

Submitted:
06 August 2026
Posted:
10 August 2026
You are already at the latest version
Abstract
Nano-size-induced shifts in alloy phase-separation critical temperatures (TCnano) are explored by introducing an atomistic concept concerning site-specific contributions to the shift (SSCS) associated with several types of coordination in cuboctahedral and truncated-octahedral nanoparticles (NPs). TCnano computed before by the Free-energy Concentration Expansion Method (FCEM) for the transformation of three small quasi-Janus Pd-Ir NPs to mixed nanophases is expanded to a much wider range of 22 sizes (147-49,049 atoms), forming a database for the modeling. The main goal of the study is to unravel the deviations of the critical temperature shifts in small NPs from the finite-size-scaling (FSS) inverse-size power law (n-1), previously proposed in thermodynamic non-atomistic modeling. In the framework of the present SSCS approach, this is done in terms of face, edge, and vertex contributions, which are proportional to the relative fraction of each type of these surface sites and are also approximated by n-1, n-2, and n-3, respectively. The introduced SSCS can be applied also to other transitions in nanoparticles with diverse shapes and sizes.
Keywords:
scaling
; separation transitions
; critical temperatures
; nanophase diagrams
; Pd-Ir
1. Introduction
Studies on the finite-size scaling (FSS) of the solid-solid phase transition temperature in immiscible alloy nanoparticles (NPs, “nanoalloys”) are quite rare in the literature. Some general principles of the FSS theory [1,2] are first outlined for macroscopic systems undergoing second-order phase transitions. Thus, thermodynamic and correlation functions exhibit singularities at a critical point , and the “correlation length” diverges according to , with characterizes the relative deviation of the temperature from the critical value, and denotes a “critical exponent”. The situation changes considerably in finite-size systems, such as NPs, for which grows up to the NP size () with increasing temperature [1]. Thus, due to the constrained , a “pseudo” critical-transition is expected at (shifted below ), so that the shift obeys , where differs from the bulk value because of free boundary conditions involving low-coordinated surface sites. According to our previous computations and analysis of the FSS based on the Free-energy Concentration Expansion Method (FCEM) [3] for nano-phase separation transitions [4]. Such inverse relationship between transition temperature shift and the nanoparticle size was claimed in several thermodynamic models [5,6,7]. It can be attributed to the surface/volume energy ratio, which is presumed to vary proportionally to the ratio of the number of surface atoms to the total number of atoms (e.g., for first-order melting transitions in spherical particles as reviewed by Calvo [8] and by Wilde [9]).
The present study is aimed at elucidating the critical-temperature shift size-dependence by considering the heterogeneity of the nanoalloy surface consisting of atomic sites with different coordinations in cuboctahedrons and truncated octahedrons. As emphasized below, the edge and vertex site fractions do not scale inversely with the NP size, especially for relatively small NPs (belonging to the so called “non-scalable regime” [8]). Hence, this study introduces a revised model based on the concept of site-specific contributions to the shift (SSCS) for handling FCEM calculated deviations from the regular inverse FSS relationship. While most computational alloy NP research focused on properties, such as compositional structure of small and medium-sized particles, typically consisting of tens to thousands of atoms [10,11], the newly developed approach covers the relatively unexplored scaling behavior in similar NP sizes.
2. Methodology
The FCEM [3] was originally derived in the canonical ensemble for modeling elemental segregation in near-surface layers of semi-infinite alloys [3]. Later it was applied to systems consisting of a large number of uniform NPs that can exchange constituent atoms without changing size or shape, allowing NP site concentrations to be treated as quasi-continuous.
For an alloy, the FCEM expression is obtained by expanding the free energy in powers of constituent concentrations [12],
When applied to NPs with geometrically nonequivalent atomic groups, numerical minimization of (e.g., using MATLAB) yields equilibrium concentrations and for each group p. Geometric input parameters include the number of atoms in each group, , and the number of nearest neighbor (NN) pairs, , between groups and . The first sum represents the configurational entropy. The second sum involves homoatomic NN pair-interactions, and . The third term includes the relatively small heteroatomic effective pair-interactions (EPIs), , between constituents (EPI considered here to be independent of group numbers). The last term accounts for short-range order contributions.
Numerical minimization via MATLAB provides temperature-dependent equilibrium site concentrations and corresponding thermodynamic characteristics (e.g., free energy, energy, entropy, specific heat). The FCEM has been validated by Monte Carlo simulations [13], and shows fair agreement with density-functional calculations [14].
In the “bond proportion model” (BPM) [15] , the vibrational entropy effect in substitutional binary bulk alloys is expressed by considering the total effective pair interaction [16,17],
where . equals (indicating separation/demixing tendency) as obtained from DFT-computed mixing enthalpy [18] . , the vibrational EPI, is closely related to the vibrational entropy change and was found to be by fitting the FCEM/BPM computed critical temperature to the experimental [19]. Bulk elemental bond energies, derived by eliminating free-atom electronic-relaxation contributions from experimental cohesive energies [20] are and . The Coordination dependence of near-surface Bond-Energy Variations (CBEV) [21] was extracted from reported pure metal surface-energy anisotropy that was computed [22] by DFT. This two-layer model estimates intra-surface and inter-surface/subsurface pair-bond strengthening, based on elemental surface-energies and cohesive-energies.
Despite the limitations of FCEM as a mean-field theory, such as focusing on dominant phases while ignoring possible NP configurational fluctuations [23], it has the advantage of separating and elucidating different contributions to the thermal stability of nanophases, including vibrational entropy and short-range order contributions. Furthermore, to enhance computational efficiency, especially for larger NPs, geometrically equivalent sites are grouped together. According to the computations, the surface of the cuboctahedral NP contains nearly pure Pd in the temperature range of interest in this study, i.e., up to and slightly above . Therefore, the surface sites are grouped according to only four coordinations (vertices, edges, (100) and (111) faces). In the core, geometrically equivalent sites are grouped according to the coarse-grained layer model (CGLM) [24], reducing the number of concentration variables by grouping atomic sites within layers perpendicular to a chosen axis. Distinct concentration variables correspond to core sites in two locations: the inner-core and the subsurface.
3. Results and Discussion
This section may be divided by subheadings. It should provide a concise and precise description of the experimental results, their interpretation, and the experimental conclusions that can be drawn.
3.1. The FCEM-Computed Data
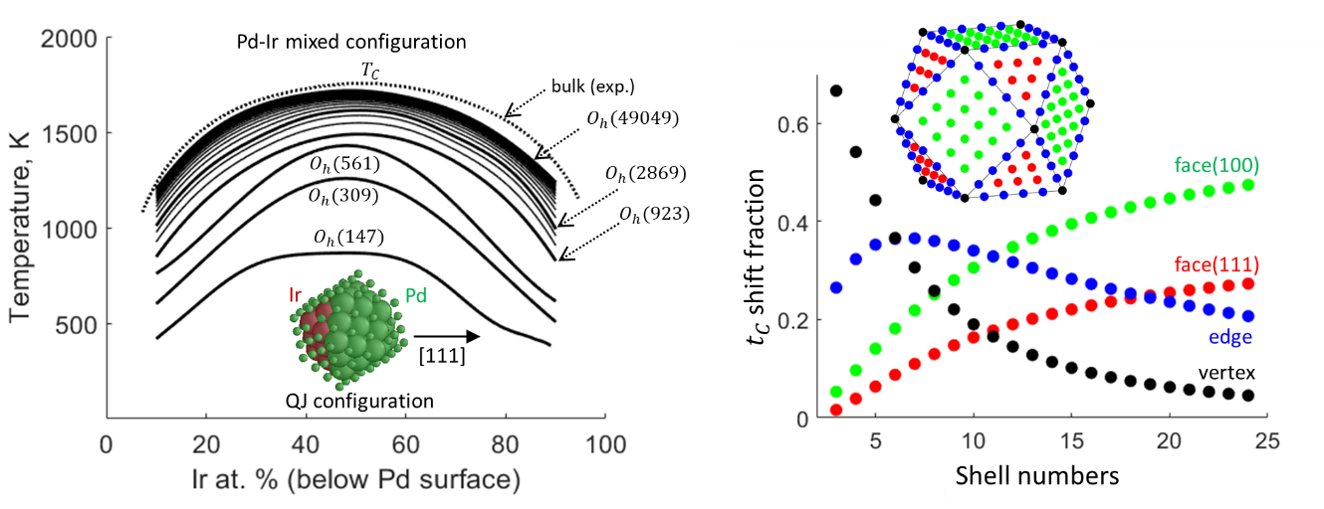
The nanophase separation diagrams of Pd-Ir fcc cuboctahedrons , based on values were computed for the [111] separation axis by the FCEM. It was combined with the coordination dependent bond-energy variations (CBEV) [21] as the main input, with vibrational entropy contributions estimated by the bond proportion model (BPM) [15] and with the rotational-symmetric site grouping model (RSSM) or the coarse-grained layer model (CGLM) [19,24]. As shown in Figure 1, the gap in the mixed nanophase (“miscibility gap”) is lower as compared to the alloy bulk gap and moves to lower temperatures for smaller NP sizes. This destabilization of the core-separated Quasi-Janus (QJ) configurations by to K is attributed to the NP size reduction limiting the correlation length (and accompanied by a growing fraction of surface atoms). When the number of surface atoms becomes negligible compared to the total number of atoms in quite large NPs, approaches closely the bulk critical temperature, (Figure 1).
3.2. Assessment and Application of the SSCS Model
Unlike relatively large NPs that exhibit finite-size nanoscaling with a critical exponent of [4,26], the smaller NP sizes in our previous study show a stronger size dependence of ( in the range 147-561 atoms) [19]. This discrepancy can be attributed to the limitations of the simple inverse relationship model , which is based on the surface-to-volume energy ratio and becomes less accurate for small NPs. Beyond face sites, significant fractions of edge and vertex sites must be considered (Figure 2a), contributing to the increased slope and deviations from linearity observed in Figure 2b. The fitted value of gradually increases and approaches 1 for larger NPs, e.g., in the range 2057-49,049 atoms.
Specifically, by considering the different surface site fractions, , and their site energies, , the shift in the critical temperature can be expressed as,
where represents the bulk site energy. Thus, the SSCS concept is introduced via the corresponding expression,
Here, the scaling coefficients for sites are assumed to be independent of the NP size, obeying the ratio . The surface site fractions depend on the NP structure (e.g., for, consisting of “nested shells”, ; other fraction formulas are given in the Appendix A.
In the case of , having , , edge and vertex, with coordinations , respectively, only three of the four fractions are independent since (according to Table A1). So, the SSCS effect can be expressed by,
where the s, are linear combinations of the s (given in the Appendix A), and the first term represents the overall contribution of the two face types. The three coefficients fitted to the FCEM/CGLM/BPM data for 147 to 49,049 atom cuboctahedrons (full range I) are given in Table 1 together with two narrower region fits. The former fit provides the smallest “root mean square deviation”, RMSD (). Actually, only three transition temperatures computed for small nanoparticles of sizes (range II) are sufficient to furnish necessary for description of the slope change and for extrapolation of the predicted nanoscaling across the full span of nanoparticle sizes, giving quite a good fit (Figure 3), but with somewhat larger RMSD (Table 1), as does the fitting performed within range III for larger nanoparticles (Figure 4). The similar coefficients and the quite small RMSD values obtained for all three fits clearly validate the SSCS model. These results contrast with extrapolations done by employing the logarithmic scaling correction [27,28], namely . In particular, the extrapolated values based on fitting to the FCEM/CGLM/BPM data in both ranges II and III provide unsatisfactory extrapolations. Namely, fitting to range II gives an erroneous slope in range III (Figure 3), and fitting to range III significantly deviates from the data for the three smallest nanoparticles in range II (Figure 4).
To find out whether the SSCS model is universally applicable to NPs having different faceted spherical shapes, FCEM/CGLM/BPM computed for 201- and 586-atom truncated octahedrons (TOs) were combined with the data, in order to fit the coefficients (Equation (2)), including the common , , and the individual for 5-coordinated vertexes and for 6-coordinated vertexes. Solution of the corresponding 5 linear SSCS equations provides the coefficients shown in Table 2. It can be noted that the obtained coefficients are fully consistent with values shown in Table 1 for range II. Furthermore, occurs to be close to arithmetic mean of and , whereas the ratio (Table 2) accurately agrees with surface site energy ratio 0.89 readily determined from the surface energy ratio measured by STM for truncated octahedron Pd nanoparticles equilibrated at 723 K [29]. This ratio is consistent with the condition of shape-independent scaling in quite large nanoparticles (discussed below).
As expected, the fitted coefficients characterizing individual site contributions to increase with the number of missing bonds (Table 2). However, the relation is not linear, unlike in the simple case of surface “bond breaking” energetics [30]. The fractions of the critical temperature shift, , originating respectively from faces, edges, and vertexes in cuboctahedrons are displayed in Figure 5a, and the site fractions at the surface alone are shown in Figure 5b. Because of the decrease in face site fraction in smaller NPs, decreases for faces and increases for vertexes (their number is 12 in all ). vs. reaches a maximum since in smaller nanoparticles the vertexes dominate, whereas in larger ones the face fraction dominates (Figure 5).
The feasibility of more transparent fitting models based on simple inverse powers of , which are roughly associated with the relative fractions of the differently coordinated sites, is explored via several alternative expressions for the size dependency of . As shown in Table 3, model 2 involving is a better one-parameter fit in the two ranges, with RMSD of 30 K. This roughly aligns with the previously mentioned in the range 147-561 atoms, corresponding to a dependence [19]. However, fitted in the range III of large NPs (921 - 49,049 atoms), yields the best one-parameter fit, with an RMSD of 19 K (not given in Table 3). Also, for this inverse-size model the wider fitting range I does better (RMSD 80K) than the small NP range II (98 K). Thus, among the one-parameter models, and are suitable for smaller and larger NPs, respectively. Actually, most of the results obtained for the wide range I are superior to those of the narrow range II (which involves only small NPs, Table 3), consistently with the latter clear-cut conclusion. When both and , are included (model 4), the fit considerably improves, as compared to the two other two-parameter models. As can be inferred from Figure 5b, this trend is due to the relatively small fractions of vertexes in 147-atom and larger NPs (), which supposedly gives the dependence to . (Despite having only 2 fitting parameters, this model gives RMSD value of 5 K compared to 18 K by a model based on with logarithmic correction, which has 3 fitting parameters.) Most remarkably, the lowest RMSD values are exhibited by the SSCS model 6, as well as by the combined three powers model 5 (< 1 K in the wide range I), indicating very high fit qualities.
It can be further noted that for other phase transitions, e.g., melting in small NPs of semiconductors C, Si, and Ge, and of the metals Sn and Pb, DFT calculations gave dependence of binding energies and melting temperatures, which was attributed to surface atom covalent bonding variations, whereas other metals seem to give the dependence [31]. According to the above analysis, is dominant in relatively small nanoparticles, such as those considered in the former study, namely, up to ~100 atoms. Thus, the current approach is in line with the reported inverse quadratic dependence, but its assumed origin is different, as are the kinds of modeled systems and transitions.
Truncated octahedrons. The calculated scaling coefficients (Table 2) were utilized to compute critical temperatures for truncated octahedrons beyond 201- and 586-atom NPs by extrapolating the SSCS Equation (2). As illustrated in Figure 6, there is very good agreement with the FCEM/CGLM/BPM results, indicating general applicability of the scaling coefficients . For general applicability to different nanoparticle shapes, it is convenient to replace the shape-specific size-characteristic in the SSCS expression by the “effective linear size” (ELS), defined for any shape e.g., as . When the data is presented against , the scaling plots are mutually displaced, as indicated in the inset of Figure 7. When the FCEM/CGLM/BPM computed data for cuboctahedrons and truncated octahedrons are plotted against (Figure 7), despite different site fractions the resulting scaling plots exhibit a remarkable level of overlap. This result together with previous ones (Figure 6) suggest a certain degree of universality to the SSCS model, at least in the case of faceted spherical NPs. The former result can be tentatively attributed to a kind of “geometric compensation”, namely, while truncated octahedrons have twice as many vertexes (24) as cuboctahedrons (12), the vertex coordination of the TO (6) is larger than that of the vertex (5). This larger coordination that leads to the TO vertex coefficient being approximately half the magnitude of the vertex coefficient, , is compensated by the higher number of vertex sites.
According to Table A1, in the case of very large s, , and for TOs, . Using the SM formulas (S5-S6) for such , the following relationships are obtained,
Irrespective of the dissimilar site fractions present in the octahedral and truncated octahedral nanoparticles, these shifts coincide, namely, , when . As noted above, this ratio is very close to the fitted coefficient ratio (Table 2), as well as to the reported STM data [29], indicating that in the case of faceted spherical and TO large nanoparticles (beyond the size range of the input data), the role of shape in the scaling behavior is expected to be negligible too.
4. Conclusions
The developed model elucidates for relatively small NPs the shift in critical transition temperatures from the simple inverse relationship with size. For this goal, first nanophase separation diagrams (miscibility gaps) of fcc cuboctahedrons were computed for the [111] separation axis in frameworks of the FCEM/CGLM/BPM approach. The miscibility gaps, including the critical points, and corresponding to transitions between QJ and mixed configurations are gradually lower for smaller sizes compared to the alloy bulk gap. The proposed concept regarding site-specific contributions to the shift (SSCS), considering all surface site types, namely, faces (111), (100), edges and vertexes, is a generalization of the more common approach considering the ratio of the overall surface to total nanoparticle energy, as the origin of the critical temperature shift. The SSCS expression is validated by the accurate agreement of with the FCEM/CGLM/BPM data for both cuboctahedrons and truncated octahedrons, indicating a certain degree of model universality. For very large nanoparticles, the impact of edges and vertices on the shift in critical temperature is negligible, and the inverse size dependence holds irrespective of shape. The presented model and corresponding expression represent an advancement in understanding of nanoscaling in relatively small crystalline NPs and provides a promising tool for further investigation and analysis of the phenomenon in the cases of other NP shapes and phase transitions. One challenge to look at is the extension of the current approach to melting transitions in alloy nanoparticles.
Author Contributions
Conceptualization, L.R. and M.P.; methodology, L.R. and M.P.; software, L.R. All authors have read and agreed to the published version of the manuscript.
Funding
This research received no external funding.
Data Availability Statement
The original contributions presented in this study are included in the article. Further inquiries can be directed to the corresponding author(s).
Acknowledgments
The authors would like to thank the Editor for her invitation to publish this paper.
Conflicts of Interest
The authors declare no conflicts of interest.
Abbreviations
The following abbreviations are used in this manuscript:
| SSCS | Site-specific contributions to the shift |
| NP | Nanoparticle |
| FCEM | Free-energy Concentration Expansion Method |
| FSS | Finite-size-scaling |
| NN | Nearest neighbor |
| EPI | Effective pair-interaction |
| BPM | Bond proportion model |
| CGLM | Coarse-grained layer model |
| CBEV | Coordination dependent bond-energy variations |
| RSSM | Rotational-symmetric site grouping model |
| QJ | Quasi-Janus |
| RMSD | Root mean square deviation |
Appendix A

Table A1.
Total number of atoms and the numbers at different surface sites in and TO nanoparticles in terms of the number of nested shells [32].
Table A1.
Total number of atoms and the numbers at different surface sites in and TO nanoparticles in terms of the number of nested shells [32].
| Shape | TO | |
Relations Between Scaling Coefficients
It can be presented as,
where the first term represents the overall contribution of faces in terms of the fraction , and the scaling coefficients that are linearly related to ,
According to Table A1, in the case of very large octahedral nanoparticles,
In the case of very large TO nanoparticles,
References
- Privman, V. Finite Size Scaling Theory. In Finite Size Scaling and Numerical Simulation of Statistical Systems; World Scientific: Singapore, 1990.
- Landau, D.P.; Binder, K. A Guide to Monte Carlo Simulations in Statistical Physics; Cambridge University Press: Cambridge, UK, 2005.
- Polak, M.; Rubinovich, L. The interplay of surface segregation and atomic order in alloys. Surf. Sci. Rep. 2000, 38, 127-194. [CrossRef]
- Polak, M.; Rubinovich, L. Nano-size scaling of alloy intra-particle vs. inter-particle separation transitions: prediction of distinctly inter-face-affected critical behaviour. Phys. Chem. Chem. Phys. 2016, 18, 18391. [CrossRef] [PubMed]
- Xiao, S.; Hu, W.; Luo, W.; Wu, Y.; Li, X.; Deng, H. Size effect on alloying ability and phase stability of immiscible bimetallic nanoparticles. Eur. Phys. J. B 2006, 54, 479. [CrossRef]
- Qi, W.H.; Wang, M.P.; Zhou, M.; Hu, W.Y. Surface-area-difference model for thermodynamic properties of metallic nanocrystals. J. Phys. D Appl. Phys. 2005, 38, 1429. [CrossRef]
- Jiang, Q.; Li, J.C.; Chi, B.Q. Size-dependent cohesive energy of nanocrystals. Chem. Phys. Lett. 2002, 366, 551-554. [CrossRef]
- Calvo, F. Thermodynamics of nanoalloys. Phys. Chem. Chem. Phys. 2015, 17, 27922-27939. [CrossRef] [PubMed]
- Wilde, G.; Structural Phase Transformations in Nanoscale Systems. Adv. Eng. Mater. 2021, 23, 2001387. [CrossRef]
- Baletto, F.; Ferrando, R. Structural Properties of Nanoclusters: Energetic, Thermodynamic, and Kinetic Effects. Rev. Mod. Phys. 2005, 77, 371-423. [CrossRef]
- Ferrando, R.; Jellinek, J.; Johnston, R.L. Nanoalloys: From Theory to Applications of Alloy Clusters and Nanoparticles. Chem. Rev. 2008, 108, 845-910. [CrossRef] [PubMed]
- Polak, M.; Rubinovich, L. Prediction of intercluster separation and Schottky-type heat-capacity contribution in surface-segregated binary and ternary alloy nanocluster systems. Phys. Rev. B 2005, 71, 125426. [CrossRef]
- Roussel, J.M.; Saul, A.; Rubinovich, L.; Polak, M. On the estimation of SRO effects on surface segregation. J. Phys. Condens. Matter 1999, 11, 9901-9906. [CrossRef]
- Barcaro, G.; Fortunelli, A.; Polak, M.; Rubinovich, L. Patchy multishell segregation in Pd-Pt alloy nanoparticles. Nano Lett. 2011, 11, 1766-1769. [CrossRef] [PubMed]
- van de Walle, A.; Ceder, G. Automating First-Principles Phase Diagram Calculations. Rev. Mod. Phys. 2002, 74, 11-45.
- Garbulsky, G.D.; Ceder, G. Effect of lattice vibrations on the ordering tendencies in substitutional binary alloys. Phys. Rev. B 1994, 49, 6327. [CrossRef] [PubMed]
- Garbulsky, G.D.; Ceder, G. Contribution of the vibrational free energy to phase stability in substitutional alloys: Methods and trends. Phys. Rev. B 1996, 53, 8993. [CrossRef] [PubMed]
- Kolb, B.; Mueller, S.; Botts, D.B.; Hart, G.L.W. Ordering tendencies in the binary alloys of Rh, Pd, Ir, and Pt: Density functional calculations. Phys. Rev. B 2006, 74, 144206. [CrossRef]
- Polak, M.; Rubinovich, L. The Thermal Stability of Asymmetric Separated Configurations inside Alloy Nanoparticles: Atomic-Scale Modeling of Pd-Ir Nanophase Diagrams. ACS Nano 2022, 16, 20186-20196. [CrossRef] [PubMed]
- Brooks, M.S.S.; Johansson, B. Exchange integral matrices and cohesive energies of transition-metal atoms. J. Phys. F Met. Phys. 1983, 13, L197-L202. [CrossRef]
- Rubinovich, L.; Polak, M. Prediction of distinct surface segregation effects due to coordination-dependent bond-energy variations in alloy nanoclusters. Phys. Rev. B 2009, 80, 045404. [CrossRef]
- Galanakis, I.; Papanikolaou, N.; Dederichs, P.H. Applicability of the broken-bond rule to the surface energy of the fcc metals. Surf. Sci. 2002, 511, 1-12. [CrossRef]
- Wales, D.J.; Berry, R.S. Coexistence in finite systems. Phys. Rev. Lett. 1994, 73, 2875-2878. [CrossRef] [PubMed]
- Polak, M.; Rubinovich, L. Thermally-induced chemical-order transitions in medium–large alloy nanoparticles predicted using a coarse-grained layer model. Phys. Chem. Chem. Phys. 2015, 17, 28211. [CrossRef] [PubMed]
- Okamoto, H. Binary Alloy Phase Diagrams; ASM International: Materials Park, OH, USA, 1990; Vol. 3, p. 2338.
- Fisher, M.E. Critical phenomena in films and surfaces. J. Vac. Sci. Technol. 1973, 10, 665. [CrossRef]
- Kenna, R.; Johnston, D.A.; Janke, W. Scaling relations for logarithmic corrections. Phys. Rev. Lett. 2006, 96, 115701. [CrossRef] [PubMed]
- Kenna, R.; Johnston, D.A.; Janke, W. Self-consistent scaling theory for logarithmic-correction exponents. Phys. Rev. Lett. 2006, 97, 155702. [CrossRef] [PubMed]
- Chen, P.Y.; Gao, Y.K.; Castell, M.R. Experimental determination of the {111}/{001} surface energy ratio for Pd crystals. Appl. Phys. Lett. 2020, 117, 101601. [CrossRef]
- Abraham, F.F.; Brundle, C.R. Surface segregation in binary solid-solutions - a theoretical and experimental perspective. J. Vac. Sci. Technol. 1981, 18, 506. [CrossRef]
- Farrell, H.H.; Van Siclen, C.D. Binding energy, vapor pressure, and melting point of semiconductor nanoparticles. J. Vac. Sci. Technol. B 2007, 25, 1441. [CrossRef]
- Kaatz, F.H.; Bultheel, A. Magic Mathematical Relationships for Nanoclusters. Nanoscale Res. Lett. 2019, 14, 150. [CrossRef] [PubMed]
Figure 1.
Pd-Ir nanophase diagrams (miscibility-gaps) computed for the [111] separation axis compared to the experimental bulk diagram reported by Okamoto [25] (dotted line). The FCEM/CGLM/BPM combination was used beyond the three smallest cuboctahedron sizes taken from our previous study [19]. Insets: Space-filling models of the quasi-Janus and mixed configurations for (, 32.7 Ir at. % below Pd surface).
Figure 1.
Pd-Ir nanophase diagrams (miscibility-gaps) computed for the [111] separation axis compared to the experimental bulk diagram reported by Okamoto [25] (dotted line). The FCEM/CGLM/BPM combination was used beyond the three smallest cuboctahedron sizes taken from our previous study [19]. Insets: Space-filling models of the quasi-Janus and mixed configurations for (, 32.7 Ir at. % below Pd surface).
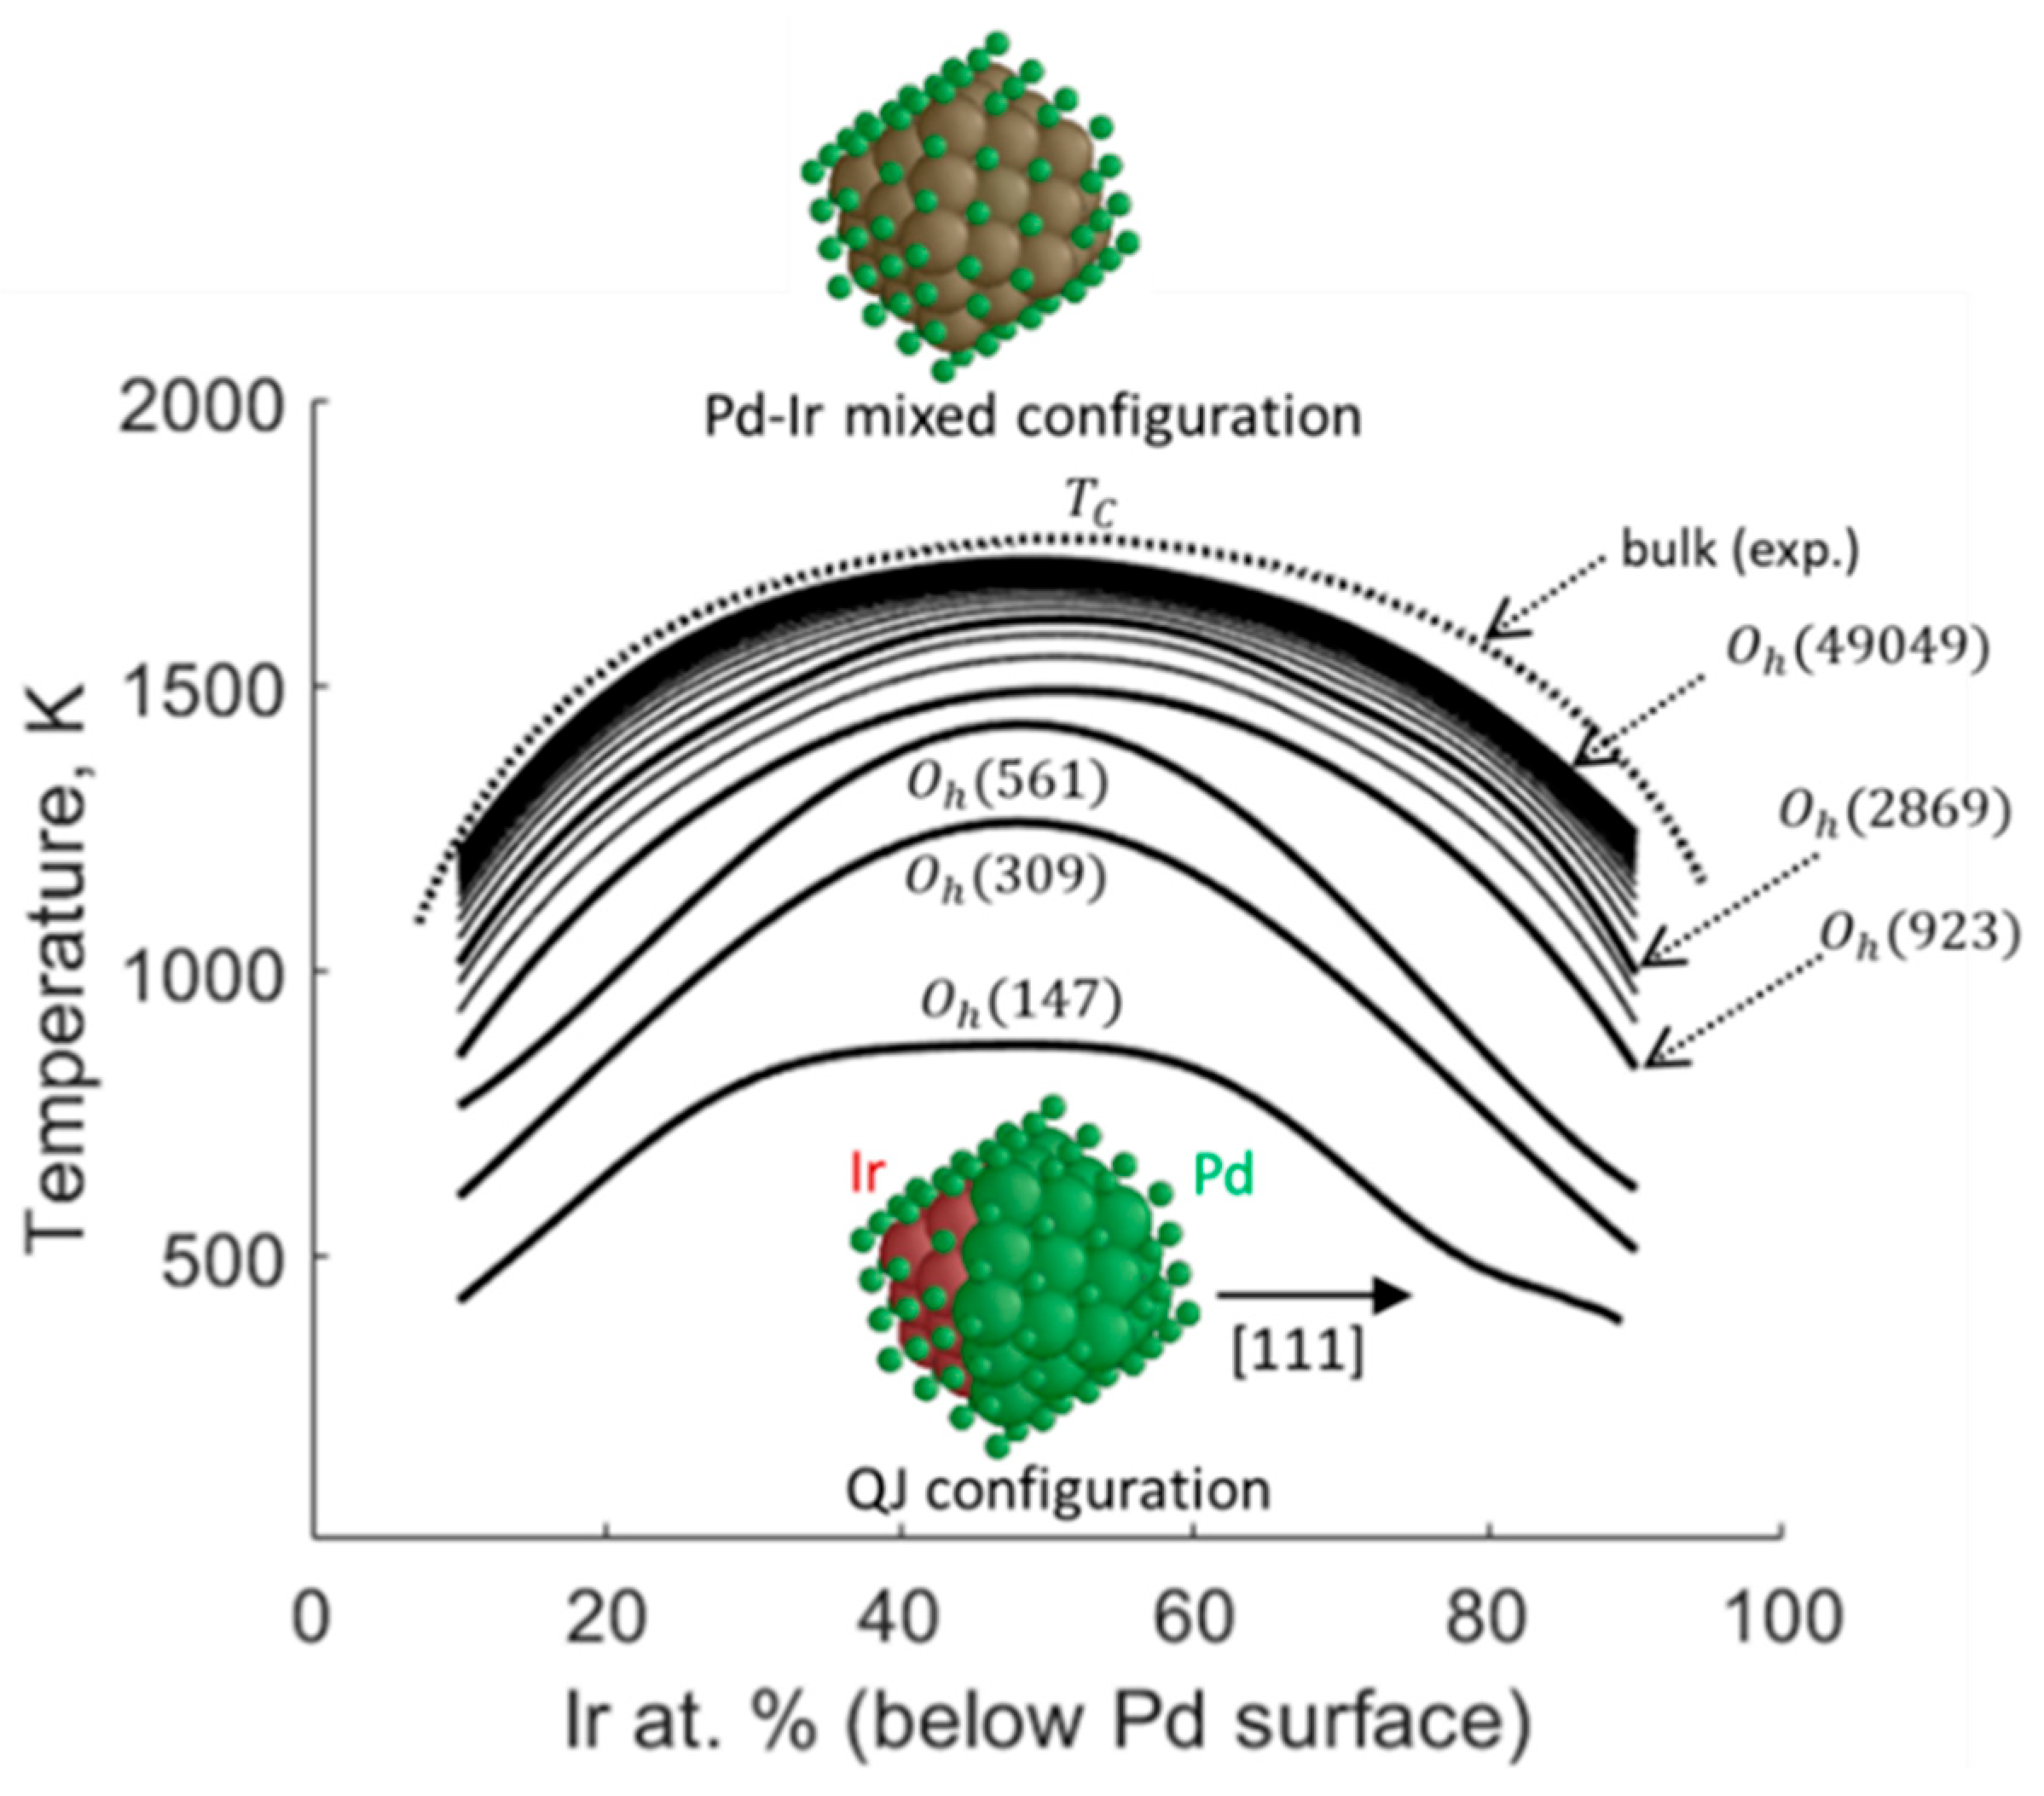
Figure 2.
(a) The cross-sectional view of the nanoparticle (the central atom and nested shells). The surface contains four types of different atomic coordinations: the (111) face, the (100) face, the edges, and the vertices. (b) Nanoscaling for Pd-Ir ([111] separation axis). The FCEM/CGLM/BPM combination was used to compute the critical temperatures, , over a wide range of cuboctahedron sizes. Deviations from linearity are revealed by the dotted line.
Figure 2.
(a) The cross-sectional view of the nanoparticle (the central atom and nested shells). The surface contains four types of different atomic coordinations: the (111) face, the (100) face, the edges, and the vertices. (b) Nanoscaling for Pd-Ir ([111] separation axis). The FCEM/CGLM/BPM combination was used to compute the critical temperatures, , over a wide range of cuboctahedron sizes. Deviations from linearity are revealed by the dotted line.
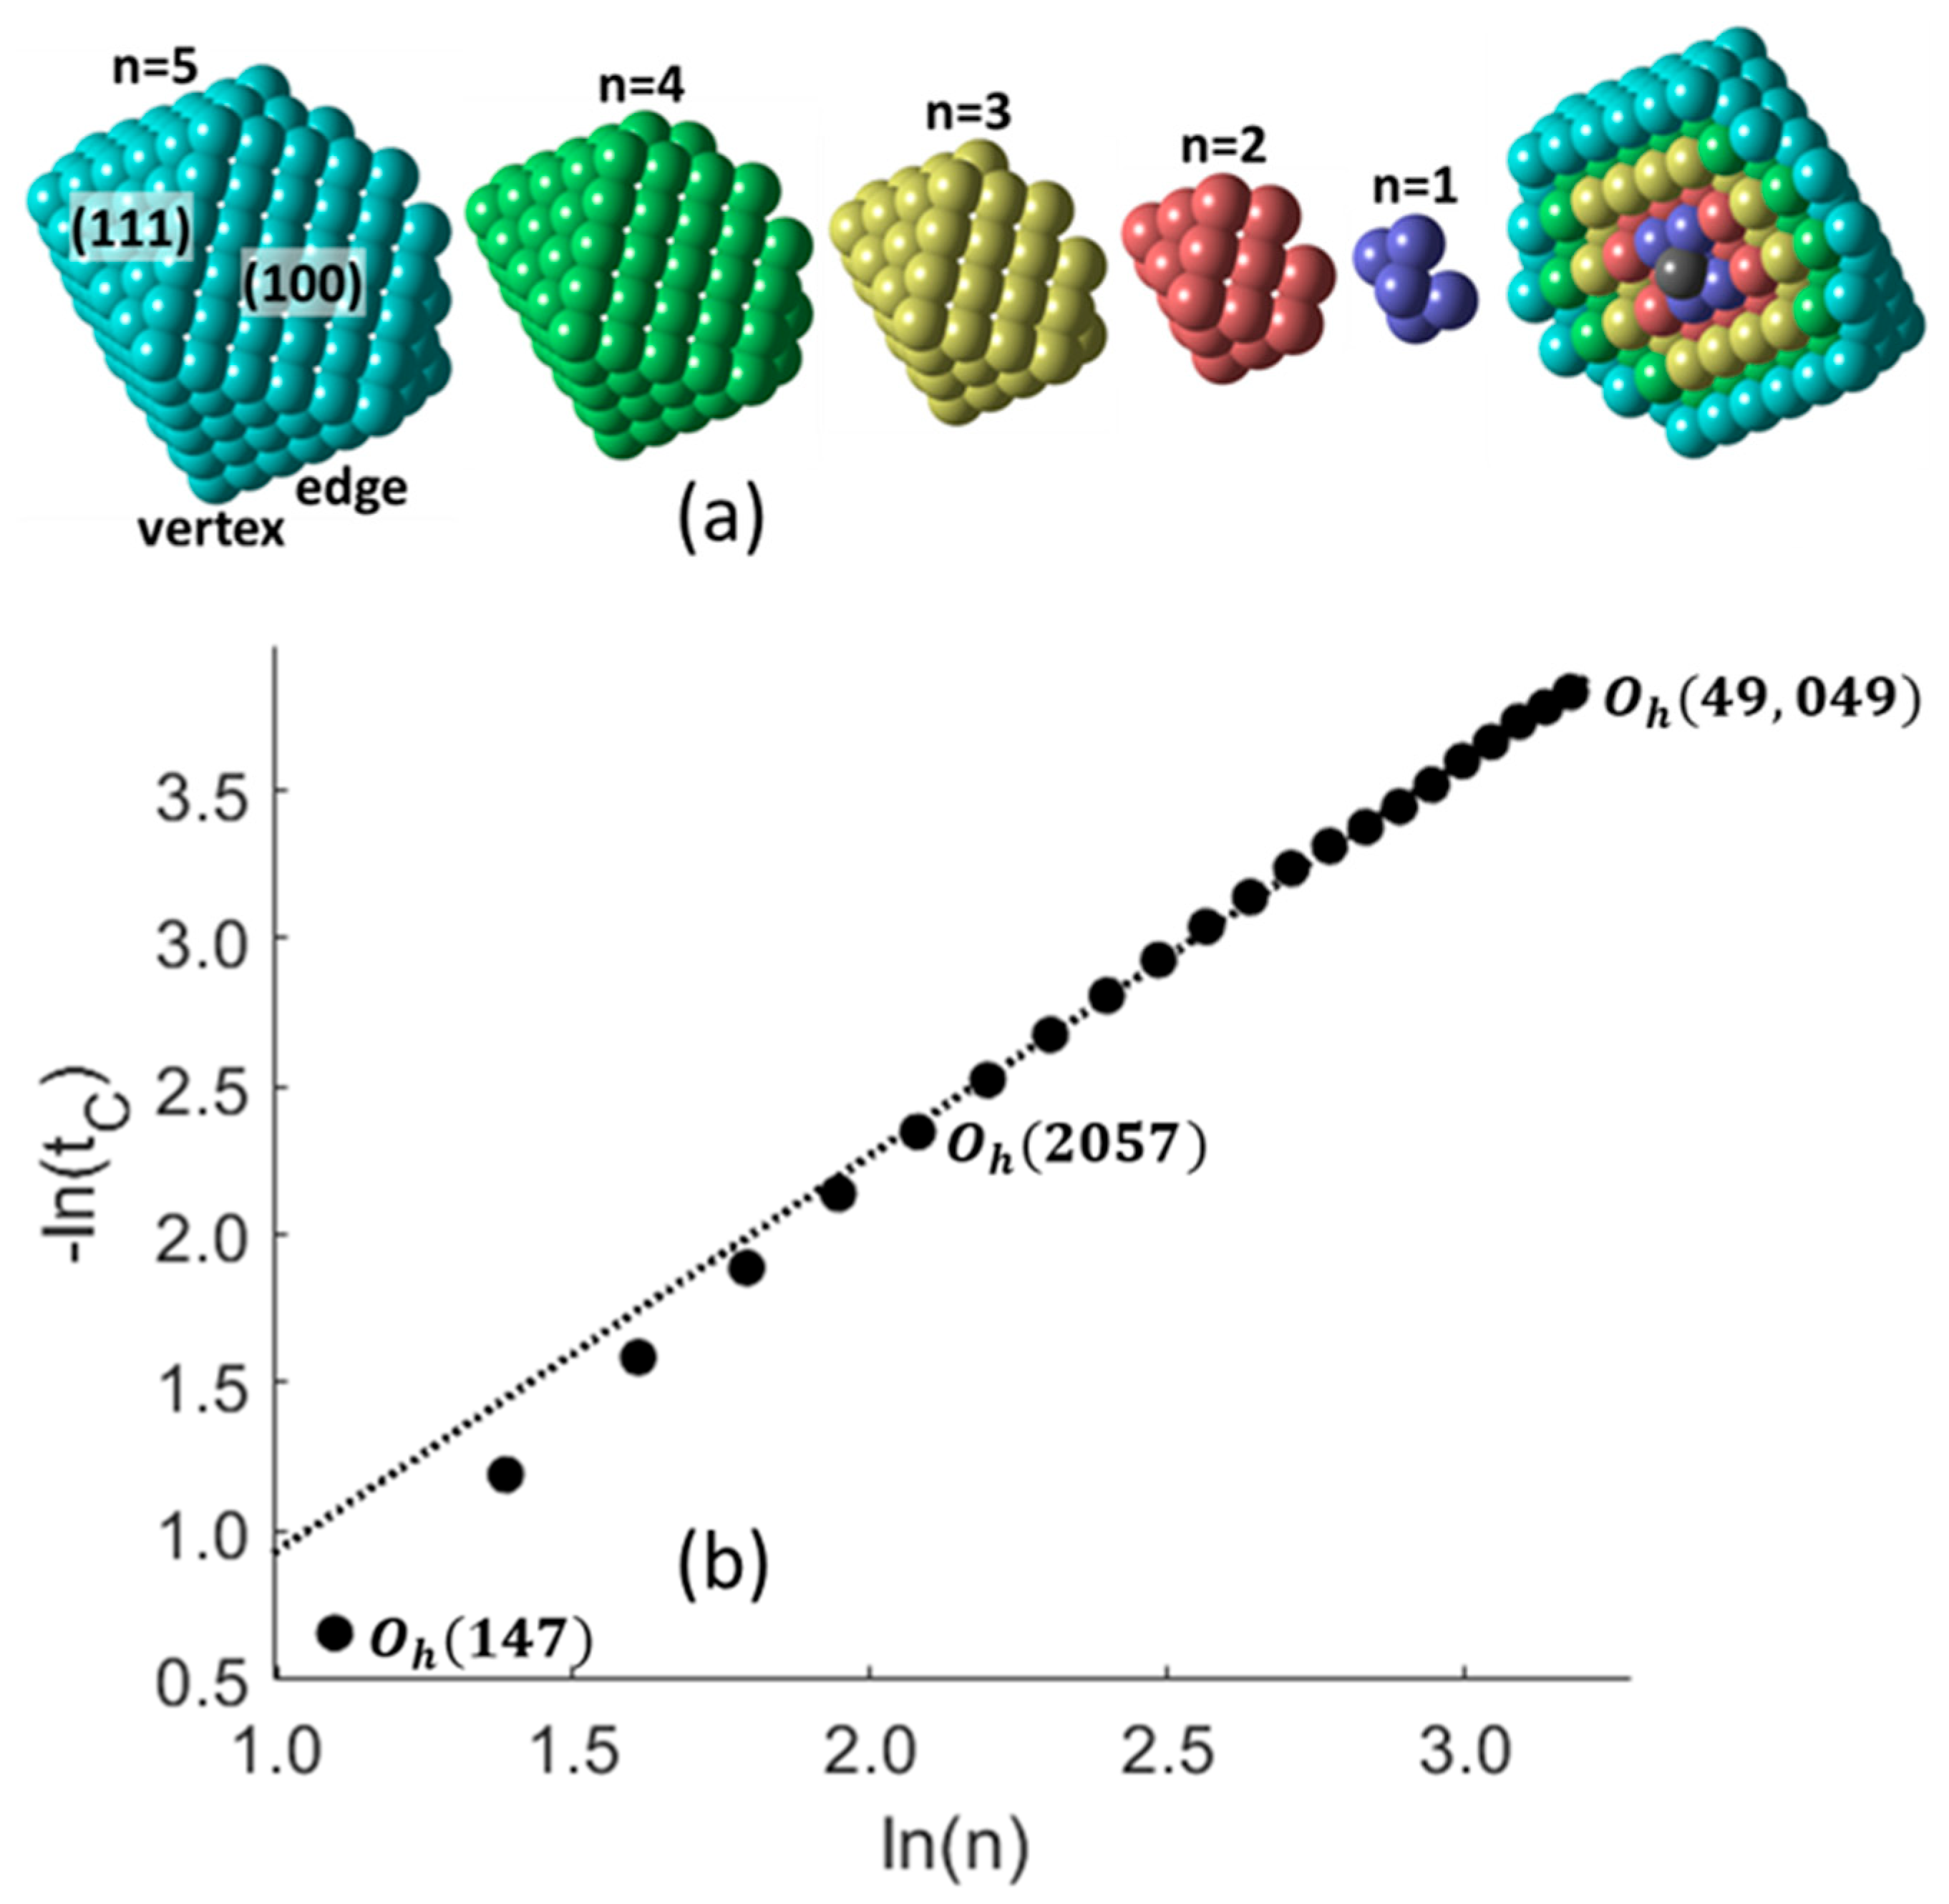
Figure 3.
Nanoscaling plots obtained from FCEM/CGLM/BPM computed critical temperatures (blue circles) for nanoparticles [111] separation axis. Fitted in the narrow range II of small cuboctahedrons, the SSCS-based black line with squares is extrapolated to larger cuboctahedrons (red solid line). The extrapolated line quite accurately coincides with the FCEM/CGLM/BPM data in range III. A fit using logarithmic scaling correction is shown by red dotted line.
Figure 3.
Nanoscaling plots obtained from FCEM/CGLM/BPM computed critical temperatures (blue circles) for nanoparticles [111] separation axis. Fitted in the narrow range II of small cuboctahedrons, the SSCS-based black line with squares is extrapolated to larger cuboctahedrons (red solid line). The extrapolated line quite accurately coincides with the FCEM/CGLM/BPM data in range III. A fit using logarithmic scaling correction is shown by red dotted line.
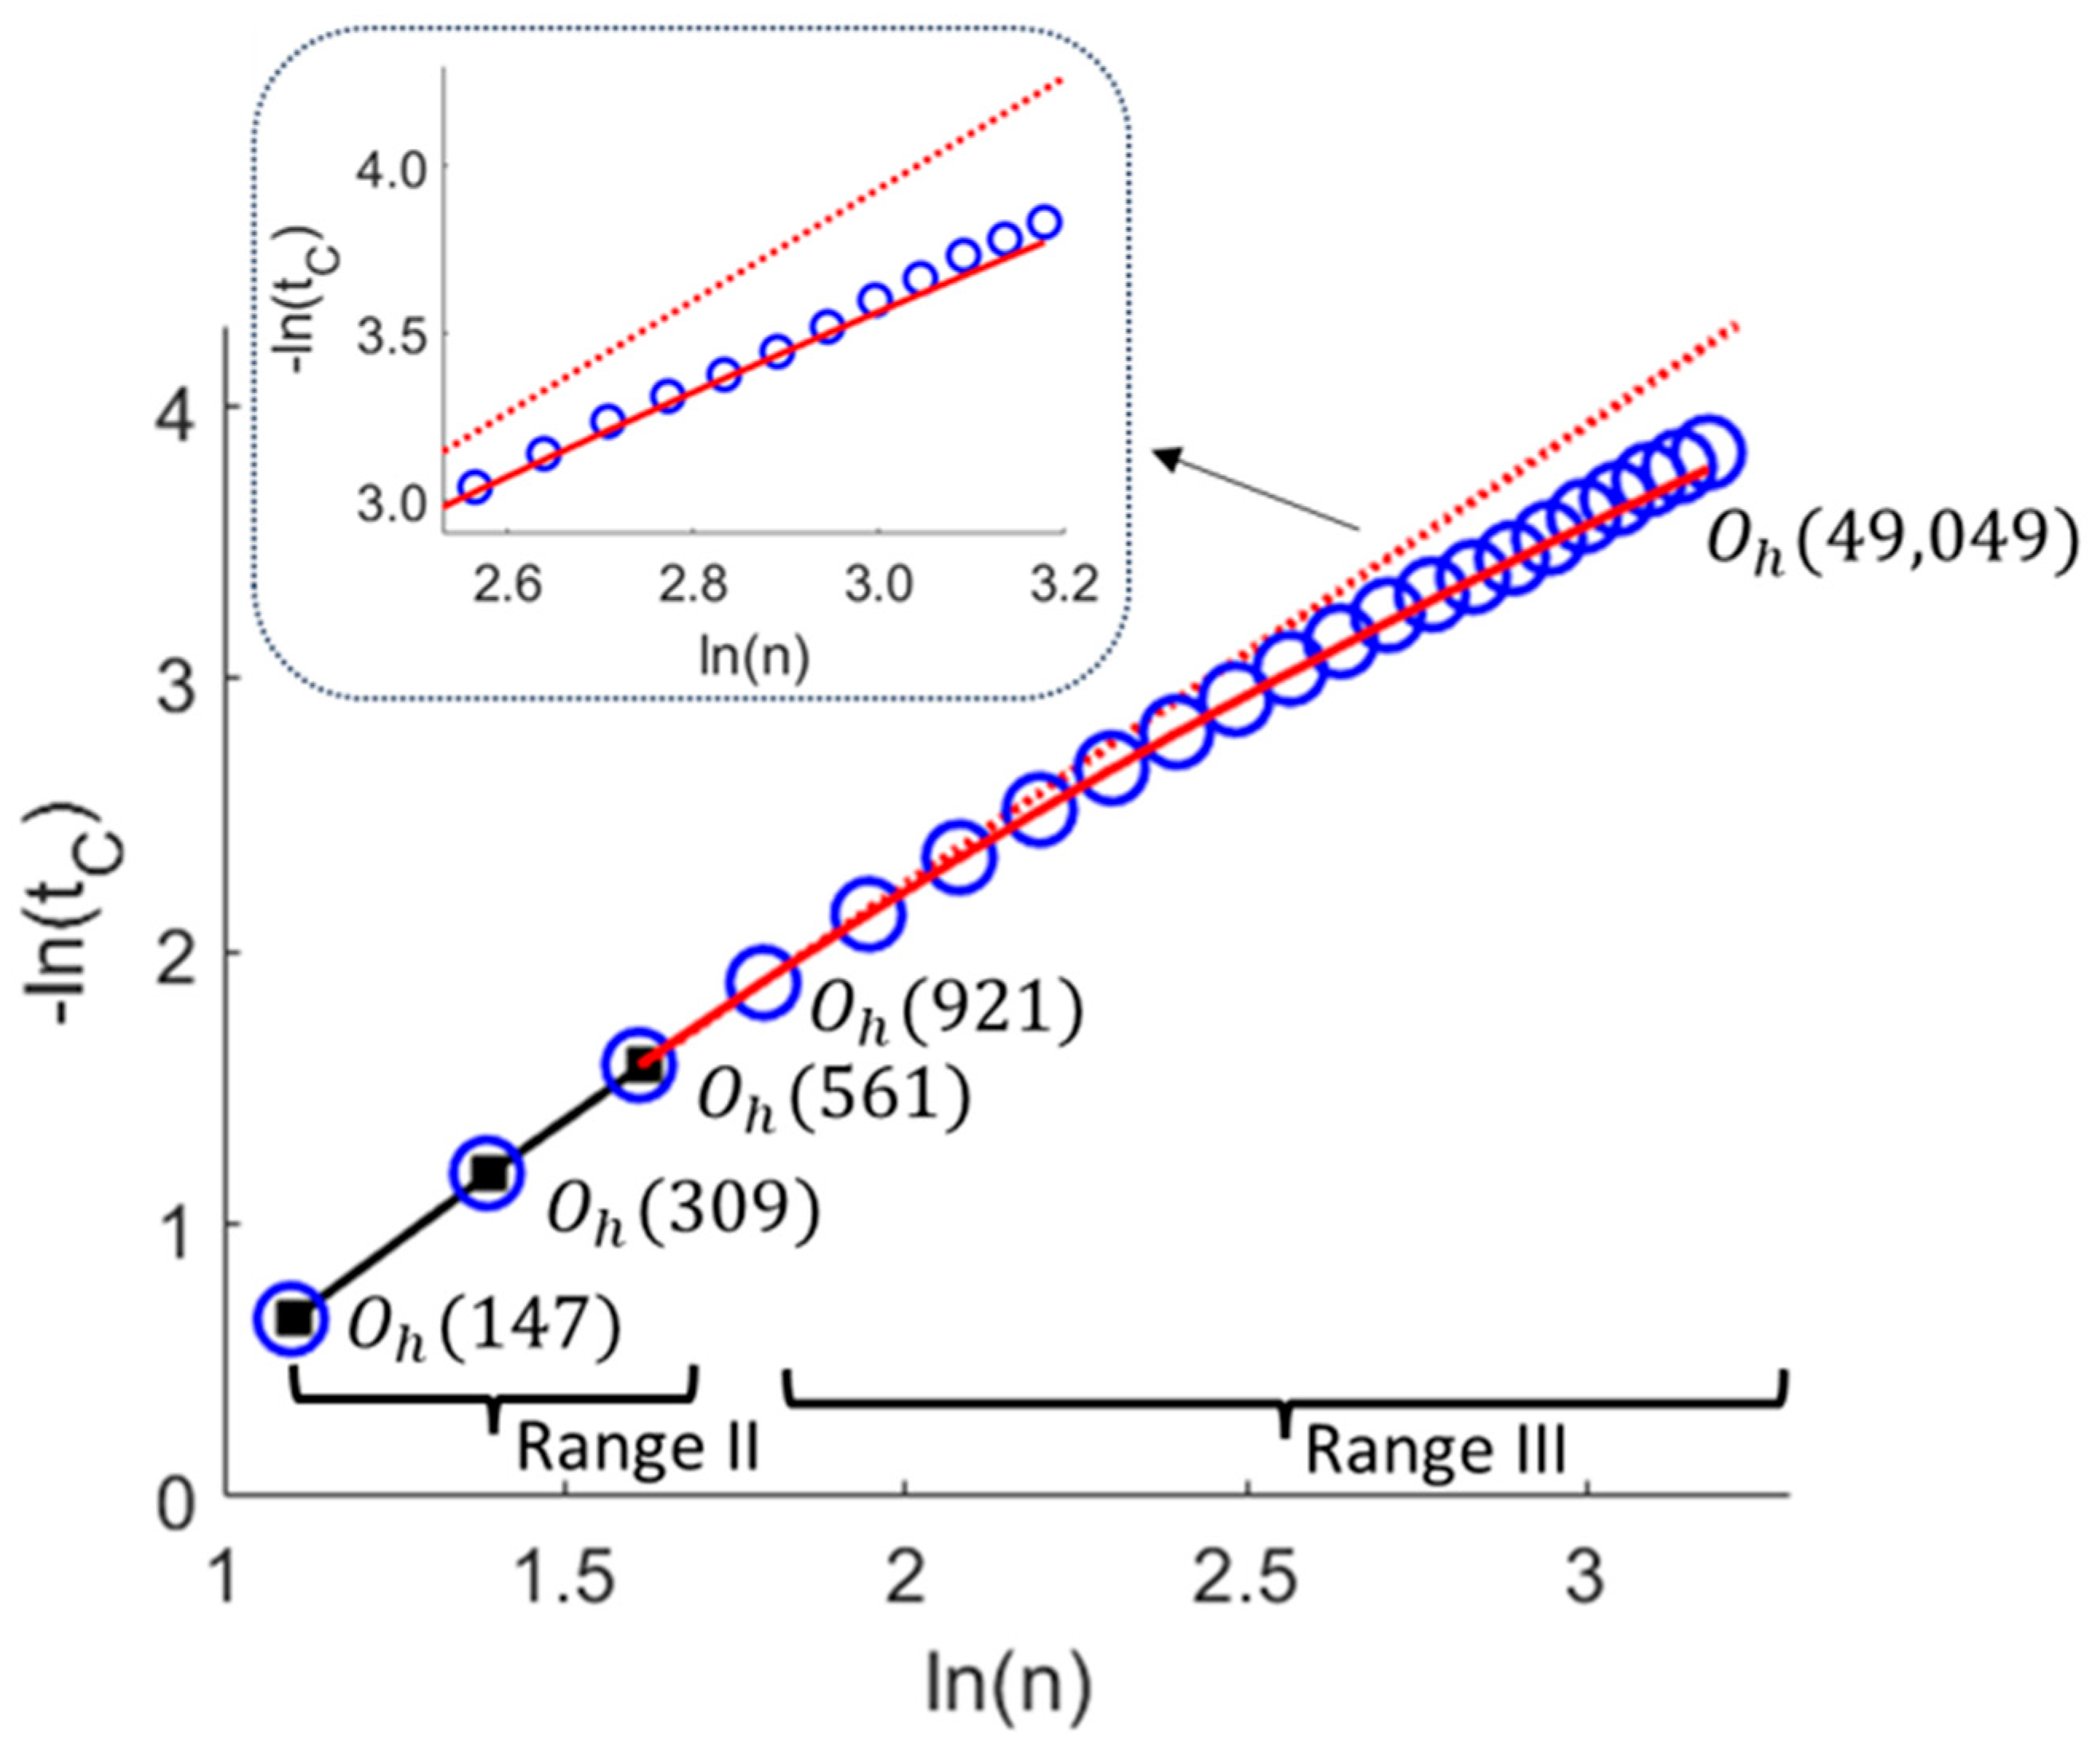
Figure 4.
Nanoscaling plots extrapolated from range III (black line) of larger cuboctahedrons to range II (red solid line). The extrapolated line coincides with the FCEM/CGLM/BPM data in this range. A fit using logarithmic scaling correction is shown by the dotted red line.
Figure 4.
Nanoscaling plots extrapolated from range III (black line) of larger cuboctahedrons to range II (red solid line). The extrapolated line coincides with the FCEM/CGLM/BPM data in this range. A fit using logarithmic scaling correction is shown by the dotted red line.
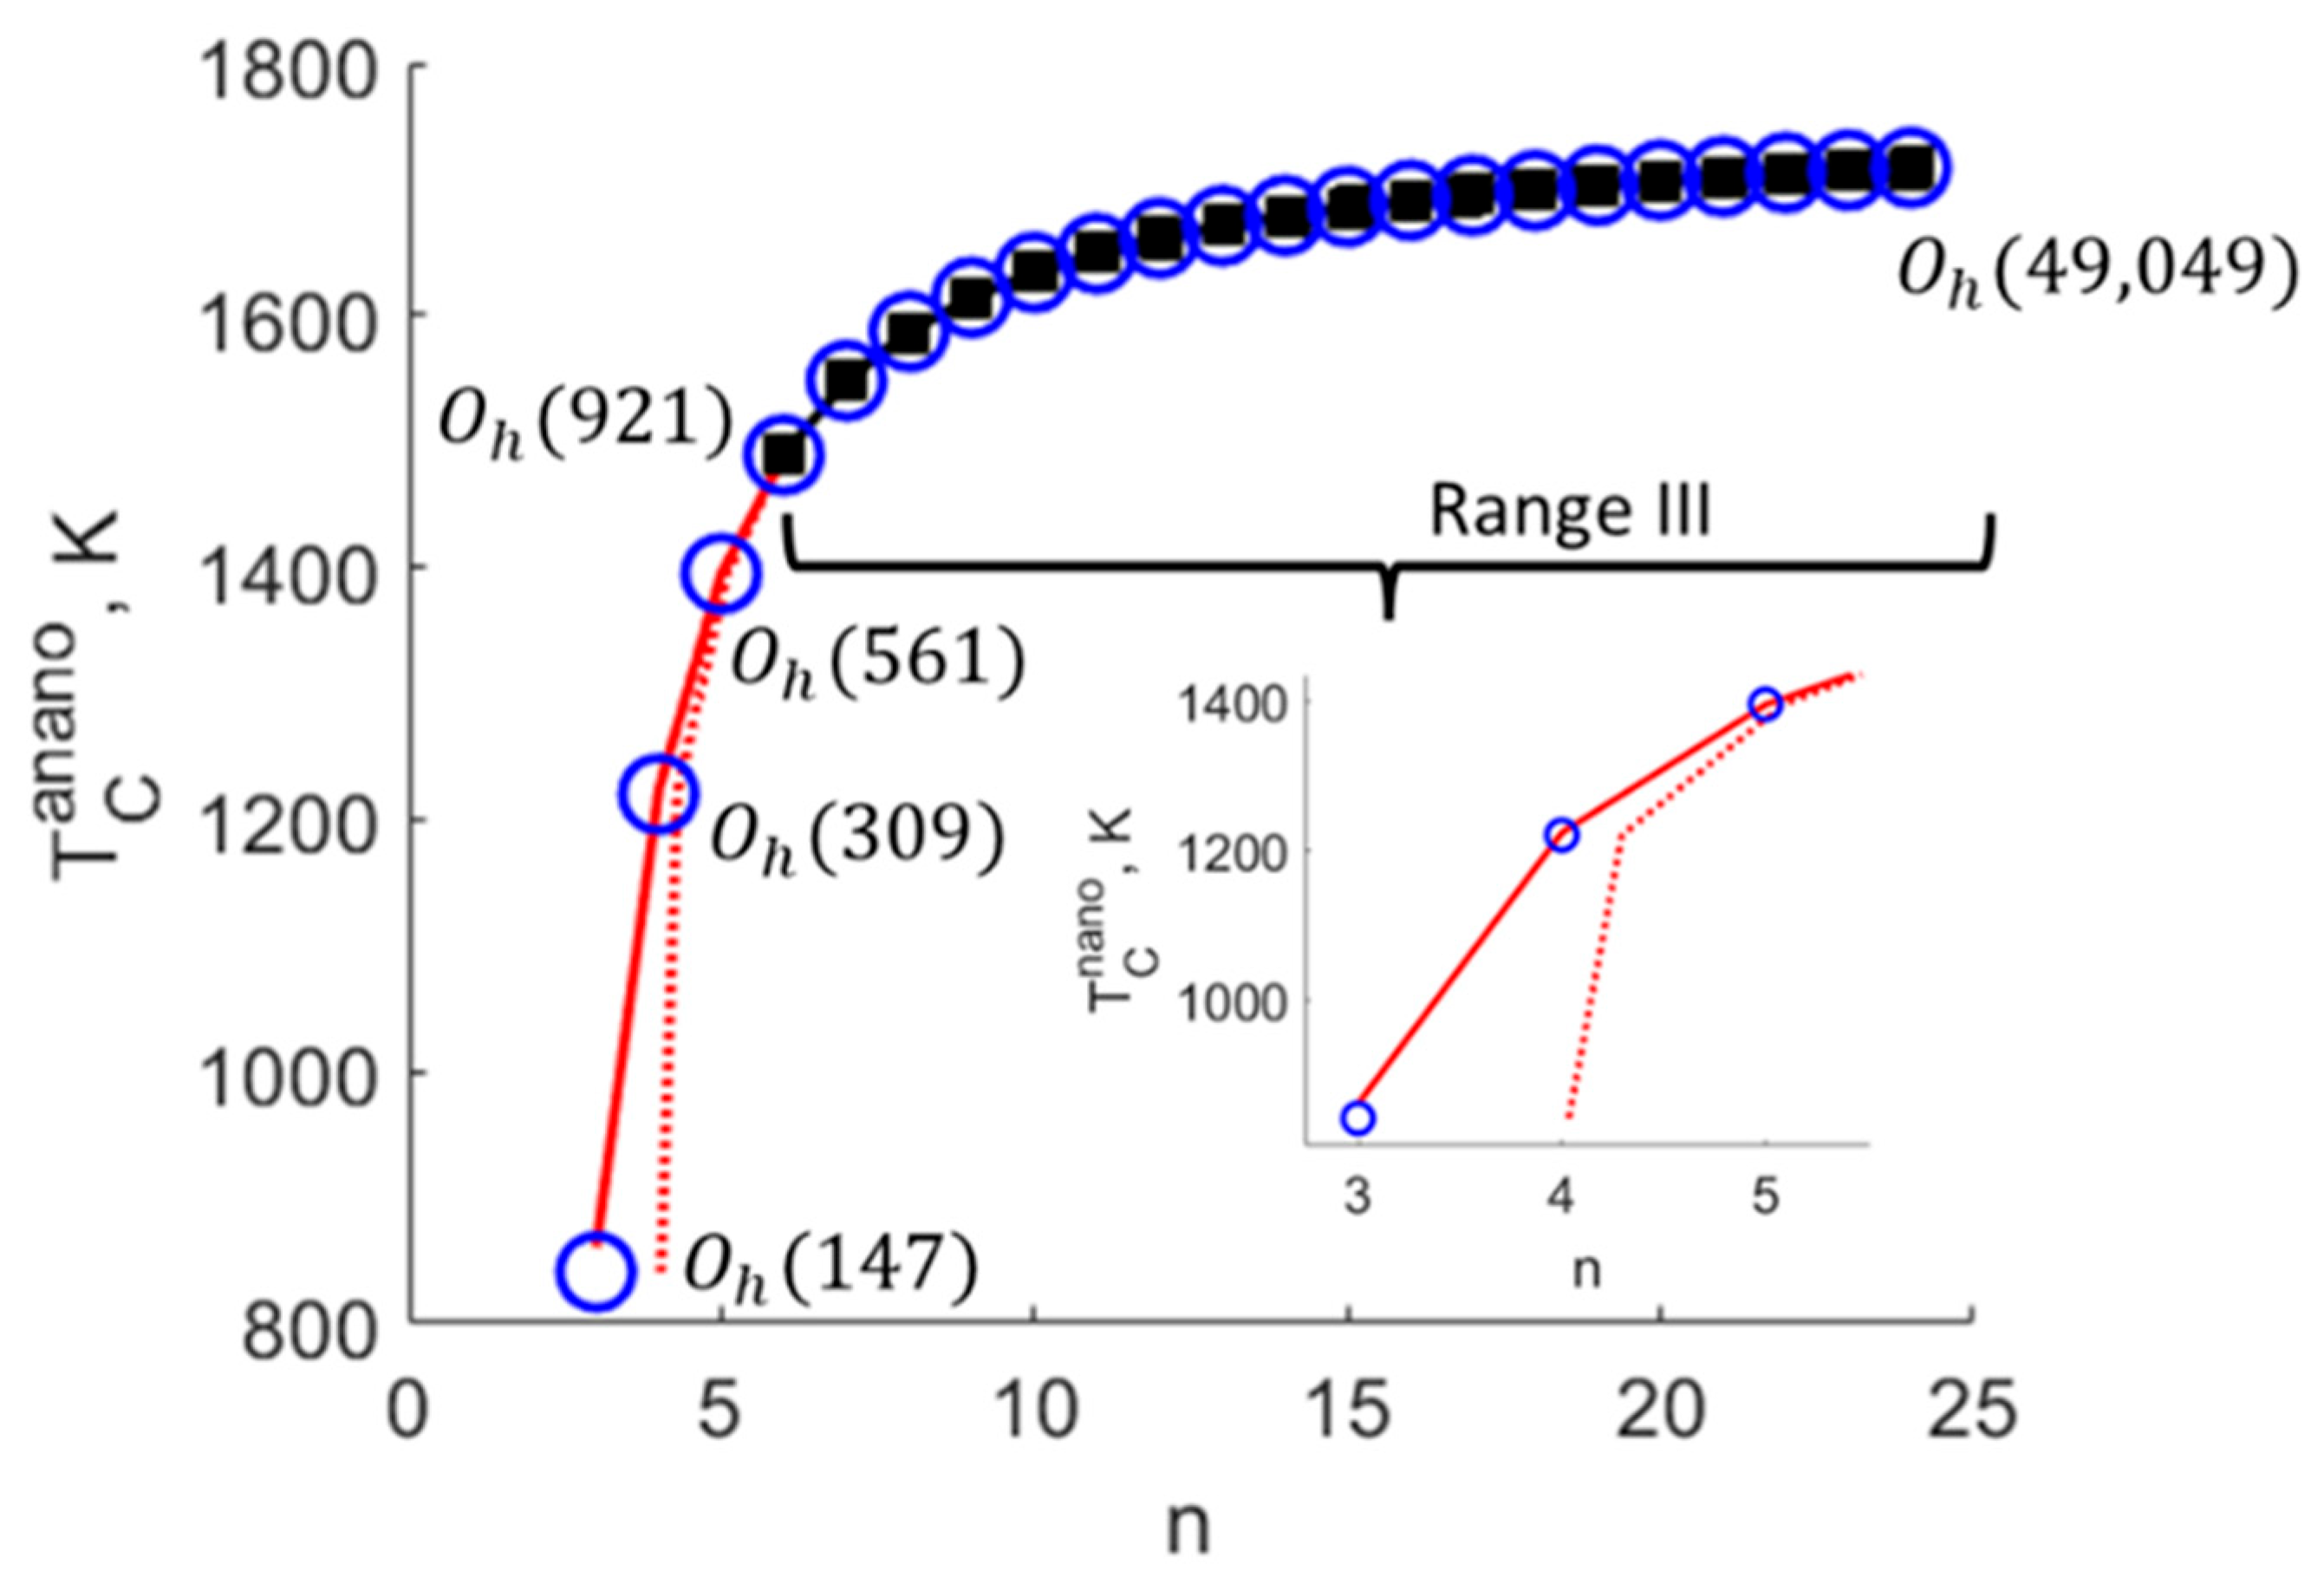
Figure 5.
The size dependence of: (a) the fractions of the critical temperature shift attributed to face, edge, and vertex sites in cuboctahedrons (according to fitting range I), and (b) the site fractions at the surface alone (shown instead of to emphasize relative site abundances).
Figure 5.
The size dependence of: (a) the fractions of the critical temperature shift attributed to face, edge, and vertex sites in cuboctahedrons (according to fitting range I), and (b) the site fractions at the surface alone (shown instead of to emphasize relative site abundances).
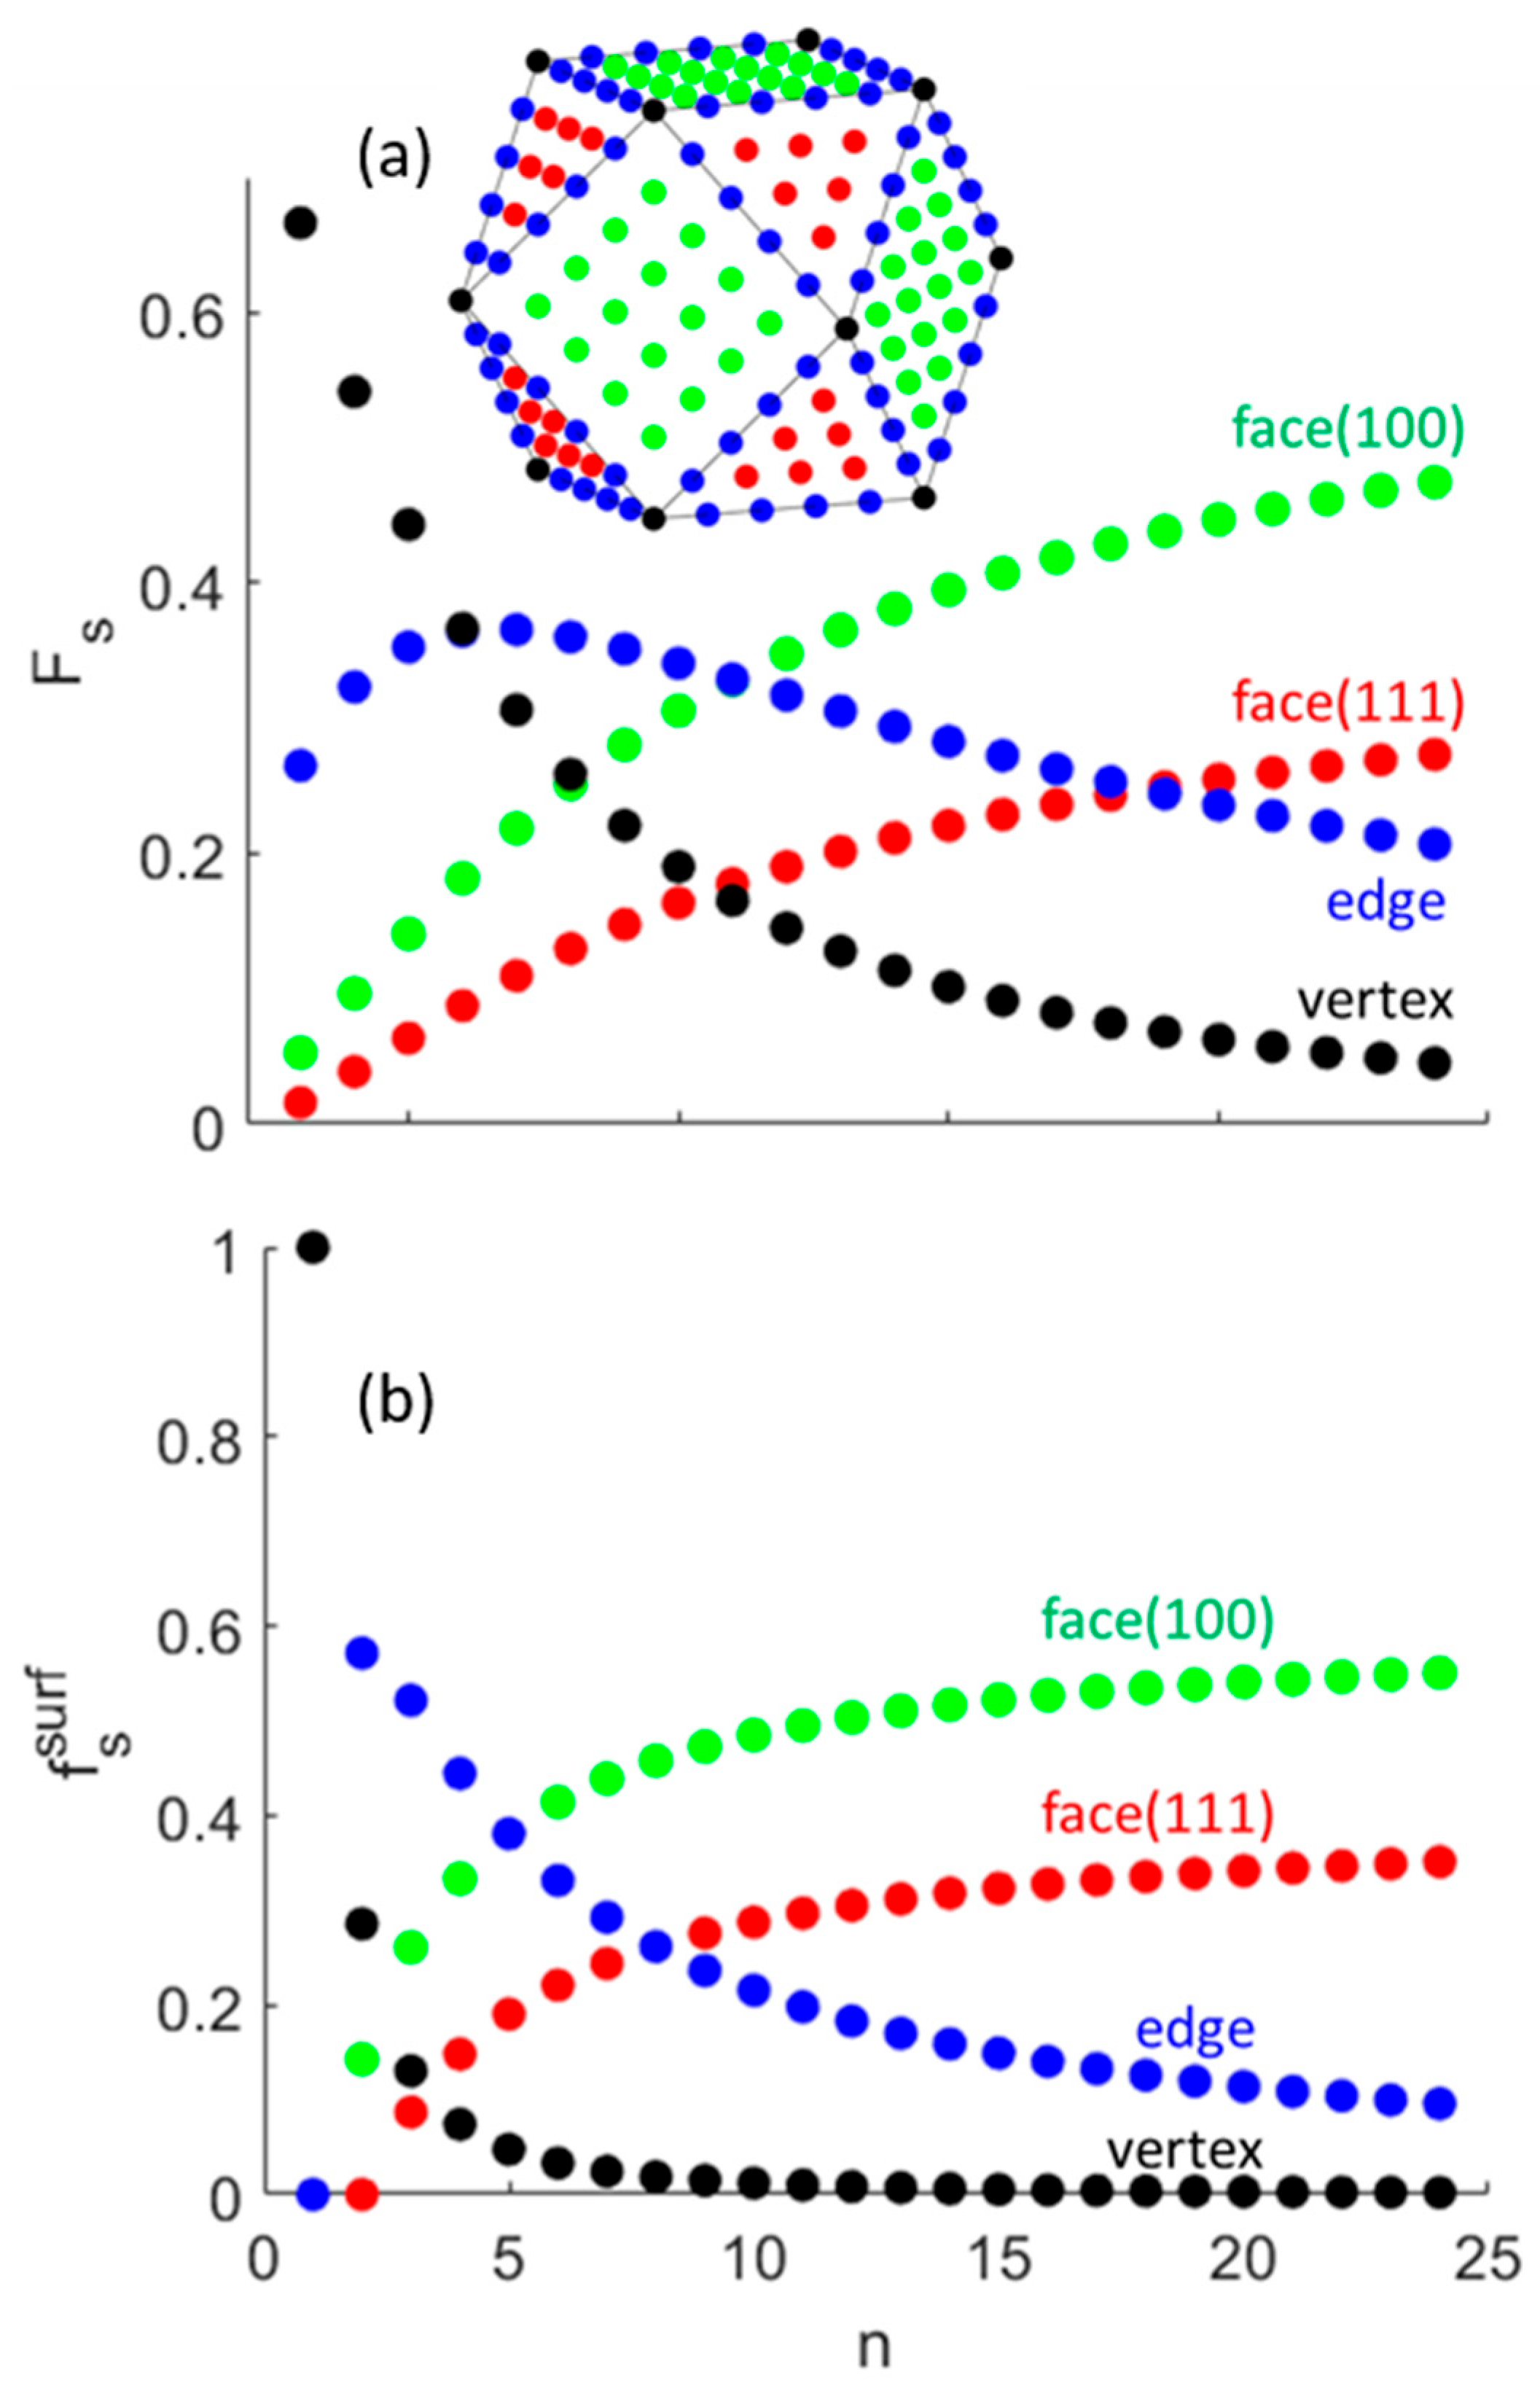
Figure 6.
Scaling plots computed for separation transitions in truncated octahedrons using the SSCS coefficients given in Table 2. SSCS-based black squares are extrapolated to larger s (red dotted line). The extrapolated line quite accurately coincides with the FCEM/CGLM/BPM data for larger s (blue circles). Inset: The surface contains four types of different atomic coordination: red corresponds to the (111) face, green - the (100) face, blue - the edges, and black corresponds to the vertices.
Figure 6.
Scaling plots computed for separation transitions in truncated octahedrons using the SSCS coefficients given in Table 2. SSCS-based black squares are extrapolated to larger s (red dotted line). The extrapolated line quite accurately coincides with the FCEM/CGLM/BPM data for larger s (blue circles). Inset: The surface contains four types of different atomic coordination: red corresponds to the (111) face, green - the (100) face, blue - the edges, and black corresponds to the vertices.
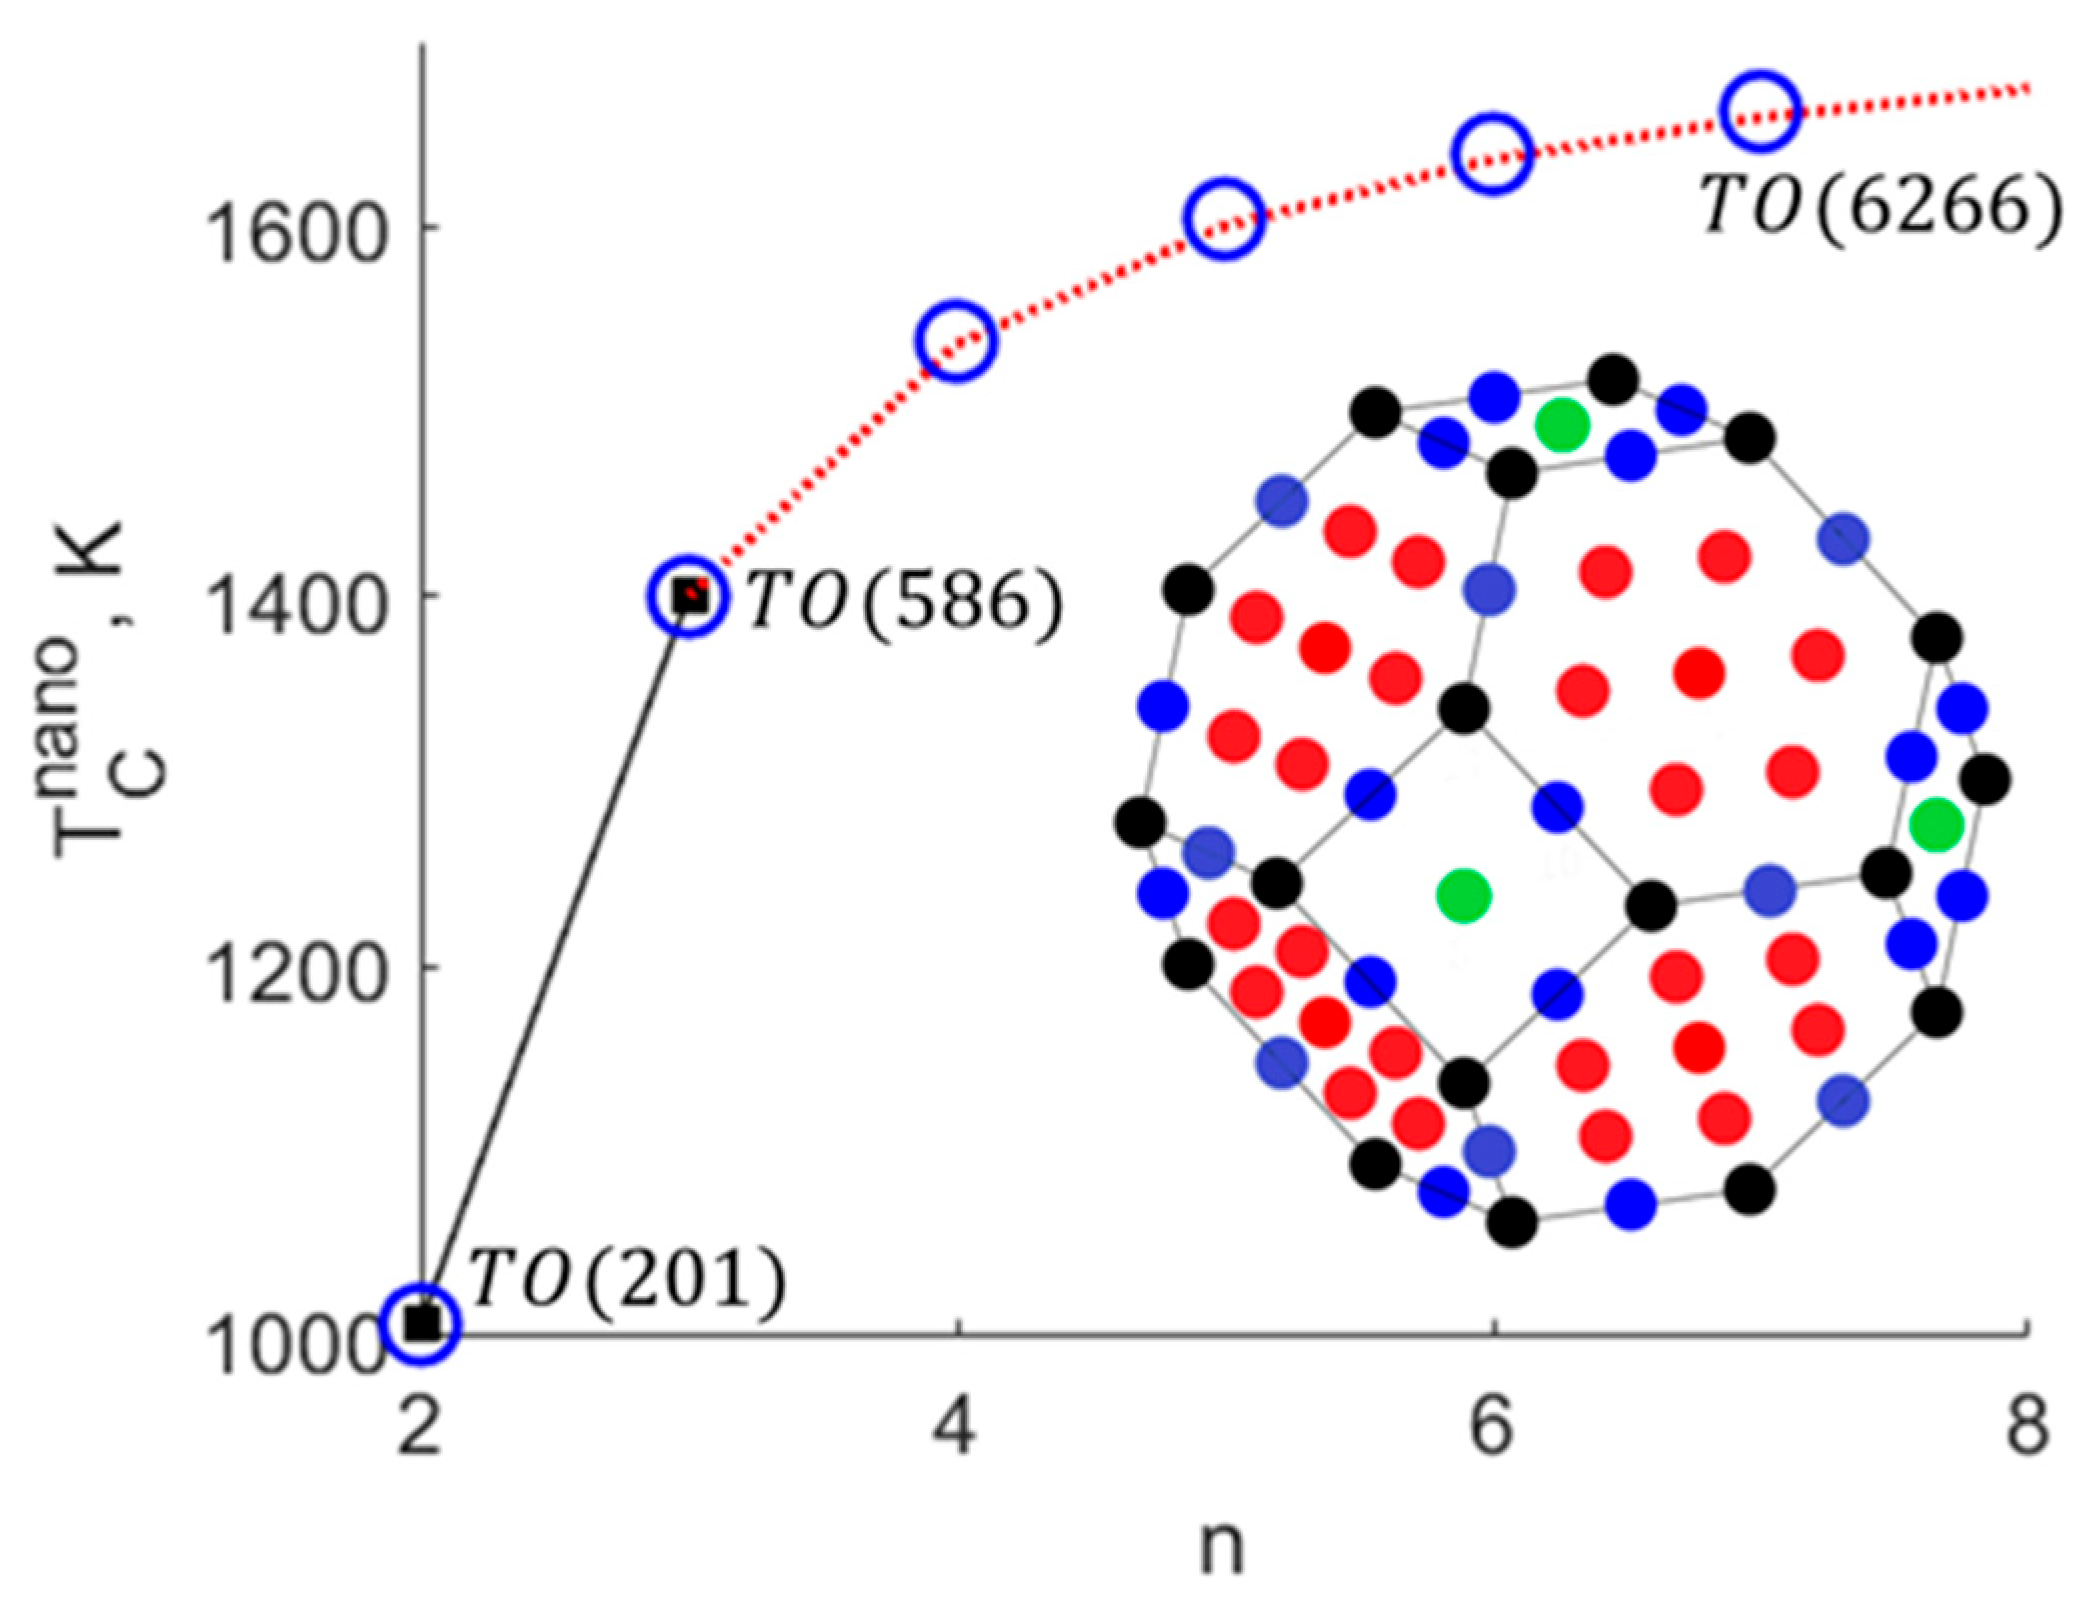
Figure 7.
Scaling plots of critical temperature vs. effective linear size, computed using the SSCS coefficients (Table 2) for s (blue dotted line) and s (red dotted line). FCEM/CGLM/BPM data are included for s (blue circles) and s (red circles). Inset: the two plots vs. the number of shells .
Figure 7.
Scaling plots of critical temperature vs. effective linear size, computed using the SSCS coefficients (Table 2) for s (blue dotted line) and s (red dotted line). FCEM/CGLM/BPM data are included for s (blue circles) and s (red circles). Inset: the two plots vs. the number of shells .
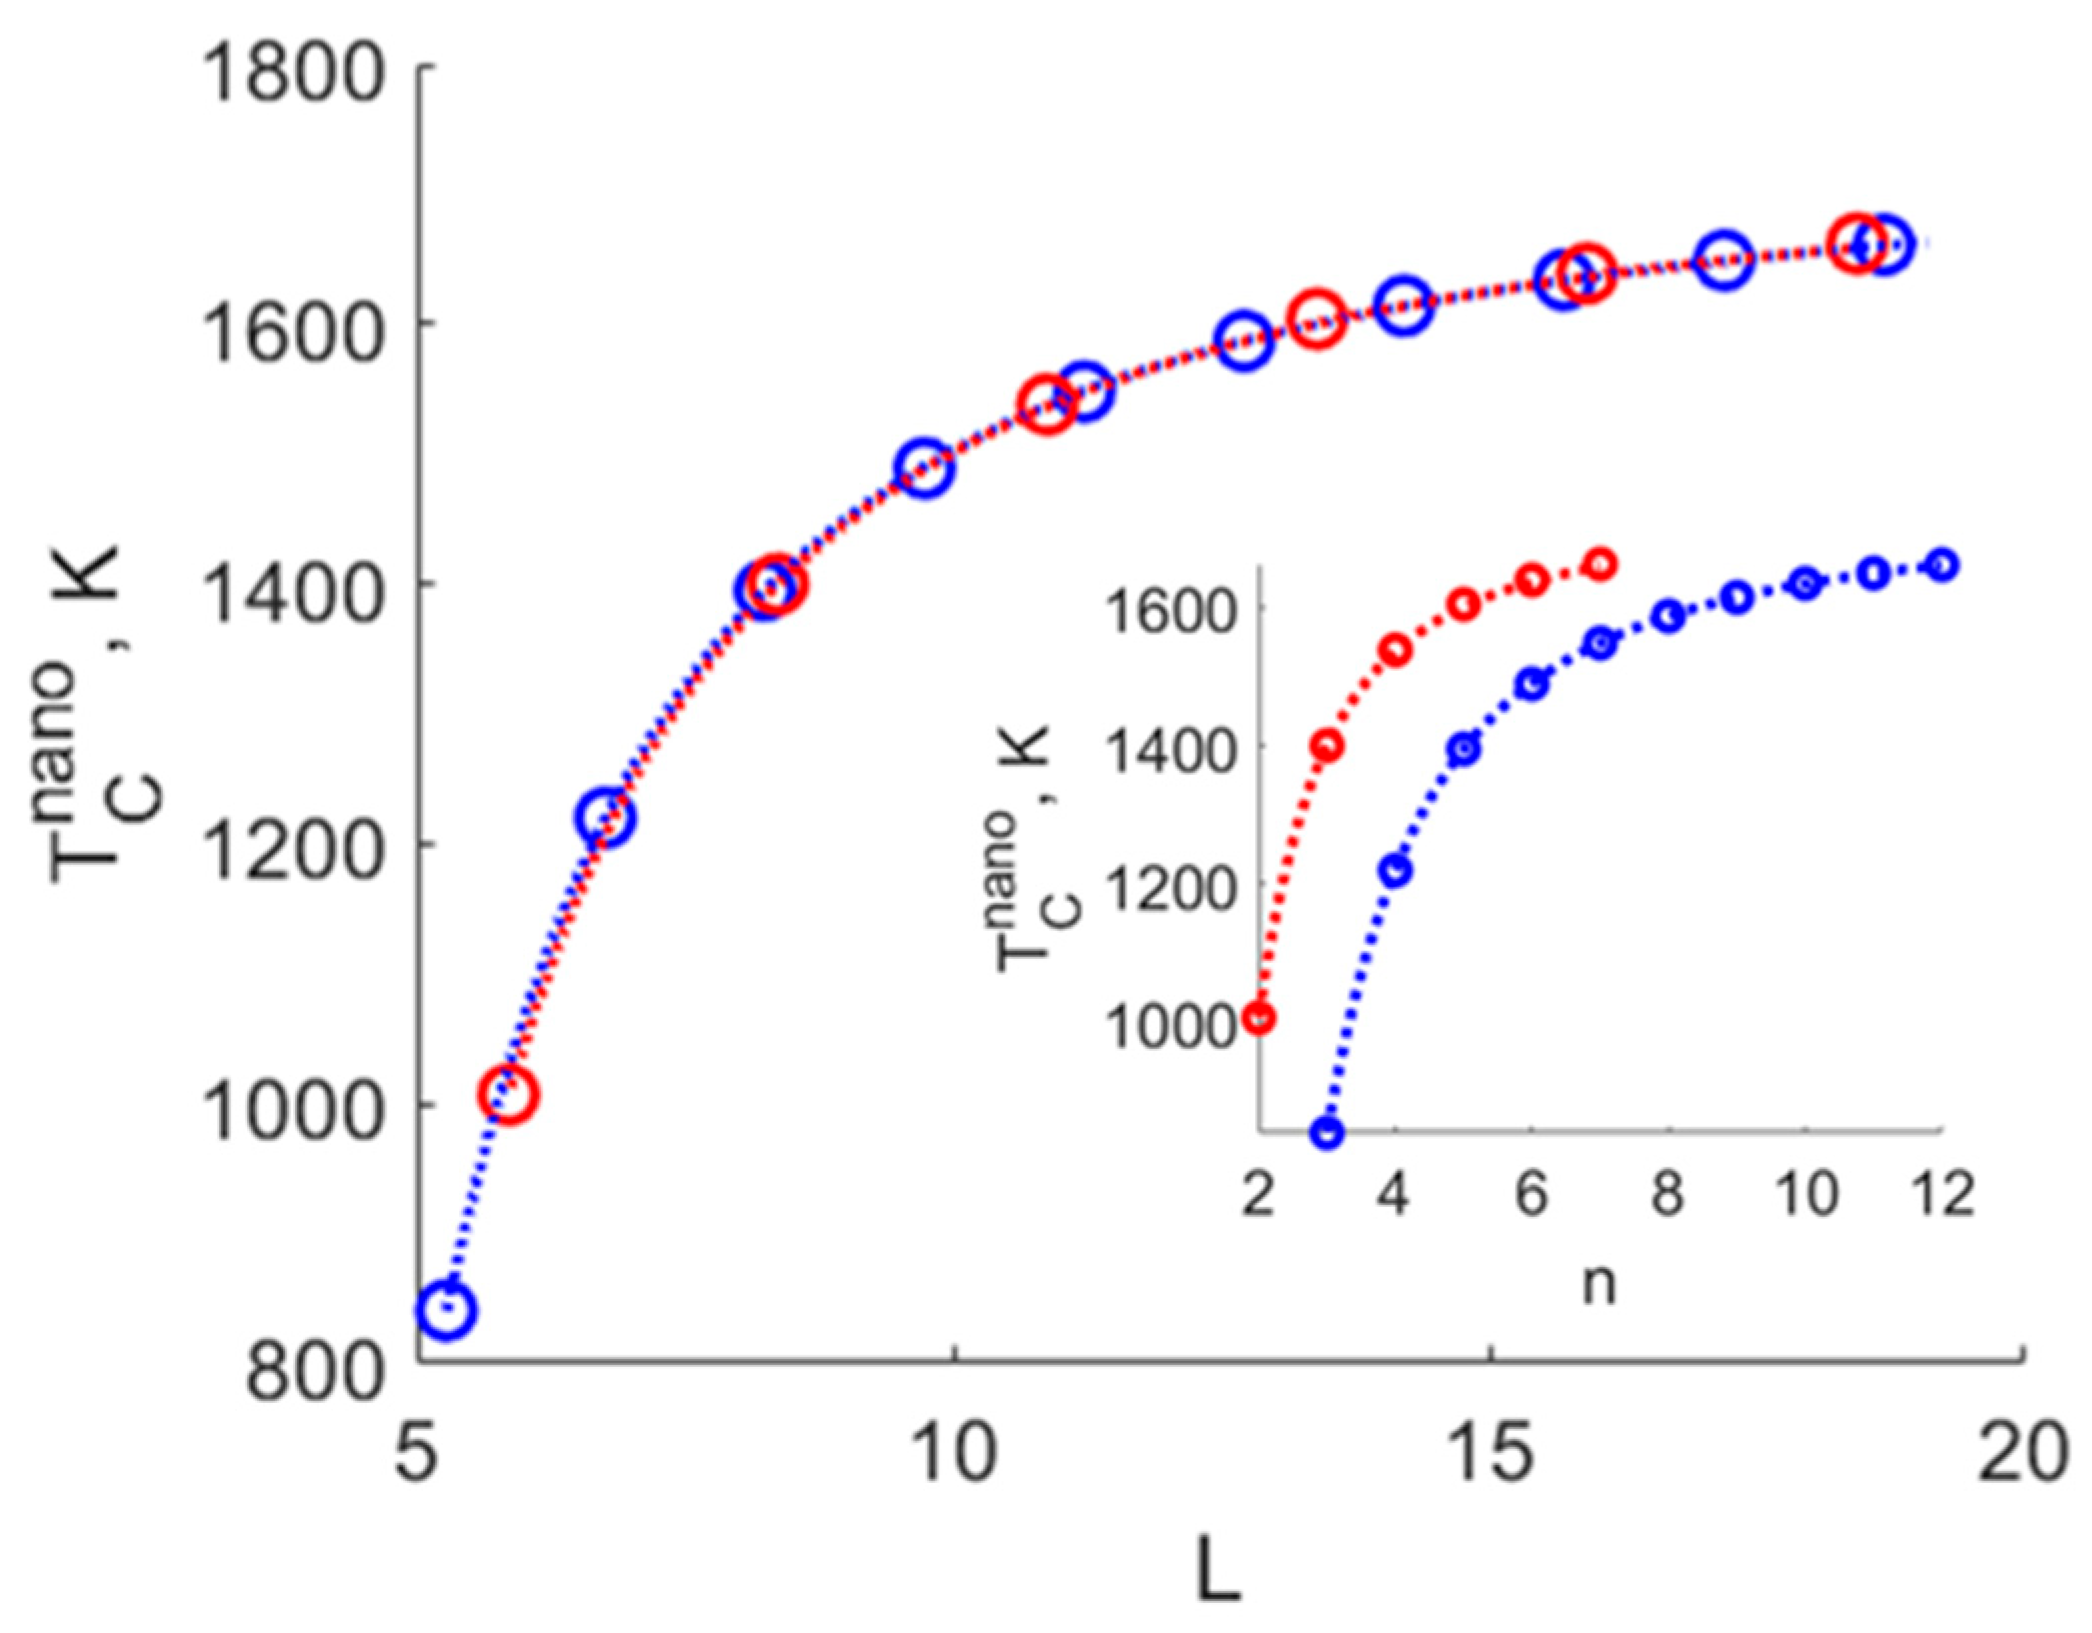
Table 1.
Fitted SSCS coefficients for .
| Coefficients | Fitting range I (147 - 49,049 atoms) |
Fitting range II (147 - 561 atoms) |
Fitting range III (921 - 49,049 atoms) |
| 0.25 | 0.27 | 0.24 | |
| 0.43 | 0.40 | 0.47 | |
| 4.15 | 4.25 | 3.86 | |
| RMSD* (), | 0.74 | 1.35 | 4.26 |
* Root Mean Square Deviation (RMSD) validated for range I.
Table 2.
Fitted SSCS coefficients fitted to and .
| Coefficients | Fitting range I (147 - 49,049 atoms) |
Fitting range II (147 - 561 atoms) |
Fitting range III (921 - 49,049 atoms) |
| 0.25 | 0.27 | 0.24 | |
| 0.43 | 0.40 | 0.47 | |
| 4.15 | 4.25 | 3.86 | |
| RMSD* (), | 0.74 | 1.35 | 4.26 |
Disclaimer/Publisher’s Note: The statements, opinions and data contained in all publications are solely those of the individual author(s) and contributor(s) and not of MDPI and/or the editor(s). MDPI and/or the editor(s) disclaim responsibility for any injury to people or property resulting from any ideas, methods, instructions or products referred to in the content. |
© 2026 by the authors. Licensee MDPI, Basel, Switzerland. This article is an open access article distributed under the terms and conditions of the Creative Commons Attribution (CC BY) license (http://creativecommons.org/licenses/by/4.0/).
Copyright: This open access article is published under a Creative Commons CC BY 4.0 license, which permit the free download, distribution, and reuse, provided that the author and preprint are cited in any reuse.