

Submitted:
07 August 2026
Posted:
10 August 2026
You are already at the latest version
Abstract
Artisanal and small-scale gold mining (ASGM) has driven mercury contamination in tropical freshwater systems, yet integrated assessments of Southeast Asian oxbow lakes remain rare. This study quantified total mercury (THg) concentrations in water, sediment, and fish from Lake Hanjalutung, an ASGM-affected oxbow lake in Central Kalimantan, Indonesia. Water THg was higher in the dry season (26.13–42.66 ng/L) than the rainy season (8.20–24.05 ng/L), whereas lake interior sediment was more enriched during the rainy season. Geoaccumulation index (Igeo) values increased from the river channels to the lake interior (1.7–2.0, moderately to heavily contaminated), confirming that the lake acts as a mercury sink. Fish THg concentrations ranged from 0.16 to 1.51 mg/kg dw. Bioaccumulation factors (BAF) ranged from 5.3 × 10³ to 39.0 × 10³ L/kg, and biota-sediment accumulation factors (BSAF) exceeded unity for all species, with both indices increasing significantly with body length, indicating body size as the primary driver of bioaccumulation. Maximum allowable weekly intake (MAWI) analysis showed that estimated regional consumption exceeded safe thresholds for all receptor groups, by 9- to 12-fold for one-year-old children and approximately 8-fold for pregnant women consuming W. leeri. Substituting with P. grootii consistently increased allowable intake by 3.5-fold, offering a practical, species-based risk reduction strategy for communities dependent on freshwater fish for protein.
Keywords:
mercury
; artisanal small gold mining
; oxbow lake
; bioaccumulation
; maximum allowable weekly intake
; Central Kalimantan
; health risk assessment
1. Introduction
Mercury pollution is one of the most pressing global environmental concerns owing to its persistence, capacity for bioaccumulation, and severe toxicity in biological systems [1,2,3,4]. In tropical regions, where artisanal and small-scale gold mining (ASGM) is prevalent, elemental mercury (Hg) is extensively used to form gold amalgams, releasing Hg-contaminated waste into adjacent river catchments and floodplain wetlands [5,6]. Once mobilized, total mercury (THg), which encompasses all mercury species present across environmental compartments, accumulates within aquatic networks, posing sustained threats to riverine ecosystems, freshwater food webs, and communities that depend on them for food.
Oxbow lakes are particularly vulnerable to Hg accumulation: their low-energy lentic hydrology promotes settling and long-term retention of fine, mercury-bearing particles in bottom sediments, which subsequently act as secondary contamination sources [4,7,8,9]. In lake and reservoir systems receiving mercury-laden inflows, more than 90% of Hg ultimately accumulates in bottom sediments [10]. The extent to which Hg is transferred from these abiotic compartments into fish can be quantified through the bioaccumulation factor (BAF), which describes the ratio of fish tissue THg to bulk water concentration, and the biota–sediment accumulation factor (BSAF), which characterizes the transfer efficiency from bottom sediments to fish tissue [11,12,13,14]. However, existing BAF and BSAF data are predominantly derived from the Neotropical Amazon [3,7], and their transferability to Southeast Asian oxbow systems with distinct ecology and consumption patterns remains poorly established. While aquaculture-driven mercury contamination has been documented in other Indonesian tropical lakes where Hg exceeded both WHO and national regulatory thresholds despite the absence of upstream mining activity [15], integrated assessments linking environmental mercury to fish bioaccumulation and human dietary exposure in systems where ASGM and aquaculture pressures coincide remain scarce.
Lake Hanjalutung (Central Kalimantan, Indonesia), a naturally isolated meander loop of the Rungan River within a major floodplain, is a critical study site for addressing these gaps [16]. The lake receives sustained Hg loading from an upstream watershed affected by an extensive history of long-standing ASGM operations, with previously documented THg concentrations ranging from 16 to 117 ng/L in bulk water and from 0.003 to 0.253 ng/mg dw in bottom sediments [17]. Lake Hanjalutung also functions as an active aquaculture site where net-cage fish are routinely harvested and consumed by local communities [16,18]. Fish consumption is near-universal in this region: 97.54% of the population in Central Kalimantan Province reportedly consumes fish [19], reflecting its role as a primary source of dietary protein for local communities. This dual status as a mercury-impacted environment and a direct regional food source underscores the urgent public health significance of evaluating THg levels across abiotic and biotic compartments.
To address these research gaps, this study aimed to determine the baseline concentrations of THg in the primary environmental compartments (bulk water, bottom sediments, and fish muscle tissue) of Lake Hanjalutung and to evaluate Hg bioaccumulation in fish through the application of BAF and BSAF metrics. Finally, this study sought to identify potential human exposure risks for local populations consuming fish from this ASGM-affected lake. By directly linking environmental THg concentrations in water and sediments to bioaccumulation in fish and dietary exposure in a local community, this study provides locally relevant evidence for food safety guidance and environmental management in one of the most mercury-affected tropical regions of the world.
2. Methods
2.1. Study Area and Sample Collection
This study was conducted at Lake Hanjalutung (Table 1; Figure 1), formed through the lateral migration and subsequent isolation of a Rungan River meander loop. The lake maintains a direct hydrological connection with the Rungan River through a northern inlet and southern outlet. No discharge was recorded at the southern outlet during both sampling seasons. This indicates that the lake functions as a semi-enclosed hydrological system with predominantly unidirectional inflow, promoting Hg retention and accumulation within the lake basin.
Five sampling points were established across the lake and the adjacent river channels (Figure 1). Three points span the lake body from the northern inlet junction (HJ2) through the lake center (HJ3) to the southern outlet (HJ4). Two additional points were located in the Rungan River channel immediately upstream (HJ1) and downstream (HJ5) of the lake, enabling the quantification of THg inputs and outputs at the lake–river interface. Bulk water and bottom sediment samples were collected during two contrasting hydrological seasons: the dry season (July 2025) and the rainy season (November 2025); fish samples were collected during the rainy season only from a single offshore net cage aquaculture unit within the lake. This two-season design was adopted because monsoon-driven hydrological fluctuations alter THg mobilization and bioavailability in tropical ASGM-affected systems [12,20,21]. The river discharge was measured at each station during each sampling visit using a current meter.
Bulk water samples were collected at the surface at each point by directly immersing acid-washed polypropylene bottles into the water column. The samples were stored at 4 °C during field transport and shipped under cold-chain conditions to a laboratory in Japan for THg analysis. Bottom-sediment samples were collected using an Ekman grab sampler. The surface sediment layer from each grab sample was transferred into new polyethylene bags and maintained at −20 °C prior to laboratory analysis. Fish samples were obtained from a single-net-cage aquaculture unit operated by local communities within Lake Hanjalutung during the rainy season. A total of 13 fish were sampled and identified to species level. Dorsal muscle samples were excised using stainless steel tools, immediately transferred to separate microcentrifuge tubes, and stored frozen prior to laboratory analysis. The total length (cm) and body weight (g) were recorded for each specimen prior to tissue extraction.
2.2. Total Mercury Analysis
Total mercury (THg) concentrations in bulk water samples were determined using the oxidation and purge-and-trap preparation procedure outlined in US EPA Method 1631E [22], with detection by thermal-desorption cold-vapor atomic absorption spectrometry (CV-AAS) using a direct mercury analyzer (MA-2000, NIC Co., Ltd., Japan). Analytical reproducibility was evaluated using triplicate measurements, with a coefficient of variation (CV) < 10% as the acceptance criterion, and the results are reported as the mean ± standard deviation of three replicates in ng/L.
The bottom sediment THg was quantified by thermal decomposition–amalgamation–cold vapor atomic absorption spectrometry (TDA-AAS) using a direct mercury analyzer (MA-3000, NIC Co., Ltd., Japan) without prior acid digestion. Prior to analysis, the samples were centrifuged at 3,000 rpm for 10 min to remove excess pore water; 10–50 mg of semi-wet sediment was then introduced directly into a ceramic combustion boat. Moisture content was determined gravimetrically from a separate aliquot dried to constant weight at 105 °C for 24 h, and THg concentrations are reported on a dry weight basis (µg/kg dw). Each sample was analyzed in triplicate, and a coefficient of variation below 10% was accepted for all measurements.
THg in the dorsal muscle tissue was quantified using MA-3000 by applying the same TDA-AAS procedure described above, without prior freeze-drying or acid digestion. Fresh wet tissues were weighed directly into a ceramic combustion boat for analysis. Moisture content was determined using the same method used for the sediment. THg concentrations are expressed on both a wet weight (mg/kg ww) and dry weight (mg/kg dw) basis. Wet weight values were applied in the human health risk calculations, whereas dry weight values facilitated comparisons with published data. Each sample was analyzed in triplicate (CV < 10%).
Procedural blanks and certified reference materials (CRMs) were included in each analytical batch to monitor accuracy and detect contamination. The calibration curves for both instruments maintained consistent linearity throughout the study period (MA-2000: R² = 0.9988–0.9999; MA-3000: R² = 0.9999). Sediment measurement accuracy was verified against NMIJ CRM 7303-a (Trace Elements in Lake Sediment, AIST; certified THg: 0.067 ± 0.006 mg/kg dw), which was selected on the basis of its matrix compatibility with the lacustrine sediment samples. For fish tissue, a matrix-matched CRM was unavailable; therefore, accuracy was assessed through spike recovery tests, with recoveries of 97–105% across all three matrices (water, sediment, and fish tissue) within the accepted range of 80–120%. The method detection limit (MDL) for each matrix was calculated as three times the standard deviation of ten replicate blank measurements. All reagents were of trace-metal grade; ultrapure water (≥18.2 MΩ·cm) was used throughout the preparation procedures.
2.3. Evaluation Index
2.3.1. Geo-Accumulation Index (Igeo)
The geoaccumulation index (Igeo) was used to assess Hg contamination in the bottom sediment by evaluating metal enrichment relative to background values. The Igeo was computed using Equation (1) [23].
where Cn is the concentration of Hg in the sediment (mg/kg dw) and Bn is the background concentration of Hg (mg/kg dw). The background Hg concentration used in this calculation was 0.023 mg/kg, based on the lowest recorded value from a relatively pristine river system in Indonesia [24,25], and 1.5: The corrective factor adjusts for lithologic variations to avoid overestimating contamination from natural element fluctuations.
2.3.2. Bioaccumulation Factor (BAF) and Biota Sediment Accumulation Factor (BSAF)
The bioaccumulation factor (BAF) was used to determine the ability of the fish to accumulate Hg relative to its concentration in the surrounding water by integrating the uptake from all exposure routes. The BAF values were calculated per unit using the mean wet weight tissue concentration, according to Equation (2). The tissue concentrations were expressed on a wet weight basis, consistent with the standard BAF conventions for aquatic organisms [26,27].
where Cfish-ww is the mean wet weight concentration of Hg in fish muscle (µg/kg ww) and Cwater is the concentration of Hg in water (µg/L).
The biota–sediment accumulation factor (BSAF) was used to determine the transfer of Hg from the bottom sediment into fish tissue, providing a direct measure of sediment-to-biota accumulation [28]. BSAF was evaluated per individu according to Equation (3). BSAF values were expressed on a dry weight basis () to eliminate moisture-driven variability and accurately reflect true solid-to-solid partitioning [29].
where Cfish-dw is the mean dry weight concentration of Hg in the fish muscle (mg/kg dw) and Csediment is the concentration of Hg in the sediment (mg/kg dw).
2.3.3. Human Exposure Risk Assessment
The health risks of Hg exposure through fish consumption were evaluated using USEPA methodology [30,31,32]. This study focused on children aged 1-10 years and pregnant women as priority receptor groups, as these populations are recognized as particularly vulnerable to methylmercury exposure. Methylmercury readily crosses the placental barrier and reaches the fetal brain at near-maternal concentrations, while the immature blood-brain barrier in fetuses and young children permits relatively unrestricted access to developing neurons during critical windows of neurogenesis, synaptogenesis, and myelination [33,34]. The lower body weight of young children produces a markedly higher per-kilogram dose for any given fish intake and reduced renal and hepatic clearance in both pregnant women and young children prolongs methylmercury retention in target tissues [35,36].
The target hazard quotient (THQ) was calculated as (Equation 4):
where IR is the ingestion rate (kg/day), BW is body weight (kg), and RfD is the USEPA reference dose for methylmercury (1.0 × 10⁻⁴ mg/kg/day) [30]. Total mercury was conservatively assumed to be present as methylmercury, consistent with its 90-99% dominance in fish muscle [37,38]. To express risk as a directly interpretable and portion-independent consumption metric, the equation was rearranged to solve for the maximum allowable weekly intake (MAWI) at THQ 1 (Equation (5)):
where 7 converts the daily RfD to a weekly basis. MAWI represents the maximum total mass of a specific fish species (g/week) that can be consumed without exceeding THQ 1, independent of how that mass is distributed across individual meals.
Body weight for pregnant women was assigned at 55 kg, representing the pre-pregnancy baseline for Indonesian women aged 19-29 years [39], consistent with the national mean maternal age of 28.7 years [40]. Body weights for children aged 1-10 years were derived from the national anthropometric reference [39] using linear interpolation between the midpoint body weights of adjacent age bands, with the infant band (6-11 months, 9 kg at midpoint age 0.71 years) enabled interpolation for the youngest ages, while the 10-12 years band (gender-averaged, 37 kg) served as the upper anchor. Based on interpolated calculations, body masses scaled sequentially from 9.9 kg (1 year old) to 19.0 kg (5 years old), reaching 33.7 kg by age 10.
3. Results and Discussion
3.1. THg Concentration in Water and Sediment, and Geoaccumulation
Total mercury concentrations in bulk water were consistently higher in the dry season (26.13–42.66 ng/L) than in the rainy season (8.20–24.05 ng/L) at every station (Figure 2a). River-channel stations (HJ1 and HJ5) retained the highest concentrations in both seasons, while the lake interior (HJ2–HJ4) recorded the lowest, particularly during the rainy season (8.20–8.91 ng/L). At river stations, this seasonal decline coincided with a more than twofold increase in discharge (41.70–45.85 to 96.14–101.3 m³/s), consistent with dilution by higher fluvial flow. Within the lake, discharge remained negligible (0.00–1.68 m³/s), indicating minimal through-flow exchange with the river system. The parallel seasonal decline observed at the river stations suggests that the lower lake interior concentrations during the rainy season may instead reflect reduced Hg loading from already-diluted river inflow rather than direct in-lake rainfall dilution alone, although the contribution from direct precipitation cannot be quantified without site-specific rainfall data.
As an active net cage aquaculture site, Lake Hanjalutung falls under the Indonesian Class II water designation, and all concentrations fell well below this limit (2,000 ng/L) [41] and the Japanese standard (500 ng/L) [42]. However, because inorganic mercury accounts for up to 99.8% of the total mercury in water columns of lakes [43], a direct comparison of THg with the CCME inorganic mercury guideline (26 ng/L) [44] is justified. Under this framework, the dry-season THg at all five stations exceeded the CCME threshold, indicating that domestic regulatory compliance does not necessarily indicate the absence of ecological risk, as lake water already exceeds internationally protective thresholds for aquatic life.
Sediment THg at lake-interior stations (HJ2–HJ4; mean 123 µg/kg dw, range 108.3–139.4) was about 1.8 times that of river-channel stations (HJ1, HJ5; mean 67.5 µg/kg, range 50.0–94.9) across both seasons (Figure 2b). During the rainy season, river-channel THg decreased (HJ1:68.9 to 50.0; HJ5:94.9 to 56.4 µg/kg dw) as higher discharge flushed fine material downstream, while lake stations HJ3 and HJ4 rose (108.3 to 139.4 and 118.1 to 135.8 µg/kg dw, respectively), confirming that the oxbow lake retains incoming particles rather than exporting them. The peak value (139.4 µg/kg dw, HJ3) reached 82% of the CCME ISQG (170 µg/kg dw) [45] and 77% of the consensus-based TEC (180 µg/kg dw) [46]. This proximity to threshold levels highlights substantial Hg retention within the basin, warranting continued environmental concern.
The geoaccumulation index (Igeo) confirmed the lake–river contrast (Figure 3): lake-interior stations (HJ2–HJ4) averaged 1.83 (Müller Class 2, moderately contaminated), with the lake center (HJ3) reaching 2.01 during the rainy season and entering Class 3 (moderately to heavily contaminated), whereas river-channel stations (HJ1, HJ5) averaged 0.93 (Class 1, uncontaminated to moderately contaminated). These values are far below those at directly mined ASGM sites such as Gunung Pongkor, West Java, where sediment Hg reached 64.4 mg/kg dw (range 2.60–150) [25], confirming that Hg contamination in Lake Hanjalutung remains moderate by comparison.
3.2. Mercury Concentrations in Fish
Among the five species examined (Table 2), tissue THg concentrations varied more than three-fold, from 0.094 mg/kg ww in Pristolepis grootii to 0.332 mg/kg ww in Wallago leeri. The two largest species, W. leeri and Channa micropeltes, exhibited the highest THg concentrations (0.332 and 0.242 mg/kg ww, respectively), whereas the three smaller-bodied species (Trichopodus leerii, P. grootii, O. melanopleura) showed lower concentrations (0.094–0.137 mg/kg ww), indicating that body size contributes to variation in THg burden. These values are within the range reported for Lake Tilap, an endorheic basin of the same Rungan River, where nine fish species showed a muscle THg concentration of 0.034–0.426 mg/kg ww, with the highest concentration in Luciosoma trinema [47]. All five species in the present study remained below the Codex Alimentarius guideline level for methylmercury in non-predatory fish (0.5 mg/kg ww; CAC/GL 7-1991) [48] and and the maximum permissible mercury concentration in processed fish established by the Indonesian National Agency of Drug and Food Control (BPOM) (0.5 mg/kg ww) [49]. W. leeri showed the narrowest safety margin (66% of the limit), followed by C. micropeltes (48%), whereas smaller species retained wider margins (19–27%).
3.3. Mercury Bioaccumulation in Fish: Species Variability and Body Length Effects
BAF ranged from 5.3 × 10³ to 39 × 103 L/kg and BSAF ranged from 1.2 to 10.8 across all individuals, with the highest values observed in W. leeri (Table 3). The smaller-bodied species (T. leerii, P. grootii, O. melanopleura) exhibited BAF values between 5.3 × 10³ and 19 × 103 L/kg, whereas the larger-bodied W. leeri and C. micropeltes showed higher values ranging from 28 × 103 to 39 × 10 k L/kg, consistent with body size as a major determinant of bioaccumulation in this system. BSAF values exceeding unity for all species confirmed that fish tissue Hg consistently surpassed sediment concentrations, a pattern also reported in ASGM-affected Amazonian oxbow lakes, where fish Hg accumulation was similarly linked to local mining intensity and sediment Hg exposure [50].
Both indices increased significantly with body length (BAF: r = 0.868, p < 0.001; BSAF: r = 0.827, p < 0.001; n = 13; Figure 4). This pattern is consistent with the biokinetic basis for size-dependent Hg accumulation in fish, where larger older individuals exhibit slower Hg elimination rates and reduced growth dilution relative to smaller individuals, resulting in progressive accumulation over a longer exposure window [51]. The strength of this body length relationship for both BAF and BSAF suggests that individual size is a more consistent predictor of Hg bioaccumulation in this system than is species identity alone.
3.4. Maximum Allowable Weekly Intake and Human Exposure Risk
Across all four receptor groups, the maximum allowable weekly intake (MAWI) exhibited a consistent species-specific hierarchy: P. grootii and T. leerii provided the widest consumption margins, while W. leeri had the narrowest (Figure 5). This hierarchy reflects the previously established gradient in body length, bioaccumulation factor, and mercury concentration, and remained consistent across receptor groups with body weights ranging from 9.9 to 55 kg. Thus, species-level mercury concentration, primarily determined by body length, is the principal factor influencing relative exposure risk in this system, rather than receptor body weight.
For the youngest receptor group (age 1 year, BW 9.9 kg), the MAWI for W. leeri was only 20.9 g/week, the lowest value among all species-receptor combinations, while C. micropeltes (n = 1) yielded a similarly restrictive 28.7 g/week. To contextualize these thresholds, Apriani et al. [52], reported a mean daily fish intake of 63.8 g/day on fish-consumption days among children under five in a rural riverine community in West Sumatra, with fish consumed three to four days per week. This reference was selected due to its environmental similarity to the present study area, as both are located in interior hinterland regions with limited access to marine fish, resulting in near-total reliance on locally sourced freshwater species for animal protein. Applying this consumption pattern yields an estimated weekly intake of 191 to 255 g/week for children under five, exceeding the MAWI for W. leeri by 9- to 12-fold. Even P. grootii and T. leerii, the species with the lowest mercury concentrations, permitted only 73.6 and 68.9 g/week, respectively, approximately 2.5 to 3 times below the lower bound of estimated consumption. These results align with the elevated Hazard Index (HI = 20.73) independently reported for freshwater fish consumption in Palangka Raya [53], indicating that the mercury exposure risk identified here is consistent with broader regional patterns in ASGM-affected river systems of Central Kalimantan
For children aged 5 and 10 years, MAWI increased proportionally with body weight: for W. leeri, values rose from 40.1 g/week (age 5) to 71.0 g/week (age 10), while for P. grootii, the corresponding values were 141.3 and 250.3 g/week. Although absolute MAWI values increase with age, the gap between MAWI and estimated consumption narrows only slightly, as older children are likely to consume greater quantities of fish. At age 10, the MAWI for W. leeri (71.0 g/week) remains substantially below typical regional fish consumption levels.
Pregnant and breastfeeding women exhibited the highest MAWI among all receptor groups (P. grootii: 409.0, T. leerii: 382.8, O. melanopleura: 280.9, C. micropeltes: 159.1, W. leeri: 116.0 g/week), reflecting their greater body weight (55 kg). However, these wider margins do not provide equivalent biological protection. The USEPA reference dose (RfD) was derived specifically from developmental neurotoxicity endpoints in prenatally exposed populations, and methylmercury crosses the placental barrier to reach the fetal brain at near-maternal concentrations [33,34]. In Central Kalimantan, total fish consumption is approximately 135 g/day, or 945 g/week [54]. Although available data could not quantify the exact proportion attributable to freshwater fish alone, Lake Hanjalutung and its surrounding communities lie deep within the riverine interior of Central Kalimantan, far from any coastal fishery. This geographical constraint, combined with the dominance of inland fisheries as the primary protein source for local communities [55,56], strongly suggests that freshwater fish constitute the majority of total fish intake. Under this assumption, the MAWI for W. leeri consumed by pregnant women (116.0 g/week) would be exceeded by approximately eightfold. Even for P. grootii, the species with the widest consumption margin, the estimated weekly intake exceeds the MAWI (409.0 g/week) by more than 2-fold.
Collectively, these results demonstrate that communities surrounding Lake Hanjalutung experience severe and sustained mercury exposure due to their reliance on freshwater fish. For children as young as one year old, the MAWI for the highest-mercury species (20.9 g/week for W. leeri) would be exceeded by as few as two to three servings per week, a threshold likely surpassed in households where freshwater fish is consumed with every meal [36,37]. Pregnant women, despite higher body weight, have consumption margins that are routinely exceeded by prevailing dietary patterns, placing fetal neurodevelopment at ongoing risk. This exposure burden is further compounded by two factors not captured in the MAWI calculation. First, local communities consume whichever species are available from the lake and surrounding waterways, rather than a single species. When multiple species are consumed in the same week, mercury doses are additive, and the effective safety margin is narrower than any individual MAWI value would suggest. Second, fish is not the sole dietary source of mercury. Other animal-protein foods, including processed fish products, may contribute additional mercury not accounted for in this species-specific assessment.
Despite the severity of these exposure estimates, the differences between species offer a practical and culturally appropriate approach to risk reduction. For pregnant women, substituting W. leeri with P. grootii increases the allowable weekly intake from 116.0 to 409.0 g/week, a 3.5-fold improvement. For a one-year-old child, the same substitution raises MAWI from 20.9 to 73.6 g/week, more than tripling the safe consumption threshold. At age 10, P. grootii (250.3 g/week) allows 3.5 times more consumption than W. leeri (71.0 g/week). Although no single species can fully close the gap between MAWI and prevailing consumption for all receptor groups, preferential consumption of P. grootii and T. leerii would substantially reduce cumulative mercury exposure without eliminating fish from the diet. Eliminating fish would have severe nutritional consequences, given the near-total dependence of these riverine communities on freshwater fish as their primary source of protein and micronutrients. These findings highlight the urgent need for species-specific consumption guidance in the ASGM-affected peatlands of Central Kalimantan, with priority given to protecting children in early life and women during pregnancy and breastfeeding.
4. Conclusions
Lake Hanjalutung functions as an Hg sink, with Igeo values increasing from river channels to the lake interior (1.7–2.0, moderately to heavily contaminated). Seasonal hydrology concentrates Hg in the water column during the dry season and enriches lake interior sediments during the rainy season. Fish THg ranged from 0.16 to 1.51 mg/kg dw, and this mercury reservoir sustains bioaccumulation across all five species (BAF: 5.3 × 10³ to 39.0 × 10³ L/kg; BSAF > 1), with both indices increasing significantly with body length (p < 0.001), indicating that individual body size is the primary driver of mercury bioaccumulation in this system. The maximum allowable weekly intake analysis, applied to children aged 1–10 years and pregnant women, demonstrated that W. leeri yielded MAWI values of 20.9–71.0 g/week for children and 116.0 g/week for pregnant women, all substantially exceeded by estimated regional freshwater fish consumption. Comparison with the FDA/EPA default recommendation of one weekly serving confirmed that W. leeri falls below this international benchmark for all pediatric age groups (0.71- to 0.84-fold), while P. grootii and T. leerii exceeded it by 1.7- to 3.6-fold, identifying these species as comparatively lower-risk protein sources. Substituting W. leeri with P. grootii consistently increased allowable intake by 3.5-fold across all receptor groups, offering a practical, species-based risk reduction strategy. These findings provide locally grounded evidence for species-specific consumption advisories and environmental mercury monitoring in ASGM-affected oxbow lakes, with particular urgency for children in the first years of life and women during pregnancy and breastfeeding.
Acknowledgments
This study was supported by JSPS KAKENHI Grant Number 25K07975 and was partially funded by the Environment Research and Technology Development Fund (5MF-2506; JPMEERF20255M06) of the Environmental Restoration and Conservation Agency. The authors would like to express their sincere gratitude to Dr. Osamu Nagafuchi and Dr. Koyomi Nakazawa for their invaluable guidance and technical assistance in the determination of total mercury (THg) concentrations in fish samples. Their expertise and support were essential to the successful implementation of the analytical methodology used in this study.
References
- Rahman, A.; Maria Ulfa, A.; Efendi, Junaidi; Supriastuti, E. Biomagnification of Mercury Through the Aquatic Food Chain in Lake Lebo Taliwang West Sumbawa. JBT 2025, 25(3), 2540–5. [Google Scholar] [CrossRef]
- Elvince, R.; Ardhani, B. Mercury Dynamics in Mining-Adjacent Ecosystems: Risk Assessment of Lake Lais, Central Kalimantan, Indonesia. LIMNOTEK 2025, 31(1), 36–43. [Google Scholar] [CrossRef]
- Montaña, C.G.; Liverpool, E.; Taphorn, D.C.; Schalk, C.M. The cost of gold: Mercury contamination of fishes in a Neotropical river food web. Neotrop. ichthyol. 2021, 19(3), e200155. [Google Scholar] [CrossRef]
- Gustin, M.S.; Bank, M.S.; Bishop, K.; Bowman, K.; Branfireun, B.; Chételat, J.; et al. Mercury biogeochemical cycling: A synthesis of recent scientific advances. Sci. Total Environ. 2020, 737, 139619. [Google Scholar] [CrossRef] [PubMed]
- Aldous, A.R.; Tear, T.; Fernandez, L.E. The global challenge of reducing mercury contamination from artisanal and small-scale gold mining (ASGM): evaluating solutions using generic theories of change. Ecotoxicology 2024, 33(4–5), 506–17. [Google Scholar] [CrossRef] [PubMed]
- Donkor, A.K.; Ghoveisi, H.; Bonzongo, J.C.J. Use of Metallic Mercury in Artisanal Gold Mining by Amalgamation: A Review of Temporal and Spatial Trends and Environmental Pollution. Minerals 2024, 14(6), 555. [Google Scholar] [CrossRef]
- Gerson, J.R.; Topp, S.N.; Vega, C.M.; Gardner, J.R.; Yang, X.; Fernandez, L.E.; et al. Artificial lake expansion amplifies mercury pollution from gold mining. Sci. Adv. 2020, 6(48), eabd4953. [Google Scholar] [CrossRef] [PubMed]
- Gutiérrez-Mosquera, H.; Marrugo-Negrete, J.; Díez, S.; Morales-Mira, G.; Montoya-Jaramillo, L.J.; Jonathan, M.P. Mercury distribution in different environmental matrices in aquatic systems of abandoned gold mines, Western Colombia: Focus on human health. J. Hazard. Mater. 2021, 404, 124080. [Google Scholar] [CrossRef] [PubMed]
- Zong, J.; Zhang, H.; Li, X.; Bai, X.; Hu, Y.; Cui, D.; et al. Process of mercury accumulation in urban strip river artificial wetland ecosystems: a case study of Changchun, a typical industrial city in Northeast China. Front Plant Sci. 2024, 15, 1392904. [Google Scholar] [CrossRef] [PubMed]
- Xin, S.; Wang, B.; Yuan, Y.; Wang, S. Assessment of the Spatial Variations of Mercury and Methylmercury in the Sediment of a Lake and Its Inflow River Estuaries. Water 2023, 15(8), 1494. [Google Scholar] [CrossRef]
- Depew, D.C.; Basu, N.; Burgess, N.M.; Campbell, L.M.; Devlin, E.W.; Drevnick, P.E.; et al. Toxicity of dietary methylmercury to fish: Derivation of ecologically meaningful threshold concentrations. Environ. Toxicol. Chem. 2012, 31(7), 1536–47. [Google Scholar] [CrossRef] [PubMed]
- Chasar, L.C.; Scudder, B.C.; Stewart, A.R.; Bell, A.H.; Aiken, G.R. Mercury Cycling in Stream Ecosystems. 3. Trophic Dynamics and Methylmercury Bioaccumulation. Env. Sci. Technol. 2009, 43(8), 2733–9. [Google Scholar] [CrossRef] [PubMed]
- Eagles-Smith, C.A.; Silbergeld, E.K.; Basu, N.; Bustamante, P.; Diaz-Barriga, F.; Hopkins, W.A.; et al. Modulators of mercury risk to wildlife and humans in the context of rapid global change. Ambio 2018, 47(2), 170–97. [Google Scholar] [CrossRef] [PubMed]
- Sinclair, C.A.; Garcia, T.S.; Eagles-Smith, C.A. A Meta-Analysis of Mercury Biomagnification in Freshwater Predatory Invertebrates: Community Diversity and Dietary Exposure Drive Variability. Env. Sci. Technol. 2024, 58(43), 19429–39. [Google Scholar] [CrossRef] [PubMed]
- Wojewódka-Przybył, M.; Soeprobowati, T.R.; Komala, P.S.; Nastuti, R.; Subehi, L.; Takarina, N.D.; et al. Exploring Spatial Dynamics of Water Quality in a Tropical Lake Affected by Aquaculture. Water 2024, 16(21), 3079. [Google Scholar] [CrossRef]
- Elvince, R.; Kembarawati. Kajian Kualitas Air Danau Hanjalutung untuk Kegiatan Perikanan di Kelurahan Petuk Katimpun, Kota Palangka Raya, Kalimantan Tengah (Water Quality Study of Lake Hanjalutung for Fishery Activities in Petuk Katimpun Village, Palangka Raya City, Central Kalimantan). J. Teknol. Lingkung. Lahan Basah 2021, 09(1), 029–41. [Google Scholar] [CrossRef]
- Elvince, R.; Inoue, T.; Tsushima, K.; Takayanagi, R.; Ardianor; Darung, U.; et al. Assessment of Mercury Contamination in the Kahayan River, Central Kalimantan, Indonesia. J. Wat Envir Tech 2008, 6(2), 103–12. [Google Scholar] [CrossRef]
- Susila, N. Analisis Sosial Ekonomi Masyarakat Kelurahan Petuk Katimpun dalam Mendukung Pemanfaatan Danau Hanjalutung Sebagai Kawasan Alternatif Pengembangan Usaha Perikanan di Kota Palangka Raya (Socio-Economic Analysis of The Petuk Ketimpun District Communites in Supporting the Use of Hanjalantung Lake as An Alternative Fishery Business Development Area in Palangka Raya City). J. Ilmu Hewani Trop. [Internet] 2012, 1(2). Available online: https://unkripjournal.com/index.php/JIHT/article/viewFile/15/14. [CrossRef]
- Pratiwi, D.; Muaris, H.; Musiawan, R.; Basrowi, R.W.; Kinesya, E. EXPLORING THE LOCAL FOOD CONSUMPTION AND KNOWLEDGE RETENTION FOR STUNTING PREVENTION. 2025, Vol. 03 03(01). [Google Scholar]
- Bastos, W.R.; Dórea, J.G.; Bernardi, J.V.E.; Lauthartte, L.C.; Mussy, M.H.; Lacerda, L.D.; et al. Mercury in fish of the Madeira river (temporal and spatial assessment), Brazilian Amazon. Environ. Res. 2015, 140, 191–7. [Google Scholar] [CrossRef] [PubMed]
- Cardoso, P.G.; Morais, H.; Crespo, D.; Tavares, D.; Pereira, E.; Pardal, M.Â. Seasonal characterization of mercury contamination along the Portuguese coast: human health and environmental risk assessment. Env. Sci. Pollut. Res. 2023, 30(45), 101121–32. [Google Scholar] [CrossRef] [PubMed]
- Telliard, W.A.; Gomez-Taylor, M. Technical Method EPA-821-R-02-019; Method 1631, Revision E: Mercury in Water by Oxidation, Purge and Trap, and Cold Vapor Atomic Fluorescence Spectrometry [Technical Method] [Internet]. Revision E. U.S. Environmental Protection Agency, Office of Water, Engineering and Analysis Division: Washington, DC, Aug 2002. Available online: https://www.epa.gov/sites/default/files/2015-08/documents/method_1631e_2002.pdf.
- Müller, G. Index of geoaccumulation in sediments of the Rhine River. GeoJournal 1969, 2(3), 108–18. [Google Scholar] [CrossRef]
- Heumasse, H.; Omar, S.B.A.; Demmallino, E.B. Mercury (Hg) contamination on water, sediment and macrozoobenthos in Waelata River, Wamsait Village Waelata Sub-district, Buru District, Maluku Province. J. Phys. Conf. Ser. 2019, 1341(9), 092019. [Google Scholar] [CrossRef]
- Agustiani, T.; Sulistia, S.; Sudaryanto, A.; Kurniawan, B.; Poku, P.A.; Elwaleed, A.; et al. Mercury Contamination and Human Health Risk by Artisanal Small-Scale Gold Mining (ASGM) Activity in Gunung Pongkor, West Java, Indonesia. Earth 2025, 6(3), 67. [Google Scholar] [CrossRef]
- Gobas, F.A.P.C.; Lee, Y.S.; Lo, J.C.; Parkerton, T.F.; Letinski, D.J. A Toxicokinetic Framework and Analysis Tool for Interpreting Organisation for Economic Co-operation and Development Guideline 305 Dietary Bioaccumulation Tests. Environ. Toxicol. Chem. 2019, 39(1), 171–88. [Google Scholar] [CrossRef] [PubMed]
- Arnot, J.A.; Gobas, F.A.P.C. A review of bioconcentration factor (BCF) and bioaccumulation factor (BAF) assessments for organic chemicals in aquatic organisms. Environ. Rev. 2006, 14(4), 257–97. [Google Scholar] [CrossRef]
- Ankley, G.T.; Cook, P.M.; Carlson, A.R.; Call, D.J.; Swenson, J.A.; Corcoran, H.F.; et al. Bioaccumulation of PCBs from sediments by oligochaetes and fishes: comparison of laboratory and field studies. Can. J. Fish. Aquat. Sci. 1992, 49(10), 2080–5. [Google Scholar] [CrossRef]
- Burkhard, L.P. Estimation of biota sediment accumulation factor (BSAF) from paired observations of chemical concentrations in biota and sediment; U.S. Environmental Protection Agency, Office of Research and Development: Duluth, MN, 2009. [Google Scholar]
- U.S. Environmental Protection Agency. Methylmercury (MeHg) (CASRN 22967-92-6): Integrated Risk Information System (IRIS) Chemical Assessment Summary [Internet]. U.S. Environmental Protection Agency: Washington, DC, 2001. Available online: https://iris.epa.gov/.
- Bezerra, M.F.; De Alencar Goyanna, F.A.; Lacerda, L.D. Risk assessment of human Hg exposure through consumption of fishery products in Ceará state, northeastern Brazil. Mar. Pollut. Bull. 2023, 189, 114713. [Google Scholar] [CrossRef] [PubMed]
- United States Environmental Protection Agency. Regional Screening Levels for Chemical Contaminants at Superfund Sites [Internet]; United States Environmental Protection Agency: Washington, D.C., 2026; Available online: https://www.epa.gov/risk/regional-screening-levels-rsls-users-guide#special.
- Dorea, J.; Barbosa, A.; Ferrari, Ír; De Souza, J. Mercury in hair and in fish consumed by Riparian women of the Rio Negro, Amazon, Brazil. Int. J. Environ. Health Res. 2003, 13(3), 239–48. [Google Scholar] [CrossRef] [PubMed]
- Dórea, J.G.; Barbosa, A.C.; Ferrari, Í.; De Souza, J.R. Fish consumption (Hair Mercury) and nutritional status of Amazonian Amer-Indian Children. Am. J. Hum. Biol. 2005, 17(4), 507–14. [Google Scholar] [CrossRef] [PubMed]
- Muniroh, M.; Bakri, S.; Gumay, A.R.; Dewantiningrum, J.; Mulyono, M.; Hardian, H.; et al. The First Exposure Assessment of Mercury Levels in Hair among Pregnant Women and Its Effects on Birth Weight and Length in Semarang, Central Java, Indonesia. IJERPH 2022, 19(17), 10684. [Google Scholar] [CrossRef] [PubMed]
- Muniroh, M.; Nugraheni, A.; Mulyono, M.; Nindita, Y.; Swastawati, F.; Bakri, S.; et al. Estimating daily intake of heavy metals from fish consumption and its association with hemoglobin levels in Indonesian pregnant women. Discov. Appl. Sci. 2026, 8(2), 233. [Google Scholar] [CrossRef]
- Bloom, N.S. On the chemical form of mercury in edible fish and marine invertebrate tissue. Can. J. Fish. Aquat. Sci. 1992, 49, 1010–7. [Google Scholar] [CrossRef]
- Houssard, P.; Lorrain, A.; Tremblay-Boyer, L.; Allain, V.; Graham, B.S.; Menkes, C.E.; et al. Inter-oceanic comparison of mercury in tropical tunas of the Pacific, Atlantic and Indian Oceans. Env. Sci. Technol. 2019, 53, 3517–28. [Google Scholar]
- Ministry of Health of the Republic of Indonesia. Peraturan Menteri Kesehatan Republik Indonesia Nomor 28 Tahun 2019 tentang Angka Kecukupan Gizi yang Dianjurkan untuk Masyarakat Indonesia [Regulation of the Minister of Health of the Republic of Indonesia Number 28 of 2019 concerning Recommended Nutritional Adequacy Rates for the Indonesian Population] [Internet]; Ministry of Health of the Republic of Indonesia: Jakarta, 2019; Available online: https://stunting.go.id/wp-content/uploads/2021/02/Permenkes-No-28-Tahun-2019-Angka-Kecukupan-Gizi-yang-Dianjurkan.pdf.
- Gayatri, M.; Kistiana, S.; Puspitasari, M.D.; Nasution, S.L. Birth intervals and the risk of perinatal mortality in Indonesia: findings from a cross-sectional study. BMJ Open 2026, 16(1), e100978. [Google Scholar] [CrossRef] [PubMed]
- Government of Indonesia. Peraturan Pemerintah Nomor 22 Tahun 2021 tentang Penyelenggaraan Perlindungan dan Pengelolaan Lingkungan Hidup [Government Regulation Number 22 of 2021 on the Implementation of Environmental Protection and Management]; State Secretariat: Jakarta, 2021. [Google Scholar]
- Ministry of the Environment J. Environmental Quality Standards for Water Pollution [Internet]; Ministry of the Environment, Government of Japan: Tokyo, 1971; Available online: https://www.env.go.jp/en/water/wq/wp.pdf.
- Soto Cárdenas, C.; Diéguez, M.D.C.; Queimaliños, C.; Rizzo, A.; Fajon, V.; Kotnik, J.; et al. Mercury in a stream-lake network of Andean Patagonia (Southern Volcanic Zone): Partitioning and interaction with dissolved organic matter. Chemosphere 2018, 197, 262–70. [Google Scholar] [CrossRef] [PubMed]
- Canadian water quality guidelines for the protection of aquatic life: inorganic mercury and methylmercury; The Office: Ottawa, 2003.
- Canadian Council of Ministers of the Environment. Canadian Sediment Quality Guidelines for the Protection of Aquatic Life — Mercury; (Canadian Environmental Quality Guidelines); CCME: Winnipeg, Manitoba, 1999. [Google Scholar]
- MacDonald, D.D.; Ingersoll, C.G.; Berger, T.A. Development and Evaluation of Consensus-Based Sediment Quality Guidelines for Freshwater Ecosystems. Arch. Environ. Contam. Toxicol. 2000, 39, 20–31. [Google Scholar] [CrossRef] [PubMed]
- Elvince, R.; Inoue, T.; Ardianor; Darung, U.; Kawakami, T.; Nagafuchi, O.; et al. Mercury Contamination in Lake Tilap, Central Kalimantan, Indonesia. J. Ecotechnology Res. 2008, 13(4), 291–4. [Google Scholar]
- Codex Alimentarius Commission. Guideline Levels for Methylmercury in Fish. 1991. [Google Scholar]
- Badan Pengawas Obat dan Makanan (BPOM). Regulation of the Indonesian Food and Drug Authority No. 9 of 2022 concerning Requirements for Heavy Metal Contaminants in Processed Food [Peraturan Badan Pengawas Obat dan Makanan Nomor 9 Tahun 2022 tentang Persyaratan Cemaran Logam Berat dalam Pangan Olahan] [Internet]; Badan Pengawas Obat dan Makanan (BPOM): Jakarta, Indonesia, 2022; Available online: https://faolex.fao.org/docs/pdf/ins218180.pdf.
- Barocas, A.; Vega, C.; Alarcon Pardo, A.; Araujo Flores, J.M.; Fernandez, L.; Groenendijk, J.; et al. Local intensity of artisanal gold mining drives mercury accumulation in neotropical oxbow lake fishes. Sci. Total Environ. 2023, 886, 164024. [Google Scholar] [CrossRef] [PubMed]
- Dang, F.; Wang, W.X. Why mercury concentration increases with fish size? Biokinetic explanation. Environ. Pollut. 2012, 163, 192–8. [Google Scholar] [CrossRef] [PubMed]
- Apriliani, A.P.; Arifuddin, D.; Nurmadilla, N.; Ananda, F.; Bima, I.H. Analisis Karakteristik dan Pola Pemberian Mpasi Anak Usia 6-24 Bulan di Puskesmas Sorowako. 2023. [Google Scholar] [CrossRef]
- Elvince, R.; Evnaweri, E. Kandungan Merkuri Pada Ikan Air Tawar Dan Resiko Bagi Kesehatan Masyarakat Di Kota Palangka Raya Kalimantan Tengah. JTLLB 2024, 12(1), 047–52. [Google Scholar] [CrossRef]
- Thornton, S.A.; Setiana, E.; Yoyo, K.; Dudin, Yulintine; Harrison, M.E.; et al. Towards biocultural approaches to peatland conservation: The case for fish and livelihoods in Indonesia. Environ. Sci. Policy 2020, 114, 341–51. [Google Scholar] [CrossRef]
- Candramila, W.; Erasmawanti, D.; Sihombing, D.R.; Hosniah, H.; Gola, L.; Magdalena, M. PERILAKU MAKAN MASYARAKAT PEDESAAN DI KALIMANTAN BARAT. Al-Kauniyah J. Biol. 2018, 11(2), 190–207. [Google Scholar] [CrossRef]
- Wijaya, S. Indonesian food culture mapping: a starter contribution to promote Indonesian culinary tourism. Asian J. Sustain. Cult. Tour. 2019. [Google Scholar] [CrossRef]
- U.S. Food and Drug Administration; U.S. Environmental Protection Agency. Advice about Eating Fish: For Women Who Are or Might Become Pregnant, Breastfeeding Mothers, and Young Children [Internet]. U.S. Food and Drug Administration / U.S. Environmental Protection Agency: Washington, DC, 2021. Available online: https://www.fda.gov/food/consumers/questions-answers-fdaepa-advice-about-eating-fish-those-who-might-become-or-are-pregnant-or.
Figure 1.
Sampling station locations at Lake Hanjalutung and the Rungan River, Central Kalimantan, Indonesia.
Figure 1.
Sampling station locations at Lake Hanjalutung and the Rungan River, Central Kalimantan, Indonesia.
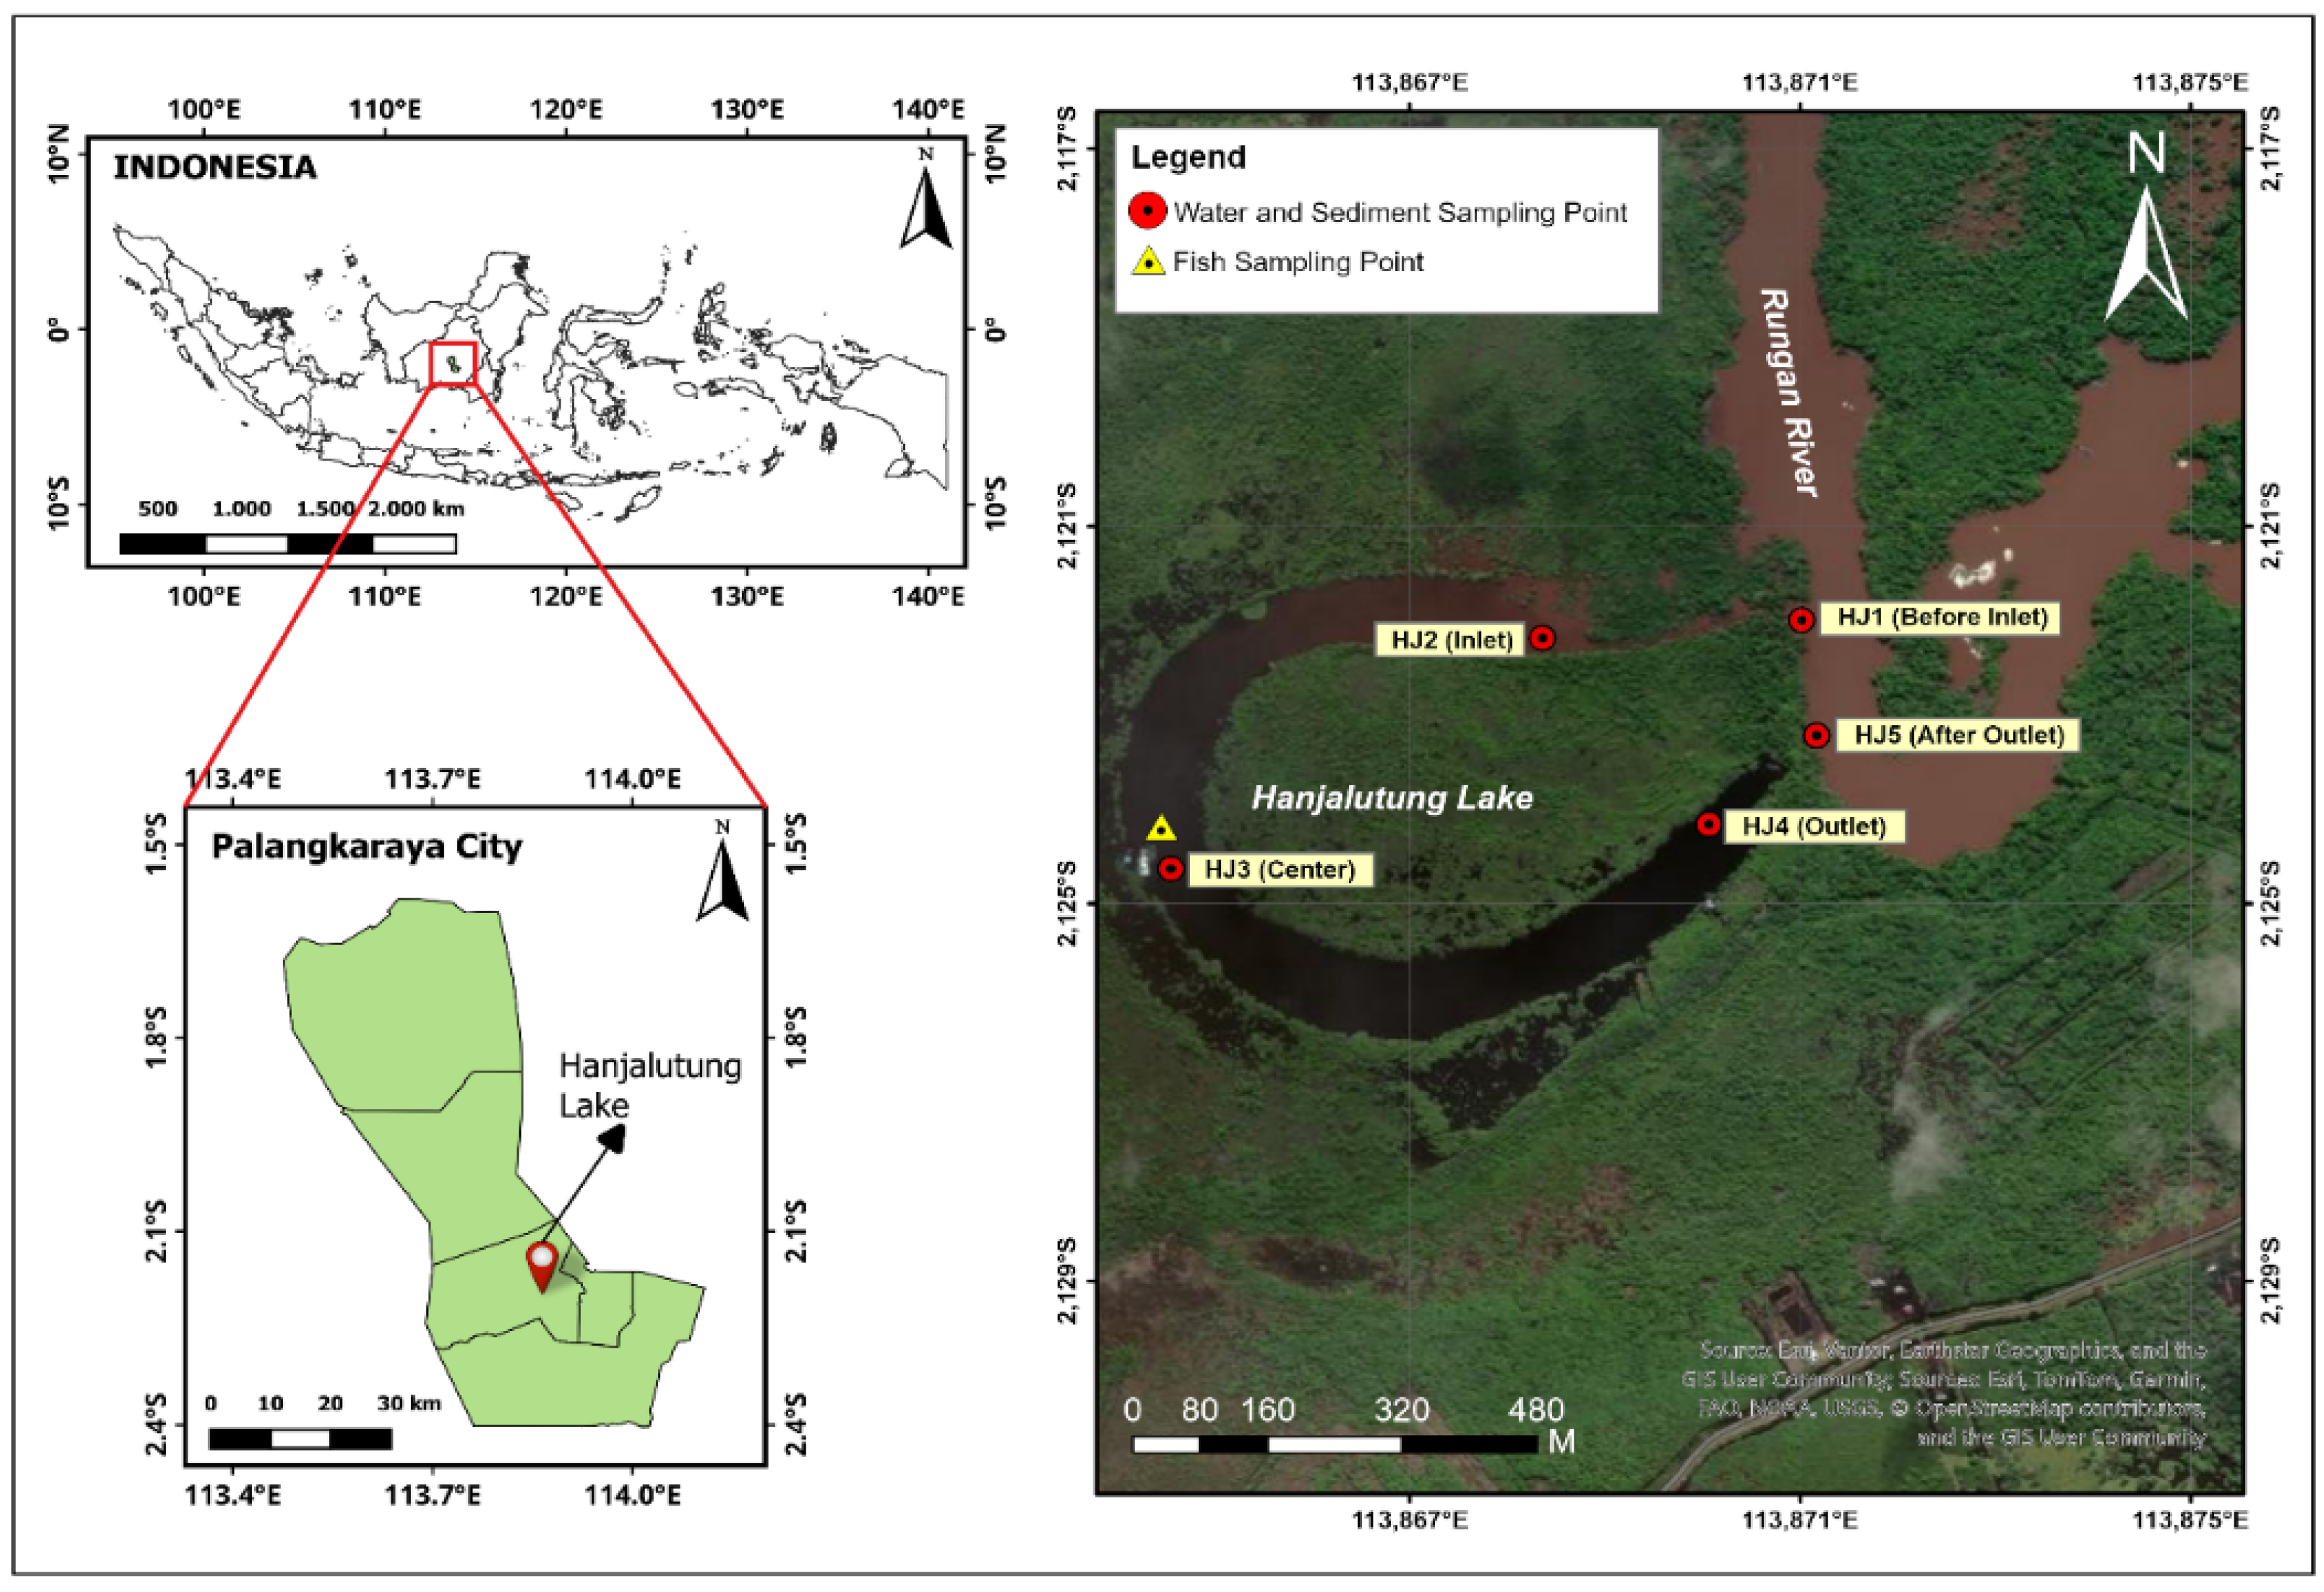
Figure 2.
Mercury concentrations across stations: (a) Bulk Water; (b) Bottom Sediment.
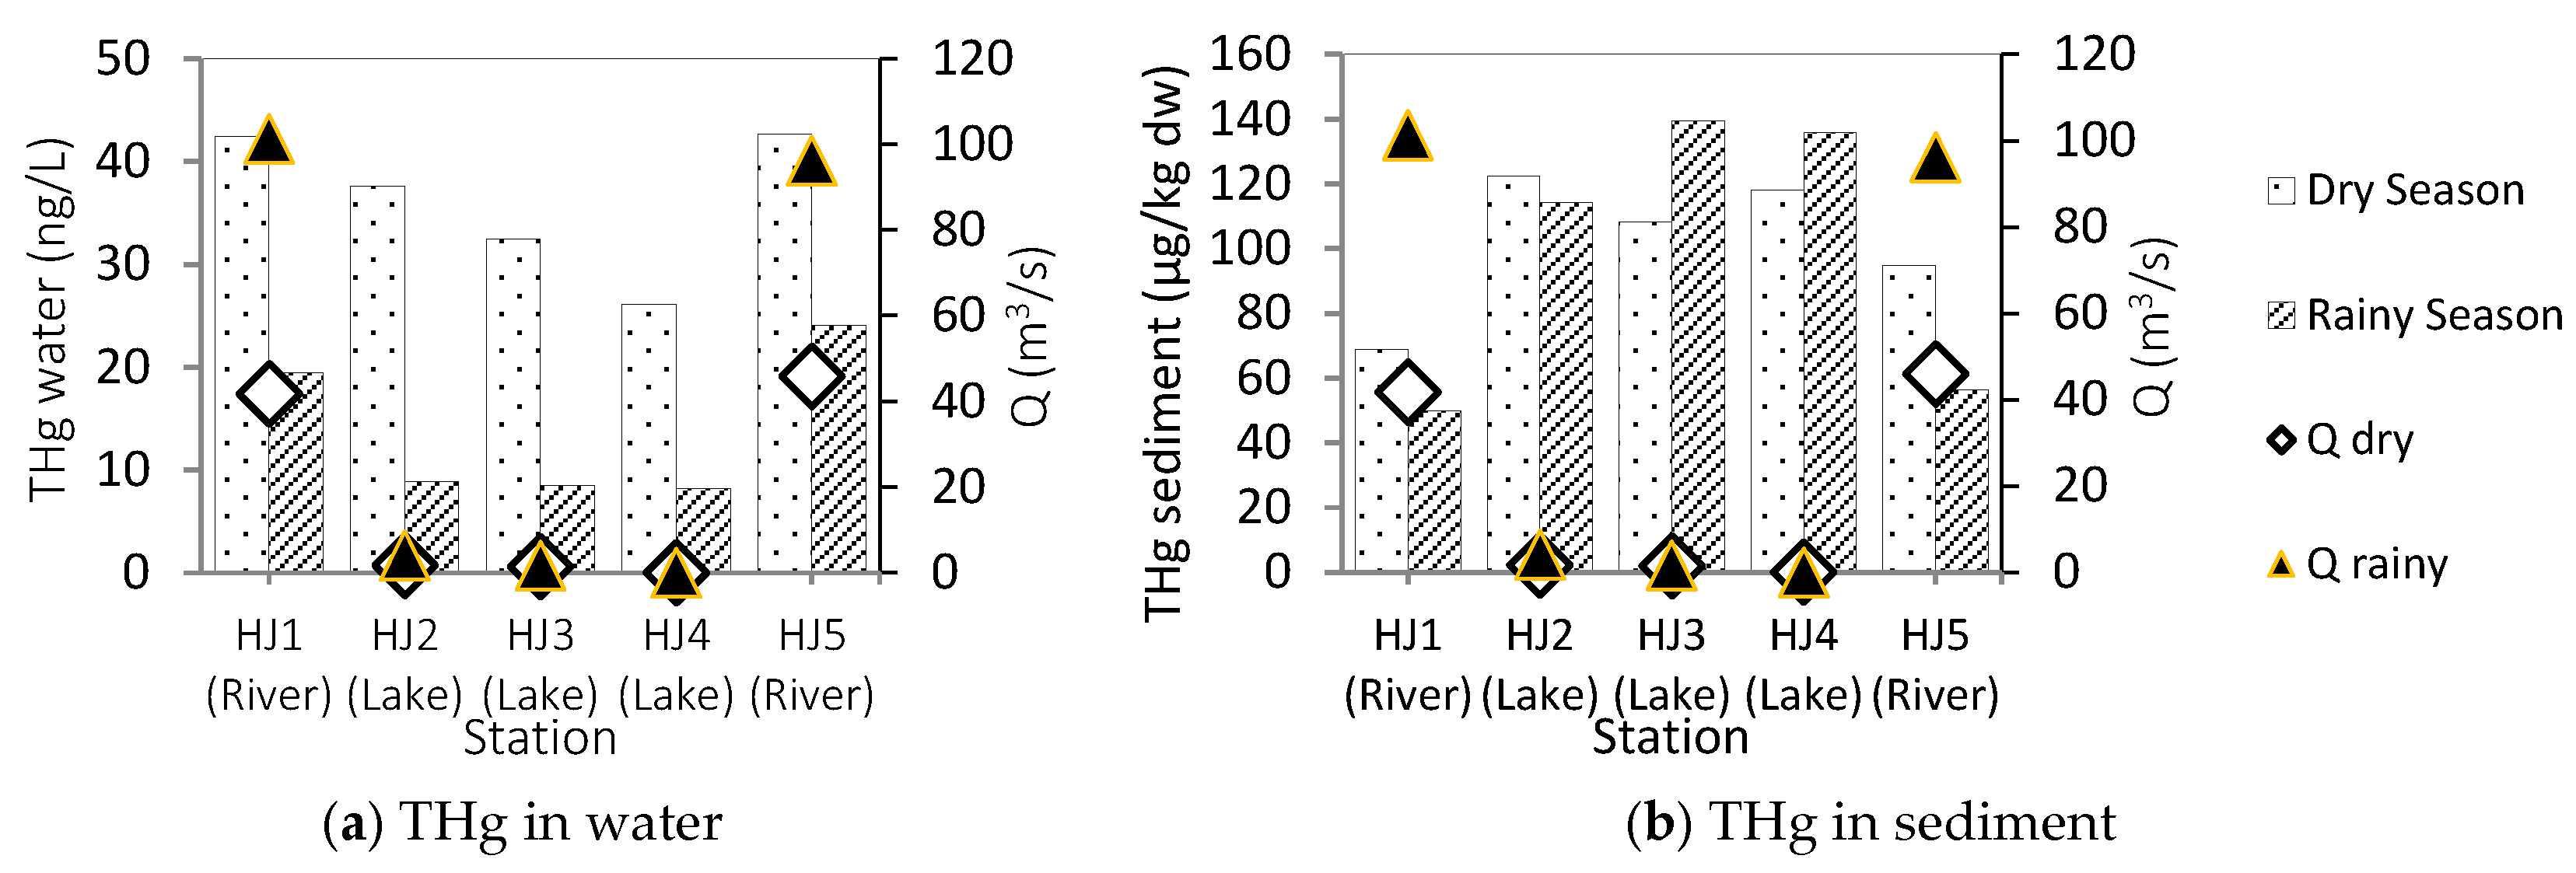
Figure 3.
The geoaccumulation index across stations.
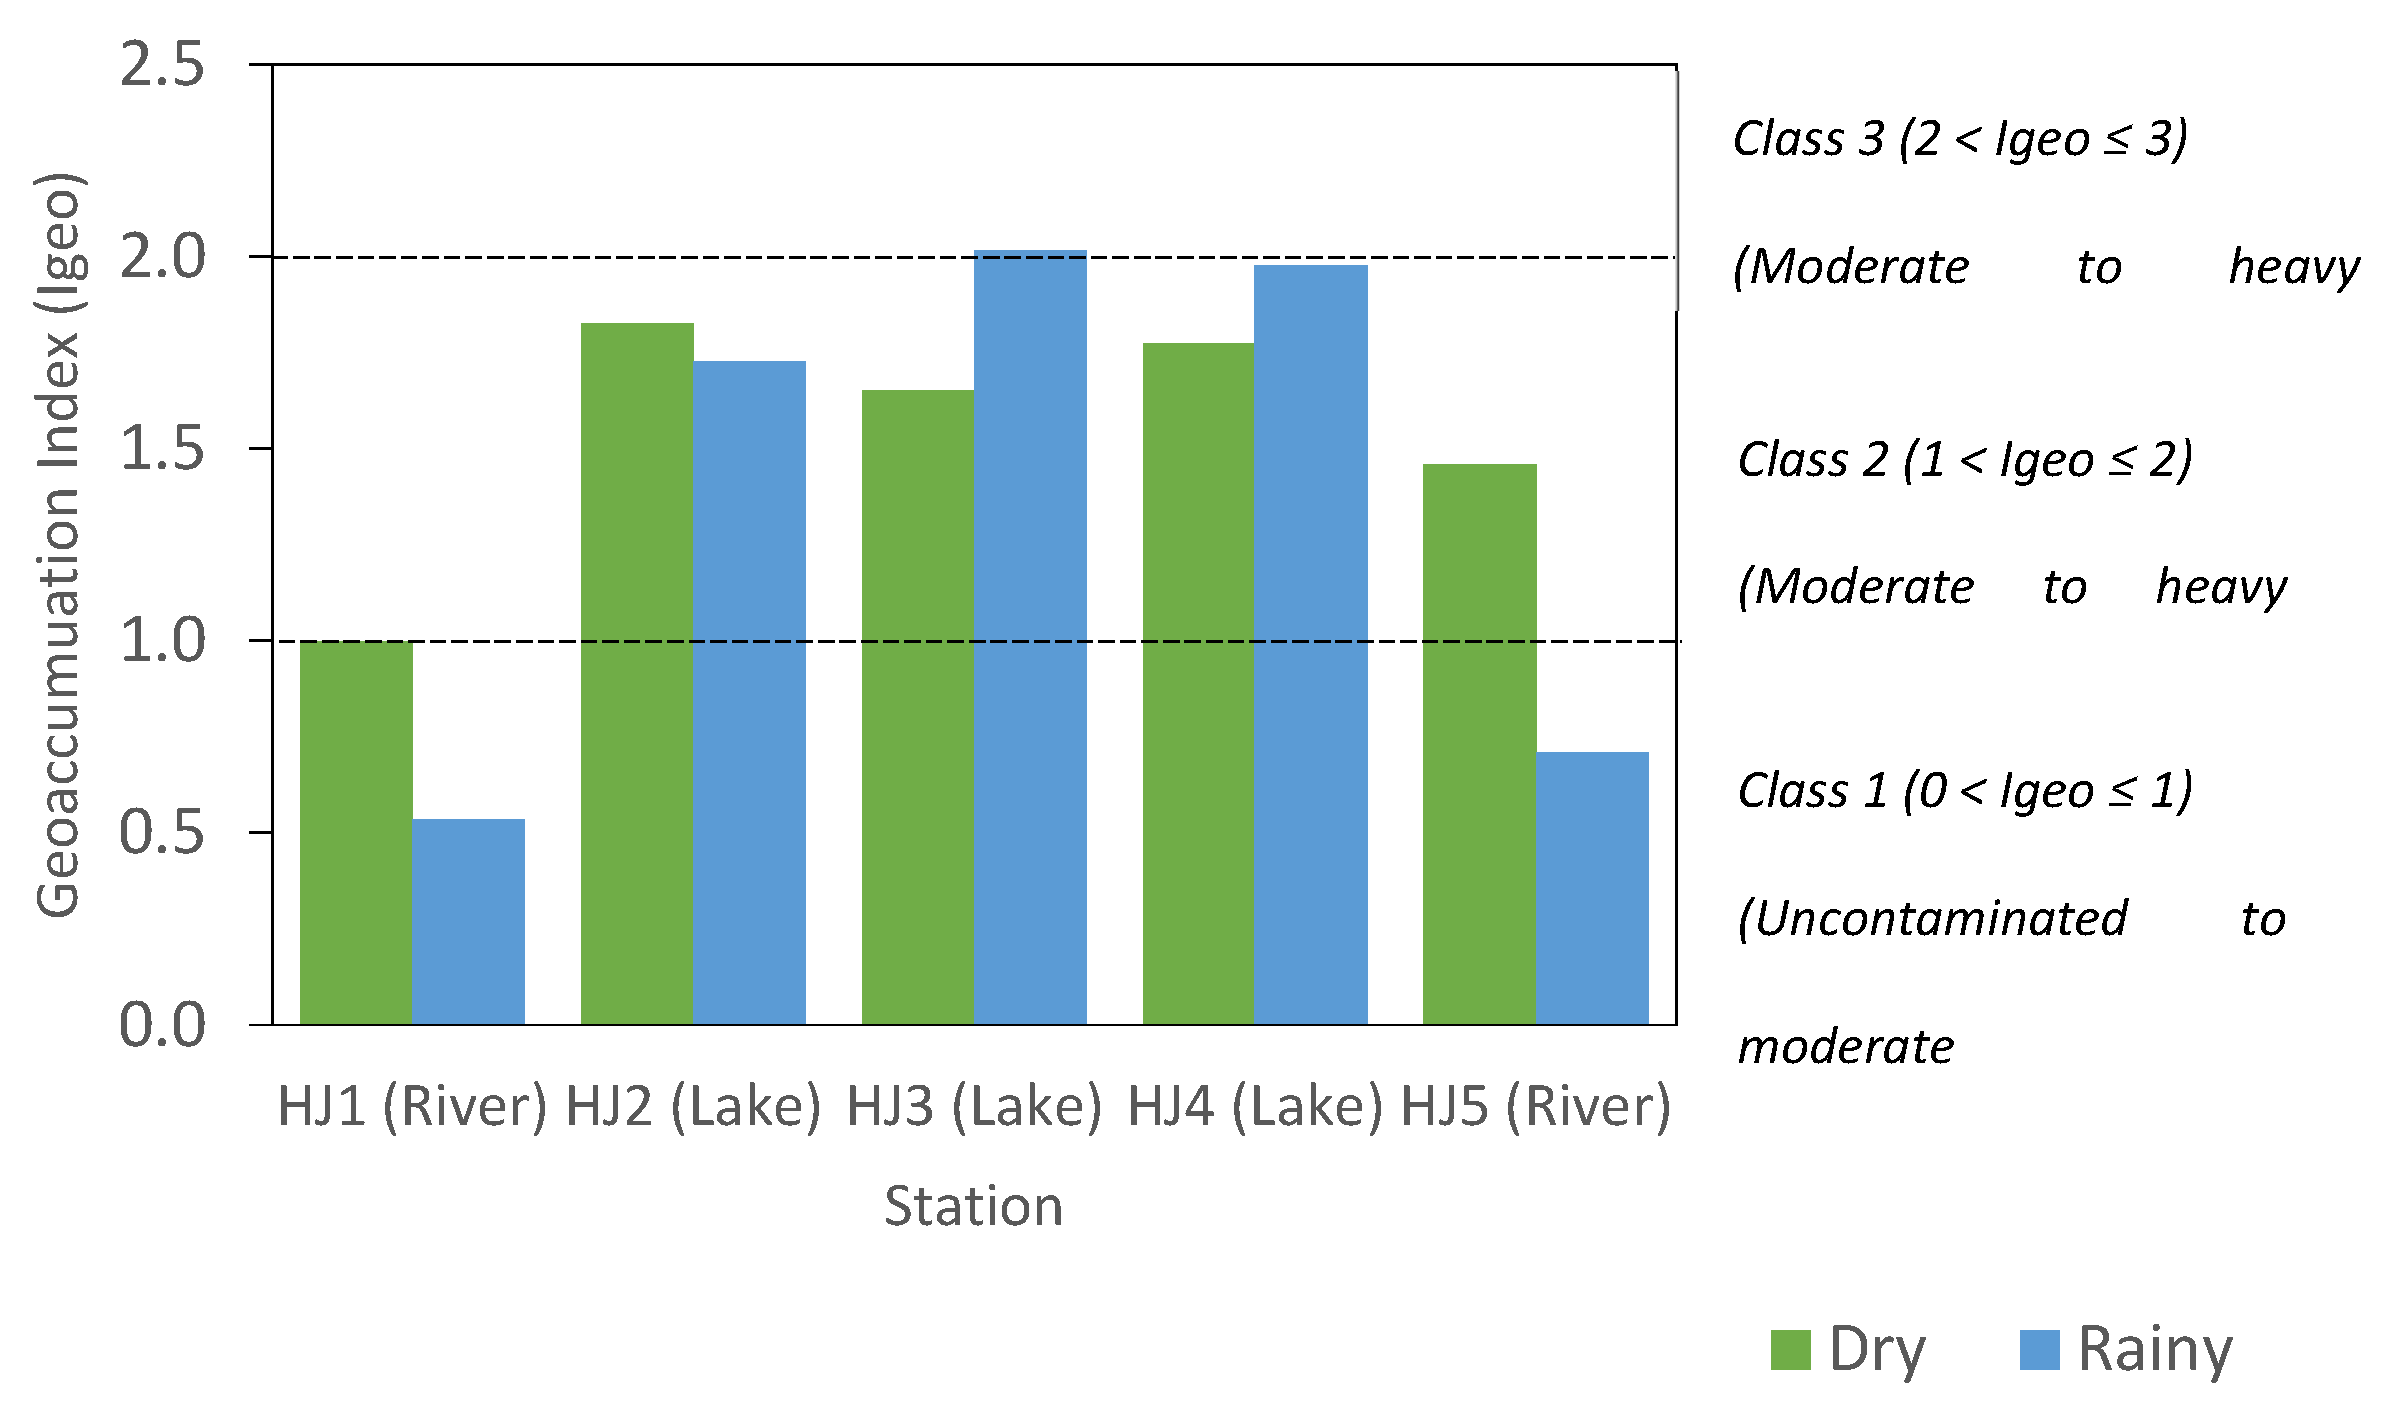
Figure 4.
Relationship between individual fish length and mercury bioaccumulation in fish from Lake Hanjalutung (n = 13): (a) bioaccumulation factor (BAF); (b) biota-sediment.
Figure 4.
Relationship between individual fish length and mercury bioaccumulation in fish from Lake Hanjalutung (n = 13): (a) bioaccumulation factor (BAF); (b) biota-sediment.
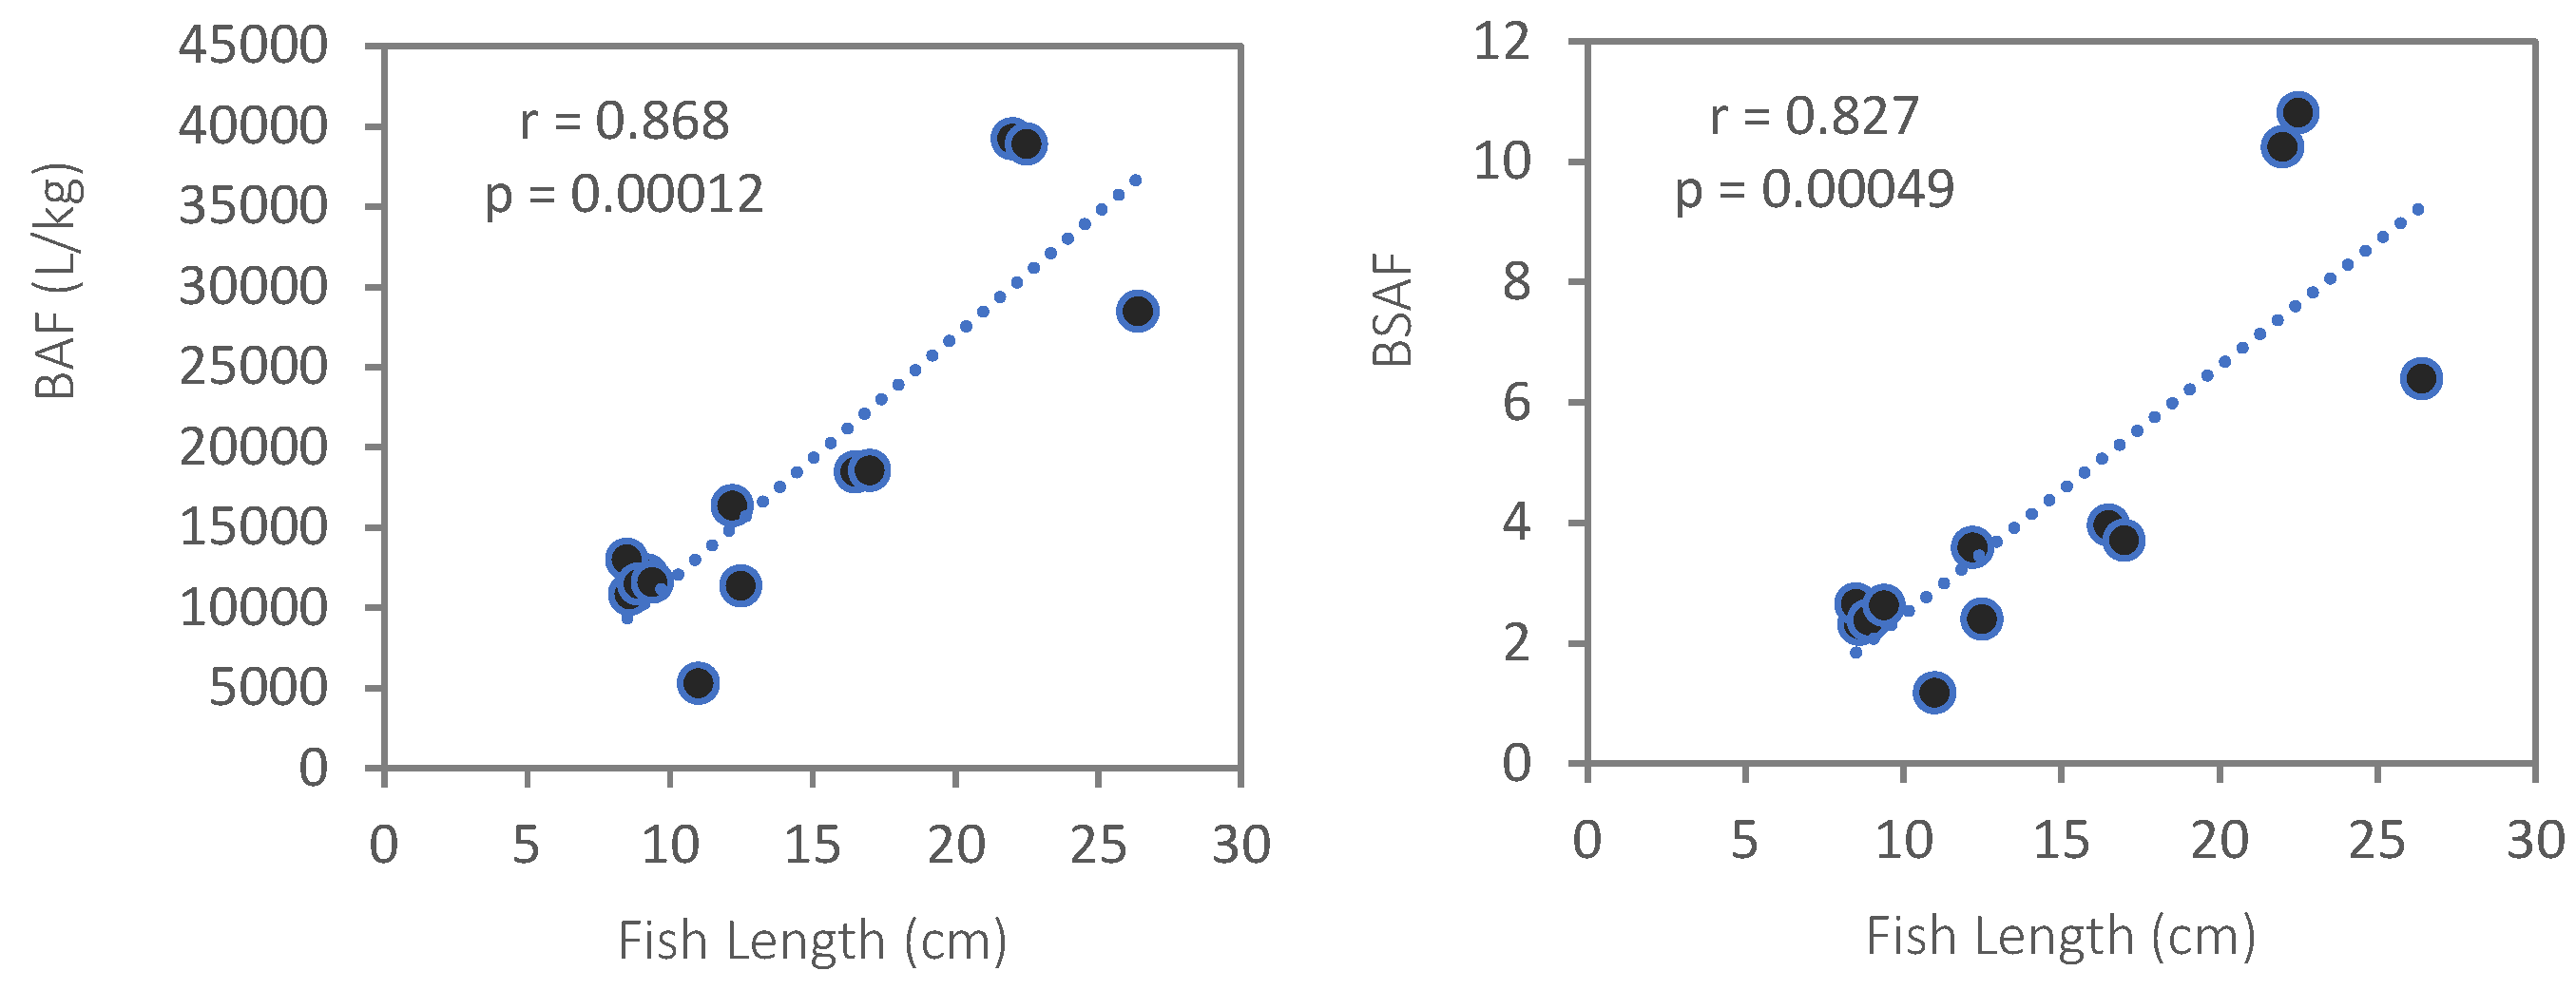
Figure 5.
Maximum Allowable Weekly Intake (MAWI) of Selected Fish Species Across Receptor Groups.
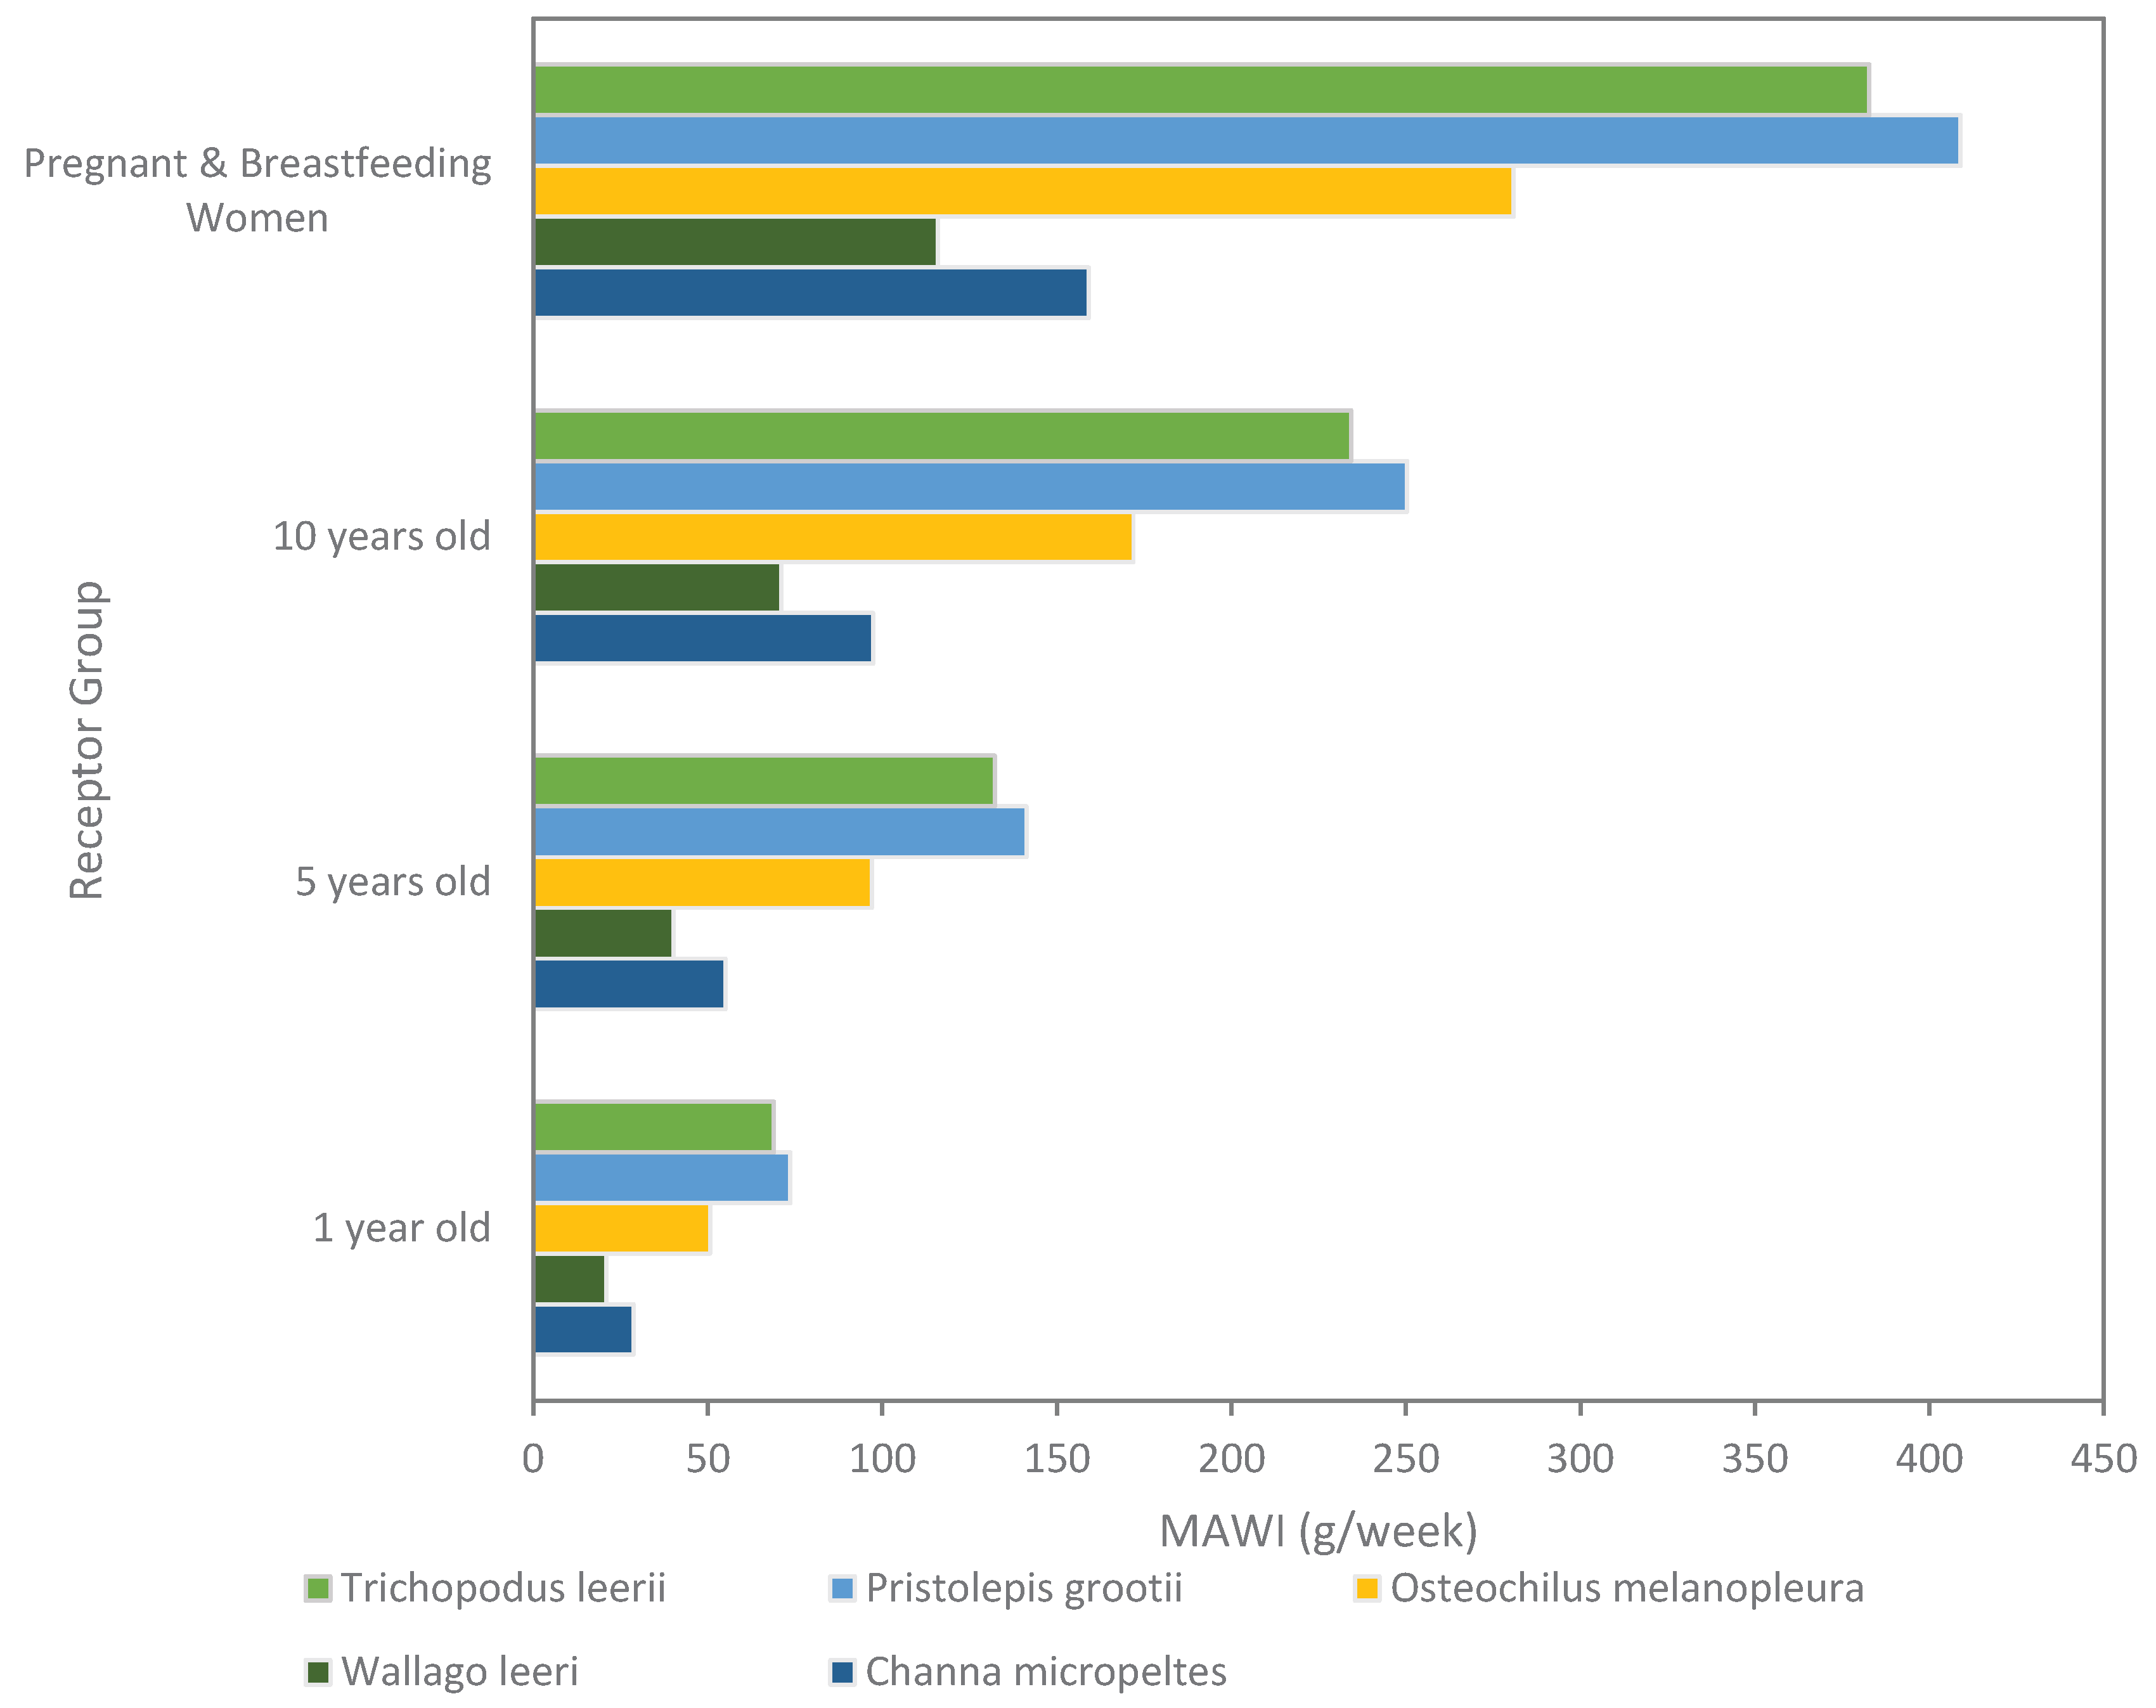

Table 1.
Geographic coordinates and setting of the five sampling stations at Lake Hanjalutung and the adjacent Rungan River, Palangka Raya, Central Kalimantan.
Table 1.
Geographic coordinates and setting of the five sampling stations at Lake Hanjalutung and the adjacent Rungan River, Palangka Raya, Central Kalimantan.
| Point | Description | Setting | Latitude | Longitude |
| HJ1 | Rungan River, upstream | River | 2°07′17.2″ S | 113°52′15.2″ E |
| HJ2 | Lake inlet (northern) | Lake | 2°07′19.0″ S | 113°52′05.2″ E |
| HJ3 | Lake center | Lake | 2°07′28.7″ S | 113°51′49.9″ E |
| HJ4 | Lake outlet (southern) | Lake | 2°07′26.9″ S | 113°52′11.5″ E |
| HJ5 | Rungan River, downstream | River | 2°07′24.7″ S | 113°52′15.9″ E |
Table 2.
THg concentrations, length, and weight (mean±SD) by fish species from Lake Hanjalutung.
| Species | Trichopodus leerii | Pristolepis grootii | Osteochilus melanopleura | Wallago leeri | Channa micropeltes |
 |
 |
 |
 |
 |
|
| n | 4 | 3 | 3 | 2 | 1 |
| Length (cm) | 8.80 ± 0.32 | 10.87 ± 1.40 | 15.33 ± 2.47 | 22.25 ± 0.35 | 26.40 |
| Weight (g) | 7.87 ± 1.36 | 28.96 ± 12.77 | 42.41 ± 19.46 | 35.15 ± 0.68 | 174.65 |
| THg ww (mg/kg) | 0.10 ± 0.01 | 0.09 ± 0.05 | 0.14 ± 0.04 | 0.33 ± 0.00 | 0.24 |
| THg dw (mg/kg) | 0.34 ± 0.02 | 0.34 ± 0.17 | 0.47 ± 0.12 | 1.47 ± 0.06 | 0.89 |
Table 3.
BAF and BSAF results (Mean + SD) by species in Lake Hanjalutung.
| Species | n | BAF (L/kg) Mean ± SD | BSAF (dw/dw) Mean ± SD |
| Trichopodus leerii | 4 | 2.48 ± 0.17 | |
| Pristolepis grootii | 3 | 2.47 ± 1.21 | |
| Osteochilus melanopleura | 3 | 3.37 ± 0.85 | |
| Wallago leeri | 2 | 10.50 ± 0.42 | |
| Channa micropeltes | 1 | 6.40 |
Disclaimer/Publisher’s Note: The statements, opinions and data contained in all publications are solely those of the individual author(s) and contributor(s) and not of MDPI and/or the editor(s). MDPI and/or the editor(s) disclaim responsibility for any injury to people or property resulting from any ideas, methods, instructions or products referred to in the content. |
© 2026 by the authors. Licensee MDPI, Basel, Switzerland. This article is an open access article distributed under the terms and conditions of the Creative Commons Attribution (CC BY) license (http://creativecommons.org/licenses/by/4.0/).
Copyright: This open access article is published under a Creative Commons CC BY 4.0 license, which permit the free download, distribution, and reuse, provided that the author and preprint are cited in any reuse.