

Submitted:
08 August 2026
Posted:
10 August 2026
You are already at the latest version
Abstract
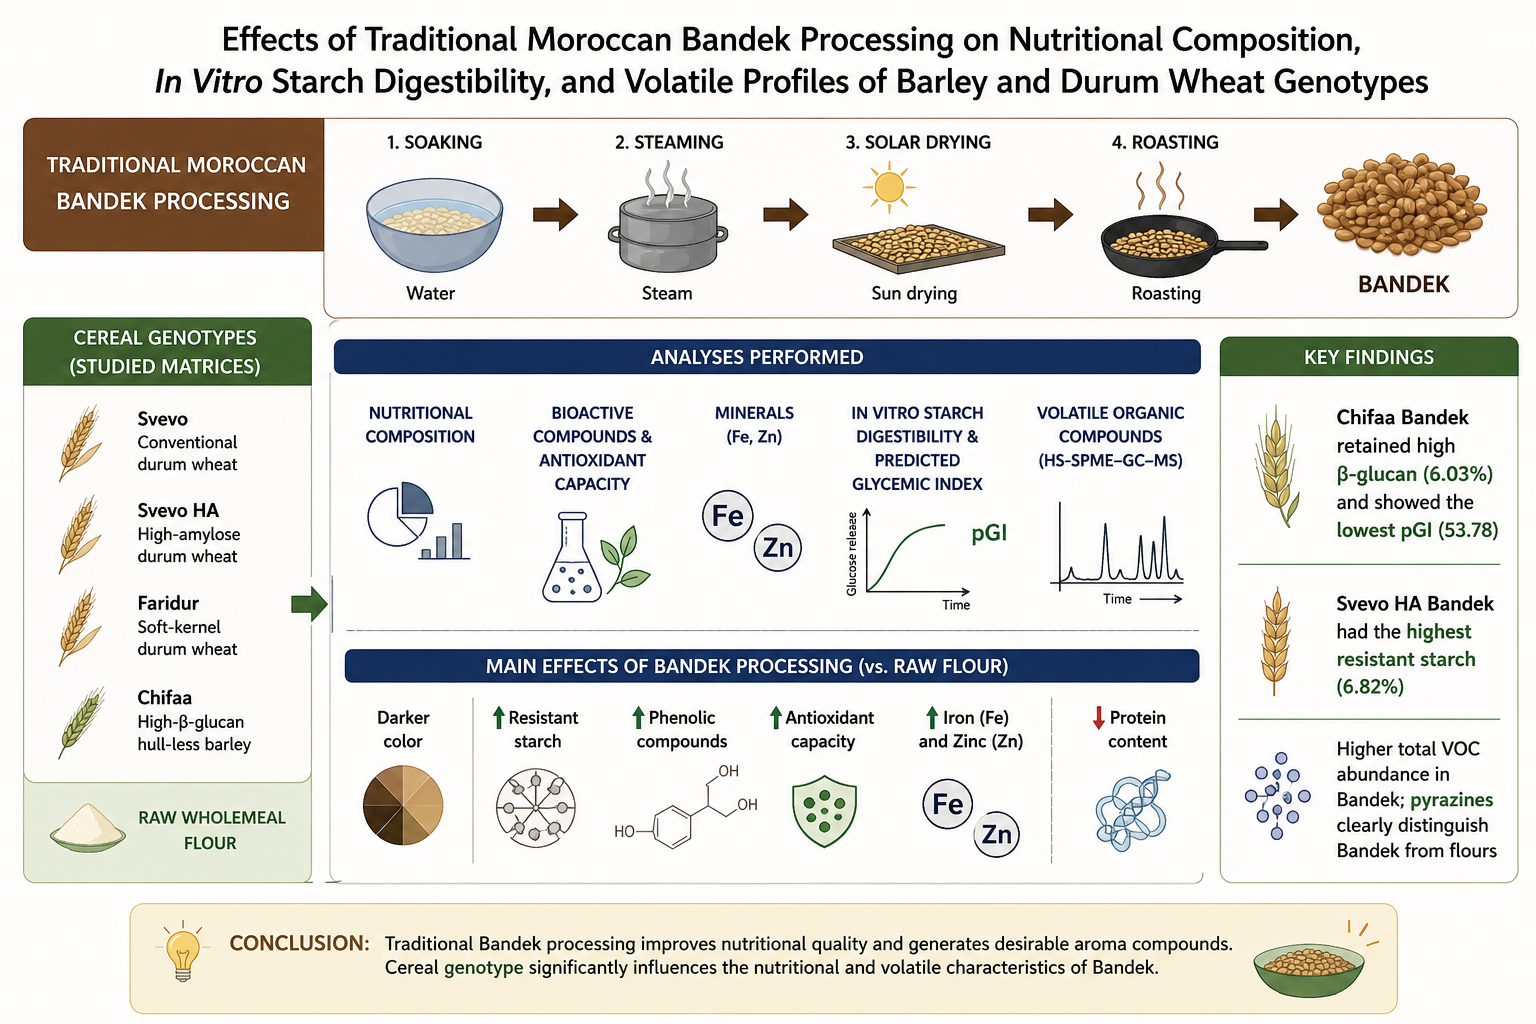
Traditional processing can modify the nutritional and volatile characteristics of cere-al-based foods. This study evaluated Moroccan Bandek production, comprising soaking, steaming, solar drying, and roasting, in four cereal matrices: conventional durum wheat (Svevo), high-amylose durum wheat (Svevo HA), soft-kernel durum wheat (Faridur), and high-β-glucan hull-less barley (Chifaa). Raw wholemeal flours and corresponding Bandek products were analyzed for color, protein, β-glucan, resistant starch, iron, zinc, phenolic compounds, antioxidant capacity, and volatile organic compounds (VOCs). In vitro starch hydrolysis and predicted glycemic index (pGI) were determined in Bandek products. Compared with the corresponding flours, Bandek products were darker and showed higher resistant starch, extractable phenolic compounds, antioxidant capacity, iron, and zinc values, whereas protein content was lower. Chifaa Bandek retained 6.03% β-glucan and had the lowest pGI (53.78), while Svevo HA contained the most resistant starch (6.82%). Following standardized sample preparation, total semi-quantitative VOC abundance was higher in Bandek than in flour, with pyrazines providing the clearest distinction between the matrices. Multivariate analyses separated Bandek products from raw flours and revealed additional genotype-dependent variation. These findings in-dicate that the nutritional and volatile characteristics of Bandek depend on the interaction between the composition of the starting cereal matrix and the traditional processing, supporting further evaluation of high-β-glucan barley and high-amylose durum wheat for traditional cereal foods.
Keywords:
traditional cereal processing
; β-glucan
; resistant starch
; glycemic index
; volatile organic compounds
1. Introduction
Traditional cereal processing methods constitute complex transformation systems that significantly influence the nutritional and functional properties of cereal-based foods. Techniques such as soaking, steaming, fermentation, roasting, and malting have long been used across African and Middle Eastern food systems not only to improve preservation, edibility, and sensory quality, but also to induce structural and biochemical changes that affect nutrient bioavailability, starch digestibility, and the technological performance of cereal flours [1]. In traditional African contexts, cereal pre-treatments, including steeping, parboiling, tempering, and roasting, play a central role in shaping product structure and sensory acceptability, although they are often not standardized [2]. Several of these treatments can also reduce antinutritional factors, particularly phytates, thereby improving the bioavailability of essential minerals such as iron and zinc [3]. Fermentation and malting, for instance, activate endogenous phytases, leading to phytic acid degradation and enhanced functional properties. Thermal processing represents a key driver of biochemical transformations in cereal matrices. Operations such as steaming, drying, and roasting induce molecular changes that affect phenolic composition, antioxidant capacity, volatile profile, starch structure, and glycemic behavior [4]. In cereals, phenolic compounds are predominantly present as bound forms associated with cell wall components, limiting their extractability in raw grains [5,6]. Thermal treatments can disrupt these structures, promote the release of bound phenolics and increase antioxidant activity [4,7]. Concurrently, hydrothermal processing and roasting modify starch organization, influencing the balance between rapidly digestible, slowly digestible, and resistant starch fractions, with implications for postprandial glycemic response [8,9]. Roasting further promotes Maillard reactions, contributing to color development, flavor formation, and potentially enhanced antioxidant properties.
Taken together, these effects demonstrate the functional significance of traditional thermal processing, which may reproduce some of the structural and biochemical transformations achieved through modern thermomechanical technologies such as extrusion [10,11]. Importantly, the magnitude of these transformations is expected to depend not only on processing conditions but also on the intrinsic compositional characteristics of the cereal genotype [12].
Within this context, roasted cereal flours occupy a prominent place in Moroccan culinary heritage. Traditional products such as sellou (sfouf) and zemita are emblematic preparations derived from roasted barley or wheat flour, often combined with sesame seeds, nuts, sugar, and fat [13,14]. These foods are deeply embedded in social practices, particularly during religious and festive occasions, and reflect longstanding traditions of cereal transformation [15]. Beyond their nutritional role, such preparations embody intergenerational knowledge transfer, gendered culinary practices, and collective food processing rituals that reinforce cultural identity [16]. However, ongoing urbanization has led to simplification of these multi-step procedures, which are increasingly replaced by the direct roasting of refined flours. This shift underscores the need for scientific documentation and characterization of artisanal cereal-processing systems, both to advance food science and to preserve intangible food heritage.
Although individual processing techniques and industrial treatments have been extensively investigated, traditional multi-step artisanal systems remain comparatively understudied. In these systems, sequential operations may produce cumulative or interactive effects that cannot be inferred from the evaluation of each processing step in isolation. This knowledge gap is particularly evident for North African cereal-based foods. Moreover, few studies have compared cereal genotypes with contrasting compositions under identical artisanal processing conditions, limiting current understanding of genotype × processing interactions.
Recent advances in cereal breeding have enabled the development of wheat and barley genotypes specifically enriched in health-promoting components, including resistant starch and β-glucans [17,18]. Although these traits offer promising opportunities for developing foods with improved nutritional profiles, their retention and functionality may be strongly affected by processing. It is therefore necessary to determine whether traditional artisanal treatments preserve, enhance, or diminish these beneficial characteristics and how the response varies according to the cereal matrix.
Against this background, the present study investigated Bandek, a traditional Moroccan roasted cereal flour obtained through sequential steaming, solar drying, and direct-fire roasting and used in the preparation of products such as sellou and zemita. Despite its cultural and nutritional importance, Bandek remains poorly documented in the scientific literature and has not yet been comprehensively characterized. The study evaluated the effects of the traditional process on the nutritional, functional, volatilomics, and glycemic properties of four cereal matrices with contrasting compositions: a high-β-glucan barley (cv. Chifaa), a high-amylose durum wheat genotype (high-amylose Svevo), a soft kernel wheat cultivar (cv. Faridur), and a conventional durum wheat cultivar (cv. Svevo). The Bandek samples were produced by a women’s cooperative in the Souss region of Morocco, thereby preserving the authenticity of the artisanal processing system.
By integrating nutritionally improved cereal germplasm with a culturally embedded processing practice, this work provides new insights into the effects of both genotype and traditional processing and their interaction on the quality of cereal-based foods. At the same time, it contributes to the scientific valorization of Moroccan food heritage and supports the development of sustainable functional foods rooted in local knowledge and practices.
2. Materials and Methods
2.1. Plant Material
Three durum wheat (Triticum turgidum ssp. durum) genotypes: i) cv. Svevo (with normal amylose content), ii) high amylose Svevo (Svevo HA), iii) soft kernel durum cv. Faridur, and the high-β-glucan hull-less barley (Hordeum vulgare L.) cv. Chifaa, were used in this study as raw materials for Bandek production. Svevo is a widely cultivated Italian durum wheat cultivar commonly used as a reference genotype in cereal quality and functional studies because of its stable agronomic performance and technological aptitude [19]. Faridur is the first Italian soft kernel durum wheat variety developed through the introgression of puroindoline genes into durum wheat, resulting in reduced kernel hardness and modified milling properties compared with conventional durum wheat cultivars [20]. Svevo HA is a high-amylose durum wheat genotype characterized by increased resistant starch accumulation and altered starch composition due to modifications in starch biosynthesis pathways, previously described for its enhanced nutritional and functional properties [17,21].
Chifaa is a hull-less barley variety characterized by high β-glucan content and recognized for its potential health-promoting properties, particularly in relation to glycemic response modulation and dietary fiber enrichment [18]. The inclusion of these cereal genotypes allowed the evaluation of the interaction between genotype composition and technological processing on the nutritional and functional quality of Bandek.
2.2. Bandek Production
Bandek was produced in the Tata region of southern Morocco according to the traditional procedure used by local processors. Mature cereal grains were processed through sequential cleaning, soaking, steaming, solar drying, roasting, cooling, and milling. Each sample (approximately 1 kg) was processed separately as a single batch to prevent cross-contamination. All samples were processed during the same production period and under comparable conditions. Grains were manually cleaned to remove dust, stones, broken kernels, chaff, and other foreign materials. The cleaned grains were immersed in potable water at a grain-to-water ratio of approximately 1:3 (w/v) and soaked overnight for 8–12 h. After soaking, excess water was drained before steaming. The hydrated grains were steamed for 45–60 min using traditional steaming equipment. Steaming was continued until the kernels were fully hydrated and softened while retaining their structural integrity. After steaming, the grains were spread in uniform layers approximately 1–2 cm thick and solar-dried under the environmental conditions of the Tata region, characterized by intense solar radiation, low relative humidity, and high daytime temperatures. During drying, ambient temperatures ranged from 28 to 36 °C. The grains were covered overnight to limit moisture reabsorption while maintaining air circulation, and solar exposure was resumed during the daytime. Drying continued until a grain moisture content of approximately 10–12% was reached. Each dried grain sample was roasted separately in a traditional metal pan heated over a wood fire. The grains were continuously stirred to promote uniform heat transfer and prevent scorching. Depending on fire intensity, roasting lasted approximately 35–50 min and was terminated when the grains developed the golden-brown color, toasted aroma, and crisp texture characteristic of traditional Bandek. After roasting, the grains were spread in a thin layer and allowed to cool naturally to ambient temperature before milling. The roasted grains were milled using a small-scale industrial six-roller mill powered by a 27-hp motor. The resulting flour was screened using a manual plansifter solely to remove coarse particles that had not been sufficiently reduced during milling. No fractionation or bran separation was performed. The final wholemeal roasted flour, with an extraction rate of approximately 100% and a mean particle size of approximately 500 μm, was immediately transferred to airtight, food-grade containers and stored at room temperature under cool and dry conditions until physicochemical, nutritional, functional, and volatile-compound analyses were performed. All processing steps were conducted by experienced local processors following artisanal practices traditionally used in the Tata oasis.
2.3. Physicochemical, Nutritional, and Mineral Analyses
Physicochemical, nutritional, and mineral analyses were carried out on wholemeal flours produced from untreated grains of the three durum wheat genotypes (Svevo, Svevo HA, and Faridur) and the hull-less barley cultivar Chifaa, together with the corresponding Bandek products obtained from the same cereal genotypes, as described below.
The total nitrogen content was determined according to AACC Method 46-10.01 [22], and protein content was calculated using a conversion factor of 6.25 (protein = N × 6.25).
The β-glucan content was determined enzymatically using the Megazyme β-Glucan Assay Kit (Megazyme International Ireland Ltd., Wicklow, Ireland), following the manufacturer’s instructions.
Resistant starch (RS) content was quantified according to AOAC Method 2002.02 [23] and AACCI Method 32-40.01 [22] using a Resistant Starch Assay Kit coupled with a glucose assay kit (Megazyme International, Wicklow, Ireland).
Color parameters were evaluated in the CIELAB color space using a Konica Minolta CR-400 colorimeter (Konica Minolta, Tokyo, Japan). The color coordinates recorded were L* (lightness), a* (redness/greenness), and b* (yellowness/blueness). In addition, the Browning Index (BI), used as an indicator of browning intensity induced by thermal processing, was calculated according to the following equations:
where:
Mineral composition, specifically iron (Fe) and zinc (Zn) contents, was determined by Inductively Coupled Plasma Optical Emission Spectroscopy (ICP-OES), following the procedure described by Palombieri et al. [24]. Results were expressed as ppm.
2.4. Determination of Phenolic Contents and Antioxidant Capacities
Phenolic compounds (free and bound) of the flour and Bandek samples were extracted according to Shamanin et al. [25]. The concentrations of free and bound phenolic compounds were determined using the Folin–Ciocalteu method [26]. Results were expressed as mg of gallic acid equivalents (GAE) per 100 g of dry weight (dw). The total phenolic content (TPC) was calculated as the sum of free and bound phenolics. Antioxidant activities were evaluated using ABTS, DPPH, and FRAP assays according to the methods of Re et al. [27], Singh et al. [28], and [29], respectively. Results were expressed as mg TE/100 g dw.
2.5. In Vitro Starch Hydrolysis and Predicted Glycemic Index Determination
In vitro starch hydrolysis index (HI) and glycemic index (GI) values of Bandek samples were determined using the Glucose Assay Kit (Megazyme International, Wicklow, Ireland), according to the methods described by Goñi et al. [30] and Tekin et al. [31]. The predicted glycemic index was calculated using the equation proposed by Goñi et al. [30]:
2.6. Characterization of Volatile Organic Compounds (VOCs)
The extraction of volatile organic compounds was carried out by using an optimized head space solid phase micro-extraction (HS-SPME) method. Before proceeding with the extraction, the samples (flour and the respective Bandek) were subjected to the cooking process according to the instructions provided by the partners from Morocco. In detail, sample (50 g) was combined with 50 g of distilled water and left to hydrate for 2-3 min. The mixture was then microwaved at maximum power for 1 min, stirred, and supplemented with 10-20 mL of water if required. A second microwave heating cycle (1 min, maximum power) was subsequently applied. The prepared product was then subjected to analytical evaluation. In order to generate the sample headspace, sample (1 g) was placed in 20 ml SPME glass vials (Chrom4, Germany) containing 1 gr of NaCl and 7 ml of a 20% (w/v) NaCl solution. 2-Octanol (5 mL, 30 ppm Sigma-Aldrich) was supplemented as an internal standard. To equilibrate the system, vials were incubated for 15 min at 60°C to release free volatiles into the headspace. A SPME fiber, assembly 50/30μm, divinylbenzene/carboxen/polydimethylsiloxane (Supelco, USA) was inserted into the vial’s headspace for 50 min at 60°C for volatile extraction [32]. The fiber was then desorbed for 10 min at 250°C within the inlet of the 8890 GC (Agilent, USA) equipped with an HP-INNOWAX capillary column (60m × 0.25mm, 0.25μm film thickness), coupled to a 5977C MS detector (both Agilent, USA). Helium was the carrier gas at a constant rate of 1 mL min−1. The analyses were performed with programmed temperature: initial temperature 40 °C is maintained for 2 min, then raised from 40 to 200 °C at 4 °C/min, and the final temperature being maintained for 10 min. The volatile organic compounds were identified by comparing the experimental mass spectra with those in the NIST/EPA/NIH Mass Spectral Database (National Institute of Standards and Technology, Version 2.4, USA, 2020), using an MS match factor of at least 80%. The identification was also verified by comparing their linear retention indices (LRI), as determined in relation to the retention times of the C5–C29 n-alkane series, with the values reported in the literature [33,34]. The concentration of each volatile compound was calculated using the internal standard method [35,36]. The resulting semi-quantitative concentration data (in ng/g sample) for all identified VOCs were used for all subsequent statistical analysis. All analyses were performed in duplicate. During GC–MS analysis, a quality control (QC) sample was injected after every 10 samples to monitor instrument stability, repeatability, and analytical performance.
2.7. Statistical Analysis
Physicochemical, nutritional, and mineral analyses were conducted in triplicate, and results were expressed as mean ± standard deviation. Statistical analyses were performed using SPSS Statistics software (IBM SPSS Statistics, version 22.0, USA). Differences among samples were evaluated by one-way analysis of variance (ANOVA) followed by Tukey’s post hoc test.
Characterization of Volatile Organic Compounds experiments were conducted in duplicate, and results were expressed as mean ± standard deviation. Differences among samples were evaluated by two-way ANOVA.
Prior to multivariate analysis, the VOC data were transformed and standardized to ensure comparability across compounds. Specifically, the data were first natural log-transformed using the log (1 + x) function and then standardized by z-score normalization (i.e., each variable was mean-centered and scaled to unit variance). The logarithmic transformation was applied to mitigate the large differences in the orders of magnitude among the abundances of the various volatile compounds, preventing the most concentrated compounds from dominating the analysis, while the addition of one prior to the logarithm allowed zero values to be handled. Both Principal Component Analysis (PCA) and hierarchical cluster analysis were then performed on the transformed and standardized VOC dataset using MATLAB (version 2024a, The MathWorks Inc., Natick, MA, USA). The hierarchical clustering and the associated heatmap were generated with the clustergram function (Bioinformatics Toolbox), clustering both rows and columns using the Euclidean distance metric and the average linkage method.
3. Results and Discussion
3.1. Effect of Traditional Processing on Color Parameters and Browning Development in Bandek Samples
The color parameters of Bandek samples were significantly affected by the traditional processing steps, including steaming, drying, and roasting (Table 1). Processing into Bandek consistently reduced lightness (L*) and increased redness (a*), yellowness (b*), and the Browning Index (BI), reflecting the progressive development of browning reactions during thermal processing.
Among flour samples, Chifaa exhibited the highest L* value (88.70), reflecting the naturally lighter color of hull-less barley flour, whereas Faridur and Svevo showed the lowest values (80.19 and 80.20, respectively). Svevo HA displayed intermediate but significantly higher lightness (84.38) compared with the conventional durum wheat varieties. Regarding yellowness (b*), Faridur flour showed the highest value (24.86), while Chifaa exhibited the lowest (13.25), likely reflecting differences in pigment composition between these genotypes [37]. Browning Index values followed a similar trend, with Faridur flour presenting the highest BI (37.18) and Chifaa the lowest (16.35).
Following traditional processing, all Bandek samples exhibited reduced L* values and increased a*, b*, and BI values compared with their respective flours, highlighting the strong impact of thermal treatment on color development. Among Bandek samples, Svevo HA exhibited the highest L* value (75.40), suggesting a relatively lighter final product, whereas Faridur showed the lowest L* value (66.92), indicative of more pronounced browning, as confirmed by the highest BI value (56.06). The increase in redness was particularly evident in Faridur (a* = 6.65), while Svevo HA displayed the lowest a* value (4.34). Similarly, yellowness increased in all processed products, with Chifaa showing the highest b* value (28.46).
These color modifications are mainly attributable to Maillard reactions and caramelization phenomena occurring during roasting, leading to the formation of brown pigments and flavor-active compounds [4,38]. The more pronounced browning observed in certain genotypes, particularly Faridur, may be related to differences in compositional and technological traits, including protein content, starch damage, particle size distribution, and the availability of reducing sugars, all of which can influence Maillard reactions during thermal processing. Faridur is characterized by softer kernel texture compared with Svevo, resulting in finer particles and modified starch properties that can affect color development during roasting [20]. Similar relationships between starch damage, thermal reactions, and crust browning have previously been reported in Svevo and Faridur based products [20].
3.2. The Characterization of Bandek Samples
The nutritional composition of Bandek samples revealed significant genotype-dependent variations and clear effects of processing (Table 2). A major distinguishing feature among samples was the β-glucan content, which was substantially higher in the barley-based Bandek (Chifaa: 6.03 g/100 g dw) compared to wheat-based samples (0.48–0.72 g/100 g dw). This finding reflects not only the well-established role of barley as a major source of soluble dietary fiber and functional compounds [39,40], but also the intrinsically high-fiber profile of the Chifaa variety used in this study. The relatively high retention of β-glucan after processing indicates that the applied traditional treatments do not significantly degrade this component, in agreement with previous studies on thermally processed barley products [41].
Protein content significantly differed among the cereal genotypes (Table 2), with Chifaa showing the highest values both in flour and Bandek samples (18.01% and 14.27%). Svevo HA exhibited a slightly higher protein content than Svevo (16.10% vs 15.04%), likely due to the trade-off between protein and starch accumulation, as this high-amylose genotype is characterized by a moderate reduction in starch content compared with the conventional Svevo cultivar [42]. Traditional Bandek processing resulted in an approximately 20% reduction in protein content in all genotypes, indicating that protein loss was mainly associated with the processing conditions rather than genotype-specific effects. This reduction may be related to soaking which can promote the loss of soluble nitrogen compounds. Despite this decrease, Bandek samples retained relatively high protein levels, confirming their nutritional relevance as cereal-based traditional products. One of the most notable effects of traditional processing was the increase in RS content. Raw flours showed very low RS values, close to the detection limit, with the exception of the high-amylose genotype Svevo HA, which exhibited markedly higher levels (6.66%). Following Bandek processing, all samples showed increased RS contents, reaching values of 1.72, 1.92 and 1.86% respectively in Svevo, Faridur, and Chifaa, while Svevo HA displayed a slight further increase up to 6.82%. The pronounced relative increase observed in conventional genotypes is likely associated with starch gelatinization during steaming followed by retrogradation occurring during cooling and drying, leading to the formation of enzyme-resistant starch structures [43]. In contrast, the limited increase observed in Svevo HA may be attributed to its already high RS content in the raw flour. Moreover, although RS in raw Svevo HA is predominantly present as RS2, processing into Bandek is expected to convert a substantial proportion of it into RS3 [44].
Iron and zinc contents were markedly higher in Bandek samples than in the corresponding flours. Iron concentration increased by approximately 44–110%, whereas zinc content showed a more moderate increase ranging from about 10% to 29%, depending on the genotype. Among the processed products, Svevo Bandek exhibited the highest iron (71.29 ppm) and zinc (41.19 ppm) contents, corresponding to increases of approximately 110% and 28%, respectively, compared with raw flour.
Fe and Zn concentrations were higher in Bandek than in the corresponding flours. However, because the mechanism underlying these differences was not investigated, the results should be interpreted as compositional differences and not as evidence of mineral enrichment or increased mineral bioavailability.
3.3. In Vitro Predicted Glycemic Index (pGI) and Hydrolysis Index (HI)
The in vitro starch digestibility analysis revealed significant differences among the Bandek samples (Table 2). Chifaa exhibited the lowest hydrolysis index (HI, 25.63) and estimated glycemic index (pGI, 53.78), followed by Svevo HA (HI, 38.29; pGI, 60.73), whereas Faridur showed the highest values (HI, 63.82; pGI, 74.75), indicating more rapid starch hydrolysis and potentially faster glucose release. Svevo displayed intermediate HI and pGI values of 52.58 and 68.58, respectively.
Based on the commonly used pGI thresholds, Chifaa would fall within the low-pGI category, Svevo HA and Svevo within the medium-pGI category, and Faridur within the high-pGI category [45]. However, because these values were estimated using an in vitro digestion assay, this classification should be interpreted as indicative of the potential glycemic response rather than as a direct assessment of the in vivo GI.
The low pGI of Chifaa is likely primarily related to its high β-glucan content. β-Glucans can increase the viscosity of the food matrix and reduce enzyme accessibility to starch, thereby slowing starch hydrolysis and glucose release [46,47]. The RS formed during Bandek processing may have provided an additional contribution to its reduced starch digestibility. Similarly, the relatively low pGI of Svevo HA is consistent with its markedly higher RS content. High-amylose starches generally exhibit reduced susceptibility to enzymatic hydrolysis and are associated with attenuated postprandial glycemic responses [48,49]. This interpretation is further supported by the inverse relationship observed between RS content and pGI across the Bandek samples [50].
Nevertheless, the high estimated pGI of Faridur, despite its processing-induced increase in RS, indicates that RS content alone does not fully determine starch digestibility. Rather, the glycemic potential of Bandek appears to depend on the overall composition and structural properties of the cereal matrix, including starch characteristics and the presence of soluble dietary fiber.
These results demonstrate that the potential glycemic response of Bandek is strongly genotype-dependent and is modulated by the interaction between the composition of the raw material and traditional processing. In conventional genotypes, starch gelatinization during steaming, followed by retrogradation during cooling and drying, likely promoted the formation of RS3 and other less digestible starch structures. In Svevo HA, which already contained a high proportion of RS2 due to long chains of amylopectin in the raw flour, processing may have promoted partial conversion of native granular RS2 into retrograded RS3 [44]; however, the individual RS fractions were not directly quantified. Therefore, selecting genotypes with specific compositional traits, particularly high amylose or β-glucan contents, may represent an effective strategy for improving the nutritional and functional properties of traditional cereal-based foods such as Bandek.
3.4. Phenolic Content and Antioxidant Capacities
The phenolic profile of Bandek samples was significantly improved compared to the flours (Table 3). Total phenolic content (TPC) increased in all samples, reaching values between 484.30 and 501.72 mg GAE/100 g dw in Bandek. The highest values were observed in Chifaa and Faridur, indicating that both barley and certain wheat genotypes respond favorably to processing in terms of phenolic enrichment.
A key observation is the increase in both free and bound phenolic fractions, with bound phenolics exceeding 250 mg GAE/100 g dw in all Bandek samples. This suggests that thermal processing promotes the release of phenolic compounds from the cereal matrix, likely through disruption of cell wall structures and cleavage of ester linkages [6]. Similar increases in phenolic extractability following thermal treatments have been already observed in barley [4]. These findings are particularly relevant from a nutritional standpoint, as phenolic compounds are associated with antioxidant, anti-inflammatory, and metabolic health benefits [51].
The enhancement of phenolic extractability was accompanied by a significant increase in antioxidant activity, as measured by ABTS, FRAP, and DPPH assays (Table 4). All Bandek samples showed higher antioxidant capacities than their corresponding flours, confirming the strong impact of processing. Among them, Chifaa exhibited the highest antioxidant activity across all assays (ABTS: 511.60; FRAP: 295.16; DPPH: 463.30 mg TE/100 g dw), reflecting its superior phenolic content.
The extractability of both free and bound antioxidants increased after processing, with bound phenolics contributing substantially to the overall antioxidant capacity. These findings confirm the key role of bound phenolic compounds in determining the antioxidant potential of cereal-based foods, in agreement with previous studies on cereal antioxidants [5]. The enhanced antioxidant activity may be associated not only with the release of phenolic compounds from the cereal matrix during processing, but also with the formation of Maillard reaction products generated during roasting, which are known to exhibit antioxidant properties [52,53]. It should also be considered that the Folin–Ciocalteu assay is not specific for phenolics, and the observed increase in total phenolic content may partially reflect the formation of Maillard reaction products and other reducing compounds generated during roasting. Further studies based on chromatographic characterization of individual phenolic compounds, together with the evaluation of thermal contaminants such as acrylamide, would help to better clarify the chemical changes occurring during Bandek processing.
3.5. Volatile Organic Compounds
The volatile organic compounds (VOCs) identified and semi-quantified in wholemeal flours from Svevo, Svevo HA, Faridur, and the barley cultivar Chifaa, together with those detected in the corresponding Bandek products, are reported in Table S1. The effects of processing stage and cereal genotype were evaluated by two-way ANOVA (Table S2). A total of 64 VOCs were detected and classified as aldehydes (22 compounds), alcohols (7), terpenes and terpenoids (9), pyrazines (13), ketones (8), and other compounds (5). Bandek processing markedly altered the overall volatile profile, although the direction and magnitude of the changes differed among chemical classes. The total semi-quantitative VOC abundance increased from 874.06-1084.82 ng/g in the flours to 3378.38-7242.90 ng/g in the corresponding Bandek products, representing an approximately three- to eightfold increase, depending on genotype. This increase was driven mainly by aldehydes, pyrazines, and selected ketones and terpenoids, whereas several alcohols were less abundant after processing.
Pyrazines provided the clearest chemical signature associated with Bandek processing. Alkyl-substituted pyrazines were virtually absent from the raw flours, except for traces detected in Chifaa flour (13.4 ng/g), whereas their total abundance ranged from 270.21 to 448.67 ng/g in Bandek. Twelve or thirteen pyrazine derivatives were detected in the processed products, depending on the cereal genotype. These compounds included methyl-, dimethyl-, ethylmethyl-, and diethylmethyl-substituted pyrazines, which are commonly associated with the Maillard reaction and with roasted or toasted odor notes [41,54]. Their detection predominantly in Bandek is consistent with the thermal reactions occurring during roasting. Svevo- and Faridur-based Bandek showed the highest total pyrazine abundances (448.7 and 441.5 ng/g, respectively). Because roasting conditions were not instrumentally monitored, these differences should not be interpreted as evidence of different roasting intensities; they may instead reflect genotype-dependent differences in the availability of reducing sugars, amino compounds, or other reaction precursors.
Aldehydes were the most abundant VOC class in Bandek, ranging from 1151.60 to 5073.46 ng/g and accounting for approximately 34-70% of the total VOC abundance, compared with 113.49-138.85 ng/g in the corresponding flours. Fourteen aldehydes were detected in the Bandek samples, including heptanal, octanal, (E)-2-heptenal, (E)-2-octenal, 2-decenal, and furfural. Straight-chain and unsaturated aldehydes such as hexanal, heptanal, octanal, nonanal, (E)-2-octenal, (E,E)-2,4-nonadienal, and (E,E)-2,4-decadienal are commonly associated with lipid oxidation pathways. Hexanal, a major secondary oxidation product of linoleic acid, was considerably more abundant in Bandek than in the corresponding flours and reached its highest value in Faridur Bandek (576.5 ng/g) [55]. These patterns are consistent with increased lipid oxidation during processing; however, they do not establish differences among genotypes in lipoxygenase activity or fatty acid composition, which were not measured in this study.
Furfural was detected only in three processed products (Svevo HA, Chifaa, and Svevo) at concentrations ranging from 106.23 to 253.47 ng/g, whereas it was not detected in the raw flours or in Faridur Bandek. Furfural can arise from the thermal degradation of sugars and is commonly reported in thermally processed cereal products [56,57]. Its occurrence together with alkyl-substituted pyrazines is therefore consistent with non-enzymatic browning reactions during Bandek processing.
Ketones constituted the second most abundant class in Bandek, with total abundances ranging from 655.25 ng/g in Svevo to 1157.70 ng/g in Faridur. Nevertheless, the response of individual ketones was compound-specific. In particular, 2-octanone was more abundant in the raw flours (332.95–485.23 ng/g) than in the corresponding Bandek products (226.00–366.18 ng/g), suggesting partial loss through volatilization or further transformation during processing. Conversely, 3,5-octadien-2-one isomers were detected mainly, or at substantially higher abundances, in Bandek. These unsaturated ketones are consistent with secondary oxidation reactions involving unsaturated fatty acids [58].
Alcohols displayed an opposite overall trend. Their total abundance decreased from 212.52-467.00 ng/g in the raw flours to 115.48-411.41 ng/g in Bandek, mainly because 1-hexanol, 1-heptanol, and 1-pentanol were depleted or were no longer detected after processing. This reduction may reflect volatilization and/or further oxidation during roasting, although the relative contribution of these mechanisms was not directly assessed.
1-Octen-3-ol (mushroom-like, earthy) behaved in a matrix-dependent way on processing: present in Chifaa and Faridur flours (26.4 and 26.1 ng/g) and ~6-fold higher in the corresponding Bandek (149.8 and 152.1 ng/g), undetected in Svevo HA flour but the highest of all after processing (240.2 ng/g), and the reverse in Svevo (32.6 ng/g in flour, absent in the product). Since this C8 alcohol forms from linoleic acid via the genotype-dependent lipoxygenase/hydroperoxide-lyase pathway [56,59], its net increase in three of the four genotypes indicates formation during processing, mirroring the general rise in lipid-oxidation products in Bandek, whereas its loss in Svevo reflects volatilization and further transformation outweighing formation [60,61]. The final aroma is thus not a carry-over of the flour’s volatiles but the net outcome of matrix-dependent lipid oxidation and process-driven formation and loss.
The terpene and terpenoid fraction increased after processing, particularly in Svevo Bandek, which showed the highest total abundance in this class (885.67 ng/g). This profile was driven mainly by carvone, p-cymen-7-ol, and o-cymene, together with limonene, α-phellandrene, β-myrcene, and γ-terpinene. Their higher abundance in Bandek may reflect enhanced release from the cereal matrix or chemical transformation during processing. Although these compounds are commonly associated with herbaceous, citrus-like, or mint-like odor notes, their sensory contribution cannot be established without odor-activity or sensory analyses.
Bandek processing transformed the volatile profiles of the four cereal matrices. The processed products were characterized by the appearance of alkyl-substituted pyrazines and furfural, an increase in lipid-derived aldehydes and selected unsaturated ketones, and a decrease in several alcohols that were more abundant in the raw flours. The magnitude of these changes differed among genotypes: Svevo HA showed the highest total VOC and aldehyde abundances, whereas Svevo was distinguished by its greater terpene/terpenoid and pyrazine abundances. These results indicate that the composition of the starting cereal matrix modulates the volatile profile obtained after a common traditional processing procedure.
3.6. Multivariate Analysis of Volatile Profiles
3.6.1. Principal Component Analysis (PCA)
Principal component analysis (PCA) was performed on the log1p-transformed and z-score-standardized VOC dataset to explore relationships among samples and variables and to assess analytical repeatability. The first two principal components explained 72.1% of the total variance, with PC1 and PC2 accounting for 52.8% and 19.3%, respectively (Figure 1). The score plot showed a clear separation between Bandek products and the corresponding raw flours along PC1: all Bandek samples were positioned on the positive side, whereas the flour samples clustered on the negative side. Additional differentiation among the Bandek samples was observed along PC2, particularly for Svevo Bandek, whose separation was associated with its higher terpene and terpenoid abundance. Svevo HA and Faridur Bandek were positioned on the positive side of PC1 and were characterized by high aldehyde and terpene abundances, respectively, whereas Chifaa occupied an intermediate position among the processed samples. The loading plot indicated that positive PC1 loadings were mainly associated with pyrazines and thermally or oxidatively derived compounds, including furfural, (E)-2-octenal, hexanal, (E)-3,5-octadien-2-one, carvone, and p-cymen-7-ol. Conversely, 2-octanone, camphor, and 2-nonanol were associated with the negative side of PC1 and, therefore, with the flour samples. Positive PC2 loadings were primarily associated with o-cymene, γ-terpinene, limonene, and 4-(1-methylethyl)benzaldehyde, contributing to the separation of Svevo Bandek, whereas alcohols, short-chain unsaturated aldehydes, and branched-chain aldehydes were mainly associated with the negative PC2 direction. The analytical replicates of each matrix–treatment combination clustered closely, supporting the repeatability of VOC extraction and instrumental analysis. In conclusion, the PCA identified the distinction between raw flours and Bandek products as the main source of variation in the dataset, while also revealing secondary matrix-dependent differences among the processed products.
3.6.2. Hierarchical Cluster Analysis
Consistent with the PCA, two-way hierarchical cluster analysis (HCA) of the transformed and standardized VOC data identified two main macro-clusters corresponding to the Bandek products and raw flours (Figure 2). Within the Bandekmacro-cluster, Svevo HA and Chifaa formed one subgroup, characterized by higher standardized values for a cluster of compounds associated with the processed matrices, whereas Faridur and Svevo formed a second subgroup distinguished by higher values for several terpenes and terpenoids. The flour macro-cluster showed a predominantly low standardized abundance of compounds associated with thermal processing and was further divided into matrix-specific subgroups. The compound dendrogram identified three broad abundance patterns: a cluster associated primarily with Bandek, comprising pyrazines, furfural, lipid-derived aldehydes, and selected unsaturated ketones; an intermediate cluster dominated by monoterpenes and terpenoids, with higher values in Faridur and Svevo Bandek; and a cluster containing compounds more closely associated with the background VOC profiles of the raw flours, including several alcohols and camphor. The close clustering of analytical replicates further confirmed analytical consistency. Overall, the HCA supported the primary separation between flours and Bandek products observed in the PCA and confirmed the presence of secondary matrix-dependent differences, particularly in the terpene and terpenoid profiles of the processed products.
4. Conclusions
This study shows that traditional Bandek processing substantially modifies the nutritional, functional, and physicochemical properties of barley and durum wheat, although the magnitude of the response depends on the cereal genotype. Under the conditions examined, processing increased extractable phenolic compounds and antioxidant capacity, promoted resistant starch formation, and lowered the estimated in vitro GI. Chifaa barley retained a high β-glucan content and showed the lowest pGI, whereas high-amylose Svevo produced the highest resistant starch content among the wheat-based products. These findings indicate that genotype selection and traditional processing act jointly in determining the nutritional characteristics of Bandek.
Processing also markedly reshaped the volatile profile, increasing total volatile organic compounds three- to eight-fold and promoting the formation of pyrazines, furfural, aldehydes, and other compounds associated with Maillard reactions, caramelization, and lipid oxidation. The genotype-dependent volatile patterns provide a chemical basis for differentiating the aroma profiles of the four Bandek products. However, the contribution of individual compounds to perceived aroma and consumer acceptance should be confirmed through sensory evaluation.
Further work should examine nutrient bioaccessibility and sensory quality and validate the physiological effects in human studies.
To conclude, combining nutritionally targeted cereal germplasm with culturally rooted Bandek processing offers a promising route to cereal foods with improved functional characteristics and distinctive volatile profiles. This approach may support the scientific valorization of Moroccan food heritage and the development of locally relevant cereal products, provided that nutritional benefits, sensory acceptance, and process reproducibility are confirmed in subsequent studies.
Supplementary Materials
The following supporting information can be downloaded at the website of this paper posted on Preprints.org, Table S1: Volatile Organic Compounds identified in flours (F) and Bandek (B); Table S2: Two-way ANOVA applied on volatolomic data.
Author Contributions
Conceptualization, F.S., and H.K.; Formal analysis, K.O., L.P., A.V., and M.F; Investigation, S.P., M.T. and H.K.; Methodology, A.J., G.S., and H.K.; Resources, F.S., S.P., and H.K.; Supervision, S.P., and H.K.; Writing—original draft, S.P., M.T., L.P., and H.K.; Writing—review and editing, A.J., K.O., G.S., F.S., C.O., O.S., S.P., and B.L. All authors have read and agreed to the published version of the manuscript.
Funding
The research was funded by MEDWHEALTH PRIMA Foundation (Horizon2020), PRIMA SECTION 1 2020 AGROFOOD VALUE CHAIN IA TOPIC: 1.3.1-2020 (IA), MEDWHEALTH project grant no. 2034.
Acknowledgments
The authors thank Dr. Francesco Tedesco for his valuable contribution to the volatilomics analysis.
Conflicts of Interest
The authors declare no conflicts of interest.
References
- Thielecke, F.; Lecerf, J.-M.; Nugent, A.P. Processing in the food chain: Do cereals have to be processed to add value to the human diet? Nutr. Res. Rev. 2021, 34, 159–173. [Google Scholar] [CrossRef]
- Ingbian, E.K.; Akpapunam, M.A. Appraisal of traditional technologies in the processing and utilisation of mumu: A cereal-based local food product. Afr. J. Food Agric. Nutr. Dev. 2005, 5, 1–17. [Google Scholar] [CrossRef]
- Atuna, R.A.; Ametei, P.N.; Bawa, A.-A.; Amagloh, F.K. Traditional processing methods reduced phytate in cereal flour and improved nutritional properties. Sci. Afr. 2022, 15, e01063. [Google Scholar] [CrossRef]
- Wang, B.; Zhang, Y.; Chen, L.; Li, X.; Zhao, G. Effect of roasting on phenolic compounds of barley. Food Res. Int. 2022, 162, 112137. [Google Scholar] [CrossRef] [PubMed]
- Shahidi, F.; Yeo, J. Insoluble-bound phenolics in food. Molecules 2016, 21, 1216. [Google Scholar] [CrossRef] [PubMed]
- Acosta-Estrada, B.A.; Gutiérrez-Uribe, J.A.; Serna-Saldívar, S.O. Bound phenolics in foods: A review. Food Chem. 2014, 152, 46–55. [Google Scholar] [CrossRef] [PubMed]
- Gallegos-Infante, J.A.; Rocha-Guzmán, N.E.; González-Laredo, R.F.; Pulido-Alonso, J. Effect of processing on the antioxidant properties of extracts from Mexican barley (Hordeum vulgare) cultivar. Food Chem. 2010, 119, 903–906. [Google Scholar] [CrossRef]
- Singh, J.; Dartois, A.; Kaur, L. Starch digestibility in food matrix: A review. Trends Food Sci. Technol. 2010, 21, 168–180. [Google Scholar] [CrossRef]
- Li, L.; Wang, Q.; Liu, C.; Hong, J.; Zheng, X. Effect of oven roasting on major chemical components in cereals and its modulation on flour-based products quality. J. Food Sci. 2023, 88, 2740–2757. [Google Scholar] [CrossRef] [PubMed]
- Guy, R. (Ed.) Extrusion Cooking: Technologies and Applications; Woodhead Publishing: Cambridge, UK, 2001. [Google Scholar]
- Fellows, P.J. Food Processing Technology: Principles and Practice, 3rd ed.; Woodhead Publishing: Cambridge, UK, 2009. [Google Scholar]
- Abu-Saad, K.; Shahar, D.R.; Vardi, H.; Fraser, D. Importance of ethnic foods as predictors of and contributors to nutrient intake levels in a minority population. Eur. J. Clin. Nutr. 2010, 64, S88–S94. [Google Scholar] [CrossRef] [PubMed]
- Barakat, I.; Chamlal, H.; El Jamal, S.; Elayachi, M.; Belahsen, R. Food expenditure and food consumption before and during Ramadan in Moroccan households. J. Nutr. Metab. 2020, 2020, 8849832. [Google Scholar] [CrossRef] [PubMed]
- Beraich, A.; Dikici, B.; El Farissi, H.; Batovska, D.I.; Nikolova, K.; Belbachir, Y.; Choukoud, A.; Bentouhami, N.E.; Asehraou, A.; Talhaoui, A. The Moroccan Meska Horra: A natural candidate for food and therapeutic applications. Foods 2025, 14, 1158. [Google Scholar] [CrossRef] [PubMed]
- Monkachi, M. L’alimentation traditionnelle dans les campagnes du nord du Maroc. Médiévales 1997, 33, 91–102. [Google Scholar] [CrossRef]
- Chaachouay, N.; Zidane, L. The symbolic efficacy of plants in rituals and socio-religious ceremonies in Morocco, Northwest of Africa. J. Relig. Theol. Inf. 2022, 21, 34–53. [Google Scholar] [CrossRef]
- Sestili, F.; Palombieri, S.; Botticella, E.; Mantovani, P.; Bovina, R.; Lafiandra, D. TILLING mutants of durum wheat result in a high amylose phenotype and provide information on alternative splicing mechanisms. Plant Sci. 2015, 233, 127–133. [Google Scholar] [CrossRef] [PubMed]
- Elouadi, F.; Amri, A.; El-Baouchi, A.; Kehel, Z.; Jilal, A.; Ibriz, M. Genotypic and environmental effects on quality and nutritional attributes of Moroccan barley cultivars and elite breeding lines. Front. Nutr. 2023, 10, 1204572. [Google Scholar] [CrossRef] [PubMed]
- Maccaferri, M.; Harris, N.S.; Twardziok, S.O.; et al. Durum wheat genome highlights past domestication signatures and future improvement targets. Nat. Genet. 2019, 51, 885–895. [Google Scholar] [CrossRef] [PubMed]
- Pasqualone, A.; Palombieri, S.; Köksel, H.; Summo, C.; De Vita, P.; Sestili, F. Milling performance and bread-making aptitude of the new soft kernel durum wheat variety Faridur. Int. J. Food Sci. Technol. 2023, 58, 268–278. [Google Scholar] [CrossRef]
- Romano, G.; Del Coco, L.; Milano, F.; Durante, M.; Palombieri, S.; Sestili, F.; Visioni, A.; Jilal, A.; Fanizzi, F.P.; Laddomada, B. Phytochemical profiling and untargeted metabolite fingerprinting of the MEDWHEALTH wheat, barley and lentil wholemeal flours. Foods 2022, 11, 4070. [Google Scholar] [CrossRef] [PubMed]
- AACC International. Approved Methods of Analysis, 11th ed.; Methods 46-10.01 and 32-40.01; AACC International: St. Paul, MN, USA, 2010. [Google Scholar]
- AOAC International. Official Method 2002.02: Resistant starch in starch and plant materials-Enzymatic digestion. In Official Methods of Analysis of AOAC International, 18th ed.; AOAC International: Gaithersburg, MD, USA, 2005. [Google Scholar]
- Palombieri, S.; Bonarrigo, M.; Cammerata, A.; Quagliata, G.; Astolfi, S.; Lafiandra, D.; Sestili, F.; Masci, S. Characterization of Triticum turgidum sspp. durum, turanicum, and polonicum grown in Central Italy in relation to technological and nutritional aspects. Front. Plant Sci. 2023, 14, 1269212. [Google Scholar] [CrossRef] [PubMed]
- Shamanin, V.P.; Tekin-Çakmak, Z.H.; Gordeeva, E.I.; Karasu, S.; Pototskaya, I.V.; Chursin, A.S.; et al. Antioxidant capacity and profiles of phenolic acids in various genotypes of purple wheat. Foods 2022, 11, 2515. [Google Scholar] [CrossRef] [PubMed]
- Özkan, K.; Geyik, Ö.G.; Shamanin, V.P.; Sagdic, O.; Pototskaya, I.V.; Kutlu, E.; Gordeeva, E.I.; Morgounov, A.; Köksel, H. Pigmented wheat whole breads: In vitro phenolic bioaccessibility and colorectal cancer-targeted effects. Eur. Food Res. Technol. 2026, 252, 1. [Google Scholar] [CrossRef]
- Re, R.; Pellegrini, N.; Proteggente, A.; Pannala, A.; Yang, M.; Rice-Evans, C. Antioxidant activity applying an improved ABTS radical cation decolorization assay. Free Radic. Biol. Med. 1999, 26, 1231–1237. [Google Scholar] [CrossRef] [PubMed]
- Singh, R.P.; Chidambara Murthy, K.N.; Jayaprakasha, G.K. Studies on the antioxidant activity of pomegranate (Punica granatum) peel and seed extracts using in vitro models. J. Agric. Food Chem. 2002, 50, 81–86. [Google Scholar] [CrossRef] [PubMed]
- Benzie, I.F.F.; Strain, J.J. The ferric reducing ability of plasma (FRAP) as a measure of antioxidant power: The FRAP assay. Anal. Biochem. 1996, 239, 70–76. [Google Scholar] [CrossRef] [PubMed]
- Goñi, I.; García-Alonso, A.; Saura-Calixto, F. A starch hydrolysis procedure to estimate glycemic index. Nutr. Res. 1997, 17, 427–437. [Google Scholar] [CrossRef]
- Tekin-Çakmak, Z.H.; Ozer, C.; Özkan, K.; Yildirim, H.; Sestili, F.; Jilal, A.; Sagdic, O.; Ozgolet, M.; Köksel, H. High-beta-glucan and low-glycemic index functional bulgur. J. Funct. Foods 2024, 112, 105939. [Google Scholar] [CrossRef]
- Frankin, S.; Cna’ani, A.; Bonfil, D.J.; Tzin, V.; Nashef, K.; Degen, D.; Simhon, Y.; Baizerman, M.; Ibba, M.I.; González Santoyo, H.I.; Luna, C.V.; Cervantes Lopez, J.F.; Ogen, A.; Goldberg, B.Z.; Abbo, S.; Ben-David, R. New flavors from old wheats: Exploring the aroma profiles and sensory attributes of local Mediterranean wheat landraces. Front. Nutr. 2023, 10, 1059078. [Google Scholar] [CrossRef] [PubMed]
- National Institute of Standards and Technology (NIST). NIST/EPA/NIH Mass Spectral Library (NIST 20), Version 2.4; NIST Standard Reference Database 1A; NIST: Gaithersburg, MD, USA, 2020; National Institute of Standards and Technology (NIST). NIST Chemistry WebBook, NIST Standard Reference Database No. 69; NIST: Gaithersburg, MD, USA, 2021. [Google Scholar] [CrossRef]
- Zellner, B.d.; Bicchi, C.; Dugo, P.; Rubiolo, P.; Dugo, G.; Mondello, L. Linear retention indices in gas chromatographic analysis: A review. Flavour Fragr. J. 2008, 23, 297–314. [Google Scholar] [CrossRef]
- Souza, H.A.L.; Bragagnolo, N. New method for the extraction of volatile lipid oxidation products from shrimp by headspace–solid-phase microextraction–gas chromatography–mass spectrometry and evaluation of the effect of salting and drying. J. Agric. Food Chem. 2014, 62, 590–599. [Google Scholar] [CrossRef] [PubMed]
- Qiu, Z.; Zhao, J.; Zhang, X.; Jiang, B.; Wang, J.; Shen, X.; et al. Geographical variation of volatile organic compounds and aroma characteristics in seven Chinese Sparassis mushrooms. J. Food Compos. Anal. 2026, 153, 109158. [Google Scholar] [CrossRef]
- Beleggia, R.; Ficco, D.B.M.; Nigro, F.M.; Giovanniello, V.; Colecchia, S.A.; Pecorella, I.; De Vita, P. Effect of sowing date on bioactive compounds and grain morphology of three pigmented cereal species. Agronomy 2021, 11, 591. [Google Scholar] [CrossRef]
- Starowicz, M.; Zieliński, H. How Maillard reaction influences sensorial properties (color, flavor and texture) of food products? Food Rev. Int. 2019, 35, 707–725. [Google Scholar] [CrossRef]
- McCleary, B.V.; Codd, R. Measurement of (1→3),(1→4)-β-D-glucan in barley and oats: A streamlined enzymic procedure. J. Sci. Food Agric. 1991, 55, 303–312. [Google Scholar] [CrossRef]
- Tosh, S.M.; Bordenave, N. Emerging science on benefits of whole grain oat and barley and their soluble dietary fibers for heart health, glycemic response, and gut microbiota. Nutr. Rev. 2020, 78, 13–20. [Google Scholar] [CrossRef] [PubMed]
- Izydorczyk, M.S.; Dexter, J.E. Barley β-glucans: Molecular structure and functionality in foods. Food Res. Int. 2008, 41, 850–868. [Google Scholar] [CrossRef]
- Frittelli, A.; Botticella, E.; Palombieri, S.; Metelli, G.; Masci, S.; Silvestri, M.; Lafiandra, D.; Sestili, F. Improving the agronomic performance of high-amylose durum wheat. Plant Sci. 2025, 355, 112459. [Google Scholar] [CrossRef] [PubMed]
- Sissons, M.; Palombieri, S.; Sestili, F.; Lafiandra, D. Impact of variation in amylose content on durum wheat cv. Svevo technological and starch properties. Foods 2023, 12, 4112. [Google Scholar] [CrossRef] [PubMed]
- Köksel, H.; Masatcioglu, M.T.; Sumer, Z.; Köksel, F. Boosting resistant starch type 3 in amylotype corn starches via combined debranching and extrusion treatments. Starch—Stärke 2026, 78, e70158. [Google Scholar] [CrossRef]
- Atkinson, F.S.; Brand-Miller, J.C.; Foster-Powell, K.; Buyken, A.E.; Goletzke, J. International tables of glycemic index and glycemic load values 2021: A systematic review. Am. J. Clin. Nutr. 2021, 114, 1625–1632. [Google Scholar] [CrossRef] [PubMed]
- Kellogg, J.A.; Monsivais, P.; Murphy, K.M.; Perrigue, M.M. High β-glucan whole grain barley reduces postprandial glycemic response in healthy adults—Part one of a randomized controlled trial. Nutrients 2025, 17, 430. [Google Scholar] [CrossRef] [PubMed]
- Tosh, S.M. Review of human studies investigating the post-prandial blood-glucose lowering ability of oat and barley food products. Eur. J. Clin. Nutr. 2013, 67, 310–317. [Google Scholar] [CrossRef] [PubMed]
- Vetrani, C.; Sestili, F.; Vitale, M.; Botticella, E.; Giacco, R.; Griffo, E.; Costabile, G.; Cipriano, P.; Tura, A.; Pacini, G.; Rivellese, A.A.; Lafiandra, D.; Riccardi, G. Metabolic response to amylose-rich wheat-based rusks in overweight individuals. Eur. J. Clin. Nutr. 2018, 72, 904–912. [Google Scholar] [CrossRef] [PubMed]
- Regina, A.; Bird, A.; Topping, D.; Bowden, S.; Freeman, J.; Barsby, T.; Kosar-Hashemi, B.; Li, Z.; Rahman, S.; Morell, M. High-amylose wheat improves indices of large-bowel health. Proc. Natl. Acad. Sci. USA 2006, 103, 3546–3551. [Google Scholar] [CrossRef] [PubMed]
- Baptista, N.T.; Dessalles, R.; Illner, A.K.; Ville, P.; Ribet, L.; Anton, P.M.; Durand-Dubief, M. Harnessing the power of resistant starch: A narrative review of its health impact and processing challenges. Front. Nutr. 2024, 11, 1369950. [Google Scholar] [CrossRef] [PubMed]
- Zhang, H.; Tsao, R. Dietary polyphenols, oxidative stress and antioxidant and anti-inflammatory effects. Curr. Opin. Food Sci. 2016, 8, 33–42. [Google Scholar] [CrossRef]
- Nooshkam, M.; Varidi, M.; Bashash, M. The Maillard reaction products as food-born antioxidant and antibrowning agents in model and real food systems. Food Chem. 2019, 275, 644–660. [Google Scholar] [CrossRef] [PubMed]
- Yilmaz, Y.; Toledo, R. Antioxidant activity of water-soluble Maillard reaction products. Food Chem. 2005, 93, 273–278. [Google Scholar] [CrossRef]
- Kocadağlı, T.; Gökmen, V. Multiresponse kinetic modelling of Maillard reaction and caramelisation in a heated glucose/wheat flour system. Food Chem. 2016, 211, 892–902. [Google Scholar] [CrossRef] [PubMed]
- Poudel, R.; Rose, D.J. Changes in enzymatic activities and functionality of whole wheat flour due to steaming of wheat kernels. Food Chem. 2018, 263, 315–320. [Google Scholar] [CrossRef] [PubMed]
- Pico, J.; Bernal, J.; Gómez, M. Wheat bread aroma compounds in crumb and crust: A review. Food Res. Int. 2015, 75, 200–215. [Google Scholar] [CrossRef] [PubMed]
- Meng, D.; Zhang, F.; Jia, W.; Jiao, J.; Zhang, Y. Understanding the health implications of furan and its derivatives in thermally processed foods: Occurrence, toxicology, and mixture analysis. Curr. Opin. Food Sci. 2024, 57, 101151. [Google Scholar] [CrossRef]
- Maire, M.; Rega, B.; Cuvelier, M.-E.; Soto, P.; Giampaoli, P. Lipid oxidation in baked products: Impact of formula and process on the generation of volatile compounds. Food Chem. 2013, 141, 3510–3518. [Google Scholar] [CrossRef] [PubMed]
- Gardner, H.W. Lipoxygenase as a versatile biocatalyst. J. Am. Oil Chem. Soc. 1996, 73, 1347–1357. [Google Scholar] [CrossRef]
- Frasse, P.; Lambert, S.; Richard-Molard, D.; Chiron, H. The influence of fermentation on volatile compounds in French bread dough. LWT—Food Sci. Technol. 1993, 26, 126–132. [Google Scholar] [CrossRef]
- Gassenmeier, K.; Schieberle, P. Potent aromatic compounds in the crumb of wheat bread (French-type). Influence of pre-ferments and studies on the formation of key odorants during dough processing. Z. Lebensm.-Unters. Forsch. 1995, 201, 241–248. [Google Scholar] [CrossRef]
Figure 1.
PCA on standardized values on VOCs data. (a) Scores of samples along the first two principal components; (b) Correlation circle plot of the VOCs values along the first two principal components.
Figure 1.
PCA on standardized values on VOCs data. (a) Scores of samples along the first two principal components; (b) Correlation circle plot of the VOCs values along the first two principal components.
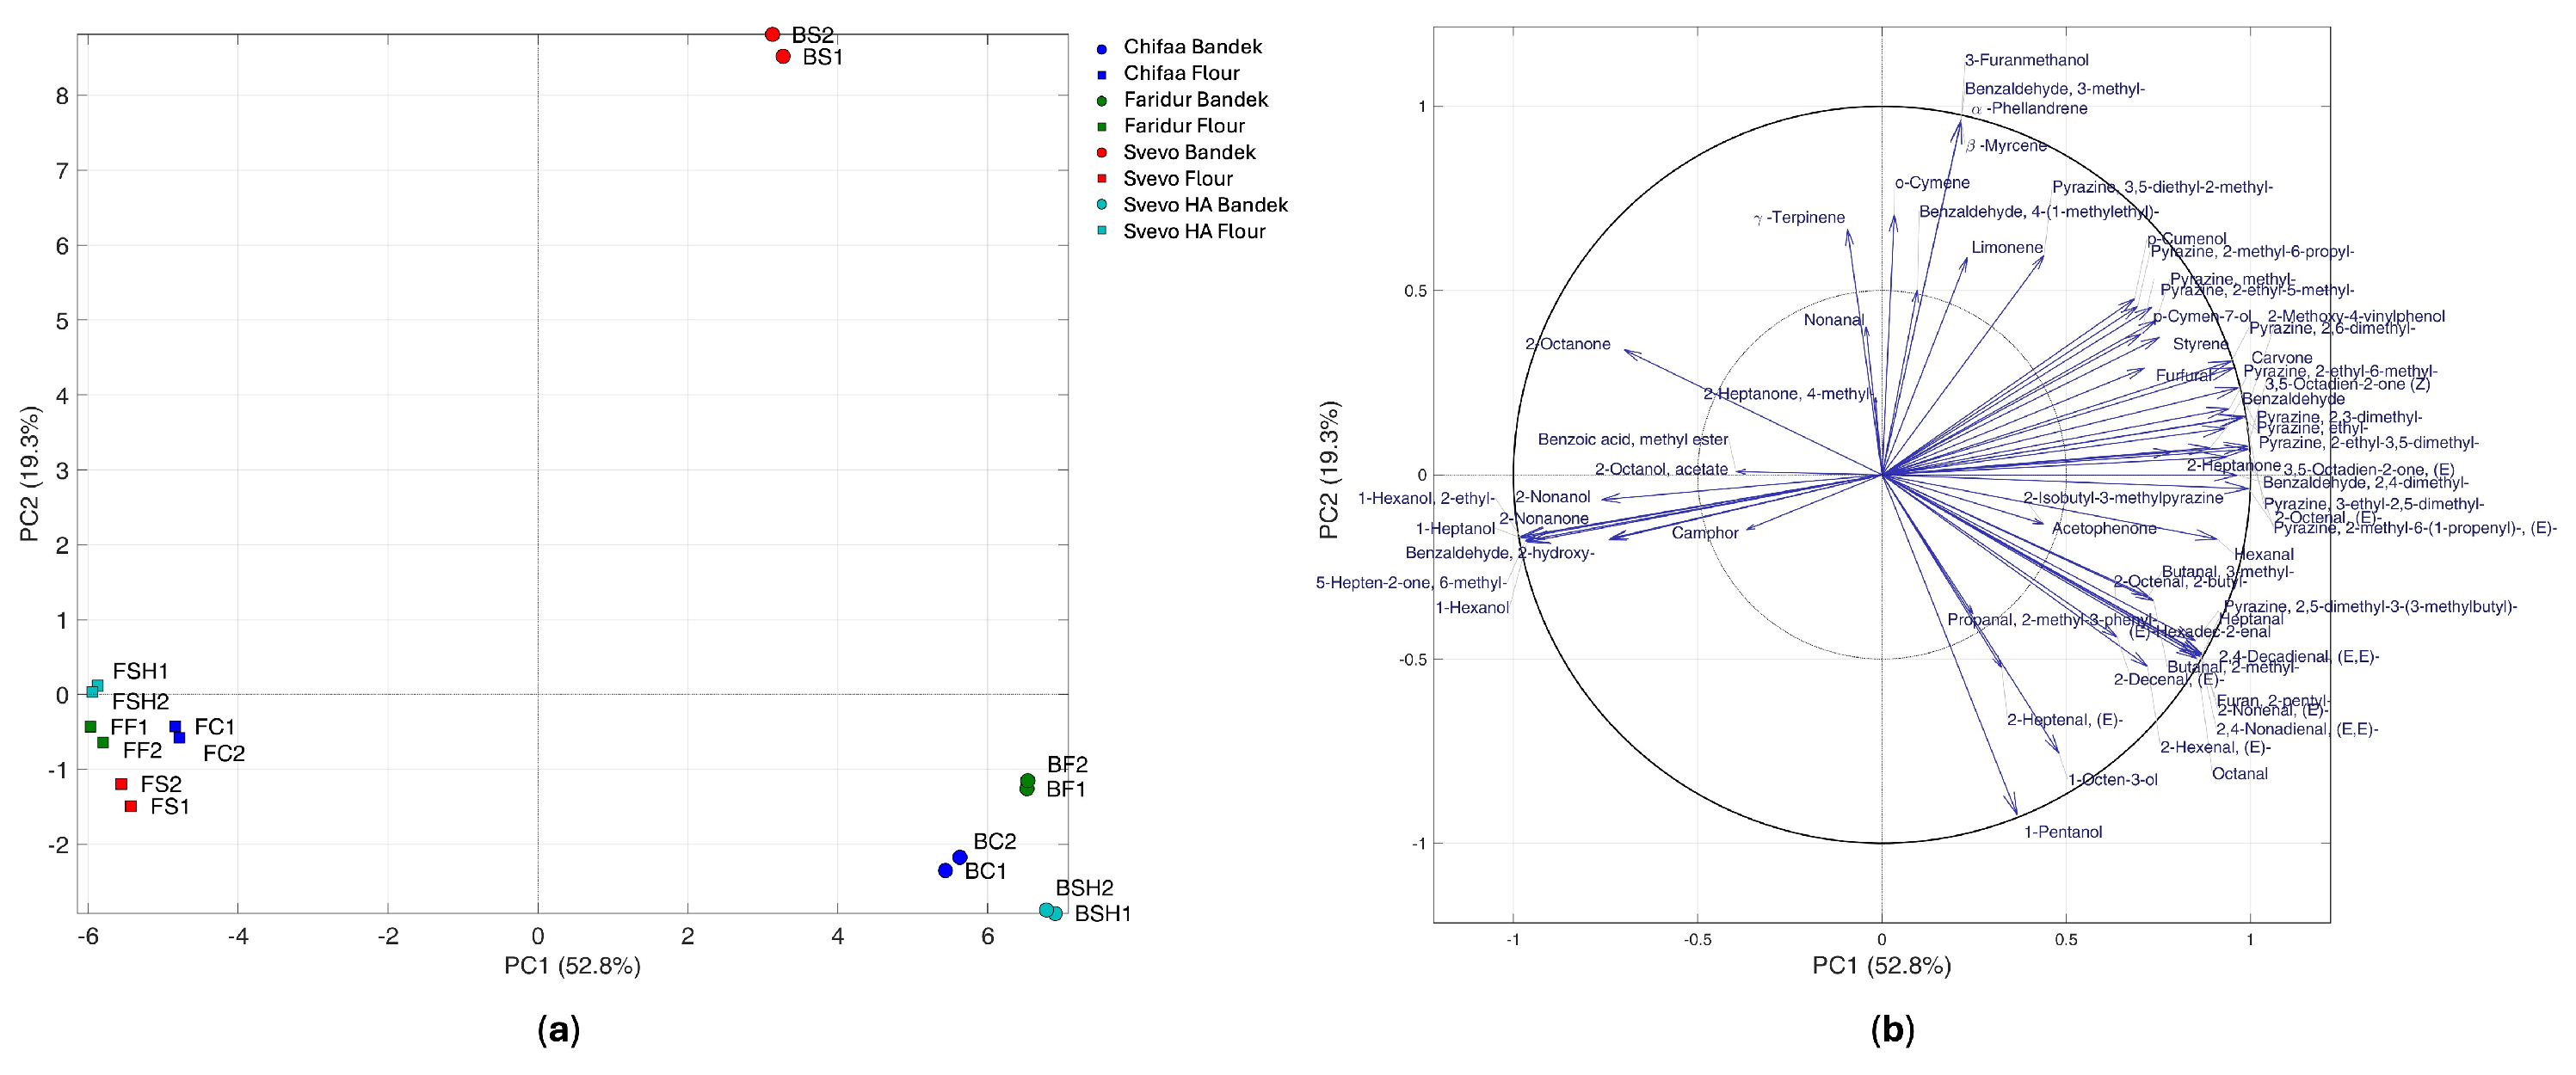
Figure 2.
Cluster heatmap of standardized concentrations of the volatile compounds. Hierarchical clustering by Euclidean distance and unweighted average linkage.
Figure 2.
Cluster heatmap of standardized concentrations of the volatile compounds. Hierarchical clustering by Euclidean distance and unweighted average linkage.
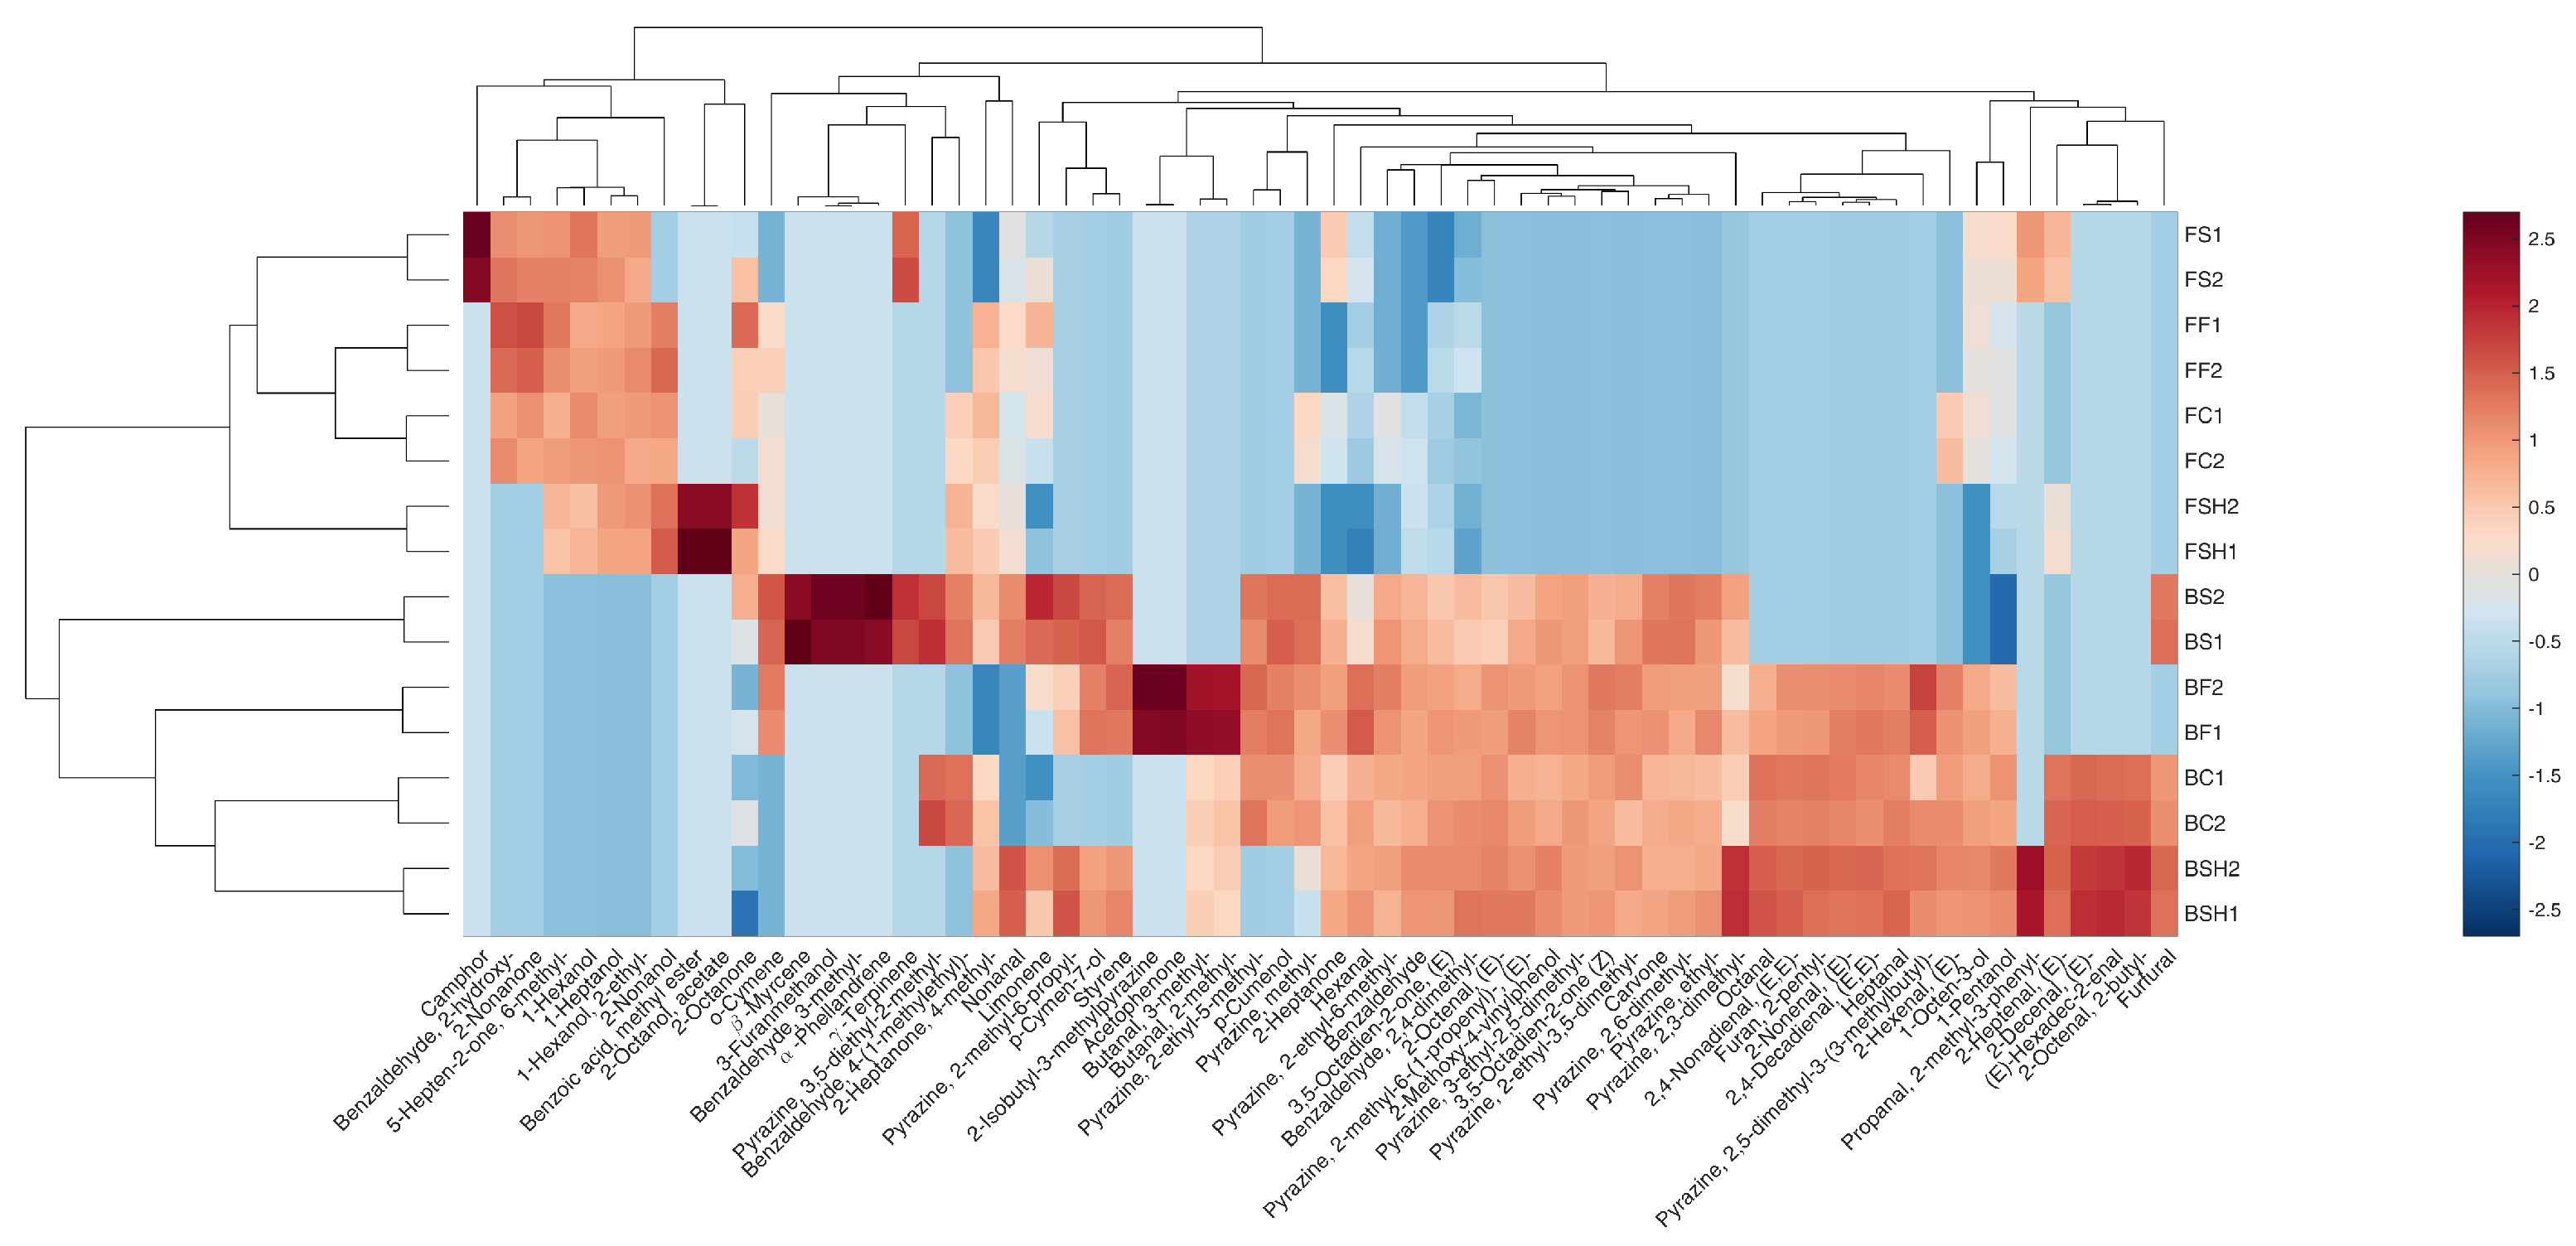

Table 1.
Color values of Bandek samples.
| L* | a* | b* | BI | ||
|---|---|---|---|---|---|
| Flour | Svevo | 80.20±0.43c | 1.81±0.12a | 22.94±0.10b | 34.2b |
| Faridur | 80.19±0.58c | 1.51±0.18a | 24.86±0.55a | 37.18a | |
| Svevo HA | 84.38±0.44b | 1.02±0.16b | 19.75±0.18c | 26.64c | |
| Chifaa | 88.70±0.20a | 0.88±0.04b | 13.25±0.18d | 16.35d | |
| Bandek** | Svevo | 72.48±0.10B | 4.76±0.03C | 27.54±0.14B | 50.95B |
| Faridur | 66.92±0.27C | 6.65±0.12A | 26.53±0.31B | 56.06A | |
| Svevo HA | 75.40±0.22A | 4.34±0.13D | 24.27±0.57C | 41.8C | |
| Chifaa | 72.72±0.19B | 5.16±0.03B | 28.46±0.15A | 53.11AB |
L*: Lightness — ranges from 0 (black) to 100 (white); indicates the brightness of the sample. a*: Red/Green Index — positive values indicate red tones; negative values indicate green tones. b*: Yellow/Blue Index — positive values indicate yellow tones; negative values indicate blue tones. BI: Browning Index; higher values indicate darker (more browned) samples. Data are expressed as mean ± standard deviation. Mean values within each column followed by different letters are significantly different (p ≤ 0.05). Flour samples (wheat and barley; a–d) and Bandek samples (A–D) were evaluated separately. **Prepared from each wheat and barley variety.
Table 2.
The nutritional analysis of Bandek samples.
| Samples | β-Glucan | Protein Content (%) |
Resistant Starch (%) |
Fe (ppm) | Zn (ppm) | HI | pGI |
|---|---|---|---|---|---|---|---|
| (g/100g dw) | |||||||
| Flour | |||||||
| Svevo | 0.52±0.01c | 15.04±0.44bc | 0.34±0.02c | 33.90±0.43a | 32.06±0.62a | ||
| Faridur | 0.51±0.01c | 14.52±0.42c | 0.52±0.01b | 33.41±0.57a | 31.46±0.65ab | ||
| Svevo HA | 0.81±0.01b | 16.10±0.23b | 6.66±0.09a | 32.19±0.44ab | 28.10±0.14c | ||
| Chifaa | 7.08±0.11a | 18.01±0.71a | 0.42±0.01bc | 31.35±0.49b | 29.84±0.48bc | ||
| Bandek* | |||||||
| Svevo | 0.50±0.02C | 12.03±0.13BC | 1.72±0.02D | 71.29±0.41A | 41.19±0.27A | 52.58±0.91B | 68.58±0.50B |
| Faridur | 0.48±0.02C | 11.46±0.53C | 1.92±0.02B | 56.02±0.17B | 36.30±0.42B | 63.82±0.41A | 74.75±0.23A |
| Svevo HA | 0.72±0.02B | 12.80±0.38B | 6.82±0.01A | 57.16±0.23B | 31.23±0.33C | 38.29±0.45C | 60.73±0.24C |
| Chifaa | 6.03±0.02A | 14.27±0.35A | 1.86±0.02C | 45.20±0.28C | 32.67±0.47C | 25.63±0.24D | 53.78±0.13D |
Data are expressed as mean ±standard deviation, mean values in each column with different letters are significantly different (p≤0.05). Flour samples (wheat and barley a-d) and bandek samples (A- D) were evaluated separately. *Prepared from each wheat and barley variety. HI: hydrolysis index, pGI: in vitro predicted glycemic index.
Table 3.
Phenolic contents of Bandek samples.
| Free | Bound | Total** | ||
| Flour | Svevo | 218.30±1.55c | 221.99±2.16f | 440.29±0.71z |
| Faridur | 224.13±0.96b | 225.18±2.85ef | 449.30±3.47y | |
| Svevo HA | 221.67±1.05b | 223.30±3.07f | 444.97±3.12yz | |
| Chifaa | 244.70±0.98a | 230.02±1.33e | 474.71±0.37x | |
| Bandek* | Svevo | 230.74±0.88B | 254.78±1.06E | 485.52±0.98Y |
| Faridur | 243.52±1.23A | 254.08±1.78E | 497.60±0.60X | |
| Svevo HA | 231.18±1.82B | 253.13±1.80E | 484.30±2.26Y | |
| Chifaa | 246.47±1.87A | 255.25±2.02E | 501.72±3.51X |
Data are expressed as mean ±SD of triplicate measurements. Flour and Bandek samples were analyzed separately. Different letters within the same column indicate significant differences among flour samples for the same phenolic fraction (free, a–d; bound, e–h; total, x–t) and among Bandek samples for the corresponding fraction (free, A–D; bound, E–H; total, X–T), according to Tukey’s post hoc test (p < 0.05). *Prepared from each wheat and barley variety. **Total phenolic content calculated as the sum of free and bound fractions and expressed as mg gallic acid equivalents (GAE)/100 g dry weight (dw).
Table 4.
Antioxidant capacities (ABTS, FRAP, and DPPH) of Bandek samples.
| Samples | ABTS | FRAP | DPPH | ||
|---|---|---|---|---|---|
| Flour | Free | Svevo | 99.47±0.65c | 40.86±0.35c | 98.54±1.11c |
| Faridur | 105.08±0.51b | 47.49±1.20b | 103.86±1.14b | ||
| Svevo HA | 99.51±0.99c | 41.55±0.96c | 100.52±1.49bc | ||
| Chifaa | 210.74±0.34a | 135.76±0.61a | 220.71±1.50a | ||
| Bound | Svevo | 164.09±1.00f | 95.39±0.47h | 129.30±1.66h | |
| Faridur | 158.40±1.02g | 100.05±1.33g | 191.48±1.70f | ||
| Svevo HA | 165.86±0.99f | 104.64±0.53f | 175.90±1.08g | ||
| Chifaa | 233.02±2.03e | 141.73±0.74e | 226.13±2.26e | ||
| Total** | Svevo | 263.56±1.51y | 136.25±0.42z | 227.85±1.47t | |
| Faridur | 263.48±1.35y | 147.54±2.35y | 295.34±2.69y | ||
| Svevo HA | 265.38±1.97y | 146.19±1.43y | 276.42±2.55z | ||
| Chifaa | 443.76±1.69x | 277.49±0.14x | 446.84±1.99x | ||
| Bandek* | Free | Svevo | 138.60±0.47C | 95.86±0.55D | 149.13±1.04D |
| Faridur | 205.15±1.56B | 138.29±0.34B | 207.25±1.06B | ||
| Svevo HA | 139.06±1.14C | 126.16±1.35C | 185.98±1.61C | ||
| Chifaa | 228.64±3.21A | 146.18±1.11A | 221.69±2.06A | ||
| Bound | Svevo | 254.19±0.93G | 122.92±0.87H | 156.59±1.04H | |
| Faridur | 267.04±1.95F | 143.50±0.89F | 209.58±1.80F | ||
| Svevo HA | 271.62±2.38F | 129.77±0.45G | 188.79±1.05G | ||
| Chifaa | 282.97±3.11E | 148.98±0.44E | 241.61±2.10E | ||
| Total** | Svevo | 392.79±1.38T | 218.78±1.20T | 305.72±1.04T | |
| Faridur | 472.20±3.26Y | 281.78±0.56Y | 416.83±2.26Y | ||
| Svevo HA | 410.69±3.47Z | 255.94±0.90Z | 374.77±2.43Z | ||
| Chifaa | 511.60±0.53X | 295.16±1.10X | 463.30±3.78X |
Data are expressed as mean ±SD of triplicate measurements. Flour and Bandek samples were analyzed separately. Different letters within the same column indicate significant differences among flour samples for the same fraction (free, a–d; bound, e–h; total, x–t) and among Bandek samples for the same fraction (free, A–D; bound, E–H; total, X–T), according to Tukey’s post hoc test (p ≤ 0.05). *Prepared from each wheat and barley variety. ABTS: 2,2′-azino-bis (3-ethylbenzothiazoline-6-sulfonic acid); DPPH: 2,2-diphenyl-1-picrylhydrazyl radical scavenging activity; FRAP: ferric reducing antioxidant power. **Total antioxidant capacity calculated as the sum of free and bound fractions, expressed as mg TE/100 g dw.
Disclaimer/Publisher’s Note: The statements, opinions and data contained in all publications are solely those of the individual author(s) and contributor(s) and not of MDPI and/or the editor(s). MDPI and/or the editor(s) disclaim responsibility for any injury to people or property resulting from any ideas, methods, instructions or products referred to in the content. |
© 2026 by the authors. Licensee MDPI, Basel, Switzerland. This article is an open access article distributed under the terms and conditions of the Creative Commons Attribution (CC BY) license.
Copyright: This open access article is published under a Creative Commons CC BY 4.0 license, which permit the free download, distribution, and reuse, provided that the author and preprint are cited in any reuse.