
Submitted:
09 August 2026
Posted:
10 August 2026
You are already at the latest version
Abstract
Chronic low grade inflammation ("inflammaging") is epidemiologically linked to organ specific aging, but tissue resolved proteomic evidence remains limited. In this exploratory study, we used 4D DIA proteomics to profile heart, liver, spleen, and kidney from mice given chronic LPS (0.1 µg/day i.p., 2 months) with or without ibuprofen co treatment (0.02 mg/mL in drinking water). LPS exposure was associated with the most pronounced proteome changes in kidney (488 DEPs) and liver (293), followed by spleen (170) and heart (135). Intersecting LPS associated DEPs with the Aging Atlas database isolated aging annotated proteins; within this subset, ibuprofen co treatment corresponded to opposite direction changes in a tissue dependent manner: kidney (8/13, 61.5%), liver (4/9, 44.4%), spleen (1/8, 12.5%), and heart (0/5). Functional enrichment of these oppositely regulated aging annotated proteins revealed kidney specific enrichment in glucuronosyltransferase and oxidoreductase activities, and liver specific enrichment in iron ion binding and steroid hydroxylase activity. STRING networks showed a kidney specific interaction cluster centered on Jun and Sod2, whereas liver showed only a discrete Egfr–Gstp1 pair. Notably, aging related DEPs functioned as network hubs, directly connecting to approximately 50% of non aging DEPs in liver and 43% in kidney. Collectively, these exploratory findings identify tissue specific proteomic correlates within the aging annotated protein subset—particularly in kidney and liver—generating hypotheses for future validation in larger experimental cohorts.
Keywords:
ibuprofen
; LPS
; inflammaging
; proteomics
; aging
; mouse
; tissue specificity
1. Introduction
Chronic low-grade inflammation, termed “inflammaging”, is a hallmark of aging and is epidemiologically associated with progressive organ dysfunction and age-related diseases [1]. However, the relationship between sustained inflammation and tissue-specific molecular aging processes remains incompletely understood, partly due to the lack of systematic, multi-organ proteomic data that link inflammatory exposure to aging-related protein networks. Unlike acute inflammation, inflammaging is persistent and systemic but manifests with distinct organ-specific patterns [2,3]. For example, the kidney and liver, both highly metabolic organs, are particularly susceptible to inflammation-induced damage, while the heart and spleen exhibit different vulnerabilities [2,4,5]. Understanding tissue-specific molecular signatures of inflammaging is therefore critical for developing targeted anti-inflammatory interventions.
Lipopolysaccharide (LPS), a component of Gram-negative bacterial cell walls, is widely used to model chronic inflammation in mice[6]. Repeated low-dose LPS administration recapitulates key features of inflammaging, including elevated pro-inflammatory cytokines, oxidative stress, and accelerated cellular senescence [7,8]. However, most LPS studies focus on a single organ, and systematic proteomic comparisons across multiple organs under chronic LPS exposure are lacking[9]. Moreover, the impact of commonly used non-steroidal anti-inflammatory drugs (NSAIDs), such as ibuprofen, on the tissue-specific proteomic landscape of inflammaging remains largely unexplored[10].
Ibuprofen is a classical NSAID that inhibits cyclooxygenase (COX) enzymes and reduces prostaglandin synthesis. Emerging evidence suggests that ibuprofen may also modulate aging-related pathways, including telomere maintenance, NF-κB signaling, and oxidative stress responses[11]. However, whether ibuprofen-associated protein changes converge on aging-related pathways in a tissue-specific manner has not been systematically examined[12].
In this exploratory study, we employed 4D-DIA quantitative proteomics to characterize proteomic alterations associated with chronic LPS administration in mouse heart, liver, spleen, and kidney. Our analytical approach proceeded in two stages: first, we identified tissue-specific differentially expressed proteins (DEPs) in response to LPS; second, we intersected these DEPs with the Aging Atlas database to isolate the aging-annotated subset, to which all subsequent analyses were confined. Within this subset, our specific aims were: (1) to describe the tissue-specific distribution of aging-annotated DEPs following chronic LPS exposure; (2) to identify which of these aging-annotated DEPs showed opposite-direction changes with ibuprofen co-treatment, thereby generating hypotheses about potential modulation of inflammation-associated aging-related protein signatures; (3) to perform functional enrichment and protein–protein interaction network analyses on these oppositely-regulated proteins to explore coherent biological themes; and (4) to discuss the interpretative boundaries of these exploratory findings and their implications for future study design.
2. Materials and Methods
2.1. Animals and Treatment
All animal procedures were approved by the Institutional Animal Care and Use Committee of Panzhihua University (No. PD2024005) and conducted in accordance with the NIH Guide for the Care and Use of Laboratory Animals (8th edition) and the ARRIVE 2.0 guidelines. Eight-week-old male C57BL/6 mice (20–22 g) were obtained from Chengdu Dashuo Laboratory Animal Co., Ltd. and maintained under specific pathogen-free conditions (22 ± 2 °C, 50 ± 10% humidity, 12 h light/dark cycle) with ad libitum access to food and water. Male mice were used to minimize confounding effects of estrous cycle on inflammatory responses.
After one week of acclimation, mice were randomly assigned to three groups (n = 3 per group): (1) control (CK), receiving intraperitoneal (i.p.) injection of sterile saline (200 μL/mouse/day) for two months; (2) LPS, receiving i.p. injection of E. coli O55:B5 LPS (Beyotime) at 0.1 μg/mouse/day for two months; and (3) LPS+ibuprofen (LPS+IBU), receiving the same LPS regimen plus 0.02 mg/mL ibuprofen (Sangon Biotech) in drinking water ad libitum for two months. After treatment, all animals underwent a 10-day washout period. Mice were euthanized by cervical dislocation; heart, liver, spleen, and kidney were rapidly dissected, rinsed in ice-cold PBS, snap-frozen in liquid nitrogen, and stored at −80 °C.
2.2. Protein Extraction, Digestion, and Desalting
Frozen tissues (50 mg per sample, n = 3 per group per tissue) were pulverized under liquid nitrogen and lysed in 8 M urea containing 1 mM PMSF and 2 mM EDTA, followed by sonication on ice for 5 min. Lysates were clarified by centrifugation (15,000×g, 10 min, 4 °C), and supernatants were collected. Protein concentration was determined using a BCA assay kit.
For each sample, 100 μg of protein solution was adjusted to 200 μL with 8 M urea, reduced with DTT at a final concentration of 5 mM (37 °C, 45 min), and alkylated with iodoacetamide at a final concentration of 11 mM in the dark at room temperature for 15 min. Subsequently, 800 μL of 25 mM ammonium bicarbonate solution and 2 μL of trypsin (Promega, V5280) were added, and digestion was performed overnight at 37 °C. The pH of the digested peptides was adjusted to 2–3 using 20% trifluoroacetic acid, followed by desalting with C18 resin (Millipore, Billerica, MA, USA). Peptide concentration was determined using a Pierce™ Quantitative Peptide Assay Kit with standards (Thermo Fisher Scientific).
2.3. LC–MS/MS Analysis
Liquid chromatography was performed on a nanoElute UHPLC system (Bruker Daltonics, Germany). Approximately 200 ng of peptides were separated within 20 min at a flow rate of 0.5 μL/min on a reversed-phase C18 column with an integrated CaptiveSpray Emitter (15 cm × 75 μm × 1.6 μm, Aurora Series with CSI, IonOpticks, Australia). The separation temperature was maintained at 50 °C using an integrated Toaster column oven. Mobile phase A was 0.1% (v/v) formic acid in water, and mobile phase B was 0.1% formic acid in acetonitrile. The gradient was: 5–25% B over 17 min, 25–40% B over 1 min, 40–95% B over 1 min, and hold at 95% B for 1 min.
The LC system was coupled online to a hybrid timsTOF Pro2 mass spectrometer (Bruker Daltonics, Germany) via a CaptiveSpray nano-electrospray ion source. The instrument was operated in data-independent parallel accumulation–serial fragmentation (diaPASEF) mode with 4 PASEF MS/MS frames per complete cycle. The capillary voltage was set to 1500 V. MS and MS/MS spectra were acquired over a mass-to-charge ratio range of 100–1700 m/z. Ion mobility (1/K₀) range was 0.85–1.3 V·s/cm². The target value was set to 10,000 with an intensity threshold of 1500, and the charge state range was 0–5. Collision energy was ramped linearly as a function of mobility from 27 eV at 1/K₀ = 0.85 V·s/cm² to 45 eV at 1/K₀ = 1.3 V·s/cm². Quadrupole isolation width was set to 2 Th for m/z < 700 and 3 Th for m/z > 800. The mass spectrometry proteomics data have been deposited to the PRIDE repository with identifier PXD076199.
2.4. Data Processing and Differential Expression Analysis
Raw DIA data were processed using DIA-NN (v1.8.1) in library-free mode against the UniProt mouse proteome database (UP000000589, 54,910 sequences). The match between runs (MBR) option was enabled to create a spectral library from DIA data using deep learning-based neural network algorithms, followed by re-analysis using this library. False discovery rate was controlled at <1% at both peptide and protein levels. Quantification was normalized to the CK group by median normalization. Differentially expressed proteins (DEPs) were defined as |FC| ≥ 1.5 and adjusted P ≤ 0.05 (two-tailed t-test with Benjamini–Hochberg correction). PCA and sample correlation heatmaps were generated using Python (pandas v2.0.3, seaborn v0.12.2, matplotlib v3.7.1).
2.5. Annotation of Aging-Related Proteins and Reversal Classification
Aging-related DEPs were identified by intersecting LPS-induced DEPs with the Aging Atlas database (NGDC). Proteins showing opposite-direction changes between LPS vs. CK and LPS+IBU vs. LPS were considered reversible candidates. Reversal strength was calculated as: |log₂(FCLPS+IBU vs. LPS) − log₂(FCLPS vs. CK)|. Based on statistical significance and fold change, reversal was categorized as: (i) complete—LPS-induced change abolished in LPS+IBU vs. CK (|FC| < 1.5 or adjusted P > 0.05) with opposite direction in LPS+IBU vs. LPS; (ii) partial—significant change remained but effect size reduced; or (iii) none. Only strictly reversible DEPs (complete reversal) were used for functional enrichment and network analyses.
2.6. Functional Enrichment and Protein–Protein Interaction Network Analysis
Gene Ontology molecular function and KEGG pathway enrichment were performed on strictly reversible aging-annotated DEPs using clusterProfiler (R v4.3.1), with significance set at adjusted P < 0.05 (Fisher’s exact test, Benjamini–Hochberg). Tissues with <3 reversible proteins (spleen, heart) were excluded. Tissue-specific core protein–protein interaction networks were constructed using aging-related DEPs as seed nodes and their first-degree interacting partners among non-aging DEPs from STRING (v11.5, confidence score ≥ 0.4). Network topology metrics were calculated using NetworkX (v3.0) and igraph (v0.10.4) in Python. Network visualizations were generated using matplotlib (v3.7.1) and seaborn (v0.12.2).
2.7. Statistical Analysis
Data are presented as mean ± SEM (n = 3). Normality was assessed by Shapiro–Wilk test. Two-group comparisons used two-tailed unpaired t-tests with Benjamini–Hochberg correction; multiple comparisons used one-way ANOVA with Tukey’s post hoc test. Significance was set at adjusted P ≤ 0.05. Analyses were performed using Python (v3.10) with packages including pandas (v2.0.3), numpy (v1.24.3), scipy (v1.10.1), and statsmodels (v0.14.0), as well as R v4.3.1 for enrichment analysis. GraphPad Prism 9.0 was used for supplementary visualization.
3. Results
3.1. Experimental Design, Quality Control, and Global Proteome Alterations
Mice were randomly assigned to three groups (n = 3/group): control (CK, saline i.p.), LPS (0.1 µg/mouse/day i.p.), and LPS+ibuprofen (LPS+IBU, same LPS plus 0.02 mg/mL ibuprofen in drinking water). After two months of treatment followed by a 10-day washout, heart, liver, spleen, and kidney were collected for 4D-DIA proteomics (Figure 1A; volcano plots in Supplementary Figure A1).
PCA of all detected proteins was performed separately for each tissue (Figure 1B). The first two principal components cumulatively explained 31.2%–43.9% of total variance across tissues (Heart: 31.2%, Spleen: 36.0%, Liver: 36.1%, Kidney: 43.9%). Kidney exhibited the clearest group discrimination, with CK, LPS, and LPS+IBU clusters distinctly separated. Liver showed LPS and LPS+IBU groups deviating from CK along PC1, though with partial overlap. Spleen and Heart displayed more modest separation, with treatment groups largely overlapping. In all tissues, LPS+IBU did not fully revert to the CK state, indicating partial rather than complete normalization at the global proteome level. 95% confidence ellipses indicated moderate intra-group variability.
LPS-induced DEPs (LPS vs. CK) were defined as |FC| ≥ 1.5 and adjusted P ≤ 0.05 (Figure 1C). Kidney showed the most alterations (488 DEPs: 263 up, 225 down), followed by Liver (293: 194 up, 99 down), Spleen (170: 73 up, 97 down), and Heart (135: 59 up, 76 down). Liver and kidney were predominantly upregulated, while heart and spleen had slightly more downregulated proteins.
Sample-wise correlation analysis (Figure 1D) revealed high intra-group correlations (r > 0.99 across replicates), confirming excellent reproducibility. Inter-group patterns exhibited tissue-specific differences. Liver and kidney showed the most distinct separation between CK and LPS-treated groups (r = 0.955–0.997), with ibuprofen co-treatment partially restoring correlation toward CK levels (r = 0.952–0.995). In contrast, spleen and heart displayed consistently high correlations across all groups (r > 0.96 and r > 0.97, respectively), indicating weaker proteomic responses to LPS in these tissues.
3.2. Tissue-Specific Responses of Aging-Related Proteins
LPS-induced DEPs were mapped to the Aging Atlas database (Figure 2A). Kidney had the highest absolute counts of aging-related DEPs (7 up, 6 down; 1.43% and 1.23% of kidney DEPs). Liver ranked second (4 up, 5 down; 1.37% and 1.71%). Spleen had 3 up, 5 down (1.76%, 2.94%). Heart had the fewest (1 up, 4 down; 0.74%, 2.96%). The highest proportions of aging-related downregulated DEPs occurred in heart (2.96%) and spleen (2.94%).
Overlap analysis (Figure 2B) showed that kidney harbored the most tissue-specific aging-related DEPs (n = 13), followed by liver (9), spleen (8), and heart (5). Only one DEP was shared between spleen and kidney; none were common to three or four tissues, indicating high tissue specificity.
Heatmap analysis (Figure 2C) revealed tissue-specific expression patterns of aging-related DEPs. In spleen (16 genes), Mtco1 was the only protein exhibiting LPS-induced upregulation reversed by ibuprofen. Kidney displayed the most extensive reversal events (25 genes, 8 with * markers: Adh1, Adipoq, Blm, Cat, Gsta4, Jun, Sirt3, Sod2). Liver (22 genes) also showed reversible proteins (Aldh1b1, Egfr, Gstp1, Pycr1), though fewer than kidney. Heart (16 genes) contained no reversal-marked proteins. Opposite-direction change patterns were further classified as complete, partial, or none in Supplementary Figure A2.
Figure 2D quantifies aging-annotated DEPs showing opposite-direction changes with ibuprofen: kidney (n = 8), liver (n = 4), spleen (n = 1), and heart (n = 0). Reversal strength varied widely. Jun (kidney, strength = 5.09) showed the strongest effect among normally computed proteins, followed by Pycr1 (liver, strength = 7.64, calculated with baseline substitution due to zero values in both CK and IBU groups), Gstp1 (liver, 3.68), Egfr (liver, 3.56), Gsta4 (kidney, 3.12), and others ranging from 1.22 to 2.52.
We compared the proportion of reversible DEPs among aging-related versus total DEPs (Figure 2E). Across four tissues, 13 of 35 aging-related DEPs (37.1%) exhibited reversible regulation, compared to 462 of 1,624 total DEPs (28.4%). Kidney showed the highest reversibility (61.5%, 8/13), markedly exceeding its total DEP reversibility (38.2%). Liver also displayed elevated reversibility (44.4%, 4/9) relative to its total DEP pool (28.2%). In contrast, none of the 5 aging-related DEPs in heart were reversible (0%), while spleen showed comparable reversibility between aging-related (12.5%, 1/8) and total DEPs (14.7%).
3.3. Functional Enrichment of Strictly Reversible Aging-Annotated DEPs
We performed GO molecular function and KEGG pathway enrichment on strictly reversible aging-annotated DEPs (FDR < 0.05; Figure 3).
GO molecular function enrichment (Figure 3A) revealed kidney as the most extensively enriched tissue (39 significant terms). Top terms included glucuronosyltransferase activity (9 genes, Fold Enrichment = 6.50, P = 2.34 × 10⁻⁶), butyrate-CoA ligase activity (5 genes, Fold Enrichment = 10.83, P = 1.50 × 10⁻⁵), and multiple oxidoreductase activities. Liver showed 25 significant terms, dominated by iron ion binding (17 genes, Fold Enrichment = 6.34, P = 6.59 × 10⁻¹⁰), steroid hydroxylase activity (11 genes, Fold Enrichment = 11.11, P = 8.08 × 10⁻¹⁰), and oxidoreductase activities (10 genes, Fold Enrichment = 9.33, P = 3.81 × 10⁻⁸). Spleen and heart each yielded 2 significant terms, both enriched in serine-type endopeptidase inhibitor activity (spleen: 7 genes, Fold Enrichment = 34.11, P = 9.39 × 10⁻¹⁰; heart: 6 genes, Fold Enrichment = 35.47, P = 1.34 × 10⁻⁸).
KEGG pathway enrichment (Figure 3B) mirrored this tissue specificity. Kidney had the most extensive enrichment (39 pathways), led by Metabolic pathways (100 genes, Fold Enrichment = 2.14, P = 1.60 × 10⁻¹³), Steroid hormone biosynthesis (19 genes, Fold Enrichment = 5.69, P = 2.50 × 10⁻¹⁰), and Metabolism of xenobiotics by cytochrome P450 (15 genes, Fold Enrichment = 5.67, P = 2.10 × 10⁻⁸). Liver showed 20 significant pathways, most prominently Steroid hormone biosynthesis (17 genes, Fold Enrichment = 10.15, P = 3.21 × 10⁻¹³) and Retinol metabolism (16 genes, Fold Enrichment = 10.45, P = 9.68 × 10⁻¹³). Spleen exhibited 2 significant pathways: Complement and coagulation cascades (5 genes, Fold Enrichment = 36.82, P = 2.17 × 10⁻⁷) and Systemic lupus erythematosus (3 genes, Fold Enrichment = 21.53, P = 3.58 × 10⁻⁴). Heart had 1 significant pathway—Complement and coagulation cascades (3 genes, Fold Enrichment = 21.65, P = 3.52 × 10⁻⁴).
Pathway overlap analysis across tissues (Figure 3C; Supplementary Table A1) identified 148 unique KEGG pathways enriched across the four tissues. Ten pathways were shared by all four tissues, including Complement and coagulation cascades (combined −log₁₀ P = 10.62), Metabolic pathways (combined −log₁₀ P = 12.80), Peroxisome (combined −log₁₀ P = 6.06), Systemic lupus erythematosus (combined −log₁₀ P = 3.60), and Regulation of actin cytoskeleton (combined −log₁₀ P = 0.04). Kidney and liver shared the highest number of pathways (129), followed by kidney–heart (36), kidney–spleen (32), liver–heart (30), liver–spleen (27), and heart–spleen (12). The most highly significant shared pathways (combined −log₁₀ P > 5) included Steroid hormone biosynthesis, Drug metabolism – cytochrome P450, Metabolism of xenobiotics by cytochrome P450, Complement and coagulation cascades, and Bile secretion. Kidney participated in the largest number of shared pathways (142 total), followed by liver (131), heart (38), and spleen (33).
3.4. Aging-Related Core PPI Networks and Integration with Non-Aging DEPs
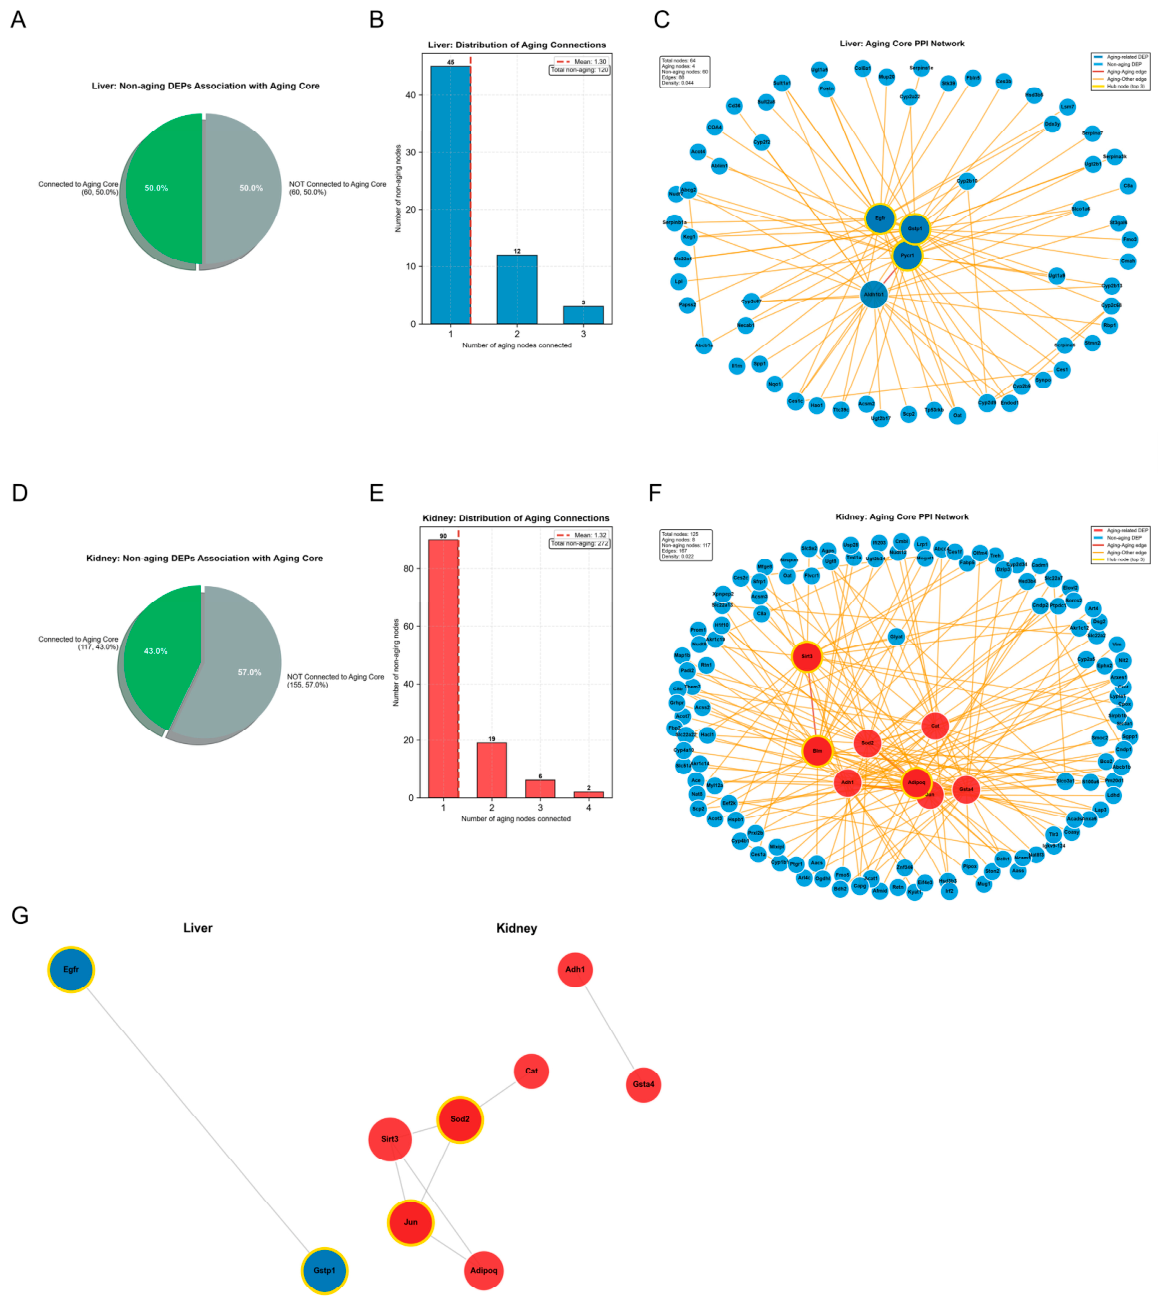
We constructed tissue-specific core PPI networks consisting of aging-related DEPs as seed nodes and their directly connected non-aging DEP neighbors (STRING confidence ≥ 0.4), focusing on liver and kidney (Figure 4; Supplementary Table A2).
The liver network comprised 4 aging-related DEPs (Pycr1, Egfr, Gstp1, Aldh1b1), all serving as hub nodes with a degree of 20 each. The network contained 64 total nodes and 88 edges (density = 0.0437). Among 120 non-aging DEPs, 60 (50.0%) were directly connected to the aging core (Figure 4A). Most non-aging nodes connected to 1–3 aging nodes (mean = 1.32 connections per connected non-aging node; Figure 4B).
The kidney network consisted of 8 aging-related DEPs (Sod2, Blm, Adh1, Jun, Cat, Gsta4, Adipoq, Sirt3) and 125 total nodes with 167 edges (density = 0.0215). Among 272 non-aging DEPs, 117 (43.0%) were connected to the aging core (Figure 4C). The mean was 1.38 aging connections per connected non-aging node, with a maximum of 4 (Figure 4D). Sod2, Cat, and Sirt3 exhibited high connectivity, forming a densely interconnected core.
Within strictly reversible aging-related DEPs, STRING analysis revealed that kidney formed an extensive eight-node network connecting Sod2, Cat, Sirt3, Jun, Adipoq, Adh1, and Gsta4, with hub proteins including Sod2 (interacting with Cat, Sirt3, and Jun) and Sirt3 (connecting to Jun and Adipoq; Figure 4E). In contrast, the liver network showed only a single interaction (Egfr–Gstp1, score = 0.664). MCODE analysis resolved the kidney network into three functional modules: a FoxO signaling module (Sod2, Cat), a NAFLD-associated module (Jun, Sirt3, Adipoq), and a xenobiotic metabolism module (Adh1, Gsta4; Supplementary Figure A3).
Across both tissues, aging-related DEPs consistently demonstrated hub-like properties. The proportion of non-aging DEPs associated with the aging core was higher in liver (50.0%) than in kidney (43.0%), suggesting tissue-specific differences in network integration.
4. Discussion
In this exploratory proteomic study, we characterized tissue-specific protein signatures associated with chronic low-grade LPS exposure and examined whether ibuprofen co-treatment corresponded to opposite-direction changes within aging-annotated protein subsets. Our descriptive findings are threefold. First, chronic LPS elicited pronounced tissue-specific proteomic remodeling, with kidney showing the most extensive alterations (488 DEPs), followed by liver (293), spleen (170), and heart (135). Second, ibuprofen co-treatment was associated with opposite-direction changes in a tissue-dependent manner—most prominently in kidney (61.5% of aging-related DEPs) and liver (44.4%), but minimally in spleen (12.5%) and none in heart (0%). Third, oppositely-regulated aging-annotated proteins in kidney formed interconnected networks resolvable into three functional modules—FoxO signaling (Sod2, Cat), inflammation-metabolic crosstalk (Jun, Sirt3, Adipoq), and xenobiotic metabolism (Adh1, Gsta4)—whereas liver showed only a discrete Egfr–Gstp1 interaction. Notably, aging-related DEPs consistently occupied hub positions, connecting to 43–50% of all non-aging DEPs in liver and kidney, suggesting they may serve as network organizers through which inflammatory signals propagate into broader proteomic landscapes. Given the exploratory nature and small sample size (n = 3/group), these findings are hypothesis-generating rather than confirmatory; they provide a prioritized set of proteins and modules for targeted mechanistic validation.
Tissue-specific vulnerability to chronic LPS. The observation that kidney exhibited the most extensive LPS-associated proteomic changes aligns with its high metabolic demand, substantial mitochondrial content, and sensitivity to oxidative stress[13]. Liver, as the primary site of systemic detoxification and acute-phase response, also showed marked remodeling[14]. In contrast, heart and spleen displayed fewer DEPs, possibly reflecting lower TLR4 dependence or distinct LPS signaling kinetics[15,16]. This pattern supports the concept that inflammaging manifests in a tissue-specific manner, with organs of high intrinsic metabolic activity being more susceptible to inflammation-associated proteome remodeling[9]. Importantly, the sub-septic LPS dose used here (0.1 µg/day for two months) models low-grade endotoxemia relevant to human inflammaging, suggesting that even modest inflammatory stimuli are sufficient to elicit aging-overlapping proteomic signatures[17].
Selective modulation of aging-annotated proteins by ibuprofen. The tissue-dependent distribution of opposite-direction changes—concentrated in kidney and liver, virtually absent in heart—argues against non-specific drug effects. If ibuprofen acted globally, a far higher proportion of DEPs would have shown changes. Instead, the selective pattern is consistent with the hypothesis that ibuprofen's anti-inflammatory action may preferentially modulate a subset of aging-associated proteins. The 10-day washout period further minimizes the likelihood of direct drug-protein interactions, suggesting that observed changes reflect sustained biological modulation rather than transient occupancy. Among the identified proteins, Jun—a core AP-1 component and master regulator of inflammaging[18]—showed the strongest directional discordance in kidney (strength = 5.09). Pycr1, a mitochondrial proline synthesis enzyme linked to cellular senescence[19], showed the largest effect in liver (strength = 7.64). These observations prioritize Jun and Pycr1 as candidates for future loss-of-function studies in tissue-specific models.
Functional convergence on redox and metabolic pathways. Enrichment analyses of oppositely-regulated aging-annotated proteins revealed tissue-specific functional themes: kidney was enriched for glucuronosyltransferase and oxidoreductase activities, whereas liver showed enrichment for iron ion binding and steroid hydroxylase activity. Notably, both tissues converged on reactive oxygen species (ROS)-related pathways, consistent with oxidative stress as a core driver of inflammaging[20]. The kidney-specific enrichment of metabolic pathways and peroxisome further implicates organelle-level redox regulation[21]. This convergence across tissues suggests that ibuprofen-associated opposite-direction changes may operate through common redox-sensitive nodes, although the upstream regulatory mechanisms (e.g., NRF2, FOXO, or NF-κB) remain to be defined.
Modular network architecture in kidney. STRING analysis revealed that kidney's reversibly-regulated aging proteins form an interconnected network, whereas liver's did not. The kidney network comprised 8 nodes and 167 edges, resolvable into three modules by MCODE. The FoxO module (Sod2, Cat) represents coordinated antioxidant defense; FoxO transcription factors are established regulators of both enzymes[20]. The inflammation-metabolic module (Jun, Sirt3, Adipoq) links AP-1-driven inflammation (Jun), mitochondrial deacetylation (Sirt3), and anti-inflammatory adipokine signaling (Adipoq)—three independently recognized aging hallmarks[22]. The xenobiotic module (Adh1, Gsta4) reflects detoxification capacity against lipid peroxidation products [23]. The edges connecting Sod2–Sirt3 (score = 0.949) and Jun–Sirt3 (score = 0.448) suggest cross-talk between modules, forming an integrated redox-inflammatory-metabolic hub. This modular architecture in kidney—but not liver—may explain why kidney exhibited more abundant opposite-direction changes; tissues with more interconnected aging-annotated networks may be more responsive to pharmacological modulation.
Aging-related DEPs as network hubs. Beyond internal module organization, aging-related DEPs—regardless of reversibility status—consistently occupied hub positions, connecting to approximately half of all non-aging DEPs in both liver (50%) and kidney (43%). This topology indicates that aging-annotated proteins are not functionally isolated but centrally positioned to coordinate broader proteomic responses. The dissociation between internal module density (high in kidney, low in liver) and external network reach (slightly higher in liver) suggests tissue-specific principles of network organization: in liver, a smaller hub set may exert wide influence, whereas in kidney, multiple interconnected hubs form a more resilient but modularly partitioned network. This architecture generates the testable hypothesis that aging-related proteins serve as sensitive nodes through which inflammatory stimuli and pharmacological interventions propagate into the wider proteomic landscape[24,25]—a concept warranting targeted perturbation experiments (e.g., conditional knockout of Jun or Sod2) combined with longitudinal proteomic monitoring.
Interpretative boundaries and study limitations. Several factors preclude causal inference. First, the small sample size (n = 3) increases the risk of both false positives and false negatives; proportions of opposite-direction changes should be considered preliminary estimates. Second, the concurrent administration of LPS and ibuprofen (followed by a 10-day washout) does not represent a sequential "exposure-then-reversal" design; observed associations reflect concurrent modulation rather than causal reversal. Third, only male mice were used, limiting generalizability given known sex differences in inflammation and drug metabolism. Fourth, a single post-washout time point was examined; dynamic trajectories during and immediately after treatment were not captured. Fifth, no functional validation (e.g., gene knockdown or pharmacological inhibition of Jun, Sod2, or Sirt3) was performed; all inferred roles remain correlative. Sixth, reliance on a single aging database (Aging Atlas) may have excluded as-yet-unannotated aging-relevant proteins, potentially underestimating the number of affected proteins. Finally, the fixed ibuprofen dose precludes assessment of dose-response relationships.
5. Conclusions
In this exploratory dataset, chronic LPS was associated with tissue-specific proteomic changes, and ibuprofen co-treatment corresponded to opposite-direction changes in a subset of aging-annotated proteins—most prominently in kidney, where they formed interconnected modules linked to redox regulation, inflammation-metabolic crosstalk, and xenobiotic metabolism. Aging-related DEPs occupied hub positions, connecting to a substantial fraction of non-aging DEPs. These findings provide a prioritized candidate list—centered on Jun, Sod2, Sirt3, and Adipoq in kidney—for future hypothesis-driven mechanistic studies. However, due to the correlative nature and small sample size, no causal conclusions can be drawn. Independent validation in larger cohorts, combined with targeted functional perturbations, is required before any mechanistic or translational inference can be made.
Supplementary Materials
The following supporting information can be downloaded at the website of this paper posted on Preprints.org: Figure A1: Volcano plots of LPS vs. CK in heart, liver, spleen, and kidney; Figure A2: Scatter plot of opposite-direction changes classified as complete, partial, or none; Figure A3: MCODE analysis of the kidney reversible aging-related protein network; Table A1: Complete list of significantly enriched KEGG pathways shared across tissues; Table A2: Tissue-specific core PPI network node and edge lists.
Author Contributions
Conceptualization, J.Z.; methodology, J.Z.; software, J.Z.; validation, X.W., X.L. and W.H.; formal analysis, J.Z.; investigation, X.W., X.L. and W.H.; resources, J.Z.; data curation, X.W. and W.H.; writing—original draft preparation, J.Z.; writing—review and editing, J.Z. and X.W.; visualization, J.Z.; supervision, J.Z.; project administration, J.Z.; funding acquisition, J.Z. All authors have read and agreed to the published version of the manuscript.
Funding
This research was funded by the Panzhihua Science and Technology Program Project (Grant No. 2024ZDS118) and the National College Students Innovation and Entrepreneurship Training Program (Grant No. 202411360015).
Institutional Review Board Statement
The animal study protocol was approved by the Institutional Animal Care and Use Committee (IACUC) of Panzhihua University (protocol code PD2024005, 15 March 2024).
Informed Consent Statement: Not applicable. This study did not involve human subjects.
Data Availability Statement: The mass spectrometry proteomics data have been deposited in the PRIDE repository with the dataset identifier PXD076199 and are publicly available. The Python scripts used for data processing, statistical analysis, and figure generation are available from the corresponding author upon reasonable request.
Conflicts of Interest
The authors declare no conflicts of interest.
Acknowledgments
The authors thank the Proteomics Platform of Sangon Biotech (Shanghai) Co., Ltd. for technical support.
Abbreviations
The following abbreviations are used in this manuscript:
| BCA | Bicinchoninic Acid |
| CK | Control Group (saline-treated) |
| COX | Cyclooxygenase |
| DEPs | Differentially Expressed Proteins |
| DIA | Data-Independent Acquisition |
| DTT | Dithiothreitol |
| EDTA | Ethylenediaminetetraacetic Acid |
| FDR | False Discovery Rate |
| FC | Fold Change |
| GO | Gene Ontology |
| IACUC | Institutional Animal Care and Use Committee |
| IBU | Ibuprofen |
| i.p. | Intraperitoneal |
| KEGG | Kyoto Encyclopedia of Genes and Genomes |
| LPS | Lipopolysaccharide |
| MCODE | Molecular Complex Detection |
| MS | Mass Spectrometry |
| NAFLD | Non-Alcoholic Fatty Liver Disease |
| NF-κB | Nuclear Factor Kappa B |
| NIH | National Institutes of Health |
| NSAIDs | Non-Steroidal Anti-Inflammatory Drugs |
| PC | Principal Component |
| PCA | Principal Component Analysis |
| PMSF | Phenylmethylsulfonyl Fluoride |
| PPI | Protein-Protein Interaction |
| PRIDE | Proteomics Identifications Database |
| ROS | Reactive Oxygen Species |
| SPF | Specific Pathogen-Free |
| STRING | Search Tool for Retrieval of Interacting Genes/Proteins |
| TLR4 | Toll-Like Receptor 4 |
References
- Li, X.; Li, C.; Zhang, W.; Wang, Y.; Qian, P.; Huang, H. Inflammation and Aging: Signaling Pathways and Interven-tion Therapies. Sig Transduct. Target Ther. 2023, 8, 239. [Google Scholar] [CrossRef] [PubMed]
- Yu, X.; Wang, Y.; Song, Y.; Gao, X.; Deng, H. AP -1 Is a Regulatory Transcription Factor of Inflammaging in the Mu-rine Kidney and Liver. Aging Cell 2023, 22, e13858. [Google Scholar] [CrossRef] [PubMed]
- Talley, S.; Nguyen, T.; Van Ye, L.; Valiauga, R.; DeCarlo, J.; Mustafa, J.; Cook, B.; White, F.A.; Campbell, E.M. Char-acterization of Age-Associated Inflammasome Activation Reveals Tissue Specific Differences in Transcriptional and Post-Translational Inflammatory Responses. Immun. Ageing 2024, 21, 60. [Google Scholar] [CrossRef] [PubMed]
- Róka, B.; Tod, P.; Kaucsár, T.; Vizovišek, M.; Vidmar, R.; Turk, B.; Fonović, M.; Szénási, G.; Hamar, P. The Acute Phase Response Is a Prominent Renal Proteome Change in Sepsis in Mice. IJMS 2019, 21, 200. [Google Scholar] [CrossRef] [PubMed]
- Arya, P.; Sharma, V.; Singh, P.; Thapliyal, S.; Sharma, M. Bacterial Endotoxin-Lipopolysaccharide Role in Inflam-matory Diseases: An Overview. Iran. J. Basic Med. Sci. 2025, 28. [Google Scholar] [CrossRef] [PubMed]
- Liu, Y.; Zeng, Y.; Liu, Y.; Wang, X.; Chen, Y.; Lepp, D.; Tsao, R.; Sadakiyo, T.; Zhang, H.; Mine, Y. Regulatory Effect of Isomaltodextrin on a High-Fat Diet Mouse Model with LPS-Induced Low-Grade Chronic Inflammation. J. Agric. Food Chem. 2022, 70, 11258–11273. [Google Scholar] [CrossRef] [PubMed]
- Mytych, J.; Romerowicz-Misielak, M.; Koziorowski, M. Long-Term Culture with Lipopolysaccharide Induces Dose-Dependent Cytostatic and Cytotoxic Effects in THP-1 Monocytes. Toxicol. Vitr. 2017, 42, 1–9. [Google Scholar] [CrossRef] [PubMed]
- Merk, D.; Cox, F.F.; Jakobs, P.; Prömel, S.; Altschmied, J.; Haendeler, J. Dose-Dependent Effects of Lipopolysaccha-ride on the Endothelium—Sepsis versus Metabolic Endotoxemia-Induced Cellular Senescence. Antioxidants 2024, 13, 443. [Google Scholar] [CrossRef] [PubMed]
- Noh, J.Y.; Han, H.W.; Kim, D.M.; Giles, E.D.; Farnell, Y.Z.; Wright, G.A.; Sun, Y. Innate Immunity in Peripheral Tis-sues Is Differentially Impaired under Normal and Endotoxic Conditions in Aging. Front. Immunol. 2024, 15, 1357444. [Google Scholar] [CrossRef] [PubMed]
- Parikh, S.V.; Madhavan, S.; Shapiro, J.; Knight, R.; Rosenberg, A.Z.; Parikh, C.R.; Rovin, B.; Menez, S. for the Kidney Precision Medicine Project Characterization of Glomerular and Tubulointerstitial Proteomes in a Case of Nonsteroidal Anti-Inflammatory Drug–Attributed Acute Kidney Injury: A Clinical Pathologic Molecular Correlation. CJASN 2023, 18, 402–410. [Google Scholar] [CrossRef] [PubMed]
- Matsuura, K.; Otani, M.; Takano, M.; Kadoyama, K.; Matsuyama, S. The Influence of Chronic Ibuprofen Treatment on Proteins Expressed in the Mouse Hippocampus. Eur. J. Pharmacol. 2015, 752, 61–68. [Google Scholar] [CrossRef] [PubMed]
- Tiwari, S.; Mishra, M.; Salemi, M.R.; Phinney, B.S.; Newens, J.L.; Gomes, A.V. Gender-Specific Changes in Energy Metabolism and Protein Degradation as Major Pathways Affected in Livers of Mice Treated with Ibuprofen. Sci. Rep. 2020, 10, 3386. [Google Scholar] [CrossRef] [PubMed]
- Liang, N.-N.; Zhao, Y.; Guo, Y.-Y.; Zhang, Z.-H.; Gao, L.; Yu, D.-X.; Xu, D.-X.; Xu, S. Mitochondria-Derived Reactive Oxygen Species Are Involved in Renal Cell Ferroptosis during Lipopolysaccharide-Induced Acute Kidney Injury. Inter-Natl. Immunopharmacol. 2022, 107, 108687. [Google Scholar] [CrossRef] [PubMed]
- Liu, T.; Tang, X.; Cui, Y.; Xiong, X.; Xu, Y.; Hu, S.; Feng, S.; Shao, L.; Ren, Y.; Miao, H.; et al. Fibroblast Growth Factor 19 Improves LPS-Induced Lipid Disorder and Organ Injury by Regulating Metabolomic Characteristics in Mice. Oxida-Tive Med. Cell. Longev. 2022, 2022, 9673512. [Google Scholar] [CrossRef] [PubMed]
- Lin, P.; Tong, X.; Xue, F.; Qianru, C.; Xinyu, T.; Zhe, L.; Zhikun, B.; Shu, L. Polystyrene Nanoplastics Exacerbate Lipopolysaccharide-Induced Myocardial Fibrosis and Autophagy in Mice via ROS/TGF-Β1/Smad. Toxicology 2022, 480, 153338. [Google Scholar] [CrossRef] [PubMed]
- Wang, T.; Zhang, M.; Wang, J.; Zhang, H.; Zhang, J.; Zou, J.; Wang, J.; Teng, Y.; Liu, G.; Yan, S.; et al. Severe Hy-peroxia during VA-ECMO Promotes Oxidative Stress and Multi-Organ Injury in an Experimental Rat Model of Septic Cardiomyopathy. J. Transl. Med. 2026, 24, 932. [Google Scholar] [CrossRef] [PubMed]
- Zhang, D.; Ji, P.; Sun, R.; Zhou, H.; Huang, L.; Kong, L.; Li, W.; Li, W. Ginsenoside Rg1 Attenuates LPS-Induced Chronic Renal Injury by Inhibiting NOX4-NLRP3 Signaling in Mice. Biomed. Pharmacother. 2022, 150, 112936. [Google Scholar] [CrossRef] [PubMed]
- Rorato, R.; Borges, B.D.C.; Uchoa, E.T.; Antunes-Rodrigues, J.; Elias, C.F.; Elias, L.L.K. LPS-Induced Low-Grade In-flammation Increases Hypothalamic JNK Expression and Causes Central Insulin Resistance Irrespective of Body Weight Changes. IJMS 2017, 18, 1431. [Google Scholar] [CrossRef] [PubMed]
- Liang, S.-T.; Audira, G.; Juniardi, S.; Chen, J.-R.; Lai, Y.-H.; Du, Z.-C.; Lin, D.-S.; Hsiao, C.-D. Zebrafish Carrying Pycr1 Gene Deficiency Display Aging and Multiple Behavioral Abnormalities. Cells 2019, 8, 453. [Google Scholar] [CrossRef] [PubMed]
- Chaudhary, M.R.; Chaudhary, S.; Sharma, Y.; Singh, T.A.; Mishra, A.K.; Sharma, S.; Mehdi, M.M. Aging, Oxidative Stress and Degenerative Diseases: Mechanisms, Complications and Emerging Therapeutic Strategies. Biogerontology 2023, 24, 609–662. [Google Scholar] [CrossRef] [PubMed]
- Ho, H.-J.; Shirakawa, H. Oxidative Stress and Mitochondrial Dysfunction in Chronic Kidney Disease. Cells 2022, 12, 88. [Google Scholar] [CrossRef] [PubMed]
- Motonari, H.; Hayashi, A.; Tanaka, Y.; Nakamura, Y.; Hisaoka-Nakashima, K.; Morioka, N. Mitochondrial Dys-function Exacerbates Inflammatory Responses via the JNK/P38-AP-1 Pathway in Primary Cultured Chondrocytes. Inter-Natl. Immunopharmacol. 2025, 165, 115433. [Google Scholar] [CrossRef] [PubMed]
- Singhal, S.S.; Singh, S.P.; Singhal, P.; Horne, D.; Singhal, J.; Awasthi, S. Antioxidant Role of Glutathione S-Transferases: 4-Hydroxynonenal, a Key Molecule in Stress-Mediated Signaling. Toxicol. Appl. Pharmacol. 2015, 289, 361–370. [Google Scholar] [CrossRef] [PubMed]
- Lee, H.-Y.; Jeon, Y.; Kim, Y.K.; Jang, J.Y.; Cho, Y.S.; Bhak, J.; Cho, K.-H. Identifying Molecular Targets for Reverse Aging Using Integrated Network Analysis of Transcriptomic and Epigenomic Changes during Aging. Sci. Rep. 2021, 11, 12317. [Google Scholar] [CrossRef] [PubMed]
- Mosharaf, M.P.; Alam, K.; Gow, J.; Mahumud, R.A. Exploration of Key Drug Target Proteins Highlighting Their Related Regulatory Molecules, Functional Pathways and Drug Candidates Associated with Delirium: Evidence from Meta-Data Analyses. BMC Geriatr. 2023, 23, 767. [Google Scholar] [CrossRef] [PubMed]
Figure 1.
Tissue-specific proteomic responses to LPS and ibuprofen. (A) Experimental design: two-month treatment (CK, LPS, or LPS+ibuprofen) followed by 10-day washout and 4D DIA proteomics of four tissues. (B) PCA plots per tissue showing treatment group separation. (C) Volcano plots and DEP counts (|FC|≥1.5, adjusted P≤0.05) for LPS vs CK. (D) Correlation heatmaps (9×9 matrices) confirming reproducibility (r>0.99) and revealing tissue-specific responsiveness. LPS+ibuprofen partially reversed LPS-induced proteomic alterations.
Figure 1.
Tissue-specific proteomic responses to LPS and ibuprofen. (A) Experimental design: two-month treatment (CK, LPS, or LPS+ibuprofen) followed by 10-day washout and 4D DIA proteomics of four tissues. (B) PCA plots per tissue showing treatment group separation. (C) Volcano plots and DEP counts (|FC|≥1.5, adjusted P≤0.05) for LPS vs CK. (D) Correlation heatmaps (9×9 matrices) confirming reproducibility (r>0.99) and revealing tissue-specific responsiveness. LPS+ibuprofen partially reversed LPS-induced proteomic alterations.
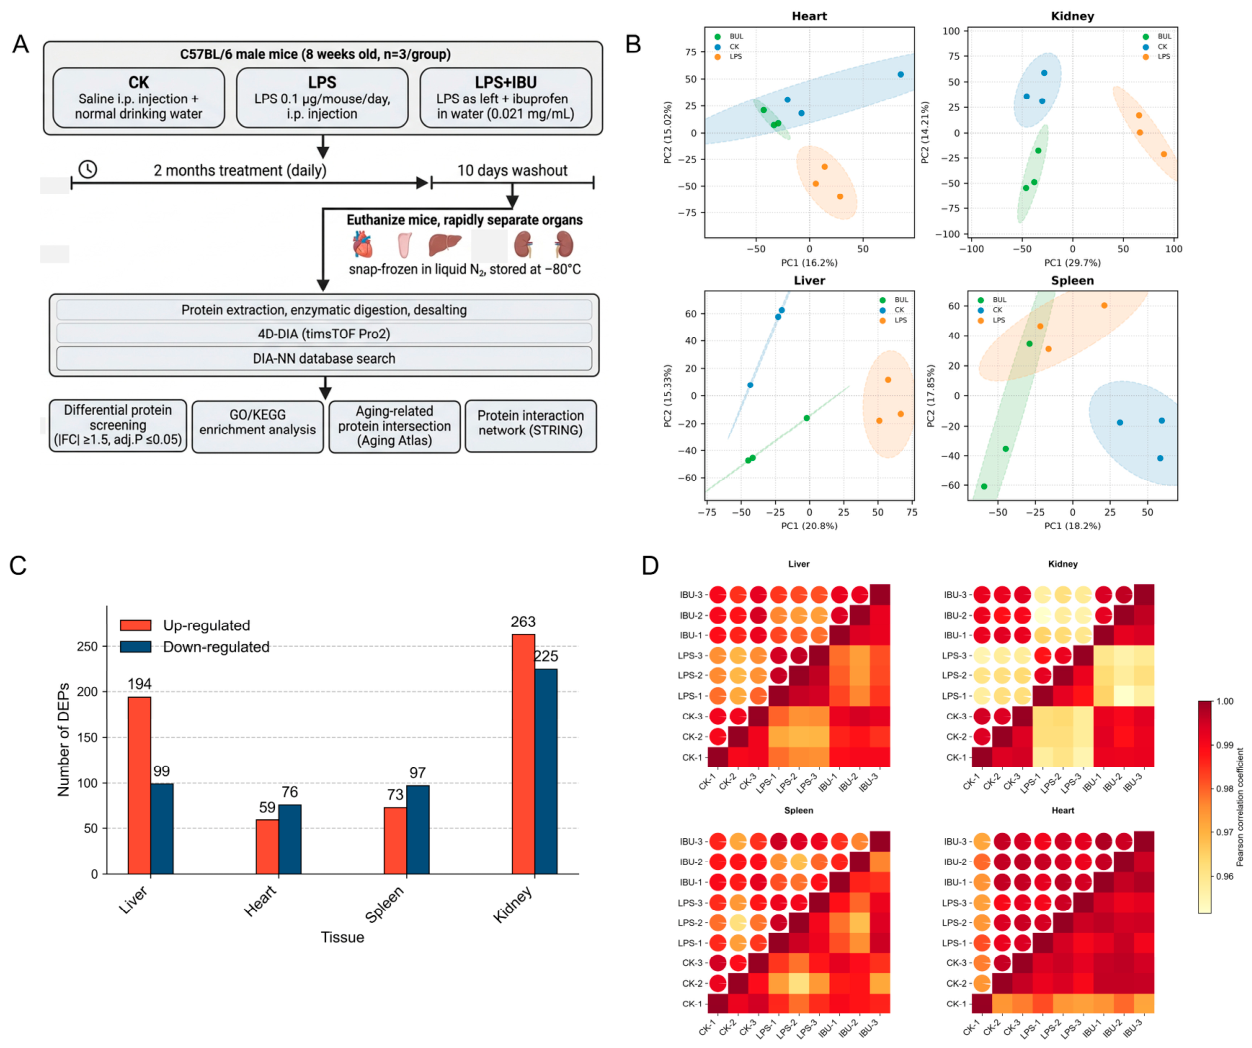
Figure 2.
Tissue-specific aging-related proteomic responses to LPS and ibuprofen. (A) Counts and proportions of aging-related DEPs across tissues. (B) Overlap analysis showing tissue specificity of aging-related DEPs. (C) Heatmaps of aging-related DEP expression patterns; asterisks denote proteins reversed by ibuprofen. (D) Reversal strength of aging-related DEPs with opposite-direction changes. (E) Reversibility comparison between aging-related DEPs and total DEPs; aging-related proteins showed higher overall reversibility, with kidney exhibiting the most prominent response.
Figure 2.
Tissue-specific aging-related proteomic responses to LPS and ibuprofen. (A) Counts and proportions of aging-related DEPs across tissues. (B) Overlap analysis showing tissue specificity of aging-related DEPs. (C) Heatmaps of aging-related DEP expression patterns; asterisks denote proteins reversed by ibuprofen. (D) Reversal strength of aging-related DEPs with opposite-direction changes. (E) Reversibility comparison between aging-related DEPs and total DEPs; aging-related proteins showed higher overall reversibility, with kidney exhibiting the most prominent response.
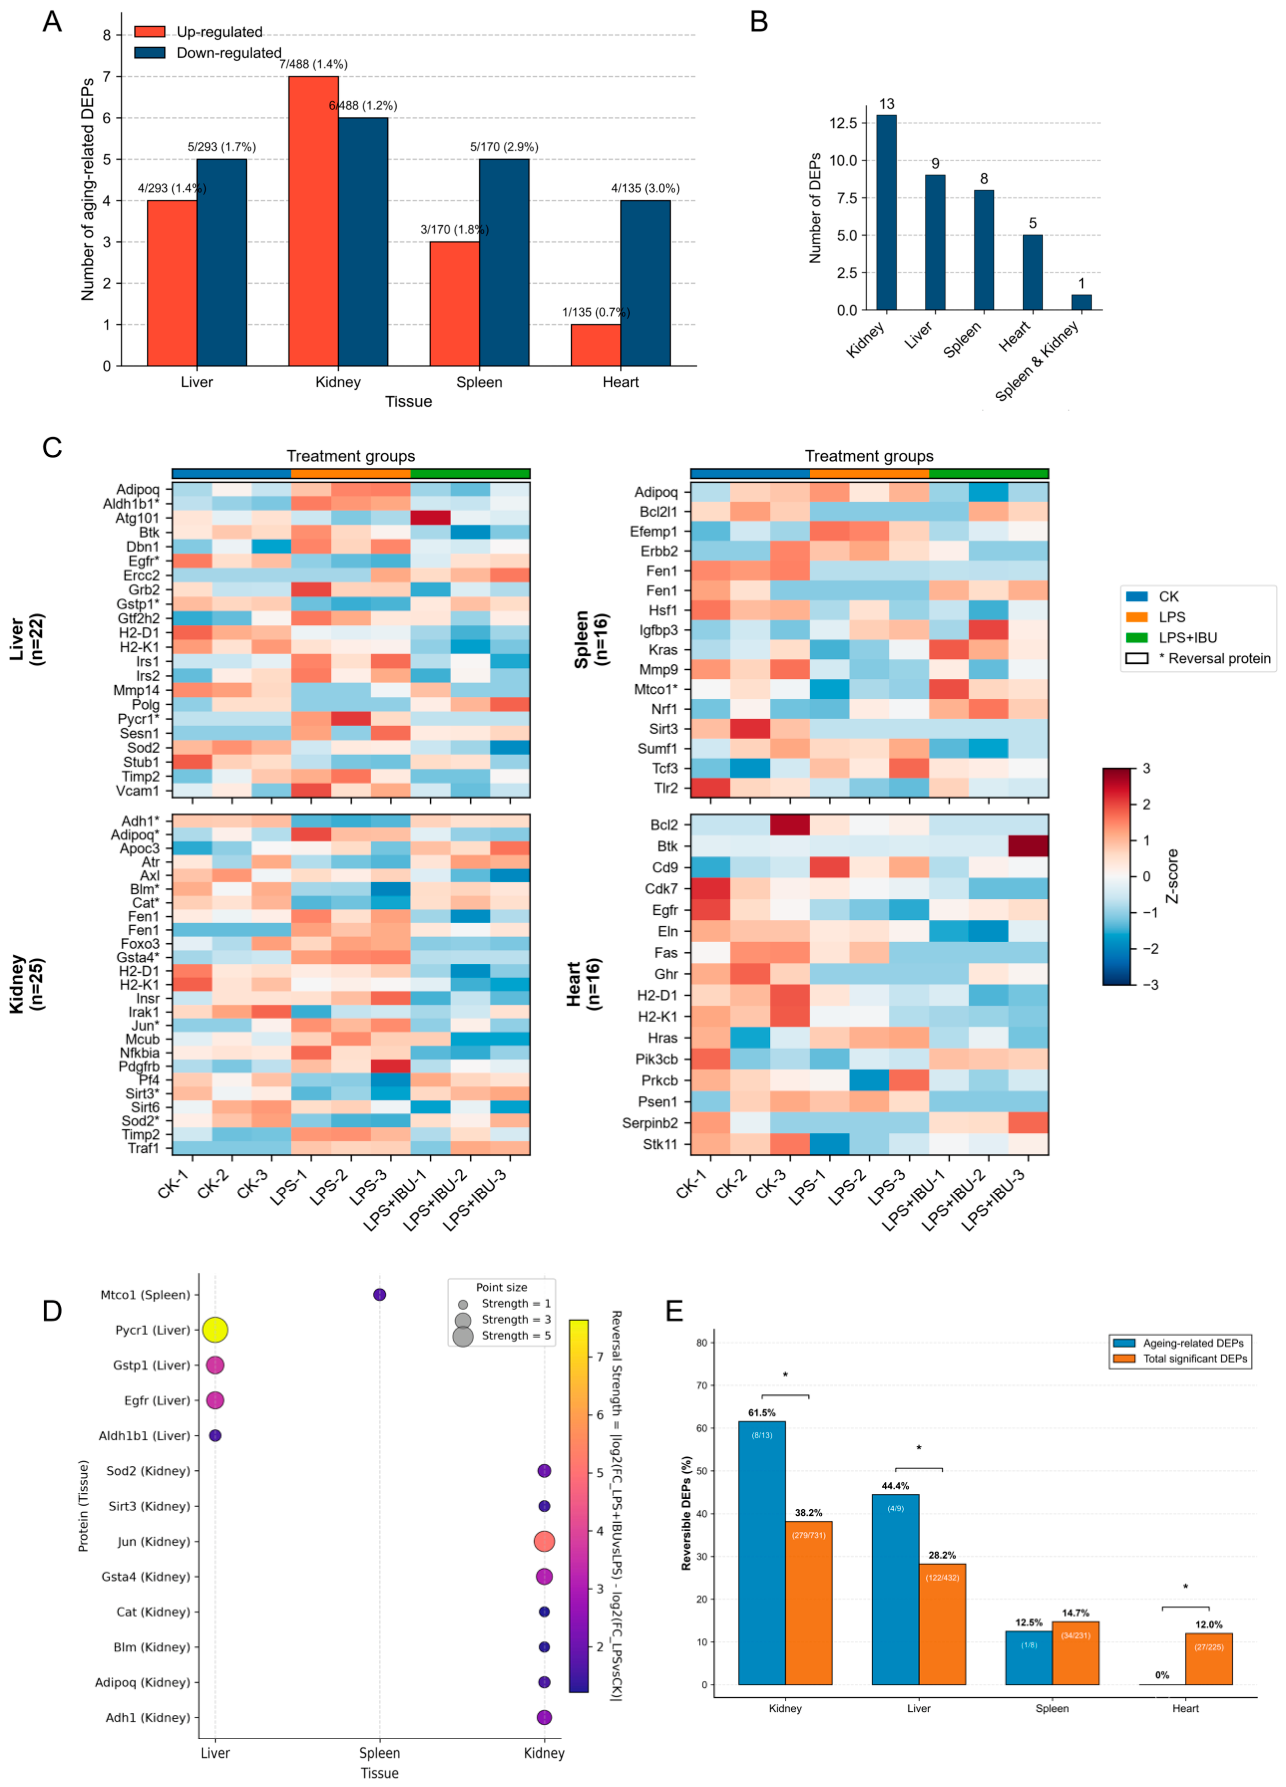
Figure 3.
Functional enrichment analysis of strictly reversible aging-annotated DEPs (FDR < 0.05). (A) GO molecular function enrichment (top 10 terms per tissue; total significant terms: kidney 39, liver 25, spleen 2, heart 2). (B) KEGG pathway enrichment (top 10 pathways per tissue; total significant pathways: kidney 39, liver 20, spleen 2, heart 1). (C) Shared KEGG pathway network among tissues (≥3 tissues). Ten pathways were shared by all four tissues; kidney-liver shared the most pathways (129). Combined −log₁₀P values denote Fisher-combined significance across tissues.
Figure 3.
Functional enrichment analysis of strictly reversible aging-annotated DEPs (FDR < 0.05). (A) GO molecular function enrichment (top 10 terms per tissue; total significant terms: kidney 39, liver 25, spleen 2, heart 2). (B) KEGG pathway enrichment (top 10 pathways per tissue; total significant pathways: kidney 39, liver 20, spleen 2, heart 1). (C) Shared KEGG pathway network among tissues (≥3 tissues). Ten pathways were shared by all four tissues; kidney-liver shared the most pathways (129). Combined −log₁₀P values denote Fisher-combined significance across tissues.
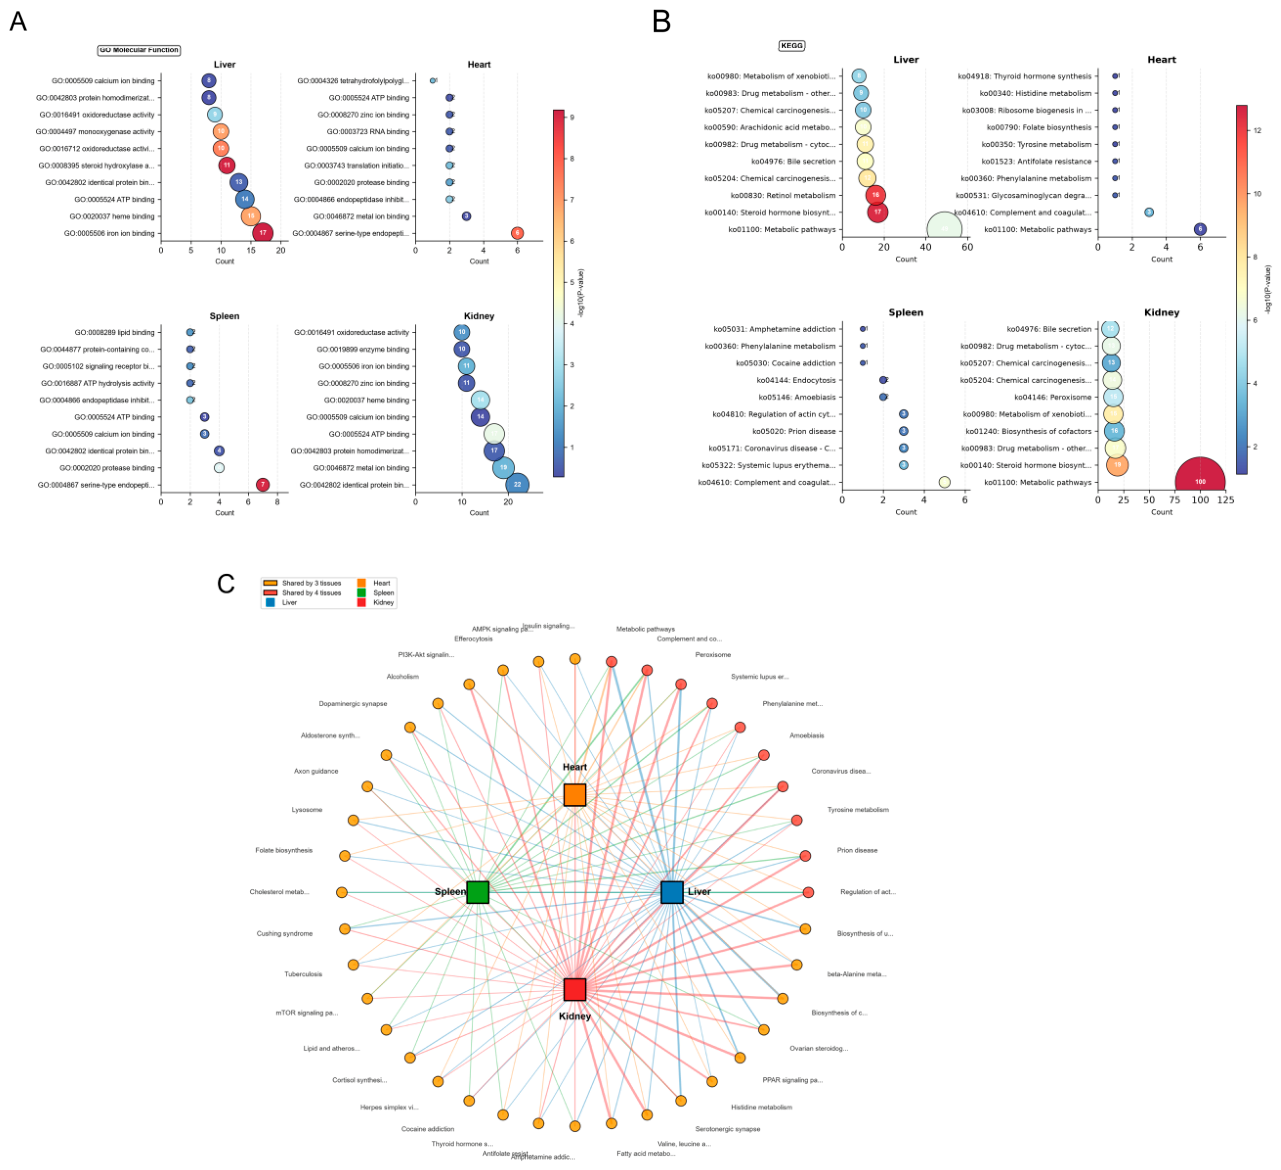
Figure 4.
Tissue-specific PPI networks integrating aging-related and non-aging DEPs. (A) Liver core network: aging-related seed nodes (red) and their connected non-aging DEP partners (blue). (B) Distribution of connections from non-aging nodes to aging hubs in liver. (C) Kidney core network: aging-related seed nodes (red) and their connected non-aging DEP partners (blue). (D) Distribution of connections from non-aging nodes to aging hubs in kidney. (E) STRING network of strictly reversible aging-related DEPs: kidney formed an extensive interconnected network, whereas liver showed only a single interaction. Aging-related DEPs acted as hub nodes in both tissues, with tissue-specific integration patterns.
Figure 4.
Tissue-specific PPI networks integrating aging-related and non-aging DEPs. (A) Liver core network: aging-related seed nodes (red) and their connected non-aging DEP partners (blue). (B) Distribution of connections from non-aging nodes to aging hubs in liver. (C) Kidney core network: aging-related seed nodes (red) and their connected non-aging DEP partners (blue). (D) Distribution of connections from non-aging nodes to aging hubs in kidney. (E) STRING network of strictly reversible aging-related DEPs: kidney formed an extensive interconnected network, whereas liver showed only a single interaction. Aging-related DEPs acted as hub nodes in both tissues, with tissue-specific integration patterns.
Disclaimer/Publisher’s Note: The statements, opinions and data contained in all publications are solely those of the individual author(s) and contributor(s) and not of MDPI and/or the editor(s). MDPI and/or the editor(s) disclaim responsibility for any injury to people or property resulting from any ideas, methods, instructions or products referred to in the content. |
© 2026 by the authors. Licensee MDPI, Basel, Switzerland. This article is an open access article distributed under the terms and conditions of the Creative Commons Attribution (CC BY) license.
Copyright: This open access article is published under a Creative Commons CC BY 4.0 license, which permit the free download, distribution, and reuse, provided that the author and preprint are cited in any reuse.