
Submitted:
08 August 2026
Posted:
10 August 2026
You are already at the latest version
Abstract
High water-cement (w/c) ratio concrete is widely used in non-structural applications but suffers from poor durability due to its porous microstructure. This study investigates ultrasonic surface treatment (UST) as a physical method to improve the durability of concrete with w/c ratios of 0.55 and 0.60. UST was applied externally to the formwork during the plastic stage to densify the surface layer. Treated and control specimens were tested under freeze–thaw cycling (0–100 cycles), sulfate dry-wet cycling (0–125 cycles), and accelerated carbonation (7–28 days), with ¹H NMR relaxometry and SEM used to characterize microstructural changes. UST reduced the ¹H NMR total porosity signal by 17.8% (w/c = 0.55) and 27.7% (w/c = 0.60), preferentially eliminating capillary pores (T₂ = 1–10 ms) by up to 65.8%. These pore structure changes translated into clear durability improvements. Freeze–thaw resistance gained 31–33 additional cycles before the 60% relative dynamic elastic modulus failure threshold, with 100-cycle mass loss reduced by 45.3% and 41.0% at w/c = 0.55 and 0.60. Sulfate attack mass loss at 125 cycles dropped by 48.0% and 41.9%, and the carbonation coefficient K decreased by 42–43%. The UST-to-control degradation rate ratio remained consistently near 0.57–0.58 across all test types, indicating that UST produces a permanent surface densification effect governed by capillary pore connectivity reduction. These findings suggest that UST offers a practical, low-cost approach for extending the service life of high w/c ratio concrete in aggressive environments.
Keywords:
concrete
; ultrasonic surface treatment
; freeze–thaw
; sulfate attack
; carbonation
; 1H-NMR
; pores structure
1. Introduction
Freeze–thaw cycles, sulfate attack, and carbonation constitute the predominant environmental stressors responsible for the premature deterioration of concrete infrastructure worldwide [1,2,3,4]. The water-to-cement (w/c) ratio is the single most influential mix-design parameter governing concrete durability: elevated w/c ratios invariably produce a more porous, more permeable microstructure with a higher fraction of interconnected capillary pores, which serve as primary conduits for aggressive species ingress [5,6]. International design codes—Eurocode EN 206-1 [7], ACI 318-19 [8], and Chinese standard GB 50010-2010 [9]—prescribe maximum w/c ratios in the range of 0.40–0.50 for structural concrete in exposure classes demanding high durability. Structures with stringent service-life requirements, such as bridges, marine platforms, and seismic-resistant buildings, enforce even stricter w/c limits. By contrast, non-load-bearing elements, temporary structures, and low-grade construction frequently employ w/c ratios exceeding 0.55 to achieve the necessary workability and economy during placement, knowingly trading long-term performance for short-term constructability.
A substantial body of literature has established that w/c ratios above 0.55 markedly diminish resistance to both physical (freeze–thaw) and chemical (sulfate, carbonation) degradation [10,11,12,13], while simultaneously elevating permeability and cracking susceptibility [14]. Traditional protective strategies—including fiber reinforcement [15,16,17], supplementary cementitious materials for microstructural refinement [18,19], organic and inorganic surface coatings [20,21,22], and microbially induced carbonate precipitation [23,24,25]—have demonstrated varying degrees of efficacy. However, these approaches often entail significant material costs, complex application procedures, or environmental burdens that render them economically prohibitive for lower-grade construction. There exists, therefore, a critical need for cost-effective, industrially scalable strategies to enhance the durability of concrete with intrinsically high w/c ratios.
Ultrasonic surface treatment (UST) has recently emerged as a promising physical method for economically fortifying concrete surfaces [26]. The technique entails coupling high-frequency mechanical vibration (typically 20–30 kHz) to the concrete surface via ultrasonic transducers mounted externally on the formwork during the plastic stage. The propagating acoustic waves induce two synergistic physical phenomena—acoustic cavitation and acoustic streaming—that collectively disrupt cement particle flocculation, promote further hydration, and drive particle rearrangement toward a denser packing state. The resultant low-permeability surface layer, termed the ultrasonic hardening layer (UHL), exhibits enhanced hardness, reduced porosity, and diminished transport properties [27,28,29]. Prior investigations have primarily focused on the formation mechanism, microhardness, and erosion resistance of the UHL [27,28]. However, a systematic evaluation of UST effects on the full spectrum of concrete durability—encompassing freeze–thaw, sulfate, and carbonation resistance—remains absent from the literature, particularly for low-grade concrete with elevated w/c ratios.
The present study addresses this gap through a comprehensive experimental program investigating the effects of UST on two concrete mixtures with w/c ratios of 0.55 and 0.60, representing the boundary between medium- and high-permeability regimes. The durability performance is evaluated under three distinct environmental stressors: freeze–thaw cycling, sulfate dry-wet cycling, and accelerated carbonation. 1H-NMR relaxometry is employed to characterize the pore structure modifications induced by UST, providing direct quantitative evidence linking microscopic densification to macroscopic durability enhancement. SEM observations further elucidate the microstructural mechanisms. The findings demonstrate that UST provides a uniform, permanent densification effect—the UST-to-control degradation rate ratio remaining remarkably constant at 0.57–0.58 across all durability tests—establishing a unified mechanistic framework centered on capillary pore elimination.
2. Materials and Methods
2.1. Materials
Cement. P.O. 42.5 ordinary Portland cement (OPC) conforming to Chinese standard GB 175-2007 was employed. The cement exhibited an initial setting time of 122 min and a final setting time of 225 min. The oxide composition determined by X-ray fluorescence is provided in Table 1.
Aggregates. Natural river sand with a particle size range of 0.15–3.00 mm and an apparent density of 1.846 g/cm3 served as fine aggregate; its particle size distribution is presented in Table 2. Crushed limestone with a nominal size of 5.00–16.00 mm was used as coarse aggregate (Table 3).
Mix design. Two concrete mixtures were prepared with a fixed cement/sand/gravel ratio of 1.0:1.4:2.3 (by mass) and w/c ratios of 0.55 and 0.60, designated as CS-0.55 and CS-0.60 for control specimens, and UST-0.55 and UST-0.60 for ultrasonically treated specimens, respectively. No chemical admixtures were employed.
2.2. Specimen Preparation
UST protocol. The UST mold was fabricated from 2.5-mm-thick stainless steel plates coated with polytetrafluoroethylene (PTFE) to prevent concrete adhesion (Figure 1). Piezoelectric ultrasonic transducers (28 kHz, 100 W per unit) were affixed to the external mold surfaces using epoxy resin adhesive. An ultrasonic generator (KMD-K1, China) operating at 28 kHz with a maximum power output of 3000 W drove the transducer array. Freshly mixed concrete was poured into the molds and rest until initial setting was approached. Subsequently, continuous high-frequency ultrasonic vibration was applied externally for about 30 min at a power density of 1.8 kW/m2..
Specimen preparation. Prismatic specimens of 100 × 100 × 400 mm3 were cast with ordinary and UST protocols, respectively. Three replicate specimens were made for each of the four groups (UST-0.55, CS-0.55, UST-0.60, CS-0.60).
Curing. Specimens were left undisturbed for 48 h before demolding. The demolded UST specimens exhibited a characteristic dark coloration attributable to microstructural densification (Figure 2(a)), in contrast to the conventional grey appearance of CS specimens (Figure 2(b)). Cross-sectional examination confirmed the presence of a distinct, dark UHL on the surface layer (Figure 3). All specimens were subsequently cured under standard conditions (20 ± 2 °C, ≥95% RH) for 26 days prior to durability testing.
2.3. Testing Methods
All durability tests were conducted in accordance with the Chinese standard GB/T 50082-2009, “Standard for Test Methods of Long-term Performance and Durability of Ordinary Concrete.”
Freeze–thaw test. An NJW-HDK9 apparatus (China) was employed. Each cycle comprised freezing at (−18 ± 2) °C for 3 h followed by thawing in water at (5 ± 2) °C for 1 h. Mass loss rate and relative dynamic elastic modulus (RDEM) were evaluated at 25-cycle intervals. The test was terminated when either the mass loss exceeded 5% or the RDEM fell below 60%. The mass loss rate (ΔWn) and RDEM (Pn) were calculated as follows:
where W0 and Wn are the initial mass and mass after N cycles; E0 and En are the initial and post-cycle dynamic elastic moduli; and f0 and fn are the corresponding transverse fundamental frequencies.
Sulfate attack test. An NJW-SL apparatus (China) was utilized with a 5% Na2SO4 solution. Each dry-wet cycle consisted of immersion in sulfate solution for 15 h followed by drying at 80 °C for 6 h, with a 3 h cooling period. Mass loss rate and RDEM were assessed every 25 cycles up to 125 cycles.
Accelerated carbonation test. A TH-B environmental chamber (China) maintained conditions of 20 ± 2 °C, 70 ± 5% RH, and 20 ± 3% CO2 concentration. Carbonation depth was measured on freshly split surfaces using 1% phenolphthalein indicator after 7, 14, and 28 days of exposure.
1H-NMR relaxometry. A MESOMR23-060H-I nuclear magnetic resonance system (New-Magnet Co., Ltd., China) operating at a proton resonance frequency of 23 MHz was employed. Cylindrical cores (Φ50 × 50 mm) were extracted from 28-day aged specimens, vacuum-saturated with deionized water for 24 h, and analyzed using the Carr–Purcell–Meiboom–Gill (CPMG) pulse sequence. Transverse relaxation time (T2) distributions were obtained via inverse Laplace transformation. The total NMR signal integral served as a proxy for total water-accessible porosity, while the T2 geometric mean (T2 gm) characterized the pore size distribution center. Pore types were classified according to T2 ranges: gel pores (T2 ≤ 1 ms, corresponding to pore diameters < ~10 nm), small capillary pores (1 < T2 ≤ 10 ms, ~10–50 nm), medium capillary pores (10 < T2 ≤ 100 ms, ~50–200 nm), and macro-pores (T2 > 100 ms, > ~200 nm).
SEM analysis. A field-emission scanning electron microscope (FEI QUANTA 650, USA) was employed. Samples (~1 cm3) were extracted from the surface layer of specimens after durability testing, hydration-arrested by immersion in anhydrous ethanol, vacuum-dried, and gold-coated prior to examination.
3. Results and Discussion
3.1. Freeze–Thaw Resistance
Table 4 presents the mass loss data with standard deviations for all groups throughout the freeze–thaw cycling program. Figure 4(a) depicts the evolution of mass loss as a function of cycle number.
A three-stage degradation pattern was consistently observed across all groups. During Stage I (0–25 cycles), all specimens exhibited a slight mass gain (negative mass loss: −0.27% to −0.51%), attributable to water absorption into surface micro-cracks and pores prior to the onset of visible frost damage. The UST specimens absorbed consistently less water than their CS counterparts (UST-0.55: −0.27% vs. CS-0.55: −0.36% & UST-0.60: −0.49% vs. CS-0.60: −0.51%), reflecting the reduced surface permeability conferred by the UHL. Stage II (25–75 cycles) was characterized by an accelerating mass loss rate as freeze–thaw micro-cracks propagated and coalesced. A critical observation is that the degradation rate ratio CS/UST remained approximately 2.2× throughout this stage for w/c = 0.55, and 1.5–2.0× for w/c = 0.60, indicating that UST provided a consistent, sustained protective effect. Stage III (75–100 cycles) corresponded to rapid surface spalling; CS-0.55 and CS-0.60 accumulated mass losses of 8.15% and 9.92%, respectively, far exceeding the 5% failure criterion, while UST groups remained below CS groups (4.46% and 5.85%). Relative to CS specimens, UST reduced the 100-cycle mass loss by 45.3% for w/c = 0.55 and 41.0% for w/c = 0.60, as shown in Figure 4(c).
Table 5 and Figure 4(b) present the RDEM evolution. The modulus degradation trajectory mirrored the mass loss pattern. CS-0.55 and CS-0.60 specimens dropped below the 60% RDEM failure threshold at approximately 65 and 75 cycles, respectively. In contrast, UST-0.55 maintained an RDEM of 55.26% at 100 cycles—the only group remaining near the 60% criterion after the full test duration—while UST-0.60 reached 45.45%. Relative to CS specimens, UST reduced the 100-cycle modulus degradation by 13.7% for w/c = 0.55 and 14.6% for w/c = 0.60, as shown in Figure 4(d). The UST treatment extended the freeze–thaw service life for both w/c ratios.
The enhanced freeze–thaw durability of UST specimens is jointly attributed to: (i) the reduced capillary porosity that diminishes the volume of freezable water—capillary pores (1–100 ms T2 range) being the primary reservoir of water susceptible to ice formation; (ii) the low-permeability UHL that retards external water ingress during the thawing phase, thereby breaking the positive feedback loop of “water absorption → freezing expansion → crack formation → further water ingress”; and (iii) the Kelvin effect arising from gel pore refinement, which depresses the freezing point of pore water.
3.2. Sulfate Attack Resistance
Figure 5(a) and Table 6 present the mass change during sulfate dry-wet cycling. Unlike the freeze–thaw test, the sulfate environment induced a distinct two-phase evolution pattern.
Phase I — Product filling and strengthening (0 – ~75 cycles). All specimens exhibited mass gain (negative ΔW values) due to the accumulation of sulfate reaction products—primarily ettringite (3CaO·Al2O3·3CaSO4·32H2O) and gypsum (CaSO4·2H2O)—within the pore network. CS specimens reached their maximum mass gain at 25 cycles (−3.06% for w/c = 0.55; −3.79% for w/c = 0.60), whereas UST specimens peaked later at 50 cycles (−1.42% and −2.85%, respectively). The substantially lower mass gain magnitude and delayed peak in UST specimens confirm that the densified UHL effectively retarded sulfate ion ingress and consequently limited the quantity of expansive reaction products generated.
Phase II — Expansive damage and spalling (~75 – 125 cycles). The accumulated expansive stress from continuing ettringite and gypsum crystallization eventually exceeded the tensile strength of the cementitious matrix, initiating micro-crack formation and accelerating mass loss. The zero-crossing point—where net mass change transitions from gain to loss—occurred at approximately 88.8 and 76.7 cycles for UST-0.55 and UST-0.60, compared with 72.7 and 62.3 cycles for their CS counterparts, representing a delay of 14–16 cycles. At 125 cycles, CS-0.55 and CS-0.60 registered mass losses of 5.23% and 7.51%, respectively, while UST-0.55 and UST-0.60 remained at 2.72% and 4.36%—corresponding to reductions of 48.0% and 41.9%, as shown in Figure 5(c).
Figure 5(b) and Table 7 present the RDEM evolution, which exhibited an initial increase (peaking at 50 cycles across all groups) followed by a monotonic decline. This initial stiffening reflects the pore-filling effect of sulfate products, which enhances the effective elastic modulus before the onset of micro-cracking. The peak RDEM values were notably higher for CS specimens (112.4% and 121.9% for w/c = 0.55 and 0.60) than for UST specimens (110.1% and 112.8%), consistent with the greater quantity of pore-filling products in the more permeable CS matrix. However, this “pseudo-strengthening” was followed by a precipitous decline: CS-0.60 dropped below the 60% RDEM threshold after 100 cycles of sulfate exposure, reaching 39.49% at 125 cycles—the most severe degradation among all groups. The enhancement-to-degradation ratio (E/D = peak modulus increase/total modulus decrease) serves as an indicator of the balance between beneficial filling and destructive expansion. UST-0.60 exhibited the lowest E/D ratio (0.215 vs. 0.266 for CS-0.60), signifying a more favorable equilibrium wherein the initial strengthening was moderate and the subsequent degradation was proportionally less severe. By 125 cycles, RDEM values were 64.58% (UST-0.55), 56.69% (CS-0.55), 53.46% (UST-0.60), and 39.49% (CS-0.60). Relative to CS specimens, UST reduced the 125-cycle modulus degradation by 13.9% for w/c = 0.55 and 35.4% for w/c = 0.60, as shown in Figure 5(d).
The improved sulfate resistance of UST-treated concrete is mechanistically rooted in the micro structure refinement induced by UST, that reduces the interconnected capillary pathways and decrease the diffusion of SO42− ions, thereby limiting the generation of expansive products and preserving the integrity of the matrix.
3.3. Carbonation Resistance
Figure 6 and Table 8 present the carbonation depth development during the 28-day accelerated test. Carbonation depth x is conventionally described by Fick’s first law of diffusion: x = K·√t, where K is the carbonation coefficient (mm/√day) and t is the exposure time (days). Linear regression of x vs. √t yielded K coefficients with R2 ≥ 0.9996 for all groups (Figure 6(b)), confirming that the carbonation process was strictly diffusion-controlled under the test conditions.
The CS specimens exhibited substantially greater carbonation depths than their UST counterparts at all measurement ages as shown in Figure 6(a). Figure 6(c) presents the carbonation depths were 9.53 mm (UST-0.55), 16.48 mm (CS-0.55), 10.56 mm (UST-0.60), and 18.51 mm (CS-0.60) at 28 days expose. The carbonation depth reductions expressed as (CS − UST)/CS × 100% yielded values of 42.2% and 42.9% for w/c = 0.55 and 0.60 at 28 days—consistent with the K coefficient reduction. Consequently, the corresponding K coefficients were 1.79, 3.11, 1.99, and 3.51 mm/√day(Figure 6(b)), respectively. UST reduced the K coefficient by 42.3% and 43.4% for w/c = 0.55 and 0.60(Figure 6(d)), which is a remarkably consistent reduction ratio despite the differing initial porosities, suggesting that the relative protective efficacy of UST against CO2 diffusion is governed primarily by the fractional reduction in capillary pore connectivity rather than by the absolute initial porosity. Figure 6(e) presents the UST/CS rate ratio remained stable at 0.57–0.58 across the three measurement intervals (0→7, 7→14, 14→28 days), confirming that the carbonation resistance conferred by UST is uniform over time and derives from the permanent microstructural densification of the surface layer.
A notable contrast in carbonation depth between UST and CS specimens was visually evident from the phenolphthalein indicator test on cross-sections after 28 days (Figure 7).
3.4. 1H-NMR Relaxometry and Pore Structure Analysis
Figure 8 presents the T2 relaxation time distributions and the derived pore size classifications of four specimen groups. The T2 spectrum of water-saturated concrete provides direct information on the pore size distribution, as the transverse relaxation time is proportional to the pore surface-to-volume ratio (1/T2 ≈ ρ2·S/V, where ρ2 is the surface relaxivity).
Total porosity reduction. The integrated T2 signal intensity, which is proportional to the total water-accessible porosity, was consistently lower for UST specimens compared to their CS counterparts at equivalent w/c ratios (Figure 8(a) and 8(b)). The total signal integral dropped from 5663.6 to 4654.5 a.u. (−17.8%) at w/c = 0.55, and from 8306.2 to 6003.6 a.u. (−27.7%) at w/c = 0.60 (Figure 8(c)). The greater absolute reduction at the higher w/c ratio is attributable to the larger initial pore volume available for densification, as well as the enhanced acoustic cavitation efficiency in the more fluid cement paste.
T2gm shift. In Figure 8(a), the T2 geometric mean (T2gm), which represents the weighted center of the pore size distribution, shifted from 0.416 ms to 0.335 ms for w/c = 0.55, and from 0.427 ms to 0.348 ms for w/c = 0.60. This leftward shift of approximately 0.08 ms in both cases indicates a systematic refinement of the pore structure toward smaller pore sizes following UST.
Selective capillary pore elimination. A classification of the T2 spectra into pore size categories (Table 9) reveals the most mechanistically significant finding: UST preferentially eliminates capillary pores. For w/c = 0.55, the signal attributed to small capillary pores (T2 = 1 – 10 ms) was reduced by 65.8%, from 643.6 to 220.3 a.u., while the gel pore signal (T2 ≤ 1 ms) decreased by only 12.0%. For w/c = 0.60, the reductions were more uniform across pore categories—gel pores: −24.4%, small capillary: −44.9%, medium capillary: −50.7%, that reflecting a more pervasive densification mode at the higher w/c ratio where the greater free water content facilitates deeper acoustic energy penetration.
Mechanistic implications for durability. The selective or comprehensive elimination of capillary pores constitutes the unifying mechanism underlying the enhanced durability performance of UST-treated concrete across all three degradation modes:
Freeze–thaw: Capillary pores are the primary reservoir of freezable water. The 65.8% reduction in small capillary pores (w/c = 0.55) directly diminishes the volume of water available for ice formation, thereby reducing the hydraulic pressure generated during freezing. Furthermore, the disconnected capillary network impedes water migration during thawing, disrupting the damage accumulation cycle.
Sulfate attack: Capillary pores serve as the dominant diffusion pathways for SO4-2 ingress. The elimination of these pathways reduces the rate and total quantity of sulfate ion penetration, limiting ettringite and gypsum formation and delaying the onset of expansive cracking.
Carbonation: CO2 diffusion through the concrete cover is governed by the capillary pore network. The reduction in capillary connectivity increases the tortuosity of the diffusion path, proportionally decreasing the effective CO2 diffusion coefficient and the resultant carbonation coefficient K.
Notably, the UST/CS degradation rate ratio was consistently 0.57–0.58 across carbonation, and the mass loss reduction ratio was 0.45–0.55 across freeze–thaw and sulfate attack (all within the range expected from a 45–66% reduction in capillary pore connectivity). This convergence of evidence suggestly supports the capillary pore elimination hypothesis as the primary durability enhancement mechanism.
3.5. SEM Microstructural Analysis
Figure 9 presents the microstructure of the concrete surface layer prior to durability testing. The UST specimen (Figure 9(a)) exhibits a markedly denser ITZ with intimate bonding between the C-S-H gel and the aggregate surface, accompanied by a notable absence of visible micro-cracks and capillary pores. In contrast, the CS specimen (Figure 9(b)) displays a porous, loosely packed ITZ morphology with numerous initial defects and a less compact C-S-H gel matrix. The distinct ITZ refinement in UST specimens is attributed to the acoustic streaming effect, which drives cement particles toward the aggregate surface during the plastic stage, combined with enhanced hydration resulting from cavitation-induced disruption of particle flocculation.
Post-freeze–thaw SEM observations (Figure 10) further corroborate the durability enhancement mechanism. The UST specimen (Figure 10(a)) retained an intact ITZ with no evidence of penetrating cracks, and only sparse micro-cracks in the C-S-H matrix. Conversely, the CS specimen (Figure 10(b)) exhibited prominent through-cracks propagating along the aggregate–paste interface, consistent with the established understanding that freeze–thaw damage initiates and propagates preferentially along the ITZ [30].
Post-sulfate-attack micrographs (Figure 11) reveal a stark contrast in degradation morphology. The UST specimen (Figure 11(a)) showed limited formation of needle-like ettringite crystals confined to isolated pores, with the ITZ remaining largely intact. The CS specimen (Figure 11(b)), by contrast, displayed extensive deposition of sulfate reaction products within the ITZ and capillary pores, with the expansive crystallization pressure having generated a major penetrating crack through the matrix. These observations directly link the macroscopic durability enhancement to the microstructural densification at the ITZ and within the capillary pore network.
4. Unified Durability Enhancement Mechanism of UST
The experimental evidence from 1H-NMR, freeze–thaw, sulfate attack, and carbonation tests collectively supports a unified mechanistic framework centered on capillary pore elimination. The UST process, through the synergistic action of high-frequency vibration and acoustic streaming during the plastic stage of cement hydration:
(1) Disrupts cement particle flocculation, releasing entrapped water that becomes available for further hydration, thereby increasing the degree of hydration and the volume fraction of C-S-H gel within the surface layer.
(2) Drives particle rearrangement toward a denser packing configuration, reducing the volume and connectivity of the capillary pore network.
(3) Enhances ITZ quality by promoting closer contact between cement paste and aggregate surfaces, reducing the thickness and porosity of the interfacial region.
(4) Forms a permanent, low-permeability UHL that serves as a diffusion barrier against water, sulfate ions, and CO2, with a protective efficacy governed by the fractional reduction in capillary pore connectivity rather than by the absolute initial porosity.
The remarkable consistency of the UST/CS degradation rate ratio (0.57 – 0.58) across carbonation time intervals and the convergence of mass loss reduction ratios (0.45–0.55) across freeze–thaw and sulfate tests strongly suggest that the durability enhancement is a direct, linear function of the capillary pore elimination achieved by UST, independent of the specific degradation mechanism.
5. Conclusions
This study experimentally investigated the effects of ultrasonic surface treatment (UST) on the durability of concrete with w/c ratios of 0.55 and 0.60 under freeze–thaw cycling, sulfate dry-wet cycling, and accelerated carbonation. The principal findings are as follows.
(1) UST reduced the total 1H NMR porosity signal by 17.8% (w/c = 0.55) and 27.7% (w/c = 0.60). Small capillary pores (T2 = 1–10 ms) were preferentially eliminated, with signal reductions of 65.8% and 44.9% at w/c = 0.55 and 0.60, accompanied by a leftward T2 geometric mean shift of approximately 0.08 ms.
(2) Under freeze–thaw cycling, UST reduced the 100-cycle mass loss by 45.3% (w/c = 0.55) and 41.0% (w/c = 0.60). The CS/UST degradation rate ratio during the acceleration stage (25–75 cycles) was approximately 2.2× at w/c = 0.55 and 1.5–2.0× at w/c = 0.60. The 100-cycle modulus degradation was reduced by 13.7% and 14.6%, respectively. CS specimens fell below the 60% RDEM threshold at 65–75 cycles, whereas UST-0.55 retained 55.26% after 100 cycles.
(3) Under sulfate dry-wet cycling, UST delayed the zero-crossing point from mass gain to mass loss by 14–16 cycles. Mass loss at 125 cycles was reduced by 48.0% (w/c = 0.55) and 41.9% (w/c = 0.60), and modulus degradation was cut by 13.9% and 35.4%. The enhancement-to-degradation ratio (E/D) was lower for UST specimens (0.215 for UST-0.60 vs. 0.266 for CS-0.60), indicating a more favorable balance between sulfate product filling and expansive damage.
(4) The carbonation coefficient K was reduced by 42.3% (w/c = 0.55) and 43.4% (w/c = 0.60), with R2 ≥ 0.9996 for all linear regressions. The 28-day carbonation depth decreased from 16.48 mm to 9.53 mm (w/c = 0.55) and from 18.51 mm to 10.56 mm (w/c = 0.60), corresponding to reductions of 42.2% and 42.9%. The UST/CS depth ratio remained stable at 0.57–0.58 across all measurement intervals.
(5) SEM imaging confirmed that UST produced a denser interfacial transition zone with fewer initial defects and a more compact C-S-H gel matrix. After durability testing, UST specimens retained largely intact microstructures, whereas CS specimens showed penetrating cracks propagating along the ITZ and extensive deposition of sulfate reaction products.
Overall, the UST/CS degradation rate ratio converged near 0.57–0.58 across freeze–thaw, sulfate attack, and carbonation tests, indicating that UST improves concrete durability through a unified mechanism governed by the reduction in capillary pore connectivity.
Funding
This work was supported by the Hohhot Municipal Science and Technology Bureau of Inner Mongolia Special Project (Grant No. XTCX2023-13).
Data Availability Statement
The data that support the findings of this study are available from the corresponding author upon reasonable request.
Conflicts of Interest
The authors declare that there are no conflicts of interest regarding the publication of this article.
Acknowledgments
The authors gratefully acknowledge the financial support provided by the Hohhot Municipal Science and Technology Bureau of Inner Mongolia, China.
References
- Xie, R.; Yang, J.; Xie, E. Investigation on mechanical properties deterioration of concrete subjected to freeze–thaw cycles. Sci. Rep. 2022, vol. 12(no. 1), 22612. [Google Scholar]
- Yujing, W. Z.; Wu, F.; Li, H.; Zhang, Y.; Xu, G. Influence of initial damage degree on the degradation of concrete under sulfate attack and wetting–drying cycles. Int. J. Concr. Struct. Mater. 2020, vol. 14, 47. [Google Scholar]
- Zhang, X.; Zhou, X.; Zhou, H.; Gao, K.; Wang, Z. Studies on forecasting of carbonation depth of slag high performance concrete considering gas permeability. Appl. Clay Sci. 2013, vol. 79, 36–40. [Google Scholar] [CrossRef]
- Li, Z.; Guo, W.; Li, K.; Li, T. Effect of mineral admixture and fiber on the frost resistance of concrete in cold region. In in Proceedings of the 2019 International Conference on Civil and Hydraulic Engineering, 2019; IOP Publishing; p. 052085. [Google Scholar]
- Powers, T. C. A working hypothesis for further studies of frost resistance of concrete. J. Am. Concr. Inst. 1945, vol. 16(no. 4), 245–272. [Google Scholar]
- Mehta, P. K.; Monteiro, P. J. M. Concrete: Microstructure, Properties, and Materials, 4th ed.; McGraw-Hill: New York, NY, USA, 2014. [Google Scholar]
- CEN, EN 206-1; Concrete — Part 1: Specification, Performance, Production and Conformity. European Committee for Standardization: Brussels, Belgium, 2000.
- ACI Committee 318, Building Code Requirements for Structural Concrete (ACI 318-19); American Concrete Institute: Farmington Hills, MI, USA, 2019.
- GB 50010-2010; Code for Design of Concrete Structures. (in Chinese). China Architecture & Building Press: Beijing, China, 2010.
- Shang, H. S.; Yi, T. H.; Song, Y. P. Behavior of plain concrete of a high water-cement ratio after freeze-thaw cycles. Materials 2012, vol. 5(no. 9), 1698–1707. [Google Scholar] [CrossRef]
- Zhao, J.; Zhang, H.; Xu, J.; Wang, Y.; Li, R. Dynamic behavior and damage mechanisms of concrete subjected to freeze–thaw cycles. Buildings 2009, vol. 15(no. 12), 2025. [Google Scholar]
- Penttala, V. Surface and internal deterioration of concrete due to saline and non-saline freeze–thaw loads. Cem. Concr. Res. 2006, vol. 36(no. 5), 921–928. [Google Scholar] [CrossRef]
- Tekle, B. H.; Ly, T. V.; Hertwig, L.; Holschemacher, K. Freeze–thaw resistance and sorptivity of fine-grained alkali-activated cement concrete. Struct. Concr. 2023, vol. 24(no. 3), 4286–4296. [Google Scholar]
- Bao, J.; Xue, S.; Zhang, P.; Dai, Z.; Cui, Y. Coupled effects of sustained compressive loading and freeze–thaw cycles on water penetration into concrete. Struct. Concr. 2021, vol. 22(no. S1), E944–E954. [Google Scholar]
- Ji, Y.; Zou, Y.; Li, W. Sulfate erosion investigation on FRP-confined concrete in cold region. Sci. Rep. 2022, vol. 12(no. 1), 10839. [Google Scholar]
- Aslani, F.; Dehghani, A.; Wang, L. The effect of hollow glass microspheres, carbon nanofibers and activated carbon powder on mechanical and dry shrinkage performance of ultra-lightweight engineered cementitious composites. Constr. Build. Mater. 2021, vol. 280, 122415. [Google Scholar] [CrossRef]
- Zhu, K.; Liang, Y.; Yuan, J.; et al. Flexible cement fibers with high toughness and water-activated setting behavior for construction. Nat. Commun. 2025, vol. 16(no. 1), 6529. [Google Scholar]
- Alanyali, H.; Çöl, M.; Yilmaz, M.; Karagöz, S. Concrete produced by steel-making slag (basic oxygen furnace) addition in Portland cement. Int. J. Appl. Ceram. Technol. 2009, vol. 6(no. 6), 736–748. [Google Scholar] [CrossRef]
- Hashim, A. A.; Al-Mosawi, A. I.; Abdulsada, S. A. Investigating the mechanical properties, durability, microstructure, and embodied CO2 emissions of silica fume-infused sustainable concrete. Int. J. Appl. Ceram. Technol. 2025, vol. 22(no. 4), e15136. [Google Scholar]
- Ahmad, S.; Gupta, A. P.; Sharmin, E.; Alam, M.; Pandey, S. K. Synthesis, characterization and development of high performance siloxane-modified epoxy paints. Prog. Org. Coat. 2005, vol. 54(no. 3), 248–255. [Google Scholar] [CrossRef]
- Brenna, A.; Beretta, S.; Berra, M.; et al. Effect of polymer modified cementitious coatings on chloride-induced corrosion of steel in concrete. Struct. Concr. 2019, vol. 21(no. 5), 1810–1822. [Google Scholar] [CrossRef]
- Li, G.; Hu, C.; Zhou, J.; Hu, W. Improvements of nano-TiO2 on the long-term chloride resistance of concrete with polymer coatings. Coatings 2019, vol. 9(no. 5), 323. [Google Scholar] [CrossRef]
- De Muynck, W.; Cox, K.; De Belie, N.; Verstraete, W. Bacterial carbonate precipitation as an alternative surface treatment for concrete. Constr. Build. Mater. 2008, vol. 22(no. 5), 875–885. [Google Scholar] [CrossRef]
- Joshi, S.; Goyal, S.; Mukherjee, A.; Reddy, M. S. Protection of concrete structures under sulfate environments by using calcifying bacteria. Constr. Build. Mater. 2019, vol. 209, 156–166. [Google Scholar] [CrossRef]
- Li, P.; Qu, W. “Bacteria for concrete surface treatment,” in Biotechnologies and Biomimetics for Civil Engineering; Pacheco-Torgal, F., et al., Eds.; Springer: Cham, Switzerland, 2015; pp. 325–358. [Google Scholar]
- Shi, Y.; Shi, Z. Preparation of novel and durable concrete skin. Struct. Concr. 2021, vol. 22(no. S1), E152–E160. [Google Scholar] [CrossRef]
- Shi, Y.; Wang, L.; Zhang, Z.; Shi, Z. Formation mechanism and microhardness characterization of the ultrasonic hardening layer in cementitious materials. Int. J. Appl. Ceram. Technol. 2022, vol. 19(no. 3), 1626–1633. [Google Scholar] [CrossRef]
- Shi, Y.; Shi, Z. M. Ultrasonic surface treatment for improving wind-blown sand erosion resistance of cementitious materials. Wear 2020, vol. 460-461, 203185. [Google Scholar] [CrossRef]
- Shi, Y.; Shi, Z. M. Surface treatment of cementitious composites by ultrasound and its effect on durability performance. J. Mater. Civ. Eng. 2021, vol. 33(no. 3), 04020481. [Google Scholar] [CrossRef]
- Liu, F.; You, Z.; Xiong, R.; Yang, X. Effects of sodium sulfate attack on concrete incorporated with drying-wetting cycles. Adv. Civ. Eng. 2021, 2021, 5393504. [Google Scholar] [CrossRef]
- Mao, M.; Zhang, D.; Yang, Q.; Zhang, W. Study of durability of concrete with fly ash as fine aggregate under alternative interactions of freeze-thaw and carbonation. Adv. Civ. Eng. 2019, 2019, 4693893. [Google Scholar] [CrossRef]
- Li, Y.; Zhang, L.; Ma, C.; Li, B.; Zhu, J. Damage mechanism of mineral admixture concrete under marine corrosion and freezing-thawing environment. Adv. Civ. Eng. 2020, 2020, 8817113. [Google Scholar] [CrossRef]
- Gong, X.; Yu, H.; Wu, C. Experimental study on the correlation between mechanical properties of concrete and interface strength of coarse aggregate mortar under freezing–thawing. Struct. Concr. 2022, vol. 24, 2023–2040. [Google Scholar] [CrossRef]
Figure 1.
UST mold and ultrasonic generator.
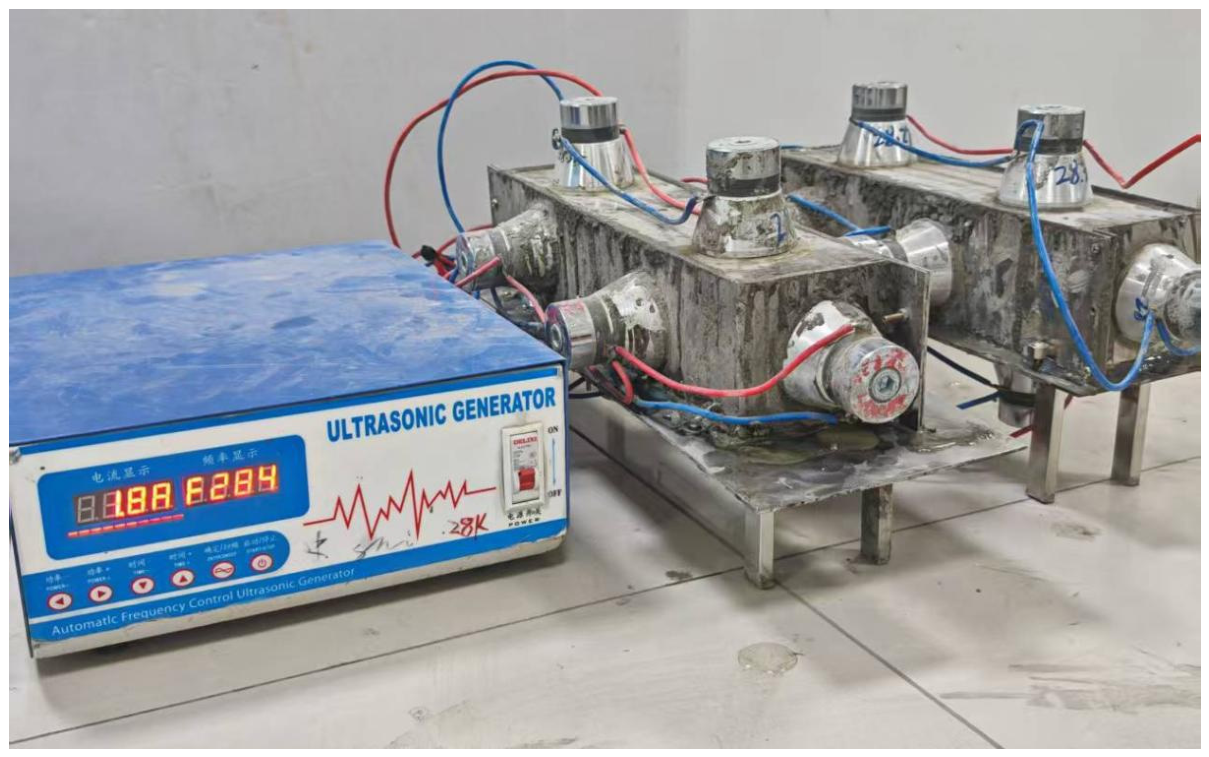
Figure 2.
Appearance of concrete specimen after demolding: (a) UST specimen, (b) CS specimen.
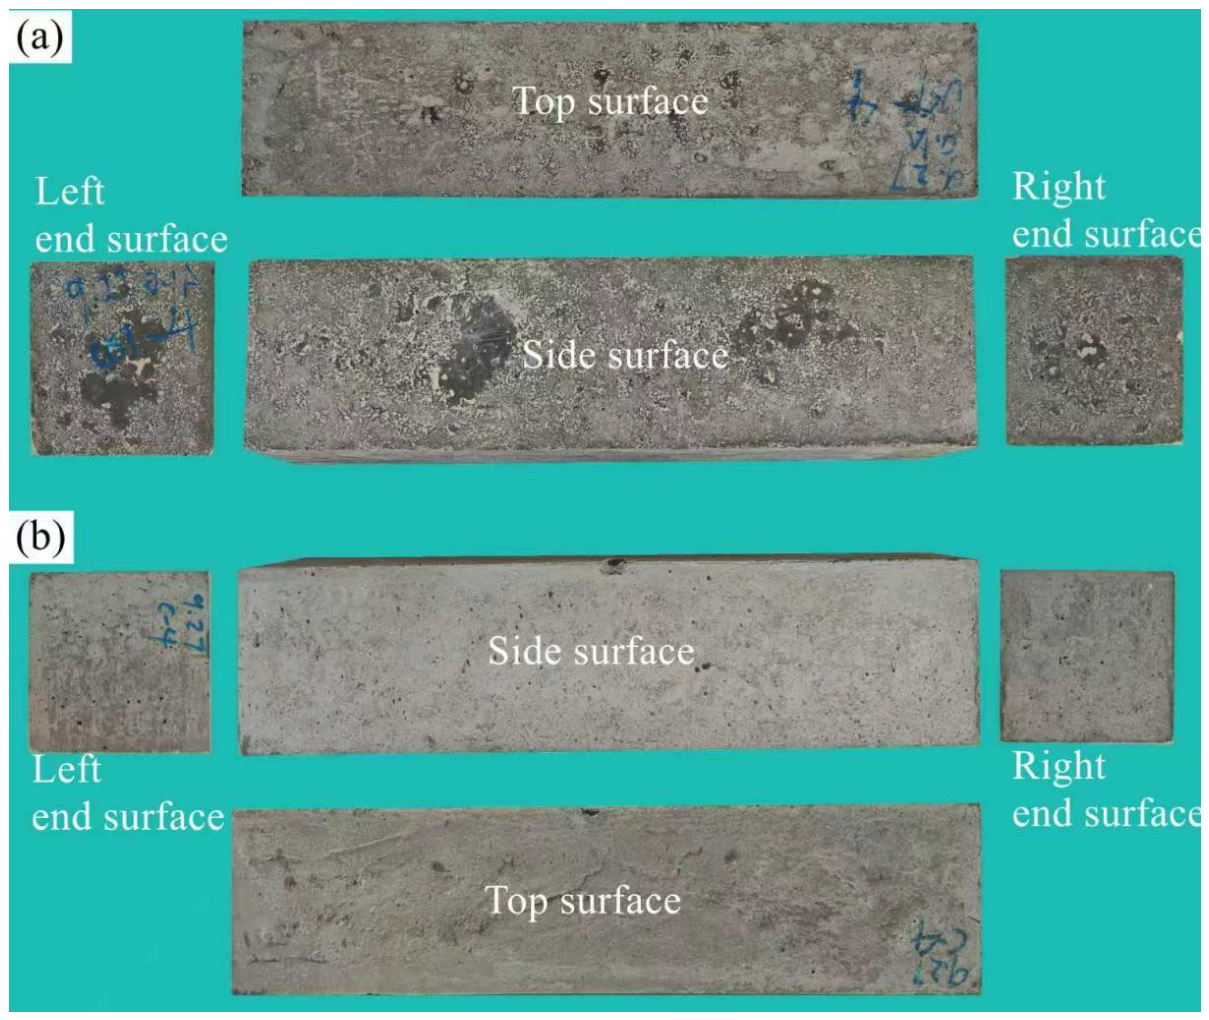
Figure 3.
Appearance of the UHL on the cross - section of concrete specimens.
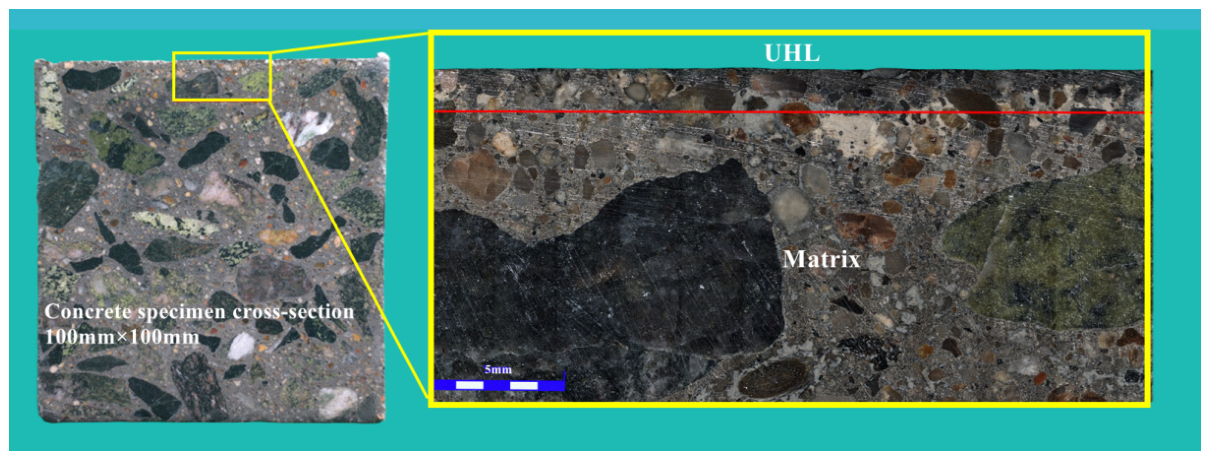
Figure 4.
Mass loss rate and RDEM with freeze - thaw cycle time: (a) mass loss rate v.s. cycle time, (b) RDEM v.s. cycle time, (c) Comparison of mass lose after 100 freeze-thaw cycles, (d) Comparison of RDEM after 100 freeze-thaw cycles.
Figure 4.
Mass loss rate and RDEM with freeze - thaw cycle time: (a) mass loss rate v.s. cycle time, (b) RDEM v.s. cycle time, (c) Comparison of mass lose after 100 freeze-thaw cycles, (d) Comparison of RDEM after 100 freeze-thaw cycles.
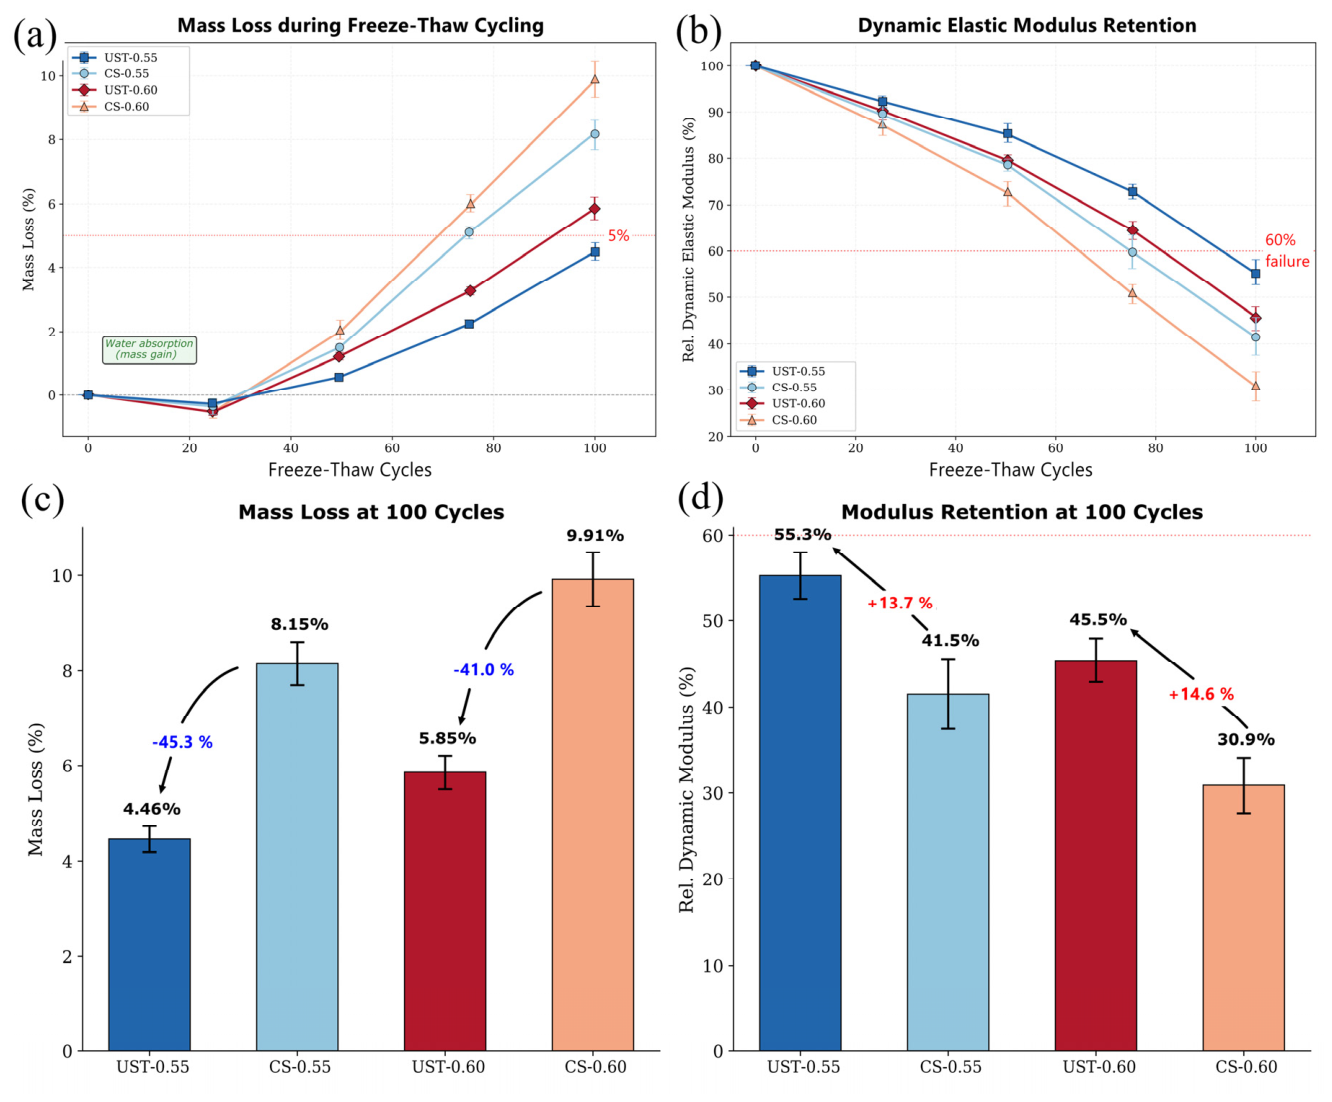
Figure 5.
Mass loss rate and RDEM with sulfate attack (a) mass loss rate v.s. cycletimes, (b) RDEM v.s. cycletimes, (c) mass lost at 125 cycles, (d) modulus retention at 125 cycles.
Figure 5.
Mass loss rate and RDEM with sulfate attack (a) mass loss rate v.s. cycletimes, (b) RDEM v.s. cycletimes, (c) mass lost at 125 cycles, (d) modulus retention at 125 cycles.
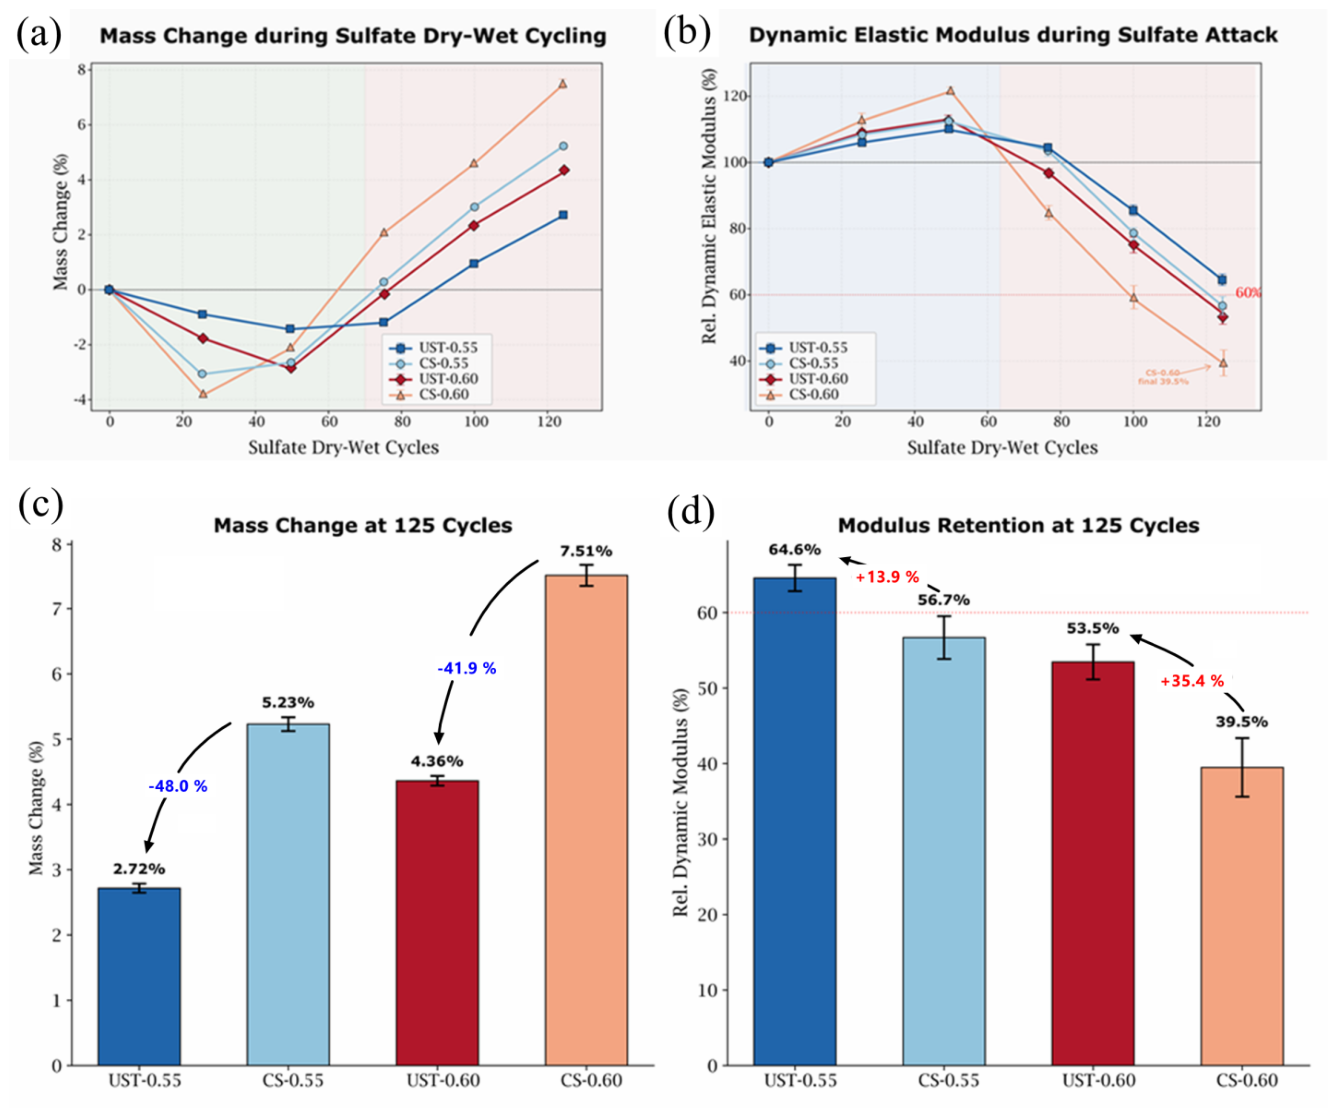
Figure 6.
Comparison of accelerated carbonation depth. (a) Carbonation depth vs time; (b) Carbonation depth vs √time; (c) Comparison of carbonation depth at 28-day expose; (d) Comparison of carbonation coefficient K; (e) Comparison of carbonation depth by stage.
Figure 6.
Comparison of accelerated carbonation depth. (a) Carbonation depth vs time; (b) Carbonation depth vs √time; (c) Comparison of carbonation depth at 28-day expose; (d) Comparison of carbonation coefficient K; (e) Comparison of carbonation depth by stage.
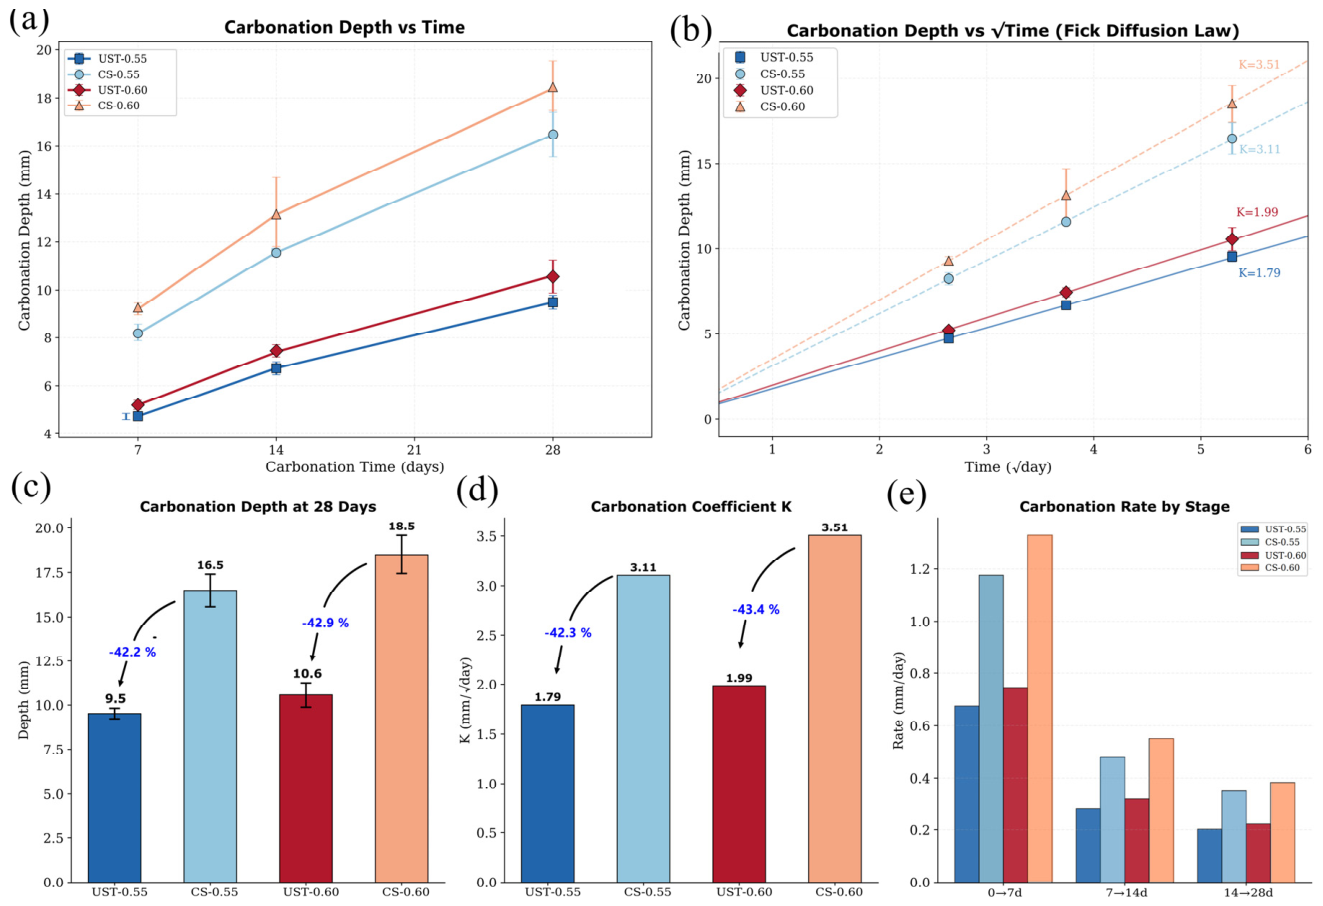
Figure 7.
Cross-section of concrete specimens at the 28-day accelerated carbonation age.
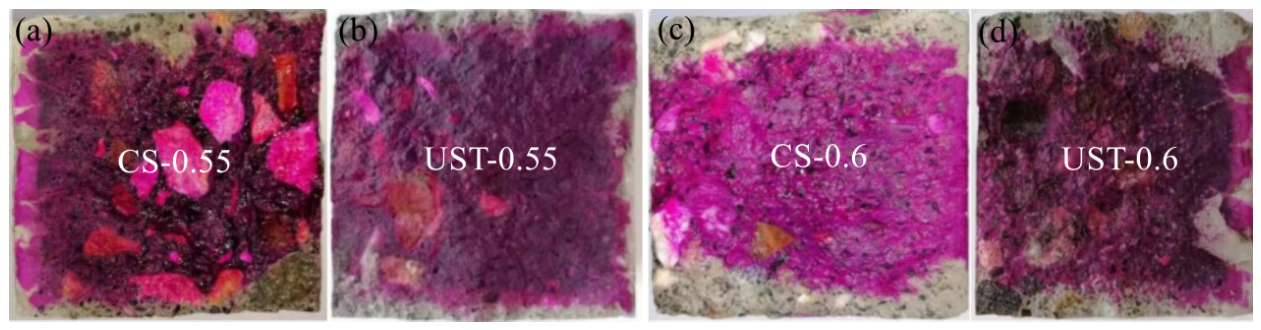
Figure 8.
1H-NMR test: (a) T2 spectrum of specimens; (b) Cumulative T2 signal distribution; (c) Comparison of total porosity proxy signal; (d) Comparison of pore size distribution.
Figure 8.
1H-NMR test: (a) T2 spectrum of specimens; (b) Cumulative T2 signal distribution; (c) Comparison of total porosity proxy signal; (d) Comparison of pore size distribution.
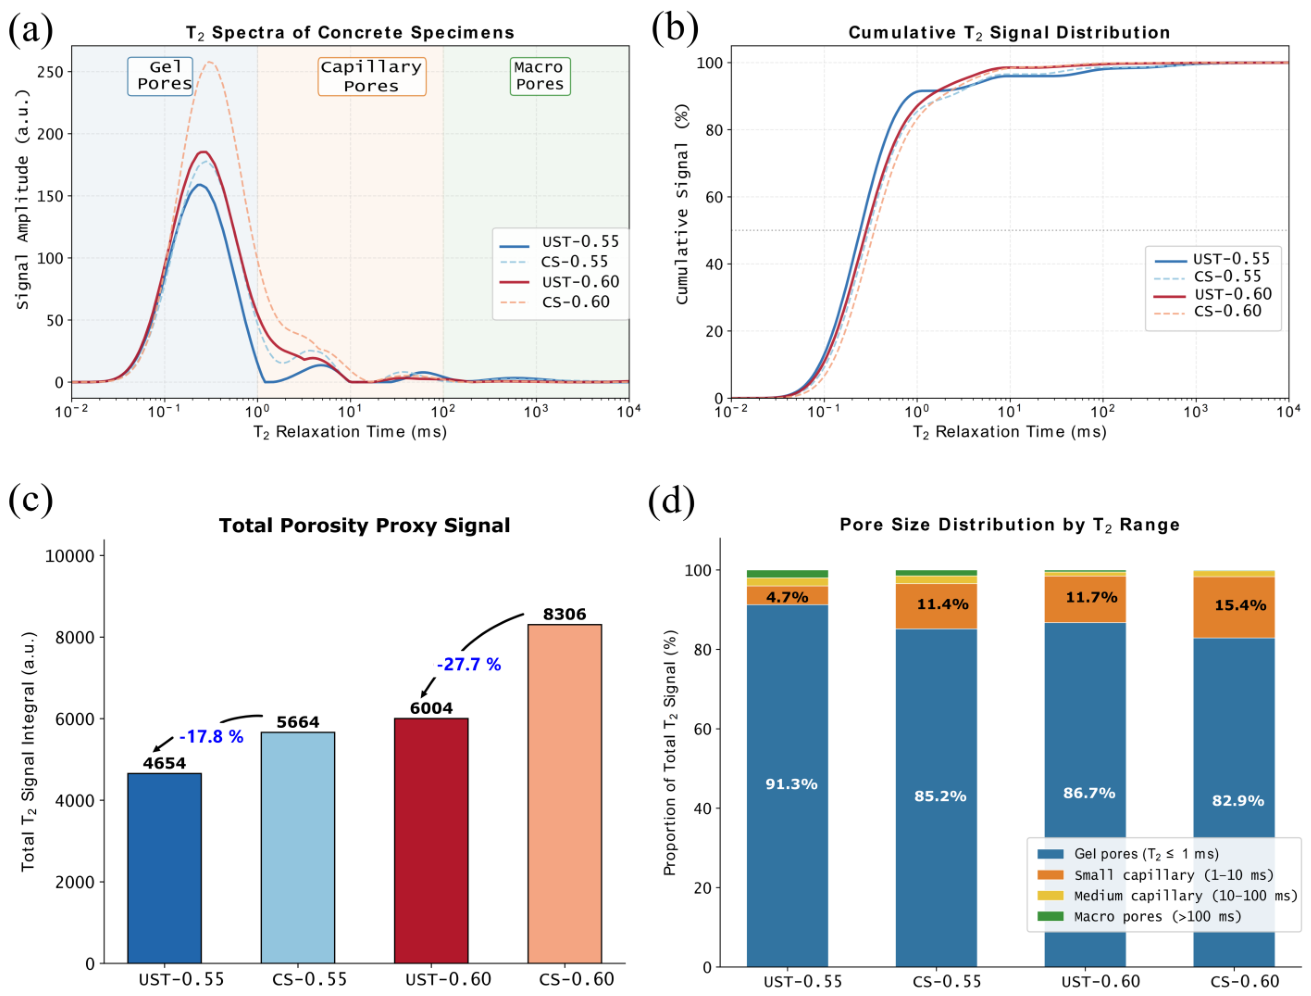
Figure 9.
Microscopic morphology of concrete specimens before testing: (a) UST-0.60 specimen; (b) CS-0.60 specimen.
Figure 9.
Microscopic morphology of concrete specimens before testing: (a) UST-0.60 specimen; (b) CS-0.60 specimen.
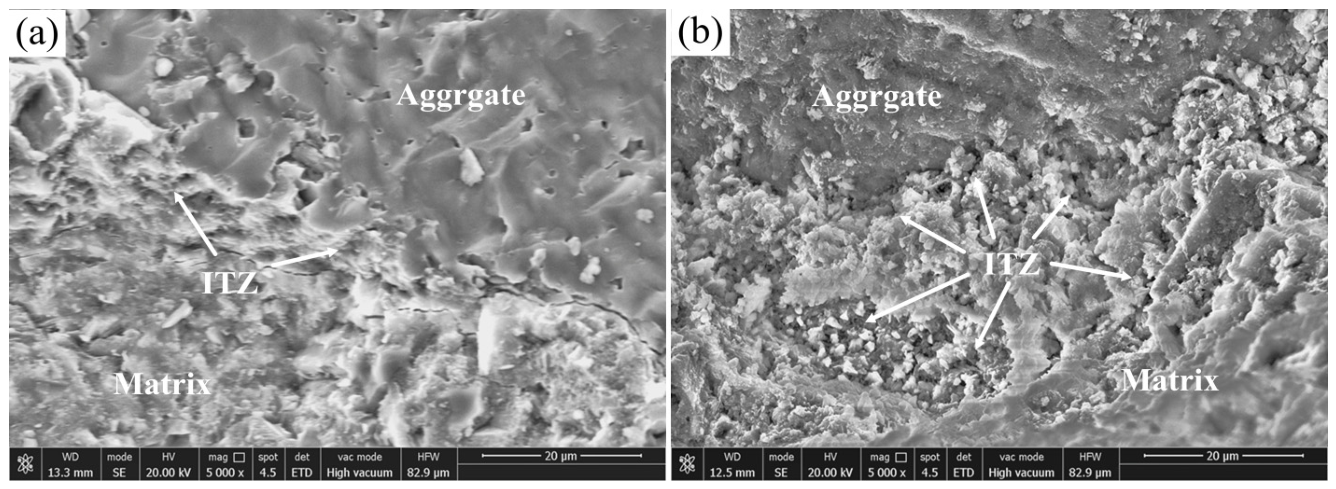
Figure 10.
Microstructure of concrete after100 freeze–thaw cycles: (a) UST-0.55 specimens, (b) CS-0.55 specimens.
Figure 10.
Microstructure of concrete after100 freeze–thaw cycles: (a) UST-0.55 specimens, (b) CS-0.55 specimens.
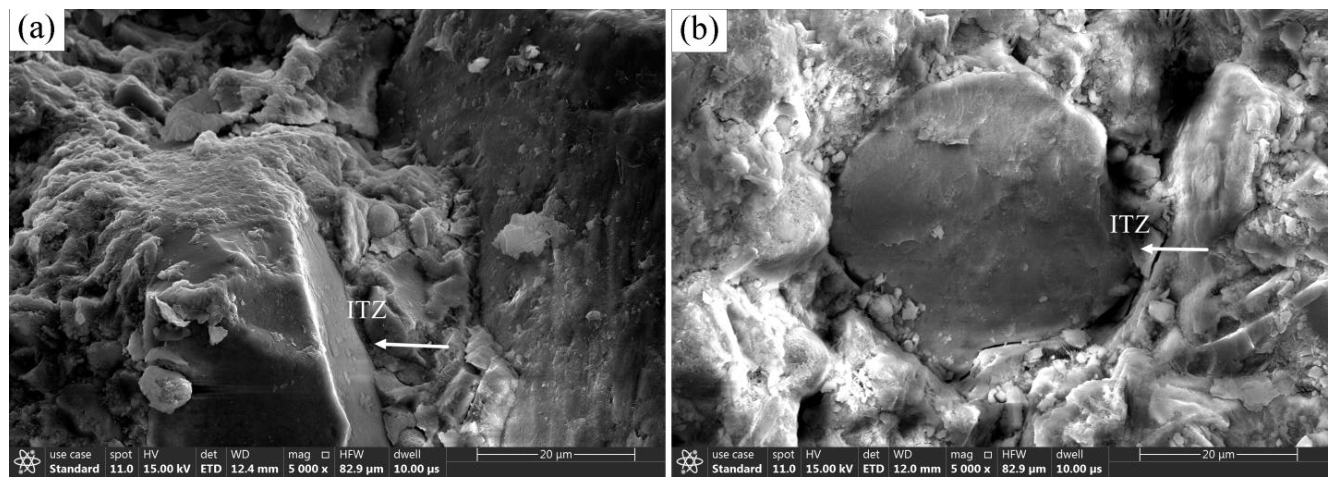
Figure 11.
Microstructure of concrete after 125 sulfate dry-wet cycles: (a) UST-0.55 specimens, (b) CS-0.55 specimens.
Figure 11.
Microstructure of concrete after 125 sulfate dry-wet cycles: (a) UST-0.55 specimens, (b) CS-0.55 specimens.
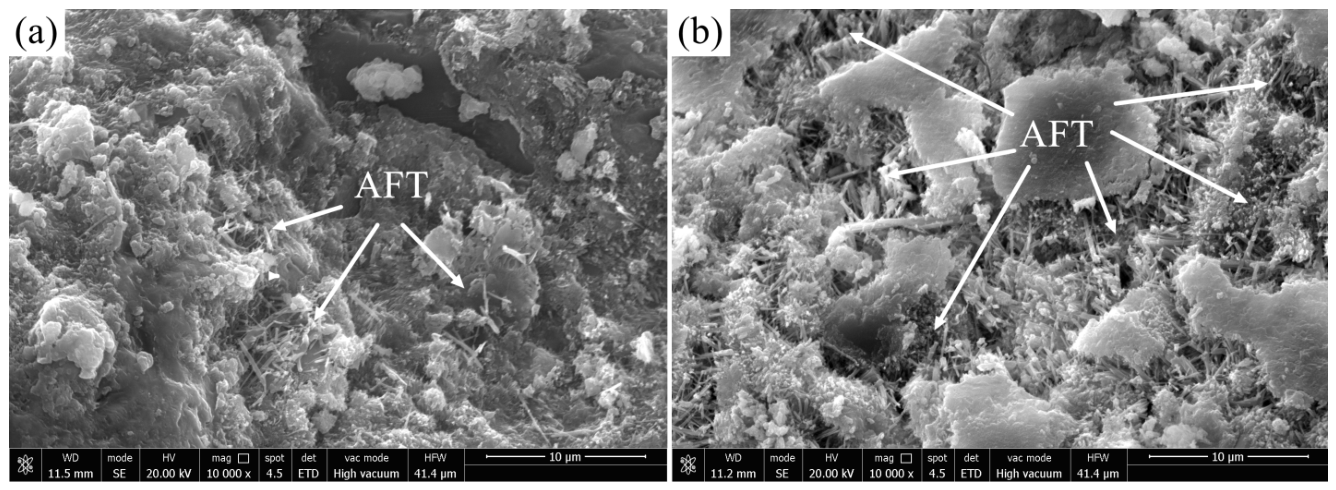

Table 1.
Chemical composition of cement (wt%).
| CaO | SiO2 | Fe2O3 | Al2O3 | MgO | Others |
| 62.43 | 21.78 | 3.41 | 5.72 | 2.14 | 4.52 |
Table 2.
Particle size distribution of fine aggregate.
| Sieve size (mm) | 4.75 | 2.36 | 1.18 | 0.60 | 0.30 | 0.15 |
| Cumulative retained (wt%) | 0 | 25.4 | 40.8 | 61.4 | 81.6 | 99.8 |
Table 3.
Particle size distribution of coarse aggregate.
| Sieve size (mm) | 16.00 | 9.50 | 4.75 | 2.36 |
| Cumulative retained (wt%) | 8.3 | 41.9 | 98.3 | 99.4 |
Table 4.
Mass loss rate during freeze–thaw cycling (mean ± SD, %).
| Cycles | UST-0.55 | CS-0.55 | UST-0.60 | CS-0.60 |
| 0 | 0 | 0 | 0 | 0 |
| 25 | −0.27 ± 0.11 | −0.36 ± 0.25 | −0.49 ± 0.14 | −0.51 ± 0.22 |
| 50 | 0.57 ± 0.10 | 1.50 ± 0.12 | 1.23 ± 0.12 | 2.05 ± 0.30 |
| 75 | 2.24 ± 0.12 | 5.10 ± 0.19 | 3.26 ± 0.13 | 6.02 ± 0.27 |
| 100 | 4.46 ± 0.28 | 8.15 ± 0.46 | 5.85 ± 0.35 | 9.92 ± 0.57 |
Table 5.
Relative dynamic elastic modulus during freeze–thaw cycling (mean ± SD, %).
| Cycles | UST-0.55 | CS-0.55 | UST-0.60 | CS-0.60 |
| 0 | 100 | 100 | 100 | 100 |
| 25 | 92.17 ± 1.11 | 89.64 ± 3.02 | 90.25 ± 2.02 | 87.33 ± 2.45 |
| 50 | 85.52 ± 1.99 | 78.63 ± 1.18 | 79.54 ± 1.18 | 72.37 ± 2.66 |
| 75 | 72.78 ± 1.56 | 59.66 ± 3.62 | 64.45 ± 1.98 | 50.66 ± 2.05 |
| 100 | 55.26 ± 2.71 | 41.53 ± 4.09 | 45.45 ± 2.53 | 30.88 ± 3.19 |
Table 6.
Mass change during sulfate dry-wet cycling (mean ± SD, %).
| Cycles | UST-0.55 | CS-0.55 | UST-0.60 | CS-0.60 |
| 0 | 0 | 0 | 0 | 0 |
| 25 | −0.89 ± 0.02 | −3.06 ± 0.03 | −1.77 ± 0.02 | −3.79 ± 0.04 |
| 50 | −1.42 ± 0.02 | −2.64 ± 0.03 | −2.85 ± 0.02 | −2.05 ± 0.02 |
| 75 | −1.17 ± 0.03 | 0.27 ± 0.02 | −0.17 ± 0.02 | 2.11 ± 0.04 |
| 100 | 0.95 ± 0.05 | 3.01 ± 0.06 | 2.33 ± 0.05 | 4.61 ± 0.08 |
| 125 | 2.72 ± 0.07 | 5.23 ± 0.11 | 4.36 ± 0.07 | 7.51 ± 0.15 |
Table 7.
RDEM during sulfate dry-wet cycling (mean ± SD, %).
| Cycles | UST-0.55 | CS-0.55 | UST-0.60 | CS-0.60 |
| 0 | 100 | 100 | 100 | 100 |
| 25 | 106.12 ± 0.84 | 108.21 ± 0.67 | 108.98 ± 1.08 | 112.88 ± 1.98 |
| 50 | 110.14 ± 0.61 | 112.44 ± 1.31 | 112.75 ± 1.51 | 121.93 ± 0.91 |
| 75 | 104.39 ± 1.25 | 103.56 ± 1.72 | 96.72 ± 1.33 | 84.82 ± 2.18 |
| 100 | 85.54 ± 1.49 | 78.65 ± 1.84 | 75.18 ± 2.29 | 59.26 ± 3.50 |
| 125 | 64.58 ± 1.74 | 56.69 ± 2.83 | 53.46 ± 2.32 | 39.49 ± 3.88 |
Table 8.
Carbonation depth during accelerated carbonation test (mean ± SD, mm).
| Time (days) | UST-0.55 | CS-0.55 | UST-0.60 | CS-0.60 |
| 7 | 4.72 ± 0.13 | 8.23 ± 0.35 | 5.21 ± 0.19 | 9.29 ± 0.24 |
| 14 | 6.70 ± 0.27 | 11.57 ± 0.17 | 7.45 ± 0.26 | 13.14 ± 1.56 |
| 28 | 9.53 ± 0.29 | 16.48 ± 0.92 | 10.56 ± 0.68 | 18.51 ± 1.07 |
Table 9.
Pore size distribution from 1H-NMR T2 relaxometry (signal integral, a.u.).
| Pore type | T2 range | UST-0.55 | CS-0.55 | Δ% | UST-0.60 | CS-0.60 | Δ% |
| Gel pores | ≤1 ms | 4247.6 | 4824.5 | −12.0 | 5207.8 | 6885.7 | −24.4 |
| Small capillary | 1–10 ms | 220.3 | 643.6 | −65.8 | 705.3 | 1281.1 | −44.9 |
| Medium capillary | 10–100 ms | 93.8 | 112.1 | −16.3 | 60.5 | 122.6 | −50.7 |
| Macro-pores | >100 ms | 92.8 | 83.4 | +11.3 | 30.1 | 16.7 | +79.8 |
| Total | — | 4654.5 | 5663.6 | −17.8 | 6003.6 | 8306.2 | −27.7 |
Disclaimer/Publisher’s Note: The statements, opinions and data contained in all publications are solely those of the individual author(s) and contributor(s) and not of MDPI and/or the editor(s). MDPI and/or the editor(s) disclaim responsibility for any injury to people or property resulting from any ideas, methods, instructions or products referred to in the content. |
© 2026 by the authors. Licensee MDPI, Basel, Switzerland. This article is an open access article distributed under the terms and conditions of the Creative Commons Attribution (CC BY) license.
Copyright: This open access article is published under a Creative Commons CC BY 4.0 license, which permit the free download, distribution, and reuse, provided that the author and preprint are cited in any reuse.


