

Submitted:
06 August 2026
Posted:
10 August 2026
You are already at the latest version
Abstract
Polarizers and polarization optics technology has been widely used in various application fields. Although there is a wealth of independent research on polarizers, thin films and polarization spectroscopy, there is a lack of a systematic review that combines "polarizers" with "polarization spectroscopy measurement methodology". In this paper, polarizers and polarization spectroscopy has been discussed revolving the development, fabrication and characterization of related materials, which include Polyvinyl Alcohol (PVA)-I2 polarizers, two-dimensional (2D) functional polarizers and grid wire polarizers. The summarized methodology based on Mueller-Stokes polarimetry and Poincaré sphere, which bridges the gap between optimal structural design and performance improvement. Furthermore, this study presents characterization techniques, mechanistic insights, and potential applications of polarizers and polarization spectroscopy. These findings offer a comprehensive strategy for designing novel structures and inspire future research on next-generation functional thin films for optical displays, molecular structural analysis, polarization imaging and polarization photodetectors.
Keywords:
polarizers
; polarization spectroscopy
; PVA-I2 polarizers
; 2D functional polarizers
; grid wire polarizers
; Mueller-Stokes polarimetry
; Poincaré sphere
; optical display
; polarization imaging
; polarization photodetectors
1. Introduction
Polarizers and polarization optics has experienced a long history over the past hundred years [1,2,3,4,5,6]. Figure 1a shows the history of polarizer development. As early as 1808, Malus discovered the phenomenon of light polarization in experiments. He used a beam of light to illuminate glass and use another glass to detect whether light was linearly polarized. Seven years later, Biot discovered the dichroism of tourmaline. His experiment proved the reflected light from tourmaline was linearly polarized light, with the vibration direction perpendicular to the incident plane. In 1852, Phelps mixed iodine with canine urine and discovered that the reaction liquid exhibited sparkling green crystals. After reporting this phenomenon to his tutor Herapath, they observed and studied the crystal with a microscope, finding that some areas were bright while others were dark. Thus, it has been learnt that this was a strongly dichroic crystal, a novel polarizing material, also known as Herapath crystals. Dr. Land became interested in polarizing materials starting from 1926 [1]. One of the most significant reasons why he was interested in polarizers is that he dedicated himself to developing glareless headlight systems by polarizers. He believed iodine was a key element, but his experience showed that crystal growth was challenging; After multiple rounds of research, it was found that using polyvinyl alcohol (PVA) as the carrier to prepare polarizing films yielded the best results, specifically H-polarizers in 1938. Subsequently, Japanese and Korean companies mastered this technology and widely applied it to liquid crystal displays (LCDs) and organic light-emitting diodes (OLEDs) for smartphones, TVs, monitors, and other optic display products.
LCD and OLED modules require variant polarizers due to differences in display modes. LCD modules typically consist of upper and lower layers of polarizers, among other components. Figure 1b shows the schematic diagram of comparison of a LCD and OLED structure, where the main difference between two display device is light source [7,8,9,10]. LCD strongly relies on the back light unit. Under the voltage, the liquid crystal layer twists, showing RGB colors. The environmental light entering LCD panel is mostly absorbed by the crossed polarizers and other optical components. As a result, we assume no light is reflected back based on theory. While OLED modules are self-emitting devices, it used metals such as silver or aluminum as cathode electrodes. Therefore, organic light-emitting diodes themselves are high-reflectivity devices [8]. To block the reflected light from the cathode, broadband circular polarizers are typically used. However, this polarizer (comprising a linear polarizer, half-wave plate and quarter-wave plate) performs well only at normal angles. At a steep angle, light leakage (known as pericardial leakage) is relatively severe [9]. Taking current iPad used polarizers as an example, as shown in Figure 2a, LCD polarizers consist of upper and lower polarizers with a typical protective film (PF), surface treatment layer, Tri-acetyl Cellulose (TAC) or Cyclic Olefin Polymer (COP), PVA and Pressure Sensitive Adhesive (PSA); whereas OLED polarizers require only one piece, typically TAC or COP, PVA, PSA and a quarter compensating film. LCD polarizers primarily form straight black images through liquid crystal torsion imaging, whereas OLED polarizers reduce reflection on panels because natural light passing through a linear polarizing layer first forms linearly polarized light, which then becomes left-handed polarized light through a retarder film. Then it becomes right-handed polarized light after cathodic reflection and finally becomes linearly polarized light through a retarder film. Due to the fact that the polarization angles of the above-mentioned linear polarization light are perpendicular to each other, the effect of reducing reflection is achieved (Figure 2a). In recent years, apart from commercially available polarizers, researchers have developed novel optical polarizers to investigate polarization performance. Representative materials and structures include graphene, black phosphorus, and transition-metal dichalcogenides (TMDs), as well as terahertz wire grids [11,12,13,14,15]. These components transmit light with a specific polarization orientation and block light with orthogonally polarized light.
The development of polarizers and polarization optics cannot be separated from polarization spectroscopy, which is a double helix process of interweaving and mutually reinforcing advancement. The early exploration of polarization technology laid the physical foundation for polarizers, and each leap in polarization has further expanded the boundaries of polarization spectroscopy, greatly enriching its applications [2,3,4,6,16,17,18,19,20,21]. One of the most famous discoveries whose properties illustrated in Figure 2b was George Gabriel Stokes parameter (S0, S1, S2, S3), which provided a comprehensive description of the polarization state of arbitrary light waves and laid the theoretical foundation for polarization measurement in 1852. 40 years later, Poincaré mapped four Stokes parameters to a point on a three-dimensional sphere, allowing any polarized state to be intuitively represented as a point on the sphere, thereby helping us better understand polarization optics. In 1943, a geometric approach for studying polarization matrix was proposed to investigate the interaction between polarized light and anisotropic media that alter the polarization state of light. In Mueller matrix calculus, an optical device is described as a 4 × 4 matrix for light intensity measurements. From 1970, instrument such as Mueller Matrix
Spectrometers (MMS) have been able to analyze the structure and optical parameters of complex films, ranging from semiconductors to nanomaterials via measuring “Mueller matrices” at different wavelengths. Additionally, polarization spectroscopy has many applications in astronomy and solar physics, especially for polarization observations of solar spectral lines and corresponding theoretical interpretations, which rely heavily on spectroscopic fundamentals [22,23]. The conversion of polarization imaging technology from clinical to preclinical studies covers the principles of polarization measurement, the latest advancements and clinical potential [21,24,25].
Polarizers and polarization spectroscopy has attracted growing interest dramatically since 1995 (Figure 2c), despite the fact that the publication quantity does not match that of polarizers and polarization spectroscopy individually. There have been fruitful accomplishments for both properties and methodology, yet significant challenges remain. Here, we provide a systematic review of polarizers and polarization spectroscopy, highlighting the significant progress achieved in this field and offering performance analysis of devices in various platforms. This paper is organized as follows: First, the fabrication of polarizers will be introduced within the context of commercial materials and functional thin films. Subsequently, common types of characterization technology for optical polarizers are summarized and compared. Thirdly, methodology (the principles and mathematical formalism) of polarization optics will be discussed, which include principles and mathematical formalism. Finally, we discuss the modern application in this field, alongside the promising prospects that pave the way for future technological breakthroughs.
2. Fabrication Method for Various Polarizers
At present, commercial polarizers possess highly mature manufacturing processes. Traditional methods to fabricate or synthesize polarizers are illustrated in Figure 3. Typically, they are prepared using PVA as the substrate, which is doped with iodine or dyes and then subjected to stretching orientation [7]. This type of PVA-based polarizers has been applied in the display industry for over 20 years. Meanwhile, driven by advances in new thin-film materials, polarizing films based on 2D materials (graphene, black phosphorus, TMDs) synthesized by mechanical exfoliation have developed rapidly in recent years [12,26,27,28,29,30]. Their atomic-level thickness and significant optical anisotropy have opened new pathways for the miniaturization and integration of polarizing optical devices. Furthermore, wire-grid polarizers fabricated via lithography have also attracted considerable attention due to their unique optical properties [31,32,33]. In this section, we review the preparation methods of these two types of polarizing materials, focusing on the key fabrication processes.
2.1. Fabrications of PVA-I2 Polarizers
The central technology of the polarizers used for display is the preparation of PVA-I2 polarizers (linear polarization layer). This system achieves polarization functionality by trapping iodine molecules within the PVA matrix, where iodide ion chains preferentially absorb light polarized in a specific direction [7]. The whole PVA stretching process is shown in Figure 4a. Typically, specific wide-width PVA film raw materials from Kuraray or Mitsubishi Corporation (MC) are first washed and swollen, which eliminates surface contaminants of the PVA raw material while partially dissolving PVA in water. Subsequently, the PVA enters a dyeing tank containing a high-concentration iodine-potassium iodide solution, enabling iodine molecules and ions to adsorb and penetrate between PVA molecular chains. The polarization performance of iodine-based polarizing films relies on the direction-selective absorption of incident light by iodine chains formed after stretching the PVA molecular chains. Therefore, the uniform distribution and bonding state of iodine within the PVA matrix directly affect the degree of polarization and light transmittance of the final product.
After iodine staining, the PVA enters the stretching tank, where 3-5% of boric acid is present. Boric acid cross-linking mainly serves to reinforce intermolecular interactions among PVA chains. It stabilizes the oriented chain structures during subsequent stretching and simultaneously enhances the mechanical strength and water resistance of the polarizing film. Under 50-60 °C temperature conditions, uniaxial stretching of the iodine-stained and cross-linked PVA film can be achieved by adjusting the roll-to-roll speed differences. Stretching causes the PVA molecular chains to highly align along the stretching direction, and the iodide ion chains adsorbed on the molecular chains also arrange themselves in the same direction, forming a dichroic polarizer. Process parameters such as stretching ratio, temperature and rate directly determine the degree of polarization, light transmittance and the properties of the PVA polarizers.
The fine control of the aforementioned processing steps directly determines the optical performance of the polarizers. Understanding the multiscale condensed structures and dynamic evolution patterns during the processing is the key to establishing the molecular-processing-performance relationship of PVA optical films [7].
2.2. Assembly of Multi-Layer Structure of Polarizer
Single-layer PVA polarizers has shortcomings in mechanical strength and weather resistance, so practical polarizers are typically designed as multilayer composite structures. As illustrated in Figure 4b, the PVA after stretching serves as the core layer (polarizer), with support film and protective film adhered on both sides, supplemented by an optically clear adhesive (OCA) layer for subsequent display panel lamination. This multilayer structure effectively enhances the overall mechanical performance and humidity-heat stability of the component while preserving the polarization performance of the PVA layers.
In industrial production, there are two main methods for laminating polarizers with support films and protective films: one is the transfer lamination process, where the PVA polarizer film is bonded onto the support film through a transfer process; the other is the direct bonding method, which involves laminating the functional layers together using adhesives. For common LCD polarizers, it usually involves one PVA stretching process and multiple film lamination steps, where the film lamination is completed during coating PSA and functional films. At that moment, protective films, PSA films, release films and brightness enhancement films are laminated. Different from LCD polarizers, OLED polarizers require the transfer technology of compensation films, where a precise-lamination machine is used. As we can see from Figure 4c, it is assembled from multiple small lamination machines, enabling precise control over tension, lamination gap and roll-to-roll speed. Its design is primarily aimed at preparing for the transfer lamination of liquid crystal. Typically, the lamination of OLED polarizers involves one PVA stretching process and 5-7 precise-lamination steps. The above is the complete preparation process for commercially available polarizers. Afterwards, the polarizer rolls undergo cutting, polarizers’ edge grinding and other processes according to the product size. The final process is to supplied to module factories for panel lamination.
2.3. Synthesis of Other 2D Thin Films
The preparation of two-dimensional (2D) polarizers involves two aspects: one is the synthesis of dichroic 2D materials themselves (including obtaining thin layers of 2D nanosheets from bulk materials), and the other is to make these materials into devices with polarization function. According to the research review published by Hu and Moss et al. in 2024, optical polarizing devices based on 2D materials can be divided into three major platforms: spatial optical devices, fiber optic devices and integrated waveguide devices [12]. Different platforms have different requirements for material preparation methods and device assembly processes. The following is a review from three aspects: synthesis methods of 2D materials, orientation control and fabrications of Wire Grid Polarizer.
2D materials used for polarizing films mainly include GO/rGO, BP, TMD (such as MoS2, WS2 and ReS2), their derivatives and etc. The preparation methods of these materials can be divided into top-down exfoliation method and bottom-up synthesis method. Typical top-down approaches include mechanical exfoliation techniques such as ball milling, ultrasound and repeated tape peeling, but it is difficult to achieve mass production. Mechanical exfoliation is the earliest method used to prepare high-quality 2D thin films, which involves repeatedly peeling off bulk crystals with adhesive tape to obtain single-layer or few layers’ 2D materials. This method is simple and efficient, and can obtain 2D thin films with high crystal quality and few defects, making it widely used in basic research [27]. However, low yield and poor scalability remain the major limitations of this method. In the preparation of BP, mechanical exfoliation is a commonly used method to obtain high-quality thin films [29]. However, due to the air sensitivity of BP, the peeled thin films degrade rapidly under environmental conditions and require passivation treatment to maintain their optical properties. Figure 5a presents a facile ball-milling strategy for the exfoliation of graphite. By grinding dry ice (solid phase of carbon dioxide), graphite and stainless-steel balls on the planetary ball-mill machine, the interlayer interaction force of graphite is weakened. Meanwhile, mechanical force promotes the reaction of edge sites with water molecules to form carboxyl groups. Combined with the solvothermal treatment, this method can successfully fabricate graphene nanosheets [30].
Liquid-phase exfoliation works by dispersing bulk materials in suitable solvents. External energy sources such as ultrasound are applied to strip 2D materials from the bulk matrix, yielding uniform and stable nanosheet dispersions [28]. Furthermore, this approach is cost-effective and amenable to large-scale fabrication. The size distribution and number of layers of the obtained 2D nanosheets can be screened and controlled by parameters such as centrifugation speed and time. The key challenges of liquid-phase exfoliation method are solvent selection (which needs to match the surface energy of 2D materials to avoid nanoparticle aggregation) and exfoliation efficiency improvement.
Chemical vapor deposition is the mainstream bottom-up route for the preparation of 2D materials and it is suitable for the growth of large-area, high-quality thin films. By controlling parameters such as precursor, substrate temperature, and growth atmosphere, CVD can regulate the thickness, domain size and morphology of 2D materials. For non-layered 2D materials such as molybdenum nitride (MoN), their three-dimensional isotropic chemical bonding properties hinder anisotropic lateral growth, making the preparation of large-area continuous thin films more challenging. In recent years, kinetically tailored chemical vapor deposition (KT-CVD) and other methods have provided a solution to this problem by coupling thermodynamics and kinetic control [34]. In Figure 5b, 2D MoN is synthesized by controlling vapor pressure of nitrogen feedstock and annealing at relatively low growth temperatures. By designing double-layer nested quartz tubes, the airflow of nitrogen vapor pressure can be slowed down to generate dynamically stable δ-MoN and γ-Mo2N, while traditional methods can only obtain MoN materials with uneven thickness. A suite of approaches, such as CVD, mechanical exfoliation, liquid-phase exfoliation and electrochemical exfoliation, have been developed for the synthesis of 2D materials, enabling diverse preparation pathways.
Orientation Control and Assembly Methods of Two-Dimensional Materials
For absorptive polarizing films, the orientation order of 2D materials on the substrate directly determines the polarization degree of the device. The realization of macroscopic optical anisotropy depends on the consistent in-plane orientation of the material. For the alignment technology, 2D nanosheets (such as BP nanosheets, carbon nanotubes, etc.) are arranged in a highly ordered manner on a substrate through liquid crystal phase guidance, unidirectional shearing or other methods. Taking carbon nanotubes as an example, thin carbon nanotube polarizers with large area and high polarization efficiency can be constructed by using liquid crystal phase and unidirectional shear drying methods. This strategy demonstrates advantages in broadband applications and heat resistance [12].
Transfer-based layering and integration is another effective strategy for fabricating high-performance 2D functional thin-film polarizers. Typically, 2D material flakes prepared via CVD or mechanical exfoliation, require transfer from their original growth substrates to target device platforms. Taking graphene and GO as examples, researchers have developed a precise deposition technique to integrate ultrathin GO films onto silicon photonic devices. This approach enables accurate modulation of the thickness and lateral dimension of GO films. Furthermore, uniform thermal reduction or localized photothermal reduction can convert GO into reduced graphene oxide (rGO), ultimately yielding optical polarization devices with desirable polarization-dependent loss characteristics [12].
2.4. Fabrications of Wire Grid Polarizers
A Wire Grid Polarizer (WGP) utilizes a metallic wire grid with subwavelength pitch to reflect the electric field component parallel to its polarization axis, while transmitting the orthogonal (vertically polarized) component. In this process, the parallel component is primarily reflected rather than absorbed, enabling efficient polarization separation. WGP can cover a wide wavelength range from deep ultraviolet to terahertz, with advantages such as high extinction ratio, high brightness, wide incident angle tolerance, and excellent durability [33].
The preparation of WGP mainly relies on nanofabrication techniques, including electron beam lithography, reactive ion etching (RIE), and nanoimprinting. Lee et al. [31] combined nanoimprint lithography (NIL) and femtosecond laser (FSL)polishing to fabricate WGP-integrated devices with improved polarization performance (in Figure 5c). InAs/GaSb type-II superlattice (T2SL) materials grown by epitaxial methods were se-quentially processed with NIL and RIE, followed by Au deposition on the ohmic contacts. FSL polishing was then employed for annealing and chip fabrication. Reactive ion etching enables the formation of thick metal lines with well-defined contours, making it suitable for preparing wire grids across various frequency bands. For visible-light applications, however, metal thin films deposited by thermal evaporation yield better performance in linear grid polarizers. In recent years, researchers have developed nano-triangular-waveform WGP using conventional manufacturing equipment combined with nanoimprinting and metal deposition processes, thereby lowering the fabrication threshold for wire grid structures.
The preparation methodology of wire grid polarizers has important reference sig-nificance for 2D material polarizing films. When 2D material films are further patterned or combined with subwavelength structures, the nano-patterning processes developed for WGP can serve as a valuable technical reference.
3. Optical and Structural Characterization of Polarizers and Thin Film Materials
3.1. Basic Optical Performance Characterization Methods for Polarizers
The spectroscopic characterization of polarizers is a significant step in evaluating their optical performance and quality control. Whether it is traditional PVA-based polarizers or recently emerging 2D material-based polarizing films, their polarization properties ultimately require quantitative characterization through spectroscopic methods. The characterization system for commercially used polarizers is already well-established, primarily focusing on key parameters such as transmittance, polarization degree and hue. In contrast, due to the atomic-level thickness and unique optical anisotropy of 2D polarizers, their characterization methods have evolved beyond conventional spectroscopic techniques (Figure 6), incorporating more targeted approaches such as polarized photoluminescence [4,7,10,35,36,37,38], polarized Raman spectroscopy [16,39,40,41], ellipsometric spectroscopy and others [11,42,43,44].
3.1.1. Key Optical Parameters for PVA-I2 Commercial Polarizers
The optical performance of polarizers is primarily evaluated through three significant indicators: transmittance, degree of polarization and hue. Transmittance macroscopically affects the brightness of display devices and microscopically reflects the density of iodine molecule alignment. The degree of polarization represents the film’s ability to convert unpolarized light into linearly polarized light. Hue represents the actual observable color of the product, characterized by the a* and b* color coordinates derived from both transmittance and reflectance measurements. Additionally, depending on specific application scenarios, other performance metrics may require testing, such as transmittance at 380 nm, total reflectance, and diffuse reflectance.
The extinction ratio is a key parameter for evaluating the polarization performance of polarizers, defined as the ratio of maximum transmittance to minimum transmittance (ER = Tmax/Tmin), typically expressed in logarithmic form. A higher extinction ratio indicates stronger suppression capability of the polarizer against orthogonal polarized light.
3.1.2. Polarizing Film Spectral Measurement Method
The spectral characterization of polarizers mainly relies on spectrophotometry. As shown in the Figure 7a, the device called Jasco can measure the parallel transmittance (TMD) and vertical transmittance (TTD) of polarizers at different wavelengths. Then the individual transmittance, parallel transmittance and orthogonal transmittance can be calculated (mechanisms as shown in the Figure 7b and c). In addition, the spectral distribution of polarization degree (PE), the parallel transmittance (Tp) and crossed transmittance can also be calculated by formulas 2 to 4. Under normal circumstances, the different contents of I5-, I3-, I2 and etc. contained in the polarizer layers will affect the monomer transmittance Ts. The higher the content of polarizing substances, the more light is absorbed and the lower the transmittance.
The single transmittance of polarizers can be calculated as:
The Polarizing Co-Efficiency of polarizers can be calculated as:
The parallel transmittance of polarizers can be calculated as:
The crossed transmittance of polarizers can be calculated as:
The alignment uniformity of polarizers directly affects the transmittance (Tc). Specifically, higher alignment degree of polarizing materials corresponds to lower transmittance. Alignment refers to the direction in which polarizing substances are arranged in PVA polymer chains. A more orderly arrangement minimizes light leakage and enhances polarization efficiency. Additionally, the concentration of polarizing substances influences the color coordinate b*(or cross b). Higher transmittance, particularly at 440 nm (Tc) can cause the image to appear bluer, potentially leading to polarizers’ performance issues.
In addition to transmittance and polarization, the most commonly measured performance metrics for OLED polarizers include reflectivity and its corresponding CIE a* and b* color coordinates. When the polarizer is attached to a highly reflective aluminum plate, the assembly appears black. Subsequently, a handheld spectrophotometer (CM-26dG) is used for testing, effectively simulating the optical characteristics of the display panel in its off-state. Color measurement results typically involve two reflection modes. Specular Component Included (SCI) refers to a method that includes specular reflection light. By capturing all surface reflections—both specular and diffuse—SCI objectively represents the intrinsic color of the object, independent of its surface structure or roughness. In contrast, Specular Component Excluded (SCE) refers to a method that measures color by excluding specular reflection light. By employing the Specular Component Excluded (SCE) method, measurement results reflect the colors perceived by the human eye. This is because the human visual system primarily processes diffuse reflection from objects rather than specular reflection under most conditions.
Beyond basic spectra, Park et al. analyzed the polarized light emission from OLEDs that employ a flexible Giant Birefringent Optical (GBO) multilayer reflecting polymer polarizer substrate rather than conventional glass [36]. By employing such a substrate, this work demonstrates the potential for highly polarized light emission from OLEDs. The polarization characteristics of these devices are analogous to those of polarizing films, which are typically used to analyze circularly polarized light performance. For practical applications, the dichroic ratio of the emitted polarized light should exceed 30.
Furthermore, polarizers can enhance the detection capability of instruments and equipment. Gao’s group utilized AlO molecular emission from femtosecond laser-induced aluminum plasma to improve the signal-to-background ratio (SBR) and achieve a lower relative standard deviation (RSD) [35]. In Figure 8a, there are two parts related to polarizers, one part is a linear polarizer inserted between L2 and the fiber probe. Another one is a half-wave plate or a quarter-wave plate placed between L1 and mirror. The synergistic effect of polarizers has made the SBR of AlO spectral at 484.21 nm increased from 8.3 to 10.8 while the RSD decreased from 4.3% to 3.6%. It was further demonstrated that by rotating the half-wave plate, the laser polarization was changed from horizontal to vertical and from linear to circular, which changed the AlO spectral intensity greatly. The above conclusion shows that polarizers and polarization plates are really helpful in reducing optical noise in characterization equipment and improving the stability of spectral data (Figure 8b).
3.2. Mueller Matrix Polarimeter (MMP) and Spectroscopic Ellipsometry (SE)
If the materials have two different refractive indexes, after light crossed that, it makes velocity of light in x and y plane different. This kind of film has been usually called the retardation film. When light passes vertically through a thin film with a phase difference, it decomposes into o-light and e-light inside the film. Due to its propagation perpendicular to the optical axis inside the crystal, the propagation speed of o-light and e-light is different, resulting in an additional phase difference when propagating to the back surface of the film. For polarizer materials with compensation film layers, Mueller Matrix Polarimeter is a very significant analytical tool [4]. It can not only beneficial to obtain phase difference results and Mueller matrix, but also help us analyze the polarization state of light when a beam of linearly polarized light enters the thin film material, passes through the influence of multiple compensation films and finally exits. When polarized light passes through a phase difference film, the phase difference polarization state of the refractive index ellipsoid perpendicular to the incident direction changes. The position difference varies with different angles. Mueller matrix polarimeters are used for measuring polarization elements, liquid crystal cells, retinal imaging and other forms of biological imaging. In Figure 8c, we can see that the device has a laser at one end and a CCD at the other; in the middle, there’s a polarization generator, two symmetrical rotating retarders and a polarization analyzer. The sample to be tested is placed on the center of carrier. The photograph of a commercial used MMP called Axo-Scan was shown in Figure 8d. The light source and polarization generator are in the top head and the analyzer and detector are in the lower head [4]. We will continue to discuss how to use this device in the next section about the methodology of polarization optics.
Since ellipsometer was firstly developed in the 1880s by Paul Drude, it has been widely used for detecting the thickness and refractive index of single-layer thin films. Park et al. developed Frequency Division Multiplexing Spectroscopic Ellipsometry (FDM-SE) technique [38]. Different from traditional SE, this facility uses a function generator to emit three different wavelength light and implement signal reception by discrete-wavelength intensity-modulated laser diodes (Figure 9a). The detailed working principle of FDM-SE is shown in Figure 9b. The fixed polarizer is used to make a linear polarization light and the rotating analyzer is to collect elliptical polarization. After Fourier transform of the IPD signal, ψ and Δ (amplitude and phase difference) parameters can be calculated. In order to evaluate the performance of FDM-SE, authors used SiO2 film on Si wafer as a demonstration to measure detected signal intensity under different rotating analyzer angles. Figure 9c shows the measured data of IPD(t) and the spectrum after Fourier transforms treatment. This facility showed comparable performance to conventional SE. The difference between the measured thicknesses is less than 5 Å on average. The advantage of this facility is to realize multicomplex light source at the same time.
Electronic properties of materials could be studied by applying the appropriate dispersion equation. For the case of an organic material, the modified Tauc–Lorentz oscillator with the energy-dependent broadening proved to be the most appropriate for the precise description and interpretation of the dielectric response. In addition, based on adequate modeling, the results from the analysis of the dielectric function spectra measured for multilayer samples can be converted into knowledge about the material’s nanostructure or interfacial properties. These are of high importance because they determine the OLED devices’ operational characteristics and performance. As it is a non-destructive and non-contact technique, SE can be implemented in situ, so it is a candidate of choice for in-lab characterization, as well as for the control and the optimization of industrial process.
Shuchi and coworkers used ellipsometric measurements of the complex dielectric function of thiazolothiazole (TTz) thin films prepared using spin coating [45]. A parameterized dielectric model function composed of a series of Tauc-Lorentz and Gaussian oscillators was developed. This model dielectric function accurately reproduces the experimental ellipsometric data within the measured spectral range from 0.65 eV to 3.5 eV (354 nm to 1907 nm).
3.3. Polarized Raman Spectrum
Polarized Raman spectroscopy has been widely used to analyze crystal structures due to its unique abilities to unveiling the properties of optically anisotropic materials [40]. Taking the analysis of natural ludlamite single crystals (·4H2O) with a monoclinic structure as an example [16], the optical vibrational modes of were characterized by polarized spectra were acquired in Figure 9d. After polarized light enters the ab plane, three vibration modes are produced: PO4 stretching modes, PO4 bending modes, and external (lattice) modes, along with the PO4 librational modes. There are obvious differences in the peak positions and intensities between the parallel polarized light spectra (aa and bb) and the cross-polarized light spectra (ab and ba). Besides, the cross-polarized spectra (ab and ba) remain almost the same across all spectral regions, suggesting that the Raman tensor of ludlamite is symmetrical, which is a typical feature of non-chiral and non-magnetic crystals. By further analyzing the higher-frequency region spectra, the main peak positions are the symmetric stretching observed near 951 cm−1 and the three antisymmetric stretching modes from 1000 to 1100 cm−1. The mid-frequency and low-frequency regions are relatively complex, with five PO4 bending modes (wavelength range from 400 cm−1 to 700 cm−1) and 15 characteristic peaks (wavelength range from 60 cm−1 to 400 cm−1), respectively. This method is really helpful for studying the structure, symmetry and dielectric properties of crystal materials.
3.4. Elliptically Polarized Light with Other Characterizations
In order to explore efficient circularly polarized light imaging systems, this work proposes a planar lens with engineering dispersion response, which simultaneously forms two object images with opposite helicity within the same field of view. Through this method, chiral properties can be detected in the visible spectrum using only lenses and cameras, without the need to add polarizers or dispersive optical devices. Placing a wire grid polarizer (Thorlabs WP25LUB) and a quarter wave plate (Thorlabs AQWP05M-600) between the optical fiber and MCHL to control the polarization state of the incident beam [46].
The photoluminescence spectrum is sensitive to exciton behavior, defect states and band structure. In 2D anisotropic materials, the intensity and energy position of photoluminescence often vary with the polarization direction of the excitation light. Polarized photoluminescence measurement can reveal the polarization selective absorption and emission characteristics of excitons, providing information for understanding the energy valley physics and exciton dynamics of materials.
Polarization dependent optical absorption and transmission spectra are direct means of characterizing the line dichroism of 2D materials. By measuring the transmittance or absorptivity of incident light with different polarization directions, the dichroism ratio of the material can be quantitatively obtained, which is the basis for evaluating the performance of the material as a polarization sensitive photosensitive absorption layer.
3.5. Optical Property Characterization of Two-Dimensional Thin Film Materials
The generation of second harmonic is highly sensitive to the symmetry of crystals and is an effective tool for detecting the orientation and structural symmetry of 2D materials. The second harmonic signal intensity of anisotropic 2D materials varies periodically with the polarization direction of the incident light and the angle between the crystal axis, which can be used to determine the crystal axis direction of the material.
To determine the optical properties of a sample accurately, the polarization properties of the light must also be known accurately. Many terahertz emitters will have both horizontal and vertical polarization components and often assumptions are made about device characteristics without measuring them-even the position of excitation beam on the photoconductive emitter can affect the resulting terahertz electric field and so the exact optical properties of a given device will vary depending on how they are configured.
The metal wire grid manufactured from this work provides up to 94.3% polarization and~22.1 dB extinction ratio over a wide frequency range of 0.2-2.5 THz. Meanwhile, the metal wire grid structures prepared in this way are effectively used as anti-reflective coating materials, demonstrating their multifunctionality and versatility. These durable, long-lasting and low maintenance metal wire grid structures will meet the sustained demand for efficient terahertz polarizers [15].
4. Measurement Methodology of Polarization Optics
The methodology of spectroscopic measurement for polarizers is founded on the fundamental framework of polarization optics. Through specific characterization methods, the properties of thin film materials can be efficiently analyzed, and various challenging problems encountered in different fields can be addressed in practical applications. Whether it is commercial PVA-I2 absorption-type polarizers or polarizing films based on 2D anisotropic materials, their performance evaluation relies on precise measurement of the polarization dimension in the interaction between light and matter. In the mathematical description of polarization optics, the Stokes vector (a 4×1 vector) is used to characterize the polarization state of a light beam, while the Mueller matrix (a 4×4 matrix) describes the transformation characteristics of the incident Stokes vector by the sample [4,47,48]. Formalism in Figure 10 constitutes the theoretical basis for modern spectroscopic measurement of polarizers.
The characterization system for commercial polarizers centers around spectrophotometry, establishing standardized testing procedures for parameters such as transmittance, degree of polarization and reflectance. In recent years, techniques such as Mueller matrix ellipsometry and polarization imaging have played an increasingly important role in areas such as display performance optimization [49,50,51,52,53,54,55,56,57,58,59,60], polarization imaging method based on liquid crystal polarization grating and polarization grating microarrays [14,15,32,61,62,63,64], elliosometry study [65,66,67,68] and etc. [69,70]. The following provides a comprehensive review of these methodologies and their applications.
4.1. Basic Definition of Parameters Stokes Vectors, Mueller Matrix and Poincaré Sphere
The methodology of polarization optical measurement is founded on two complementary mathematical frameworks. As illustrated in the Figure 11, the Stokes-Mueller formalism employs a 4×1 Stokes vector and a 4×4 real Mueller matrix, enabling the handling of partially polarized and non-polarized light [4,48,71]. It is particularly suitable for practical optical systems that incorporate depolarization effects. In 1852, Stokes proposed a vector consisting of four parameters to describe the polarization state of light, known as the Stokes vector. Within the realm of linear optics, the Stokes vector, a 4×1 vector, is utilized to characterize the state of polarization (SOP) of a light beam. Different polarization states of light, such as horizontal linear polarization, 45° linear polarization, circular polarization, elliptical polarization and etc., can be represented through the Stokes matrix, facilitating a better understanding of the principles of polarization spectroscopy (Figure 11a). Upon interaction with a medium, the polarization state of a polarized light beam undergoes changes.
The polarization state of light can be described by the Stokes vector as below, Ax, Ay means x, y directional amplitude, △=δy-δx means x, y directional phase difference.
S0 = Ix + Iy = Ax2 + Ay2 (Total light intensity)
S1 = Ix − Iy = Ax2 − Ay2 (Horizontal linear polarization)
S2 = I45° + I-45° = 2AxAycosΔ (45° linear polarization)
S3 = IR − IL = 2AxAysinΔ (Circularly polarization)
Assuming the interaction process is linear and denoting the polarization state of the incident light as Sin = [S0, S1, S2, S3] and the polarization state of the outgoing light after passing through the optical medium as Sout = [S′0, S′1, S′2, S′3], the relationship between the two can be expressed as Figure 11b. This formula was proposed by Hans Mueller in 1947 and the mathematical description is shown in the above equation and Figure 11b. Mueller matrix is a 4×4 matrix describing the transformation properties of the object that affect the Stokes vector. In the framework of the Mueller matrix, the transformation of an optical element or sample on the incident polarization state can be represented as: Mueller matrix (MM) describes the vectorial transformation properties of an object. Its 16 elements contain all the polarization information of the sample—including dichroism, phase delay, optical rotation and depolarization effects. For example, the optical axis and phase difference of the Quarter-Wave Plate (QWP) can be calculated through the method shown in the Figure 11b. By performing polarization decomposition on the Mueller matrix, these coupled polarization effects can be separated one by one.
For Stokes vector visualization, the parameters (S1, S2, S3) representing the polarization state are represented in an orthogonal coordinate system and their trajectory plane will be a sphere, which is called the Poincaré sphere (PS) [4] (see Figure 11c). Horizontal linear polarizers and partial linear polarizers are all located on the equator, with the North and South poles representing right-handed circularly polarized light and left-handed circularly polarized light, respectively. And other positions representing elliptical polarization. The mutually orthogonal Stokes vectors exist in a centrosymmetric form, (a) intuitively representing the polarization state, (b) the polarization azimuth angle θ, and the ellipticity angle β of elliptical polarization are represented twice on the sphere (2θ: longitude, 2β: latitude), (c) for centrosymmetric polarization states, the difference in polarization azimuth angle is 90°. The advantage of this methodology lies in its ability to not only describe the performance of ideal polarization components but also quantitatively characterize the depolarization effect commonly present in actual polarizers, which is the physical root cause of issues such as dark-state light leakage.
4.2. Display Performance Improvement
LCDs include various display modes such as Twisted Nematic (TN) LCD (bend alignment LC) [54], In-Plane Switching (IPS) LCD [50,59], and Vertical Alignment (VA) [53,54,55]. The thickness of the LC layer affects light leakage. Light leakage is usually caused by misalignment deviation of orthogonally polarized films under oblique viewing angles, light scattering, and phase delay of liquid crystal molecules. To address this issue, one method is to first analyze the phase compensation principles using the Poincaré sphere representation. Then, we systematically derive analytical solutions for some commonly employed IPS and VA modes. In this part, we will focus on discussing the mechanisms of photonic compensation proposed by uniaxial films and biaxial films. Zhu et al. analyzed the performance of phase compensation under different combinations of stacked structures +A and +C, or +A and -C compensation films using the Poincaré sphere, providing valuable insights and methods for addressing light leakage in the dark state of LCDs [49]. In this section, the author first introduced the situation where light leakage didn’t occur under normal conditions, as shown in Figure 12a and b. Under normal viewing angles, the upper and lower polarizers can form a black image at right angles, preventing light leakage; points A and P exhibit centrosymmetric properties, with the two linearly polarized light beams perpendicular to each other. However, under wide viewing angles, especially when viewed from the side, as shown in Figure 12c and d, the angle between the polarizer and the analyzer becomes less than 90°. Consequently, both the incident light (point P) and the reflected light (point T) are no longer on the S2 axis. In fact, only when the incident light is at point P and the reflected light is at point A, can light leakage be avoided. To address this issue, analysis using the Poincaré sphere reveals that by using +A and +C compensation films, the incident linearly polarized light can be effectively converted into circularly or elliptically polarized light and then returned to the direction where the original linearly polarized light should be emitted, thereby solving the problem. Taking IPS-LCD as an example, a positive C-film and a positive A-film are placed between the front polarizer (front pol) and the liquid crystal, and the rear polarizer (rear pol) has the same optical axis direction as +A. The linearly polarized light travels from point P to point T, then enters the +C and +A films, whose effective optical axis positions on the Poincaré sphere are points C and P, respectively. It first rotates to point E (along the CO axis) and then rotates along the PO axis to point A, successfully eliminating light leakage. Similar methods can be applied to other film combinations, such as +A/+C plate and +A/-A plate with varying optical axis angles, to eliminate light leakage at wide viewing angles.
Lee et al. also solved the light leakage problem in LCD displays in the VA domain through a similar approach [53]. After optimizing the wavelength dispersion of the retardation film, focusing on dark-state light leakage, the optical compensation film was the main solution. The Mueller matrix method was employed to optimize the optical configuration of the vertically aligned liquid crystal cell. By introducing compensation layers such as A-plate and C-plate into the liquid crystal cell, off-axis light leakage can be eliminated throughout the entire visible light range. In terms of the compensator design method, the researchers proposed a compensation scheme based on Stokes vector polarization measurement: extracting equivalent parameters (δ, θ) from the original retarder’s Mueller matrix, and then designing a single compensating retarder to achieve polarization compensation. This Mueller matrix-based compensation design method is more systematic and predictable than the traditional trial-and-error method.
Tien et al. proposed a chromaticity model based on the Mueller matrix for the quantitative analysis of dark-state light leakage in multi-domain vertical alignment liquid crystal displays [57]. This model incorporates the depolarization effect during light propagation through liquid crystal molecules, polarizers and color filters. Through this model, the researchers found that the light leakage intensity in the convex areas is three times that in the non-convex areas. More importantly, the deviation between the chromaticity simulation values and the measured values is only around 0.01, verifying the reliability of the Mueller matrix method in quantitative analysis of light leakage.
For OLED polarizers, when the interlayer material, such as PVA, exhibits significant wrinkles, and when the customer’s panel is attached and covered with a low-reflective and anti-reflective (AG) cover glass, Fine Pitch Mura may occur under screen-off conditions. This is a defect in display products that needs to be improved and resolved. Through the Poincaré sphere (Figure 12c), when the polarizer is set at 90° & 180°, the PVA surface reflection aligns with the detecting polarization and the system is near an extinction condition (Phase ≈ 90°, low S0), so small polarization changes are converted into large intensity contrast. In contrast, at 135°, the PVA reflection is suppressed, while higher background (increased S0) and lower phase sensitivity reduce FPM visibility. This also provides a way of thinking for improving the analysis of this type of defects.
4.3. Polarization Imaging Method Based on Liquid Crystal Polarization Grating and Polarization Grating Microarrays
The micro-polarization array is the central component of the focal plane polarimeter. Compared to the nanowire grid array, the liquid crystal polarization array possesses advantages such as flexible design, straightforward manufacturing process and stable performance. By studying the polarization theory of light, the polarization information detection of light is determined based on the Stokes vector method. The device structures, fabrication processes, and polarization modulation effects on light waves of liquid crystal variable phase retarders and liquid crystal polarization gratings needs to investigated before designing a polarization grating. Firstly, the polarization theory of light has to be studied, and the polarization information detection of light is determined based on Stokes vector method. The structure, fabrication process and polarization modulation of liquid crystal variable phase retarder and liquid crystal polarization grating are both important.
As shown in Figure 13, one of the classical papers published by RuBin and his coworkers is about a metasurface polarization camera designed based on Full-Stokes vectors [63]. In this article, the authors combine matrix Fourier optics and construct optical models through a series of methods such as Jones matrix, Stokes matrix, Müller matrix, and the Poincaré sphere. Subsequently, they fabricate a TiO2 metasurface using electron beam lithography and atomic layer deposition for using as a matrix grating in a standard monochrome complementary metal–oxide–semiconductor (CMOS) imaging sensor. The main innovation of this work isn’t the TiO2 array or the visible wavelengths, but the design and construction of a full Stokes polarimeter for an 11×11 element grating. As shown in Figure 13a, the author carried out a series of attempts to prove the feasibility of this strategy. Next, metagrating was integrated the into the imaging system to build a CMOS imaging sensor (Figure 13b). This camera eliminates the need for polarizers or waveplates and can then be utilized for practical full-Stokes photography.
Xuan et al. used liquid crystal polarization grating (LCPG)for full stokes polarization imaging [62]. By using the Muller matrix and a quarter waveplate (QWP), they optimize the design of polarization detection system and applied it for linear polarization detection and full Stokes polarization detection. To achieve efficient glasses-free 3D effects, Xia et al. utilized the Jones matrix formula and optical simulations to complete the construction of the optical system [61]. The outgoing light from the liquid crystal panel is now vertically linearly polarized. After passing through a twisted nematic liquid crystal layer with transparent electrodes, where no voltage is applied, the polarization direction of the light is rotated 90° to become horizontally linearly polarized. Then, after passing through a QWP, it becomes right-handed circularly polarized light. When this right-handed circularly polarized light is incident on the polarization grating, the diffracted light emerges in the +1-order diffraction direction. Therefore, the image loaded on the liquid crystal display panel will be emitted in this direction and eventually enter the right eye of the observer. If a voltage is applied to the twisted nematic liquid crystal layer, an electric field perpendicular to the liquid crystal layer will be generated, causing the twisted nematic liquid crystal layer to lose its optical activity. The polarization direction of the light emerging from the twisted nematic liquid crystal layer remains in the vertically linearly polarized state. After passing through another QWP, it becomes left-handed circularly polarized light. When this left-handed circularly polarized light is incident on the polarization grating, the diffracted light emerges in the -1-order diffraction direction. Therefore, the image loaded on the liquid crystal display panel will be emitted in this direction and eventually enter the left eye of the observer. The image entering the right eye and the image entering the left eye are two images with parallax. When polarization micro-array technology makes compact and parallelized polarization imaging systems possible, it has broad application prospects in the field of real-time polarization measurement and imaging.
4.4. Ellipsometry Study of Other Functional Films
In addition to methods such as Stokes vectors and Mueller matrices, there are also some simple methodologies related to the design of circular polarization spectroscopy that can greatly assist in enhancing product performance.
In order to solve the ohmic losses, Shao et al. designed twisted bilayer plasmonic metasurfaces [66]. At a wavelength of 1660 nm, the circular dichroism value reaches 0.48, and it further increases to 0.84 at 2200 nm. This scheme differs from the traditional “waveplate–polarizer” cascading approach and is also distinct from three-dimensional helical configurations that rely on the intrinsic chirality of the structure. The designed device consists of two stacked anisotropic plasmonic metasurfaces, each of which does not possess intrinsic chirality. However, by precisely controlling the in-plane twist angle between the two layers, the mirror symmetry of the overall structure can be effectively broken, thereby inducing strong CD in the transmission spectrum.
Middendorf et al. developed a simple but effective solution to eliminate or reduce the insertion loss for narrow frequency bands, a polyvinyl-chloride (PVC) antireflection (AR) coating, which has improved the transmittance of THz polarizers [67].
5. Applications of Polarizers and Polarization Spectroscopy
Polarizers have been widely used in the field of liquid crystal displays for decades. In recent years, polarizing film materials based on 2D materials such as BP, TMDs and graphene have garnered attention due to their atomic-level thickness and unique optical anisotropy. Simultaneously, polarization spectroscopy, as a methodological bridge connecting polarizing elements with specific applications, is playing an increasingly important role in fields such as display optics, chemical structure detection, biomedical imaging, and optoelectronic devices (Figure 14). Next, we will further introduce the applications of polarizers and polarization optics in the fields of optical displays [5,72,73,74], molecular structural analysis [75,76,77,78], polarization imaging [21,63,79,80,81,82,83,84,85,86,87], and polarization photodetectors [12,86,88,89,90,91,92].
5.1. Optical Display
Polarizers play a significant role in the display industry, with their applications spanning both consumer electronics (such as mobile phones, computers, and LCD TVs) and industrial control (including automotive electronics, medical devices, and instrument displays). Although polarizer technology has matured significantly, there remains substantial room for improvement in various application scenarios, particularly in terms of compatibility with panel design [5]. Certain mobile phone models demand enhanced waterproofing and resistance to noticeable fading at the edges after exposure to artificial sweat. Furthermore, product structures evolve rapidly, with customers continuously demanding thinner polarizers to minimize creases, enabling their application on foldable phone screens or other high-end models. Beyond the commonly used PVA-iodine polarizers in the display sector, terahertz polarizers have emerged as a pivotal component in next-generation (6G) high-speed wireless communication, thanks to their precise control and detection of the polarization state of terahertz waves, thereby enhancing spectral efficiency and data transmission rates [73].
Polarization spectroscopy is the central method for characterizing the performance of polarizers. Spectrophotometry calculates the degree of polarization and extinction ratio by measuring the parallel and perpendicular transmittance spectra. Phase difference analyzers can analyze the compatibility of products and panels through binding, thereby helping us better design display devices with superior performance. As shown in Figure 15a, Maria analyzed the thickness increasement of crystal growth between different film layers of OLED devices using spectroscopic ellipsometry [72]. While OLED devices are usually made up of an electron transport layer (ETL), a light-emitting layer (EML) and a hole transport layer (HTL). The author used SE spectroscopy and data fitting to get the thickness of the electron transport layer PFN-Br film under three models. Model 1# is 9.5 nm, while the other two models show some blending between the electron transport layer and the light-emitting layer, with thicknesses of 32.7 nm and 34.6 nm, respectively. Among them, the simulation result of model 3# is the closest to the experimental result. Based on this result, we can explain why the light-emitting efficiency of this device is relatively low.
5.2. Molecular Structural Analysis
Polarization spectroscopy boasts multiple mature techniques in chemical structure analysis. Linear polarization infrared spectroscopy is widely used for the orientation and structural analysis of biomolecules, cells, and tissues. Furthermore, polarization spectroscopy sensing involves characterizing left-handed and right-handed photon states, reconstructing the complete polarization state of the detection signal, and thereby obtaining information related to the stereochemical structure of the sample, such as polarization ellipsometry and polarization rotation angle. Based on this, chiral spectroscopy detection technology further analyzes the differences in photon polarization states caused by the configuration and conformation of the sample, obtaining circular dichroism spectra and optical activity spectra. Conducting research on polarization spectroscopy and chiral spectroscopy sensing detection helps to obtain multi-parameter information related to the molecular structure of the sample, while simultaneously enhancing detection sensitivity and accuracy. The polarization spectrum refers to the polarization elliptical angle (PEA) and the polarization rotation angle (PRA) spectra.
Zhong et al. developed a biochemical molecules-PVA film coated PI film sensor, it demonstrates high performance in achieving quantitative detection of saccharides while also facilitating qualitative discrimination between different saccharides [78]. Firstly, terahertz polarizers were prepared with a 200 nm Au array on a 100 μm thick Polyimide (PI) film as the substrate. Then, PVA and saccharides samples were mixed in a solution and then spin-coated onto the surface of the metasurface-Polyimide (PI) film. As shown in Figure 15b, different saccharide molecules exhibit distinct spectral patterns. Among all the saccharides, galactose has the most unique spectrum, showing a clear red shift. The linear polarization spectra of glucose and lactose are difficult to distinguish, and their peak positions are very close, with only slight differences in intensity. In the PRA spectrum, the polarization angle of lactose is always greater than that of glucose, allowing for qualitative distinction between the three sugars. Additionally, the polarization ellipses of the THz wave affected by three kinds of sugars also have significant differences at specific frequencies.
When testing the CD spectra of chiral molecules, it is often difficult to distinguish due to weak signals. Zhang and others constructed a metasurface to detect chiral amino acids and biomolecules [77]. Compared to direct detection, this method can amplify the response signal. The CD spectra of tyrosine, cysteine, arginine, and their chiral enantiomers were amplified by the same metasurface, and the maximum enhancement was about 97 times. This strategy demonstrates the great potential of polarimetric spectroscopy in the field of molecular detection.
In another work, Liu et al. proposed a novel Pancharatnam–Berry (PB) metasurface which can influence CD angles [75]. The spin beam deflection and separation of the PB metasurface can effectively amplify the chirality response of the substance, and significantly improve the chirality characteristics. The experimental results show that the transmission of D-tyrosine at a negative angle deflection is always greater than that at a positive angle deflection, and the results of L-tyrosine are opposite. The CD values of D-tyrosine and L-tyrosine reach 16.4° and −11.6°, respectively, which are 9.3 and 11.9 times higher than that without the PB metasurface. This method has been successfully applied to distinguish chiral isomers of amino acids, which provides a new way to determine chiral substances. The above studies on the sensing of chiral substances are all based on metasurfaces without chiral properties.
Patty and his coworkers have studied circular polarization–phase angle dependency of vegetation induces relatively small changes in spectral shape and mostly affects the signal magnitude [76]. With these results, it can be underlined the use of circular spectropolarimetry as a promising agnostic biosignature complementary to the use of linear spectropolarimetry and scalar reflectance.
5.3. Polarization Imaging
Polarizers are one of the most significant components for achieving polarization imaging. Traditional polarizers, based on principles such as dichroic absorption or birefringence, perform functions of generating, selecting and detecting polarization states in imaging systems. In recent years, 2D materials, with their atomic-level thickness and remarkable optical anisotropy, have provided a new material platform for polarization-enhanced imaging through their metasurface. Polarization spectroscopy combines polarization measurement with spectral analysis, further expanding the information dimension of polarization imaging. The following will focus on the applications of polarization imaging in the fields of imaging technology and biomedicine.
Polarization 2D imaging technology plays a significant role in polarization decomposition. Chen’s group uses periodic integral images to replace orthogonal polarization images in order to eliminate mutual interference from different polarization directions and image noise [79]. Polarization differential imaging (PDI) is developed to collect a series of images with different polarization directions within a complete image variation cycle, and accumulate these images to obtain the integral of the polarization dimension. This further yields the polarization degree of each pixel and a clear polarization difference image. The author studied the results of processing normal images, low turbidity underwater images, and high turbidity underwater images using optical correlation, Stokes vector, and PDI methods in four scenarios (Figure 16a). Experimental results show that the performance of image restoration is excellent, especially in high turbidity conditions. Compared with traditional polarization difference imaging methods, this approach effectively suppresses image noise and improves underwater imaging quality.
Self-learning-based polarization 2D imaging has achieved great success in image fusion; in 2021, Zhang et al. proposed using a self-learning strategy to solve the problem of polarization image fusion [80]. The network consists of an encoder, a fusion (Convenlution and ReLu function) layer, and a decoder layer. It fuses the feature images extracted by the encoder and then inputs them into the decoder to generate a fused image. The authors compared the image fitting results of their developed model with those of other models and various indicators showed that this method performed well. It means that the Convolutional neural networks (CNNs) have unique advantages in image processing. In 2022, Zhang et al. proposed the Cycle Convolutional Neural Network (CCNN) method to achieve visible light polarization image desmogging [81]. Smog and haze images are difficult to deal with, and the approaches to processing models are also different; the target detection sub-network in this network detects smoke areas based on polarization feature information. Then, it utilizes an encoder-decoder sub-network with a feature transformation structure to generate fog-free areas, which are fused with the original hazy visible light polarization images to obtain a coarse clear image. This coarse clear image is used as the input data for the model, placing the model in a cyclic topology and ultimately obtaining a high-definition fused image. They contributed the first large-scale visible light polarization image desmogging evaluation dataset, consisting of 17,216 visible.
In 2015, Missael Garcia et al. addressed the ambiguity of zenith angle using the method of circular polarization [83]. The relationship between zenith angle and degree of circular polarization is a monotonic function, and the zenith angle can be uniquely determined by the degree of circular polarization, thus solving the ambiguity of zenith angle.
The main contributions of this paper are twofold: a mathematical framework for polarization-based surface normal reconstruction and utilizing circular polarization to uniquely solve the zenith angle of the surface normal. The scene shows a PET plastic bottle with a refractive index of 1.64. The angle of polarization image is presented using a false color scheme, where red represents horizontally polarized light, i.e., 0 degree of light oscillation angle, and blue represents vertically polarized light, i.e., 90 degrees of light oscillation angle. The angle of polarization maps directly to the azimuth angle after providing the seeding pixels in the image.
Polarization imaging plays a significant role not only in the processing of images of macroscopic objects but also in the observation of microscopic objects, where it has seen considerable application and development. Through polarized wide-field microscopy, isotropic depolarizing tissues and non-birefringent tissues can be analyzed [19,24]. Recently, Mueller polarimetric imaging has emerged as a promising technique for tissue imaging, enhancing image contrast and offering a unique perspective to reveal additional information that cannot be resolved by other optical imaging modalities.
One of the reviews given by He et al. also explained the importance of polarization image in bio tissues [21]. These sub-matrices are converted into individual parameters associated to diattenuation, retardance, and depolarization properties. Cancerous tissue with high vascularization and high cellular density depolarizes less than the other tissues. The measured depolarization also depends on the tissue thickness, direction of projection and light penetration depth in the colon layer.
Vizet et al. analyzed human muscle clone tissue samples using a dual-wavelength method [87]. The first wavelength (λ1 = 633 nm) is used to characterize the fiber, while the second wavelength (λ2 = 638 nm) is used for characterizing the assembly of fiber plus sample. A healthy human colon tissue sample was cut into a 30 μm thick glass on a plane perpendicular to the axis of the colonic canal and place it on an aluminum coated glass plate with 98% reflectivity without standard staining. In order to highlight the superiority of this work, the imaging performance of A Mueller microscope and two-wavelength differential technique has been compared (Figure 16b). The images obtained by the two methods are very similar and comparable in many ways, but the endoscopic setup has lower resolution and smaller pixels, so the images of zone 1 and 2 taken with the two devices still show obvious differences when zoomed in, especially the linear retardance in zone 2. This study shows that besides improvements in facilities, another area that needs further enhancement is measuring across different wavelength ranges (usually green and red) at the same time, because the depth light penetrates into tissue actually depends on the wavelength.
5.4. Polarization Photodetectors
In the application scenario of polarization imaging, polarization-sensitive photodetectors based on 2D materials can directly convert polarization information into electrical signals, eliminating the need for external components such as polarizers. This intrinsic polarization response mechanism not only reduces the system’s size and complexity, but also avoids the loss of response speed and spatial resolution caused by passive filtering in the traditional “polarizer with detector” approach.
In 2021, Ahn et al. from the Korea Institute of Science and Technology (KIST) developed a self-powered linear polarization-sensitive near-infrared photodetector based on a 2D WSe2/ReSe2 van der Waals heterostructure, utilizing classical mechanical exfoliation and a polydimethylsiloxane stamp transfer method [90]. In a semi-perpendicular geometry, the Pt bottom electrode overlaps with the WSe2/ReSe2 heterojunction, reducing the quasi-neutral region that acts as a parasitic resistor and generating a significant photovoltaic effect for self-powering. This photodetector exhibits excellent optoelectronic performance, with a wide spectral light response ranging from 405 nm to 980 nm, a linear dynamic range of 100 dB, and a high cut-off frequency of 100 kHz. Additionally, under 980 nm near-infrared illumination, significant polarization-dependent photocurrent can be observed. Furthermore, this LP-sensitivity material maintains good stability when exposed to air for over five months.
In 2024, Hu et al. employed a similar method to fabricate a 2D ReS2 photodetector for high-performance self-powered polarization-sensitive photodetection [88]. This study revealed that under 650 nm illumination, the ReS2 photodetector exhibited excellent optoelectronic performance, with a responsivity of 0.28 A·W−1 and a detectivity of 4.22×10⁹ Jones. The polarization sensitivity reached 2.79, and the fast current response times (rise time/fall time) were 2.63 and 2.11 ms, respectively. These performances could be further optimized by adjusting the gate voltage. At a gate voltage of 40 V, the maximum responsivity and external quantum efficiency (EQE) were approximately 0.41·AW−1 and approximately 78%, respectively. Additionally, a balanced photodetection system was proposed. This system consists of two ReS2 photodetectors, with their b-axes perpendicular to each other. Since the b-axis of the ReS2 material is parallel to the direction of maximum photocurrent, the output photocurrent curves of the two photodetectors with perpendicular b-axes are opposite in trend, and a zero point can be obtained through balanced detection technology. At the zero point, the photocurrent tends to zero, so theoretically, the linear polarization extinction ratio tends to infinity. This study provides inspiration for further developing high-performance 2D material polarization photodetectors.
Typically, the polarization ratio (PR) values of most 2D photodetectors are less than 10 (PR = Imax/Imin), which limits their development. Li et al. first prepared a CdSb2Se3Br2/WSe2 bulk material through solid-phase high-temperature synthesis, and then constructed a heterojunction polarimetric photodetector using mechanical exfoliation transfer [91]. By designing sublattice carrier transitions, they achieved a reconfigurable high polarization ratio. CdSb2Se3Br2 is composed of alternating CdBr2 and Sb2Se3 chains forming a periodic sublattice structure. Carriers within the sublattice prefer to transition along the Sb2Se3 chains. By utilizing the sublattice carrier transitions in the CdSb2Se3Br2/WSe2 heterojunction and varying the gate voltage, the energy band alignment of the heterojunction can be anisotropically adjusted. Due to the anisotropic sublattice carrier transitions, this heterojunction exhibits polarization-dependent light-induced threshold voltage (Vth) drift. Simultaneously, the significant Vth drift provides sign reversal of the polarization photovoltaic current and a reconfigurable polarization ratio, ranging from positive (unipolar region) to negative (bipolar region), covering all possible values (1→+∞/−∞ →−1). The device achieves a highly efficient polarimetric detection capability with a PR value up to approximately 102 by varying the gate voltage.
Inspired by bees’ ability to respond to polarized light directions for navigation and by the human visual system, Yan and Wu et al. developed an optoelectronic device [89], which is an optically-controlled polarimetry memtransistor (OCPM) based on a van der Waals heterostructure (ReS2/GeSe2). Notably, the synthesis method of ReS2/GeSe2 is simple, requiring only mechanical exfoliation using Nitto tape for transfer onto a carrier; this device combines an intelligent polarization photodetector with an artificial neural network to obtain a machine vision system that integrates human cognitive functions with the special visual abilities of other species. The device provides polarization sensitivity, nonvolatility and simultaneous positive/negative photoconductance. Both ReS2 and GeSe2 exhibit certain resistance switching characteristics, which are crucial for neuromorphic computing systems, while their adjustable electrical properties and photosensitivity make them ideal materials for machine vision. Applying this system to autonomous vehicles can enable real-time navigation and anti-glare pattern recognition. Just like bees swing to pass on information and detect polarized light to figure out direction, OCPM can tell the solar meridian (SM) and polarization direction (PD) outdoors. This cross-species hybrid machine vision provides a new concept for designing artificial intelligence systems and is expected to be applied in fields such as medical diagnosis, holography and intelligent robotics (Figure 17).
5.5. Other Applications
In the field of AR/VR research, specifically augmented and virtual reality, selecting the appropriate linear polarizers, circular polarizers, wave plates and reflective coatings to pair with projectors can enhance the visual experience when people wear AR glasses, thereby providing viewers with different visual experiences. In photography, polarizers are used to reduce glare, enhance contrast and improve color reproduction. For chiral materials that emit light with circular polarization, they can also be applied in fields such as photocatalysis, photodetection and biomedicine [12,21,93].
6. Perspective
Polarization imaging technology is currently undergoing a significant transformation, characterized by a shift from discrete components to integrated systems, from static measurements to intelligent processing, and from single-dimensional data to multimodal fusion. The synergistic advancement in three key areas—polarizers, 2D polarizing thin-film materials, and polarization spectroscopy—is redefining the technological boundaries and expanding the application scenarios of polarization imaging.
The demand for traditional polarizers in the display sector is expected to continue growing. With the accelerated iteration of global consumer electronics and the expansion of application scenarios such as in-vehicle displays and industrial applications, the market demand for polarizers is poised to rise. The global competitive landscape is intensifying, exhibiting a clear geographical concentration. Technologically, the development of commercially used PVA-I2 polarizers is advancing in two directions. First, there is a continuous optimization of performance, featuring higher light transmittance, greater extinction ratio, thinner product structures and improved environmental stability to meet the requirements of next-generation display technologies for image quality and reliability [7]. Secondly, a transformation in form and function has occurred: the introduction of metasurface technology enables polarization manipulation at the sub-wavelength scale, facilitating the miniaturization and on-chip integration of polarization imaging systems. Consequently, the development of metasurface polarization devices is evolving from 2D to 3D architectures [69]. Light beams with spatially varying polarization structures are gaining increasing attention due to their unique optical properties and the additional degrees of freedom in coding technology. Although polarizers remain a crucial component of LCD products, with the emergence of Color Filter on Encapsulation (COE) technology [94], OLED polarizers may disappear in the future, which will have a significant impact on the entire industry chain. This is driving us to develop new thin-film materials that can more efficiently produce both linear and circular polarization effects.
Novel 2D materials offer a path to polarization imaging that differs from traditional optical polarizers. Low-symmetry 2D materials provide an ideal platform for the development of high-performance, miniaturized polarization-sensitive photodetectors, owing to their unique broken crystal symmetry and polarization-dependent photoelectric response [95]. Current challenges center on the following aspects. First, the intrinsic polarization ratio is generally low, necessitating enhancement via new physical mechanisms, such as plasmonic effects. Second, the environmental instability of certain materials (e.g., black phosphorus) has yet to be fundamentally resolved, which limits their practical device applications. Third, achieving broadband response while retaining high polarization sensitivity, as well as performing on-chip simultaneous analysis of polarization degree and angle, remain technical bottlenecks that must be overcome. Fourth, although the mass-production process for 2D polarizers is being accelerated to meet the demands of emerging optoelectronic devices—a move that would greatly advance the entire field—scaling up fabrication still poses a significant challenge [96]. The simple use of adhesive tape (e.g., Nitto tape) for exfoliation is highly inefficient and cannot guarantee stable synthesis.
The methodology of polarization spectroscopy is currently at a critical stage of transition from time-series modulation to snapshot measurement. Taking Stokes vector-Mueller matrix imaging as an example, this technology has developed into a key means of quantitative polarization characterization over the past three decades. However, the inherent sequential acquisition characteristic of time-series modulation severely limits the temporal resolution. In recent years, snapshot methods such as spatial multiplexing based on micro-polarizer arrays, spectral encoding and metasurface-assisted modulation have emerged, enabling the capture of multiple polarization states in a single exposure.
The future development of polarization spectroscopic imaging technology may follow three main directions. The first is the chip-scale integration of polarization modulation, spectral dispersion, and detection functions, which offers a viable pathway for metasurfaces and on-chip dispersive optical components. The second involves the collaborative design of intelligent computational imaging via hardware coding and algorithmic reconstruction, leading to significant improvements in system integration and information recovery. Deep learning and other techniques are also being incorporated into polarized image reconstruction and object recognition [97]. The third direction lies in the perceptual fusion of multiple information dimensions—including polarization, spectrum, phase and depth—which is expected to become a key focus for the next generation of polarization spectral imaging.
Polarizers, novel 2D polarizing thin-film materials and polarimetric spectroscopy together form the technological chain of polarization imaging, spanning from fundamental components to system applications. Polarizers are evolving from mature display-sector components toward metasurface-based integration platforms. 2D materials, leveraging their intrinsic polarization-responsive properties, provide a new paradigm for compact polarization detection without external polarizers. Polarimetric spectroscopy, through snapshot architectures, intelligent algorithms and multimodal fusion, continues to enhance the information acquisition efficiency and environmental adaptability of polarization imaging. The convergence of these three directions—chip-level integration, real-time intelligent perception and multidimensional information fusion—will serve as the primary trajectory for the future development of polarization imaging technology.
7. Conclusions
When polarizers meet polarization spectroscopy, it will have a profound impact on the entire field of optics. This paper reviews the advancements in polarizers and polarization spectroscopy, ranging from the fundamental to the advanced levels. It provides a self-contained tutorial on polarization optics, covering essential elements such as the historical development of polarizers. It then introduces the structures and working principles of commercially common LCD and OLED polarizers. Subsequently, it reviews the development history of polarization spectroscopy, describing the discovery process of Stokes vectors and Mueller matrices. The fabrication of commercial polarizer PVA-I2 series polarizer materials, the synthesis of novel 2D polarizers and the fabrication of WGP has been discussed. The characterization methods of commonly used for commercial polarizers, 2D polarizers and polarization spectroscopy, with a focus on the MMP and SE has been systematically introduced and summarized. Polarization methodology, namely Mueller-Stokes polarimetry and Poincaré sphere, is thoroughly discussed within the framework of recent developments in these polarimetric techniques. These methods can effectively construct optical compensation films, thereby address LCD light leakage issues or analyze the reasons for Mura improvement in OLED polarizers. Furthermore, model simulations can be used to analyze the design of micro-polarization arrays and assist in the design of polarization cameras. Last but not least, we present and summarize the applications of polarizers and polarization optics in various fields, including display technology, molecular structure analysis, photodetection, polarization imaging and other domains. Finally, the perspective of the future development on polarizers and polarization spectroscopy has been put forward. This article targets interested researchers in polarization optics and is expected to serve as a useful and easy-to-understand reference for staff currently engaged in industrialization projects related to polarizers and polarization imaging from multidisciplinary research backgrounds.
Author Contributions
Conceptualization, Z.R.; methodology, Z.R.; Z.R. and Q.Q.Y.; investigation, Z.R. and Y.N.W.; writing—original draft preparation, Z.R.; writing—review and editing, X.C.H.; supervision, X.C.H.; project administration, X.C.H.; All authors have read and agreed to the published version of the manuscript.
Funding
This research received no external funding.
Institutional Review Board Statement
Not applicable.
Informed Consent Statement
Not applicable.
Data Availability Statement
No new data were created or analyzed in this study. Data sharing is not applicable to this article.
Conflicts of Interest
The authors declare no conflicts of interest.
Acknowledgments
Appreciating Shanjin Optoelectronics Co., Ltd. and Nanjing Tech University for their support in writing and publishing this paper, great thanks to my family, especially the support from my wife.
References
- Land, E.H. Some aspects of the development of sheet polarizers. J. Opt. Soc. Am. 1951, 41, 957–963. [Google Scholar]
- del Toro Iniesta, J.C. Introduction to spectropolarimetry; Cambridge university press, 2003. [Google Scholar]
- Goldstein, D.H. Polarized light; CRC press, 2017. [Google Scholar]
- Chipman, R.; Lam, W.S.T.; Young, G. Polarized light and optical systems; CRC press, 2018. [Google Scholar]
- Kozenkov, V.; Belyaev, V.; Chausov, D. Thin film polarizers: Properties and technologies. Part 1. Opt. Spectrosc. 2022, 130, 377–388. [Google Scholar] [CrossRef]
- Tiwari, V. Advances in polarization imaging: Techniques and instrumentation. J. Quant. Spectrosc. Radiat. Transf. 2025, 338, 109427. [Google Scholar] [CrossRef]
- Li, Y.; Xie, J.; Cheng, H.; Wei, X.; Chen, J.; You, L.; Chen, W. Polyvinyl alcohol-based polarizers for new displays: Molecules, processing and properties. Soft Matter 2025, 21. [Google Scholar] [CrossRef] [PubMed]
- Li, Z.; Li, Z.R.; Meng, H. Organic light-emitting materials and devices; CRC press, 2006. [Google Scholar]
- Chen, H.; Tan, G.; Wu, S.T. Ambient contrast ratio of lcds and oled displays. Opt. Express 2017, 25, 33643. [Google Scholar] [CrossRef]
- Zhu, J.; Wang, J.; Lu, H.; Qiu, L. Solution-processed polarized light-emitting diodes. J. Mater. Chem. C 2020, 8, 9147–9162. [Google Scholar] [CrossRef]
- Lin, Z.; Yang, X.; He, J.; Dong, N.; Li, B. Structural and optoelectronic characterization of anisotropic two-dimensional materials and applications in polarization-sensitive photodetectors. Appl. Phys. Rev. 2025, 12, 011301. [Google Scholar] [CrossRef]
- Zhang, Y.; Wu, J.; Jia, L.; Jin, D.; Jia, B.; Hu, X.; Moss, D.; Gong, Q. Advanced optical polarizers based on 2d materials. npj Nanophotonics 2024, 1, 28. [Google Scholar] [CrossRef]
- Seah, S.K.W.; Biswas, S.; Hail, C.U.; Rossman, G.R.; Atwater, H.A. Electrically reconfigurable polarization control with double tri-layer black phosphorus heterostructures. Nat. Commun. 2026, 17, 6831. [Google Scholar] [CrossRef] [PubMed]
- Yan, F.; Yu, C.; Park, H.; Parrott, E.P.; Pickwell-MacPherson, E. Advances in polarizer technology for terahertz frequency applications. J. Infrared Millim. Terahertz Waves 2013, 34, 489–499. [Google Scholar] [CrossRef]
- Pal, P.K.; Chakraborty, S.; Mitra, R.K.; Barman, A. Optimizing the polarization and antireflection characteristics of metallic wire grid structures in the terahertz frequency range. Opt. Mater. 2023, 146, 114553. [Google Scholar] [CrossRef]
- Moreira, R.L.; Scholz, R.; Righi, A.; Dias, A. Polarization-resolved raman and infrared phonon modes of ludlamite. Spectrochim. Acta Part A 2026, 356, 127740. [Google Scholar] [CrossRef] [PubMed]
- Landi Degl’Innocenti, E. Radiative transfer for polarized radiation: A personal, historical overview. Sol. Polariz. 5 Honor Jan. Stenflo 2009, 57. [Google Scholar]
- Azzam, R.M. Stokes-vector and mueller-matrix polarimetry. J. Opt. Soc. Am. A 2016, 33, 1396–1408. [Google Scholar] [CrossRef] [PubMed]
- Ramella-Roman, J.C.; Saytashev, I.; Piccini, M. A review of polarization-based imaging technologies for clinical and preclinical applications. J. Opt. 2020, 22, 123001. [Google Scholar] [CrossRef]
- Sang, Y.; Han, J.; Zhao, T.; Duan, P.; Liu, M. Circularly polarized luminescence in nanoassemblies: Generation, amplification, and application. Adv. Mater. 2020, 32, 1900110. [Google Scholar]
- He, C.; He, H.; Chang, J.; Chen, B.; Ma, H.; Booth, M.J. Polarisation optics for biomedical and clinical applications: A review. Light Sci. Appl. 2021, 10, 194. [Google Scholar] [CrossRef] [PubMed]
- Rees, D.E. Solar polarimetry: Observations and theories. Publ. Astron. Soc. Aust. 1982, 4, 335–341. [Google Scholar] [CrossRef]
- Degl’Innocenti, E.L. Polarimetric shapes of spectral lines in solar observations. Adv. Space Res. 2014, 54, 1272–1275. [Google Scholar] [CrossRef]
- Ghosh, N.; Vitkin, A. Tissue polarimetry: Concepts, challenges, applications, and outlook. J. Biomed. Opt. 2011, 16, 110801. [Google Scholar] [CrossRef] [PubMed]
- Alali, S.; Vitkin, A. Polarized light imaging in biomedicine: Emerging mueller matrix methodologies for bulk tissue assessment. J. Biomed. Opt. 2015, 20, 061104–061104. [Google Scholar] [CrossRef] [PubMed]
- Giri, R.K.; Mansingh, S.; Priyadarshini, N. A critical review on black phosphorus mediated z-scheme heterojunctions: Properties, synthesis, and mechanistic insights towards solar h2 evolution. Catal. Sci. Technol. 2024, 14, 1428–1461. [Google Scholar] [CrossRef]
- Jing; Yu; Xiaozong; Hu; Huiqiao; Li; Xing; Zhou; Tianyou; Zhai. Large-scale synthesis of 2d metal dichalcogenides. J. Mater. Chem.C 2018, 6, 4627–4640. [Google Scholar] [CrossRef]
- Kang, J.; Sangwan, V.K.; Wood, J.D.; Hersam, M.C. Solution-based processing of monodisperse two-dimensional nanomaterials. Acc. Chem. Res. 2017, 50, 943–951. [Google Scholar] [CrossRef] [PubMed]
- Wu, Y.P.; Yuan, W.; Xu, M.; Bai, S.G.; Chen, Y.; Tang, Z.H.; Wang, C.; Yang, Y.; Zhang, X.Q.; Yuan, Y.H.; et al. Two-dimensional black phosphorus: Properties, fabrication and application for flexible supercapacitors. Chem. Eng. J. 2021, 412, 19. [Google Scholar] [CrossRef]
- Jeon, I.-Y.; Shin, Y.-R.; Sohn, G.-J.; Choi, H.-J.; Bae, S.-Y.; Mahmood, J.; Jung, S.-M.; Seo, J.-M.; Kim, M.-J.; Wook Chang, D. Edge-carboxylated graphene nanosheets via ball milling. Proc. Natl. Acad. Sci. 2012, 109, 5588–5593. [Google Scholar] [CrossRef] [PubMed]
- Kim, H.; Jeon, J.; Jo, J.; Chun, B.S.; Lee, S.J.; Chang, W.S. Realizing the high efficiency of type-ii superlattice infrared sensors integrated wire-grid polarizer via femtosecond laser polishing. Adv. Mater. Technol. 2024, 9, 2400374. [Google Scholar] [CrossRef]
- Chen, B.; Fu, X.; Liu, X.; Pan, Y.; Dong, S.; Wang, B.; Lin, Z.; Jiang, H. A review of sub-wavelength wire grid polarizers and their development trends. Photonics 2025, 1046. [Google Scholar]
- Chen, B.; Fu, X.; Liu, X.; Pan, Y.; Dong, S.; Wang, B.; Lin, Z.; Jiang, H. A review of sub-wavelength wire grid polarizers and their development trends. Photonics 2025, 12. [Google Scholar] [CrossRef]
- Kim, J.; Son, E.; Choi, Y.; Choi, K.J.; Baik, J.M.; Park, H. Kinetically tailored chemical vapor deposition approach for synthesizing high-quality large-area non-layered 2d materials. Small 2025, 21, 2410411. [Google Scholar] [CrossRef] [PubMed]
- Chu, X.; Wang, Q.; Gao, X. Polarization characteristics of alo molecular spectra in femtosecond laser-induced aluminum plasma. Photonics 2026, 13, 504. [Google Scholar] [CrossRef]
- Park, B.; Park, C.H.; Kim, M.; Han, M.-y. Polarized organic light-emitting device on a flexible giant birefringent optical reflecting polarizer substrate. Opt. Express 2009, 17, 10136–10143. [Google Scholar] [CrossRef] [PubMed]
- Hinrichs, K.; Gensch, M.; Esser, N. Analysis of organic films and interfacial layers by infrared spectroscopic ellipsometry. Appl. Spectrosc. 2005, 59, 272. [Google Scholar] [CrossRef] [PubMed]
- Park, J.; Cho, Y.J.; Chegal, W. Spectroscopic ellipsometry utilizing frequency division multiplexed lasers. Commun. Phys. 2024, 7. [Google Scholar] [CrossRef]
- Hannotte*, Théo; amp; nbsp; amp; nbsp; Herrero Léon, Iker; amp; nbsp; amp; et al. Polarization-resolved characterization of antenna-mediated scattering in transflection s-snom. ACS Photonics 2026, 13 7, 1818–1827. [Google Scholar] [CrossRef]
- Pimenta, M.A.; Resende, G.C.; Ribeiro, H.B.; Carvalho, B.R. Polarized raman spectroscopy in low-symmetry 2d materials: Angle-resolved experiments and complex number tensor elements. Phys. Chem. Chem. Phys. 2021, 23, 27103–27123. [Google Scholar] [CrossRef] [PubMed]
- Zhao, X.; Li, Z.; Wu, S.; Lu, M.; Xie, X.; Zhan, D.; Yan, J. Raman spectroscopy application in anisotropic 2d materials. Adv. Electron. Mater. 2024, 10. [Google Scholar] [CrossRef]
- Yan, F.; Yu, C.; Park, H.; Parrott, E.P.J.; Pickwell-Macpherson, E. Advances in polarizer technology for terahertz frequency applications. J. Infrared Millim. Terahertz Waves 2013, 34, 489–499. [Google Scholar] [CrossRef]
- Pal, P.K.; Chakraborty, S.; Barman, M.A. Optimizing the polarization and antireflection characteristics of metallic wire grid structures in the terahertz frequency range. Opt. Mater. 2023, 146, 114553.114551–114553.114557. [Google Scholar] [CrossRef]
- Cheng, J.; Yu, K.; Xu, J.; Zhou, G.; Zhang, Z.; Xiang, H.; Chen, Z. Two-dimensional anisotropic semiconductors: From structure and properties to device applications. Nanoscale 2025, 17. [Google Scholar] [CrossRef] [PubMed]
- Shuchi, N.; Mower, J.; Stinson, V.P.; McLamb, M.J.; Boreman, G.D.; Walter, M.G.; Hofmann, T. Complex dielectric function of thiazolothiazole thin films determined by spectroscopic ellipsometry. Opt. Mater. Express 2023, 13, 1589–1595. [Google Scholar] [CrossRef]
- Khorasaninejad, M.; Chen, W.; Zhu, A.; Oh, J.; Devlin, R.; Rousso, D.; Capasso, F. Multispectral chiral imaging with a metalens. Nano Lett. 2016, 16, 4595–4600. [Google Scholar] [CrossRef] [PubMed]
- Kliger, D.S.; Lewis, J.W.; Randall, C.E.; Azzam, R.M. Polarized light in optics and spectroscopy; American Institute of Physics, 1991. [Google Scholar]
- Furchner, A.; Kratz, C.; Ogieglo, W.; Pinnau, I.; Rappich, J.; Hinrichs, K. Ultrasensitive broadband infrared 4× 4 mueller-matrix ellipsometry for studies of depolarizing and anisotropic thin films. J. Vac. Sci. Technol. 2020, 38. [Google Scholar]
- Xinyu, Z.; Zhibing, G.; Wu, S.T. Analytical solutions for uniaxial-film-compensated wide-view liquid crystal displays. J. Disp. Technol. 2006, 2, 2–20. [Google Scholar] [CrossRef]
- Lu, R.; Qi, H.; Wu, S.T. An o-plate compensated in-plane switching liquid crystal display. J. Disp. Technol. 2006, 2, 223–232. [Google Scholar] [CrossRef]
- Hong, Q.; Wu, T.X.; Zhu, X.; Lu, R.; Wu, S.T. Extraordinarily high-contrast and wide-view liquid-crystal displays. Appl. Phys. Lett. 2005, 86, 8259. [Google Scholar] [CrossRef]
- Oh, S.-W.; Kim, A.-K.; Park, B.W.; Yoon, T.-H. Optical compensation methods for the elimination of off-axis light leakage in an in-plane-switching liquid crystal display. J. Inf. Disp. 2015, 16, 1–10. [Google Scholar] [CrossRef]
- Ji, S.-H.; Hee Lee, S.; Lee, G.-D. Optimization of an optical configuration in a vertical alignment liquid crystal cell for wide viewing angle. Appl. Opt. 2008, 48, 48–54. [Google Scholar] [CrossRef] [PubMed]
- Chen, J.; Kim, K.H.; Jyu, J.J.; Souk, J.H.; Bos, P.J. 21.2: Optimum film compensation modes for tn and va lcds. SID Symp. Dig. Tech. Pap. 2012, 29. [Google Scholar]
- Hong, Q.; Wu, T.X.; Lu, R.; Wu, S.-T. P-141: A wide-view multi-domain vertical-alignment liquid crystal display with high transmittance and high contrast. SID Symp. Dig. Tech. Pap. 2006, 37, 736–739. [Google Scholar] [CrossRef]
- Ishinabe, T.; Miyashita, T.; Uchida, T. Wide-viewing-angle polarizer with a large wavelength range. Jpn. J. Appl. Phys. 2002, 41, 4553. [Google Scholar] [CrossRef]
- Utsumi, Y.; Takeda, S.; Hiyama, I.; Tomioka, Y.; Ishii, M.; Ono, K. Light leakage behaviors of homogenously aligned liquid crystal layers placed between crossed polarizers. Jpn. J. Appl. Phys. 2008, 47, 2144. [Google Scholar] [CrossRef]
- Tien, C.-L.; Lin, R.-J.; Yeh, S.-M. Light leakage of multidomain vertical alignment lcds using a colorimetric model in the dark state. Adv. Condens. Matter Phys. 2018, 2018, 6386428. [Google Scholar] [CrossRef]
- Yukito Saitoh, Y.S.; Shinichi Kimura, S.K.; Kaoru Kusafuka, K.K.; Hidehisa Shimizu, H.S. Optimum film compensation of viewing angle of contrast in in-plane-switching-mode liquid crystal display. Jpn. J. Appl. Phys. 1998, 37, 4822. [Google Scholar] [CrossRef]
- Miyashita, T.; Yamaguchi, Y.; Tatsuo Uchida, T.U. Wide-viewing-angle display mode using bend-alignment liquid crystal cell. Jpn. J. Appl. Phys. 1995, 34, L177. [Google Scholar] [CrossRef]
- Xia, R.; Wang, C.; Pan, Y.; Yang, Y.; Li, H. Design of autostereoscopic 3d display with full resolution by means of polarization gratings. J. Phys. Commun. 2017, 2, 015019. [Google Scholar] [CrossRef]
- Yan, X.; Guo, Q.; Zhao, H.; Zhang, H. Full stokes polarization imaging based on broadband liquid crystal polarization gratings. Cryst. 2023, 13, 38. [Google Scholar] [CrossRef]
- Rubin, N.A.; D’Aversa, G.; Chevalier, P.; Shi, Z.; Chen, W.T.; Capasso, F. Matrix fourier optics enables a compact full-stokes polarization camera. Science 2019, 365, eaax1839. [Google Scholar] [CrossRef] [PubMed]
- Azzam, R.M.; Sudradjat, F.F. Single-layer-coated beam splitters for the division-of-amplitude photopolarimeter. Appl. Opt. 2005, 44, 190–196. [Google Scholar] [CrossRef] [PubMed]
- Rudenko, A.N.; Katsnelson, M.I. Anisotropic effects in two-dimensional materials. 2D Mater. 2024, 11, 042002. [Google Scholar] [CrossRef]
- Jian, X.; Lv, L.; Zou, Y.; Song, G.; Cheng, B.; Xiaoming, W.; Xiujun, Z.; Zhai, K.; Shao, H. Design of a high-efficiency near-infrared circular polarization filter responding to dual wavelengths based on twisted bilayer plasmonic metasurfaces. Cryst. 2026, 16, 317. [Google Scholar] [CrossRef]
- Middendorf, J.; Cetnar, J.; Brown, E. Low-cost high fill-factor polarizers with low insertion-loss using an anti-reflection coating. In 2014 39th International Conference on Infrared, Millimeter, and Terahertz waves (IRMMW-THz); IEEE, 2014; pp. 1–1. [Google Scholar]
- Li, Z.; Xu, B.; Liang, D.; Pan, A. Polarization-dependent optical properties and optoelectronic devices of 2d materials. Research 2020. [Google Scholar] [CrossRef] [PubMed]
- Qi, B.; Li, Y.; Chen, X. Flat optics for polarization structure engineering from 2d to 3d. Adv. Opt. Mater. 2025, 13, e02164. [Google Scholar] [CrossRef]
- Liu, Y.; Xu, Y.; Yu, B.; Liu, W.; Zhang, Z.; Cheng, H.; Chen, S. Terahertz metasurfaces for polarization manipulation and detection: Principles and emerging applications. Adv. Phys. Res. 2025, 4. [Google Scholar] [CrossRef]
- Guan, C.; Zeng, N.; He, H. Review of polarization-based technology for biomedical applications. J. Innov. Opt. Health Sci. 2025, 18, 2430002. [Google Scholar] [CrossRef]
- Gioti, M. Spectroscopic ellipsometry studies on solution-processed oled devices: Optical properties and interfacial layers. Mater. 2022, 15, 9077. [Google Scholar] [CrossRef] [PubMed]
- Liu, Y.; Xu, Y.; Yu, B.; Liu, W.; Zhang, Z.; Cheng, H.; Chen, S. Terahertz metasurfaces for polarization manipulation and detection: Principles and emerging applications. Adv. Phys. Res. 2025, 4, 2400100. [Google Scholar] [CrossRef]
- Ma, R.; Yu, Y. Next-generation pva–dye complex film with advanced properties for optical applications. Polymers 2026, 18, 876. [Google Scholar] [CrossRef] [PubMed]
- Liu, J.; Zhang, T.; Tan, Z.; Cheng, J.; Chang, S.; Fan, F. Chiral enantiomer recognition of amino acids enhanced by terahertz spin beam separation based on a pancharatnam–berry metasurface. Opt. Lett. 2023, 48, 440–443. [Google Scholar] [CrossRef] [PubMed]
- Patty, C.H.L.; Pommerol, A.; Kühn, J.G.; Demory, B.O.; Thomas, N. Directional aspects of vegetation linear and circular polarization biosignatures. Astrobiology 2022, 22, 1034–1046. [Google Scholar] [CrossRef] [PubMed]
- Zhang, T.; Liu, J.; Shi, W.; Fan, F.; Chang, S. Enhancing terahertz circular dichroism spectrum of amino acid chiral enantiomers by all-dielectric metasurface. Sens. Actuators A 2022, 348, 114001. [Google Scholar] [CrossRef]
- Zhong, C.; Fan, F.; Zhang, Z.; Liu, H.; Chang, S. Terahertz polarization sensing based on the saccharide-pva mixture film coated on the flexible metasurface sensor. Opt. Lasers Eng. 2022, 149, 106798. [Google Scholar] [CrossRef]
- Wang, J.; Wan, M.; Gu, G.; Qian, W.; Ren, K.; Huang, Q.; Chen, Q. Periodic integration-based polarization differential imaging for underwater image restoration. Opt. Lasers Eng. 2022, 149, 106785. [Google Scholar] [CrossRef]
- Zhang, J.; Shao, J.; Chen, J.; Yang, D.; Liang, B. Polarization image fusion with self-learned fusion strategy. PR 2021, 118, 108045. [Google Scholar] [CrossRef]
- Zhang, J.; Zhang, X.; Li, T.; Zeng, Y.; Lv, G.; Nian, F. Visible light polarization image desmogging via cycle convolutional neural network. Multimed. Syst. 2022, 28, 45–55. [Google Scholar] [CrossRef]
- Miyazaki, D.; Shigetomi, T.; Baba, M.; Furukawa, R.; Hiura, S.; Asada, N. Surface normal estimation of black specular objects from multiview polarization images. Opt. Eng. 2016, 56, 041303.041301–041303.041317. [Google Scholar] [CrossRef]
- Garcia, N.M.; de Erausquin, I.; Edmiston, C.; Gruev, V. Surface normal reconstruction using circularly polarized light. Opt. Express 2015, 23, 14391–14406. [Google Scholar] [CrossRef] [PubMed]
- Huse, N.; Schönle, A.; Hell, S.W. Z-polarized confocal microscopy. J. Biomed. Opt. 2001, 6, 480–484. [Google Scholar] [CrossRef] [PubMed]
- Yang, B.; Lesicko, J.; Sharma, M.; Hill, M.R.; Sacks, M.S.; Tunnell, J.W. Polarized light spatial frequency domain imaging for non-destructive quantification of soft tissue fibrous structures. Biomed. Opt. Express 2015, 6 4, 1520–1533. [Google Scholar] [CrossRef] [PubMed]
- Pan, Y.; Zheng, T.; Gao, F.; Qi, L.G.; Gao, W.; Zhang, J.L.; Li, L.; An, K.; Gu, H.M.; Chen, H.Y. High-performance photoinduced tunneling self-driven photodetector for polarized imaging and polarization-coded optical communication based on broken-gap rese2/snse2 van der waals heterojunction. Small 2024, 20, 13. [Google Scholar] [CrossRef] [PubMed]
- Vizet, J.; Manhas, S.; Tran, J.; Validire, P.; Benali, A.; Garcia-Caurel, E.; Pierangelo, A.; De Martino, A.; Pagnoux, D. Optical fiber-based full mueller polarimeter for endoscopic imaging using a two-wavelength simultaneous measurement method. J. BioMed Opt. 2016, 21, 71106. [Google Scholar] [CrossRef] [PubMed]
- Hu, Y.; He, J.; Yan, Z.; Xu, C.; Li, X.; Wei, N.; Wang, Y.; Dong, N.; Wang, J. High performance balanced linear polarization photodetector based on 2d res2. Laser Photonics Rev. 2024, 18, 2400661. [Google Scholar] [CrossRef]
- Guo, T.; Li, S.; Zhou, Y.N.; Lu, W.D.; Yan, Y.; Wu, Y.A. Interspecies-chimera machine vision with polarimetry for real-time navigation and anti-glare pattern recognition. Nat. Commun. 2024, 15, 6731. [Google Scholar] [CrossRef] [PubMed]
- Ahn, J.; Ko, K.; Kyhm, J.-h.; Ra, H.-S.; Bae, H.; Hong, S.; Kim, D.-Y.; Jang, J.; Kim, T.W.; Choi, S.; et al. Near-infrared self-powered linearly polarized photodetection and digital incoherent holography using wse2/rese2 van der waals heterostructure. ACS Nano 2021, 15, 17917–17925. [Google Scholar] [CrossRef] [PubMed]
- Li, D.; Li, Z.; Sun, Y.; Zhou, J.; Xu, X.; Wang, H.; Chen, Y.; Song, X.; Liu, P.; Luo, Z.; et al. In-sublattice carrier transition enabled polarimetric photodetectors with reconfigurable polarity transition. Adv. Mater. 2024, 36, 2407010. [Google Scholar] [CrossRef] [PubMed]
- Cheng, J.; Yu, K.; Xu, J.; Zhou, G.; Zhang, Z.; Xiang, H.; Chen, Z. Two-dimensional anisotropic semiconductors: From structure and properties to device applications. Nanoscale 2025, 17, 15086–15109. [Google Scholar] [CrossRef] [PubMed]
- Cao, H.; Yang, E.; Kim, Y.; Zhao, Y.; Ma, W. Biomimetic chiral nanomaterials with selective catalysis activity. Adv. Sci. 2024, 11, 2306979. [Google Scholar] [CrossRef] [PubMed]
- Kang, S.J.; Oh, H.S. A study on the fabrication and an analysis of the characteristics of a red organic light-emitting device with a inorganic multi-metal layer. J. Korean Phys. Soc. 2008, 53, 3187. [Google Scholar] [CrossRef]
- Li, G.; Wu, Y.; Hu, M.; Duan, J.; Long, H.; Shi, T. Anisotropic two-dimensional materials for polarization-sensitive photodetectors: Fundamentals, architectures and applications. J. Alloys Compd. 2025, 1039, 183025. [Google Scholar] [CrossRef]
- Yu, L.; Dong, H.; Zhang, W.; Zheng, Z.; Liang, Y.; Yao, J. Development and challenges of polarization-sensitive photodetectors based on 2d materials. Nanoscale Horiz. 2025, 10, 847–872. [Google Scholar] [CrossRef] [PubMed]
- Wang, R.; Jin, D.; Hu, J.; Liu, W.; Zhang, Y.; Abidi, I.H.; Walia, S.; Jia, B.; Huang, D.; Wu, J.; et al. Ai-guided design and optimization of 2d-material-based optical polarizers. Chip 2026, 100196. [Google Scholar] [CrossRef]
Figure 1.
Timeline of polarizers ‘development and two common modes for display devices: (a) The key figures and milestone events in the development of polarizing films are briefly explained in the annotations below the image; (b) Schematic of the panel structure: LCD panel, small- and medium-sized OLED and large-sized OLED. Reprinted with permission from ref. [7]; copyright 2025, the Royal Society of Chemistry.
Figure 1.
Timeline of polarizers ‘development and two common modes for display devices: (a) The key figures and milestone events in the development of polarizing films are briefly explained in the annotations below the image; (b) Schematic of the panel structure: LCD panel, small- and medium-sized OLED and large-sized OLED. Reprinted with permission from ref. [7]; copyright 2025, the Royal Society of Chemistry.
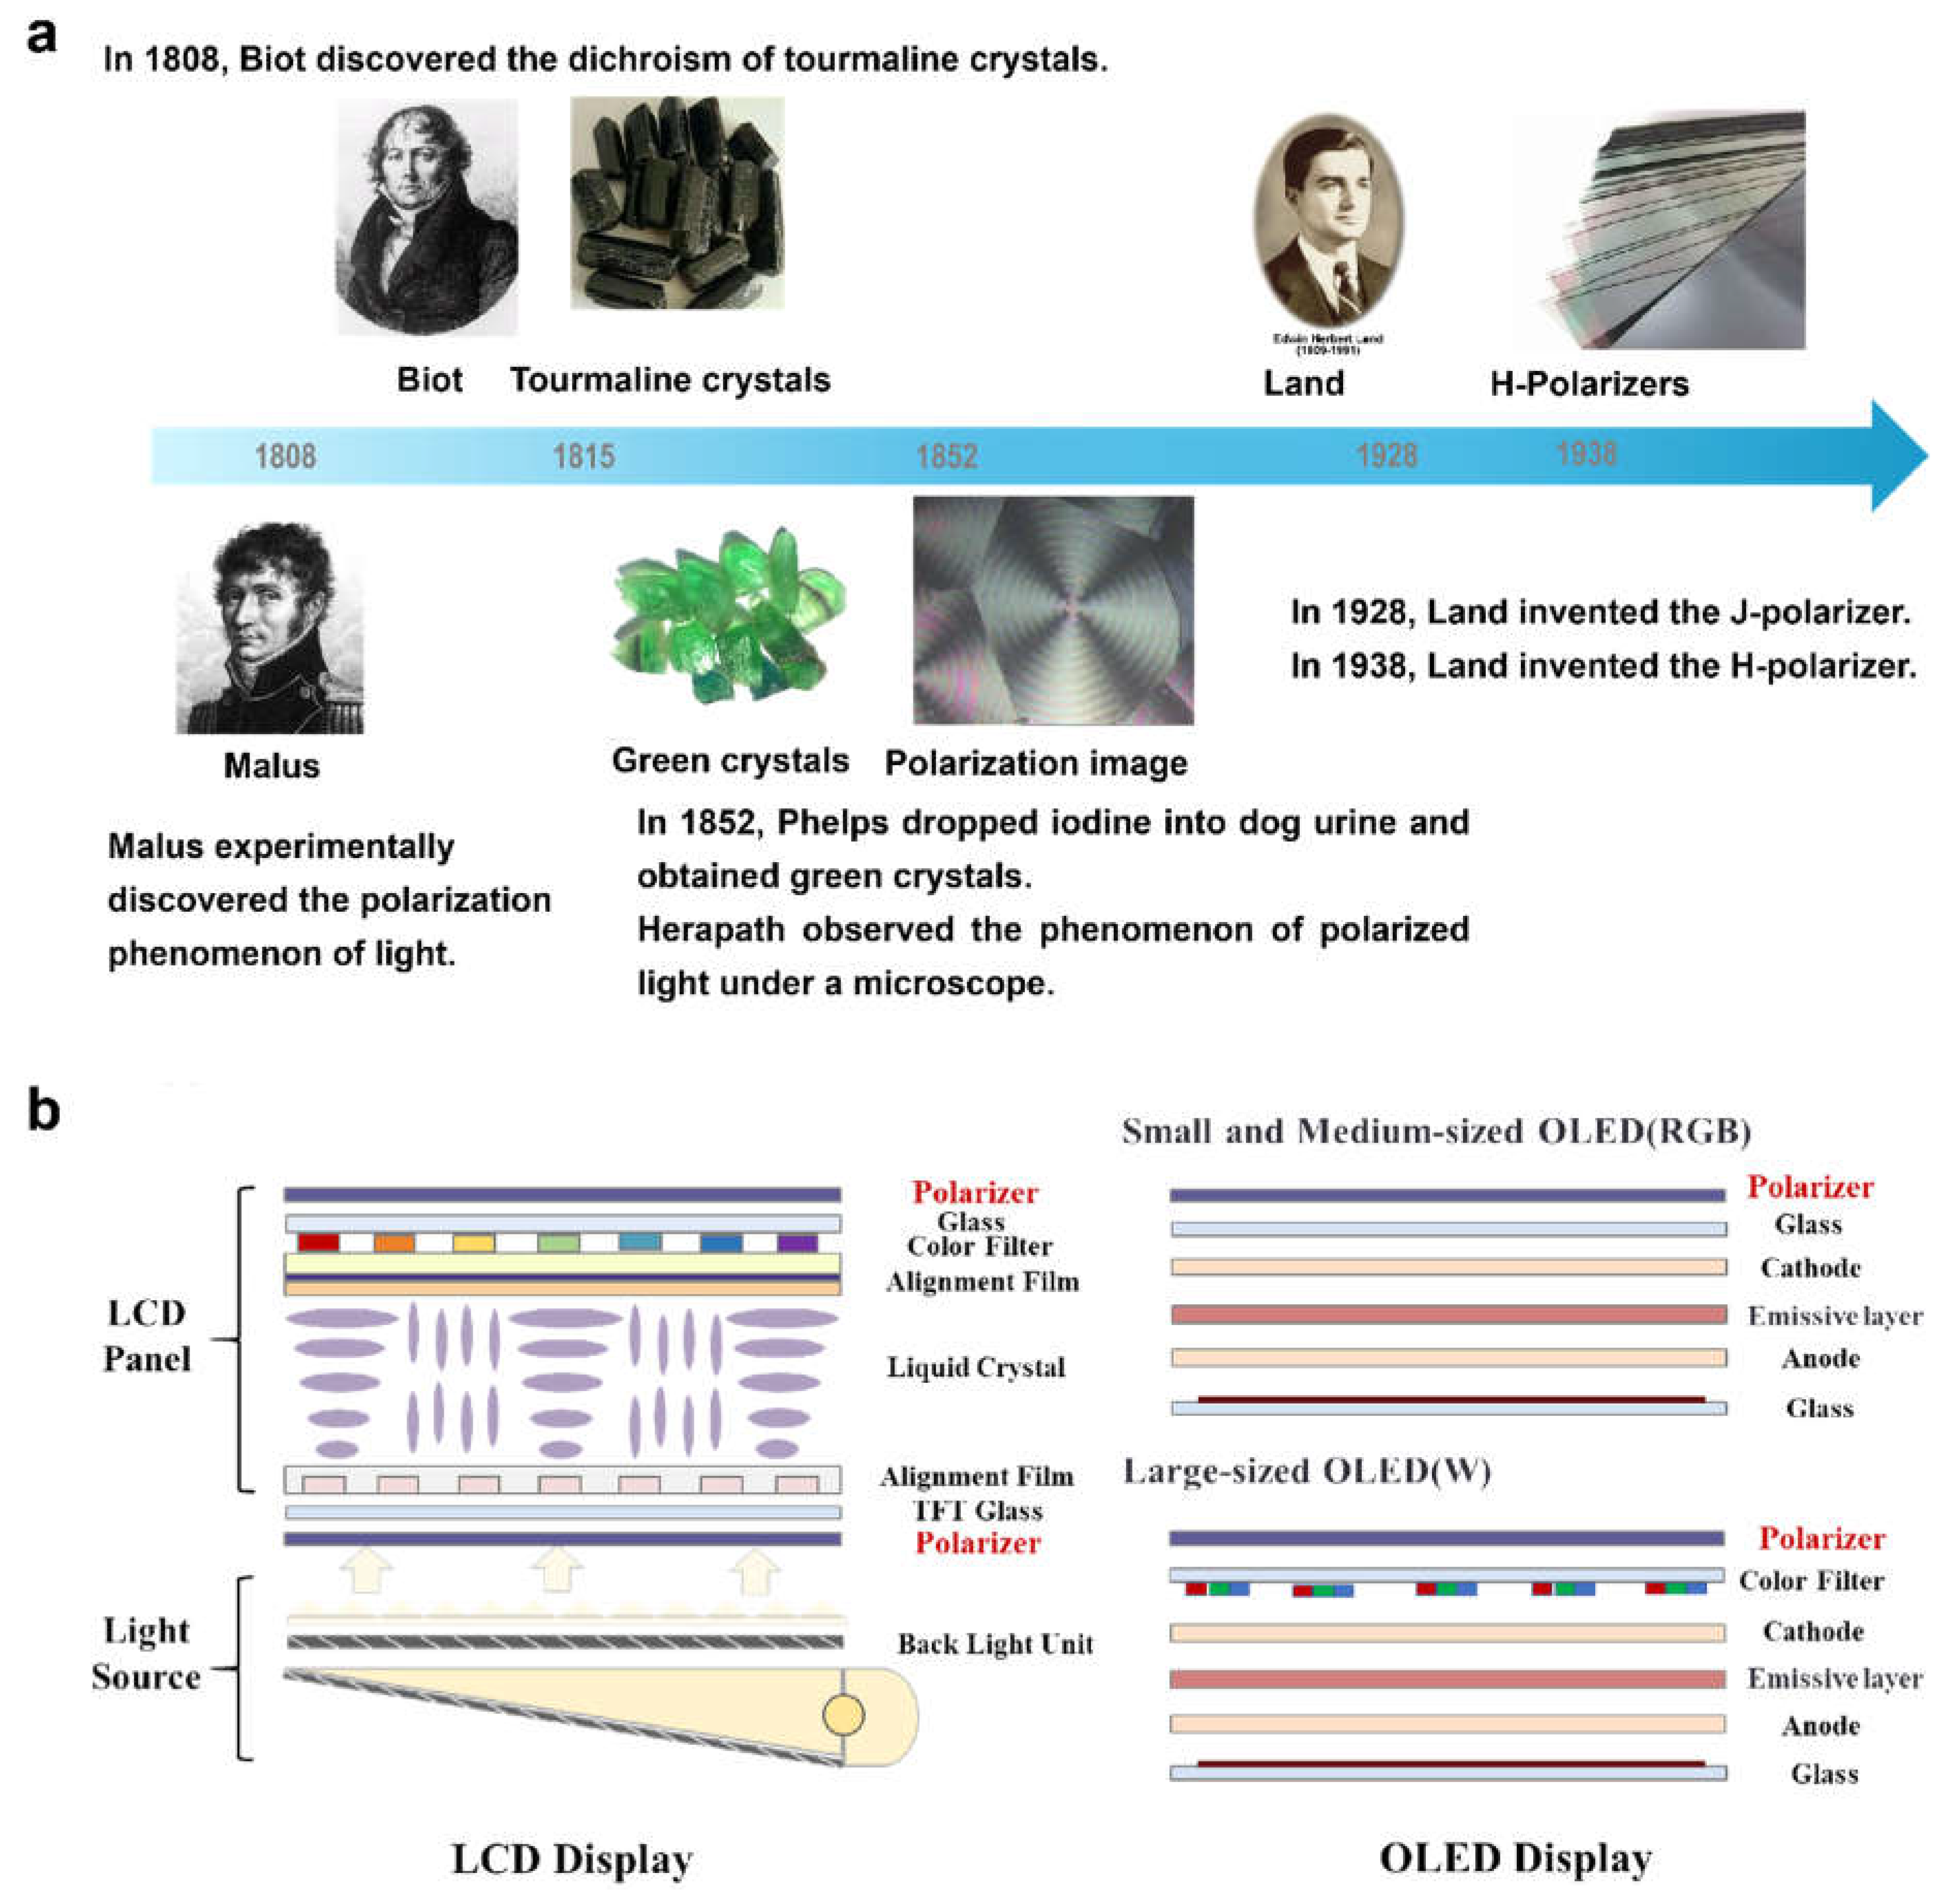
Figure 2.
The structure and display principle of LCD and OLED polarizers, the development timeline of polarization spectroscopy, and literature search on polarizers and polarization spectroscopy: (a) Main function, structure of LCD and OLED polarizers; (b) The key figures and milestone events in the development of polarization spectroscopy are briefly explained in the annotations below the image; (c) Publications per two years that fall under the scope of “polarizers or polarization spectroscopy” and “polarizers and polarization spectroscopy” in the web of science site since 1995. Updated until June 17th, 2026.
Figure 2.
The structure and display principle of LCD and OLED polarizers, the development timeline of polarization spectroscopy, and literature search on polarizers and polarization spectroscopy: (a) Main function, structure of LCD and OLED polarizers; (b) The key figures and milestone events in the development of polarization spectroscopy are briefly explained in the annotations below the image; (c) Publications per two years that fall under the scope of “polarizers or polarization spectroscopy” and “polarizers and polarization spectroscopy” in the web of science site since 1995. Updated until June 17th, 2026.
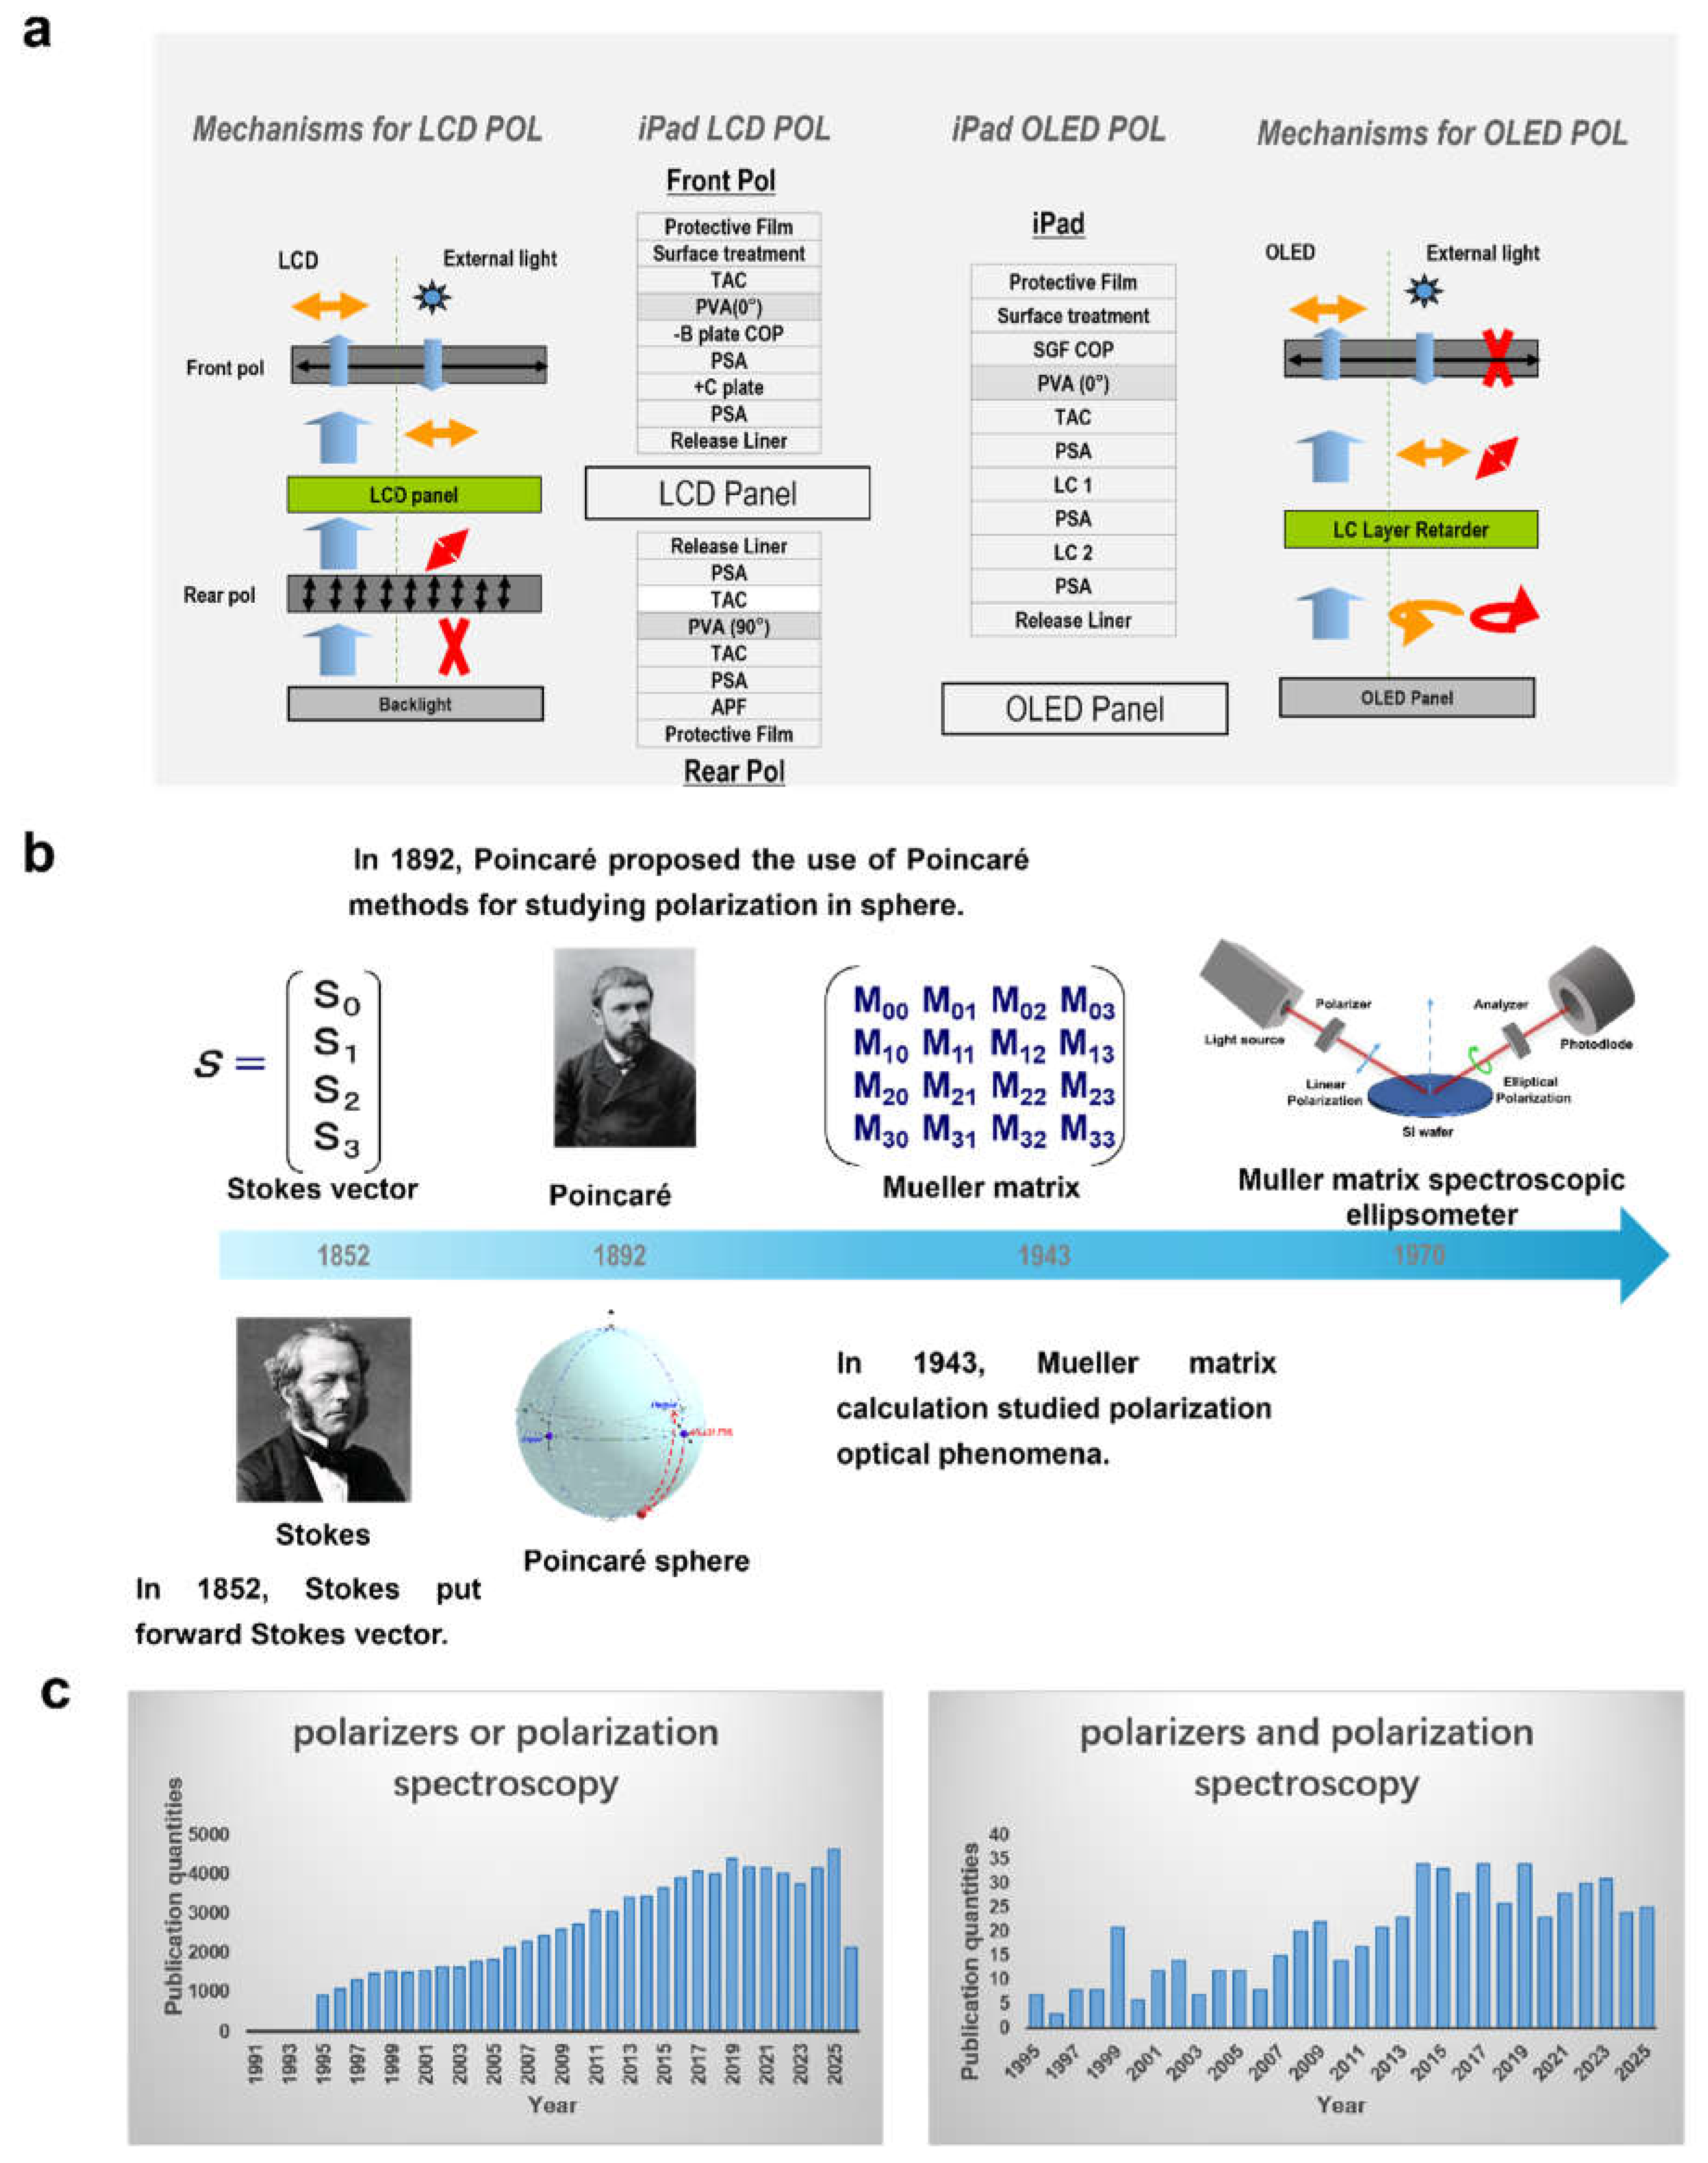
Figure 3.
The schematic diagram illustrates the fabrication methods of common polarizers (PVA-I2, 2D polarizers, and girl wire polarizers). The stretching process of PVA (line deviation layer) was demonstrated (Top left); lamination process of multilayer films (Top right); Synthesis of 2D materials by using ball milling, ultrasound, chemical deposition and tape adhesion methods; Fabrication of grid wire polarizers by nanoindentation and etching method.
Figure 3.
The schematic diagram illustrates the fabrication methods of common polarizers (PVA-I2, 2D polarizers, and girl wire polarizers). The stretching process of PVA (line deviation layer) was demonstrated (Top left); lamination process of multilayer films (Top right); Synthesis of 2D materials by using ball milling, ultrasound, chemical deposition and tape adhesion methods; Fabrication of grid wire polarizers by nanoindentation and etching method.
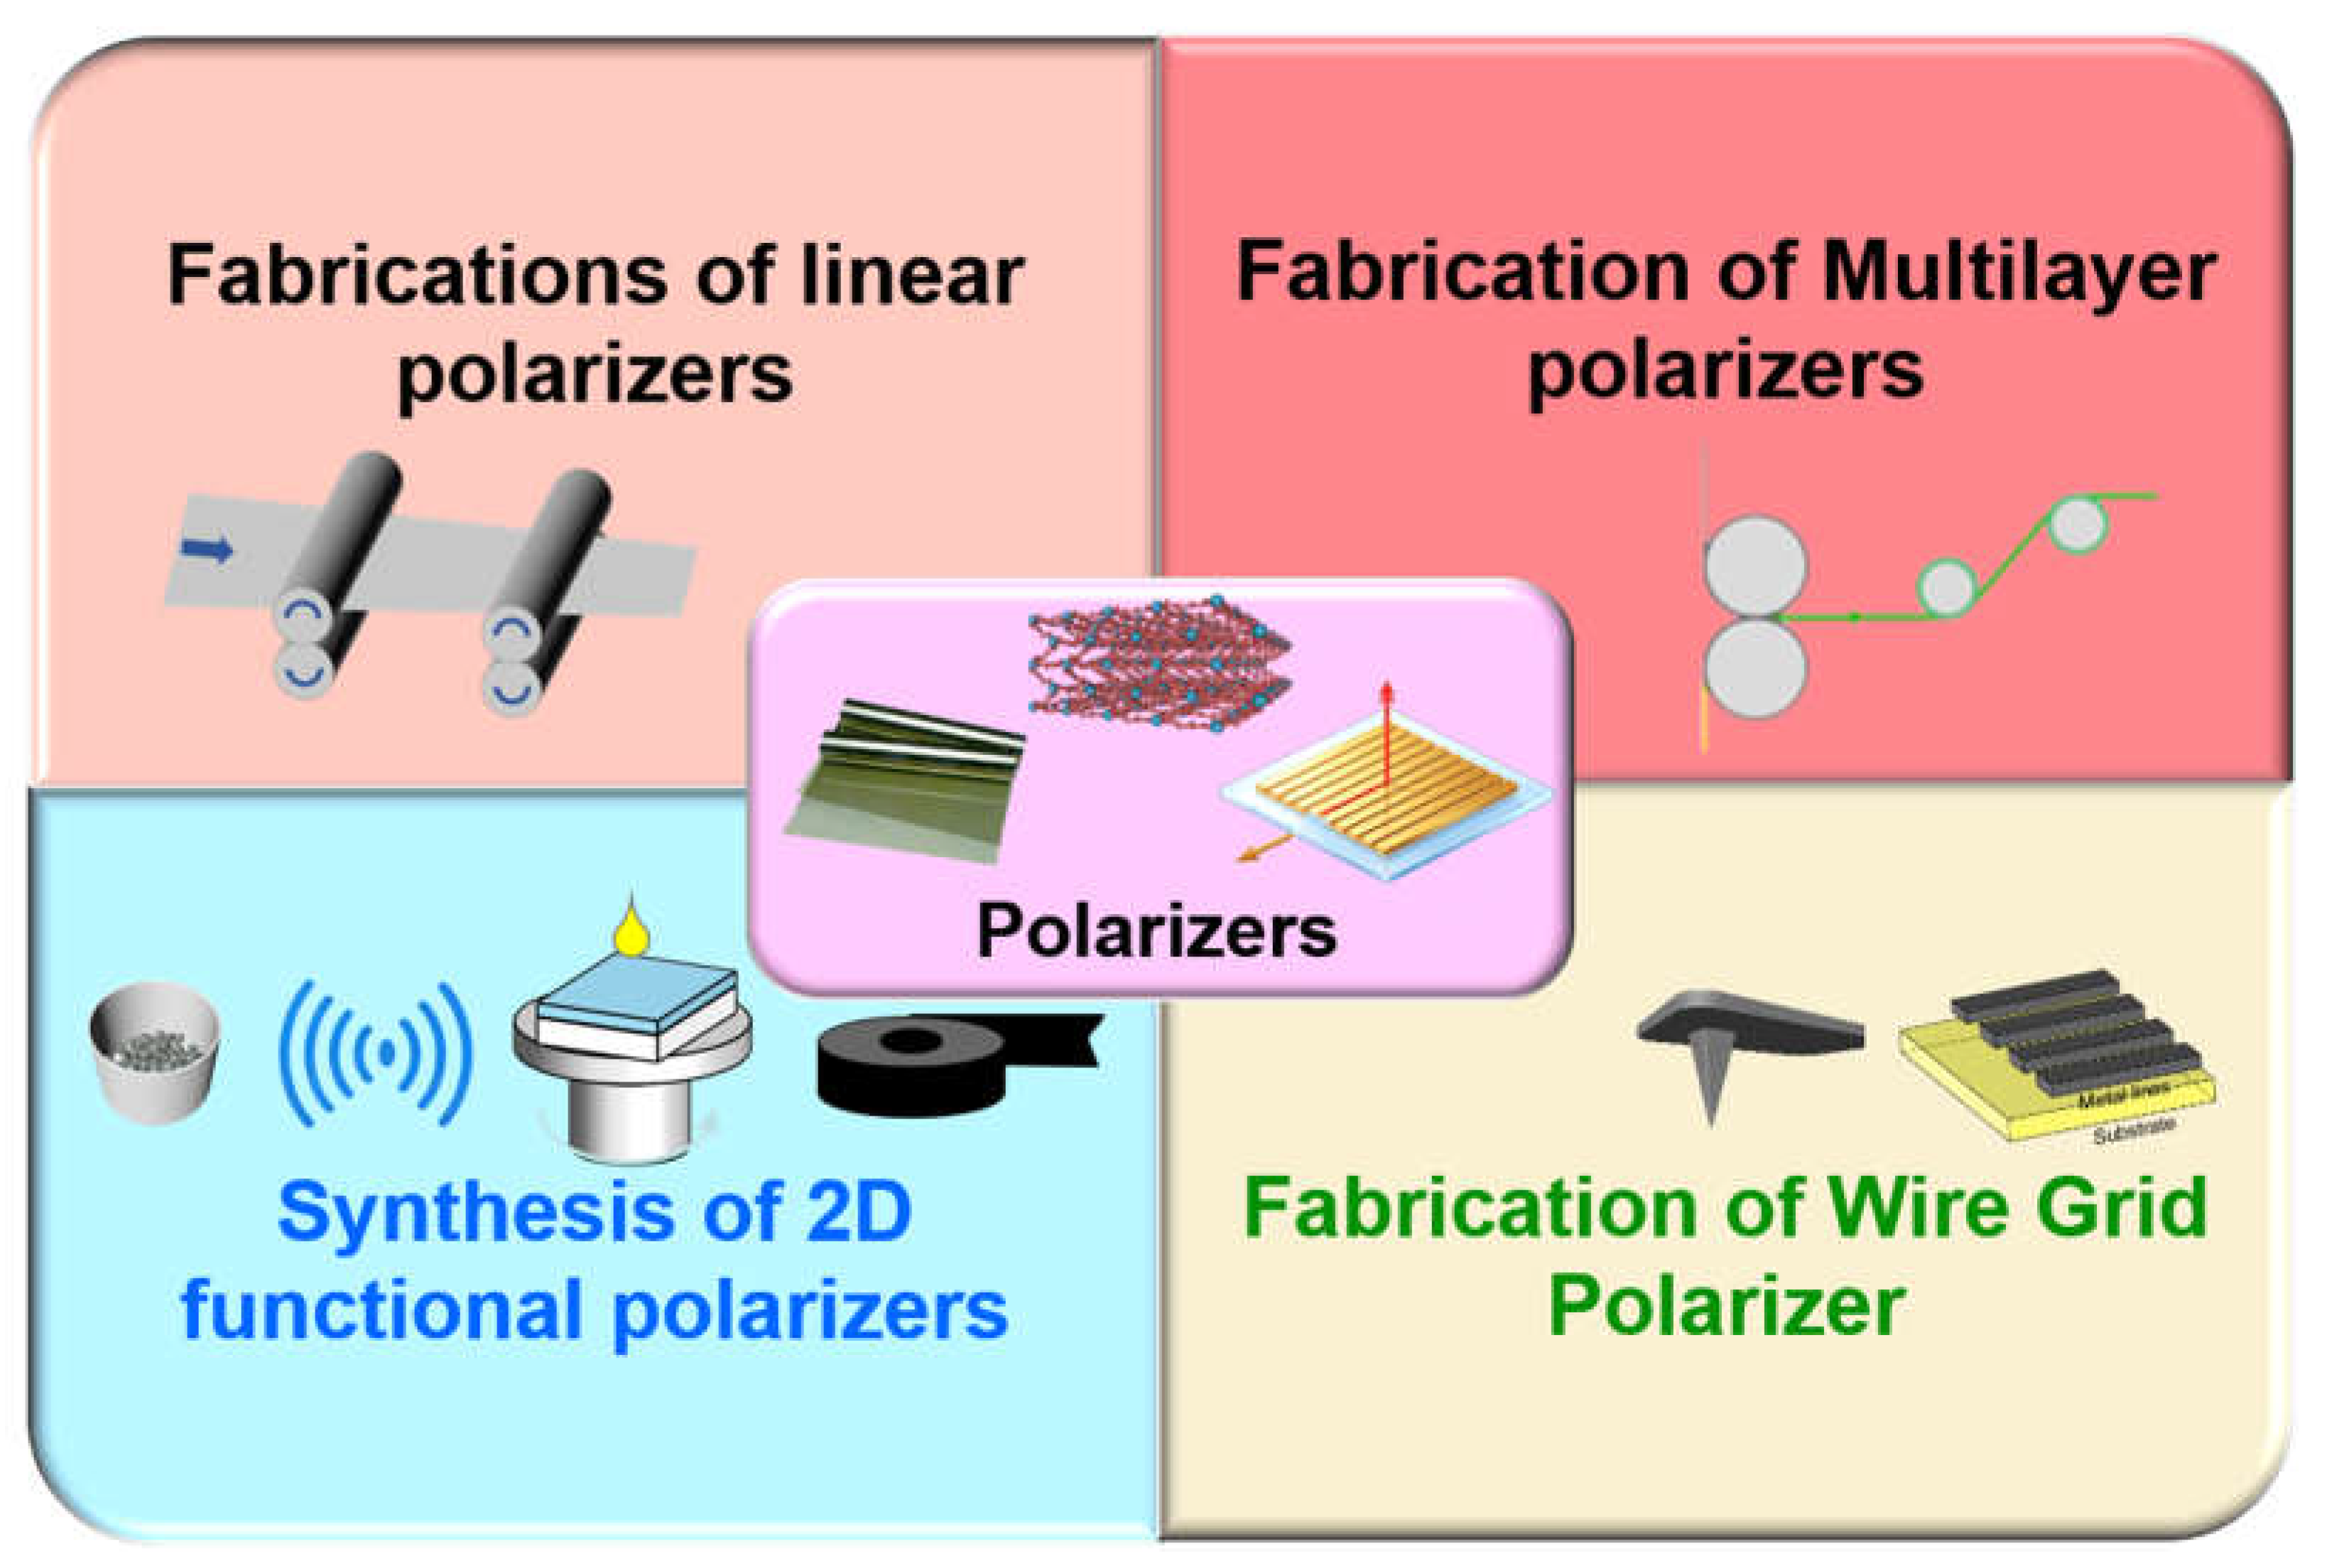
Figure 4.
Processing flow of PVA-I2 polarizers. (a) The scheme of PVA undergoes several steps including raw material cleaning, dyeing, stretching and drying to make a linear polarizer; (b) Common preparation process for LCD polarizers; (c) Common preparation process for OLED polarizers.
Figure 4.
Processing flow of PVA-I2 polarizers. (a) The scheme of PVA undergoes several steps including raw material cleaning, dyeing, stretching and drying to make a linear polarizer; (b) Common preparation process for LCD polarizers; (c) Common preparation process for OLED polarizers.
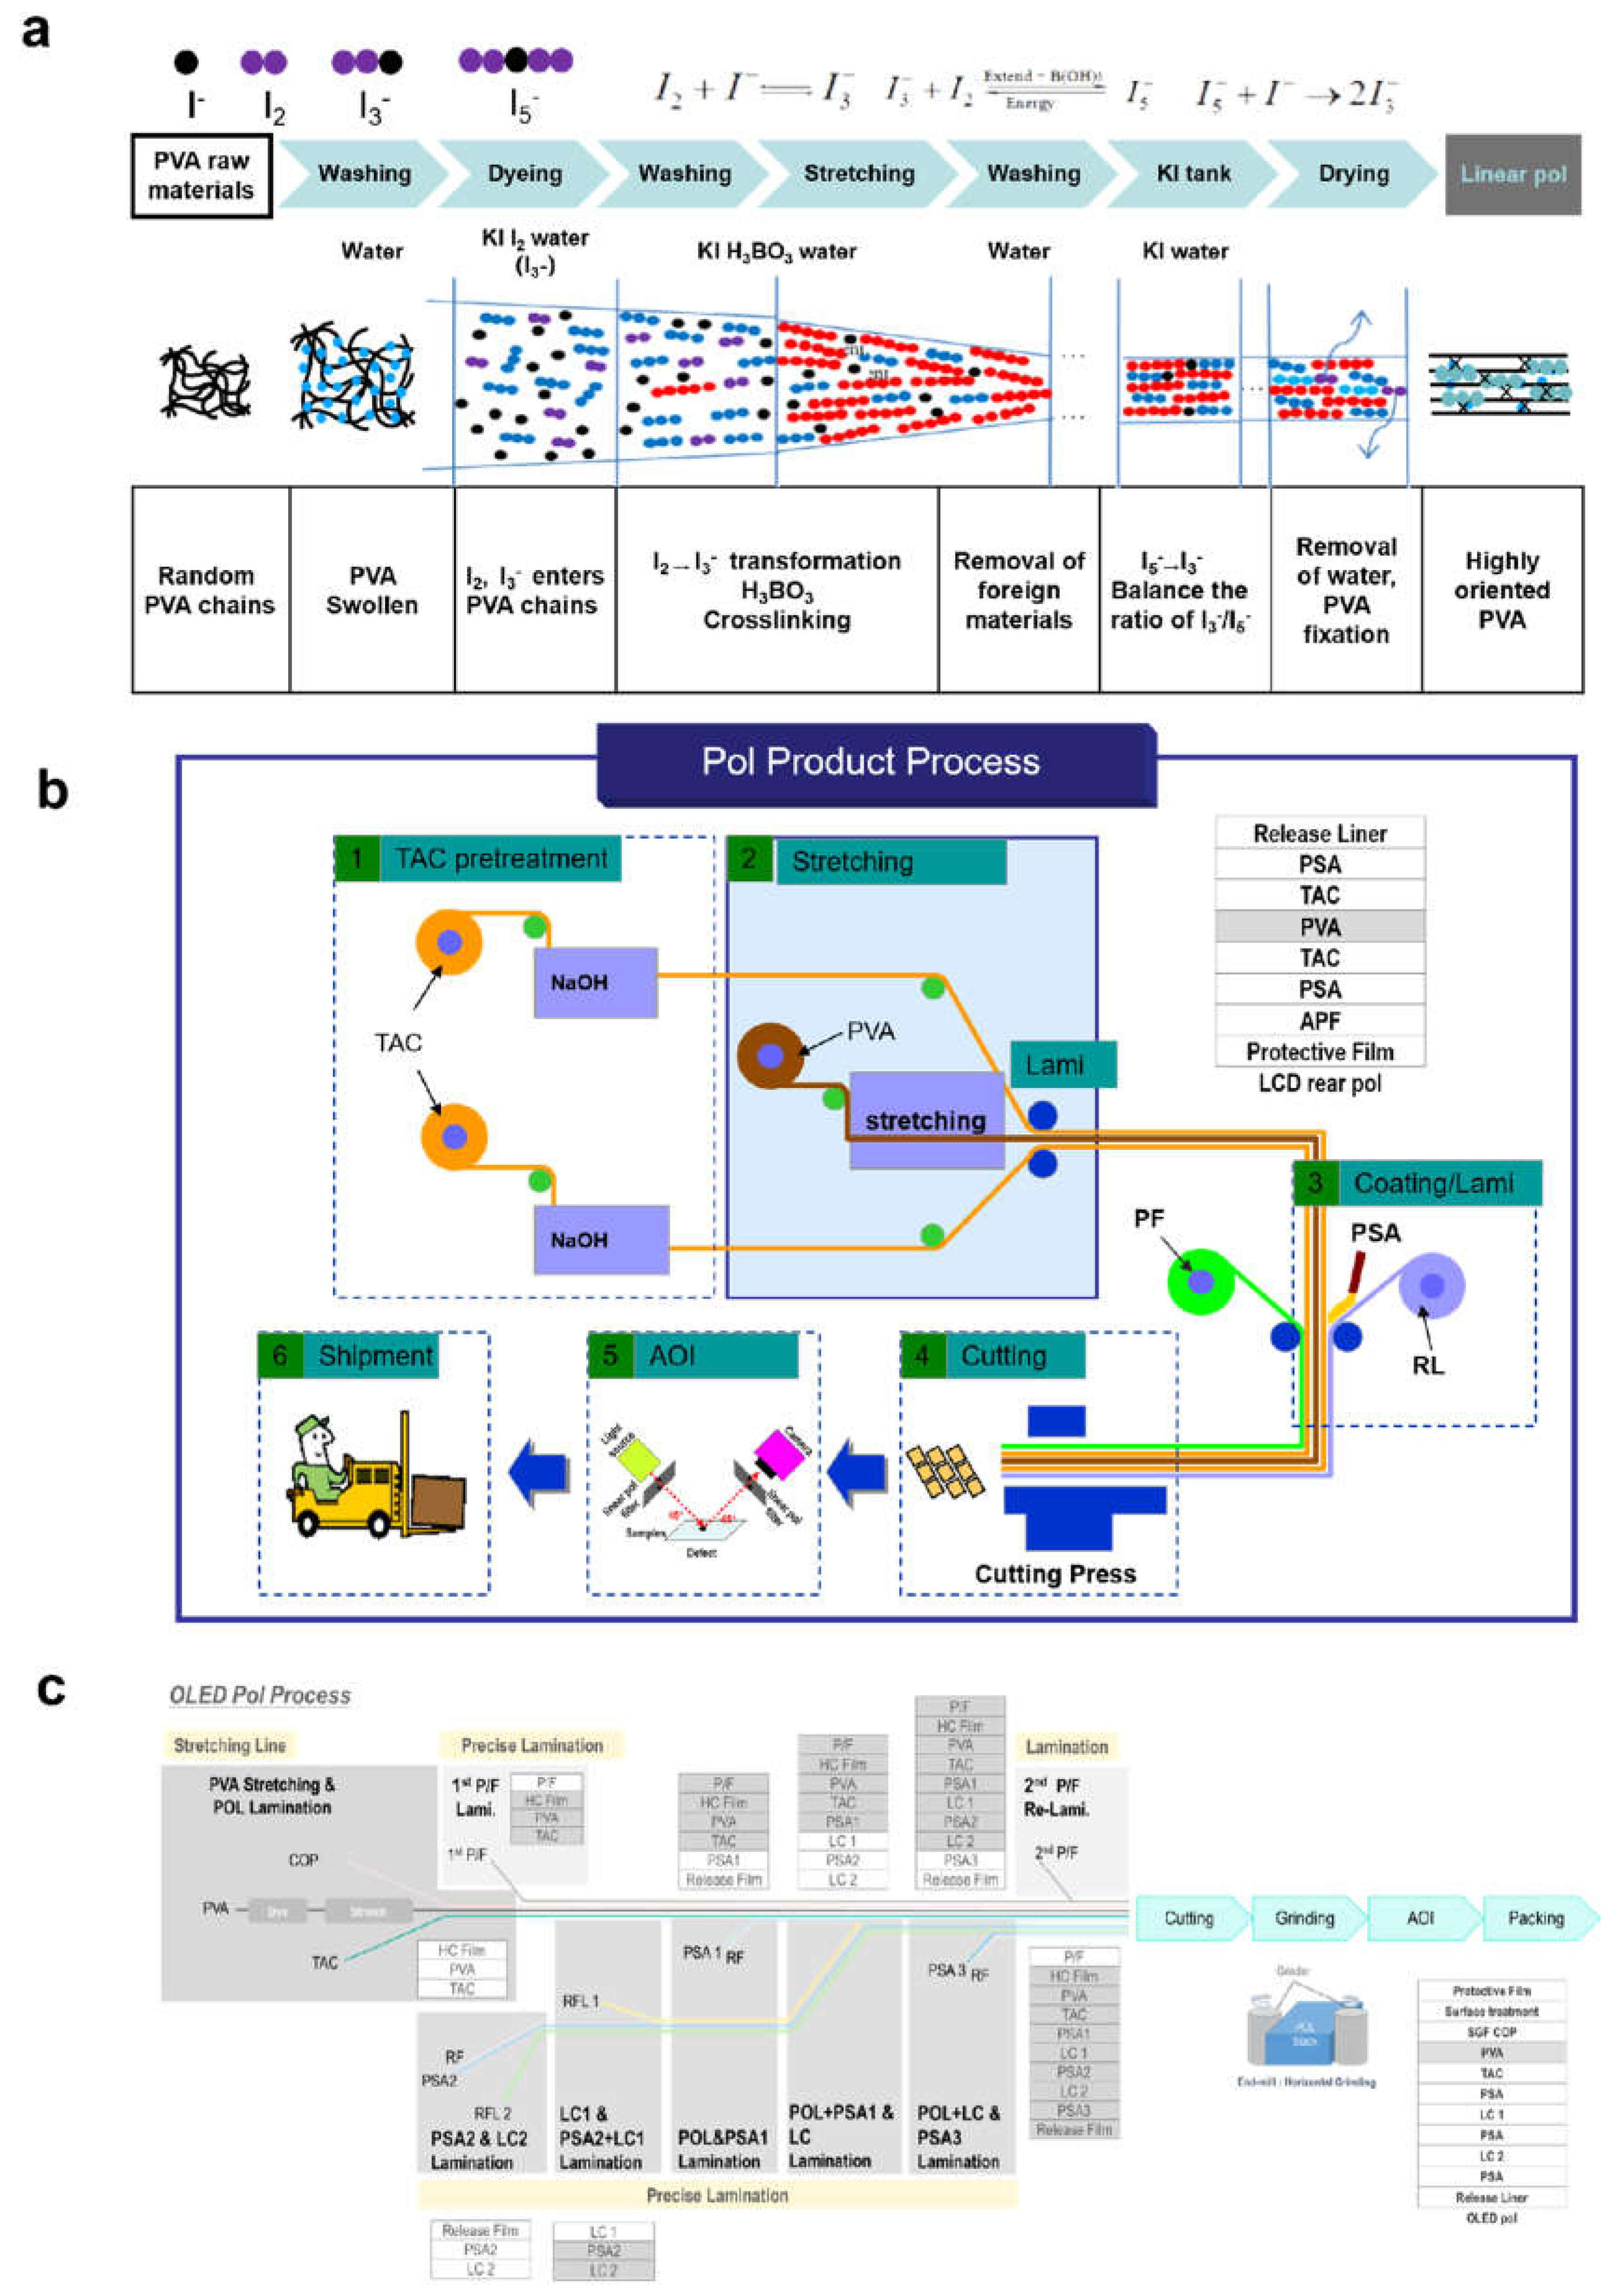
Figure 5.
Schemes for preparing 2D polarizers and their composites. (a) Edge-carboxylated graphite (ECG) prepared by mixing graphite with dry ice and ball-milling for 48 h; Reprinted with permission from ref. [30]; copyright 2012, PNAS; (b) Schematic showing the KT-CVD setup and depicting the process for synthesizing 2D non-layered materials. Reprinted with permission from ref. [34]; copyright 2025, Wiley; (c). Schematic of the WGP integrating process on the InAs/GaSb T2SL PD based on NIL and FSL polishing. Reprinted with permission from ref. [31]; copyright 2024, Wiley.
Figure 5.
Schemes for preparing 2D polarizers and their composites. (a) Edge-carboxylated graphite (ECG) prepared by mixing graphite with dry ice and ball-milling for 48 h; Reprinted with permission from ref. [30]; copyright 2012, PNAS; (b) Schematic showing the KT-CVD setup and depicting the process for synthesizing 2D non-layered materials. Reprinted with permission from ref. [34]; copyright 2025, Wiley; (c). Schematic of the WGP integrating process on the InAs/GaSb T2SL PD based on NIL and FSL polishing. Reprinted with permission from ref. [31]; copyright 2024, Wiley.
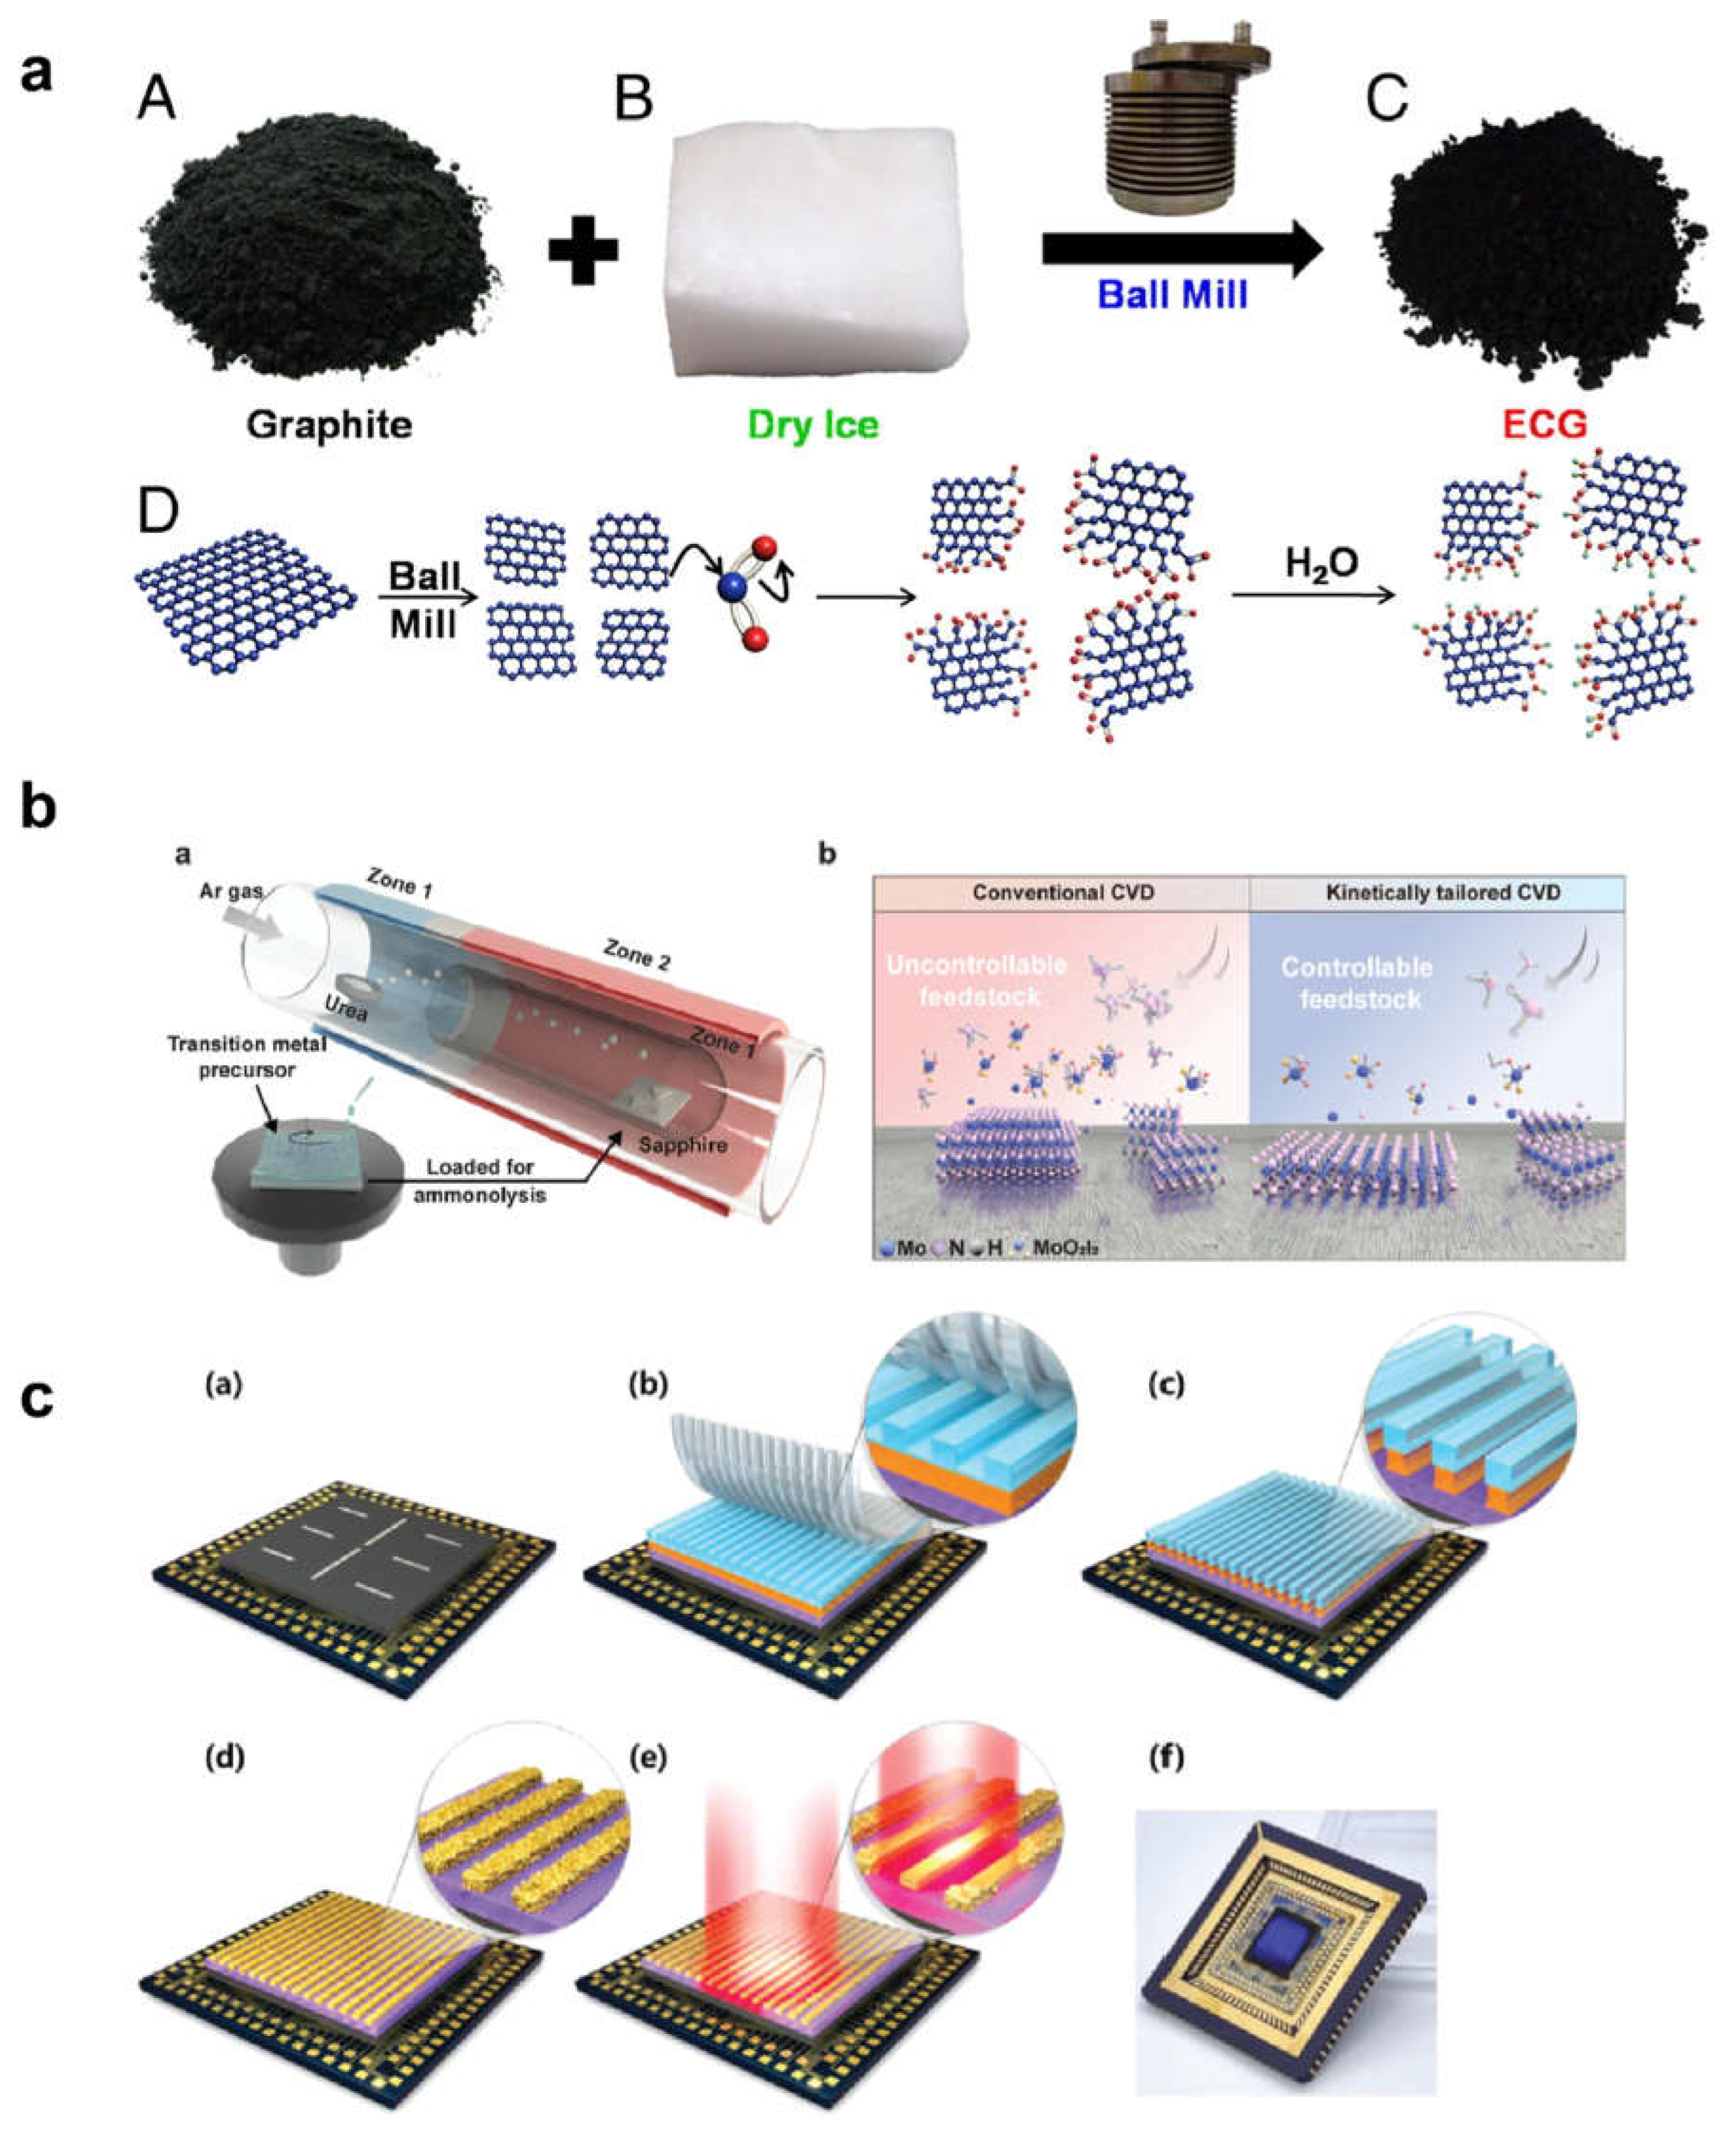
Figure 6.
Schemes of common analysis methods used to characterize PVA-I2 polarizers, 2D polarizers, wire grid polarizers, and other materials include Mueller Matrix Polarimeter (MMP), Spectroscopic Ellipsometry (SE), polarization Raman and Elliptically Polarized Light (EPL) methods.
Figure 6.
Schemes of common analysis methods used to characterize PVA-I2 polarizers, 2D polarizers, wire grid polarizers, and other materials include Mueller Matrix Polarimeter (MMP), Spectroscopic Ellipsometry (SE), polarization Raman and Elliptically Polarized Light (EPL) methods.
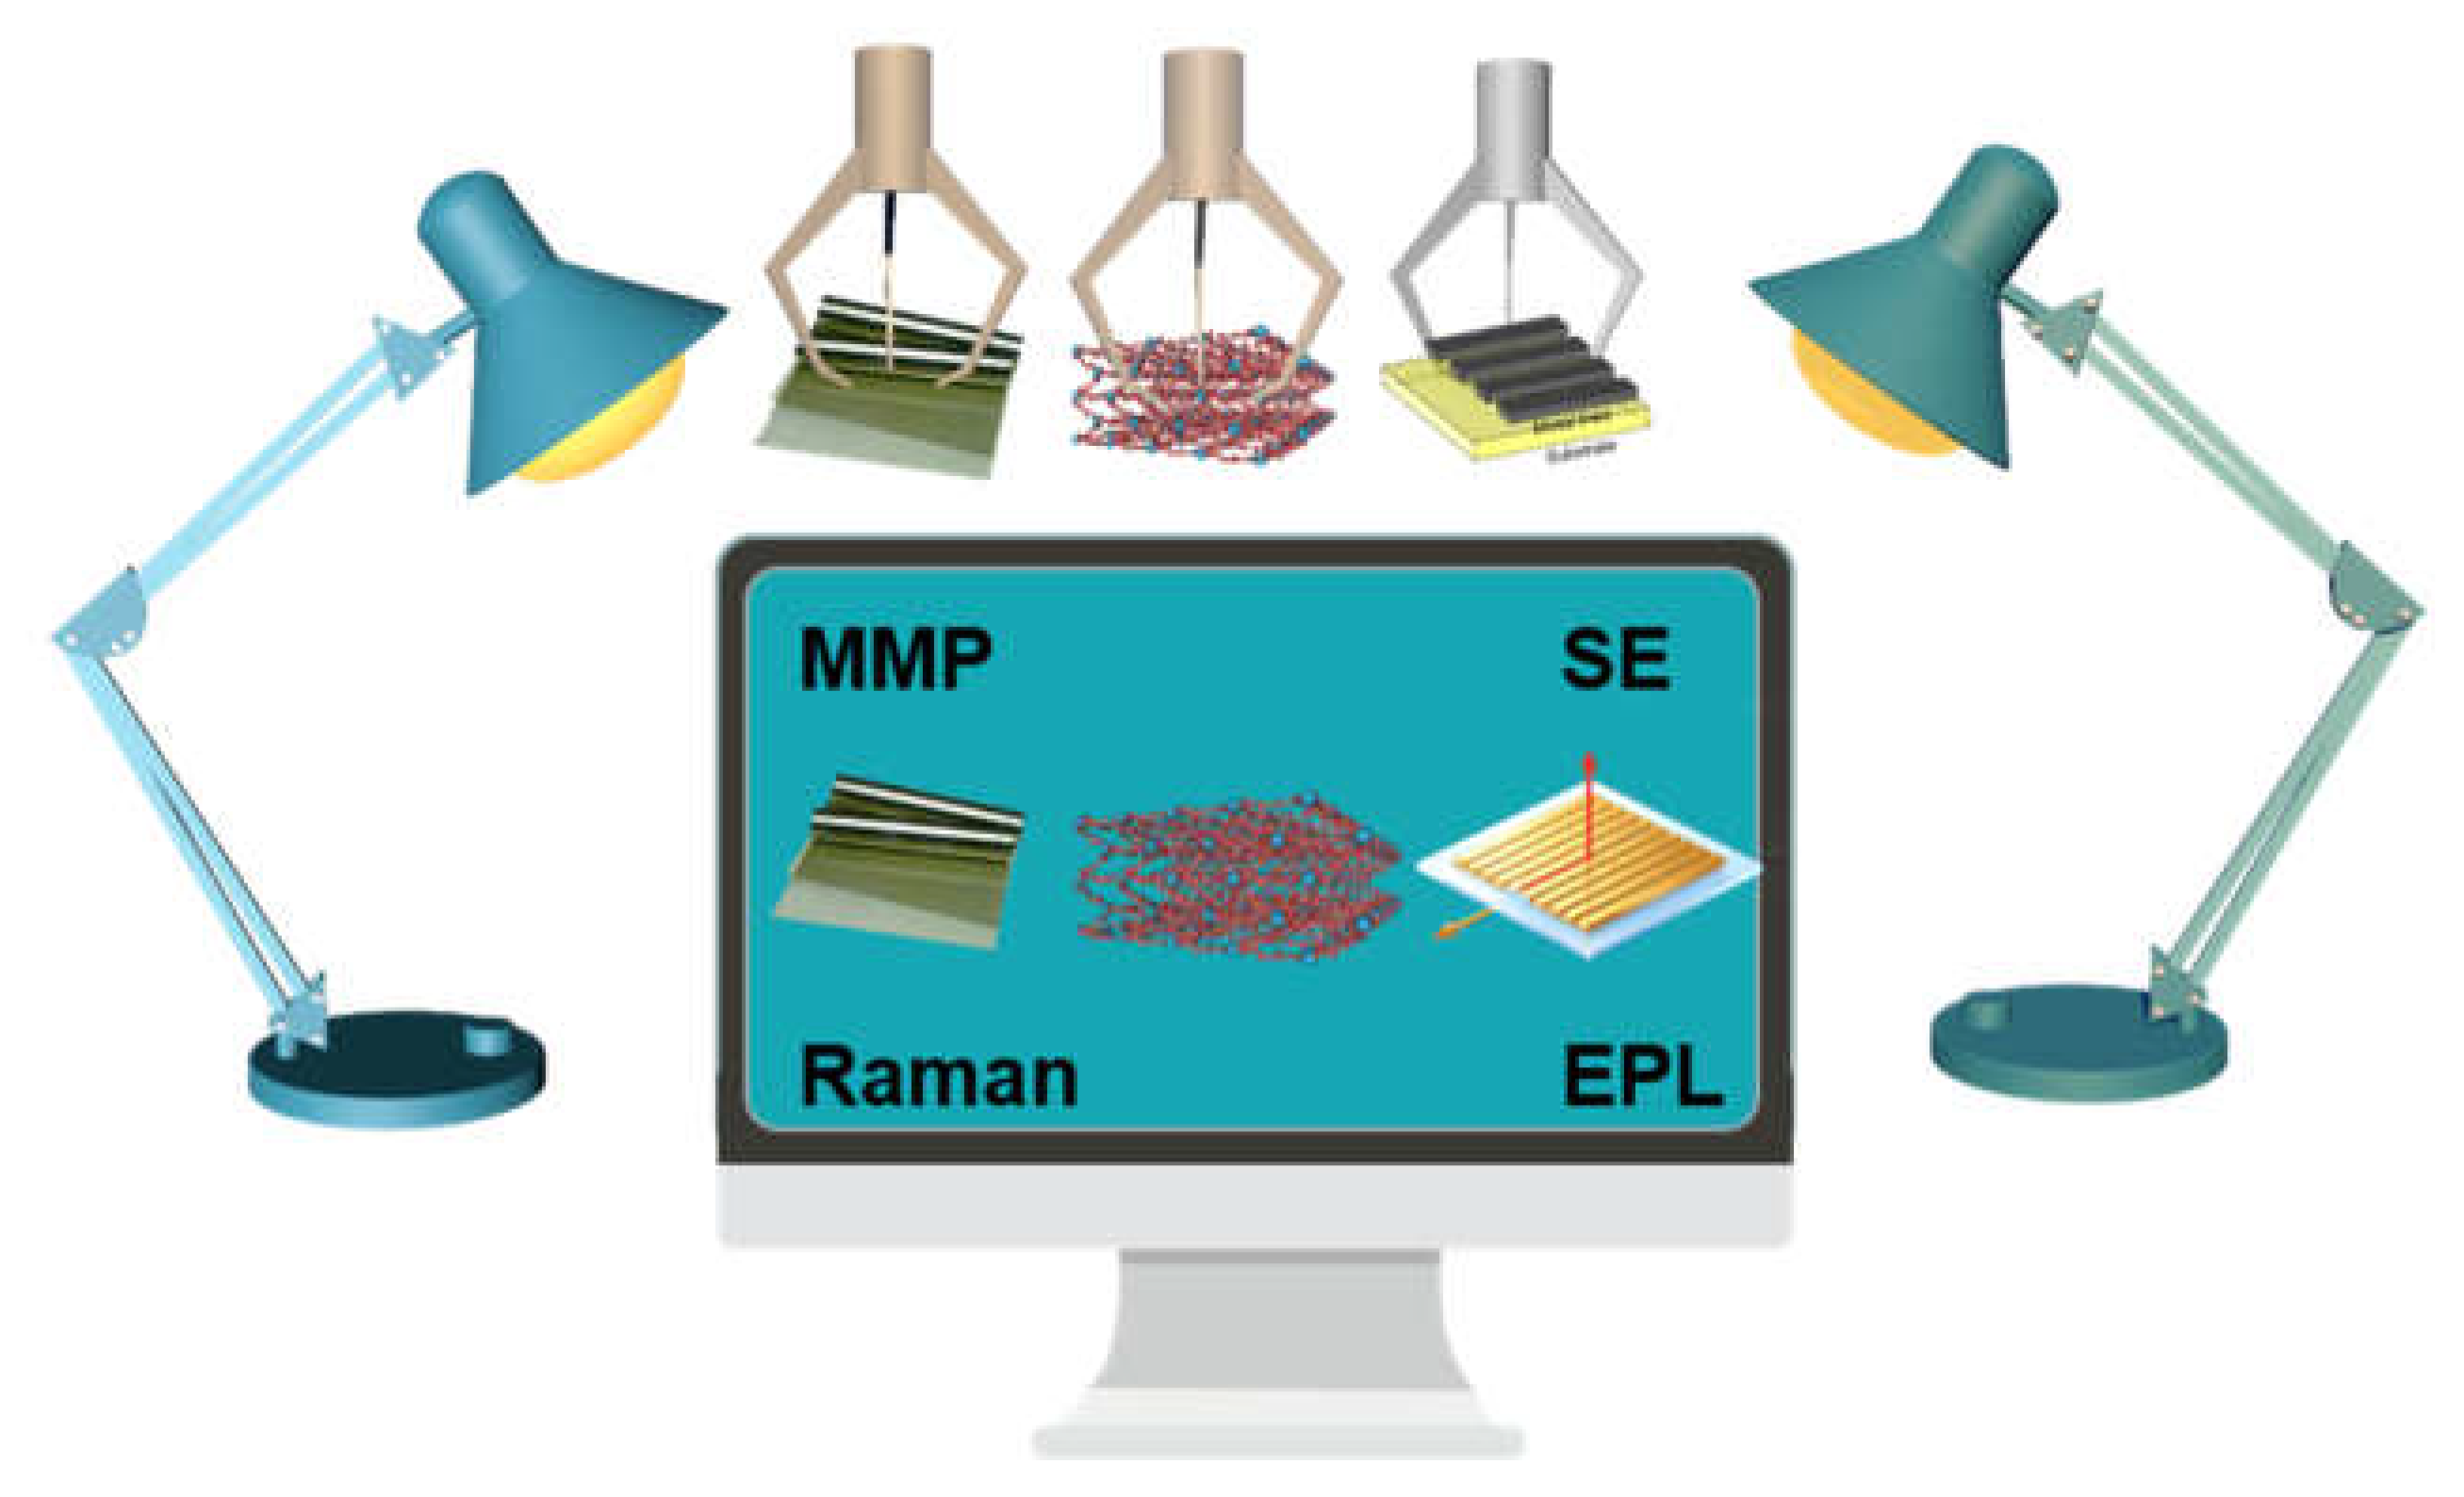
Figure 7.
Scheme of PVA-I2 Polarizer optical performance measurement. (a)The principle of optical measuring equipment is that the Xe lamp light source emits light, which passes through the polarizer and polarizer layer to reach the analyzer; (b) Spectral diagram of transmittance measurement results for polarizers. (c) Scheme of monomer transmittance, parallel transmittance and crossed transmittance.
Figure 7.
Scheme of PVA-I2 Polarizer optical performance measurement. (a)The principle of optical measuring equipment is that the Xe lamp light source emits light, which passes through the polarizer and polarizer layer to reach the analyzer; (b) Spectral diagram of transmittance measurement results for polarizers. (c) Scheme of monomer transmittance, parallel transmittance and crossed transmittance.
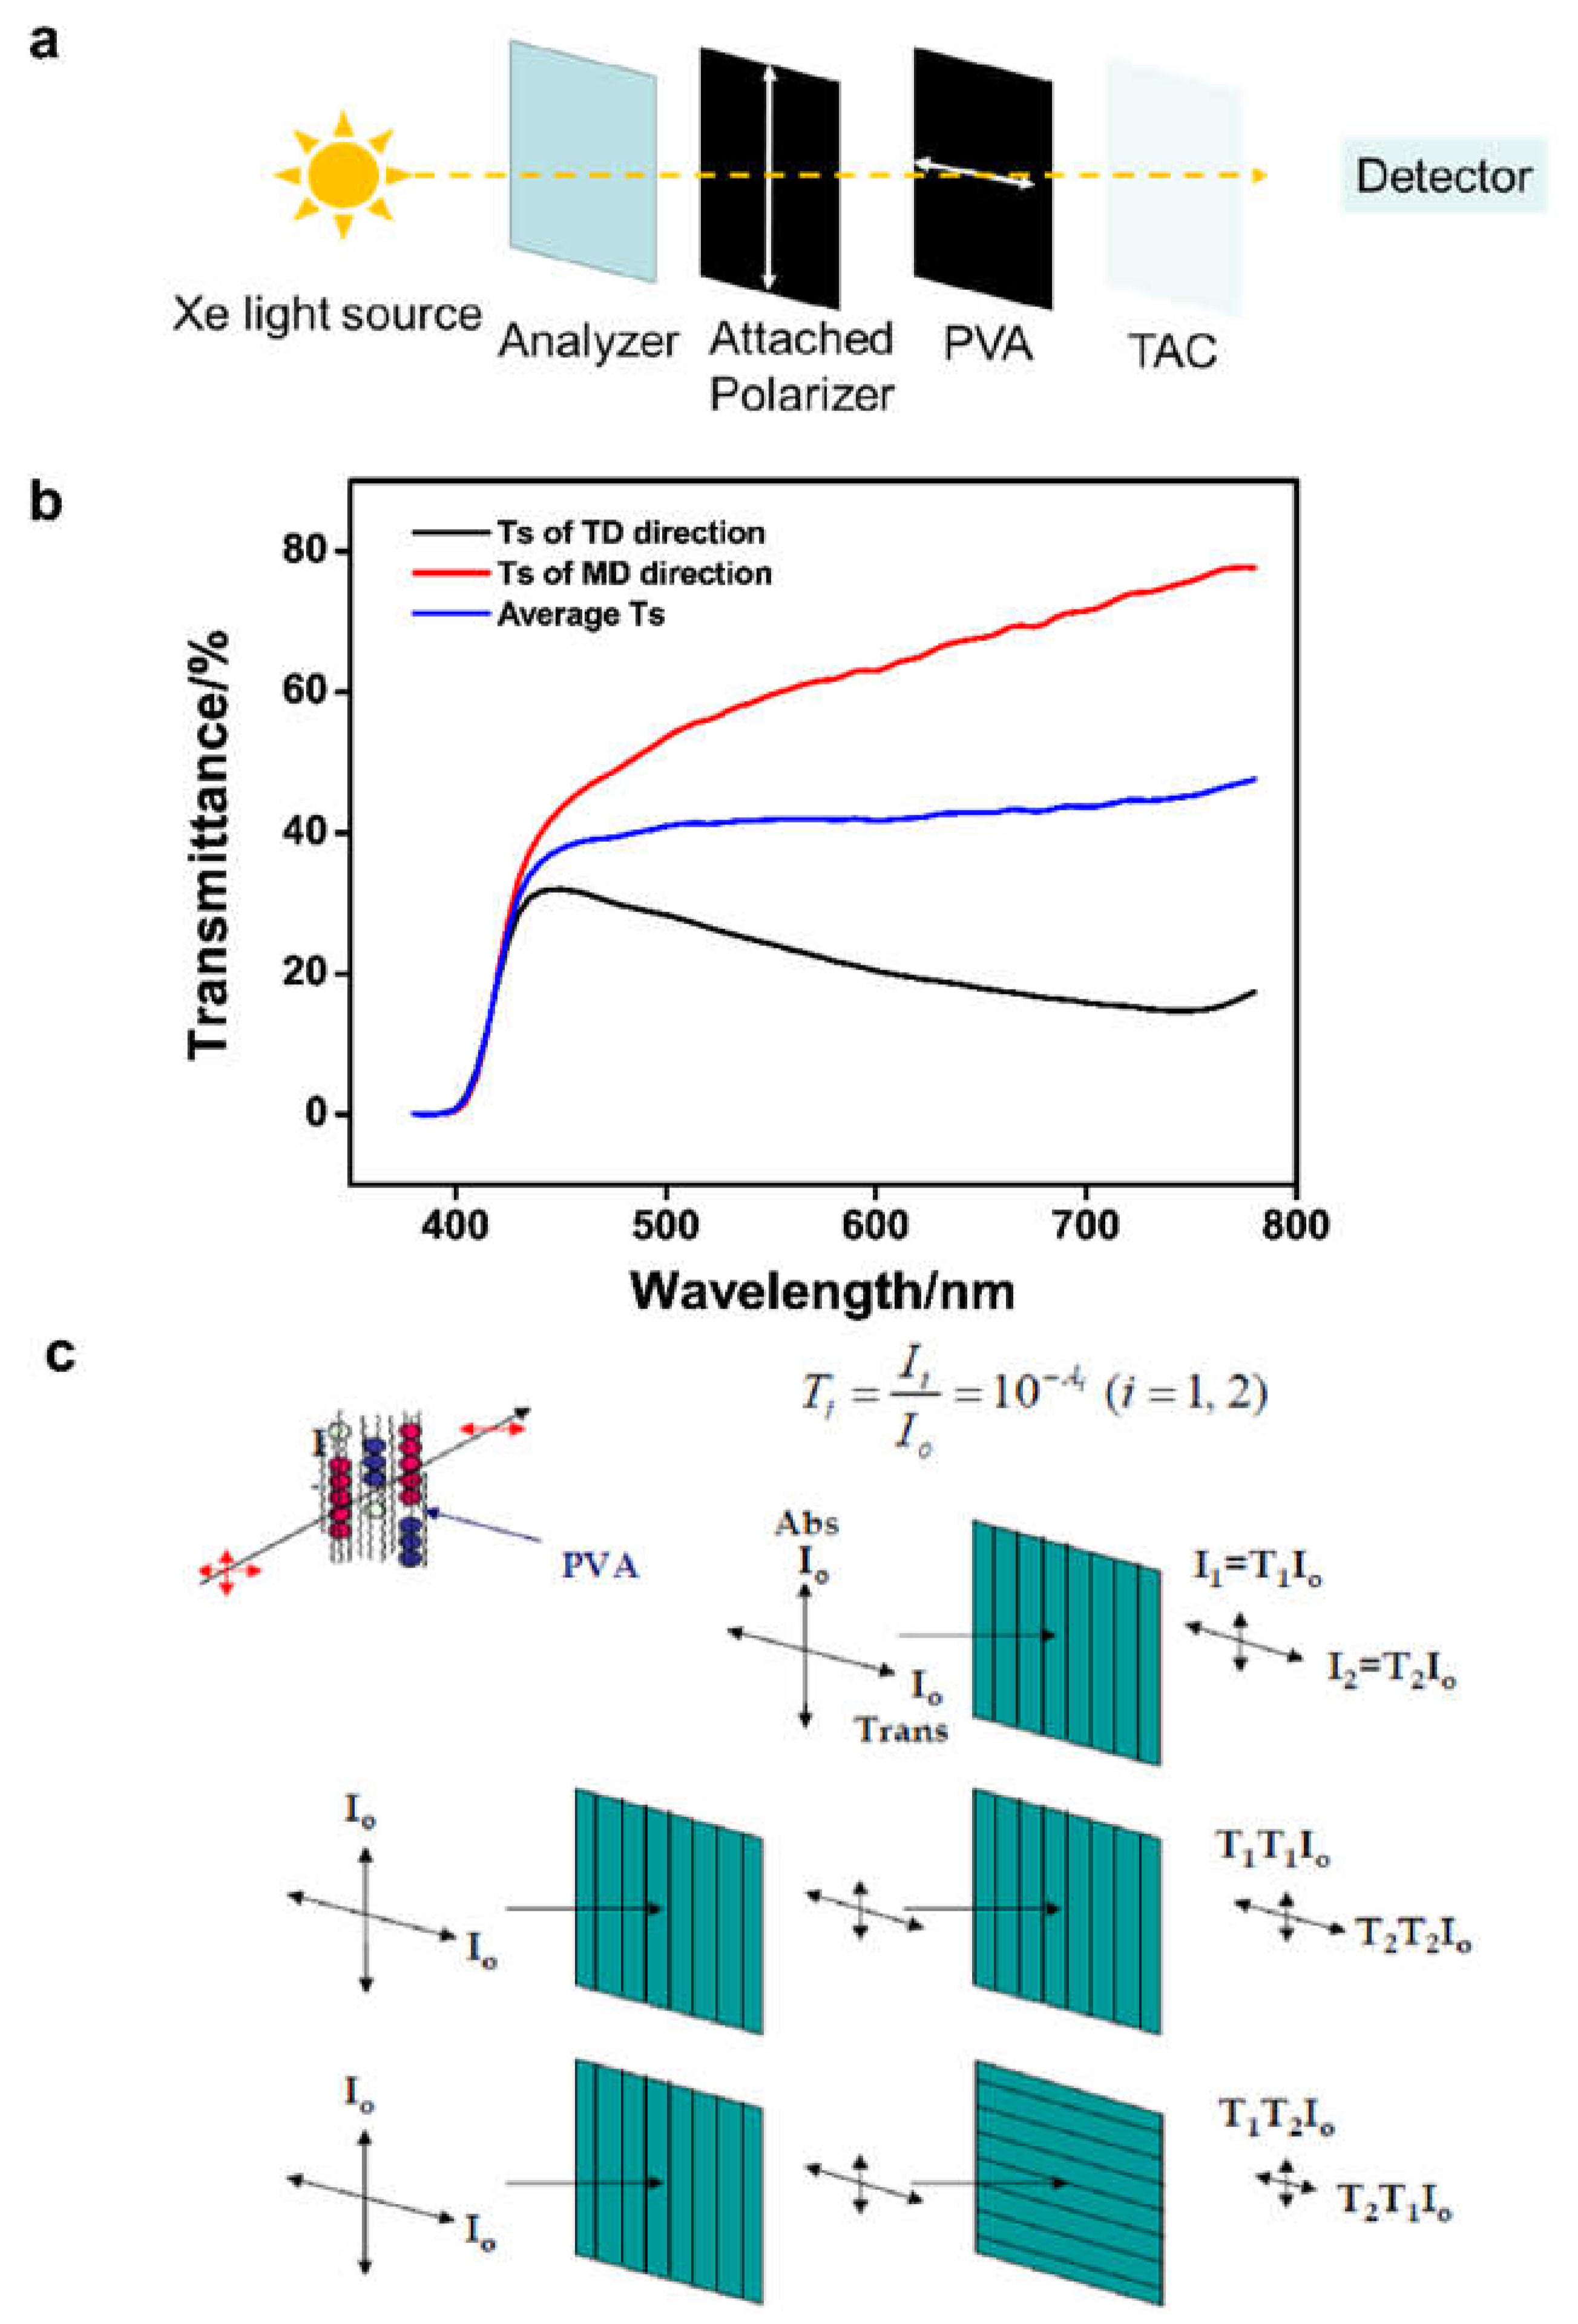
Figure 8.
(a) Schematic illustration of the experimental arrangement for analysis of the polarization properties of AlO molecular spectra; (b) SBR and RSD of AlO (484.21 nm) with and without polarization. Reprinted with permission from ref. [35]; copyright 2026, MDPI; (c) A Mueller matrix imaging polarimeter illuminates and measures a sample with many combinations of illuminating polarizers and analyzing polarizers to measure the Mueller matrix, diattenuation, retardance, and depolarization of samples; (d) A commercial Mueller matrix polarimeter configured for transmission Mueller matrix measurements. This polarimeter measures thirty Mueller matrices per second [4].
Figure 8.
(a) Schematic illustration of the experimental arrangement for analysis of the polarization properties of AlO molecular spectra; (b) SBR and RSD of AlO (484.21 nm) with and without polarization. Reprinted with permission from ref. [35]; copyright 2026, MDPI; (c) A Mueller matrix imaging polarimeter illuminates and measures a sample with many combinations of illuminating polarizers and analyzing polarizers to measure the Mueller matrix, diattenuation, retardance, and depolarization of samples; (d) A commercial Mueller matrix polarimeter configured for transmission Mueller matrix measurements. This polarimeter measures thirty Mueller matrices per second [4].
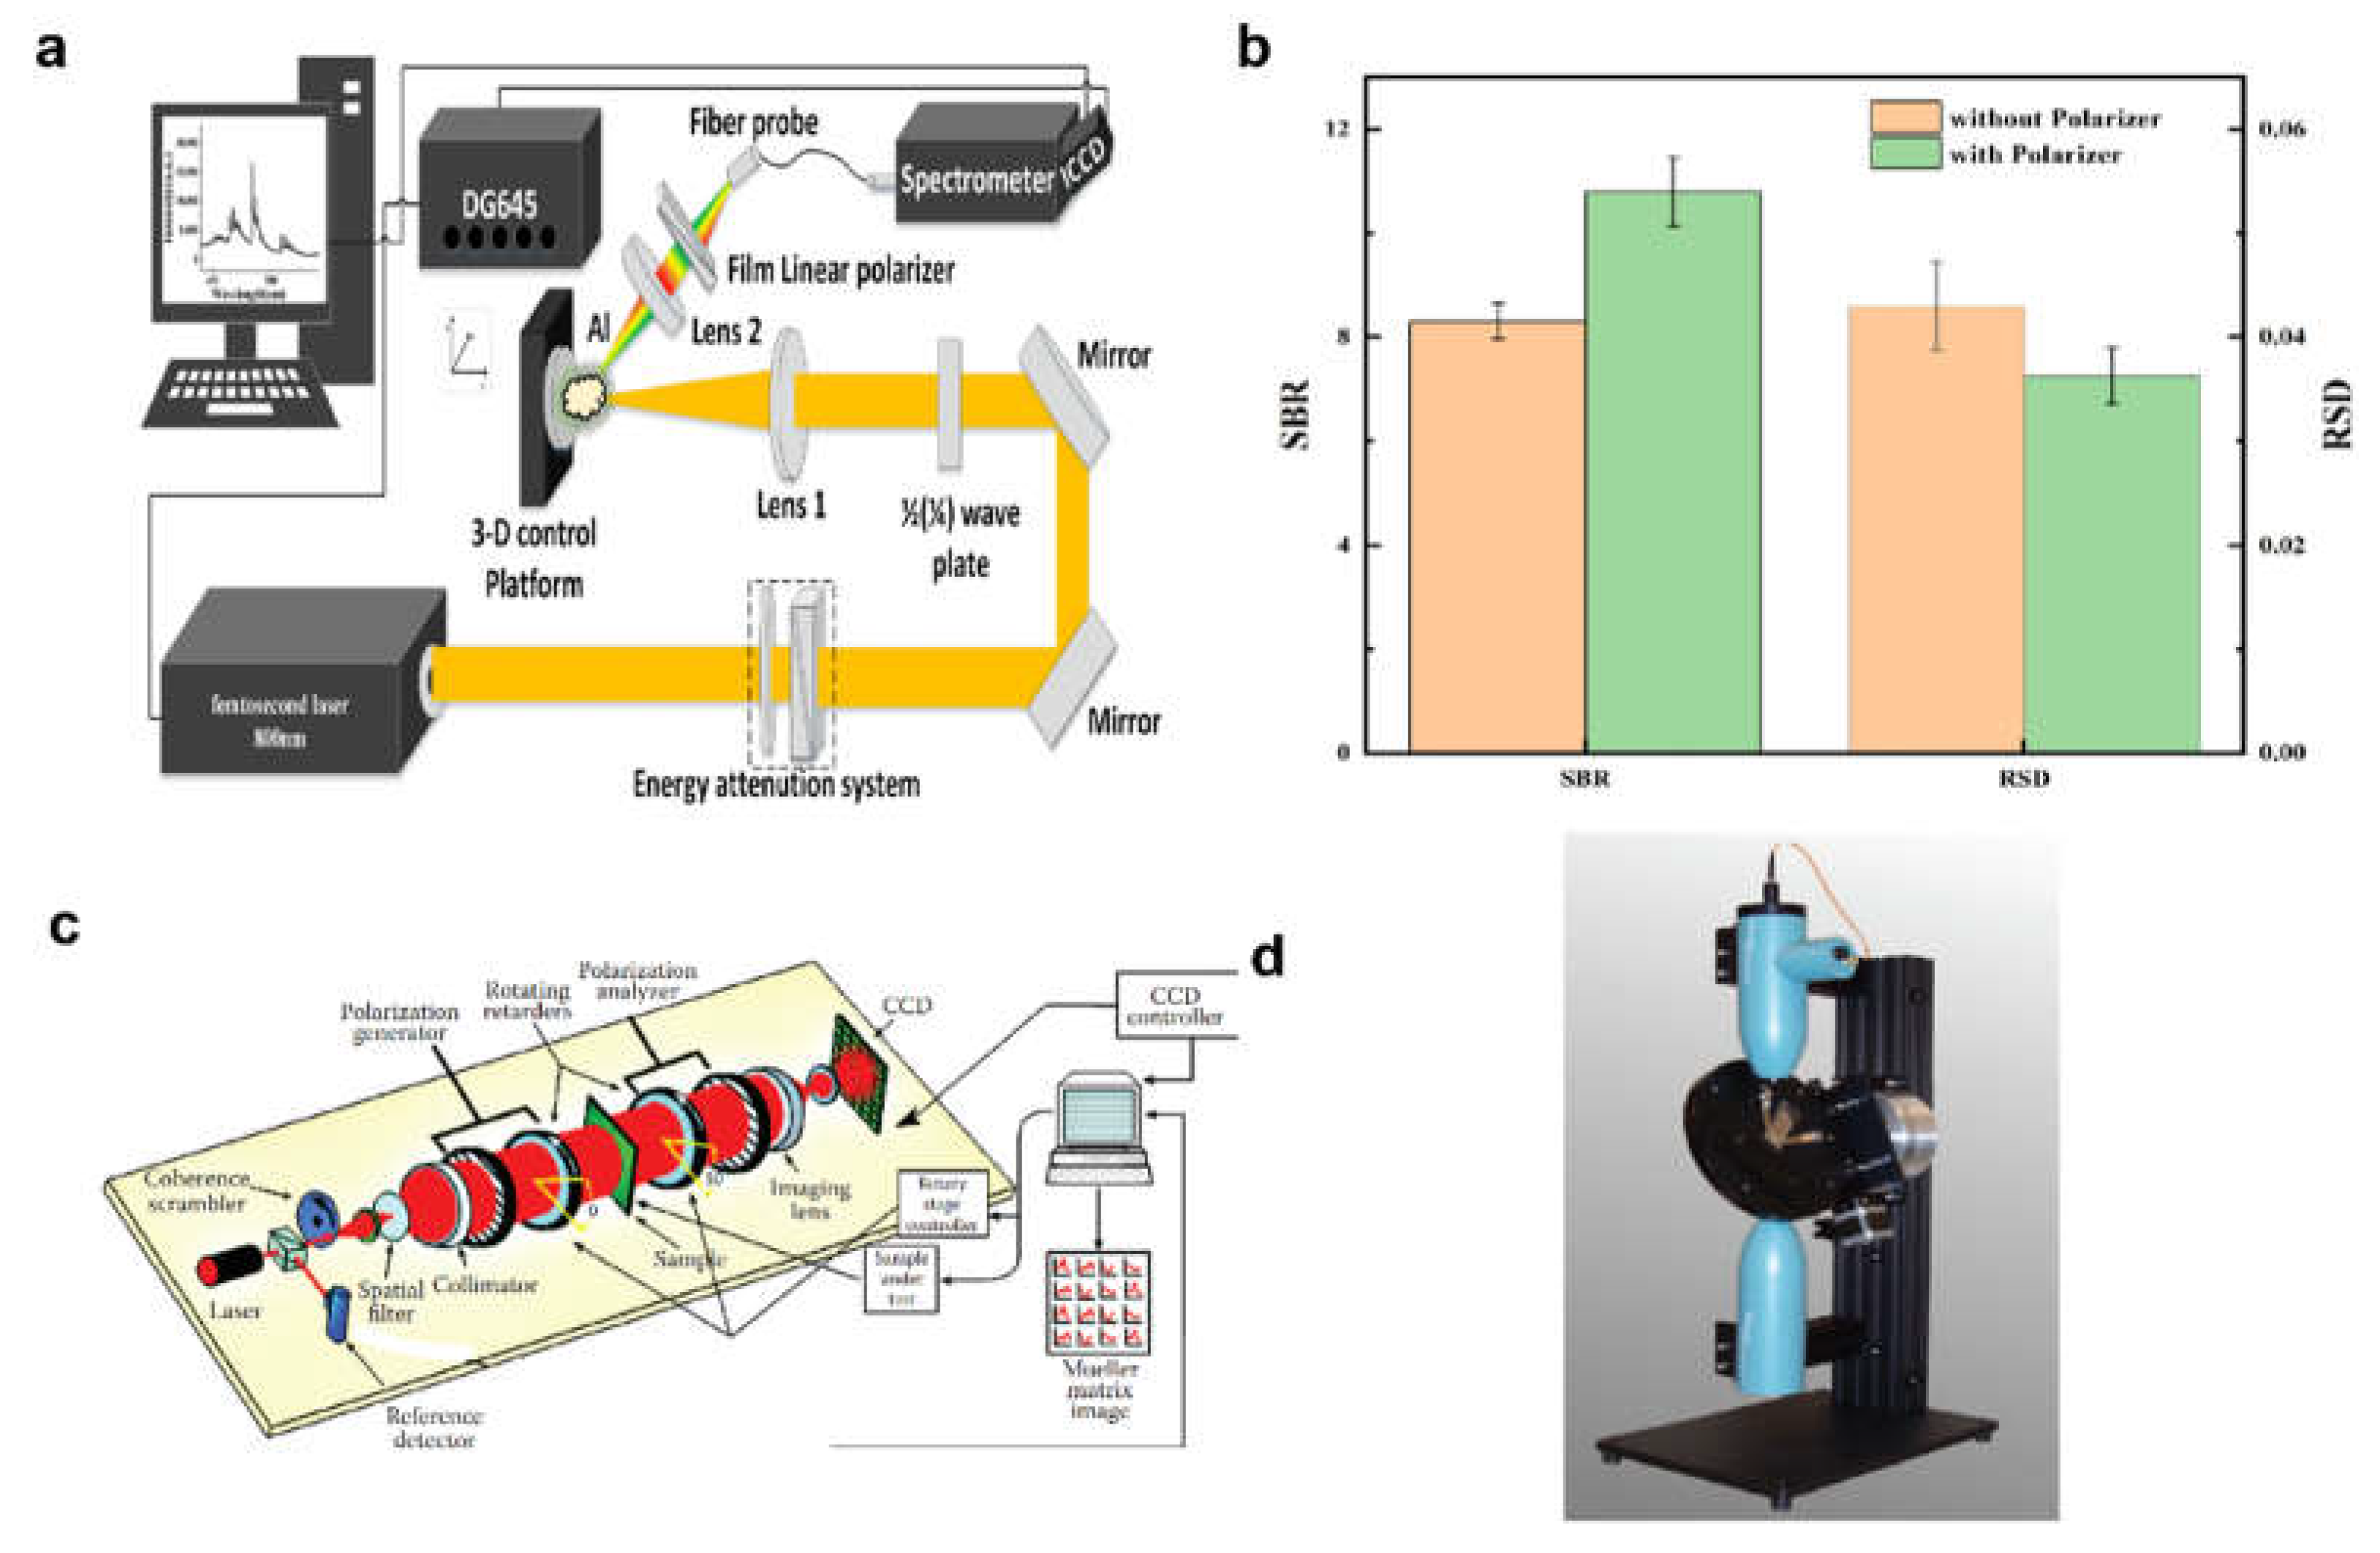
Figure 9.
Schematic of frequency division multiplexing, frequency division multiplexing spectroscopic ellipsometry, Experimental measurement for a 40-nm SiO2 film on a Si wafer and polarized Raman spectra of an oriented monoclinic ludlamite crystal recorded on the (001) cleavage plane. If there are multiple panels, they should be listed as: (a) Three LDs generating light of distinct wavelengths (λ1, λ2, λ3) are intensity-modulated by a function generator. Reprinted with permission from ref. [38]; copyright 2024, Springer Nature; (b) Frequency division multiplexing spectroscopic ellipsometry (FDM-SE) consists of an intensity-modulated LD source, a fixed polarizer (fP), the sample to be analyzed, a rotating analyzer (rA), a fixed analyzer (fA) and a photodiode. Reprinted with permission from ref. [38]; copyright 2024, Springer Nature; (c) IPD (t) for rotating analyzer angles C of 0°, 45°, 90°, 135°, and 180°, respectively. Frequency-domain representation of IPD (t) obtained after Fourier transform. Reprinted with permission from ref. [38]; copyright 2024, Springer Nature; (d) Reprinted with permission from ref. 106; copyright 2026, © Elsevier B.V.
Figure 9.
Schematic of frequency division multiplexing, frequency division multiplexing spectroscopic ellipsometry, Experimental measurement for a 40-nm SiO2 film on a Si wafer and polarized Raman spectra of an oriented monoclinic ludlamite crystal recorded on the (001) cleavage plane. If there are multiple panels, they should be listed as: (a) Three LDs generating light of distinct wavelengths (λ1, λ2, λ3) are intensity-modulated by a function generator. Reprinted with permission from ref. [38]; copyright 2024, Springer Nature; (b) Frequency division multiplexing spectroscopic ellipsometry (FDM-SE) consists of an intensity-modulated LD source, a fixed polarizer (fP), the sample to be analyzed, a rotating analyzer (rA), a fixed analyzer (fA) and a photodiode. Reprinted with permission from ref. [38]; copyright 2024, Springer Nature; (c) IPD (t) for rotating analyzer angles C of 0°, 45°, 90°, 135°, and 180°, respectively. Frequency-domain representation of IPD (t) obtained after Fourier transform. Reprinted with permission from ref. [38]; copyright 2024, Springer Nature; (d) Reprinted with permission from ref. 106; copyright 2026, © Elsevier B.V.
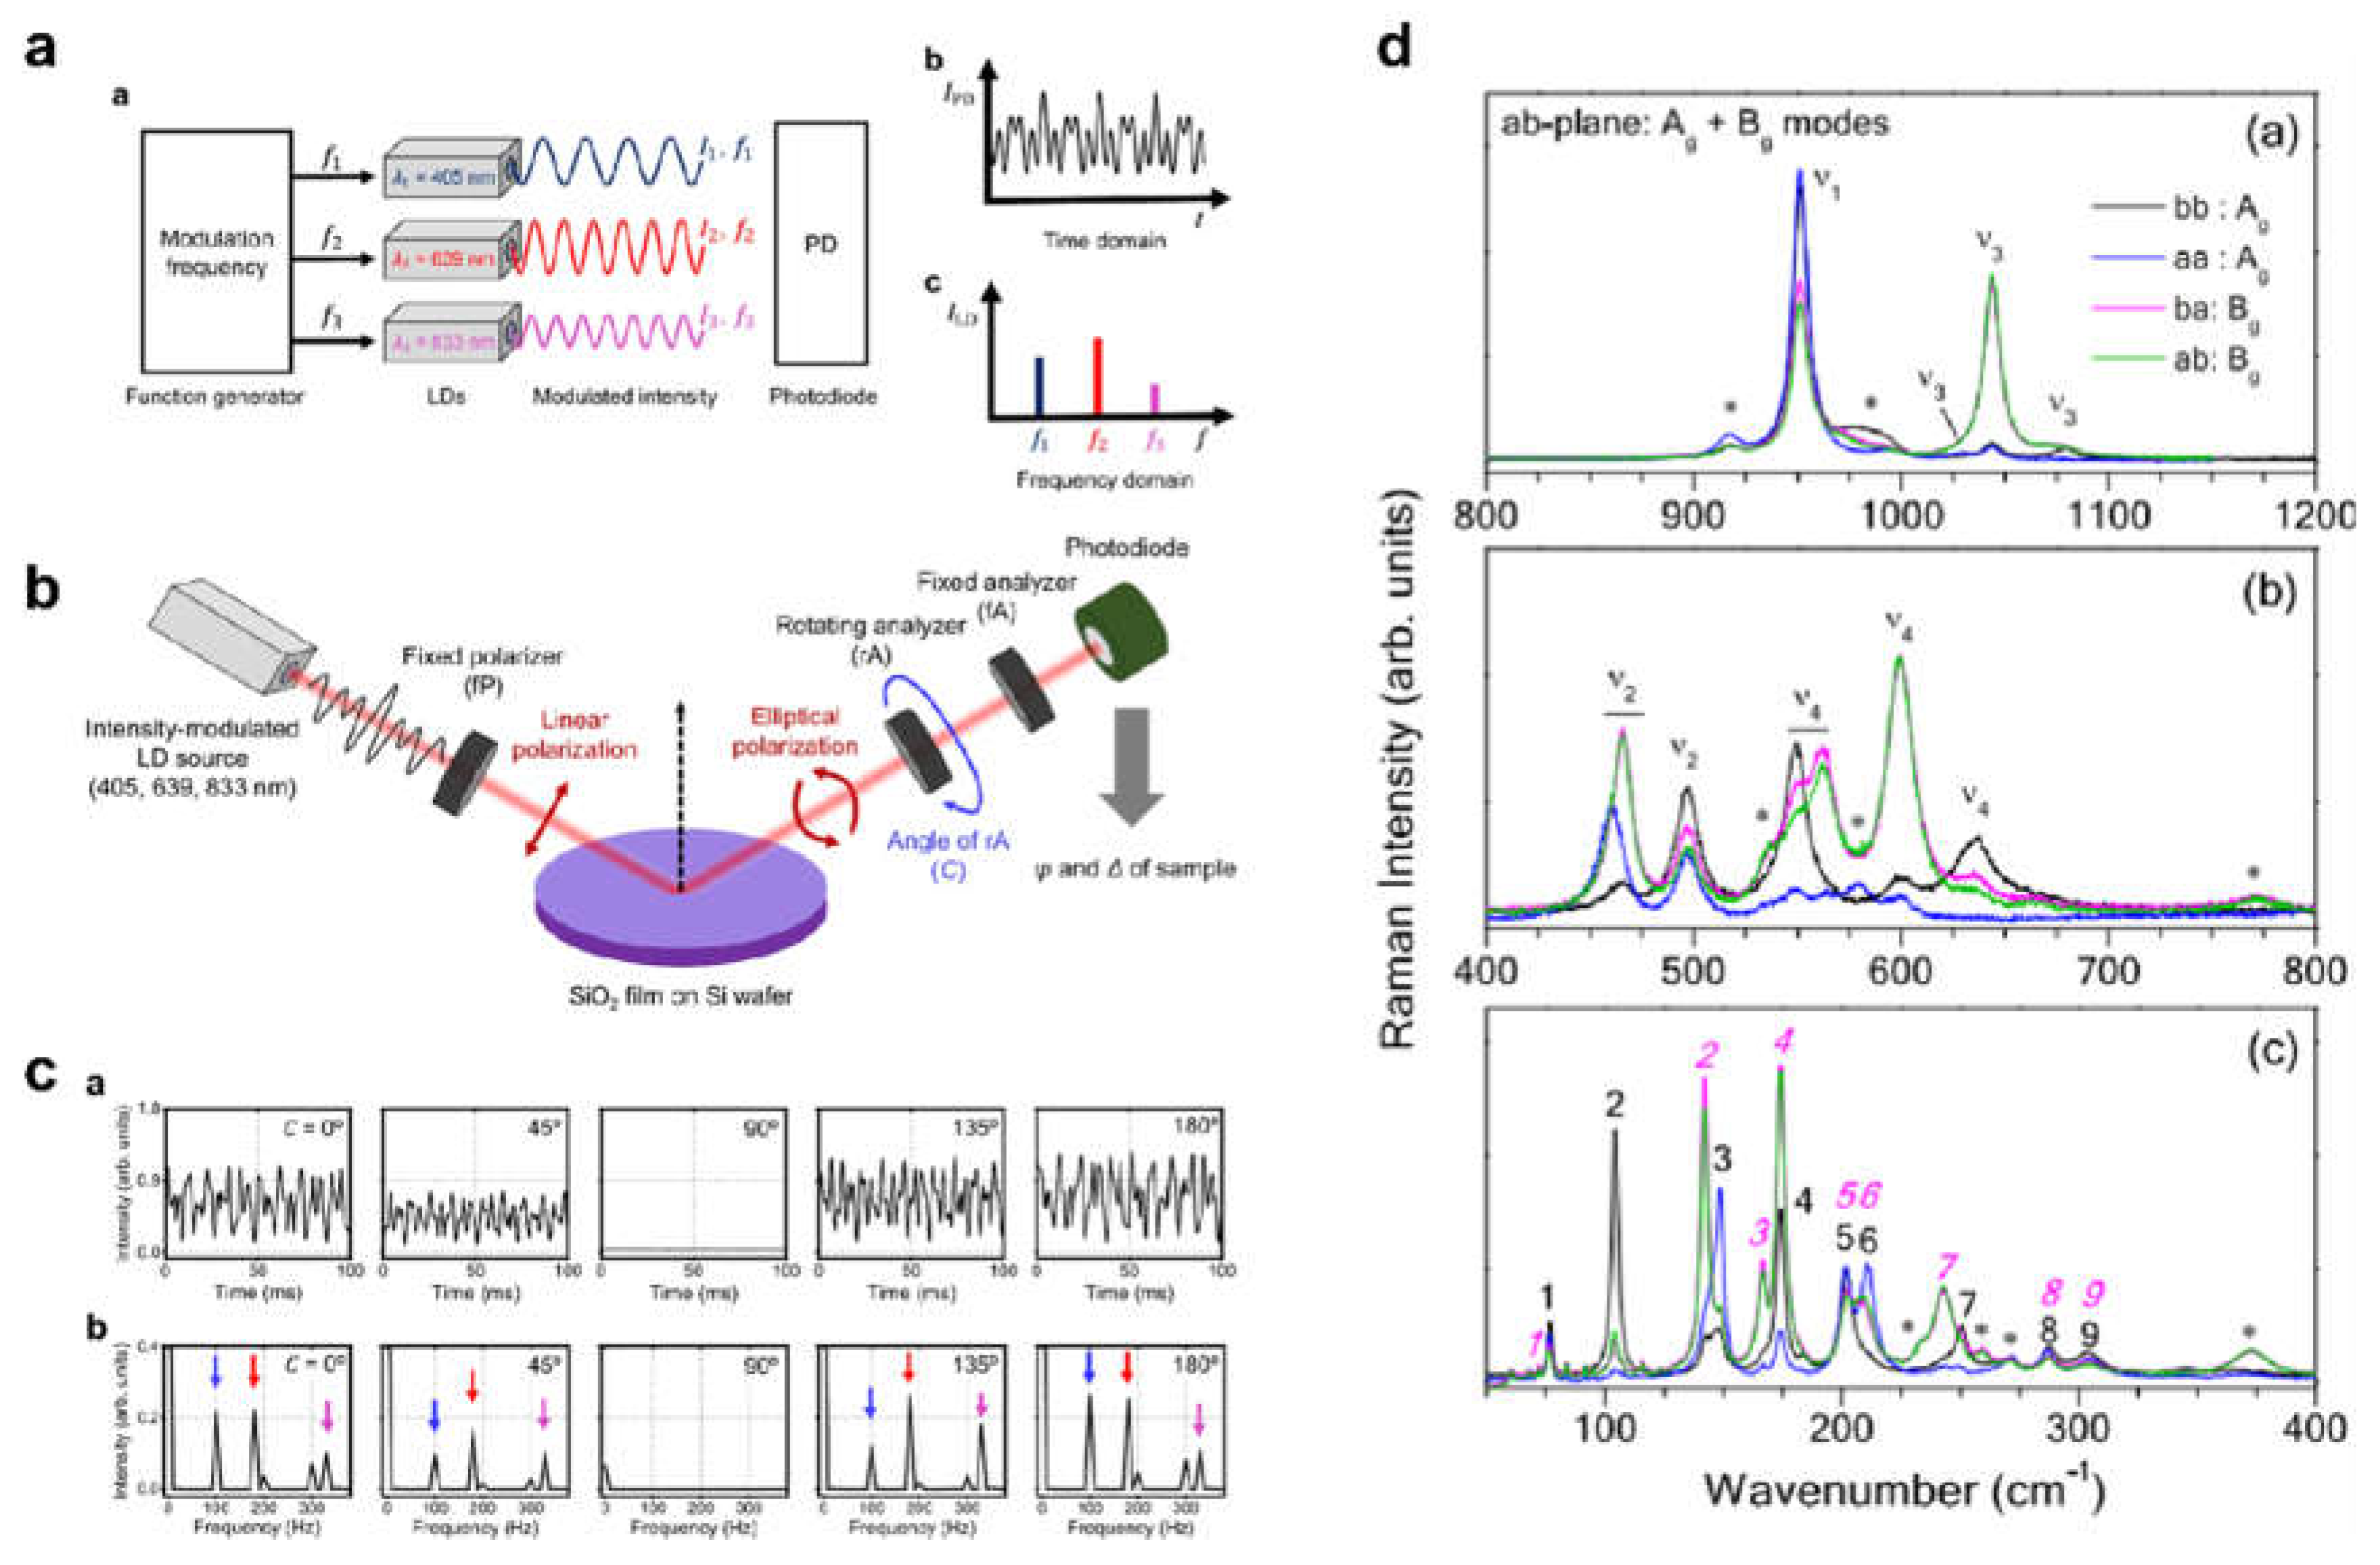
Figure 10.
Schemes of polarization methodology for display performance improvement, polarization grating microarrays and ellipsometry study by using mathematical methods such as Stokes vector and Muller matrix.
Figure 10.
Schemes of polarization methodology for display performance improvement, polarization grating microarrays and ellipsometry study by using mathematical methods such as Stokes vector and Muller matrix.
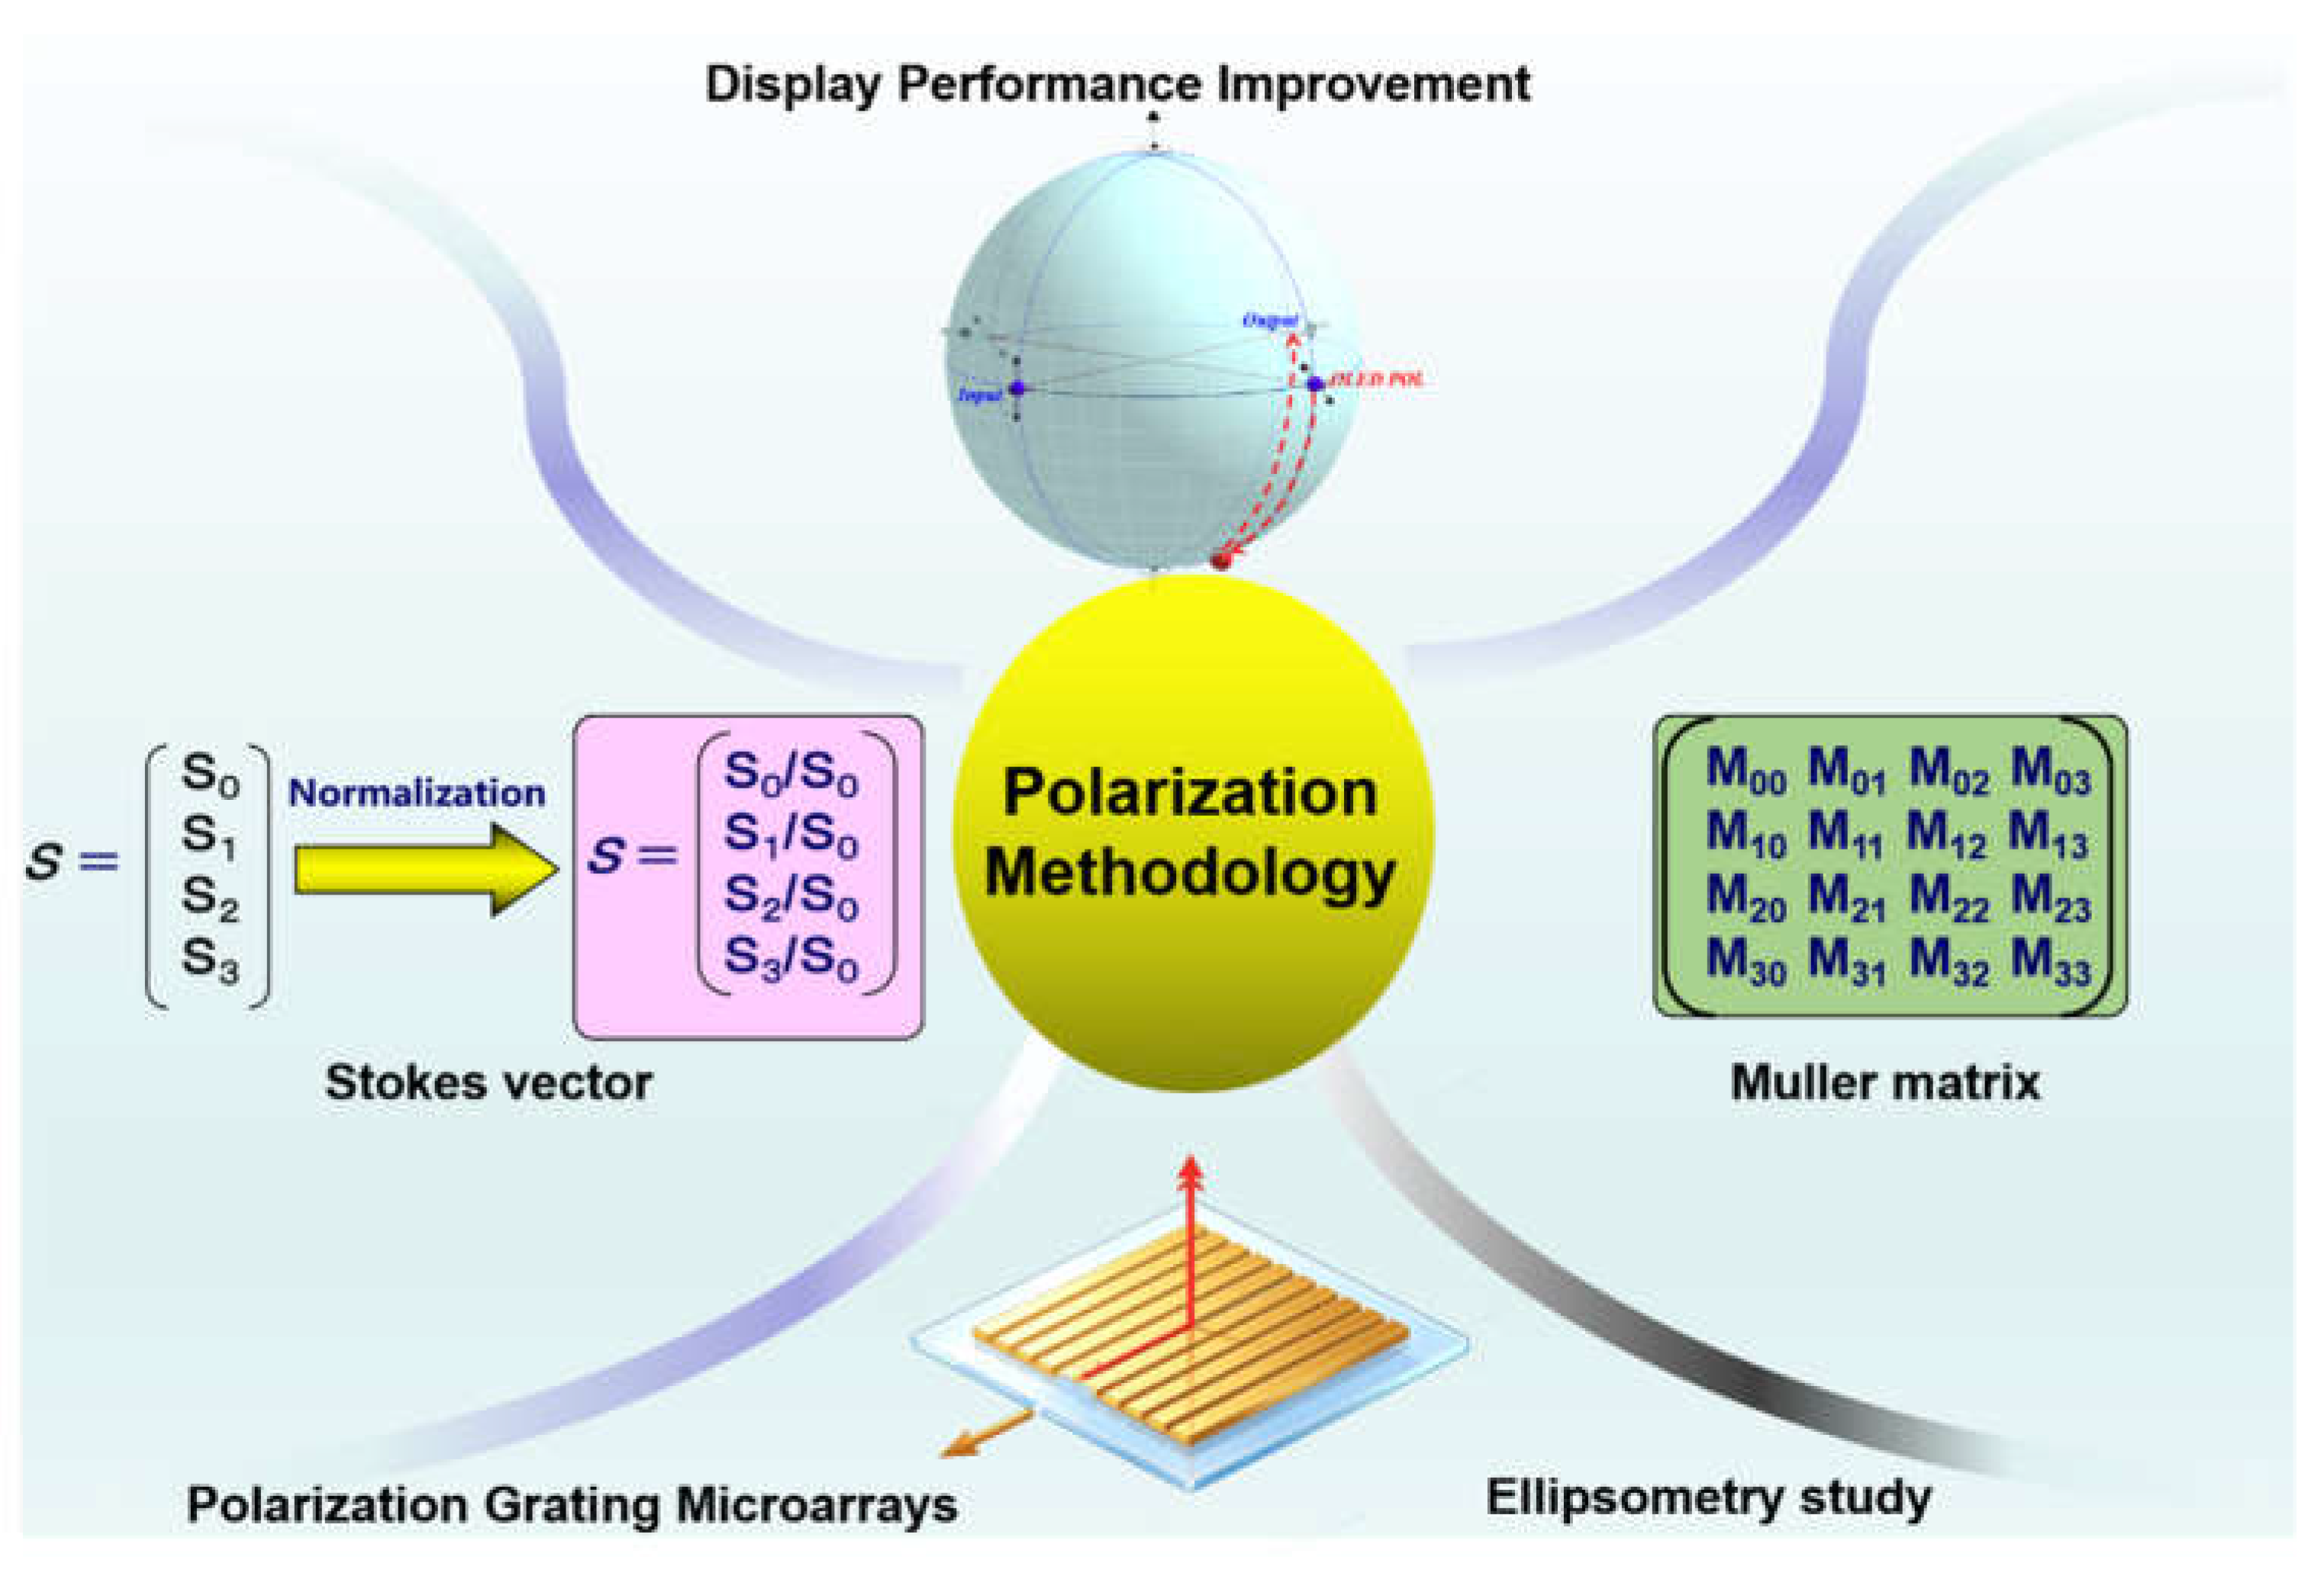
Figure 11.
Schemes of Stokes vector and Muller matrix and Poincaré sphere. (a) Stokes vectors and incident light vector diagrams of linear and circular polarization; (b) A beam of polarized light is represented by a Stokes vector, and after passing through a Mueller matrix, the outgoing light’s Stokes vector is obtained; (c) The Poincaré sphere description of the Stokes vector.
Figure 11.
Schemes of Stokes vector and Muller matrix and Poincaré sphere. (a) Stokes vectors and incident light vector diagrams of linear and circular polarization; (b) A beam of polarized light is represented by a Stokes vector, and after passing through a Mueller matrix, the outgoing light’s Stokes vector is obtained; (c) The Poincaré sphere description of the Stokes vector.
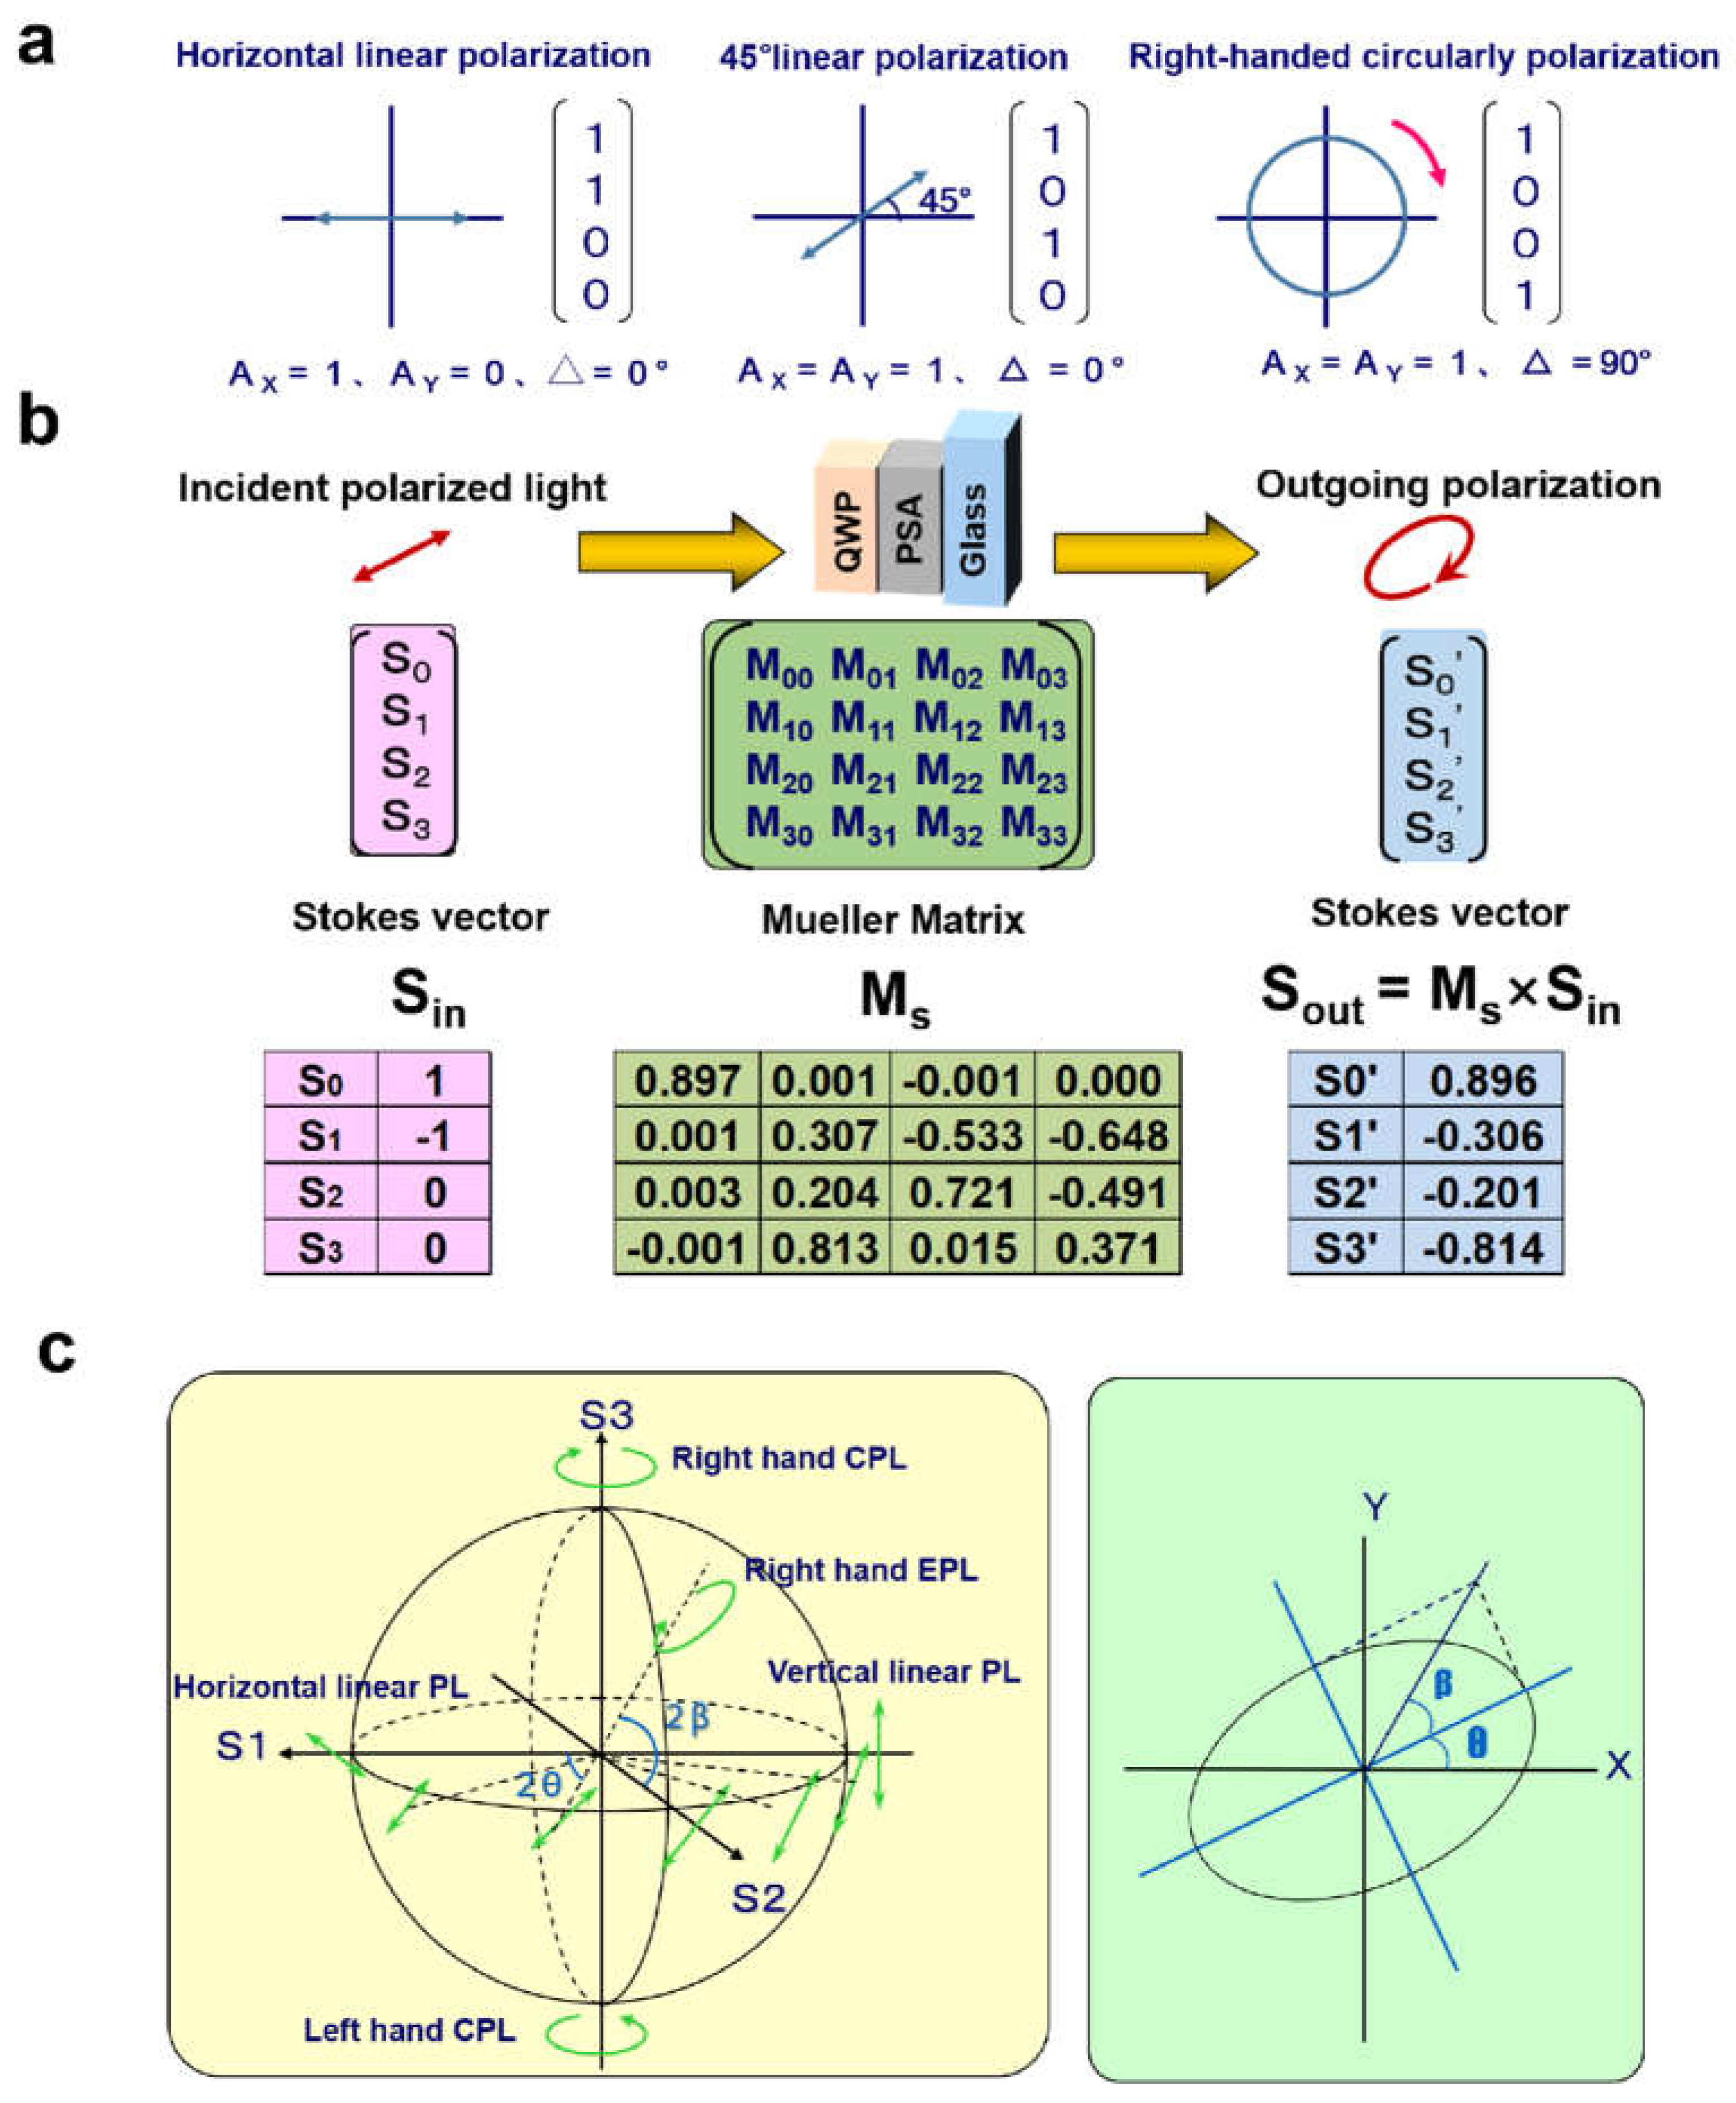
Figure 12.
Demonstration of LCD polarizers and OLED polarizers on Poincaré sphere. (a) Device structure and (b) compensation principle of an IPS-LCD with compensation of a positive a-film and a positive c-film [49]; (c) FPM Level Sample Absorption Axis Angle-dependent explained by Poincaré sphere.
Figure 12.
Demonstration of LCD polarizers and OLED polarizers on Poincaré sphere. (a) Device structure and (b) compensation principle of an IPS-LCD with compensation of a positive a-film and a positive c-film [49]; (c) FPM Level Sample Absorption Axis Angle-dependent explained by Poincaré sphere.
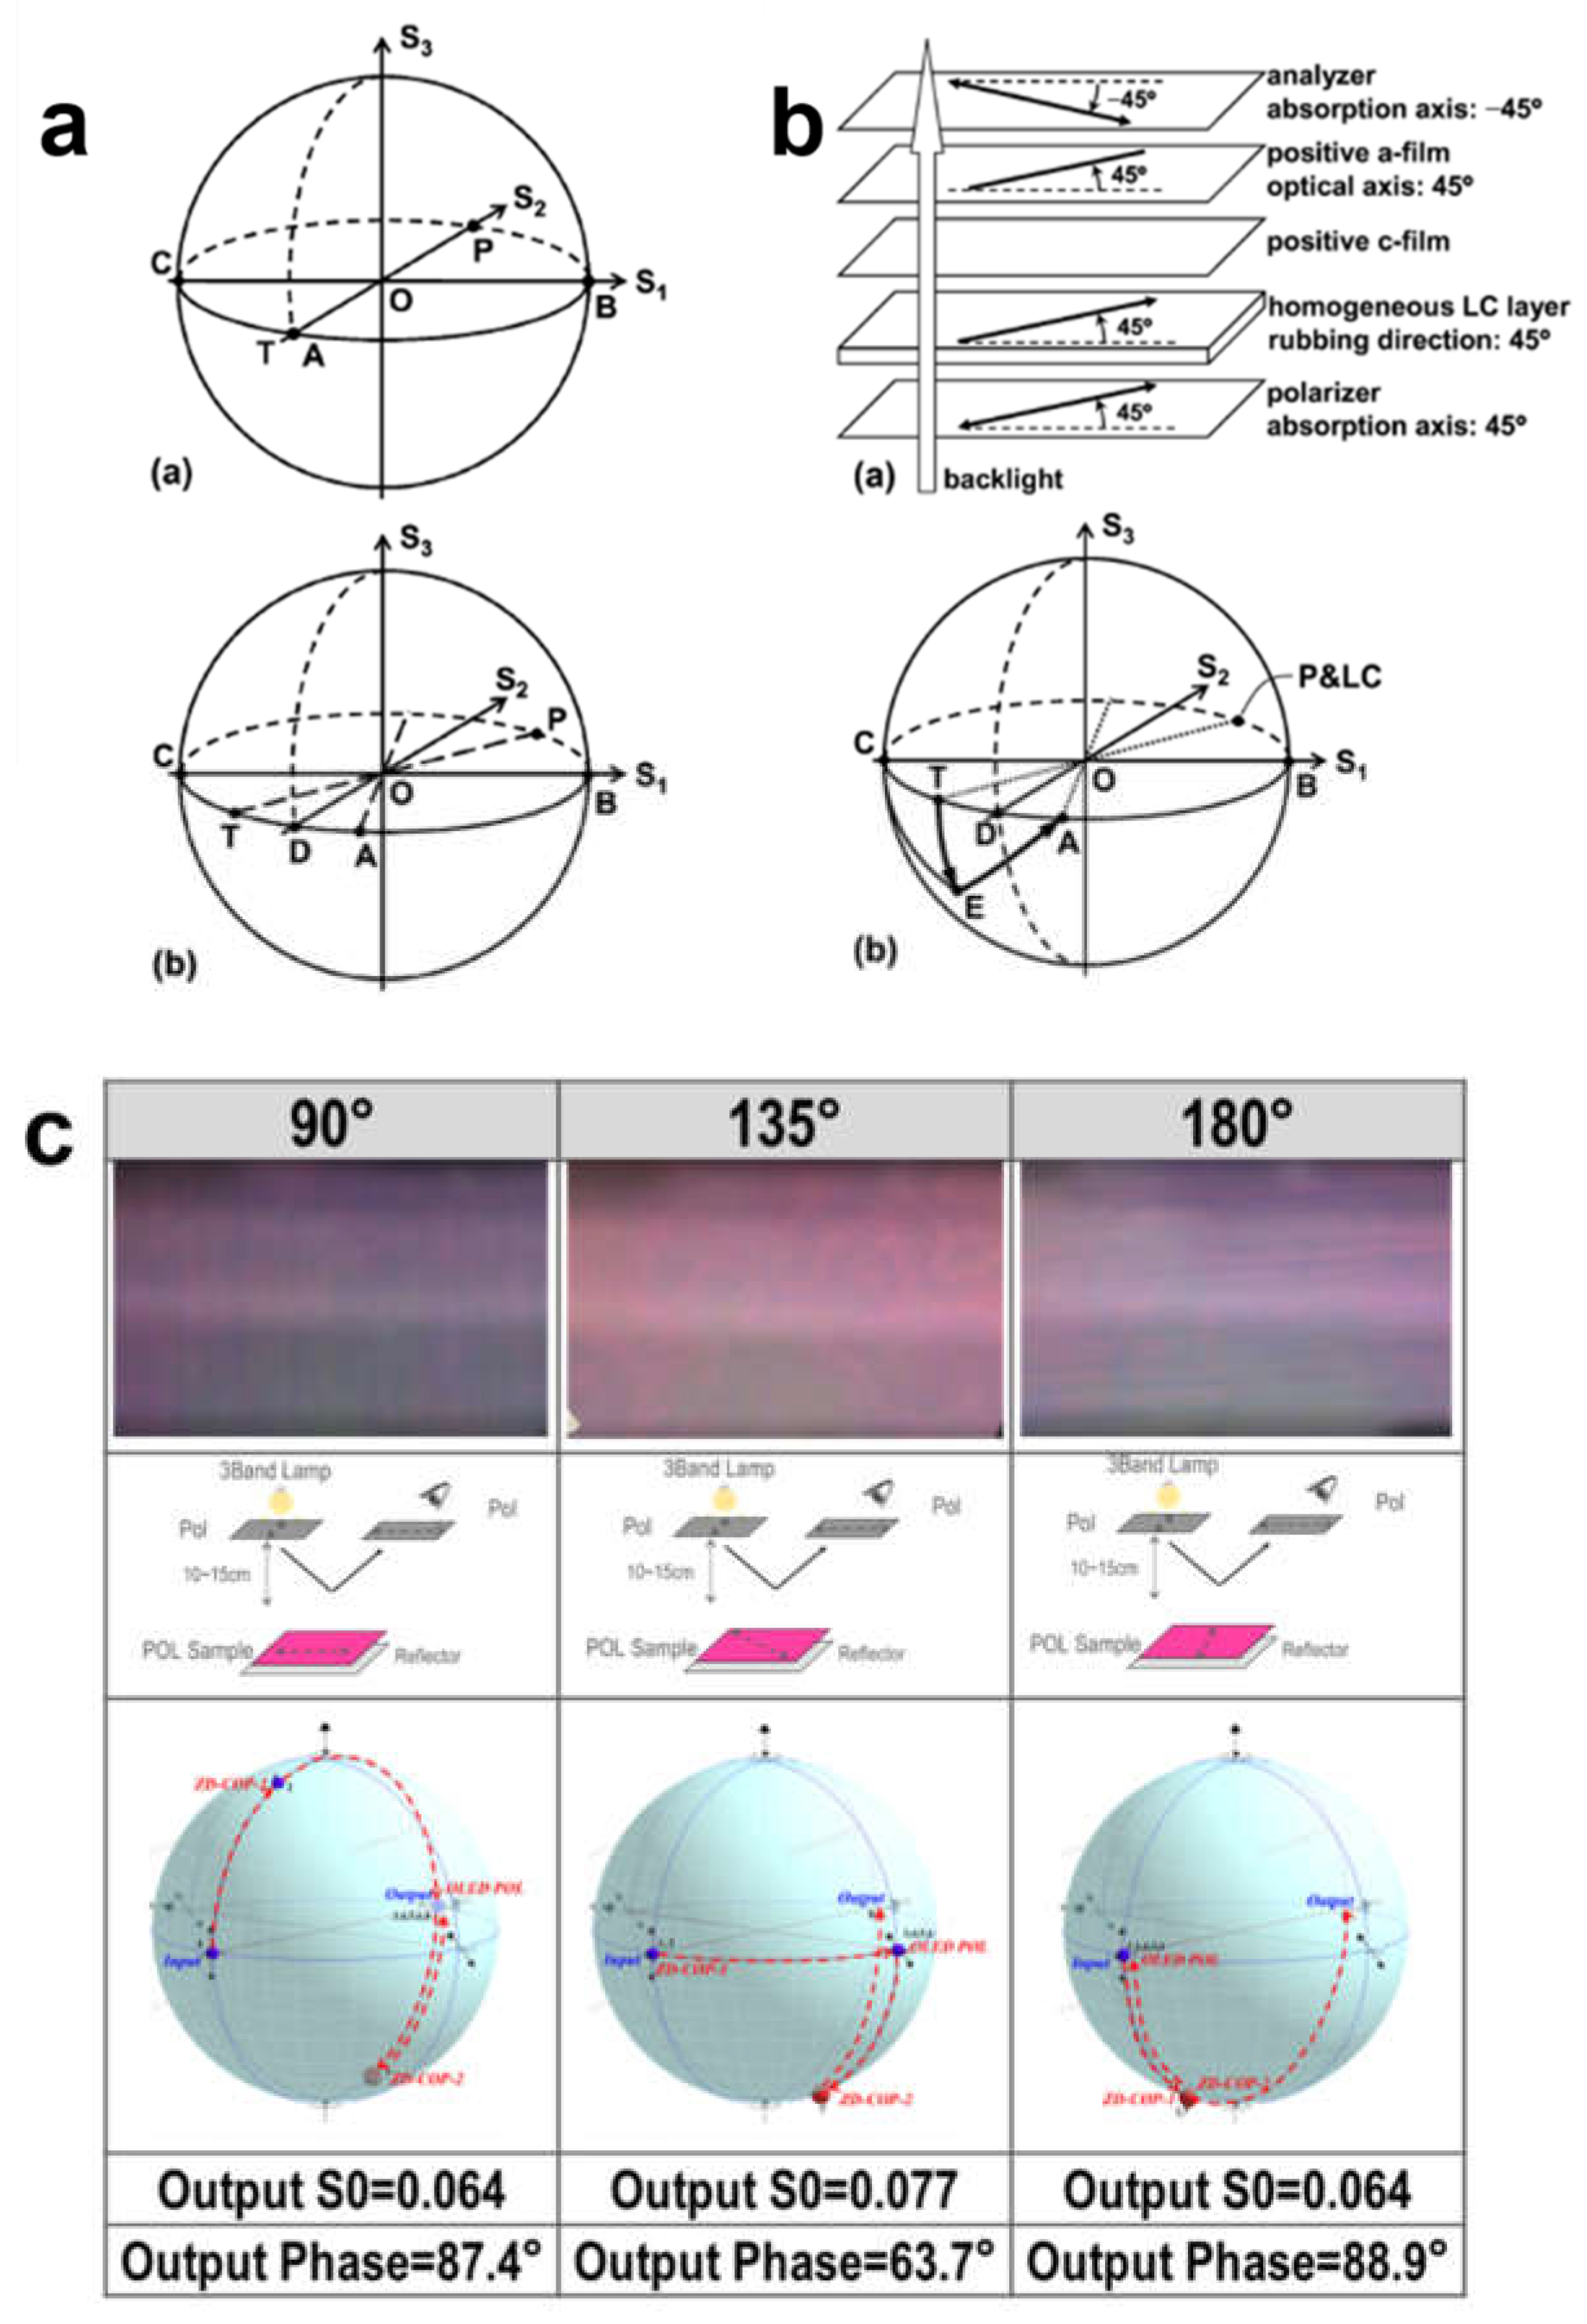
Figure 13.
Matrix gratings for arbitrary parallel polarization analysis and metagrating full-Stokes polarization camera. This is a figure. Schemes follow another format. If there are multiple panels, they should be listed as: (a) The grating is illuminated by light whose polarization is varied while recording the output polarization on a single diffraction order with a full-Stokes polarimeter; The polarization contrast of each order is shown; The polarizations analyzed by each order of the tetrahedron grating are shown on the Poincaré sphere alongside a tetrahedron indicating the desired analyzer polarizations as predicted by the optimization, a full-wave simulation, and as-measured; A set of 1024 uniformly sampled input polarization states on the Poincaré sphere can be operated on by an experimentally determined Mueller matrix (b) A matrix metagrating is integrated with an aspheric lens to image four diffraction orders onto four quadrants of a CMOS imaging sensor; Each copy of the image on each quadrant has been analyzed along a different polarization; A clearer side view of the ray trace; Reprinted with permission from ref. 106; copyright 2019, Science.
Figure 13.
Matrix gratings for arbitrary parallel polarization analysis and metagrating full-Stokes polarization camera. This is a figure. Schemes follow another format. If there are multiple panels, they should be listed as: (a) The grating is illuminated by light whose polarization is varied while recording the output polarization on a single diffraction order with a full-Stokes polarimeter; The polarization contrast of each order is shown; The polarizations analyzed by each order of the tetrahedron grating are shown on the Poincaré sphere alongside a tetrahedron indicating the desired analyzer polarizations as predicted by the optimization, a full-wave simulation, and as-measured; A set of 1024 uniformly sampled input polarization states on the Poincaré sphere can be operated on by an experimentally determined Mueller matrix (b) A matrix metagrating is integrated with an aspheric lens to image four diffraction orders onto four quadrants of a CMOS imaging sensor; Each copy of the image on each quadrant has been analyzed along a different polarization; A clearer side view of the ray trace; Reprinted with permission from ref. 106; copyright 2019, Science.
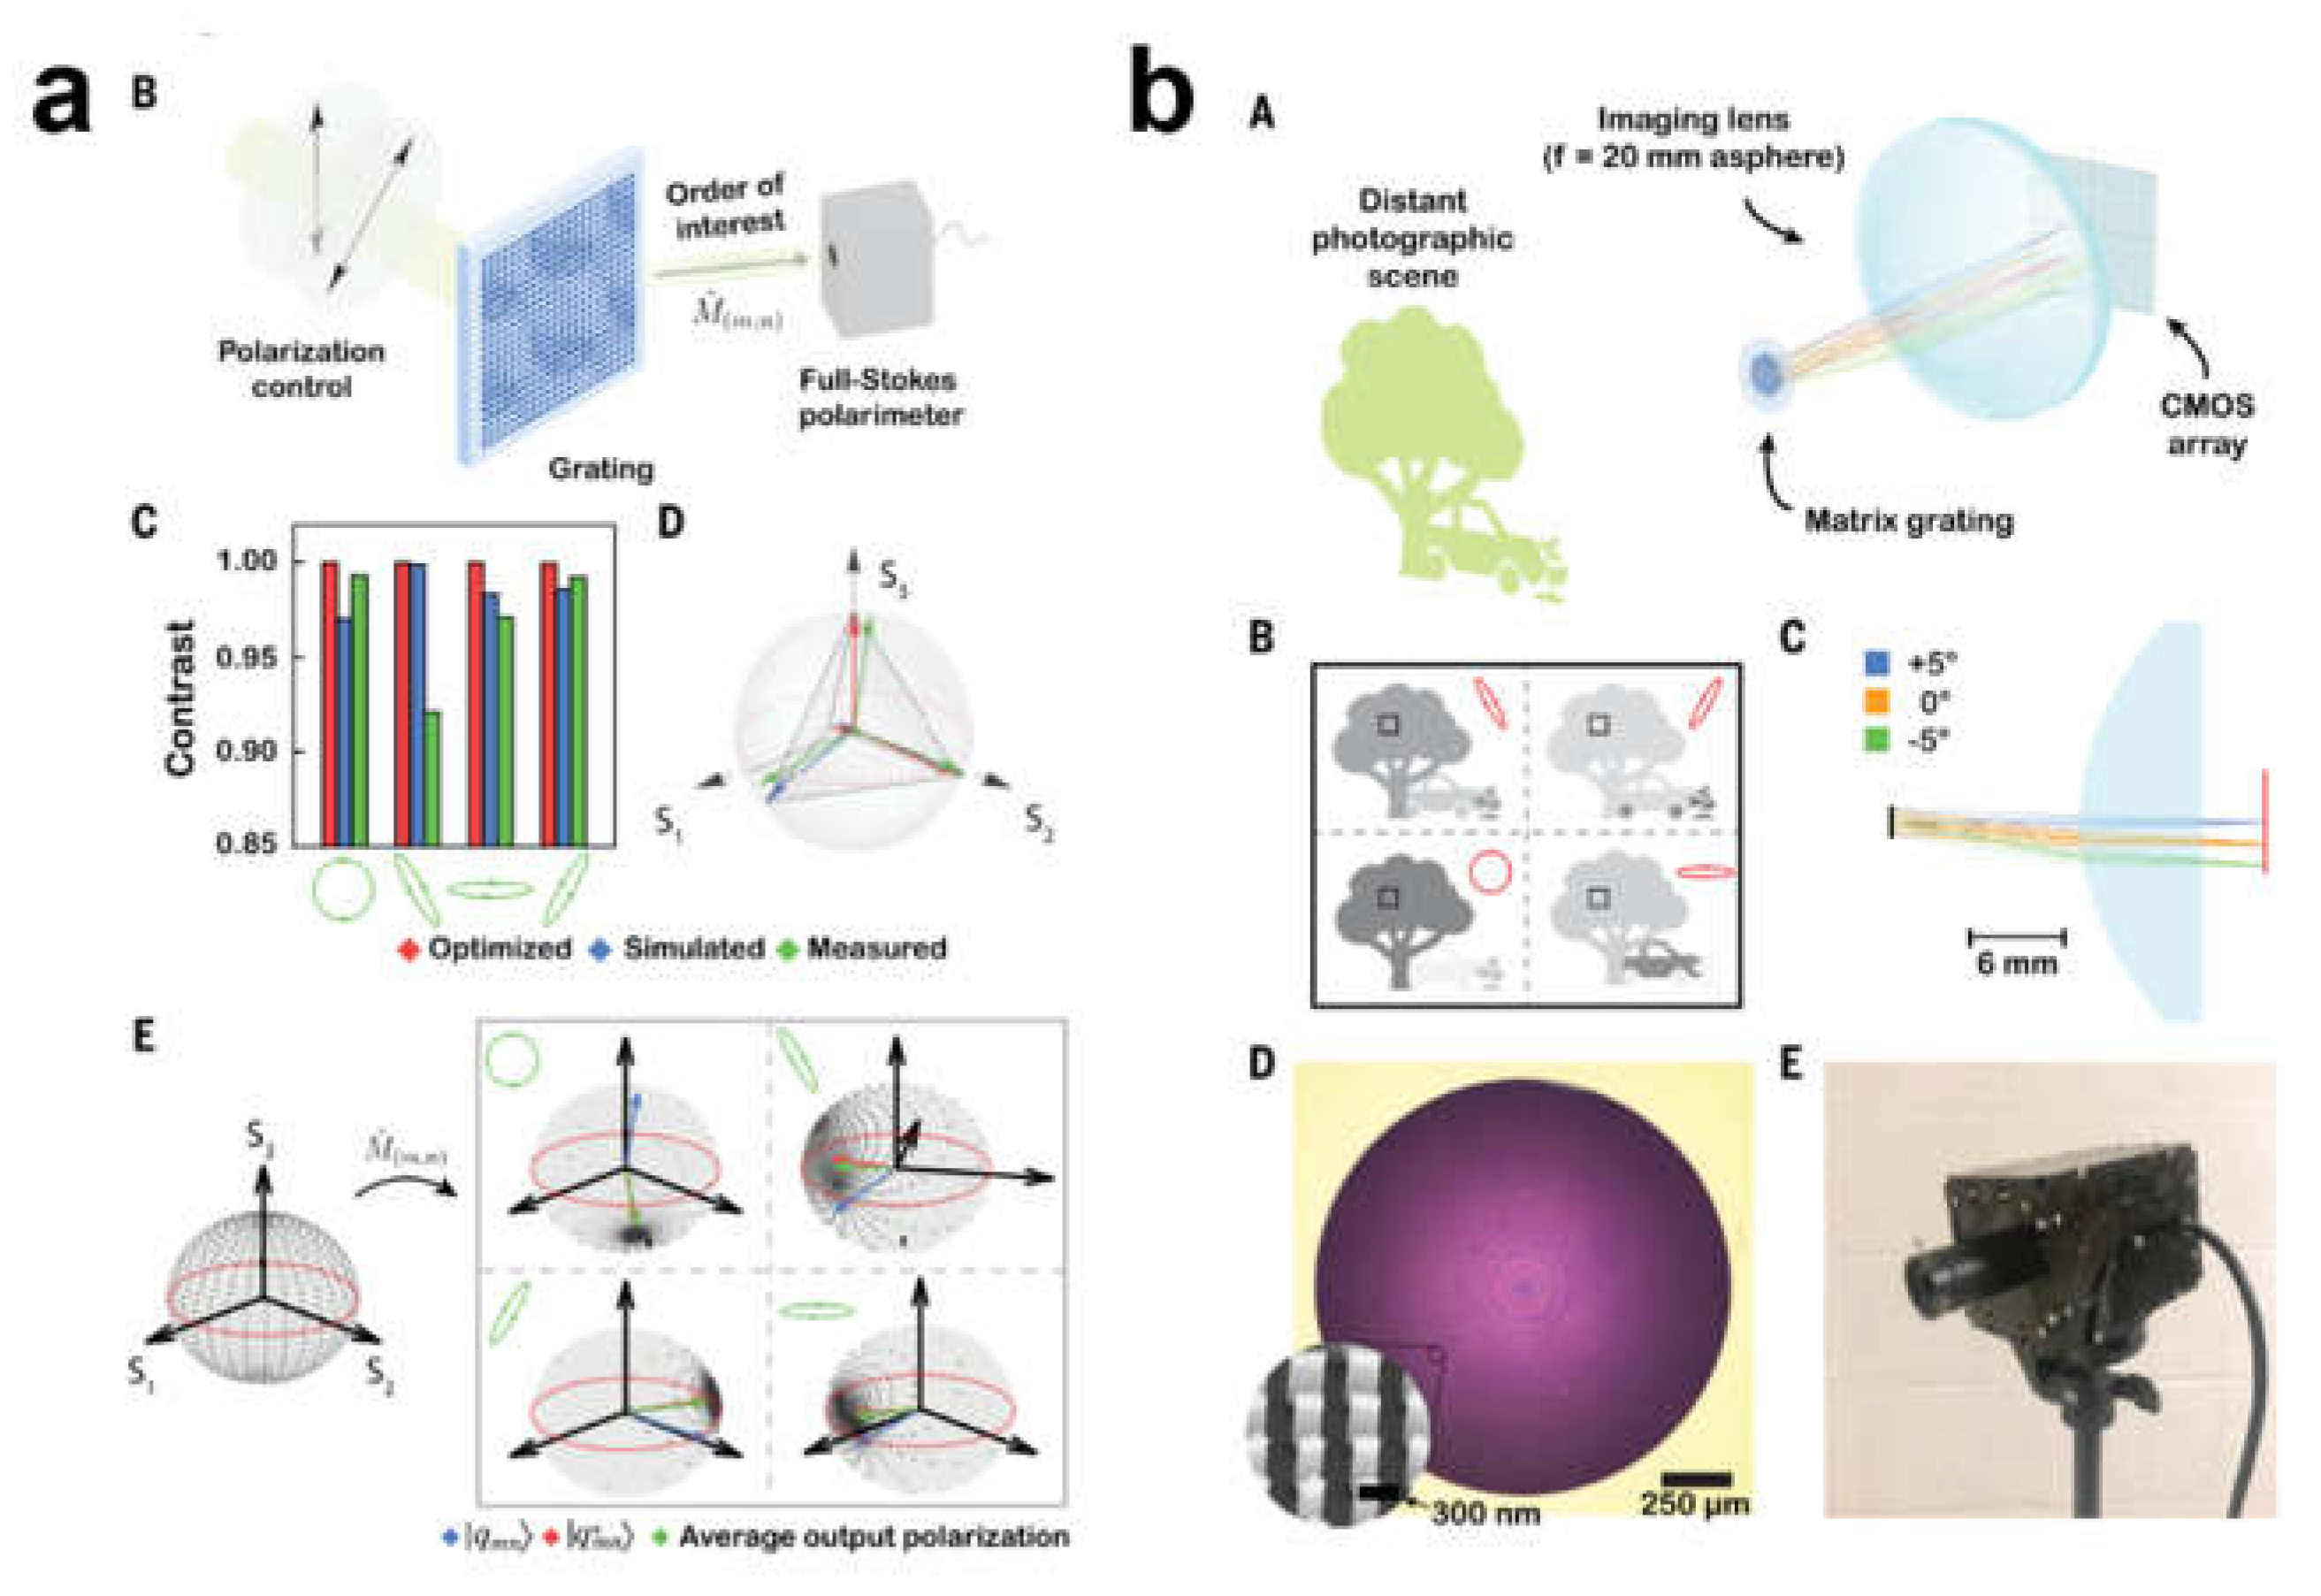
Figure 14.
Schemes of applications on polarizers and polarization spectroscopy, which includes optical display, molecular structural analysis, polarization imaging and polarization photodetectors.
Figure 14.
Schemes of applications on polarizers and polarization spectroscopy, which includes optical display, molecular structural analysis, polarization imaging and polarization photodetectors.
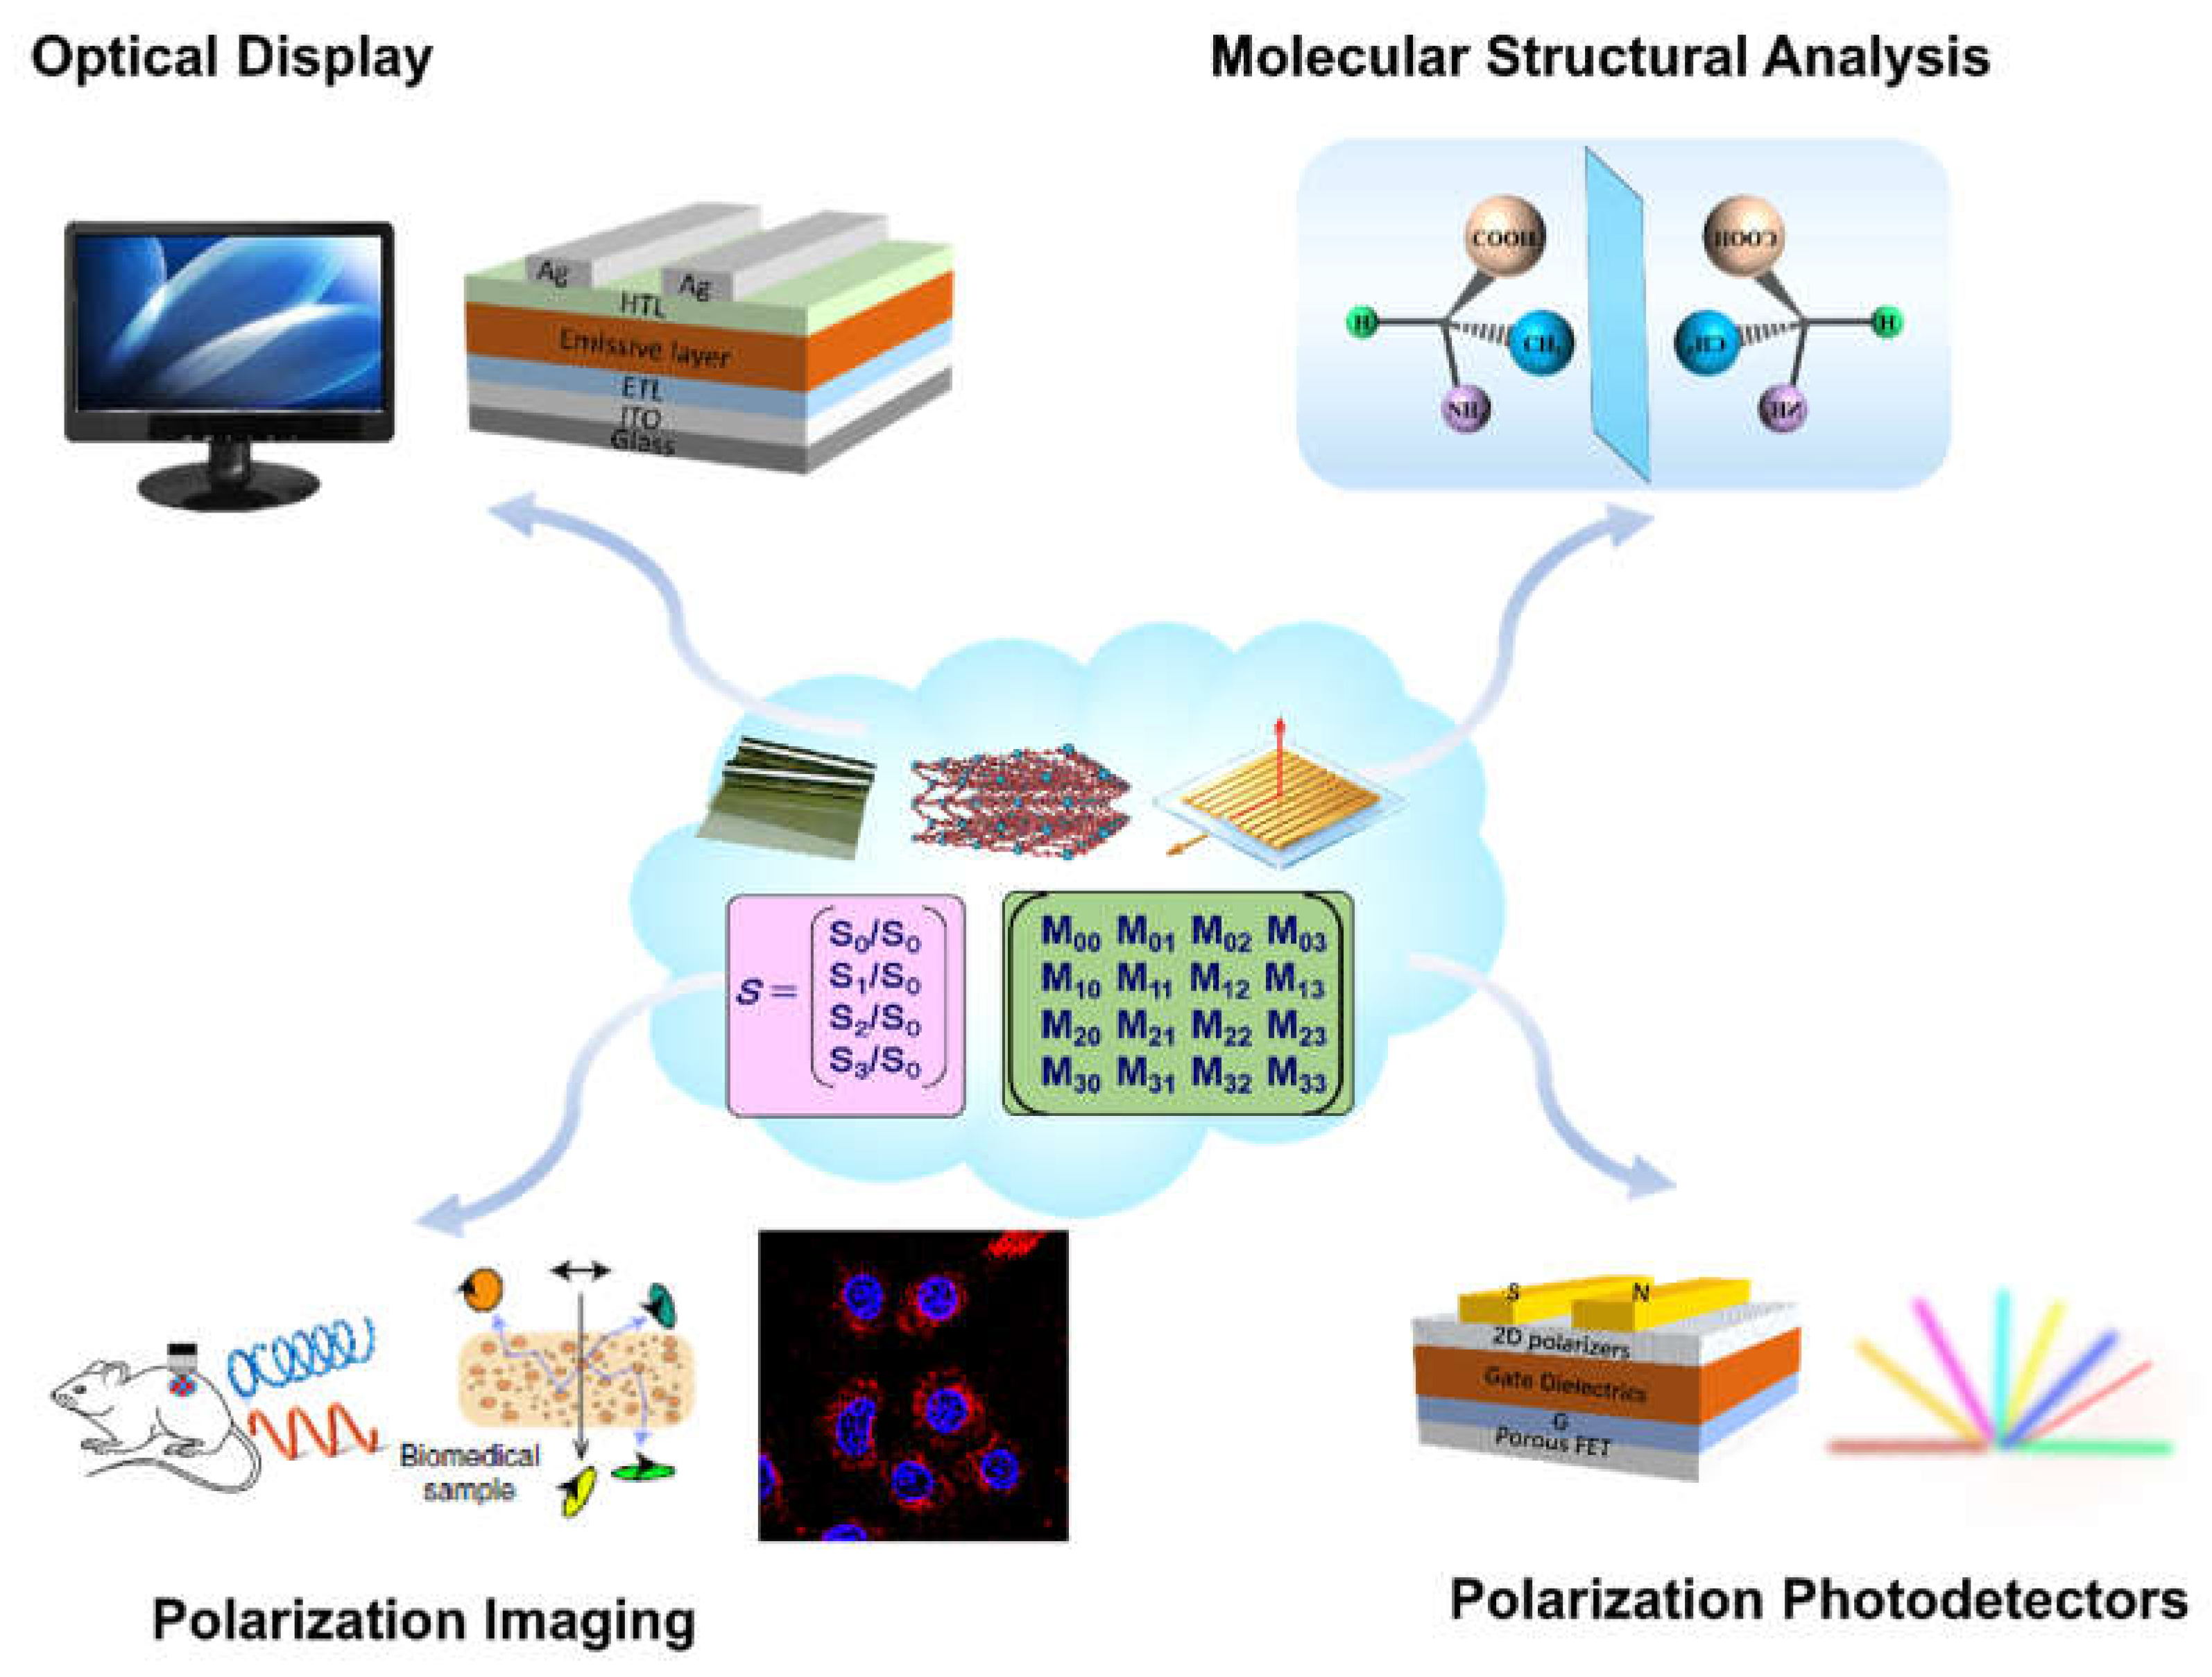
Figure 15.
The measured SE spectra of OLED devices and THz polarization sensing for qualitative identification. (a) The measured SE spectra and calculated deviations between of the PFN-Br film, grown on PET/ITO/PEDOT: PSS/F8:F8BT (symbols) and the corresponding fitted ones (lines) [72]; (b) Experimental results attached with different saccharides-PVA films: (a) LP, (b) PEA, and (c) PRA spectra. Polarization ellipses of the output THz waves with different saccharides-PVA films at (d) 0.75 THz and (e) 0.8 THz. Reprinted with permission from ref. [78]; copyright 2021, Elsevier Ltd.
Figure 15.
The measured SE spectra of OLED devices and THz polarization sensing for qualitative identification. (a) The measured SE spectra and calculated deviations between of the PFN-Br film, grown on PET/ITO/PEDOT: PSS/F8:F8BT (symbols) and the corresponding fitted ones (lines) [72]; (b) Experimental results attached with different saccharides-PVA films: (a) LP, (b) PEA, and (c) PRA spectra. Polarization ellipses of the output THz waves with different saccharides-PVA films at (d) 0.75 THz and (e) 0.8 THz. Reprinted with permission from ref. [78]; copyright 2021, Elsevier Ltd.
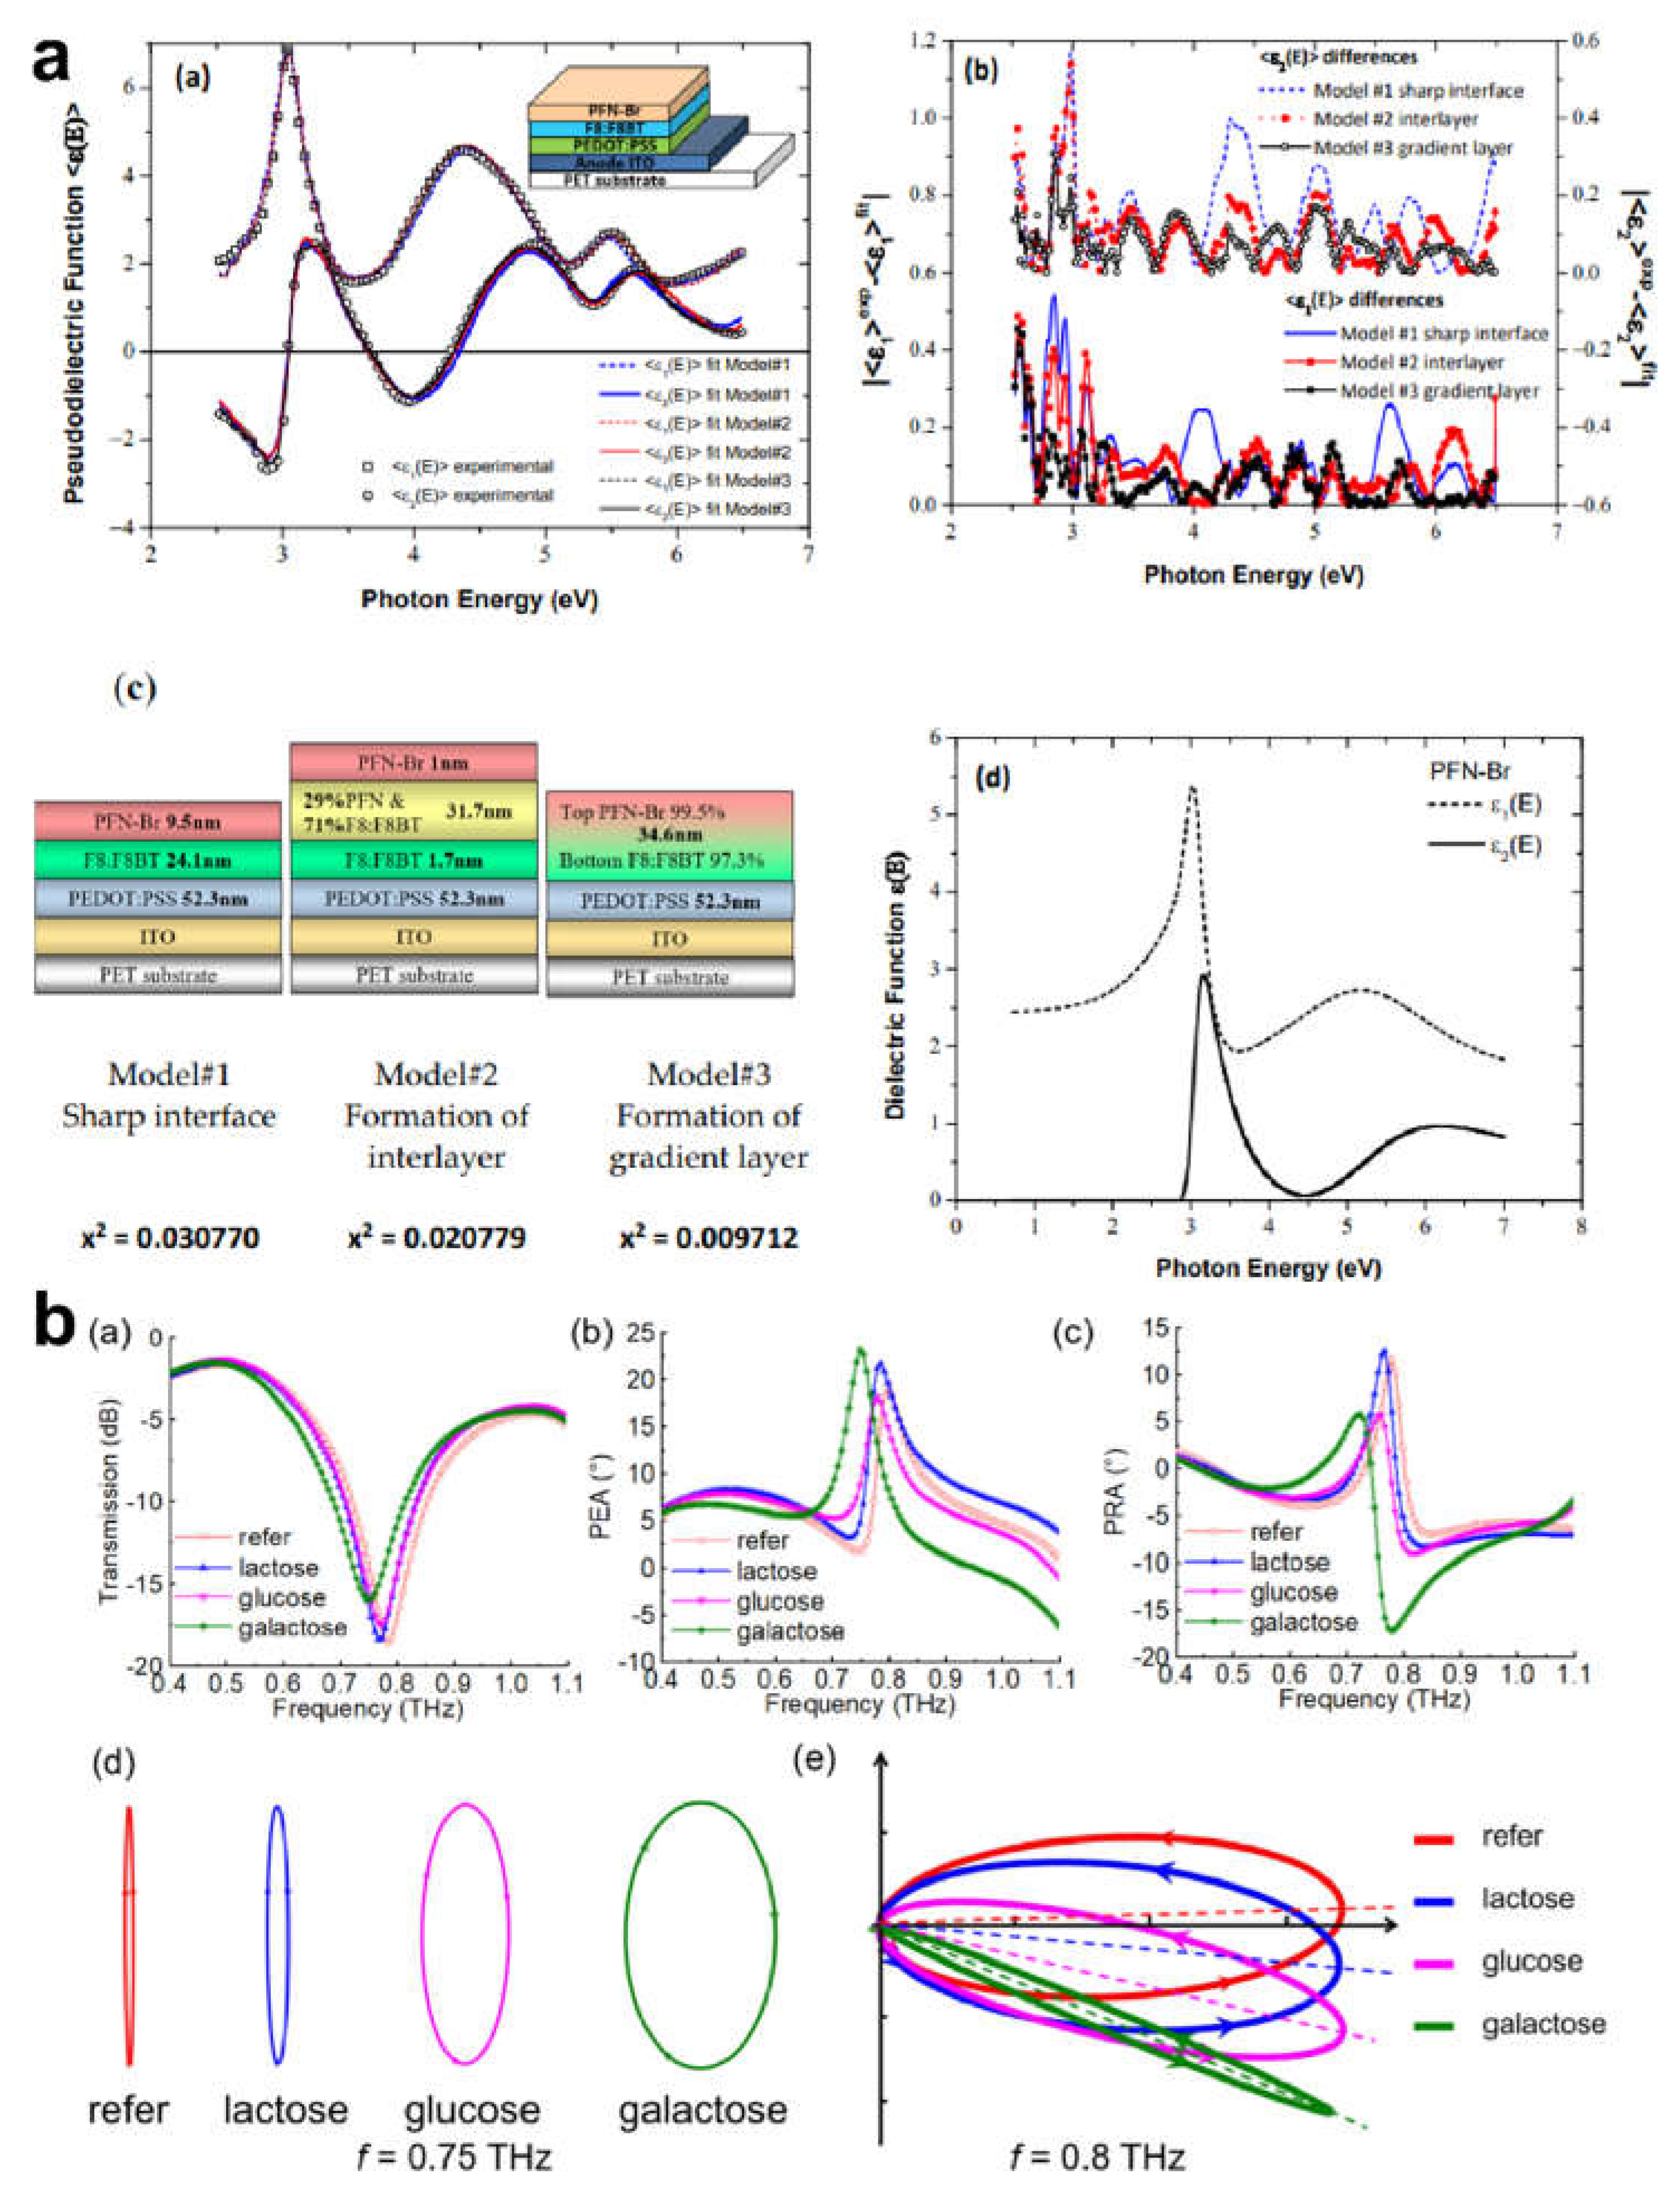
Figure 16.
The restored images by different methods in different scenes and Comparison between the linear retardance measured by using the proposed endoscopic setup with the linear retardance obtained by a Mueller free space microscope on two different zones of the muscular tissue of colon sample. If there are multiple panels, they should be listed as: (a) Images and restored images captured in the clear water or the water with low turbidity; Reprinted with permission from ref. [79]; copyright 2022, Elsevier Ltd.; (b) Linear retardance measured with the endoscopic setup and the experimental scheme of the Mueller polarimetric microscope working in backscattering configuration is shown. Reprinted with permission from ref. [87]; copyright 2016, SPIE.
Figure 16.
The restored images by different methods in different scenes and Comparison between the linear retardance measured by using the proposed endoscopic setup with the linear retardance obtained by a Mueller free space microscope on two different zones of the muscular tissue of colon sample. If there are multiple panels, they should be listed as: (a) Images and restored images captured in the clear water or the water with low turbidity; Reprinted with permission from ref. [79]; copyright 2022, Elsevier Ltd.; (b) Linear retardance measured with the endoscopic setup and the experimental scheme of the Mueller polarimetric microscope working in backscattering configuration is shown. Reprinted with permission from ref. [87]; copyright 2016, SPIE.
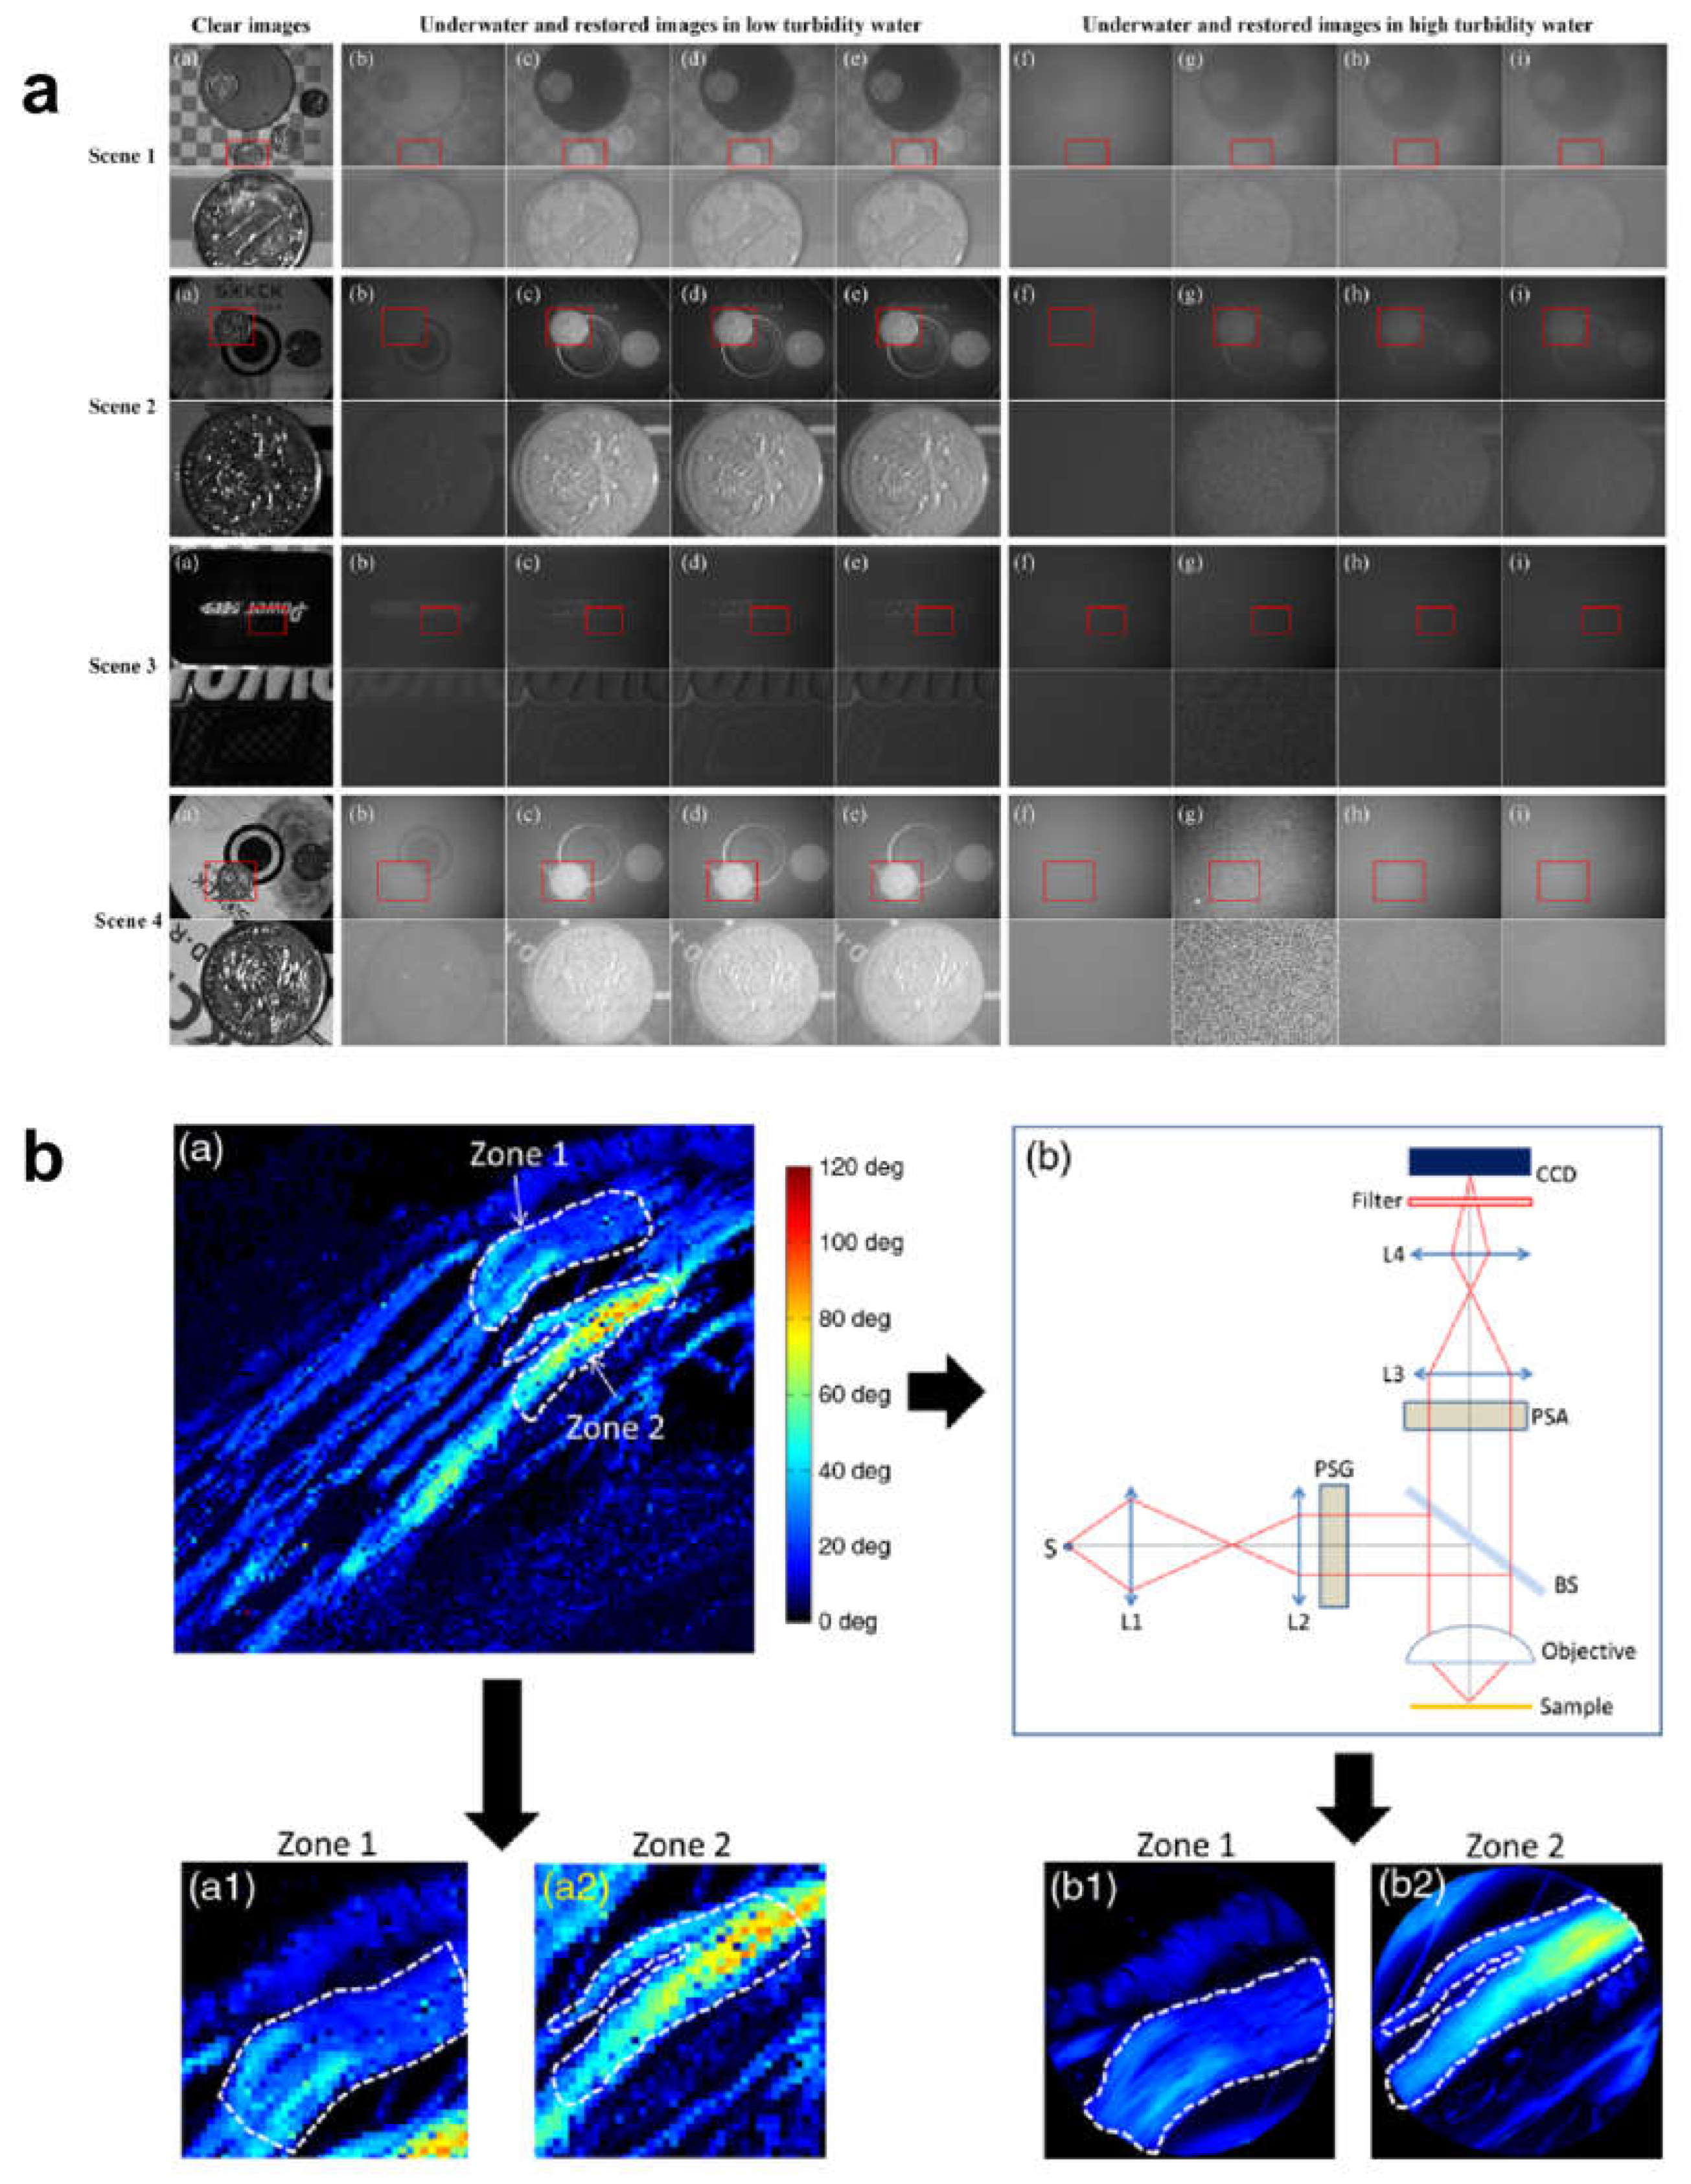
Figure 17.
Biomimetic real-time navigation using OCPM arrays. Reprinted with permission from ref. [89]; copyright 2024, Springer Nature.
Figure 17.
Biomimetic real-time navigation using OCPM arrays. Reprinted with permission from ref. [89]; copyright 2024, Springer Nature.
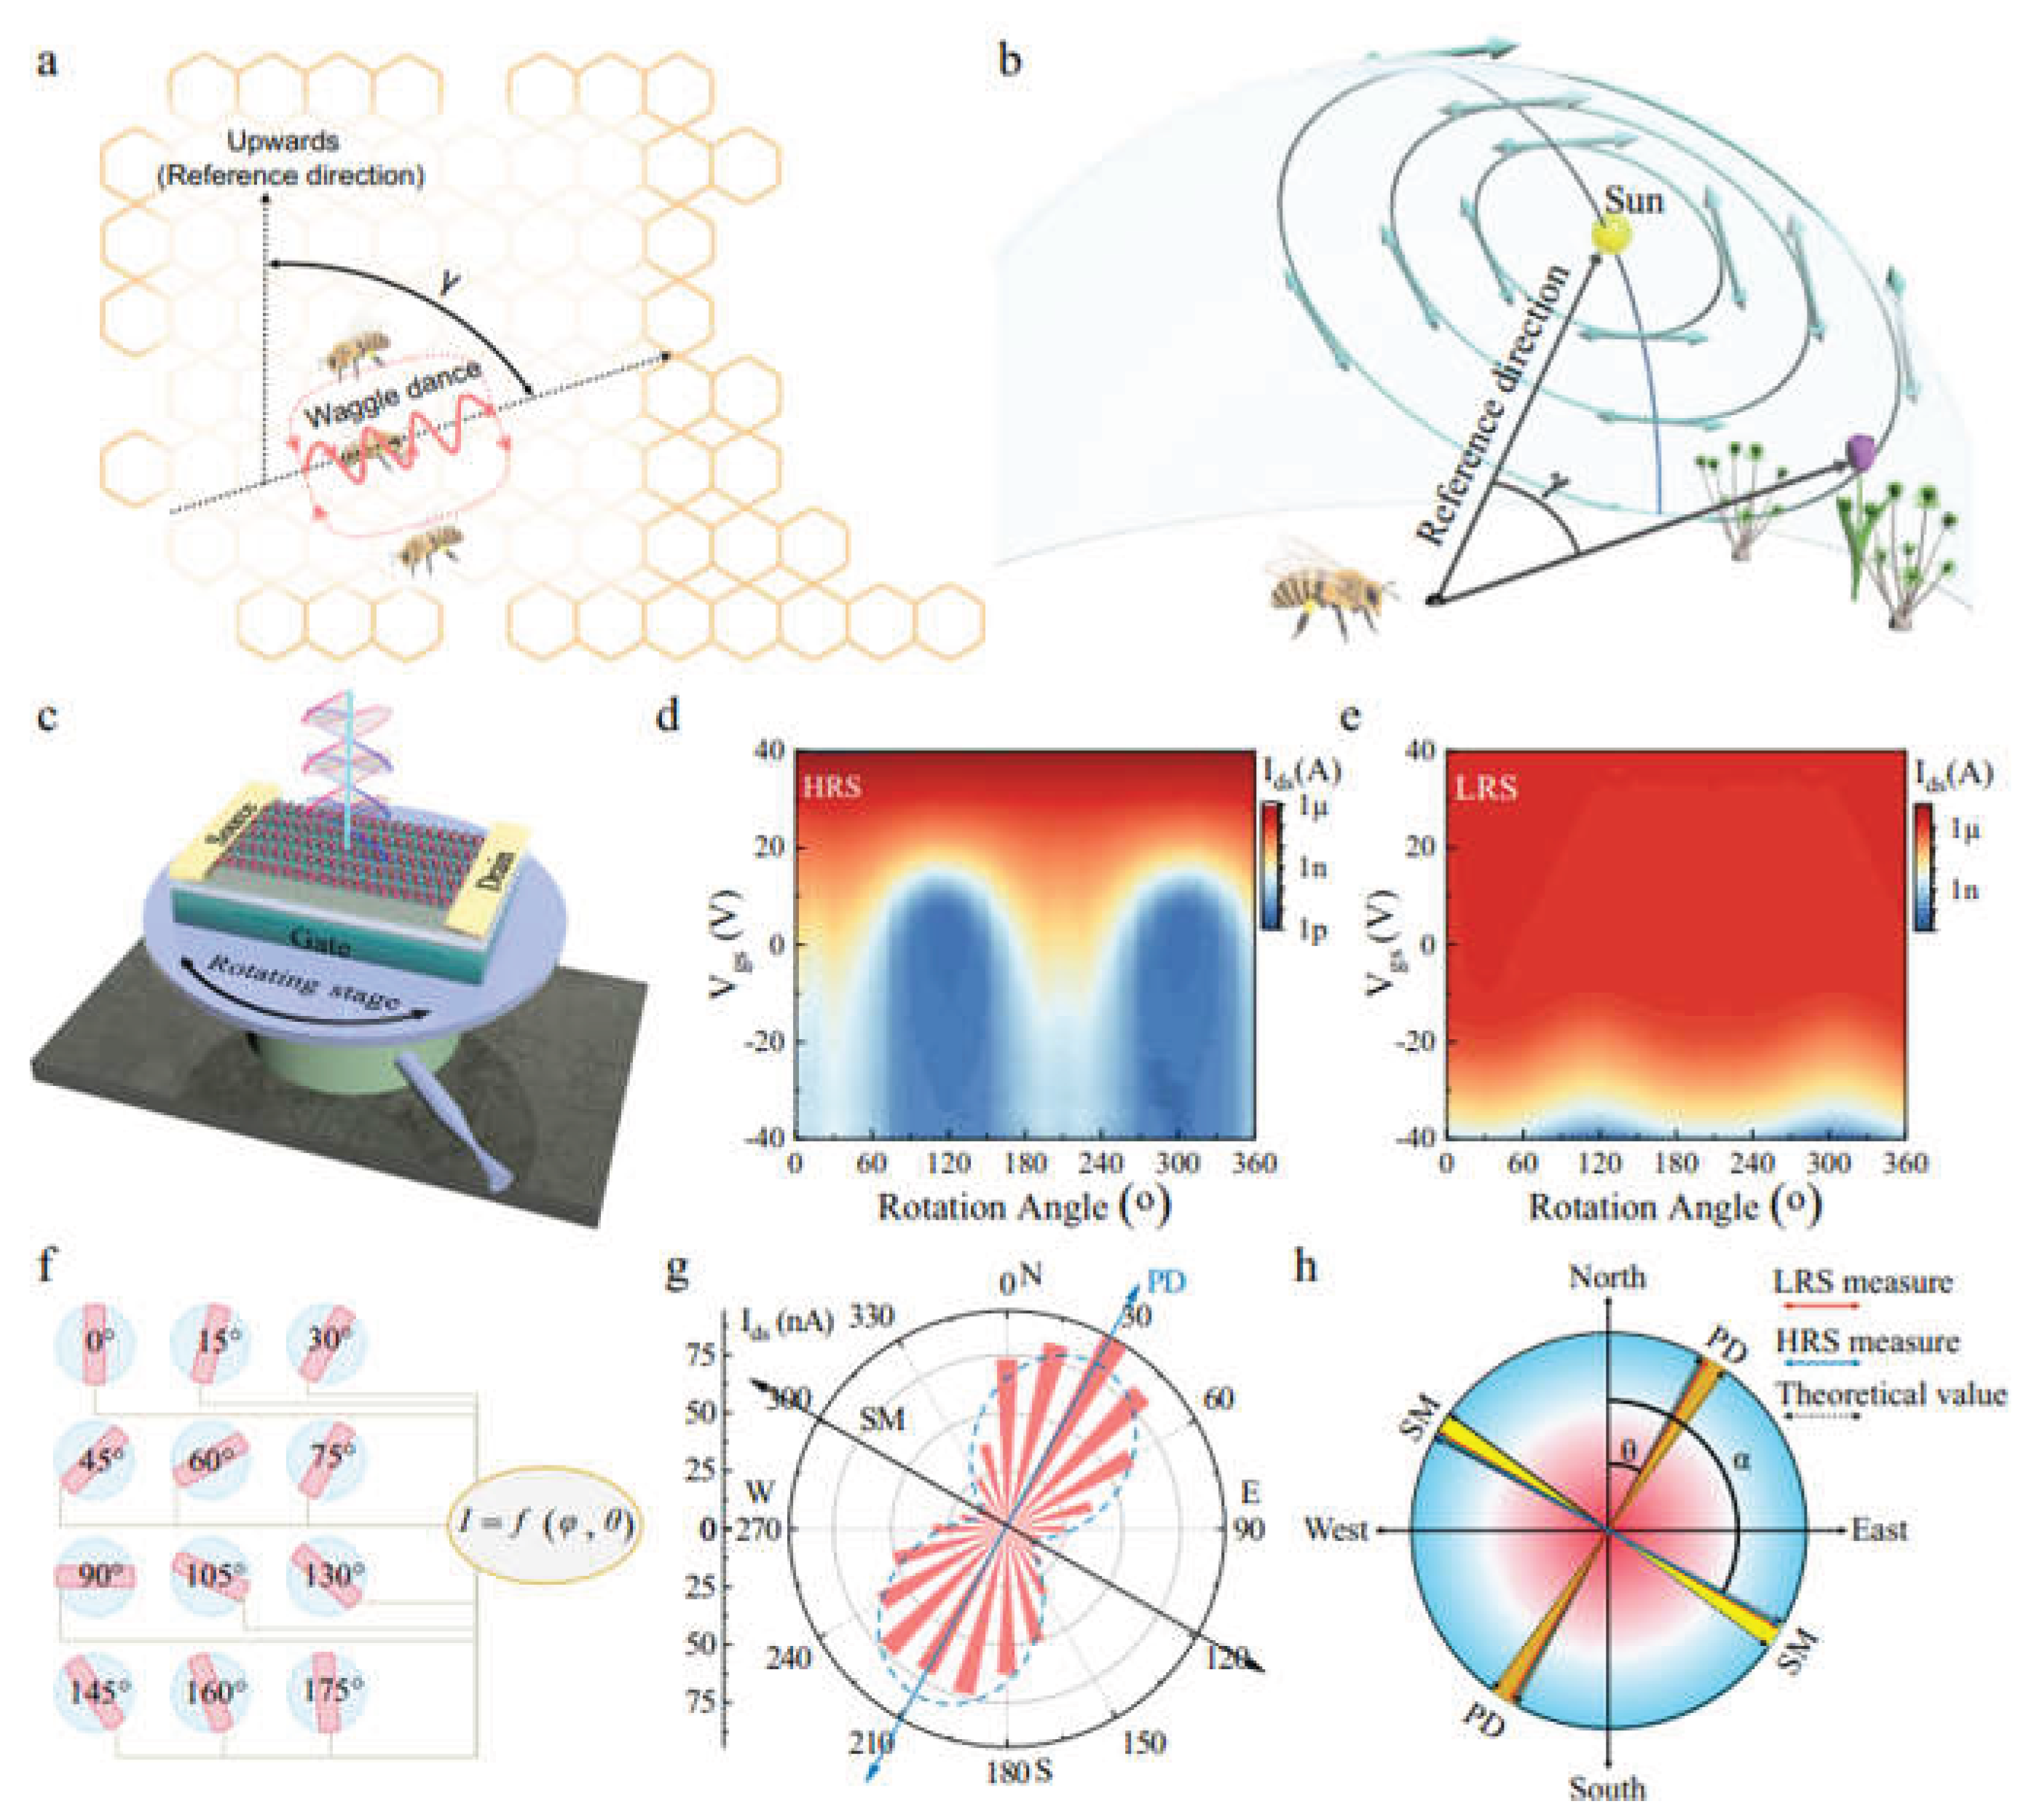
Disclaimer/Publisher’s Note: The statements, opinions and data contained in all publications are solely those of the individual author(s) and contributor(s) and not of MDPI and/or the editor(s). MDPI and/or the editor(s) disclaim responsibility for any injury to people or property resulting from any ideas, methods, instructions or products referred to in the content. |
© 2026 by the authors. Licensee MDPI, Basel, Switzerland. This article is an open access article distributed under the terms and conditions of the Creative Commons Attribution (CC BY) license (http://creativecommons.org/licenses/by/4.0/).
Copyright: This open access article is published under a Creative Commons CC BY 4.0 license, which permit the free download, distribution, and reuse, provided that the author and preprint are cited in any reuse.