

Submitted:
06 August 2026
Posted:
10 August 2026
You are already at the latest version
Abstract
Molten salt-based thermal energy storage (TES) systems are widely deployed for large-scale energy storage; however, they currently utilize only sensible heat, limiting their energy density and overall efficiency. The utilization of latent heat in molten salts has the potential to significantly increase the extractable energy, but its practical implementation remains largely unexplored due to challenges related to solidification control, thermal stresses, and structural integrity. Addressing this gap is essential for improving the performance and economic viability of TES systems in renewable energy applications. This work presents the first combined experimental and numerical study demonstrating the safe and controlled utilization of latent heat in a molten salt TES system at semi-industrial scale. A vertical shell-and-tube heat exchanger integrated into a salt tank was investigated experimentally, enabling controlled melting and solidification of solar salt under realistic operating conditions. High-resolution spatial and temporal measurements of temperature and heat flux were used to establish detailed energy balances and characterize the thermal response during phase change. In addition, a validated three-dimensional CFD model was developed and validated against the measured temperature histories to predict the corresponding crystallization behaviour and support system optimization and scale-up. The combined experimental–numerical analysis provides new insights into molten salt solidification. While the thermal response was validated experimentally, the spatial distribution and temporal evolution of the solid phase were inferred from the validated CFD simulations. It is shown that complete solidification can increase the thermal energy yield by approximately 10%. However, an optimal operating strategy is identified at about 60% solidification, corresponding to an energy storage capacity of approximately 1300 kJ/kg within a temperature range of 550°C to 200°C. Beyond this point, heat transfer is significantly reduced due to the formation of insulating solid layers, and thermal stresses may compromise structural integrity. These findings demonstrate the technical feasibility of controlled latent heat utilization in the investigated molten salt TES configuration and provide new insight into the mechanisms governing frozen-layer growth and discharge performance under high-temperature operating conditions.
Keywords:
molten salt
; latent heat
; phase change material
; salt crystallization
; thermal energy storage
; salt solidification and melting
; heat exchanger
1. Introduction
Global energy demand increased by 2.2% in 2025, surpassing the average growth rate over the past decade [1], which emphasizes the urgent need for clean, reliable, and dispatchable energy. This poses a significant challenge of our time: supplying the world with clean and stable energy [2]. However, the unpredictable nature of renewable energy, including wind and solar, poses inherent challenges to the stability of the power grid [3]. To address this, thermal energy storage (TES) systems provide a promising solution by decoupling energy generation from consumption [4], enabling flexible load management [5], and allowing electricity to be converted into heat and back at times of high demand [6]. Molten salt-based TES systems are among the most mature and widely deployed technologies for large-scale energy storage [7]. Their high operating temperatures, typically exceeding 500°C and in advanced concepts, targeting temperatures of up to 800°C [8], favourable thermophysical properties, and proven integration in concentrated solar power (CSP) plants [9] make them suitable for industrial-scale applications [10]. At such temperature levels, stored thermal energy can be directly utilized for applications such as saturated steam generation or feedwater preheating, significantly enhancing overall system efficiency [11]. Historically, these systems have focused primarily on sensible heat storage, which involves storing energy through temperature changes of the molten salt without inducing a phase change. Sensible heat storage is well understood, robust, and easy to implement using established heat exchanger designs, such as shell-and-tube and U-tube configurations [12]. This approach offers predictable operation, manageable pressure drops, and well-characterized thermal performance, which has contributed to the successful deployment of molten salt TES in several commercial CSP plants and industrial settings [13]. Combining molten salt TES with power-to-heat energy storage systems provides fast and flexible load control [14], significantly outperforming conventional coal-fired power plants [15]. Despite the widespread use of sensible heat systems, their energy density is inherently limited, and the full potential of the storage medium is not realized [16]. Latent heat storage in phase change materials (PCMs), including molten salts undergoing solid–liquid transitions, provides substantial advantages: it allows storing and releasing large amounts of energy at nearly constant temperature [17], increases the extractable thermal energy [18], improves system efficiency [19], reduces temperature swings [20], and enhances operational flexibility and environmental sustainability [21]. By exploiting latent heat, existing storage volumes can store more energy without enlarging the system footprint [22], and thermal management can be optimized to align with grid or process requirements [23]. These benefits of molten salt PCMs are particularly attractive for industrial applications where space, energy efficiency, low costs, and fast load control are critical [24]. Beyond high-temperature molten salt systems, numerous latent heat TES concepts employing alternative PCMs have been proposed for low- and medium-temperature applications. Recent developments include compact heat exchanger concepts based on pillow-plate heat exchangers, finned structures, and optimized internal geometries, where the overall storage performance is likewise governed by the interaction between heat exchanger topology, phase-change progression, and internal heat transfer [25]. In particular, recent analytical and CFD investigations of pillow-plate latent heat storage systems demonstrated that melting and solidification performance is controlled by the evolution of thermal resistance within the PCM, emphasizing the importance of exchanger-controlled heat transfer rather than solely the latent heat capacity of the storage material. These studies highlight that identifying the governing heat-transfer mechanisms is equally important as maximizing latent heat storage capacity. However, conventional PCM materials such as paraffins or polymers are typically limited to low and moderate temperature ranges, rendering them unsuitable for high-temperature applications above 500 °C [26]. In contrast, molten salts uniquely enable latent heat storage at these elevated temperatures, making them highly attractive for industrial-scale TES systems [27]. Despite this potential, the active utilization of latent heat in molten salt systems remains largely unexplored in practical applications. A major barrier is the lack of experimentally validated systems capable of stable and repeatable operation under realistic conditions. Most studies either circumvent the solidification process experimentally [28] or avoid it in numerical models [29] due to concerns over structural integrity, thermal stress, and controllability. Consequently, hybrid TES concepts combining sensible and latent heat remain largely conceptual or limited to small-scale laboratory experiments [30]. In addition, key engineering aspects such as pressure drop, manufacturability, and cost implications are often neglected, limiting the feasibility of latent heat TES for real-world deployment. This indicates that although latent heat storage is promising, more research is needed to create solutions for large-scale energy storage systems [31,32]. Addressing these gaps, this study presents a combined experimental and numerical investigation of a molten salt TES system designed to actively utilize latent heat under practical operating conditions (≥550°C). The system is based on a semi-industrial vertical U-tube shell-and-tube heat exchanger, reflecting designs already implemented in CSP plants [33]. This design ensures low pressure drop, high robustness, and straightforward manufacturability [34]. The selected geometry was chosen to reflect industrially relevant design principles and operating conditions. This enables investigation of latent heat utilization under conditions that are substantially closer to industrial practice than those typically reported in laboratory-scale studies. Solar salt is used as the storage medium surrounding the heat transfer tubes, while air flows inside the tubes to enable controlled charging and discharging, allowing both sensible and latent heat to be harvested in an operationally relevant manner. A key objective of this work is to quantify the additional energy that can be extracted per cycle through latent heat utilization compared to purely sensible heat operation. The experimental campaign represents the first documented attempt to safely melt and solidify molten salt in a semi-industrial test rig, combining electrical and compressed air heating. Comprehensive measurements of temperature distributions and heat fluxes were conducted under diverse and realistic boundary conditions, and precise energy balances were established. To investigate spatially resolved phase change phenomena beyond the capability of direct experimental diagnostics, a high-fidelity three-dimensional CFD model was developed to predict the solidification process. The model was extensively validated against the experimentally measured thermal response over a wide range of operating conditions and provides physically consistent predictions of crystallization behaviour and frozen-layer evolution. This combined experimental–numerical approach enables investigation of the governing mechanisms controlling latent heat utilization and supports the identification of configuration-specific operating conditions that balance heat transfer performance and latent heat recovery. These results demonstrate that latent heat in molten salt TES systems can be partially and safely exploited, providing several practical engineering advantages: higher energy yield from existing storage volumes [35], improved operational flexibility [36], and better alignment with energy demand profiles. While the test rig uses Alloy 600, findings indicate that more affordable alternatives, such as 316L stainless steel, can be employed without compromising performance, making latent heat TES practical for industrial settings. This work bridges the gap between theoretical concepts and deployable engineering solutions. By demonstrating controlled latent heat utilization in a semi-industrial molten salt TES system, validated by high-fidelity CFD simulations, the study offers a pathway to increase energy density, efficiency, and operational flexibility of existing and future storage systems, demonstrating the feasibility of practical latent heat utilization in real-world applications. It should be noted that the methodology developed in this work, particularly the reconstruction of the liquid fraction evolution from temperature measurements and the associated validation strategy, was developed and validated specifically for solar salt under the investigated operating conditions. Solar salt exhibits only a relatively small density difference between the liquid and solid phases, which limits volumetric changes during phase transition. Consequently, the quantitative findings and the demonstrated accuracy of the proposed methodology cannot be directly generalized to phase change materials exhibiting substantially larger density variations, different phase transition characteristics, or significantly different operating conditions. Extension of the methodology to such systems would require dedicated validation and assessment of density-related effects.
2. Materials and Methods
The materials used and the design of the semi-industrial test rig are briefly explained.
2.1. Materials
Solar salt, a mixture of 60 wt% sodium nitrate (NaNO3) and 40 wt% potassium nitrate (KNO3), is a widely utilized thermal storage medium in concentrated solar power (CSP) systems. Its efficacy is attributed to its favourable thermophysical properties, such as low melting point, high heat capacity, and thermal stability. While it is a prevalent choice, its performance is constrained at temperatures exceeding 600 °C due to thermal degradation [37]. This salt is also inexpensive and readily available [19]. The low melting point of 222°C makes it easy to work at the phase change point and gain experience with latent heat and salt crystallization [38]. The solar salt used was prepared in-house, and its melting point was measured experimentally. When lower temperature levels are desired, a switch to different salts [39,40] is also feasible. In instances where reduced melting points are desired, the incorporation of pure salts has been demonstrated to result in a substantial reduction in melting points without compromising the energy storage capacity [41]. Adding nanoparticles could potentially further increase the heat storage capacity [42], thermal conductivity [43] and performance [44]. Previous research confirms that choosing the right material is essential for components in contact with liquid salt. Earlier studies have shown that Ni-alloys with at least 15% chromium are most effective in solar salt applications [45]. Therefore, the salt tank was constructed using the nickel-based Alloy 600 (NiCr15Fe; 2.4816). After more than 200 thermal load cycles and roughly 2400 hours of operation, no signs of material degradation were observed. The phase change temperature was repeatedly measured (at least 150 times) and remained constant, indicating stable thermophysical properties of the salt. In addition, the experimental discharge curves were found to be highly reproducible, confirming the absence of performance degradation of the salt over time. No indications of corrosion or thermo-mechanical fatigue were detected in the storage tank. These results demonstrate the suitability of solar salt as a stable and reliable phase change material under the investigated operating conditions. It is also possible to build the salt tank from less alloyed steel, which can lower costs [46]. Alloy 600 was chosen as a reliable material for all types of salts [47].
2.2. System Description and Test Rig Design
As shown in the test rig flow diagram in Figure 1, the test rig consists of the core element (salt tank; Inner dimensions: 400mm x Ø82,7 mm) in which the salt is melted and heated using a heating element. The salt tank was filled with a total of 2009 g of solar salt. Compressed air is used as the heat transfer medium on the test rig to simulate steam or supercritical CO2 for industrial applications [48]. The test rig is constructed in the form of a vertical U-tube shell and tube heat exchanger, featuring a single U-tube (341mm height; 50mm pipe spacing). This design has been proven on an industrial scale [49] and performs slightly better than coil types [50]. A vertical alignment was chosen for practical reasons; it is easier to refill the salt tank, and the salt tank can be reopened using the flange. In the heat exchanger, the compressed air is contained within the pipe, while the salt is located around the pipe. A total length of 270mm air pipe covers the salt; the rest of the pipe is in the gas chamber. The upscaling of the experimental data is also favourable with a U-tube heat exchanger [51]. The U-tube was designed to achieve high Reynolds numbers in the turbulence range of Re > 10,000 on the air side. Previous work has investigated low Reynolds numbers, where the arrangement of salt and air is reversed [52]. Shell and tube heat exchangers are the most cost-effective design in concentrated solar power applications [53]. The test rig is connected to the institute's compressed air line on the air side, with a maximum available air pressure of 8 bar absolute. To determine the flow rate and pressure in the air line, a volume flow sensor and a pressure sensor were installed in the cold air line before the tube furnace. The cold compressed air flows through a tube furnace, which can regulate the air to any desired temperature (with a maximum temperature of the tube furnace of 1200°C). The (tempered) compressed air flows into the U-tube heat exchanger, whereby energy in the form of heat is transferred from the salt to the compressed air during the extraction of thermal energy. Thermal loading can also work in reverse, transferring energy from the compressed air to the salt. At the outlet of the U-tube heat exchanger, a temperature-resistant valve is located, allowing the back pressure to be adjusted to achieve a maximum absolute pressure of 8 bar absolute in the U-pipe heat exchanger. A pressure sensor monitors the gas pressure in the gas chamber above the salt. Suppose a specified gas pressure or a specified salt temperature in the system is exceeded. In that case, the heating element automatically switches off, ensuring operational safety, and a pressure relief valve can evacuate the gas chamber in the event of an emergency. When designing the test rig, the heating surfaces were dimensioned following the VDI Heat Atlas [54]. The true-to-scale structure of the salt tank, including the measurement points, is shown in Figure 2. A thermocouple is located at the inlet and outlet of the U-tube heat exchanger to measure the air temperatures (Tin and Tout). Twenty additional thermocouples measure the salt temperatures radially and axially within the salt tank (Ti,salt). The green lines represent the thermocouples, which measure the temperature at the inner shell of the salt tank. The blue lines represent the thermocouples that measure the salt temperature at the very inside of the salt tank. The salt temperatures are measured by placing a thermocouple in a welded-on cladding tube to ensure the imperviousness of the salt tank. Two thermocouples (yellow) are located directly above the U-tube in a welded-on cladding tube to determine the temperature in the gas chamber above the salt level. The heating element (red) is located within a casing tube that is welded to the salt tank. Above the heating element, a welded-on cylinder is located, which is connected to the gas chamber above the salt. This design avoids the formation of high-pressure zones or liquid salt pockets during melting by ensuring the liquid salt can always flow upward into the gas chamber. The air pipes are installed from below, as only in this construction can the flange be disassembled again when cold (due to frozen salt). This design is also advantageous for crystallization. Suppose thermal energy is extracted by compressed air through the U-tube; the highest temperature gradient will be at the bottom of the U-tube (inlet and outlet), as the warm salt circulates upward due to natural convection. Especially, the inlet section will have the highest temperature gradients; therefore, the salt crystallizes from the bottom to the top, and thus, no areas of high pressure can occur during crystallization. A dotted orange line indicates the liquid salt level; the filling level changes minimally during operation due to the thermal expansion of the solar salt. The filling level of the liquid salt is approximately 1cm below the flange sealing. All data is recorded using LabVIEW.
3. Experimental
The stationary tests provide the heat losses and the boundary conditions for subsequent numerical CFD investigations. The transient experiments provide insight into the system's performance, with a focus on the phase change of the solar salt.
3.1. Stationary Testing
The salt tank was insulated in three layers to reduce heat loss to an acceptable minimum, as shown in Figure 3. In the first layer, the central cylinder was roughly sheathed. In the following two layers, the insulating material was also wrapped around the flange. The fully insulated cylinder was operated either with the heating element or with hot compressed air until a stationary operating state was reached, allowing for the measurement of heat losses. The maximum salt temperature of T = 550 °C was never exceeded because of the thermal stability of the solar salt [55]. The heat loss in stationary operation using hot air was calculated via Eq. (1), where is the heat loss, is the mass flow of air, and are the air temperatures, measured at the inlet and outlet, and is the heat capacity of air at the median temperature.
The heat loss in stationary operation using the heating element was measured using the data recorded in LabVIEW. Several stationary tests were conducted within the relevant salt temperature range of 220°C to 550°C. When the salt tank temperature is optimized, annual costs of an extensive system can be significantly reduced [56]. During the stationary tests, an infrared camera and many thermocouples were used to determine the maximum wall temperature of the insulation. With the now-known values of the salt temperature, wall temperature, heat flux, and geometry, the heat losses were calculated with high accuracy. The thermal conductivity of the entire storage tank was now determined using the known values of heat flux, temperature, and geometry. It was assumed that the salt tank was a cylinder. The heat loss of a cylindrical system is calculated using Equation (2), where denotes the heat loss, L represents the height of the cylinder, and k is the thermal conductivity of the insulation material. As illustrated in Figure 2, corresponds to the radius of the outer wall of the salt tank (i.e., the metallic shell), while denotes the outer radius of the thermal insulation. The temperature refers to the temperature of the metallic shell at radius , which is assumed to be equal to the salt temperature at this location. In contrast, represents the temperature at the outer boundary of the insulation, measured at radius . If the formula is converted to the desired value of thermal conductivity, the result is Eq. (3).
The values determined for the thermal conductivity of the entire salt tank, as a function of the salt temperature, will be used as boundary conditions for the CFD model to recreate the heat losses and are also relevant in Section 3.3 Energy Balance. The results of the thermal conductivity over the hull temperature (assuming the salt temperature equals the metal hull temperature) are shown in Figure 4. All data necessary for creating the figure are included in the supplementary document. Stationary experiments were conducted in either compressed air mode (blue dots) or with the heating element in operation (red squares). The standard deviation of the stationary tests with air is slightly higher (4-5% of the measured value) than the standard deviation of the tests with the heating element (2-3%). This can be explained by the greater number of measurement readings in the air tests than in those with the heating element. In the stationary tests with the heating element, there are only two measurement variables, namely voltage and current. In the tests with compressed air, there are four measurement variables: pressure, volume flow, and the inlet and outlet air temperatures of the U-tube. The experimentally determined thermal conductivity of the insulation is in good agreement with values reported in the literature [57]. The values of the thermal conductivity of the entire salt tank were also compared with the manufacturer's values for the thermal conductivity of the insulating fleece (green triangles) [58]. It can be seen that the thermal conductivity of the whole system is approximately 3 times higher than the manufacturer's values. This corresponds well with the experience of other systems, where compression on the insulation has been observed [59,60,61,62]. As the insulation is often compressed during installation, its insulating capacity decreases [63]. In practice, the insulation is built up in several layers [64]. The insulation structure always creates compacted regions and small air spaces [65]. This can be counteracted in practice by increasing the insulation thickness [66], as shown in Figure 3. Three layers of thermal insulation were applied here, resulting in a total insulation thickness of approximately 17 cm. In an industrial setting, optimising insulation thickness and electric heating can reduce power loss by an additional 10% and operating costs by 15%, further reducing heat loss [67].
3.2. Transient Testing (Storage Tests)
The primary objective of the transient experiments was to characterize the thermal response associated with salt solidification and to identify the conditions governing the evolution of the solid salt layer during discharge. To this end, the storage tank was instrumented with 20 thermocouples distributed throughout the salt domain, enabling spatially and temporally resolved monitoring of the phase-change process. The salt tank was thermally charged using an internal heating element until the salt reached an average temperature of approximately 550°C. The heating element was then switched off and compressed air was introduced into the U-tube heat exchanger, initiating the thermal discharge process. During discharge, heat extraction progressively cooled the molten salt until crystallization occurred and a solid salt layer developed around the heat exchanger surfaces. The experiments were continued until complete solidification was achieved, corresponding to average salt temperatures below approximately 220°C. Figure 5 summarizes the measured thermal response during a representative discharge experiment. The transient inlet and outlet air temperatures shown in Figure 5a provide information on the heat extraction process, while the heat flux presented in Figure 5b quantifies the thermal power transferred from the storage medium (salt) to the air stream. A steady decrease of the heat flux over time can be observed when the storage tank is discharged, as the temperature spread from salt to air becomes increasingly smaller throughout the experiment. The heat flux per tube area is plotted on the right-hand ordinate. This is calculated by dividing the heat flux in watts by the outer surface area of the U-pipe covered by salt, which amounts to 0.0348 m². The order of magnitude of the heat flux density is in agreement with previous results from molten salt storage systems [68]. More importantly, the temperature measurements within the salt domain shown in Figure 5c provide direct experimental evidence of the phase-change process. As the salt approaches its crystallization temperature, characteristic temperature plateaus and reduced temperature gradients are observed, indicating latent heat release and the progressive formation of a solid salt layer. These thermal signatures form the experimental basis for interpreting the crystallization behaviour and for validating the corresponding CFD analysis. The temperature measurements provide detailed information on the thermal evolution within the instrumented region of the salt domain (Ti,salt - Figure 2). Due to geometrical constraints of the flange in the experimental setup, no thermocouples could be installed in the uppermost liquid region of the storage tank. Consequently, the local thermal conditions and potential crystallization behaviour in this region cannot be observed directly. Additional support for the predictive capability of the CFD model in this region is provided in the Supplementary Material (Figure S20), where the transient gas temperatures above the salt domain are compared with the corresponding experimental measurements. The excellent agreement between CFD and experiment demonstrates that the model accurately captures the thermal response in the upper part of the storage tank, thereby providing increased confidence in the predicted temperature field and the inferred crystallization behaviour in this otherwise inaccessible region. The corresponding solidification patterns are therefore inferred from the validated CFD model and should be interpreted as model-based predictions supported by experimentally measured thermal response data. The standard deviation of the experimental data across all transient tests can be derived from section 3.1 Stationary testing (). The initial salt temperature was consistently maintained at 550°C for all experiments in this study. The heat flux of air in the U-pipe, calculated using Equation (1), and the heat flux density are shown for several experiments in Figure 6a. The lines are sorted in descending order by inlet air temperature. The inlet air temperature depicted in the diagram pertains to the temperature attained after approximately 30 minutes. The mass flow rate of the air was 0.0052 kg/s in all experiments shown in Figure 6, with a maximum back pressure of 8 bar absolute, corresponding to the minimum air mass flow. The blue line with an air inlet temperature of 230°C was specified as a reference. In this reference case, the temperature did not fall below the freezing point of the salt; only the sensible heat of the heat storage was transferred to the air. The inlet temperature specified in the legend represents the constant temperature set after the approximately 30-minute run-in phase, as shown in Figure 5. The thermal energy quantity shown in the legend represents the thermal energy of the air. This is calculated by integrating the heat flow over time, as shown in Eq. (4), where is the mass flow of air in the U-pipe, cp is the heat capacity of air at the median temperature, and Tin and Tout are the inlet and outlet air temperatures of the U-pipe heat exchanger. The absolute value is applied to ensure the thermal energy during discharge is positive. The integration was performed using the trapezoidal method, with a time step of 1 second. The average salt temperature at the end of the experiment is plotted in the graph near the end of each curve.
If the air mass flow remains constant in the experiments and the inlet temperature varies, this has no significant effect on the heat flow. When the phase change occurs (around 45 minutes), no decrease in heat flux is observed. This can be attributed to the release of latent heat. The measurement values of the average salt temperature are shown in Figure 6b. The average salt temperature is the arithmetic mean of the 20 temperature sensors that determine the axial and radial salt temperature, Eq. (6). The average salt temperature drops relatively steadily until around the 45-minute mark, after which the gradient decreases. This is due to the start of the crystallization process. The release of latent heat in the salt creates a “plateau” in the salt temperature around the 60-minute mark. After the salt has crystallized and the latent heat has been released, the salt temperature drops again more rapidly. For comparison with the blue reference curve (no salt crystallization), this plateau is missing; no latent heat was released in this specific experiment. A hysteresis of the average salt temperature is included in the supplementary document to provide a better understanding of the test procedure and the salt temperature during the experiment. The temperature difference over the test duration is illustrated in Figure 6c. In the experiments, the temperature difference always refers to the average temperature difference between the air and the salt. The mean air temperature was calculated as the mean value of the inlet and outlet temperature, Eq.(5). The temperature difference is then calculated from the average values of salt and air temperature, Eq. (7), and is shown on the ordinate. With this temperature difference related to the mean temperature values of air and salt, it is easy to estimate how much of a temperature rise the air experiences during the experiment. When the crystallization temperature of the salt is reached, a plateau or a slight increase in the temperature difference is observed, especially in the experiments with lower inlet air temperature. This is because the average salt temperature changes only slightly due to crystallization and the release of latent heat in the salt. To provide a more detailed physical interpretation of the observed temperature profiles, the thermal discharge process can be divided into distinct stages governed by different heat transfer mechanisms. Initially, heat transfer is dominated by sensible cooling of the liquid salt, supported by natural convection, resulting in a continuous decrease in salt temperature and heat flux. As the salt approaches the phase-change temperature (222°C), the onset of crystallization leads to the release of latent heat, which manifests as a characteristic temperature plateau in the salt temperature and a stabilization of the heat flux. During this phase, the balance between latent heat release and heat extraction governs the thermal response. As solidification progresses, a solid salt layer forms around the heat exchanger surfaces, suppressing convective motion and shifting the dominant heat transfer mechanism toward conduction. This mechanism becomes dominant once the frozen salt layer reaches a thickness of approximately 3–4 mm, as predicted by the CFD model, resulting in a progressive reduction in heat flux during continued heat extraction. The influence of operating conditions is evident from the variation in inlet temperature and air mass flow rate (Figure 6 and Figure 7). While the timing and intensity of the individual stages vary, the underlying thermal behaviour remains consistent across all investigated cases, confirming the robustness of the observed phase-change dynamics under different thermal and pneumatic conditions. Additional transient experimental data are provided in the Supplementary Material (Figure S11 and Table S4). To explicitly highlight the utilization of latent heat in the thermal discharge process, the experimental procedure was designed to allow the salt to fully solidify. As the salt reaches its phase-change temperature (≈222 °C), the onset of crystallization leads to the release of latent heat, which is directly transferred to the air stream. This manifests as a characteristic plateau in the salt temperature and a stabilization of the heat flux, effectively prolonging and sustaining the energy output beyond what is achievable through sensible heat alone. By controlling the inlet air temperature and mass flow rate, it is possible to regulate the rate of latent heat extraction and optimize the balance between heat flux and total energy yield. The cumulative energy release over time for cases with and without phase change is presented in the Supplementary Information (Figure S7), providing a clear quantitative illustration of the latent heat contribution to the overall energy storage and discharge behaviour.
Figure 7 illustrates the same scenario as in Figure 6, except that the air mass flow is variable and the inlet air temperature is held constant. The tube furnace was switched off during the experiments in Figure 7. The air was, nevertheless, slightly preheated, as the pipe sections had heated up before entering the salt tank due to heat conduction. The air inlet temperature for all experiments in Figure 7 was 85°C. The curves are sorted in ascending order by air mass flow. The calculated pressure drop is 3800 Pa for the maximum air mass flow rate of 0.0091 kg/s and 1500 Pa for the minimum air mass flow rate of 0.0052 kg/s. The pressure drop was calculated over the entire flow path, including the inlet section, the vertical U-tube heat exchanger, and the outlet section, corresponding to a total flow length of approximately 1.1 meters. Figure 7a shows the heat flux of the air over time. Due to the higher mass flow rates, significantly higher heat flow peaks are achieved. The peak heat flux at maximum (5min) air flow of 1260 W at 0.0091 kg/s is also almost twice as high as the peak heat flux at minimum air flow of 680W at 0.0052 kg/s. The extraction time is correspondingly shorter due to the low inlet temperature and high air flow rates. The maximum heat flux density (green line, approximately 5 minutes) is 35000 W/m² and corresponds well with other experimental research [69]. After 30 minutes, the heat flux decreases to approx. 550 W (15000 Wm-2). At 60 minutes, corresponding to the onset of crystallisation around the tubes, it further declines to approximately 300 W (9000 Wm-2). After 90 minutes, when crystallisation around the U-tubes is well underway, the heat flux is reduced to about 200 W (5500 Wm-2). The average salt temperature of the experiments is shown in Figure 7b. The phase change occurs at all curves, and the characteristic “crystallization plateau” of the salt temperature begins at an average salt temperature of approximately 250°C. In experiments with higher mass flow, crystallization begins approximately 25 minutes after the start (green curve). In the experiments with lower mass flow (blue curve), crystallization begins only after approximately 60 minutes. The heat flow decreases the most during the crystallization process in experiments with the highest mass flow. This can be explained by a salt layer forming around the U-tube, which restricts heat transfer from the salt to the air. At the beginning of crystallization, when the solid salt layer around the U-tube is just forming, heat transfer is hardly restricted. However, as this solid salt layer continues to grow, convection ceases, and heat can only be transferred by pure conduction. In this case, the salt layer surrounding the U-tube acts as thermal insulation, reducing the achievable heat flow. Suppose the aim is to operate with the highest possible heat flows. In that case, it is important to understand the crystallization process in detail and identify an optimal condition that maximizes latent heat yield while simultaneously maximizing heat flow. The experimental results indicate that the discharge behaviour is governed by the evolution of the solid salt layer surrounding the U-tubes. At the onset of crystallization, latent heat release maintains high heat transfer rates despite the decreasing salt temperature. As the evolution of the solid salt layer progresses, the growing frozen layer increasingly restricts heat transfer by suppressing natural convection and introducing an additional conductive thermal resistance between the remaining liquid salt and the heat transfer surface. Consequently, system performance is not primarily determined by the total amount of latent heat available, but by the evolution of the solid salt layer and its associated increase in conductive thermal resistance during discharge. The measured thermal response therefore provides indirect information on the evolution of the solid salt layer and the progression of crystallization. Combined with the validated CFD simulations, these measurements enable detailed investigation of the evolution of the solid salt layer and support the identification of configuration-specific operating conditions that maximize latent heat utilization while limiting the formation of excessively thick insulating salt layers. The temperature difference in the experiments with variable air mass flow is illustrated in Figure 7c. Due to the lower inlet temperature resulting from the inactive tube furnace, slightly higher temperature differences between the salt and air can be observed. The plateau, which occurs when the salt reaches its phase change, is recognizable in all these experiments after approximately 30–60 minutes. The analysis concludes that the highest heat fluxes and the largest temperature spread ΔT are achieved at maximum air mass flow and minimum inlet air temperature. This was to be expected, as the heat transfer value is strongly dependent on the flow velocity and temperature spread. Parameters such as charging and discharging rates, as well as transient temperature profiles, are key considerations in the design of salt-based phase change material (PCM) storage systems [70]. The thermal energy quantity of the storage tank when it is completely discharged and the latent heat is used is more than 3000 kJ. However, some of this heat is available at a very low temperature level. At an average salt temperature of 200°C, a temperature spread from salt to fluid of approximately ΔT = 100°C can be achieved (Figure 7c). On an industrial scale, it is not valuable to have fluid temperatures at a lower level. Therefore, the amount of energy in the storage tank up to this salt temperature is of interest. The thermal energy stored in the tank, transferred to the compressed air, is approximately 2600 kJ when the average salt temperature ranges from 550 °C to 200 °C. The amount of energy was calculated using Eq. (4). When considering the salt quantity of 2009g of solar salt, the thermal energy, related to salt mass, is calculated according to Eq. (8). The thermal energy associated with salt mass in the temperature range from 550°C to 200°C is approximately 1300 kJ/kg, assuming the latent heat is utilized. This value is consistent with the existing literature in terms of magnitude for molten salt thermal energy storage systems [71].
The experimental campaign covers a range of operating conditions to ensure the robustness of the thermal storage system under transient operation. In addition to a reference case with no salt crystallization, constant inlet temperature and constant air mass flow, experiments with varying inlet temperatures as well as varying mass flow rates were conducted. These variations allow the assessment of the system behaviour under different thermal and pneumatic driving conditions, which are representative of typical waste heat recovery scenarios. The results show that, despite significant changes in inlet temperature and mass flow rate, the characteristic phase-change behaviour, including the latent heat-induced temperature plateau and the associated modification of the heat flux evolution, remains consistently observable. This confirms that the observed thermal response is not limited to a single operating point but persists across a relevant range of operating conditions, covering both thermal-dominated and flow-dominated regimes. With the gathered experimental data, an energy balance was conducted to better understand the proportion of heat in the storage tank that comes from the salt.
3.3. Energy Balance
The amount of thermal energy extracted from the storage tank by the heat transfer fluid was determined using Equation (4). An energy balance was conducted to determine the proportion of energy contributed by the thermal storage system. The energy balance has the extracted energy on the left-hand side, i.e., the thermal energy of the air including the heat losses, and on the right-hand side is the storage terms consisting of salt and metal (Alloy 600), Eq. (9). The heat losses were assumed at the average salt temperature of the experiment and are known from 3.1 Stationary testing. The salt temperature in the experiments refers to the mean salt temperature calculated from Eq. (6). The latent heat of fusion of salt is a well-established literature value, amounting to 161 kJ/kg [72]. It should be noted that different values are reported in the literature (e.g., around 100 kJ/kg), depending on the exact salt composition and measurement approach. In this study, the value provided by SQM was used, as it is considered most representative for the solar salt employed in the experiments. The average salt temperature was used as the reference temperature to calculate the thermal energy in the metal. The heat capacity values correspond to the median temperature of the respective material. Figure 8 shows a bar chart comparing the thermal energy quantities for several experiments. All data in the diagram is provided in the supplementary document. The blue bars represent the thermal energy of the air, minus the heat losses through the insulation, i.e., the left-hand side of Eq. (9). The stacked bars indicate the thermal energy stored in the storage tank. They are composed of the thermal energy in the salt (orange), the thermal energy in the metal (yellow), and the latent heat of the salt (purple), i.e., the right-hand side of Eq. (9). The bars are arranged by air mass flow on the x-axis. The different heights of the bars result from different operating parameters, such as test duration and temperature difference. Listed on top of each bar is the average salt temperature at the end of the experiment. The average salt temperatures range from a maximum of 550°C to a minimum of 97°C (at 0.009 kg/s). It can be concluded that only about half of the thermal energy in the storage tank comes from the salt (). In contrast, the remaining portion originates from the metal (). Even in larger thermal energy storage systems, substantial amounts of the sensible energy is provided by the shell [73]. To quantify the contribution of latent heat to the overall energy storage capacity of the system, an additional evaluation of the energy components was performed based on the results shown in Figure 8. In particular, the ratio of latent heat to the total stored energy was determined. The analysis shows that the latent heat contribution accounts for an increase of up to 11% of the total energy stored in the system. This highlights the significant role of the phase change process in enhancing the effective energy density of the storage unit compared to a purely sensible heat storage system. Consequently, the inclusion of latent heat provides a measurable increase in the overall storage capacity, demonstrating the benefit of the phase change material within the investigated configuration. A detailed breakdown of the individual energy contributions and the corresponding ratio of latent heat to total stored energy is provided in the Supplementary Information (Table S2), enabling a quantitative assessment of the impact of phase change on the storage capacity. The test rig consists of 2009g of solar salt and approximately 12.5kg of metal, which yields a salt-to-metal ratio of 0.161. These results show that the ratio of salt to metal is a decisive design parameter in the construction of thermal energy storage units. On a larger scale, the salt-to-metal ratio should be reversed from this small design, leading to a higher proportion of Esalt. In the calculation of thermal energy, it was assumed that all the salt had crystallized, meaning that all the latent heat of the salt had been utilized. This assumption cannot be verified experimentally, as there may still be small “pockets” of molten salt in the salt tank. To verify how, when, and where the salt undergoes the phase change, a computational fluid dynamics (CFD) analysis of the experiments was conducted. Additionally, the conservation of energy within the CFD model was verified by comparing the temporal change of total enthalpy in the computational domain with the net heat transfer (air + losses). A detailed comparison between the CFD-based energy content of the air domain and the experimentally derived total energy balance is provided in the Supplementary Information (Figure S6), showing excellent agreement with a deviation of only +0.9%.
4. Numerical Study of Salt Phase Change
This chapter presents the CAD geometry of the salt tank, the resulting mesh for the simulation, and the results of the 3-D transient CFD simulations, including a comparison with the measured data. The primary focus of this study was the salt phase change, particularly crystallization. The melting process is not illustrated in this study due to space constraints.
4.1. Geometry and Model Structure
The construction of the numerical domain was performed using the academic software package ANSYS Design Modeler (version 2024 R2). The geometry was simplified; no radii, weld seams, or the like were considered. The geometry consists only of cylinders, truncated cones, or similar simple geometric shapes. The construction consists of five domains: salt (orange), metal (Alloy 600, green), compressed air (blue), a gas space above the salt (grey), and a separating layer between the salt and gas domains (red), as shown in Figure 9. The salt volume in the numerical model is constant, which slightly contradicts the physical reality on the test bench, as the salt expands as the temperature rises. A fill level at 400°C salt temperature was selected for the CFD model. The U-tube that separates the compressed air from the salt does not have a continuous radius, as the bending radius could not be realized in practice, so the U-tube was welded together in cylinder segments. The casing tube, located in the middle of the salt cylinder, has a cylinder welded to its end. This was provided for practical reasons to ensure a constant thermal connection between the salt domain and the gas chamber. This is beneficial during melting because it enables the hot liquid salt to ascend to the top, and this design can help decrease thermal stresses. The compressed air domain is located within a cylinder in the U-tube; the inlet is positioned at the bottom left, and the outlet is located at the bottom right corner (indicated by blue arrows). The separation layer between the salt and gas domains was necessary for solver convergence; direct contact between the salt and gas led to problems in Fluent. The geometry is not rotationally symmetrical, but it can be mirrored around the center axis in both the plane of the U-tube and the plane of the thermocouples. The metal shell and thermal insulation of the salt tank were not designed to limit the total number of cells. Both the metal shell and thermal insulation were simulated in Fluent with a 2-layer shell conduction model.
4.2. Meshing
ANSYS Mesher® (version 2024 R2) was used to generate the mesh. The default size of the elements was 2mm with a growth rate of 1.2. A total of 5 inflation layers were inserted in the compressed air domain to determine suitable y+ values (y+ = 10-20). The maximum skewness is less than 0.8, indicating good mesh quality. The final mesh comprises approximately 1.6 million cells, as illustrated in Figure 10, which shows a sectional view of the mesh. The mesh consists mainly of tetrahedra, and approximately 89% of the total elements are tetrahedra. The rest consists of 4% Hexahedra, 6% Wedges, and 1% Pyramids. The Alloy 600 U-tube has a thickness of approximately 2.6 mm and consists of two elements in depth. The Interface has a thickness of 1 mm and consists of one element in depth. The high number of tetrahedra is visible in the gas and salt domains. A grid independence study was conducted using 3, 10, and 30 million cells, respectively. No grid influences were detected.
4.3. Physical Model and Boundary Conditions
A three-dimensional solver that considers the conservation of energy, mass, and momentum equations in a transient case was implemented using a Realizable k-ε-turbulence model with enhanced wall treatment in the air domain. The salt domain was set to the Laminar turbulence model. The Solidification & Melting Tool was also activated to model the phase change of the salt. An enthalpy-porosity method [74] is employed in FLUENT to model the solidification and melting processes. The enthalpy-porosity method is well-established for developing numerical models of phase change materials. With this approach, the melt interface is not tracked explicitly. Each cell in the domain is assigned a value known as liquid fraction β, which represents the part of the cell volume that is liquid. The liquid fraction is calculated at each iteration based on an enthalpy balance. The mushy zone is an area where the liquid fraction varies from 0 to 1. It is modeled as a “pseudoporous” medium in which porosity decreases from 1 to 0 as the material solidifies. When a cell’s material is fully solidified, the porosity drops to zero, and the velocities also reduce to zero. The enthalpy of the phase change material is computed as the sum of the sensible heat () and the latent heat (), according to Eq. (9) [75]:
The sensible heat of the material is defined by Eq. (10);
Where is the reference enthalpy and is the specific heat at constant pressure. When the temperature of a cell is below the solidus temperature, the liquid fraction β is equal to 0. If the temperature is above the liquidus state, the liquid fraction β equals 1. In the event of a phase change, when the temperature of the cell is between the liquidus and solidus temperatures, the following relationship, expressed by Eq. (11), applies to the liquid fraction β:
The latent heat content can now be written using the latent heat of the material, L. The latent heat, expressed in Eq. (12), can vary between 0 (solid) and L (liquid). For solar salt, L is 161 kJ/kg.
For problems involving solidification & melting, the energy equation in the solver can be written as Eq. (14), where H is the enthalpy of the phase change material (Eq. (10)), is the density, is the fluid velocity, T is the temperature, and S is the source term.
The solution for temperature is fundamentally a reiteration of the energy equation (Eq. (13)) and the liquid fraction equation (Eq. (13)). As the material transitions from a solid to a liquid state or vice versa, it becomes porous, a phenomenon known as the 'mushy zone'. The porosity of the material depends on the liquid fraction. When the cell is fully solidified, the porosity is zero, which extinguishes velocities in these solid regions [74]. The heat losses of the salt tank to the environment were modelled using a two-layer shell conduction approach. The first layer represents the metallic structure (Alloy 600). As the numerical implementation requires constant layer thicknesses, the total mass of the metal in direct thermal contact with the salt, including additional components such as the flange, was converted into an equivalent uniform wall thickness to preserve the overall thermal mass. This resulted in an effective thickness of 9 mm for the metallic layer. The second layer represents the thermal insulation, which was modelled with a thickness of 170 mm, consistent with the experimental setup shown in Figure 3. Heat losses to the surroundings were defined using an ambient temperature of 22 °C and an external heat transfer coefficient of 5.5 W/m²K, based on the stationary experiments described in Section 3.1. At the fluid boundaries, a mass-flow-inlet condition was applied at the air inlet and a pressure-outlet condition at the outlet. The remaining external surfaces, corresponding to the outer walls of the inlet and outlet pipes, were modelled as adiabatic. This assumption is justified by the short distance between the measurement locations and the storage tank, where no significant temperature change of the air was observed experimentally. A schematic overview of all described boundary conditions is provided in the Supplementary Information (Figure S8). The material properties of air were specified as those of an ideal gas, and the database for material values of ρ, k, μ, and cp, stored by ANSYS Fluent®, was used. A corresponding clarification has been added to the Supplementary Material (Section: “Material properties of air in CFD analysis”). The thermal energy of the air is evaluated based on the enthalpy difference between inlet and outlet mass flow rates as obtained from the CFD solution, ensuring consistency with the energy conservation equations in the fluid domain. The material properties of the solar salt, based on its phase state, were assumed as follows:
Literature data indicate that the density of solar salt changes only by approximately 4–5% across the solid-liquid phase transition [72]. In the present model, this discontinuous density change associated with melting and solidification was neglected. However, the density of the liquid salt remained temperature dependent according to the implemented density correlation, allowing buoyancy-driven natural convection to be resolved throughout the liquid phase. This modelling approach neglects only the volumetric expansion and contraction associated with melting and solidification, while preserving the influence of thermal expansion on the flow field. The assumption was adopted because the fixed computational mesh cannot represent moving boundaries or volume changes during phase change. For the investigated test rig, the resulting change in salt level is only a few millimetres and therefore has a negligible influence on the quantities of interest. A more detailed insight into the behavior of the TES with respect to volume expansion and contraction during thermal charging and discharging is provided in the Supplementary Material, in the section entitled “Effect of pressure in the gas space on latent heat.” The viscosity in the solid state is higher than 100 Pa s, but with viscosity jumps greater than 105, there were problems in Fluent. Therefore, this value was chosen for the solid aggregate state of the salt. Since the thermal conductivity and specific heat of the solar salt do not change significantly over the temperature range, and to accelerate the solver's convergence, these material values were assumed to be constant. The latent heat released by the phase change of solar salt was considered to be 161 KJ/kg [72]. The material values used for Alloy 600 originate from the manufacturer [80]. The property values of salt were used as the material values of the interface between salt and air. The thermophysical properties of salt can also be further enhanced when nanoparticles are added [81]. The area for inserting the boundary condition of the heating element is in the very center of the salt tank and is shown in Figure 2. The thermal boundary condition was modeled via convection, with the heat transfer coefficient set to h = 250 (W/m²K), and the corresponding heating temperature was set to the same value as in the experiment. The modelling via convection was necessary to accurately reproduce the heat contact between the casing tube and the heating element.
4.4. Solver-Setup Transient
The transient solver of ANSYS Fluent® was used in this study. The pressure-velocity-coupling scheme was set to SIMPLE; the spatial discretization schemes were put to second-order upwind for the energy, momentum, turbulent dissipation rate, and turbulent kinetic energy equations. The pressure discretization scheme was set to PRESTO!. The convergence criterion was deactivated, and the simulation duration was adjusted to match the experiment duration. The time step size was set to 5 seconds, and the number of iterations per time step was selected as 25. The temperature distribution of the salt at the end of the loading process is the starting condition for the transient thermal discharging simulations. In the thermal loading experiments, only the heating element was active. The initial salt temperature at the start of the transient simulations was 550°C. There is almost no temperature stratification in the radial direction in the salt. In future work, the temperature stratification could be optimized using composite materials, which improve thermal conductivity [82]; however, thermal stability becomes more challenging with the addition of composites [83]. As little temperature distribution as possible is desirable, as thermal gradients in molten salts tend to increase corrosion [84].
4.5. Validation
The ultimate purpose of the validation is not merely to reproduce measured temperatures, but to establish confidence that the model captures the physical mechanisms governing frozen-layer growth and the associated degradation of heat-transfer performance during discharge. Particular attention was given to the onset and progression of crystallization, as these phenomena govern the evolution of the insulating solid salt layer and ultimately determine the thermal performance of the storage system. To this end, spatially resolved salt temperatures distributed throughout the storage domain were used as the primary validation metric. Additional validation quantities included average salt temperatures, heat transfer rates, and transient gas temperatures. Figure 11 summarizes the comparison between experimentally measured and CFD-predicted temperature histories at five representative thermocouple locations (T1, T3, T5, T7, and T9), spanning the vertical extent of the storage tank. Thermocouple T1 is located in the upper region of the storage domain, whereas T9 is positioned near the bottom. The exact sensor locations of the experiment and numerical simulation are provided in Figure S2 of the Supplementary Information. Figure 11a presents results for cases of minimum and maximum air mass flow rates ( and , respectively), while Figure 11b shows the corresponding comparison for minimum and maximum inlet air temperatures at constant mass flow rate. All simulations and experiments were initialized at an identical initial average salt temperature of approximately 550 °C. The experimental datasets shown in Figure 11 correspond to the same measurement campaigns as those previously presented in Figure 6 and Figure 7. Across all cases, the results reveal a consistent stratified temperature distribution within the molten salt domain, with higher temperatures in the upper region and progressively lower temperatures toward the bottom of the salt tank. The thermocouples located near the mid-height of the domain (T3 & T5) closely follow the evolution of the volume-averaged salt temperature. A comparison of average salt temperature and outlet air temperature between CFD and experiments is provided in Figure S9 of the Supplementary Information. As shown in Figure 11a, increasing the air mass flow rate leads to a significantly accelerated thermal discharge of the storage system. The onset of phase change at approximately 222 °C occurs at around 40 minutes (at sensor T9) in the high-mass-flow case, whereas it is delayed to approximately 65 minutes (at sensor T9) under low-mass-flow conditions. During phase transition, a pronounced temperature plateau is observed, corresponding to the release of latent heat and increased thermal resistances due to solid salt formation on the heat exchanger tube. Once the local phase change is complete, the temperature decreases again. The characteristic plateau behaviour and overall temporal evolution are consistently captured by the numerical model for both operating states. In the CFD model, the phase change process is implemented using a sharp interface approach with identical solidus and liquidus temperatures of 222 °C. Compared to a smeared phase transition interval, where solidus and liquidus temperatures differ, this formulation provides improved numerical stability and reduces convergence difficulties during the transient crystallization process. However, the sharp interface assumption also introduces localized deviations between the numerical and experimental results within the phase transition region. The experimental thermocouple signals indicate a more gradual phase transition behaviour, suggesting that the solar salt undergoes crystallization over a finite temperature range rather than at a single discrete temperature. Consequently, the experimentally observed temperature plateau during phase change appears smoother compared to the CFD analysis. This difference explains the localized deviations observed during the onset and completion of crystallization, particularly around 40 minutes for the high-mass-flow case and approximately 65 minutes for the low-mass-flow case. Additional insight into the solidification process is provided by the liquid fraction evolution shown in Figure S10 of the Supplementary Information. Since the liquid fraction cannot be measured directly in the present experimental setup, these results should be interpreted as model-based predictions derived from the validated thermal response. Nevertheless, the predicted progression of the solidification front is consistent with the experimentally observed temperature plateaus and changes in local cooling rates associated with latent heat release. This is further confirmed by the time-averaged RMSE values reported in Figure S11 of the Supplementary Information, which demonstrate consistent predictive accuracy across all investigated operating conditions. After completion of phase change in the vicinity of the thermocouple locations, the temperature decreases with a significantly lower gradient compared to the liquid phase. This behaviour is primarily attributed to the substantial reduction in the effective overall heat transfer coefficient caused by the formation of a solid salt layer around the heat exchanger tubes. Once crystallization occurs, the solidified salt acts as an insulating barrier between the airflow inside the heat exchanger and the remaining molten salt domain, thereby limiting further heat transfer. In addition, the continuously decreasing temperature difference between the airflow and the salt further reduces the thermal driving force during the later stages of discharge. A detailed analytical assessment of the thermal resistance contributions and the resulting overall heat transfer coefficient is provided in Figure S12 & Figure S13 of the Supplementary Material. The analysis demonstrates that even thin solid salt layers rapidly dominate the overall thermal resistance of the system. In particular, the resistance fraction associated with the solidified salt layer becomes the dominant contribution already at sub-millimeter solid layer thicknesses, resulting in a pronounced reduction of the overall heat transfer coefficient. This behaviour explains the reduced thermal gradients observed experimentally after the completion of local phase change. Although the growing solid salt layer substantially increases the conductive thermal resistance, latent heat release during crystallization partially compensates for this effect during the active phase-change period. Once solidification is nearly complete, however, heat transfer is governed predominantly by conduction through the solid salt layer, leading to the observed reduction in temperature gradients. The most important outcome of the present investigation is that the thermal performance of the storage system is governed primarily by the evolution of the solid salt layer rather than by the total amount of latent heat available. The thermal resistance analysis presented in Figures S12 and S13 demonstrates that the resistance associated with the solidified salt layer rapidly becomes the dominant contribution to the overall heat-transfer resistance, even at relatively small frozen-layer thicknesses. Consequently, the transition from convection-dominated to conduction-dominated heat transfer occurs much earlier than complete solidification. This transition represents the fundamental mechanism controlling TES performance during discharge. While latent heat release initially sustains high heat-transfer rates, continued frozen-layer growth progressively suppresses natural convection and introduces an increasingly insulating conductive barrier around the heat-transfer surfaces. As a result, further latent heat utilization becomes progressively less beneficial despite additional energy remaining stored within the salt. The CFD analysis indicates that this transition occurs when the frozen salt layer reaches approximately 3–4 mm thickness, corresponding to about 60% overall solidification in the present system. Beyond this point, the increase in thermal resistance outweighs the benefits associated with additional latent heat recovery, thereby defining the practical operating limit of the investigated storage concept. Complete solidification of the storage medium is reached after approximately 150–165 minutes, at which point the experiments were terminated. Figure 11b compares CFD and experimental results for varying inlet air temperatures under constant air mass flow. As expected, the largest initial temperature gradients occur at the beginning of the discharge process, when the salt is at its initial temperature of approximately 550 °C. The onset of phase change occurs at approximately 70 minutes (at sensor T9) in both cases, with a slight shift depending on inlet temperature. Specifically, the case with lower inlet air temperature (104 °C) exhibits an earlier onset of phase change (approximately 10 minutes earlier) compared to the case with higher inlet temperature (146 °C), while maintaining identical mass flow conditions. Following the characteristic phase-change plateau at 222 °C, the temperature decreases again with a reduced gradient until the end of the discharge process. Additional experimental results, including the comparison of maximum and minimum gas pressure in the gas chamber above the salt domain, are provided in Figure S14 of the Supplementary Information. It should be emphasized that the present validation is based on experimentally measured thermal quantities, including transient temperature distributions and heat transfer response. The spatial evolution of the crystallization field and frozen salt layer thickness cannot be measured directly with the available experimental techniques and are therefore inferred from the validated CFD model. Consequently, the predicted solidification patterns should be interpreted as model-based predictions supported by extensive thermal validation rather than directly validated quantities.
The experimental validation presented in this work, including spatially resolved temperature measurements, liquid fraction evolution, RMSE analysis, for multiple operating conditions, demonstrates that the applied numerical methodology captures the dominant thermal and phase-change dynamics with good accuracy and reproducibility. Figure 12a presents the spatially resolved temperature evolution during the discharge process for different density assumptions used in the numerical model. The experimental measurements are shown in blue. The orange curves represent the CFD simulation using a density of 2192 kg/m³ for both the liquid and solid phases, corresponding to the values listed in Table 1. The yellow curves represent a CFD simulation using a constant density of 2090 kg/m³ for both the liquid and solid phases. According to literature data and material datasheets for solar salt, the density of the solid phase is approximately 2192 kg/m³, whereas the liquid-phase density is approximately 2090 kg/m³. These two density values were therefore selected to investigate the influence of density variation on the transient thermal behaviour of the storage system. The thermal discharge process begins at an initial salt temperature of approximately 550 °C and decreases continuously until the onset of phase change at approximately 222 °C. In the CFD simulations, crystallization starts after approximately 90 minutes. During phase transition, latent heat release causes a substantial reduction in the local temperature gradients, resulting in the characteristic plateau behaviour of the temperature curves. After completion of local phase change, the temperature decreases further under predominantly conduction-controlled heat transfer conditions within the solidified salt domain until the end of the experiment after approximately 225 minutes. Among the investigated density assumptions, the configuration using the higher density value (orange curves, Table 1) provides the closest agreement with the experimentally measured spatially resolved temperatures and was therefore selected for the numerical analysis presented in this work. The corresponding RMSE values are provided in Figure S4 of the Supplementary Information. Overall, the comparison demonstrates that the density variation from 2090 to 2192 kg/m³ has only a minor influence on both the local temperature evolution and the overall transient discharge behaviour of the thermal energy storage system. The Supplementary Information provides the corresponding spatially resolved temperature fields, time-averaged deviations, and RMSE values for all investigated cases. Figure 12b compares the experimentally determined average salt temperature (blue) with the CFD simulations using the maximum density assumption (orange) and the minimum density assumption (yellow). As expected, the experimentally determined average salt temperature in the liquid phase is slightly lower than the CFD prediction. The observed deviation in average salt temperature during the liquid phase is mainly attributed to the finite number of thermocouple positions within the storage domain. Due to natural convection, hotter molten salt accumulates in the upper region of the tank. However, no thermocouples could be installed directly at the top of the salt domain because of geometric limitations caused by the flange configuration. In contrast, the CFD analysis determines the average salt temperature from the entire computational domain by averaging over all cells. Once crystallization begins and the salt transitions into the solid state with simultaneous latent heat release (approximately 90 minutes), the agreement between experimental and numerical results improves significantly.
This behaviour is additionally influenced by the crystallization of salt around the thermocouple casing tubes, which affects the experimentally measured local temperatures. Additional sensitivity analyses investigating more pronounced density variations of up to +25%, as well as the influence of the phase-dependent density change from 2090 kg/m³ (liquid) to 2192 kg/m³ (solid), are provided in Figure S15 of the Supplementary Information. Figure 12c compares the transient outlet air temperatures obtained experimentally and numerically. For clarity, only the results for the case is shown, as the differences between the and simulations are negligible. The results indicate that neglecting the phase-change-induced density discontinuity is appropriate for solar salt under the investigated operating conditions. However, the additional sensitivity analysis demonstrates that larger density differences may significantly affect the predicted phase-change behaviour. Consequently, the validity of the present modelling approach should be interpreted within the context of the investigated material system and should not be generalized to phase change materials exhibiting substantially larger density-induced volume changes without further validation. The inlet air temperature was imposed in the CFD model using a polynomial fit of the experimental data and therefore exhibits no deviation between simulation and experiment. The outlet air temperature agrees very well with the measurements, with maximum deviations remaining below approximately 2% of the instantaneous temperature value. The numerical model slightly overpredicts heat transfer from the salt to the airflow during the first half of the discharge process, corresponding to the liquid-state regime, while heat transfer is slightly underpredicted during the later stages after solidification. This trend is consistent with the behaviour observed for the salt temperatures and is directly reflected in the transient outlet air temperature evolution. The heat flux comparison from measurement data to simulation results can be found in the supplementary material under Figure S16.
The phase state of the salt is represented using the liquid fraction parameter, where a value of 1 corresponds to fully liquid salt and 0 corresponds to fully solid salt. Figure 12d presents the evolution of the domain-averaged liquid fraction for the (orange) and (yellow) simulations. Up to approximately 90 minutes, the salt domain remains fully liquid. As thermal discharge progresses, an increasing number of computational cells reach the crystallization temperature of 222 °C, initiating solidification throughout the storage domain. At the end of the experiment, nearly the entire salt domain is solidified, with only approximately 2% remaining in either liquid or partially molten state. The dotted red lines in Figure 12 represent several key points in time during the thermal discharge process, which are illustrated in Figure 13. The elements in the salt domain in Figure 13 are coloured according to their liquid fraction state, where red represents a liquid state, and orange, yellow, green, and turquoise indicate a phase change state, or a mushy zone. The CFD simulations predict that crystallization initiates in the vicinity of the air tubes, where the largest local temperature gradients exist, as shown in Figure 13a. Based on the validated thermal response, the model predicts a progressive growth of the solidification front from the heat exchanger surfaces into the surrounding salt domain. The resulting frozen-layer evolution provides a physically consistent explanation for the experimentally observed reduction in heat transfer during the later stages of discharge. A cross-section of the solid fraction shown in Figure 13a can be found in the Supplementary material under Figure S17. As soon as the salt around the air pipes is completely crystallized, the crystallization front begins to spread toward the heating element, as shown in Figure 13b. If thermal discharge is continued, the solid salt also grows from the bottom to the top of the heating element's casing tube. Now, the outer surface of the salt domain is entirely covered with solid salt; only liquid “salt pockets” remain, which change phase from bottom to top as the thermal discharge progresses, transitioning into the solid phase. At the end of the thermal discharge process, almost the entire salt domain is in a solid state, as shown in Figure 13c. The proportion of liquid melt or salt that is in the transition area between liquid and solid is in the low single-digit percentage range at the end of the experiment. A video of the crystallization process (for salt densities and ) is available in the supplementary material document. When the salt crystallizes, the heat transfer from the tube to the salt decreases significantly in the pipe areas where the salt has solidified, as shown in Figure 14. This reduction in heat flux occurs because natural convection occurs only on the outer surface of the pipe when it is in the liquid aggregate state. As soon as the salt crystallizes and adopts a solid aggregate state, a thermal insulation layer of solid salt forms around the U-tube. If this salt layer continues to grow, only pure heat conduction will occur at the U-tube. Dead zones in the flow course are a further limiting factor for heat transfer [85]. When the crystallization front reaches the casing tube of the heating element, it poses a problem in industrial operation. Suppose the casing tube of the heating element is completely enclosed by solid salt; only very low temperature gradients can be used during heating, otherwise, material fatigue and thermal stresses occur. This is audible through loud cracking noises. Flexible operation, achieved by quickly switching loads, can significantly reduce costs when favourable electricity prices are available [86]. Hybrid molten-salt thermal energy storage systems that utilize both sensible and latent heat can dramatically enhance the flexibility of a coal-fired power plant [87]. Suppose operation with solar salt is initiated at a salt temperature of 550°C. In that case, the salt tank can be thermally discharged for approximately two to three hours (depending on the operating parameters) until the critical operating point, approximately 60% salt crystallization, is reached (163min after start in Figure 13b; and Figure 12d). At this point, the next thermal loading cycle should be initiated. In that case, the total usable thermal energy increases by roughly 6%, due to latent heat. If 60% of the latent heat is used, the layer of frozen salt around the U-tube is approximately 3-4 mm thick. These CFD findings refine the experimental data presented in Section 3.2. This operating duration is consistent with other experimental TES studies in which latent heat was utilised [88]. Based on the experimentally validated CFD model, the progression of the phase-change process can be predicted with sufficient accuracy to identify practical operating limits and discharge strategies. The maximum increase in thermal energy output resulting from the use of the latent heat of the salt is 10%, as shown in Figure 8. There is no concern about the potential risk of freezing the salt [89], as this is safe when done correctly [90]. The design can be optimized to increase the amount of salt that can crystallize and maximize the latent heat yield. In an optimization, the distance between the heat source (heating element) and the heat sink (air pipes) would be increased [91], as the freezing of the salt around the heating element severely restricts the operating mode, making rapid load changes impossible. The optimization could be further enhanced using existing models for phase change materials in heat exchangers [92]. Previous work has demonstrated that targeted adjustments to the geometry and operating temperature can significantly improve the performance of phase change material-based heat storage systems [93]. It is not optimal if the entire salt domain crystallizes completely, as this leads to unnecessarily long reloading times due to the low temperature gradients of the heating element. However, if thermal discharging is carried out up to the critical operating point, approximately 60% of the latent heat of the salt can be safely utilized. To further illustrate the internal flow dynamics within the molten salt phase and to demonstrate the high spatial and temporal resolution achieved by the CFD model, Figure 15a presents the velocity vectors, while Figure 15b shows the corresponding contours of velocity magnitude at four characteristic time steps. Natural convection within the molten salt phase is explicitly resolved in the CFD model by incorporating gravity and temperature-dependent density, thereby enabling buoyancy-driven flow. During the early stage of thermal discharge (t=1 min), the salt is fully liquid and convection is strongest, exhibiting pronounced circulation patterns that enhance heat transfer within the molten region, with a maximum velocity of 0.01082 m/s and a volume-averaged velocity of 0.00155 m/s. As solidification begins (t=85 min), the liquid fraction decreases and natural convection weakens significantly (maximum velocity 0.00286 m/s, volume-averaged velocity 0.000337 m/s), reflecting the gradual suppression of convective motion. In the intermediate stage (t=127 min, liquid fraction ≈ 0.8), convection is further reduced due to the growing solid regions and diminished temperature gradients, while at t=163 min (liquid fraction ≈ 0.37), fluid motion is extinguished and heat transfer becomes predominantly conduction-driven. This progressive decrease in velocity magnitude clearly illustrates the transition from convection-dominated to conduction-dominated heat transfer during solidification, a key mechanism governing overall system performance. Simplified one-dimensional models generally fail to capture these effects, as phase-change heat transfer in molten salts is inherently three-dimensional and involves local processes such as the formation of insulating solid layers at heat-transfer surfaces and the decay of buoyancy-driven flow. These phenomena are fully resolved in the present CFD model. Similar conclusions have been reported for reduced-order modelling approaches, where high-fidelity CFD remains necessary to resolve local melting, solidification, and heat-transfer mechanisms in latent heat TES systems [94]. To provide a more detailed view of the flow structures, a region in the upper part of the salt domain is highlighted in Figure 15a (dashed black box) for the first three time steps, and the corresponding magnified views are presented in Figure S19 in the Supplementary Material. The observed transition from convection-dominated to conduction-dominated heat transfer has important implications for practical applications such as waste heat recovery systems. The results suggest that high flow rates or low inlet temperatures can accelerate solid layer formation on the heat exchanger surface, reducing heat transfer performance. Therefore, an optimal operating strategy should balance heat extraction rate and phase-change progression to maximize both heat flux and latent heat utilization. Overall, the numerical predictions show good agreement with the experimental observations across all investigated operating conditions. The CFD model successfully reproduces the measured thermal response associated with thermal stratification, latent heat release, and the transition from convection-dominated to conduction-dominated heat transfer. Based on this extensive thermal validation, the model provides physically consistent predictions of crystallization dynamics and frozen-layer evolution within the storage domain.
Remaining local discrepancies are considered acceptable for such strongly coupled transient phase-change systems and can be attributed to a combination of experimental limitations, including the finite spatial resolution of the thermocouple network, sensor encapsulation effects, and potential minor thermocouple displacements caused by thermal expansion and mechanical stresses during operation. The validation presented in this work comprises spatially resolved salt temperatures, average salt temperatures, transient gas temperatures, heat transfer rates, RMSE analyses, and multiple operating conditions. These experimentally validated thermal quantities provide confidence that the numerical methodology captures the dominant thermo-physical processes governing solidification. The resulting liquid fraction evolution and frozen-layer development should therefore be interpreted as model-based predictions supported by extensive thermal validation rather than directly validated quantities. The additional sensitivity analyses further indicate that neglecting the phase-change-induced density discontinuity represents an appropriate simplification for solar salt and similar PCM systems exhibiting only small density differences between the liquid and solid phases. Based on the combined experimental and numerical results, the proposed frozen-layer limits and discharge recommendations are considered valid for the investigated storage configuration, the applied heat exchanger geometry, the examined operating conditions, and comparable molten-salt PCM systems. However, the results also demonstrate that the optimum frozen-layer thickness (as inferred from CFD analysis) is not a universal parameter but depends strongly on the thermophysical properties of the PCM, heat exchanger design, thermal conductivity, operating conditions, and storage scale. Consequently, systems employing different PCM materials, alternative heat exchanger configurations, or exhibiting substantially larger density variations during phase change may exhibit different optimum operating points. In such cases, more advanced numerical approaches, including moving-mesh or deformable-interface methods, may be required to accurately capture interface movement, volume contraction, thermal stresses, and scale-dependent effects. Therefore, the conclusions presented in this work should be interpreted within the context of the investigated solar salt TES system and similar storage concepts rather than as universally applicable design rules for latent heat thermal energy storage systems.
5. Conclusions
This study provides the first experimentally supported demonstration that latent heat in molten salt thermal energy storage (TES) systems can be deliberately and safely utilized under semi-industrial conditions. In contrast to conventional molten salt TES concepts limited to sensible heat operation, this work demonstrates that controlled melting and solidification can be integrated into industry-relevant system designs without compromising structural integrity. A unique feature of this study is the combination of an extensive high-resolution experimental campaign, comprising more than 40 transient measurements with high spatial and temporal resolution of temperature and heat flux, with a validated high-fidelity three-dimensional CFD model. This combined approach enables detailed investigation of the solidification process by linking experimentally measured thermal response to CFD-based predictions of crystallization behaviour and frozen-layer growth. The results provide new insight into the transition from convection-dominated to conduction-dominated heat transfer and identify practical operating boundaries for the investigated molten salt TES configuration. The main conclusions are summarized as follows:
(1) The thermal response associated with solar salt crystallization was experimentally characterized and reproduced with high accuracy using a validated 3D CFD model, with maximum deviations in transient gas temperature below ±2%. The model accurately captures the measured temperature evolution across a wide range of operating conditions. Based on this extensive thermal validation, the CFD simulations provide physically consistent predictions of frozen-layer growth and solidification progression within the storage domain. Although the frozen-layer thickness could not be measured directly, the predicted crystallization behaviour is consistent with experimentally observed temperature plateaus, local cooling rates, and latent-heat release signatures.
(2) The combined experimental–numerical analysis indicates that the practical operating limit of the investigated storage system is governed by frozen-layer growth on the heat exchanger surface. For the specific geometry, salt inventory, and operating conditions considered in this study, the CFD model predicts that a frozen-layer thickness of approximately 3–4 mm corresponds to the onset of strongly degraded heat-transfer performance. Further solidification increases the conductive thermal resistance and progressively reduces the effectiveness of latent heat utilization.
(3) The system achieved heat fluxes of up to 35,000 W/m² and extracted approximately 1300 kJ/kg of thermal energy within the temperature range of 550°C to 200°C. These results demonstrate that controlled latent heat utilization substantially enhances the effective energy density of molten salt TES systems compared with conventional sensible heat operation, while maintaining discharge rates relevant for industrial waste heat recovery and flexible energy applications.
(4) An optimal operational strategy was identified that balances heat transfer performance and latent heat utilization. High air mass flow rates maximize heat flux, while the discharge process should be terminated after approximately 2–3 hours under the investigated operating conditions to limit excessive frozen-layer growth and maintain favourable heat-transfer characteristics.
(5) For the investigated test rig and operating conditions, the optimum operating point was found at approximately 60% solidification, corresponding to a heat yield increase of about 6% compared with purely sensible heat utilization. According to the CFD analysis, this operating point coincides with a frozen-layer thickness of approximately 3–4 mm. Beyond this point, continued solidification increasingly restricts heat transfer and reduces system responsiveness, highlighting the importance of controlled partial crystallization. This optimum point should be interpreted as specific to the investigated configuration and operating range and not as a universally applicable design criterion for molten salt TES systems.
The applicability of the proposed liquid-fraction reconstruction methodology should be interpreted within the scope of the investigated material and operating conditions. The validation was performed for solar salt, which exhibits comparatively small density differences between the liquid and solid phases. The additional sensitivity analysis demonstrated that artificially increasing the density difference can significantly influence the predicted liquid fraction evolution. Therefore, the quantitative accuracy reported in this study cannot be assumed for phase change materials with substantially larger density variations or fundamentally different solidification behaviour without further validation. Future work should investigate the applicability of the methodology to other molten salts and PCM systems exhibiting stronger density-induced volume changes. The liquid-fraction evolution and frozen-layer thickness reported in this study should therefore be interpreted as CFD-based predictions supported by extensive thermal validation rather than directly validated quantities. Furthermore, conclusions regarding frozen-layer evolution and optimum operating conditions should be interpreted as specific to the investigated solar salt system and should not be assumed to apply universally to other PCM-based thermal energy storage concepts.
The central finding of this work is that latent heat utilization in molten salt TES systems is not primarily limited by the amount of latent heat available, but by the evolution of the thermally insulating frozen salt layer. By identifying and quantifying this mechanism, the present study provides a physically based framework for interpreting operating limits and discharge behaviour in the investigated storage configuration and offers a basis for future studies of similar high-temperature latent heat storage systems. A particular contribution of this study is the demonstration of controlled latent heat utilization at operating temperatures exceeding 550 °C, which are highly relevant for industrial thermal energy storage and power-to-heat applications. The combination of high-temperature operation and controlled crystallization extends the experimental evidence available for molten salt latent heat storage systems, where latent heat utilization has previously remained largely conceptual or restricted to laboratory-scale investigations. The presented results demonstrate the technical feasibility of integrating latent heat utilization into industrially relevant molten salt TES concepts and provide a foundation for future optimization and scale-up studies. The presented results demonstrate the technical feasibility of integrating latent heat utilization into industrially relevant molten salt TES concepts and provide a foundation for future optimization and scale-up studies. The validated experimental and numerical framework developed in this work can support future investigations aimed at assessing latent heat utilization under different geometries, operating conditions, and scales.
Supplementary Materials
The following supporting information can be downloaded at the website of this paper posted on Preprints.org, Figure S1: title; Table S1: title; Video S1: title.
Author Contributions
Johannes Hochenauer: Writing – original draft, Visualization, Validation, Software, Methodology, Investigation, Formal analysis, Conceptualization, Data curation, Writing – review & editing. Mario J. Müller: Writing – review and editing, Supervision, Project administration, Funding acquisition. Christoph Hochenauer: Writing – review and editing, Supervision, Resources, Project administration, Conceptualization.
Funding
This project has received funding from the Austrian Promotion Agency (FFG) as part of the project ‘CALstore’ (grant project no.903946). The authors gratefully acknowledge the support.
Data Availability Statement
The research data used will be made available upon request.
Conflicts of Interest
The authors declare no conflicts of interest. The funders had no role in the design of the study; in the collection, analyses, or interpretation of data; in the writing of the manuscript; or in the decision to publish the results.
Abbreviations
The following abbreviations are used in this manuscript:
| CFD | Computational Fluid Dynamics |
| TES | Thermal energy storage |
| PCM | Phase change material |
| 3-D | Three dimensional |
References
- Cozzi, L.; Martinos, A.; Spencer, T.; Tapia, V.; Roge, A. Global Energy Review 2025; IEA Publications, Mar 2025; Available online: https://iea.blob.core.windows.net/assets/5b169aa1-bc88-4c96-b828-aaa50406ba80/GlobalEnergyReview2025.pdf.
- Intergovernmental Panel On Climate Change (Ipcc) (Ed.) “Energy Systems,” in Climate Change 2022 - Mitigation of Climate Change, 1st ed.; Cambridge University Press, 2023; pp. 613–746. [Google Scholar] [CrossRef]
- Wu, M.; He, Q.; Liu, Y.; Zhang, Z.; Shi, Z.; He, Y. Machine Learning Techniques for Decarbonizing and Managing Renewable Energy Grids. Sustainability 2022, 14, 13939. [Google Scholar] [CrossRef]
- Hu, W.; Liu, M.; Zhang, J.; Zhang, S.; Yan, J. Load cycling rate of power-to-heat molten salt thermal storage and power generation system: Dynamic modeling and performance evaluation. J. Energy Storage 2025, 125, 116982. [Google Scholar] [CrossRef]
- Fadzlin, W. A.; Hasanuzzaman, M.; Rahman, S. A.; Said, Z. Solar thermal energy storage: global challenges, innovations, and future directions for renewable energy systems. Appl. Therm. Eng. 2025, 280, 128346. [Google Scholar] [CrossRef]
- Guo, X.; Goumba, A. P. Process Intensification Principles Applied to Thermal Energy Storage Systems—A Brief Review. Front. Energy Res. 2018, 6. [Google Scholar] [CrossRef]
- Li, Y.; Liu, Y.; Lu, Y.; Yu, N. Sustainability Study based on Molten Salt Energy Storage. HSET 2023, 80, 198–203. [Google Scholar] [CrossRef]
- Petri; Claar; Tison; Marianowski. “High-temperature molten salt thermal energy storage systems.” Feb. 01, 1980. Available online: https://ntrs.nasa.gov/citations/19800009285.
- Yang, S.; et al. Modelling of radiative and convective heat transfer in an open cavity volumetric receiver for a 50-MWth beam-down integrated receiver-storage concentrating solar thermal system. Renew. Energy 2025, 242, 122457. [Google Scholar] [CrossRef]
- Tang, Z.; et al. A review study for physical characteristics and engineering perspectives of dual molten salt tanks. Appl. Therm. Eng. 2026, 283, 128840. [Google Scholar] [CrossRef]
- Yu, Y.; et al. Influence of pressure boundary condition on load-following operation of molten-salt-steam-generation-system. Appl. Therm. Eng. 2025, 279, 127886. [Google Scholar] [CrossRef]
- Mahmoudinezhad, S.; Sadi, M.; Ghiasirad, H.; Arabkoohsar, A. A comprehensive review on the current technologies and recent developments in high-temperature heat exchangers. Renew. Sustain. Energy Rev. 2023, 183, 113467. [Google Scholar] [CrossRef]
- Ong, T.-C.; et al. Review on the challenges of salt phase change materials for energy storage in concentrated solar power facilities. Appl. Therm. Eng. 2024, 238, 122034. [Google Scholar] [CrossRef]
- Niknam, P. H.; Sciacovelli, A. Hybrid PCM-steam thermal energy storage for industrial processes – Link between thermal phenomena and techno-economic performance through dynamic modelling. Appl. Energy 2023, 331, 120358. [Google Scholar] [CrossRef]
- Sornek, K.; et al. Power-to-Heat and Seasonal Thermal Energy Storage: Pathways Toward a Low-Carbon Future for District Heating. Energies 2025, 18, 5577. [Google Scholar] [CrossRef]
- Kanimozhi, B.; Arnav, A.; Krishna, E. V.; Thamarai Kannan, R. Review on Phase Change Materials in Thermal Energy Storage System. AMM 2015, 766–767, 474–479. [Google Scholar] [CrossRef]
- Liu, Y.; et al. Hydrate salt/self-curing acrylic resin form-stable phase change materials with enhanced surface stability and thermal properties via the incorporation of graphene oxide. Int. J. Energy Res. 2020, 44, 5791–5805. [Google Scholar] [CrossRef]
- Boretti, A.; Nayfeh, J.; Al-Kouz, W. Validation of SAM Modeling of Concentrated Solar Power Plants. Energies 2020, 13, 1949. [Google Scholar] [CrossRef]
- Kearney, D.; et al. Assessment of a Molten Salt Heat Transfer Fluid in a Parabolic Trough Solar Field. J. Sol. Energy Eng. 2003, 125, 170–176. [Google Scholar] [CrossRef]
- Gasa, G.; Lopez-Roman, A.; Prieto, C.; Cabeza, L. F. Life Cycle Assessment (LCA) of a Concentrating Solar Power (CSP) Plant in Tower Configuration with and without Thermal Energy Storage (TES). Sustainability 2021, 13, 3672. [Google Scholar] [CrossRef]
- Ladkany, Samaan; Culbreth, William; Loyd, Nathan. Molten Salts and Applications III: Worldwide Molten Salt Technology Developments in Energy Production and Storage. JEPE 2018, 12. [Google Scholar] [CrossRef]
- Al-mahmodi, A. F.; Munusamy, Y.; Atta, M. R.; Suyambulingam, I.; Bin Mokaizh, A. A.; Muniyadi, M. Utilizing phase change materials in thermal energy systems: applications in waste heat recovery. Appl. Therm. Eng. 2025, 279, 128003. [Google Scholar] [CrossRef]
- Huang, W.; Liu, Y.; Lin, S.; Chen, W. Computational thermodynamics-assisted design of nitrate-based phase change materials for waste heat recovery. Intl J. Energy Res. 2022, 46, 14452–14461. [Google Scholar] [CrossRef]
- Prieto, C.; Borri, E.; Pavon-Moreno, M. C.; Zsembinszki, G.; Cabeza, L. F. A technical and economic comparison between concrete and latent thermal energy storage for concentrated solar power applications. Appl. Therm. Eng. 2025, 275, 126823. [Google Scholar] [CrossRef]
- Ciappi, L.; Ding, Y.; Sciacovelli, A. Design of an innovative latent heat thermal energy storage prototype with pillow plates through analytical and computational fluid dynamics modelling. Comput Therm. Scien 2026. [Google Scholar] [CrossRef]
- Przybek, A.; Hebdowska-Krupa, M.; Łach, M. Paraffin Coated with Diatomite as a Phase Change Material (PCM) in Heat Storage Systems—A Review of Research, Properties, and Applications. Materials 2025, 18, 5166. [Google Scholar] [CrossRef] [PubMed]
- Ma, S.; Yang, Q.; Li, Y.; Yan, C.; Wang, X. A review on preparation, thermal transport properties, phase-change characteristics, and thermal stability of molten salts. J. Clean. Prod. 2024, 444, 141272. [Google Scholar] [CrossRef]
- Liu, X.; Zhong, Y.; Li, J.; Wang, H.; Wang, M. A Review of High-Temperature Molten Salt for Third-Generation Concentrating Solar Power. Energy Sci. Eng. 2025, 13, 456–474. [Google Scholar] [CrossRef]
- Köse, U.; Koç, U.; Erbay, L. B.; Öğüt, E.; Ayhan, H. Heat exchanger design studies for molten salt fast reactor. EPJ Nucl. Sci. Technol. 2019, 5, 12. [Google Scholar] [CrossRef]
- Kwasi-Effaha, C. C.; Okpako, O. Comprehensive review of emerging trends in thermal energy storage mechanisms, materials and applications. Front. Energy Res. 2025, 13, 1651471. [Google Scholar] [CrossRef]
- Ong, T.-C.; et al. Review on the challenges of salt phase change materials for energy storage in concentrated solar power facilities. Appl. Therm. Eng. 2024, 238, 122034. [Google Scholar] [CrossRef]
- Flueckiger, S. M.; Garimella, S. V. Latent heat augmentation of thermocline energy storage for concentrating solar power – A system-level assessment. Appl. Energy 2014, 116, 278–287. [Google Scholar] [CrossRef]
- Bonilla, J.; De La Calle, A.; Rodríguez-García, M. M.; Roca, L.; Valenzuela, L. Study on shell-and-tube heat exchanger models with different degree of complexity for process simulation and control design. Appl. Therm. Eng. 2017, 124, 1425–1440. [Google Scholar] [CrossRef]
- Khaliquzzama, M. A.; Masuri, S. U.; Saidur, R.; Hairuddin, A. A.; Tahir, S. M.; Malek, N. A. Heat transfer analysis of molten salt nitrates inside shell and tube heat exchanger with small round holed segmental baffles for concentrated solar power. Int. J. Heat Fluid Flow 2025, 116, 109916. [Google Scholar] [CrossRef]
- Sun, F.; Ji, J.; Zeng, G.; Li, J.; Wei, G. Employment of molten salt thermal energy storage coupled to coal-fired power unit for power grid peak shaving: A thermodynamic study. J. Energy Storage 2025, 131, 117503. [Google Scholar] [CrossRef]
- Llamas, J. M.; Bullejos, D.; Ruiz De Adana, M. Optimization of 100 MWe Parabolic-Trough Solar-Thermal Power Plants Under Regulated and Deregulated Electricity Market Conditions. Energies 2019, 12, 3973. [Google Scholar] [CrossRef]
- Aarab, F.; Kuhn, B. Development of Self-Passivating, High Strength Ferritic Alloys for CSP and TES Application. SolarPACES Conf. Proc. 2024, 1. [Google Scholar] [CrossRef]
- Villada, C.; Bolívar, F.; Jaramillo, F.; Castaño, J.G.; Echeverría, F. Thermal evaluation of molten salts for solar thermal energy storage. RE&PQJ 2024, 12. [Google Scholar] [CrossRef]
- Raade, J. W.; Padowitz, D. Development of Molten Salt Heat Transfer Fluid With Low Melting Point and High Thermal Stability. J. Sol. Energy Eng. 2011, 133, 031013. [Google Scholar] [CrossRef]
- Wang, Y.; Wang, Y.; Lu, Y.; Wu, Y.; Zhang, C. Study on thermophysical properties and performance enhancement of novel quaternary molten salt for thermal energy storage. Appl. Therm. Eng. 2026, 290, 130122. [Google Scholar] [CrossRef]
- Zhang, S.; et al. , Component-dependent thermal properties of molten salt eutectics for solar thermal energy storage: Experiments, molecular simulation and applications. Appl. Therm. Eng. 2022, 209, 118333. [Google Scholar] [CrossRef]
- Xu, Z.; et al. Industrial-grade hydrated salt-based PCM thermal energy storage device: Thermal and economic performances. Appl. Therm. Eng. 2025, 262, 125233. [Google Scholar] [CrossRef]
- Xu, Q.; et al. Heat transfer efficiency enhancement of latent functional thermal fluids through multiscale interfacial modulation. Adv. Compos Hybrid. Mater. 2026, 9, 249. [Google Scholar] [CrossRef]
- Paul, D.; Biswas, N. Performance enhancement of phase change materials based thermal energy storage: Synergistic effects of fins, nanoparticles, and machine learning approach. Appl. Therm. Eng. 2026, 292, 130326. [Google Scholar] [CrossRef]
- Vignarooban, K.; Xu, X.; Arvay, A.; Hsu, K.; Kannan, A. M. Heat transfer fluids for concentrating solar power systems – A review. Appl. Energy 2015, 146, 383–396. [Google Scholar] [CrossRef]
- Zhai, W.; et al. Study on corrosion of metal materials in nitrate molten salts. in AIP Conference Proceedings, Uttar Pradesh, India, 2017; Author(s); p. 020016. [Google Scholar] [CrossRef]
- Wang, Y.; Liu, H.; Yu, G.; Hou, J.; Zeng, C. Electrochemical study of the corrosion of a Ni-based alloy GH3535 in molten (Li,Na,K)F at 700°C. J. Fluor. Chem. 2015, 178, 14–22. [Google Scholar] [CrossRef]
- Montes, M. J.; Linares, J. I.; Barbero, R.; Rovira, A. Proposal of a new design of source heat exchanger for the technical feasibility of solar thermal plants coupled to supercritical power cycles. Sol. Energy 2020, 211, 1027–1041. [Google Scholar] [CrossRef]
- Armoudli, E. “Heat Transfer and Fluid Flow Analysis of Molten Salt Heat Exchanger in a Novel Thermolysis Reactor Design for the Thermochemical Cu-Cl Cycle for Hydrogen Production,” University of Windsor, 2022. Available online: https://scholar.uwindsor.ca/etd/8915/.
- Mao; Park, J. H.; Han, G. Y.; Seo, T.; Kang, Y. Heat transfer characteristics of high temperature molten salt for storage of thermal energy. Korean J. Chem. Eng. 2010, 27, 1452–1457. [Google Scholar] [CrossRef]
- Zauner. “Development of latent heat storages using polymers as phase change material for applications in industry, solar energy and heat networks,” TU Wien, Wien, 2019. Available online: https://repositum.tuwien.at/handle/20.500.12708/1755.
- Chen, Y.-S.; et al. , Thermal sizing design and experimental evaluation of molten salt-to-air heat exchanger. Ann. Nucl. Energy 2019, 132, 504–511. [Google Scholar] [CrossRef]
- Salvatore, G. Design and Optimization of a Sodium-Molten Salt Heat Exchanger for Concentrating Solar Power applications. Available online: https://www.diva-portal.org/smash/record.jsf?pid=diva2%3A1461996&dswid=8343.
- VDI, e. V. (Ed.) VDI-Wärmeatlas; Springer Berlin Heidelberg: Berlin, Heidelberg, 2013. [Google Scholar] [CrossRef]
- Opolot, M.; Zhao, C.; Liu, M.; Mancin, S.; Bruno, F.; Hooman, K. A review of high temperature ( ≥ 500 °C) latent heat thermal energy storage. Renew. Sustain. Energy Rev. 2022, 160, 112293. [Google Scholar] [CrossRef]
- Pardillos-Pobo, D.; González-Gómez, P. A.; Laporte-Azcué, M.; Cholette, M. E.; Santana, D. Design of coil-wound heat exchangers for molten chloride salt TES in CSP with sodium receiver and sCO2 cycle. J. Energy Storage 2025, 128, 117210. [Google Scholar] [CrossRef]
- Daryabeigi, K. Thermal Modeling and Testing of High- Temperature Refractory Ceramic Insulation Felts. Apr 2024. Available online: https://ntrs.nasa.gov/api/citations/20240003609/downloads/NASA-TM-20240003609.pdf.
- Thermal conductivity of BCTEX-fleece. Available online: https://www.horst.de/abf1100000100000.
- Kolich, M.; Hoke, P.; Dooge, D.; Doroudian, M.; Litovsky, E.; Kleiman, J. Influence of temperature and mechanical compression on thermophysical properties of car interior foam plastics insulation. J. Elastomers Plast. 2014, 46, 132–143. [Google Scholar] [CrossRef]
- MartÍnez-DÍez, J. A.; RodrÍguez-PÉRez, M. A.; De Saja, J. A.; Arcos Y RÁbago, L. O.; Almanza, O. A. The Thermal Conductivity of a Polyethylene Foam Block Produced by a Compression Molding Process. J. Cell. Plast. 2001, 37, 21–42. [Google Scholar] [CrossRef]
- Bardy, E. R.; Mollendorf, J. C.; Pendergast, D. R. Thermal Conductivity and Compressive Strain of Aerogel Insulation Blankets Under Applied Hydrostatic Pressure. J. Heat Transf. 2007, 129, 232–235. [Google Scholar] [CrossRef]
- Glombikova, V.; Komarkova, P.; Hercikova, E.; Havelka, A. How High-Loft Textile Thermal Insulation Properties Depend on Compressibility. Autex Res. J. 2020, 20, 338–343. [Google Scholar] [CrossRef]
- Kislinger, C.; Daurer, G.; Schwarz, S.; Demuth, M.; Gaber, C.; Hochenauer, C. CFD study of hydrogen combustion effects on the heat-up characteristics of steel samples using a low-swirl burner: A comparative analysis with methane. Appl. Therm. Eng. 2025, 261, 125105. [Google Scholar] [CrossRef]
- Prieler, R.; et al. Fire resistance of gypsum-sheathed stud walls with an embedded steel door: Validation of a numerical approach. Fire Saf. J. 2023, 141, 103922. [Google Scholar] [CrossRef]
- Raič, J.; et al. Validation of a coupled 3D CFD simulation model for an oxy-fuel cross-fired glass melting furnace with electric boosting. Appl. Therm. Eng. 2021, 195, 117166. [Google Scholar] [CrossRef]
- Mayrhofer, M.; Koller, M.; Seemann, P.; Bordbar, H.; Prieler, R.; Hochenauer, C. MILD combustion of hydrogen and air – An efficient modelling approach in CFD validated by experimental data. Int. J. Hydrogen Energy 2022, 47, 6349–6364. [Google Scholar] [CrossRef]
- Bonanos, M.; Georgiou, M. C.; Stokos, K. G.; Papanicolas, C. N. Engineering aspects and thermal performance of molten salt transfer lines in solar power applications. Appl. Therm. Eng. 2019, 154, 294–301. [Google Scholar] [CrossRef]
- Ferrara; Yenetchi; Haslett; Kosson. Thermal energy storage heat exchanger: Molten salt heat exchanger design for utility power plants. Oct 1977. Available online: https://ntrs.nasa.gov/citations/19780006689.
- Ji, G.-J.; Gu, J.-M.; Chen, Z.; Lu, B.-B.; Gao, Y. Experimental research on heat transfer characteristic of HITEC molten salt in evacuated tube solar collector. Front. Energy Res. 2023, 11, 1150326. [Google Scholar] [CrossRef]
- Han, Z.; Wickramaratne, C.; Yogi Goswami, D.; Jotshi, C. Experimental study on operating characteristics of nitrate salt-based latent heat thermal energy storage unit. Appl. Therm. Eng. 2022, 202, 117846. [Google Scholar] [CrossRef]
- Zhao, Y.; Viverito, T.; Bowers, R.; Kimbal, C.; Aytas, T.; Olivetti, E. An Innovative Design of High-Temperature, Sensible Molten Salt Thermal Energy Storage Systems With Geopolymer Insulation. Jan 2024. Available online: https://docs.nrel.gov/docs/fy24osti/88400.pdf.
- Thermo - Solar Salts. Available online: https://sqm-ynv.com/wp-content/uploads/2018/05/Solar-salts-Book-eng.pdf.
- Georgousis, N.; Diriken, J.; Speetjens, M.; Rindt, C. Comprehensive review on packed-bed sensible heat storage systems. J. Energy Storage 2025, 121, 116516. [Google Scholar] [CrossRef]
- Brent, D.; Voller, V. R.; Reid, K. J. ENTHALPY-POROSITY TECHNIQUE FOR MODELING CONVECTION-DIFFUSION PHASE CHANGE: APPLICATION TO THE MELTING OF A PURE METAL. Numer. Heat Transf. 1988, 13, 297–318. [Google Scholar] [CrossRef]
- Moreira, M.; Silva, T.; Dias-de-Oliveira, J.; Neto, F.; Amaral, C. Numerical modelling of radiant systems and phase change materials in building applications - a review. Appl. Therm. Eng. 2023, 234, 121342. [Google Scholar] [CrossRef]
- Anagnostopoulos; Alexiadis, A.; Ding, Y. Molecular dynamics simulation of solar salt (NaNO3-KNO3) mixtures. Sol. Energy Mater. Sol. Cells 2019, 200, 109897. [Google Scholar] [CrossRef]
- Aguanno, D.’.; Karthik, M.; Grace, A. N.; Floris, A. Thermostatic properties of nitrate molten salts and their solar and eutectic mixtures. Sci. Rep. 2018, 8, 10485. [Google Scholar] [CrossRef] [PubMed]
- Zhao, Q.-G.; Hu, C.-X.; Liu, S.-J.; Guo, H.; Wu, Y.-T. The thermal conductivity of molten NaNO3, KNO3, and their mixtures. Energy Procedia 2017, 143, 774–779. [Google Scholar] [CrossRef]
- Ibrahim, H. Peng; Riaz, A.; Abdul Basit, M.; Rashid, U.; Basit, A. Molten salts in the light of corrosion mitigation strategies and embedded with nanoparticles to enhance the thermophysical properties for CSP plants. Sol. Energy Mater. Sol. Cells 2021, 219, 110768. [Google Scholar] [CrossRef]
- material values of alloy 600. Available online: https://woite-edelstahl.com/alloy600en.html.
- Ma, S.; Yang, Q.; Li, Y.; Yan, C.; Wang, X. A review on preparation, thermal transport properties, phase-change characteristics, and thermal stability of molten salts. J. Clean. Prod. 2024, 444, 141272. [Google Scholar] [CrossRef]
- Zuo, J.; Luo, H.; Ling, Z.; Zhang, Z.; Fang, X.; Zhang, W. Preparation of inorganic molten salt composite phase change materials and study on their electrothermal conversion properties. Ind. Chem. Mater. 2024, 2, 571–586. [Google Scholar] [CrossRef]
- Lee, D.; Jo, B. Thermal energy storage characteristics of binary molten salt nanofluids: Specific heat and latent heat. Int. J. Energy Res. 2021, 45, 3231–3241. [Google Scholar] [CrossRef]
- Sabharwall, P.; Clark, D.; Glazoff, M.; Zheng, G.; Sridharan, K.; Anderson, M. Advanced heat exchanger development for molten salts. Nucl. Eng. Des. 2014, 280, 42–56. [Google Scholar] [CrossRef]
- Du, B.-C.; He, Y.-L.; Qiu, Y.; Liang, Q.; Zhou, Y.-P. Investigation on heat transfer characteristics of molten salt in a shell-and-tube heat exchanger. Int. Commun. Heat Mass Transf. 2018, 96, 61–68. [Google Scholar] [CrossRef]
- Trevisan, S.; Buchbjerg, B.; Guedez, R. Power-to-heat for the industrial sector: Techno-economic assessment of a molten salt-based solution. Energy Convers. Manag. 2022, 272, 116362. [Google Scholar] [CrossRef]
- Ma, Y.; Cao, Y.; Si, F. Multi-objective optimization design of hybrid molten salt-phase change salt thermal energy storage system: An enhanced peak shaving scheme of ultra-supercritical coal-fired power plant. J. Energy Storage 2025, 127, 117145. [Google Scholar] [CrossRef]
- Tamraparni; Rendall, J.; Shen, Z.; Hun, D.; Shrestha, S. Experimental investigation on phase change material–based finned tube heat exchanger for thermal energy storage and building envelope thermal management. Appl. Therm. Eng. 2025, 273, 126490. [Google Scholar] [CrossRef]
- Li, Z.; Brun, N. L.; Gasparrini, C.; Markides, C. N. A novel nonlinear radiative heat exchanger for molten-salt applications. Appl. Therm. Eng. 2023, 225, 120157. [Google Scholar] [CrossRef]
- Raj, K.; Desai, N. B.; Haglind, F. Numerical Analysis of Solidification in Molten Salt-Air Shell-and-Tube Heat Exchangers. In in ASME 2024 18th International Conference on Energy Sustainability; American Society of Mechanical Engineers: Anaheim, California, USA, Jul 2024; p. V001T06A005. [Google Scholar] [CrossRef]
- Wu, Z.; Li, X.-L.; Fang, T.; Xia, X.-L.; Zhang, H.-M. Bio-inspired lightweight heat exchange element for enhanced melting performance in PCM storage. J. Energy Storage 2025, 131, 117593. [Google Scholar] [CrossRef]
- Hu, W.; Bai, Y.; Chang, M.; Du, Y.; Wang, D. Numerical models with an equivalent thermal conductivity approach for heat release characteristic in densely packed PCM-based finned-tube heat exchangers. J. Energy Storage 2025, 127, 117087. [Google Scholar] [CrossRef]
- Yang, P.; Wang, Y.; Yu, Y.; Wu, X. Numerical investigations on performance improvement of molten salt-based horizontal latent heat thermal energy storage unit with optimized structures. J. Energy Storage 2024, 98, 113203. [Google Scholar] [CrossRef]
- Niknam, P. H.; Ciappi, L.; Sciacovelli, A. Latent heat thermal energy storage system with pillow-plate heat exchangers topology – Assessment of thermo-fluid dynamic performance and application potential. Appl. Therm. Eng. 2025, 265, 125606. [Google Scholar] [CrossRef]
Figure 1.
Test rig flow diagram.
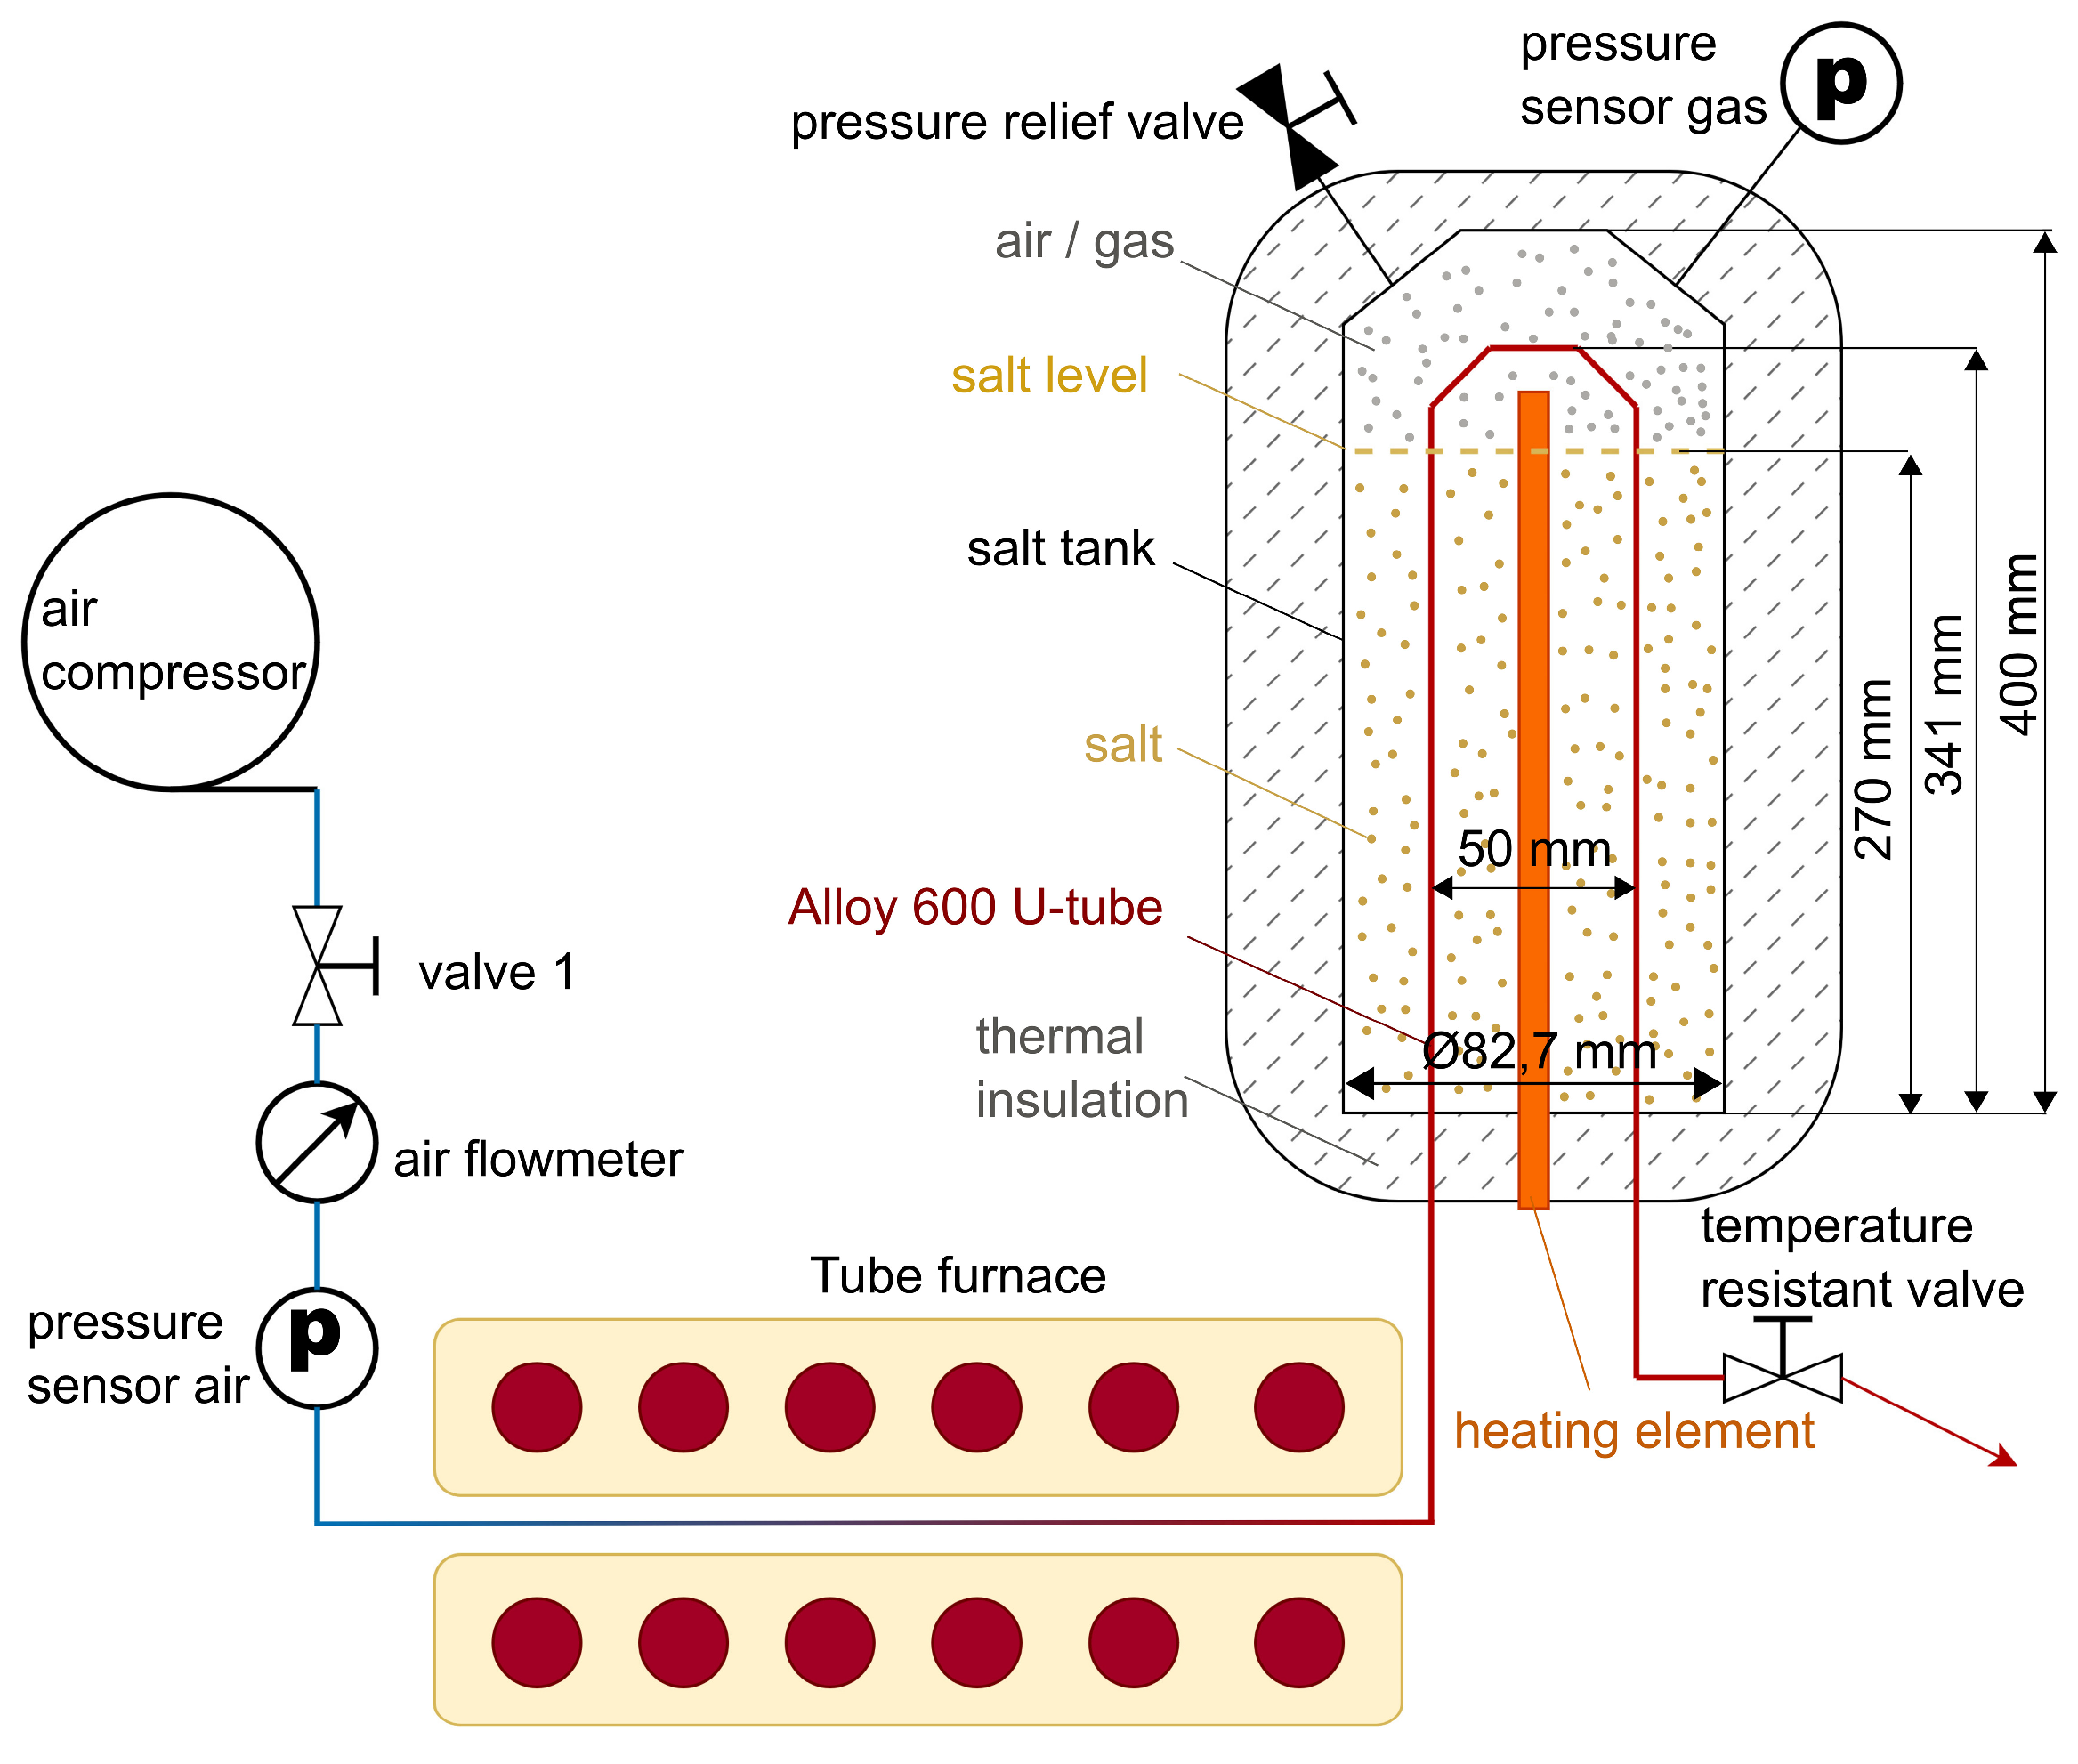
Figure 2.
salt tank with measurement points and liquid salt filling level in 2 cross sections.
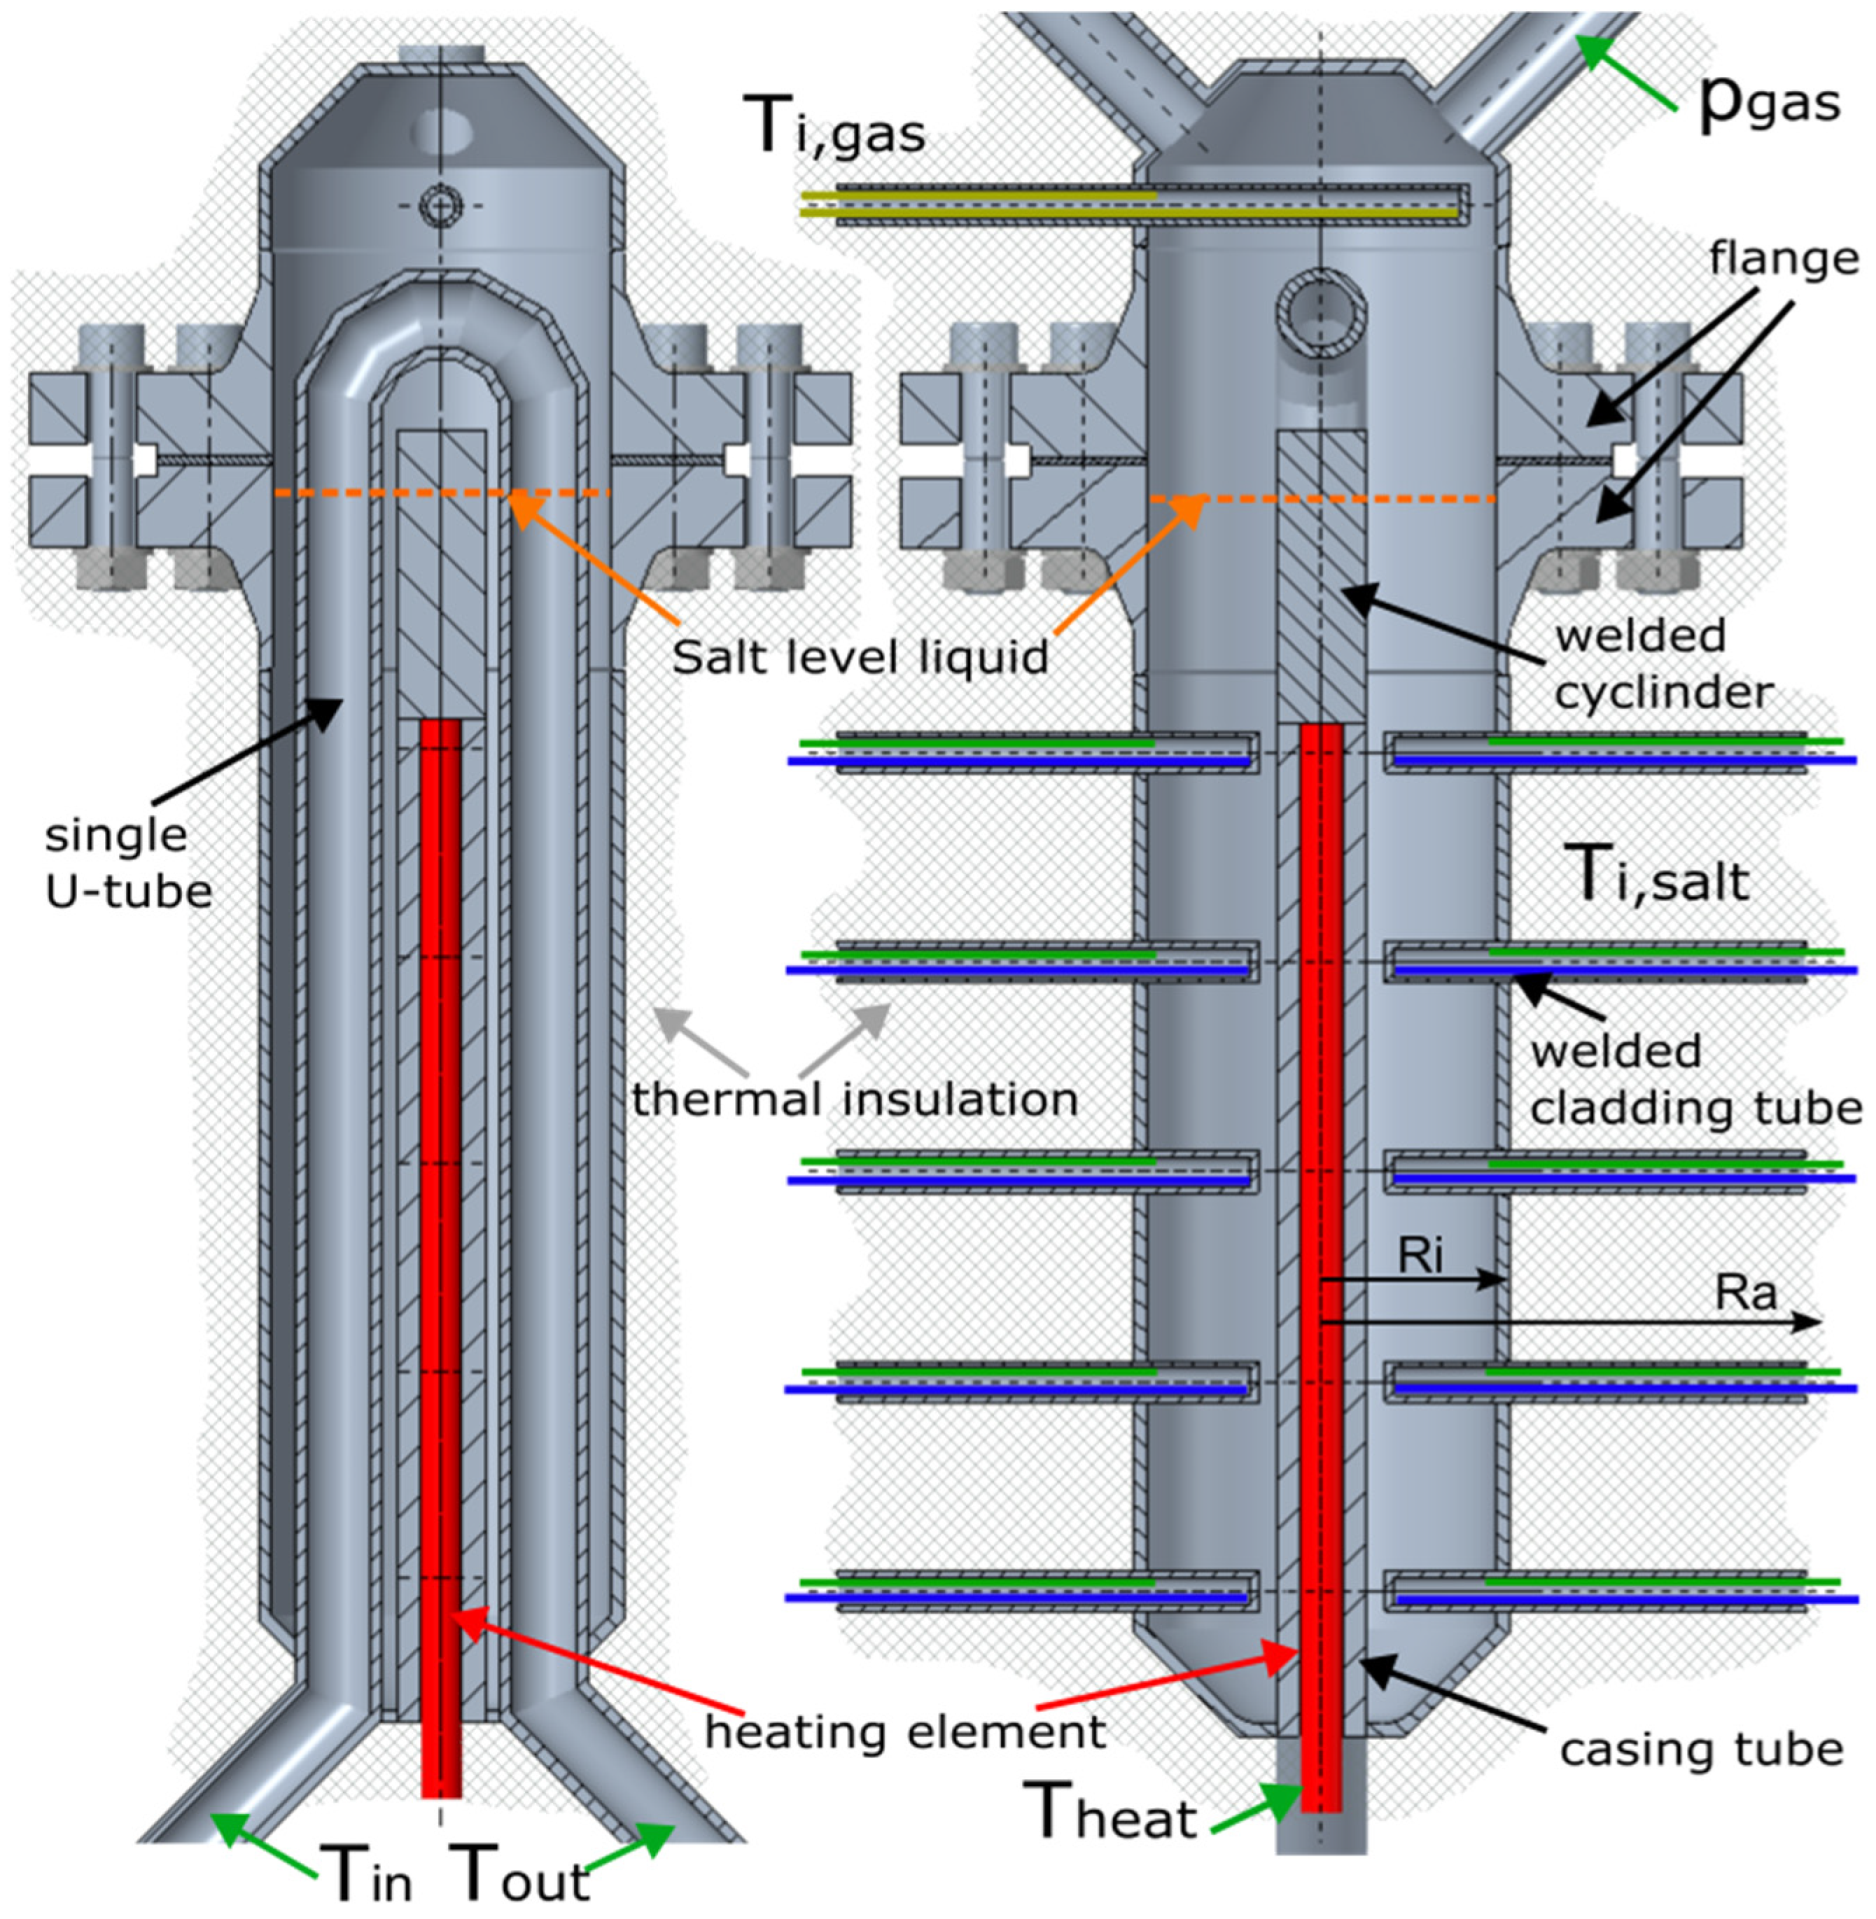
Figure 3.
Thermal insulation of salt tank; 1 layer- (left), 2 layers- (middle), 3 layers (right)- of thermal insulation.
Figure 3.
Thermal insulation of salt tank; 1 layer- (left), 2 layers- (middle), 3 layers (right)- of thermal insulation.
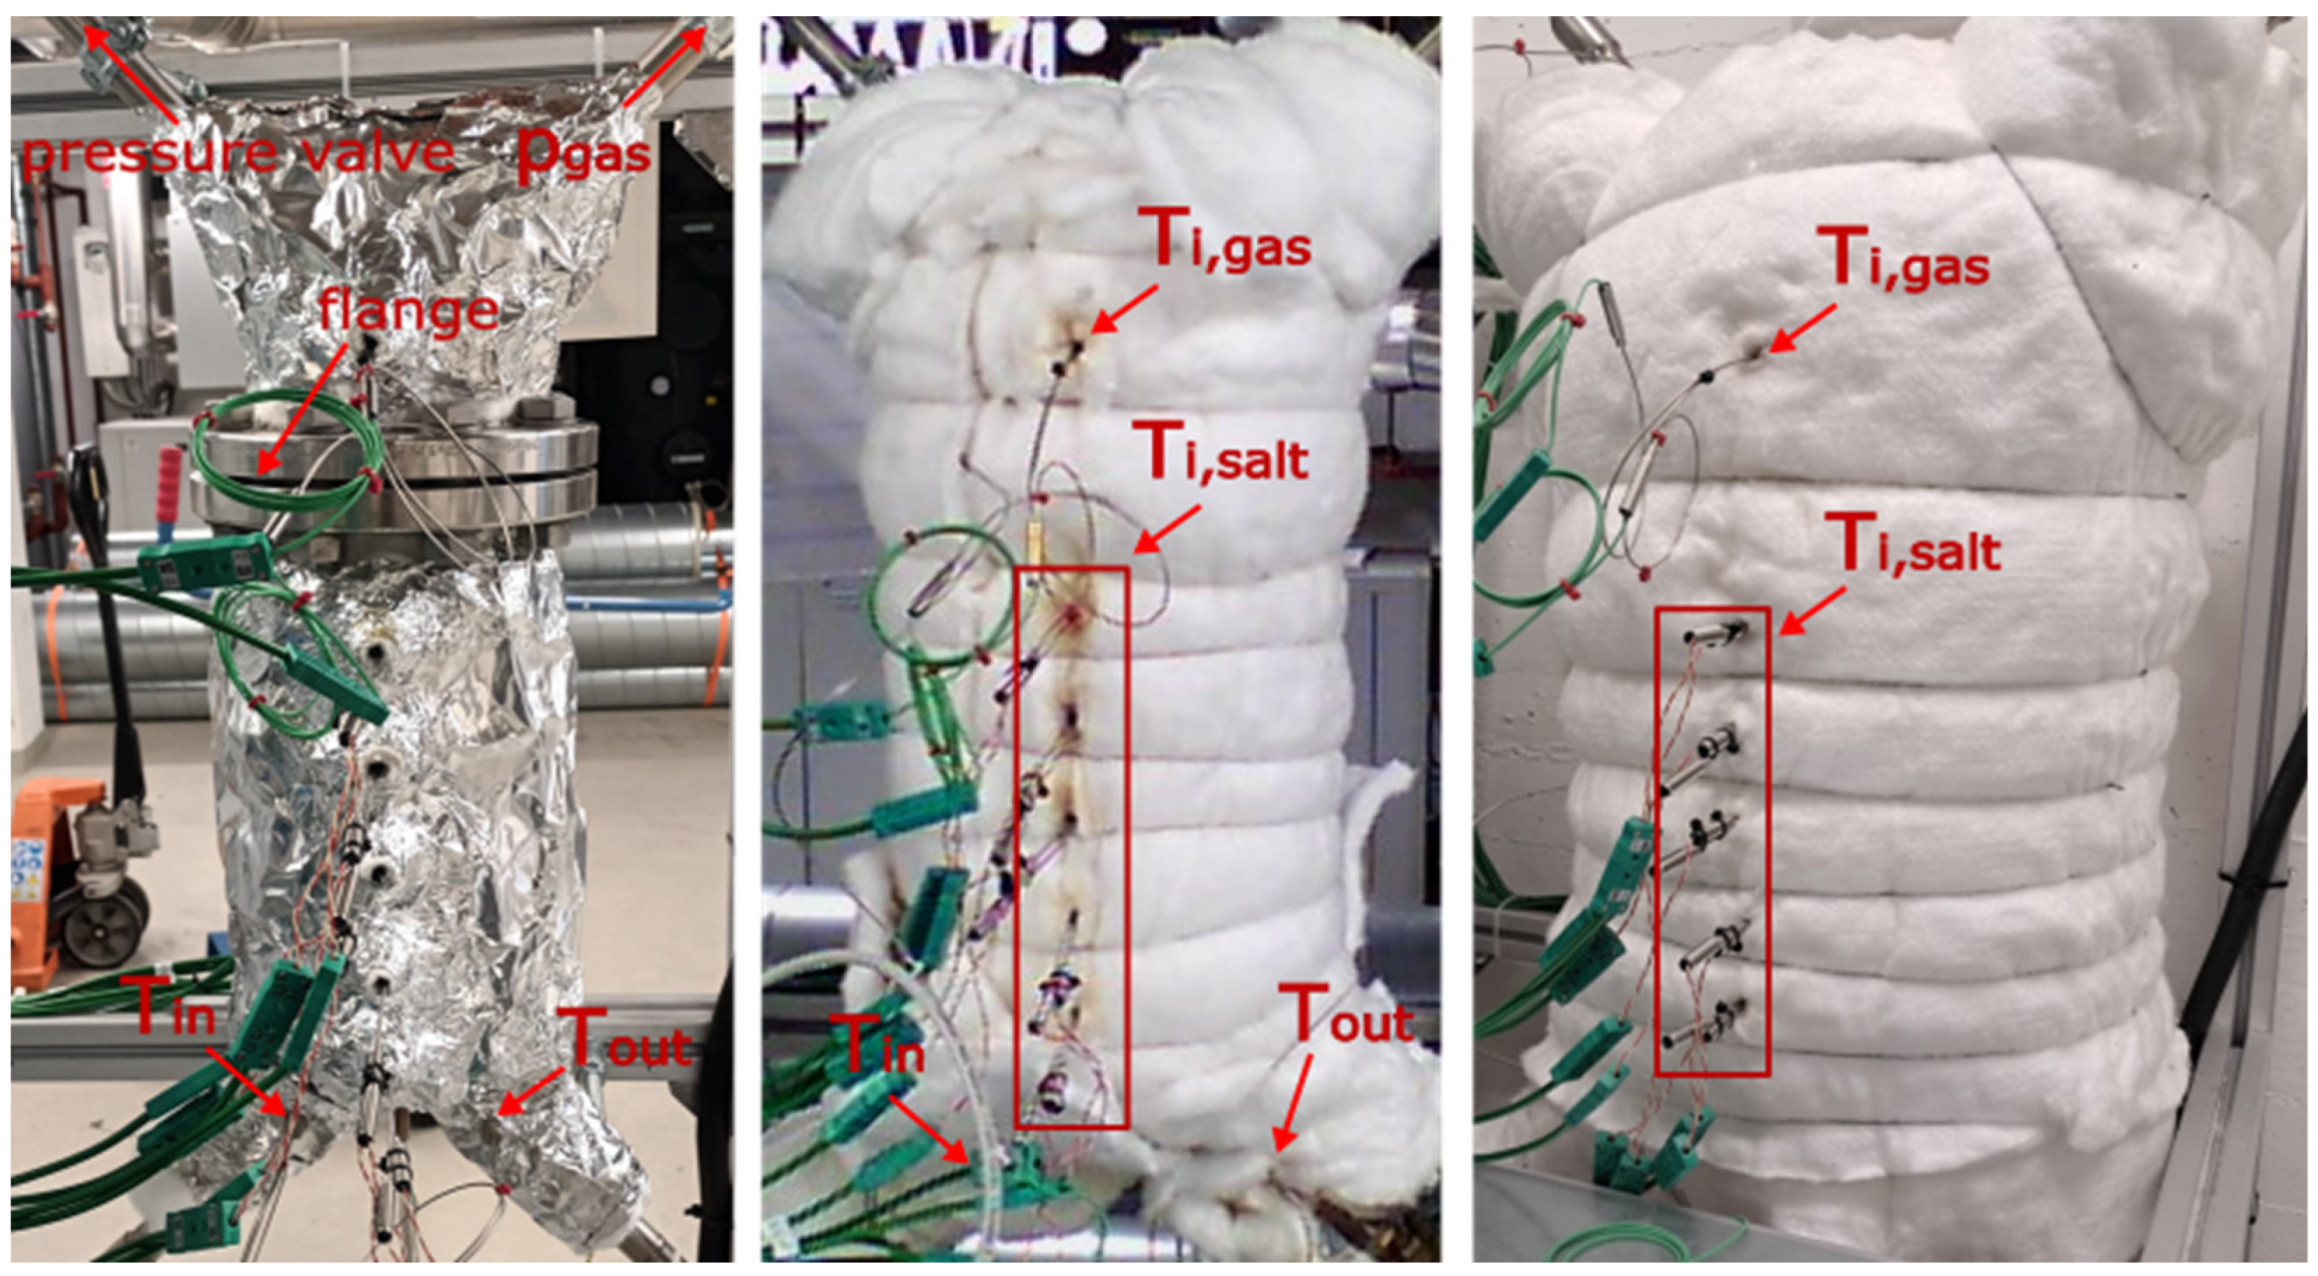
Figure 4.
Thermal conductivity of the insulation of the salt tank as a function of the salt temperature under steady-state operating conditions.
Figure 4.
Thermal conductivity of the insulation of the salt tank as a function of the salt temperature under steady-state operating conditions.
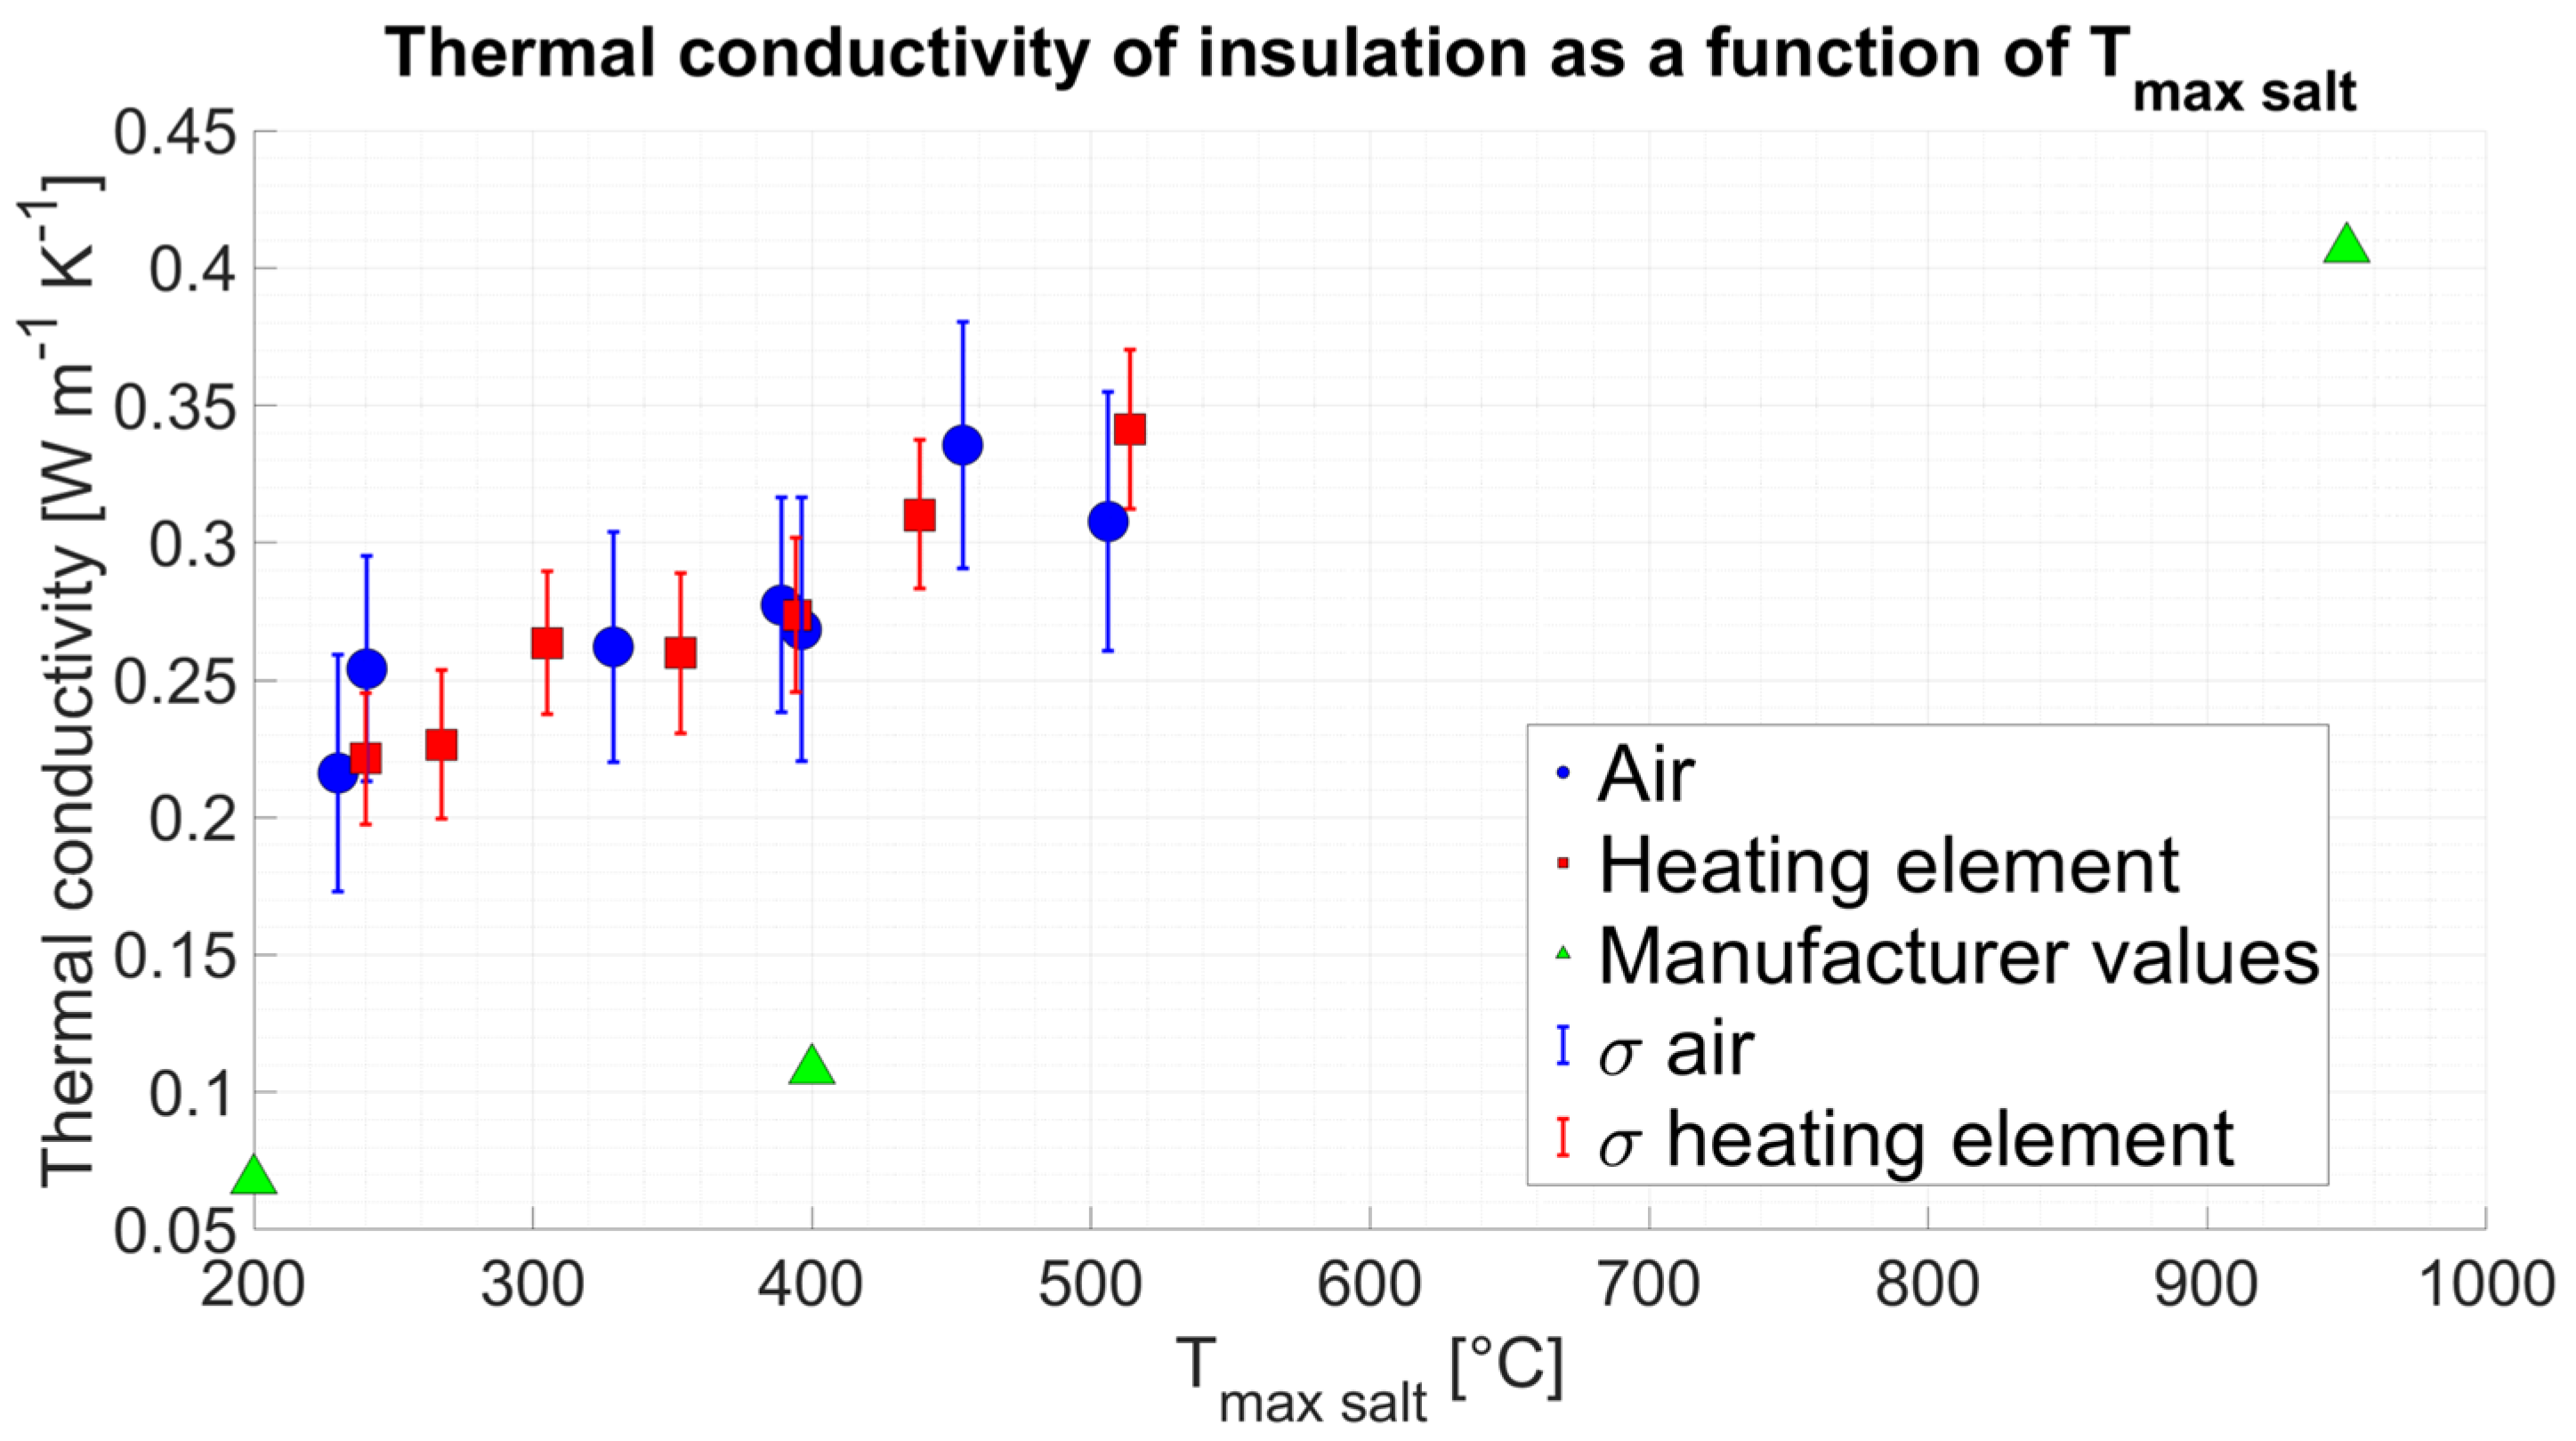
Figure 5.
Measurement data of transient heat storage experiments.
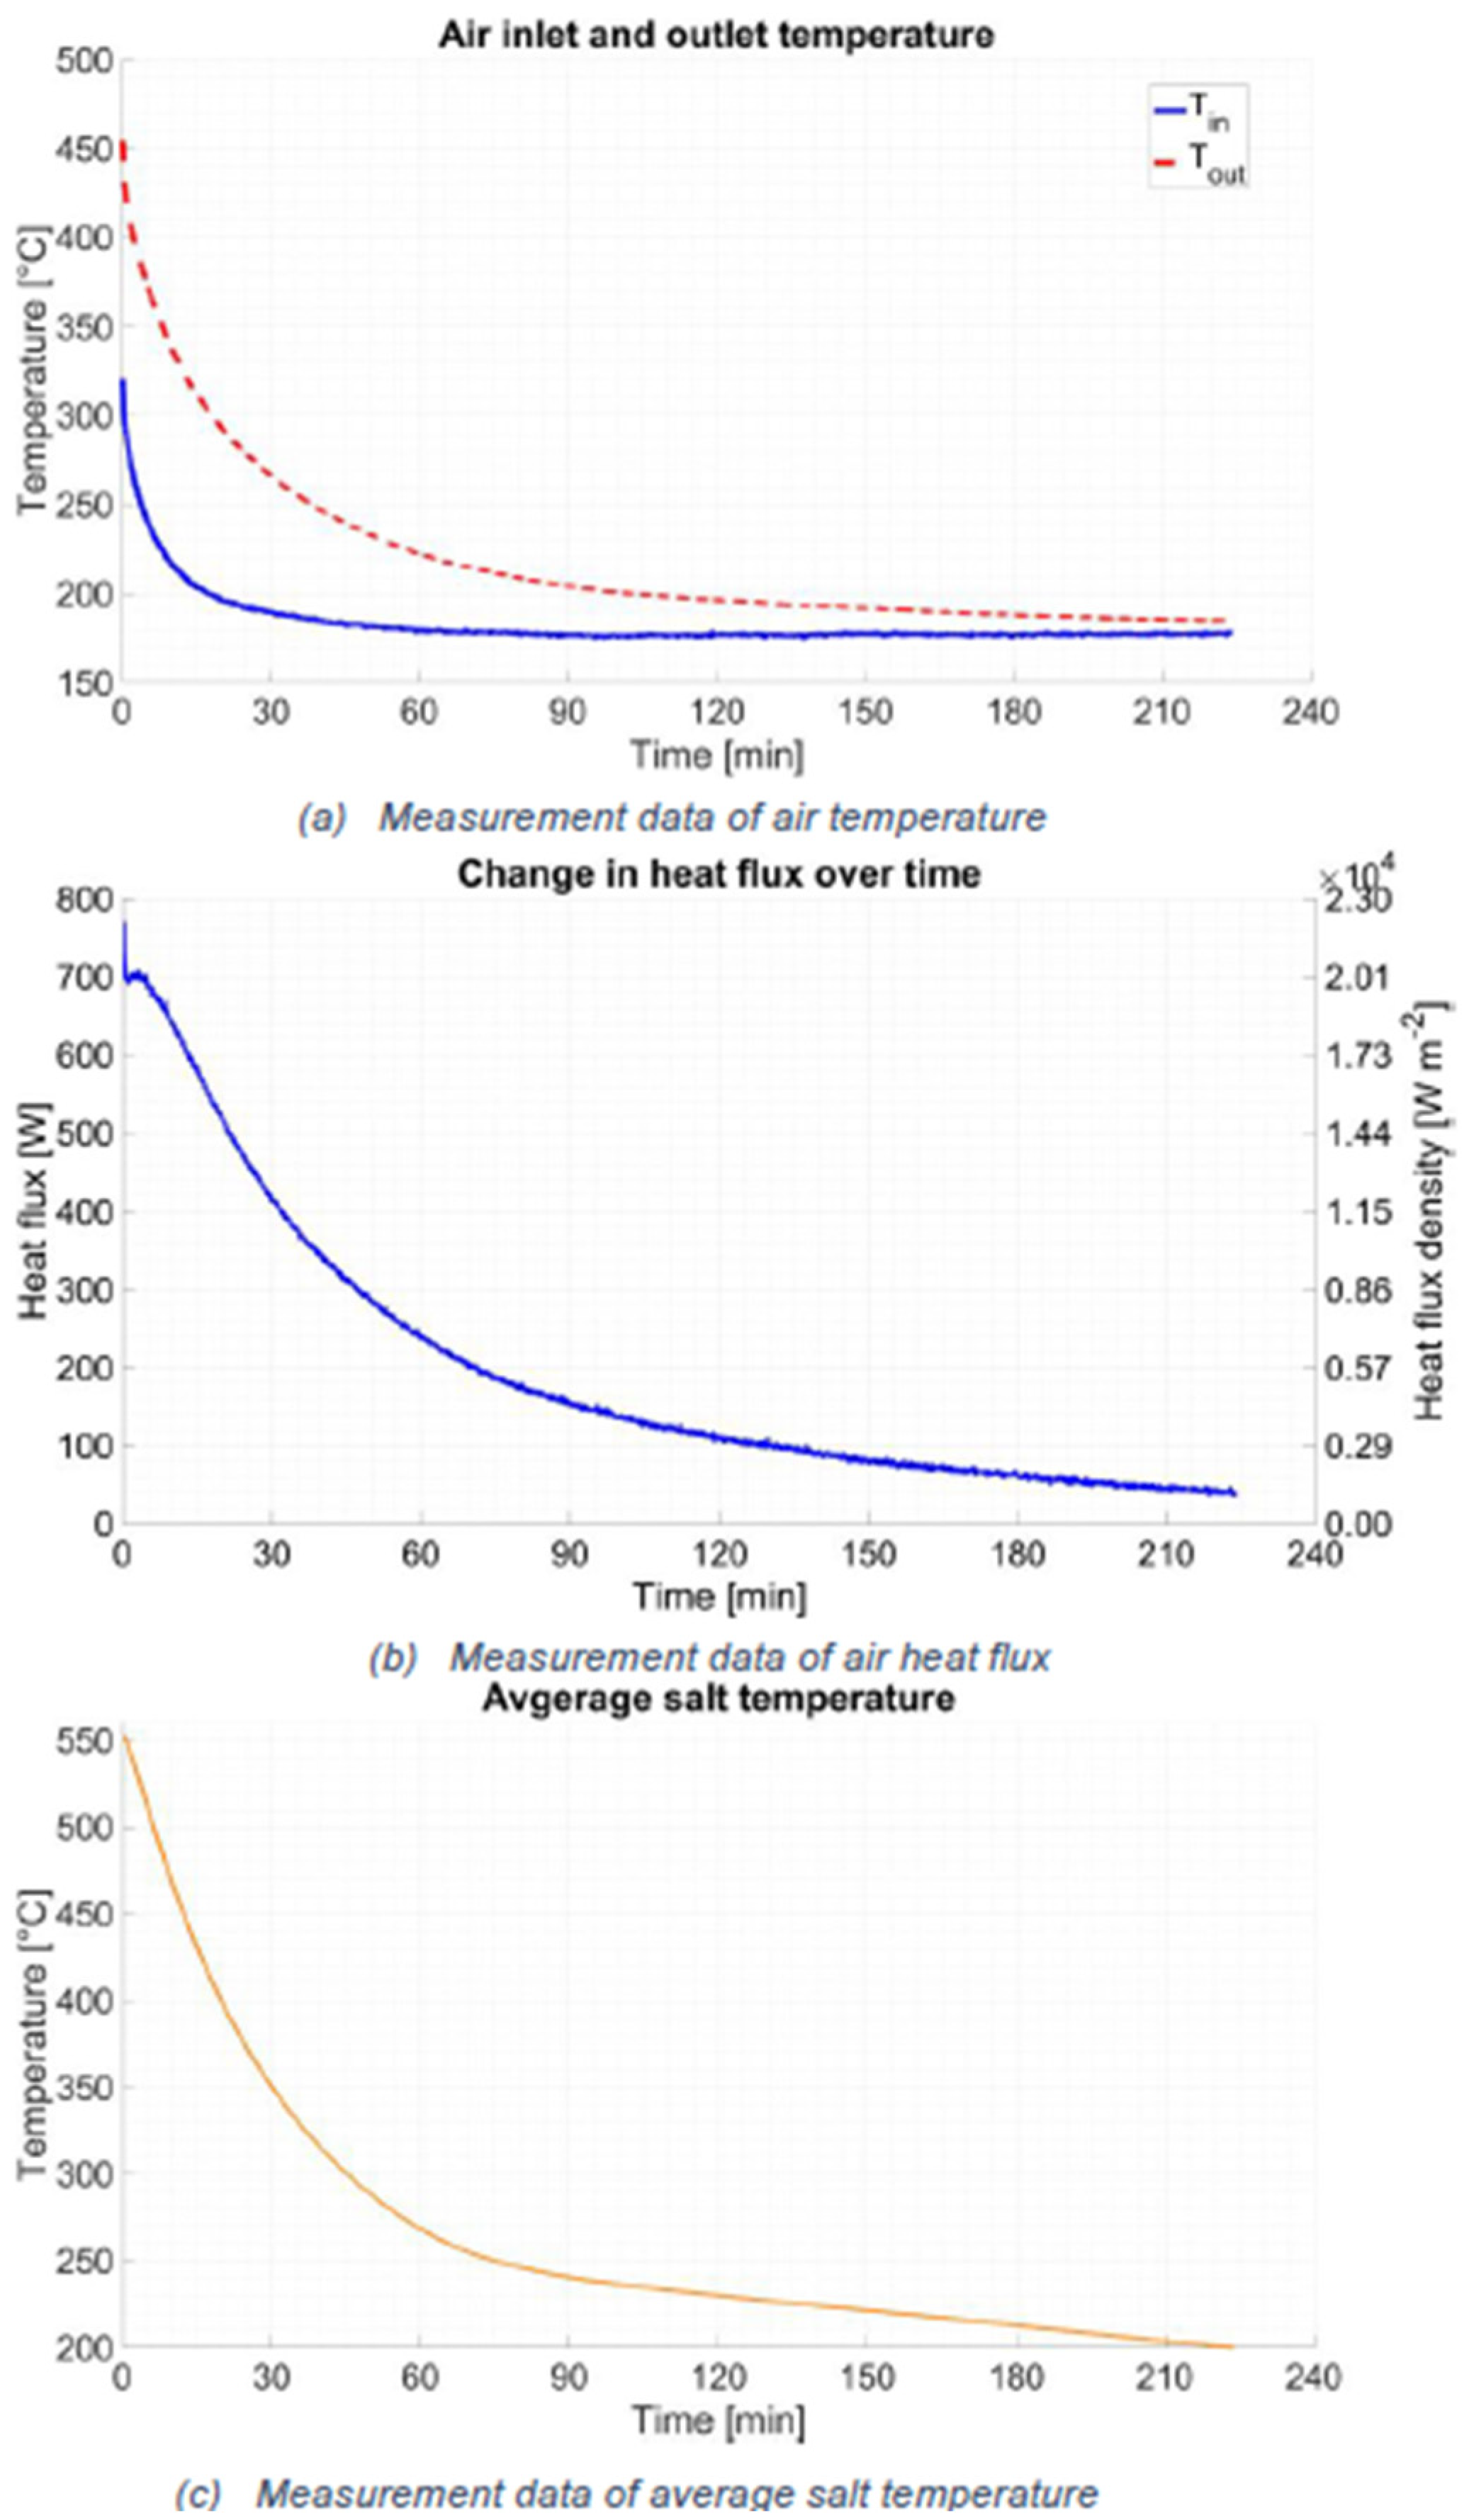
Figure 6.
Thermal discharging process with constant air mass flow of 0.0052 kg/s and variable inlet air temperature.
Figure 6.
Thermal discharging process with constant air mass flow of 0.0052 kg/s and variable inlet air temperature.
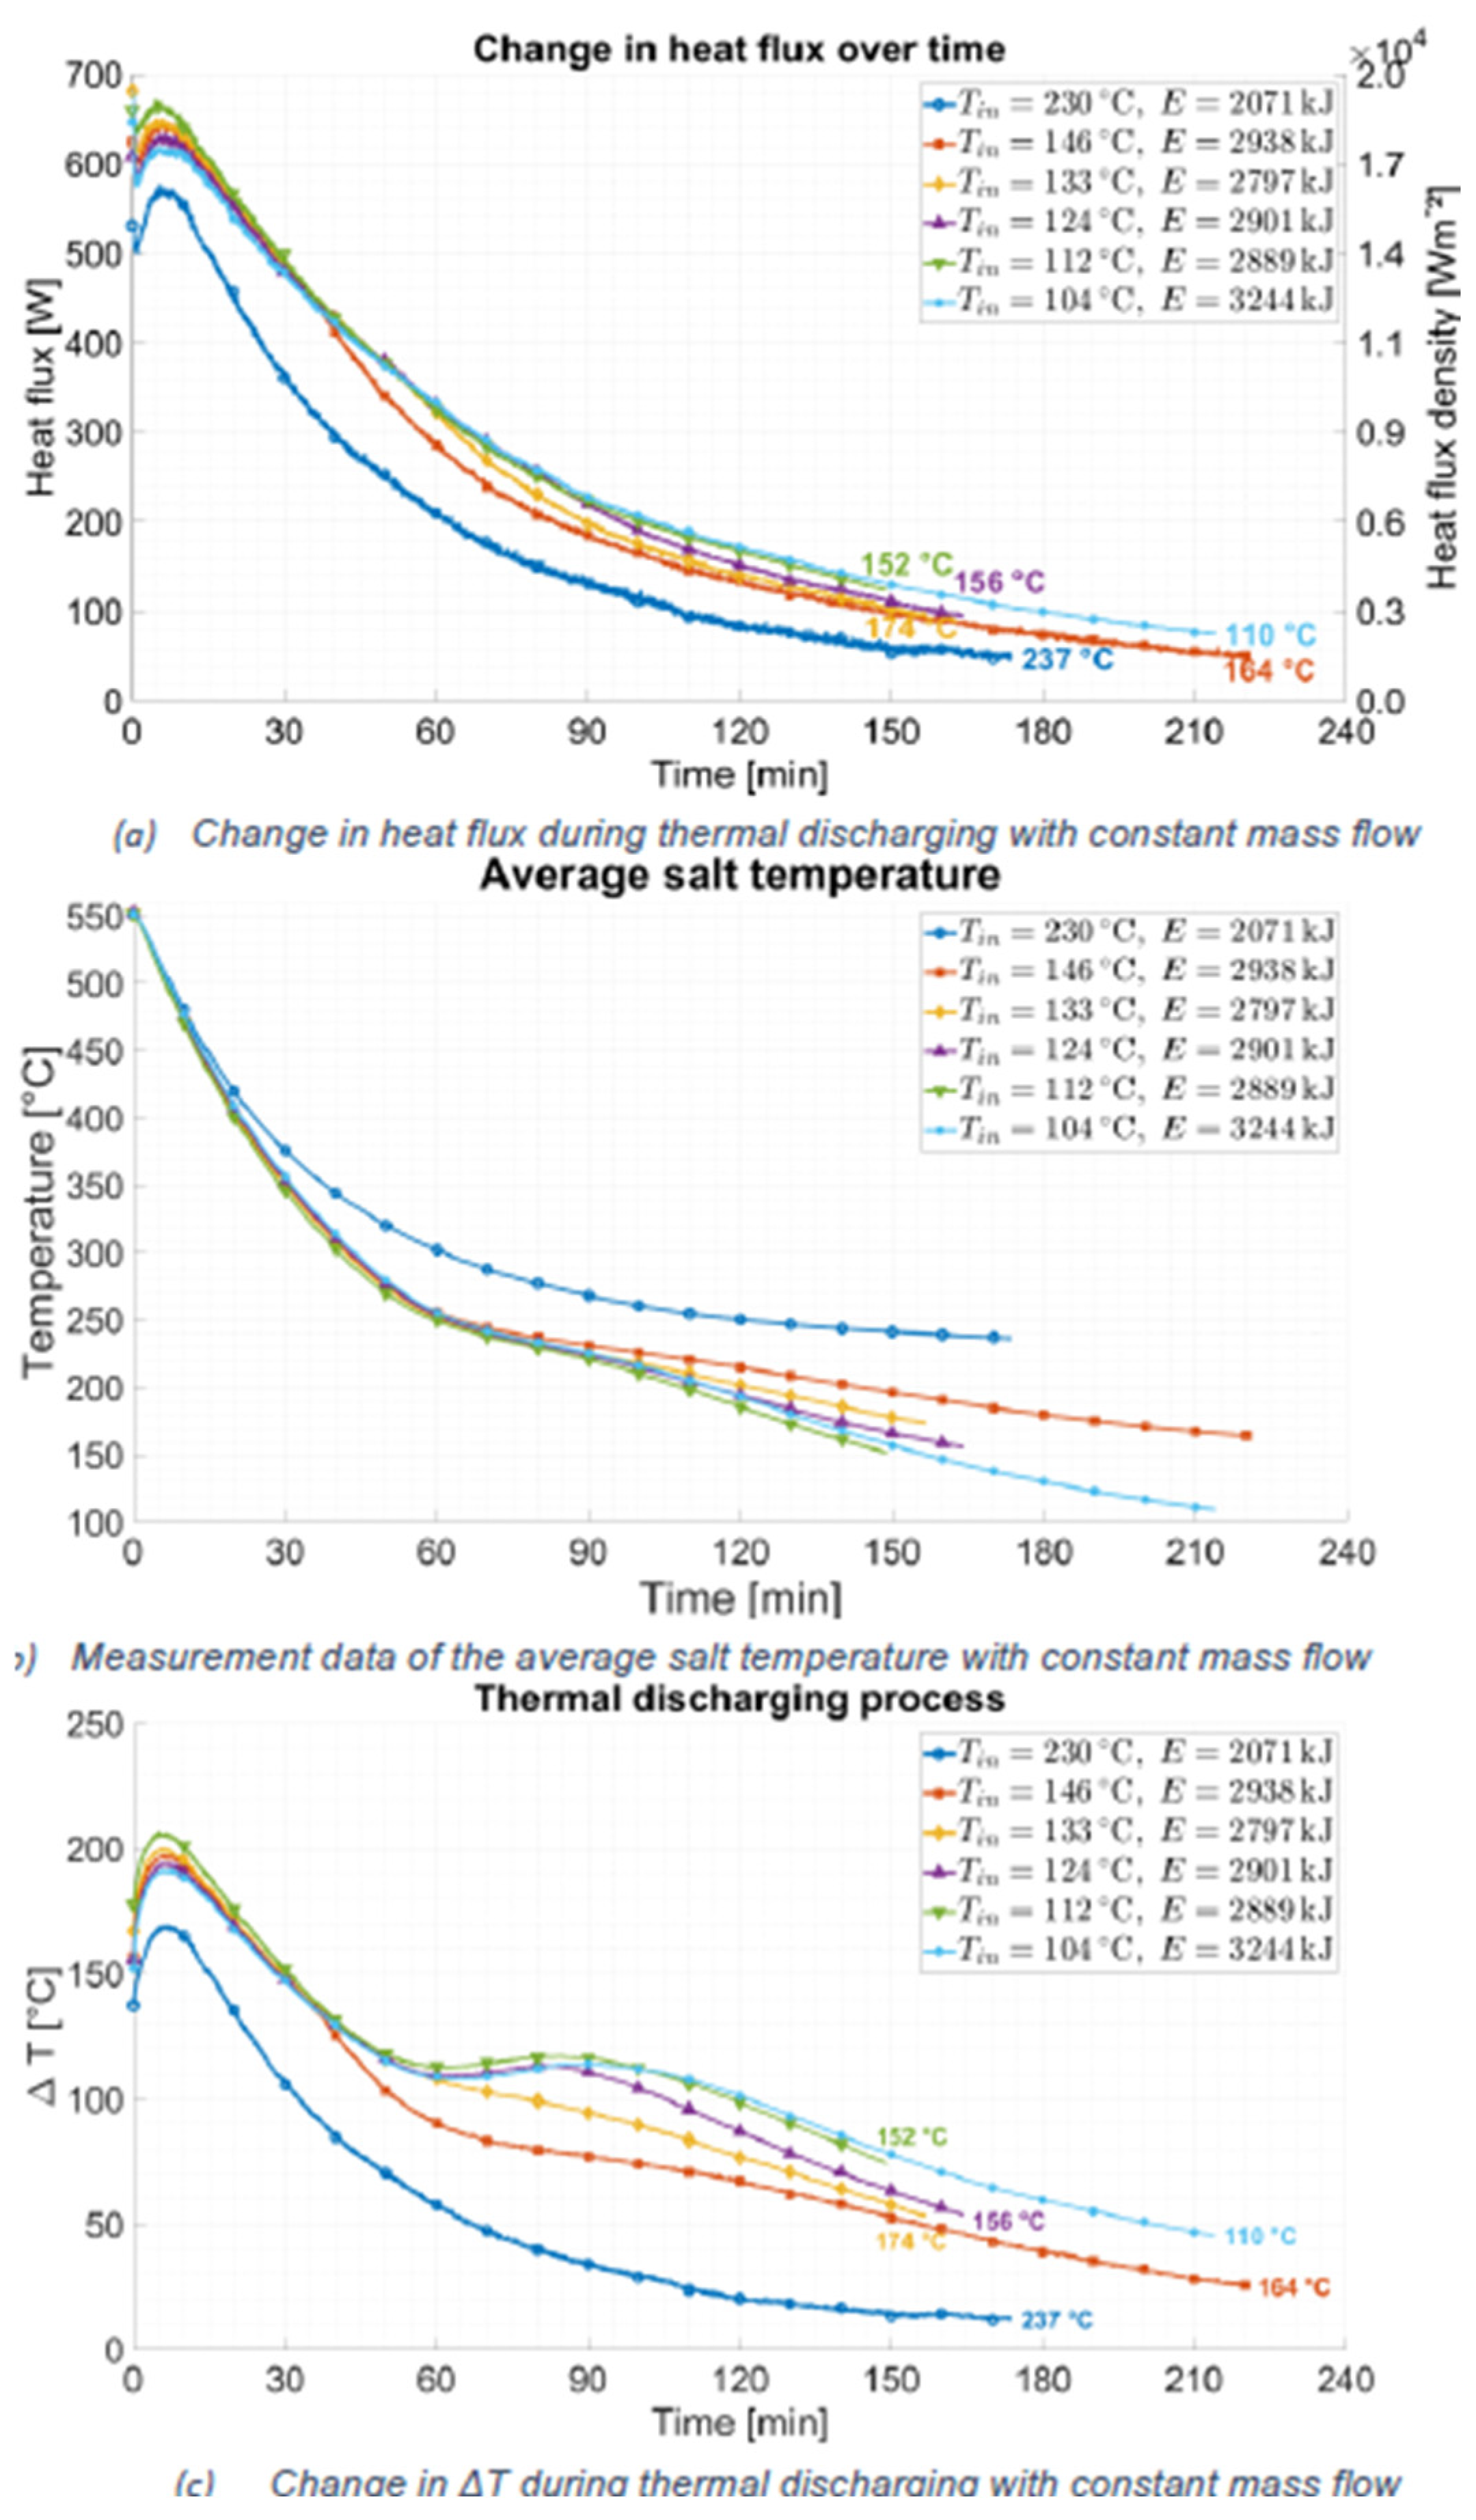
Figure 7.
Thermal discharging process with variable air mass flow and constant inlet air temperature of 85°C.
Figure 7.
Thermal discharging process with variable air mass flow and constant inlet air temperature of 85°C.
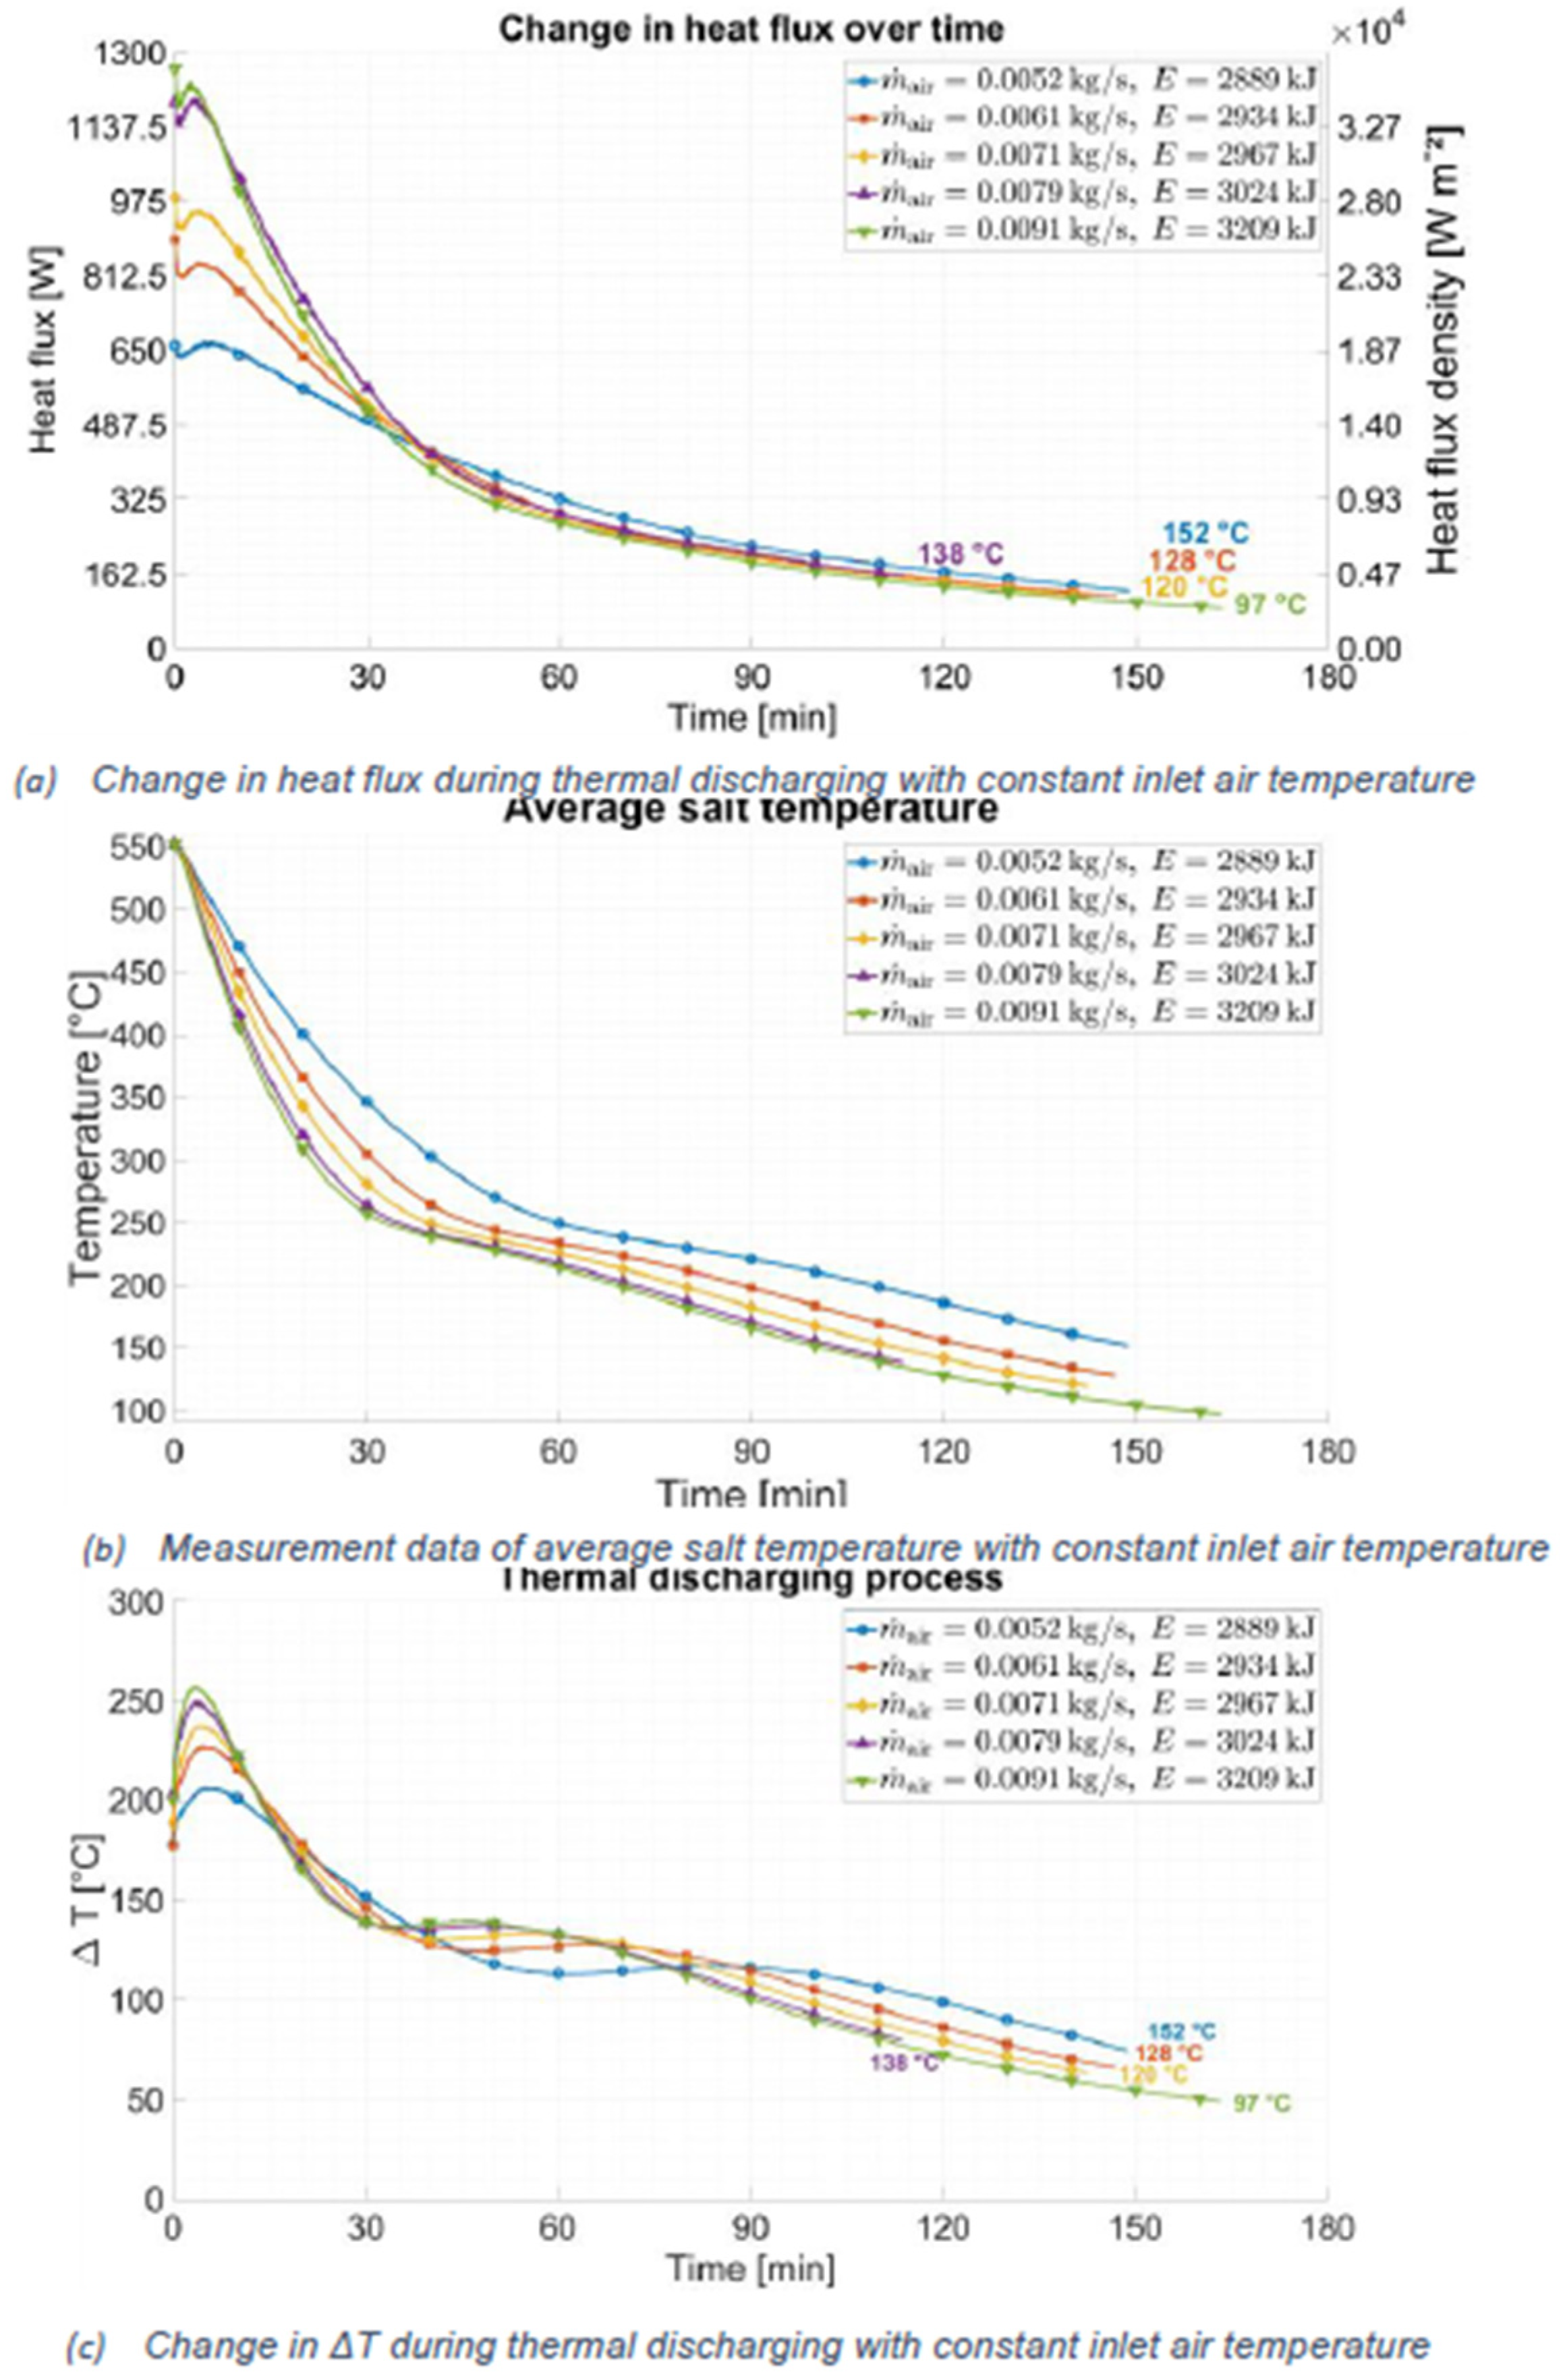
Figure 8.
Energy balance of experimental data – air vs. TES (salt +metal + latent heat).
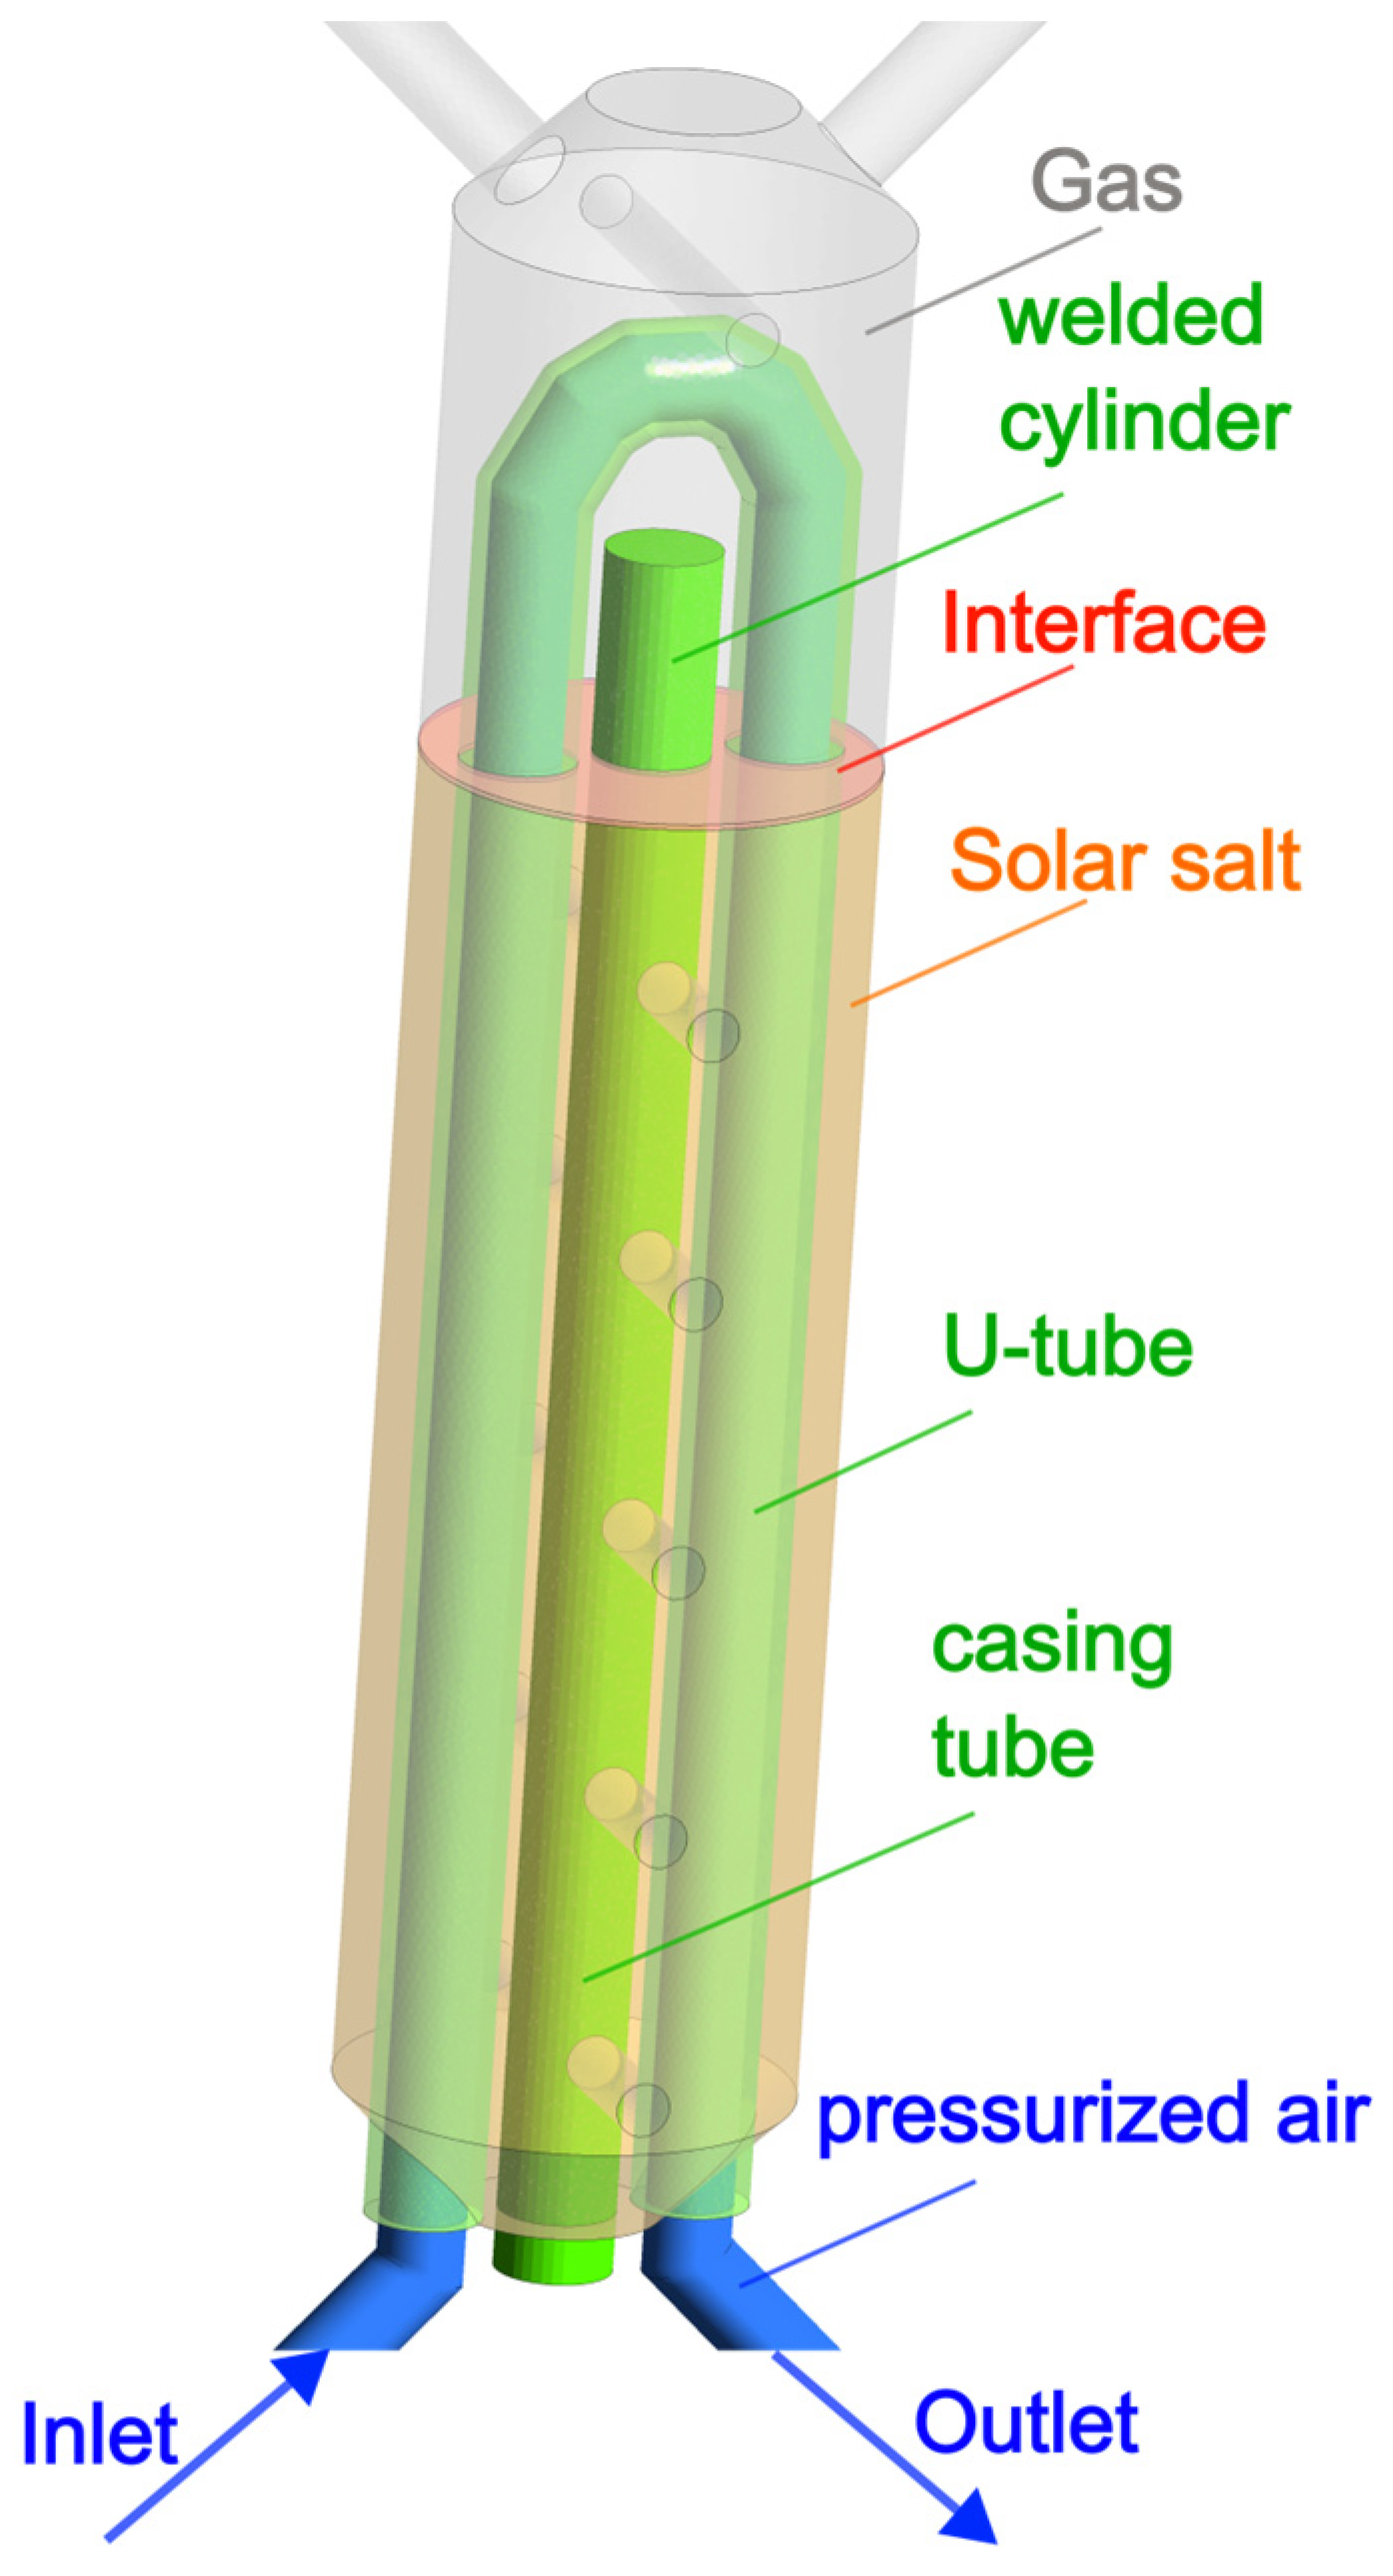
Figure 9.
CAD geometry of the experimental setup.
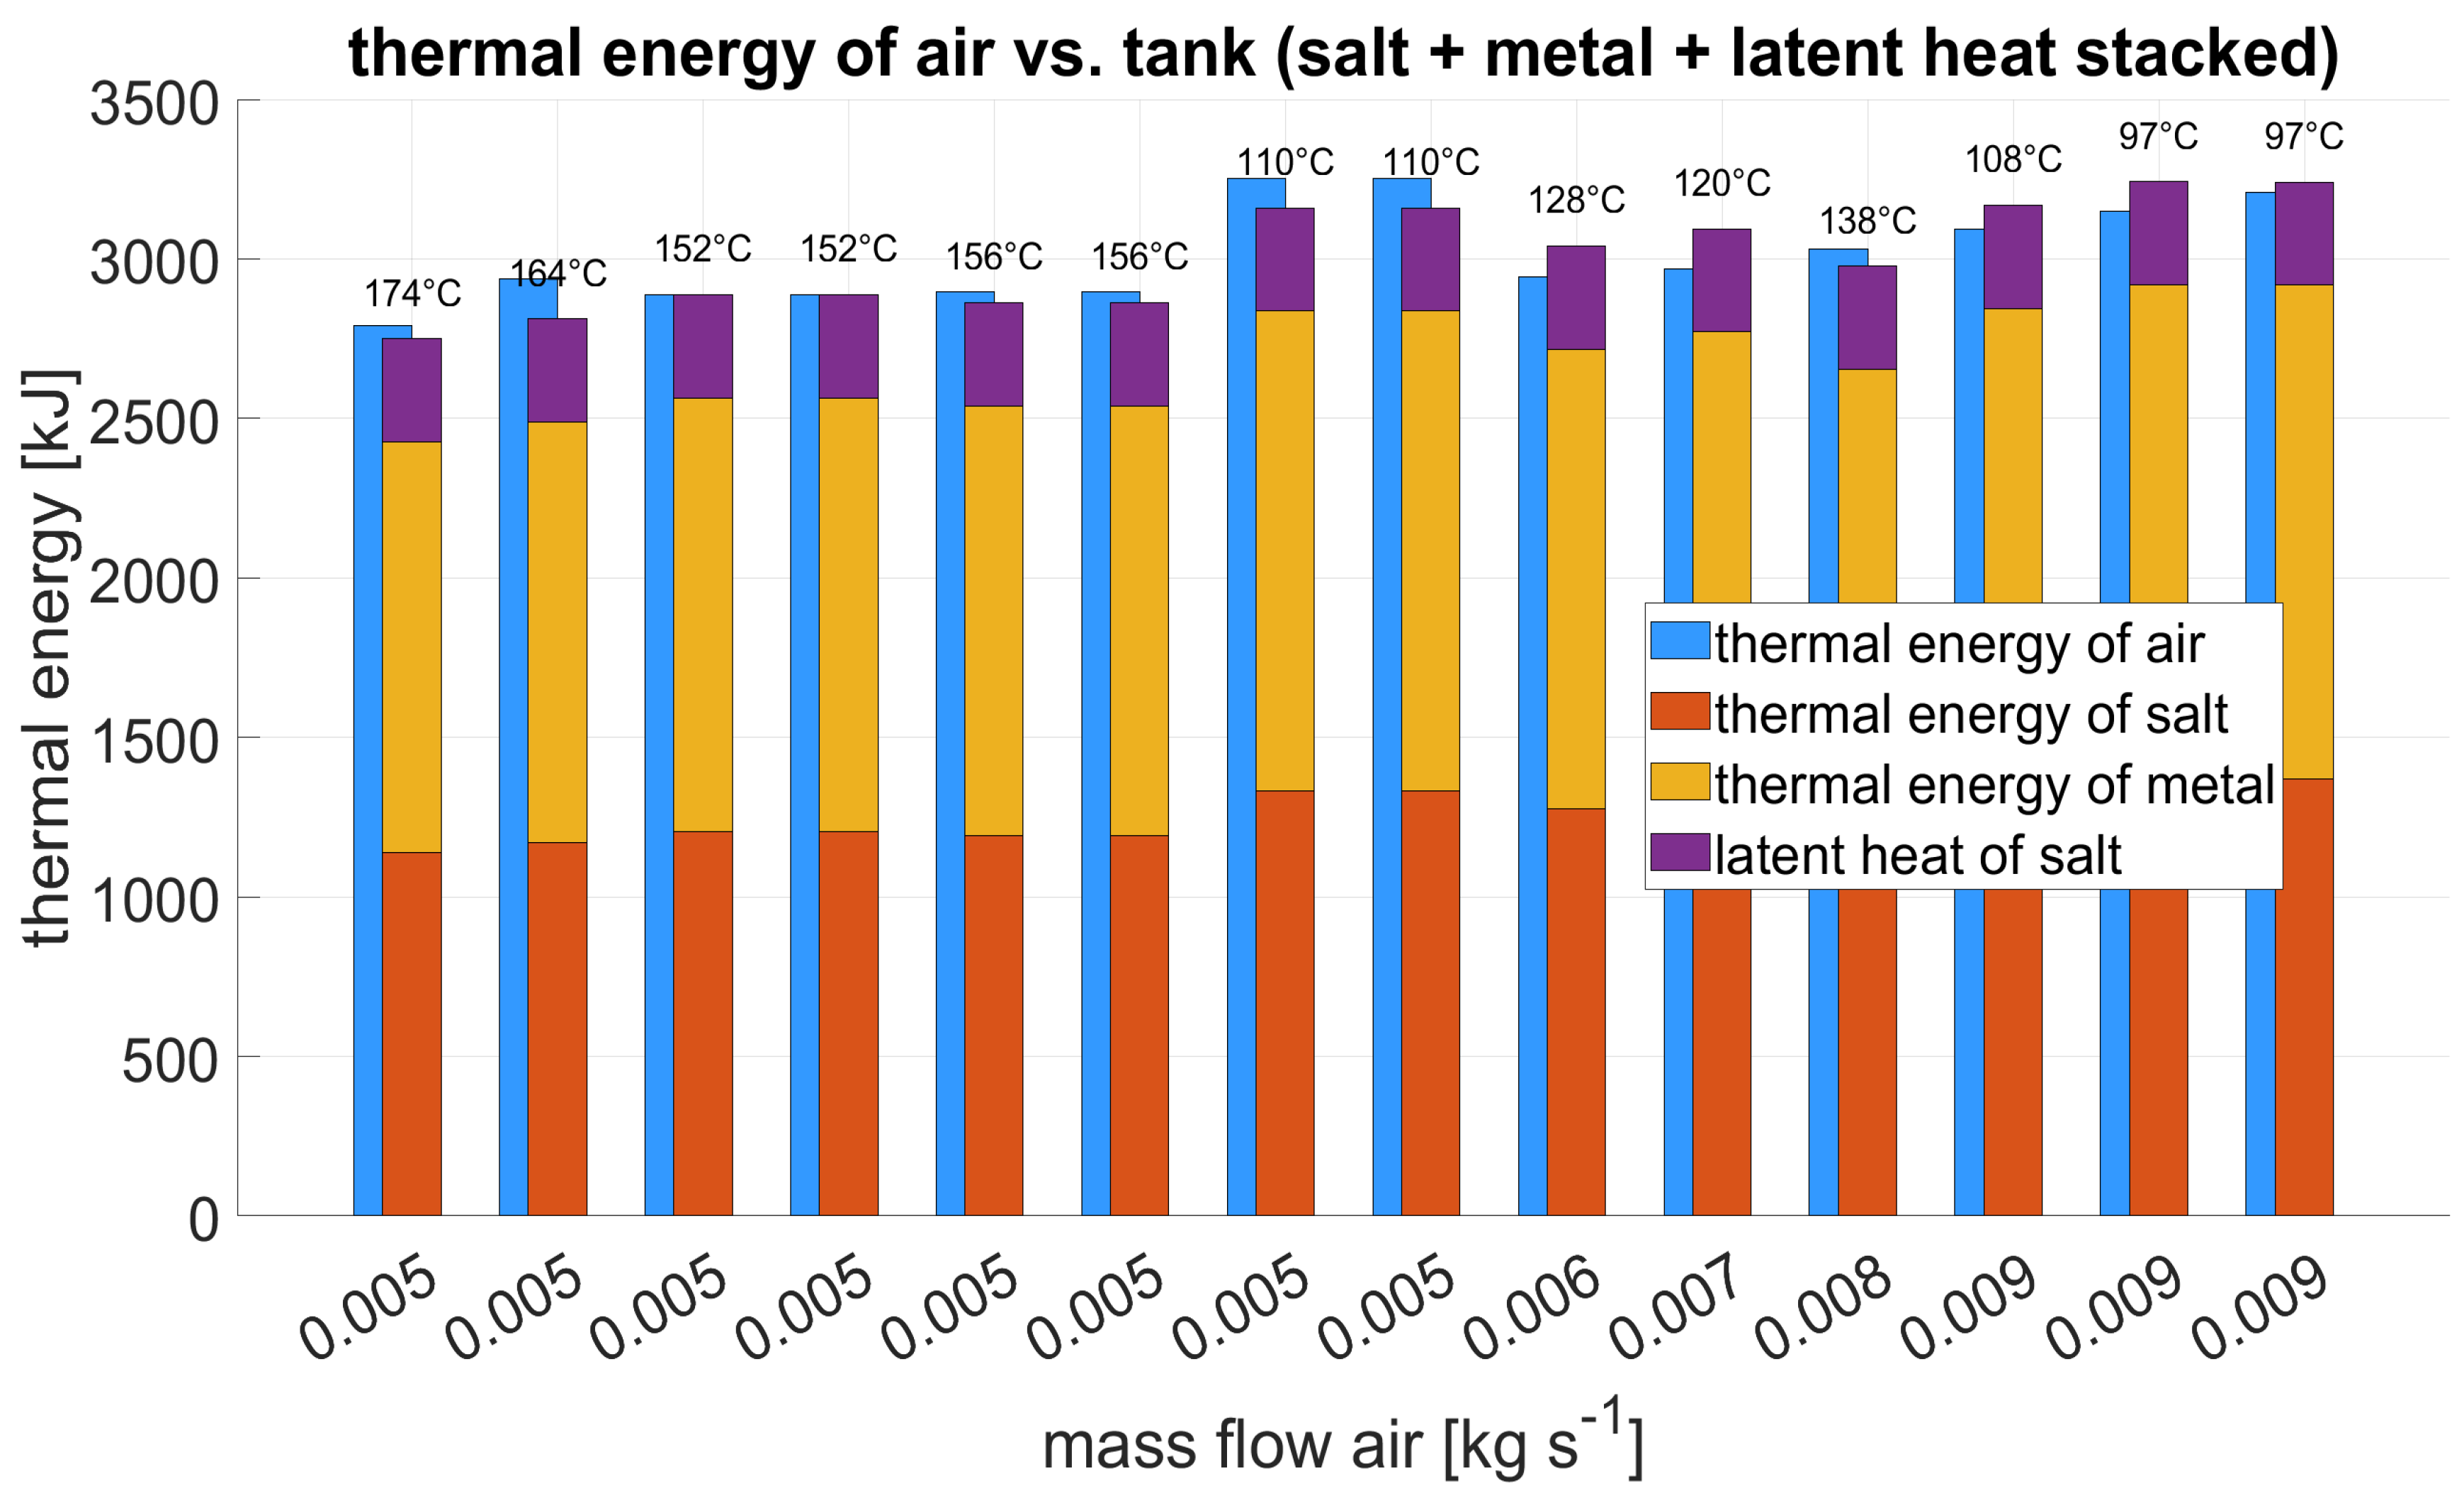
Figure 10.
Final mesh in 2 sectional views.
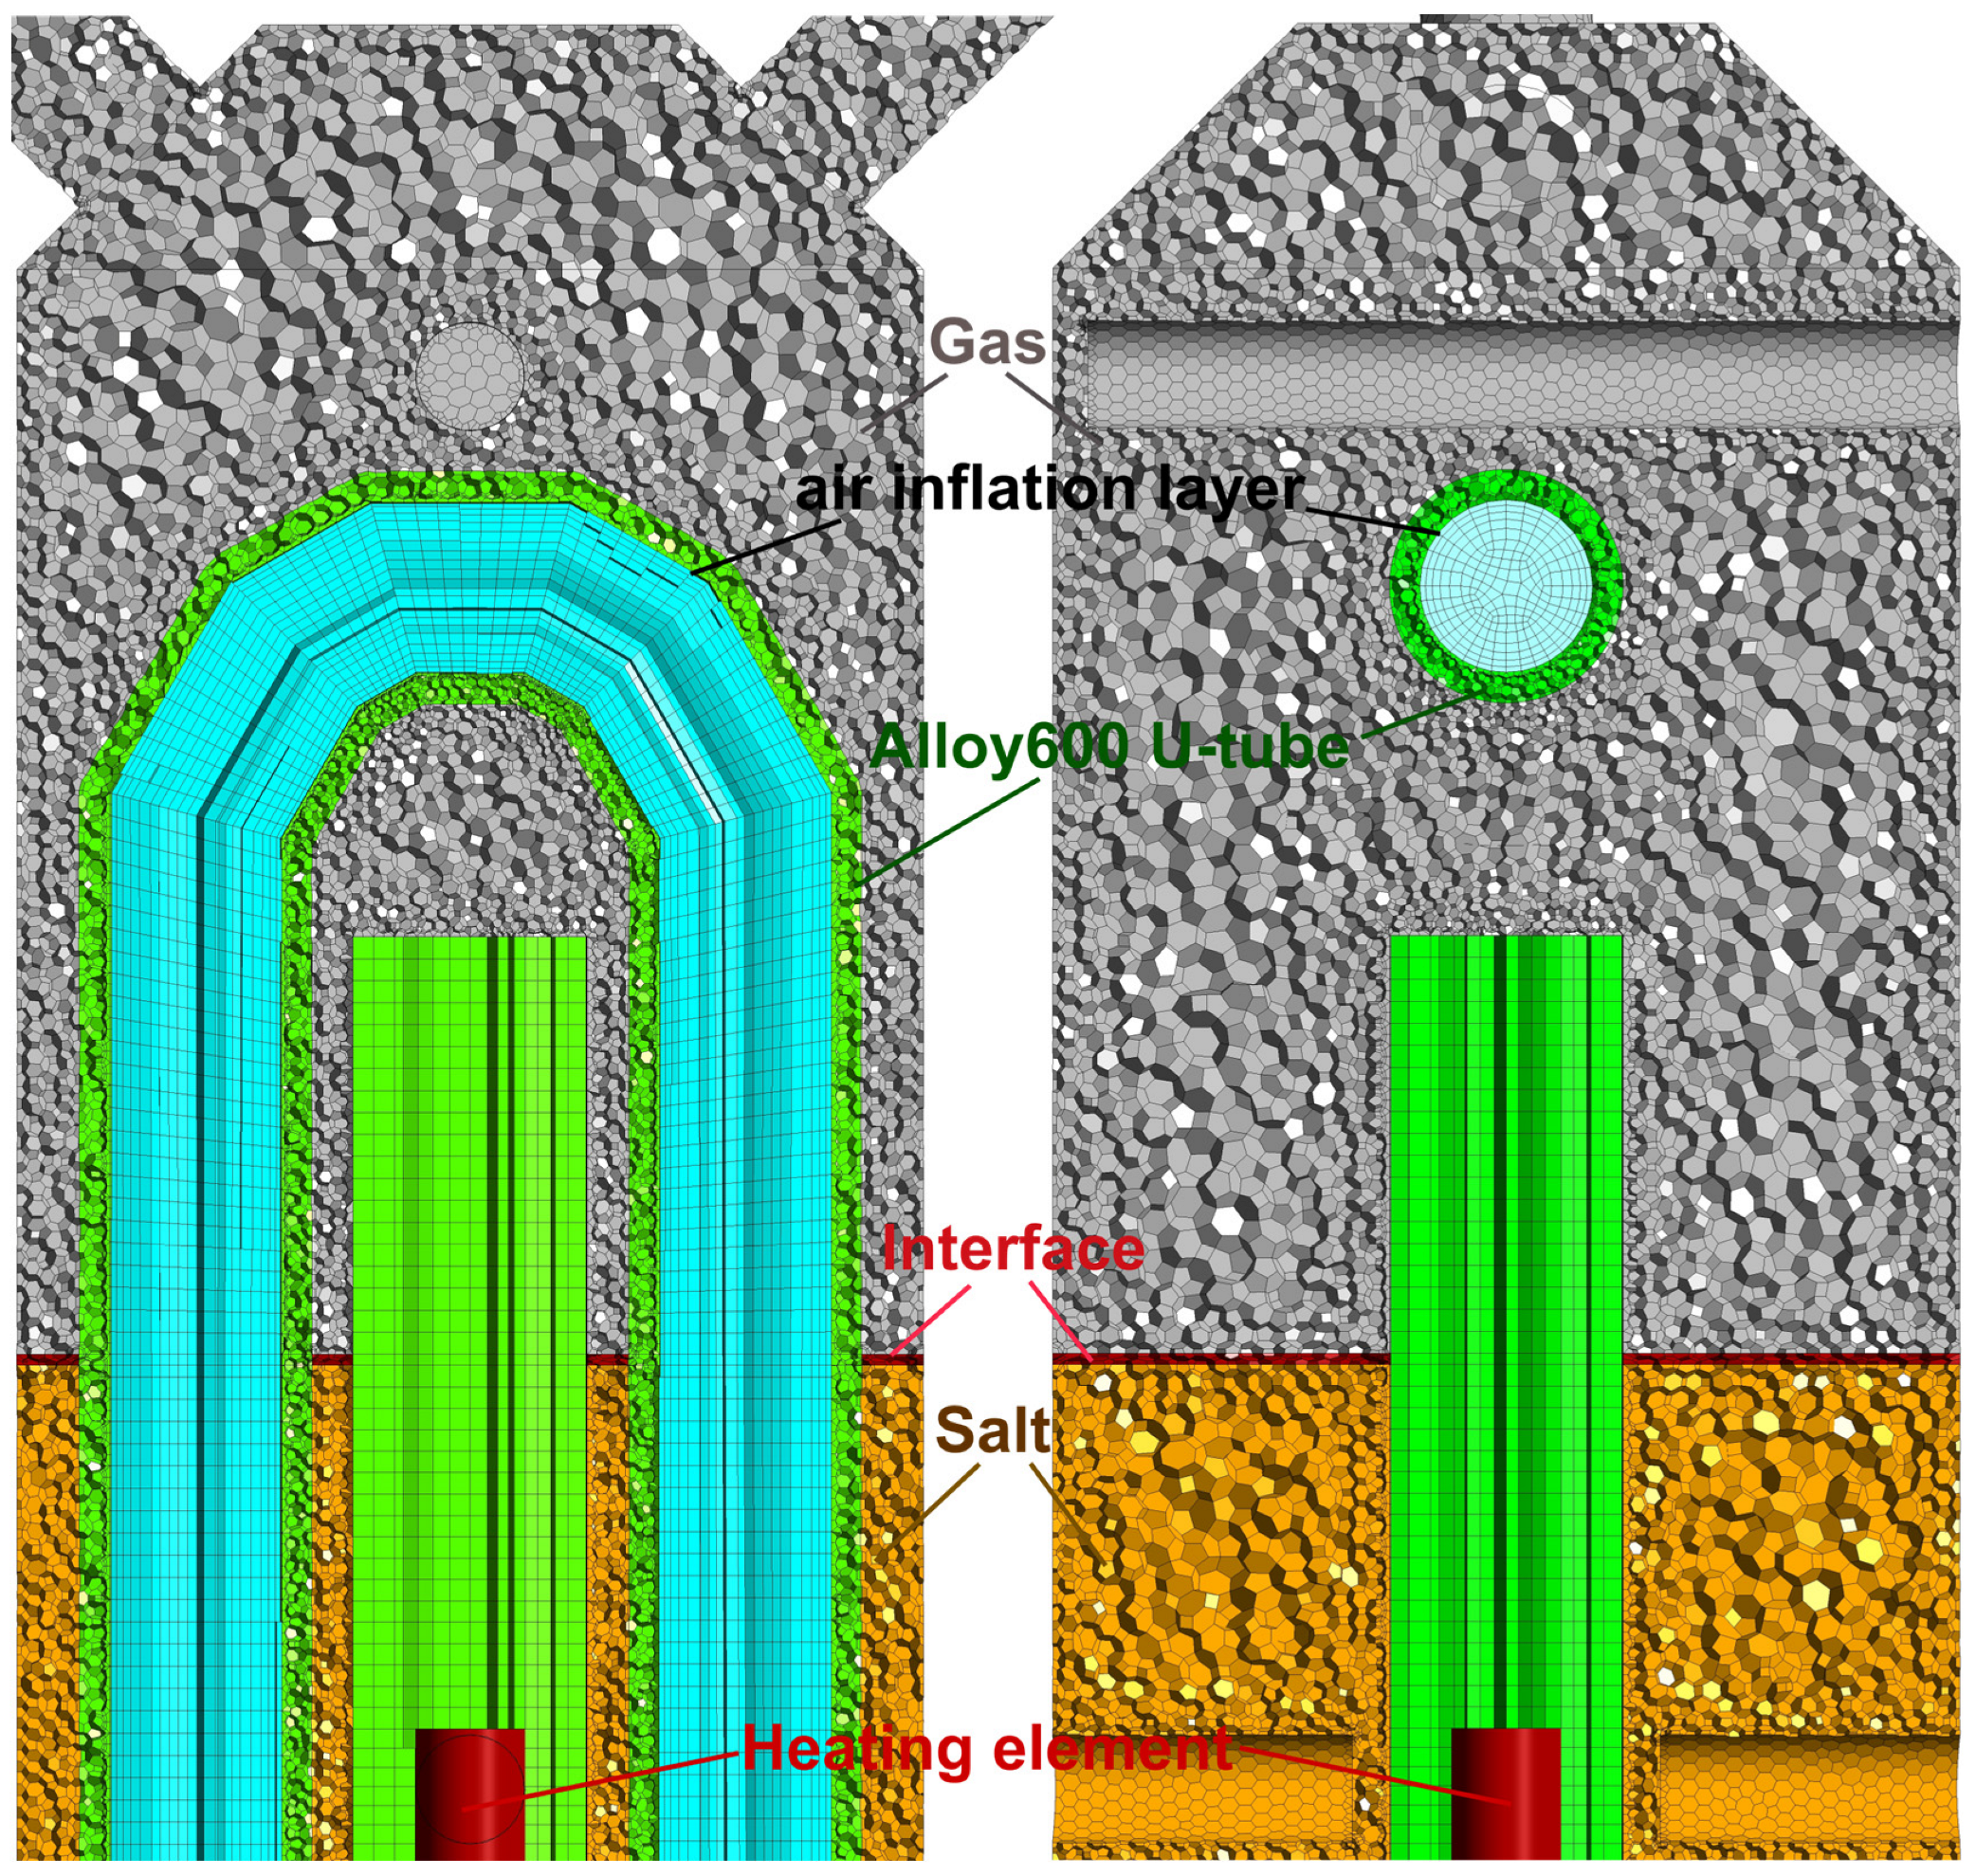
Figure 11.
Spatially resolved salt temperature - Validation - Experiment vs. CFD.
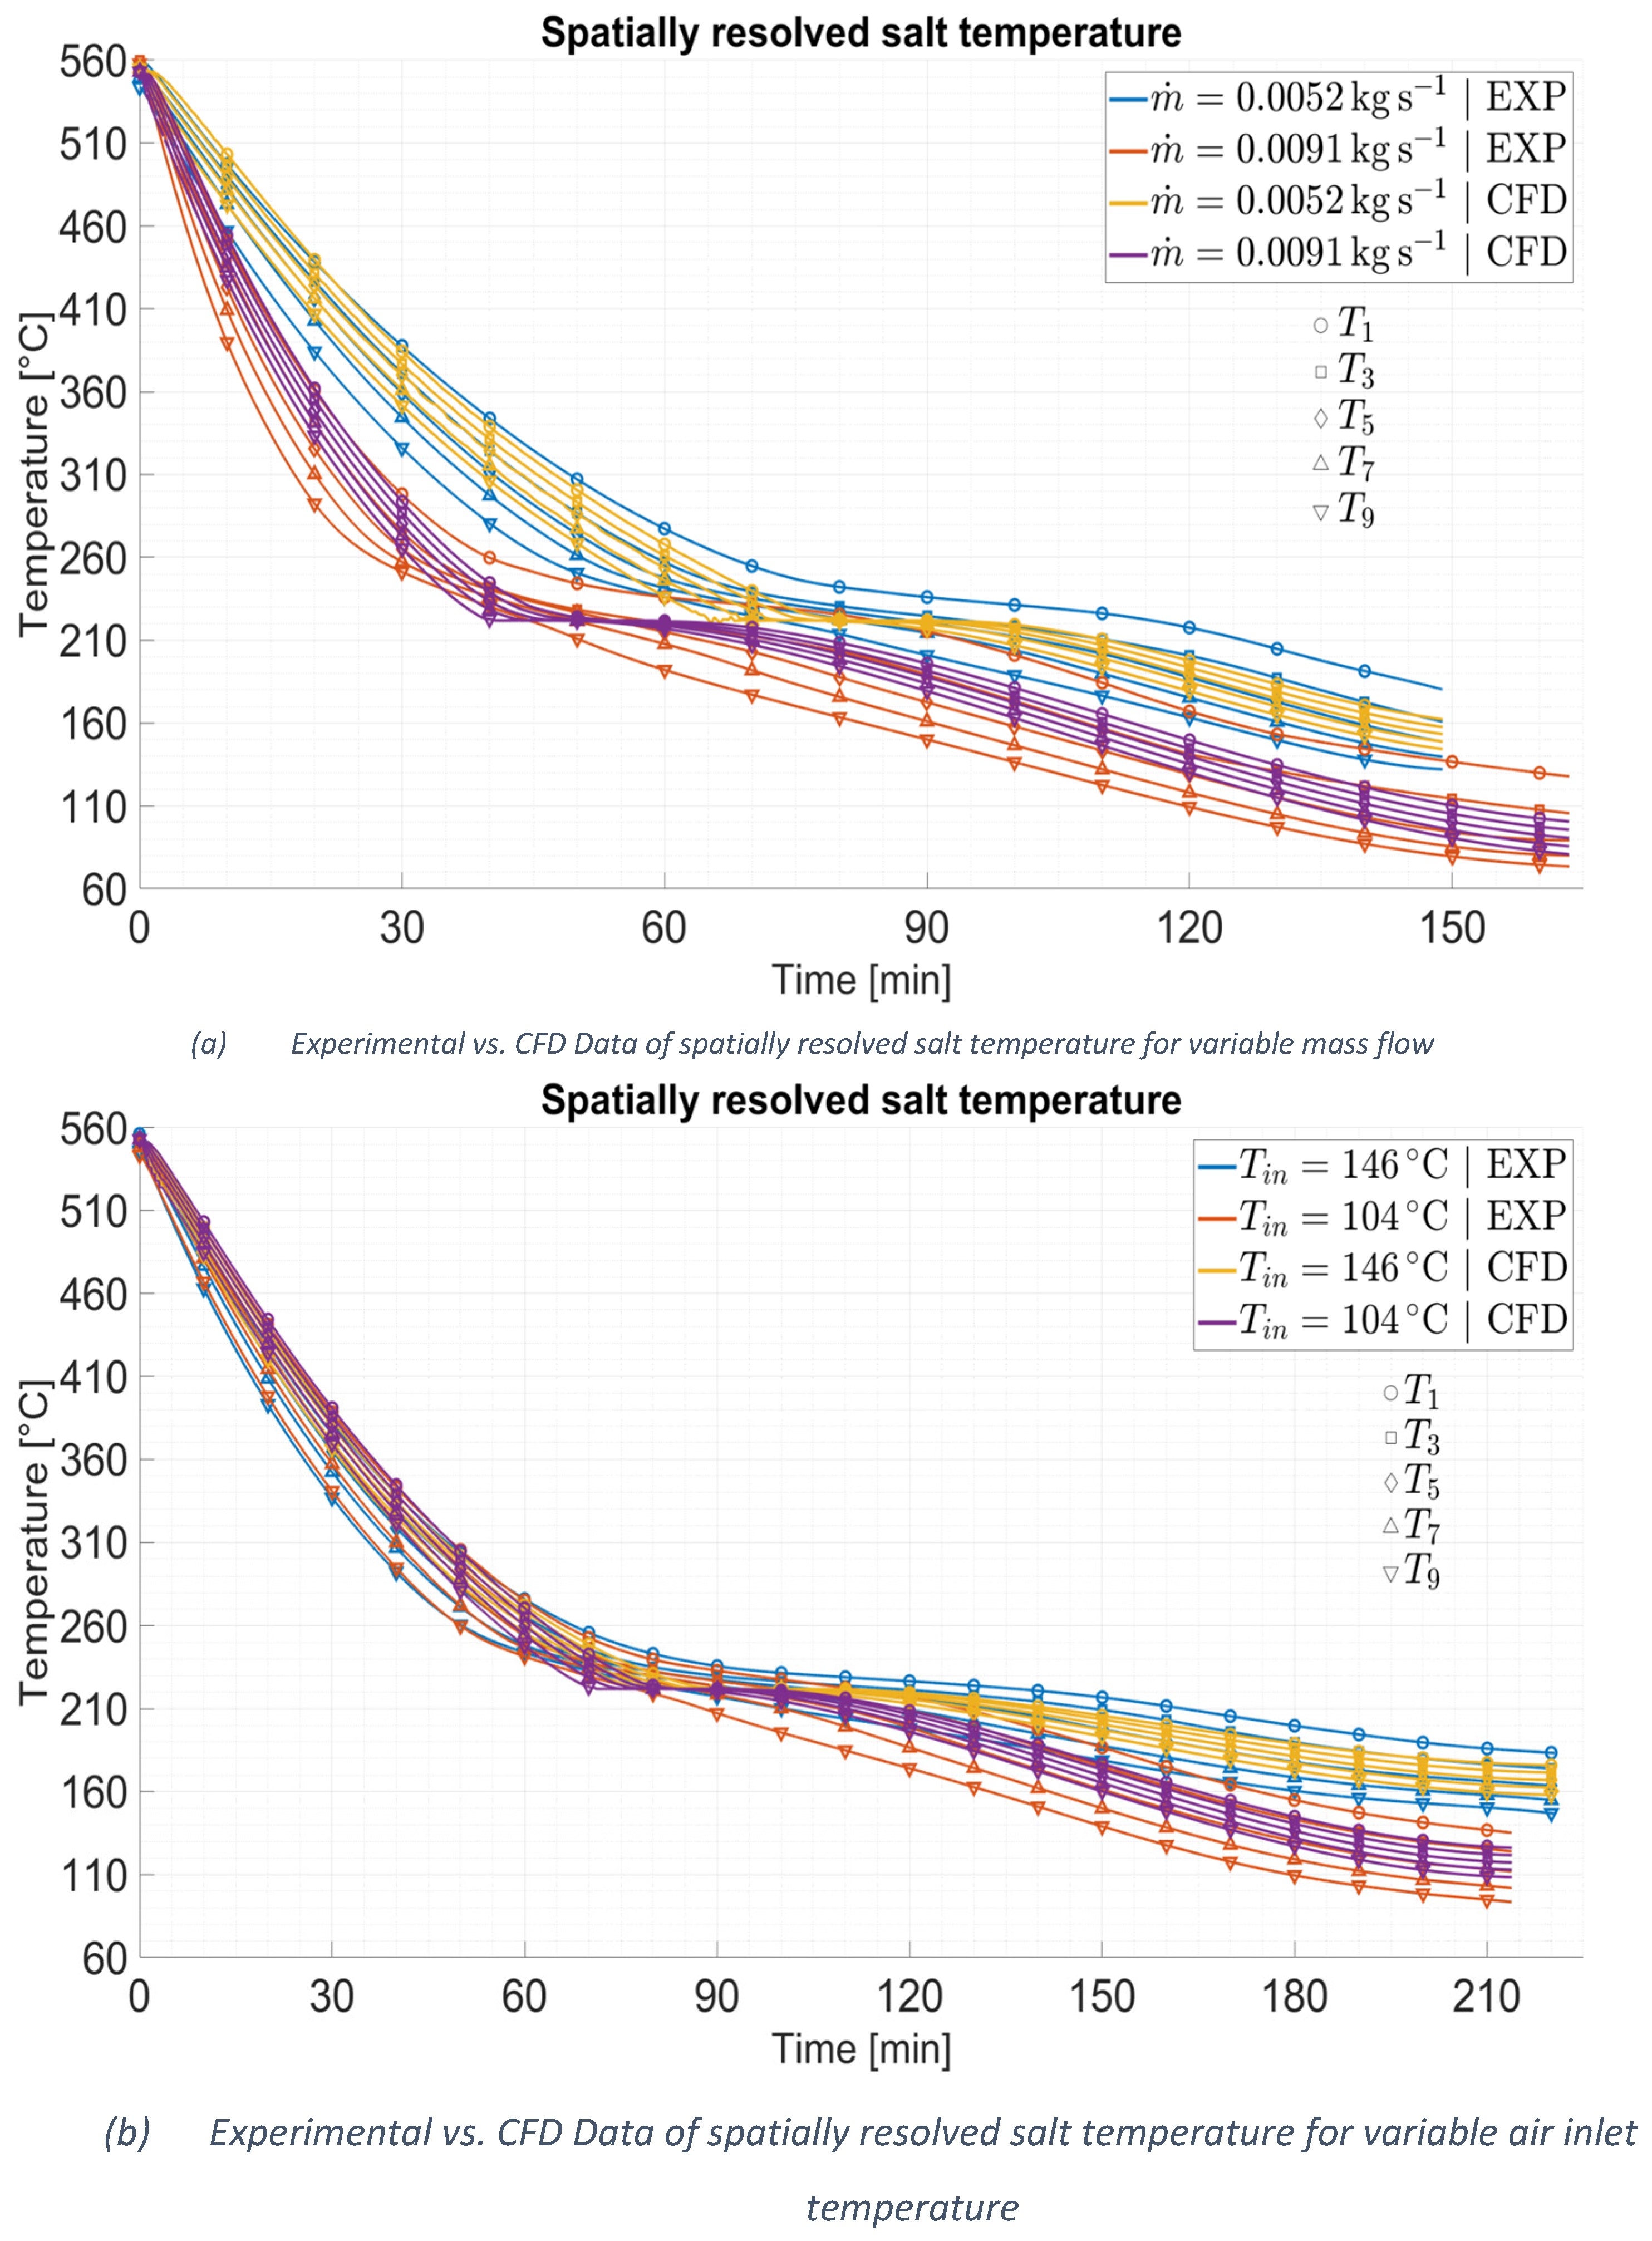
Figure 12.
Air temperature at the inlet & outlet, heat flux, average salt temperature, and liquid fraction – experimental vs. CFD.
Figure 12.
Air temperature at the inlet & outlet, heat flux, average salt temperature, and liquid fraction – experimental vs. CFD.
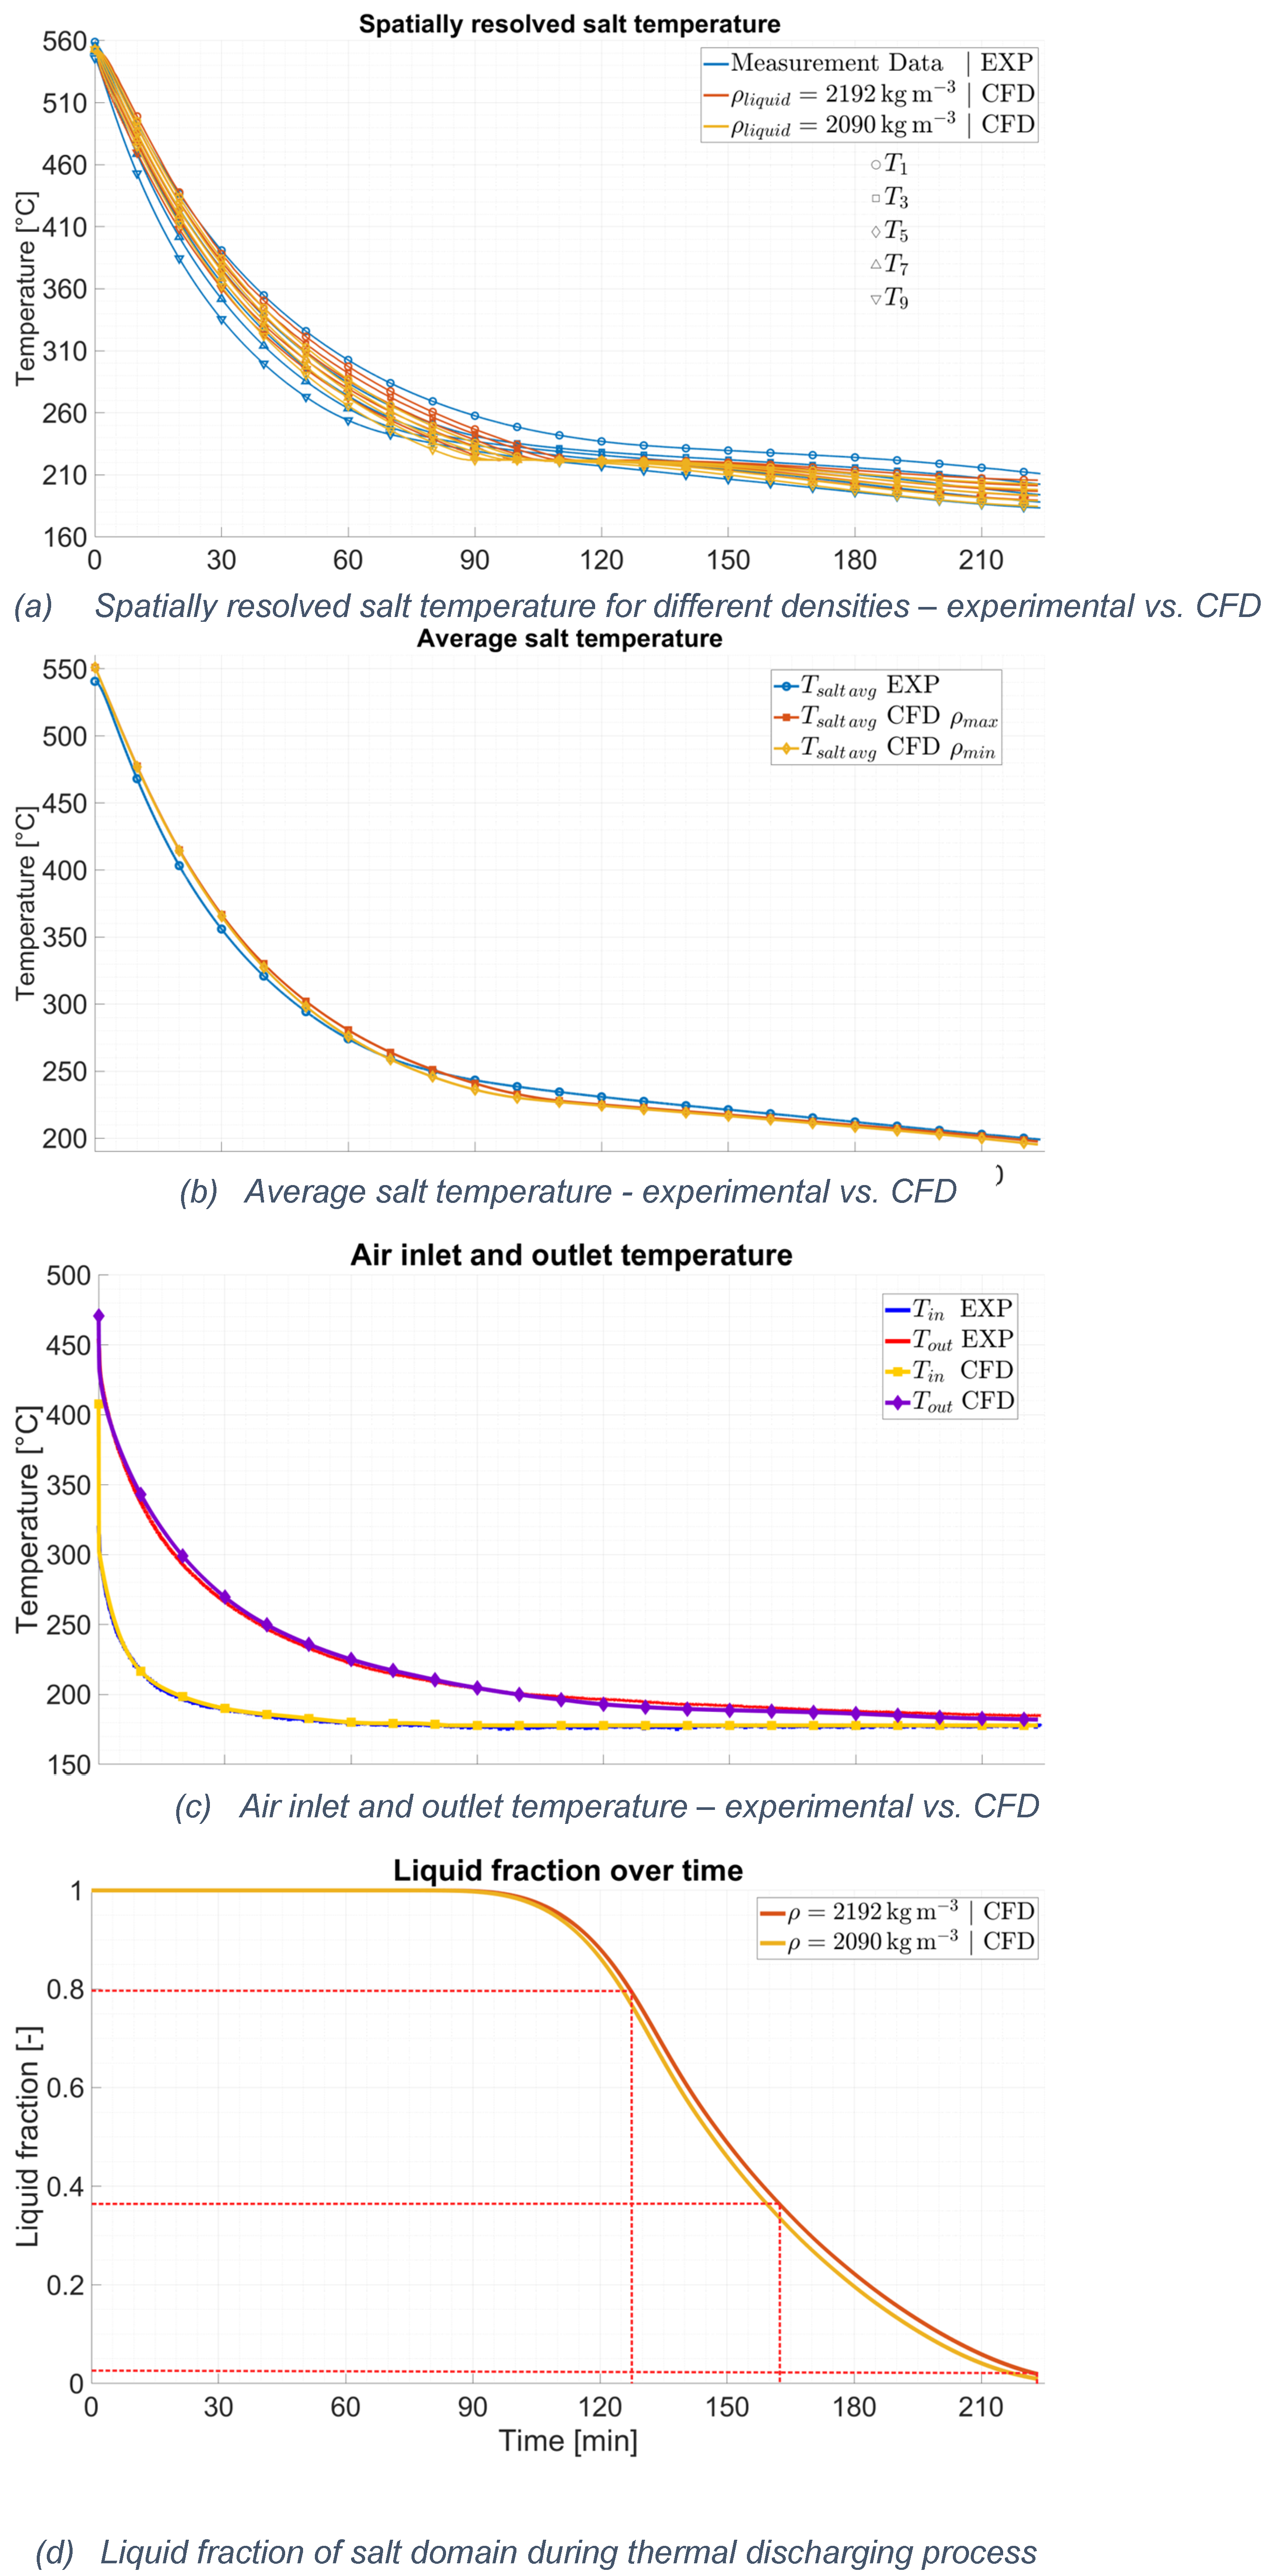
Figure 13.
Liquid fraction on relevant time steps during the crystallization process.
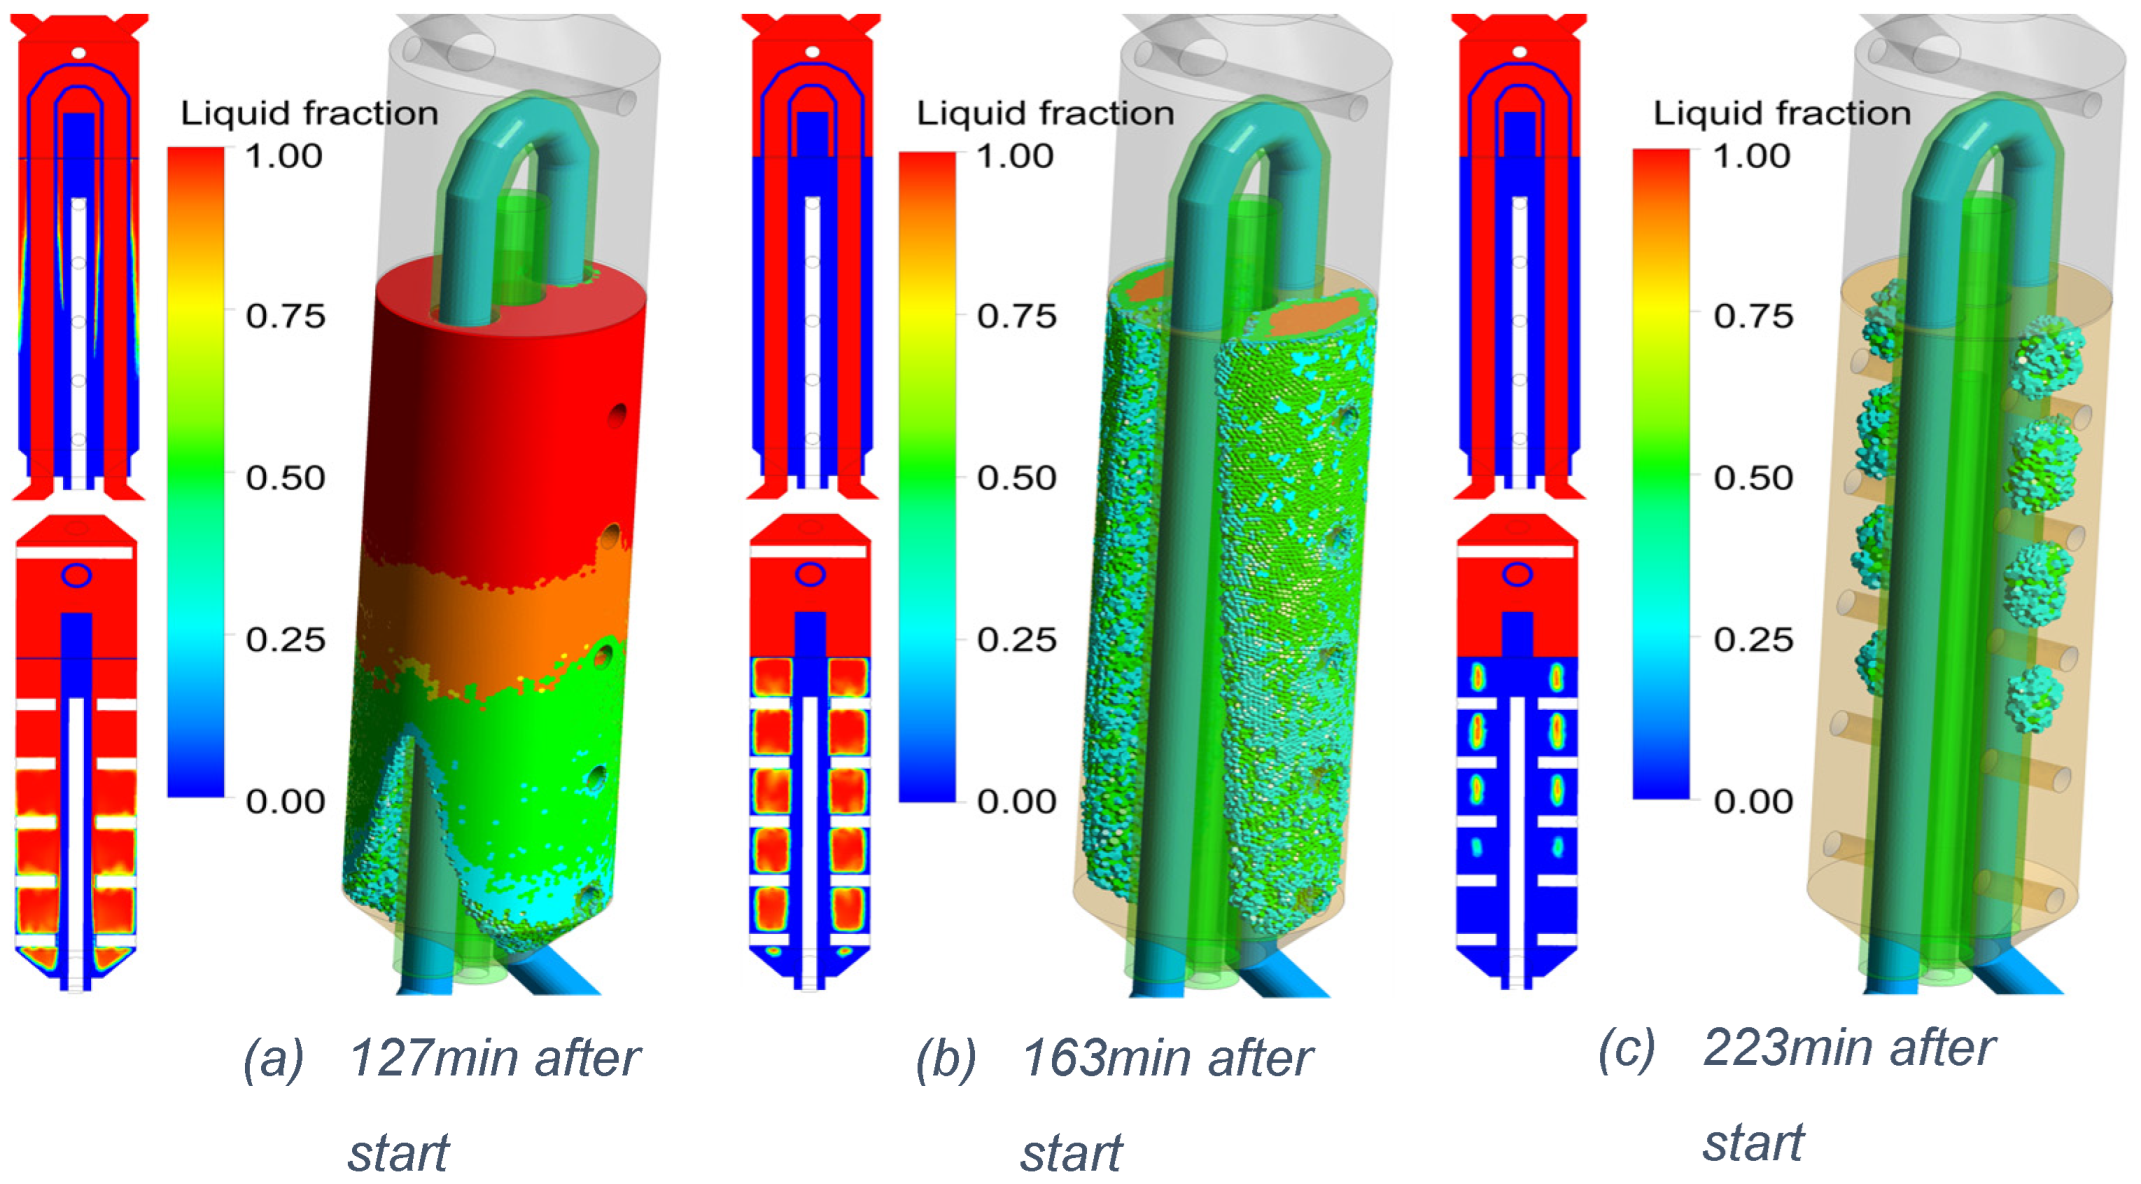
Figure 14.
Liquid Fraction and Heat Flux 127min after start in sectional view.
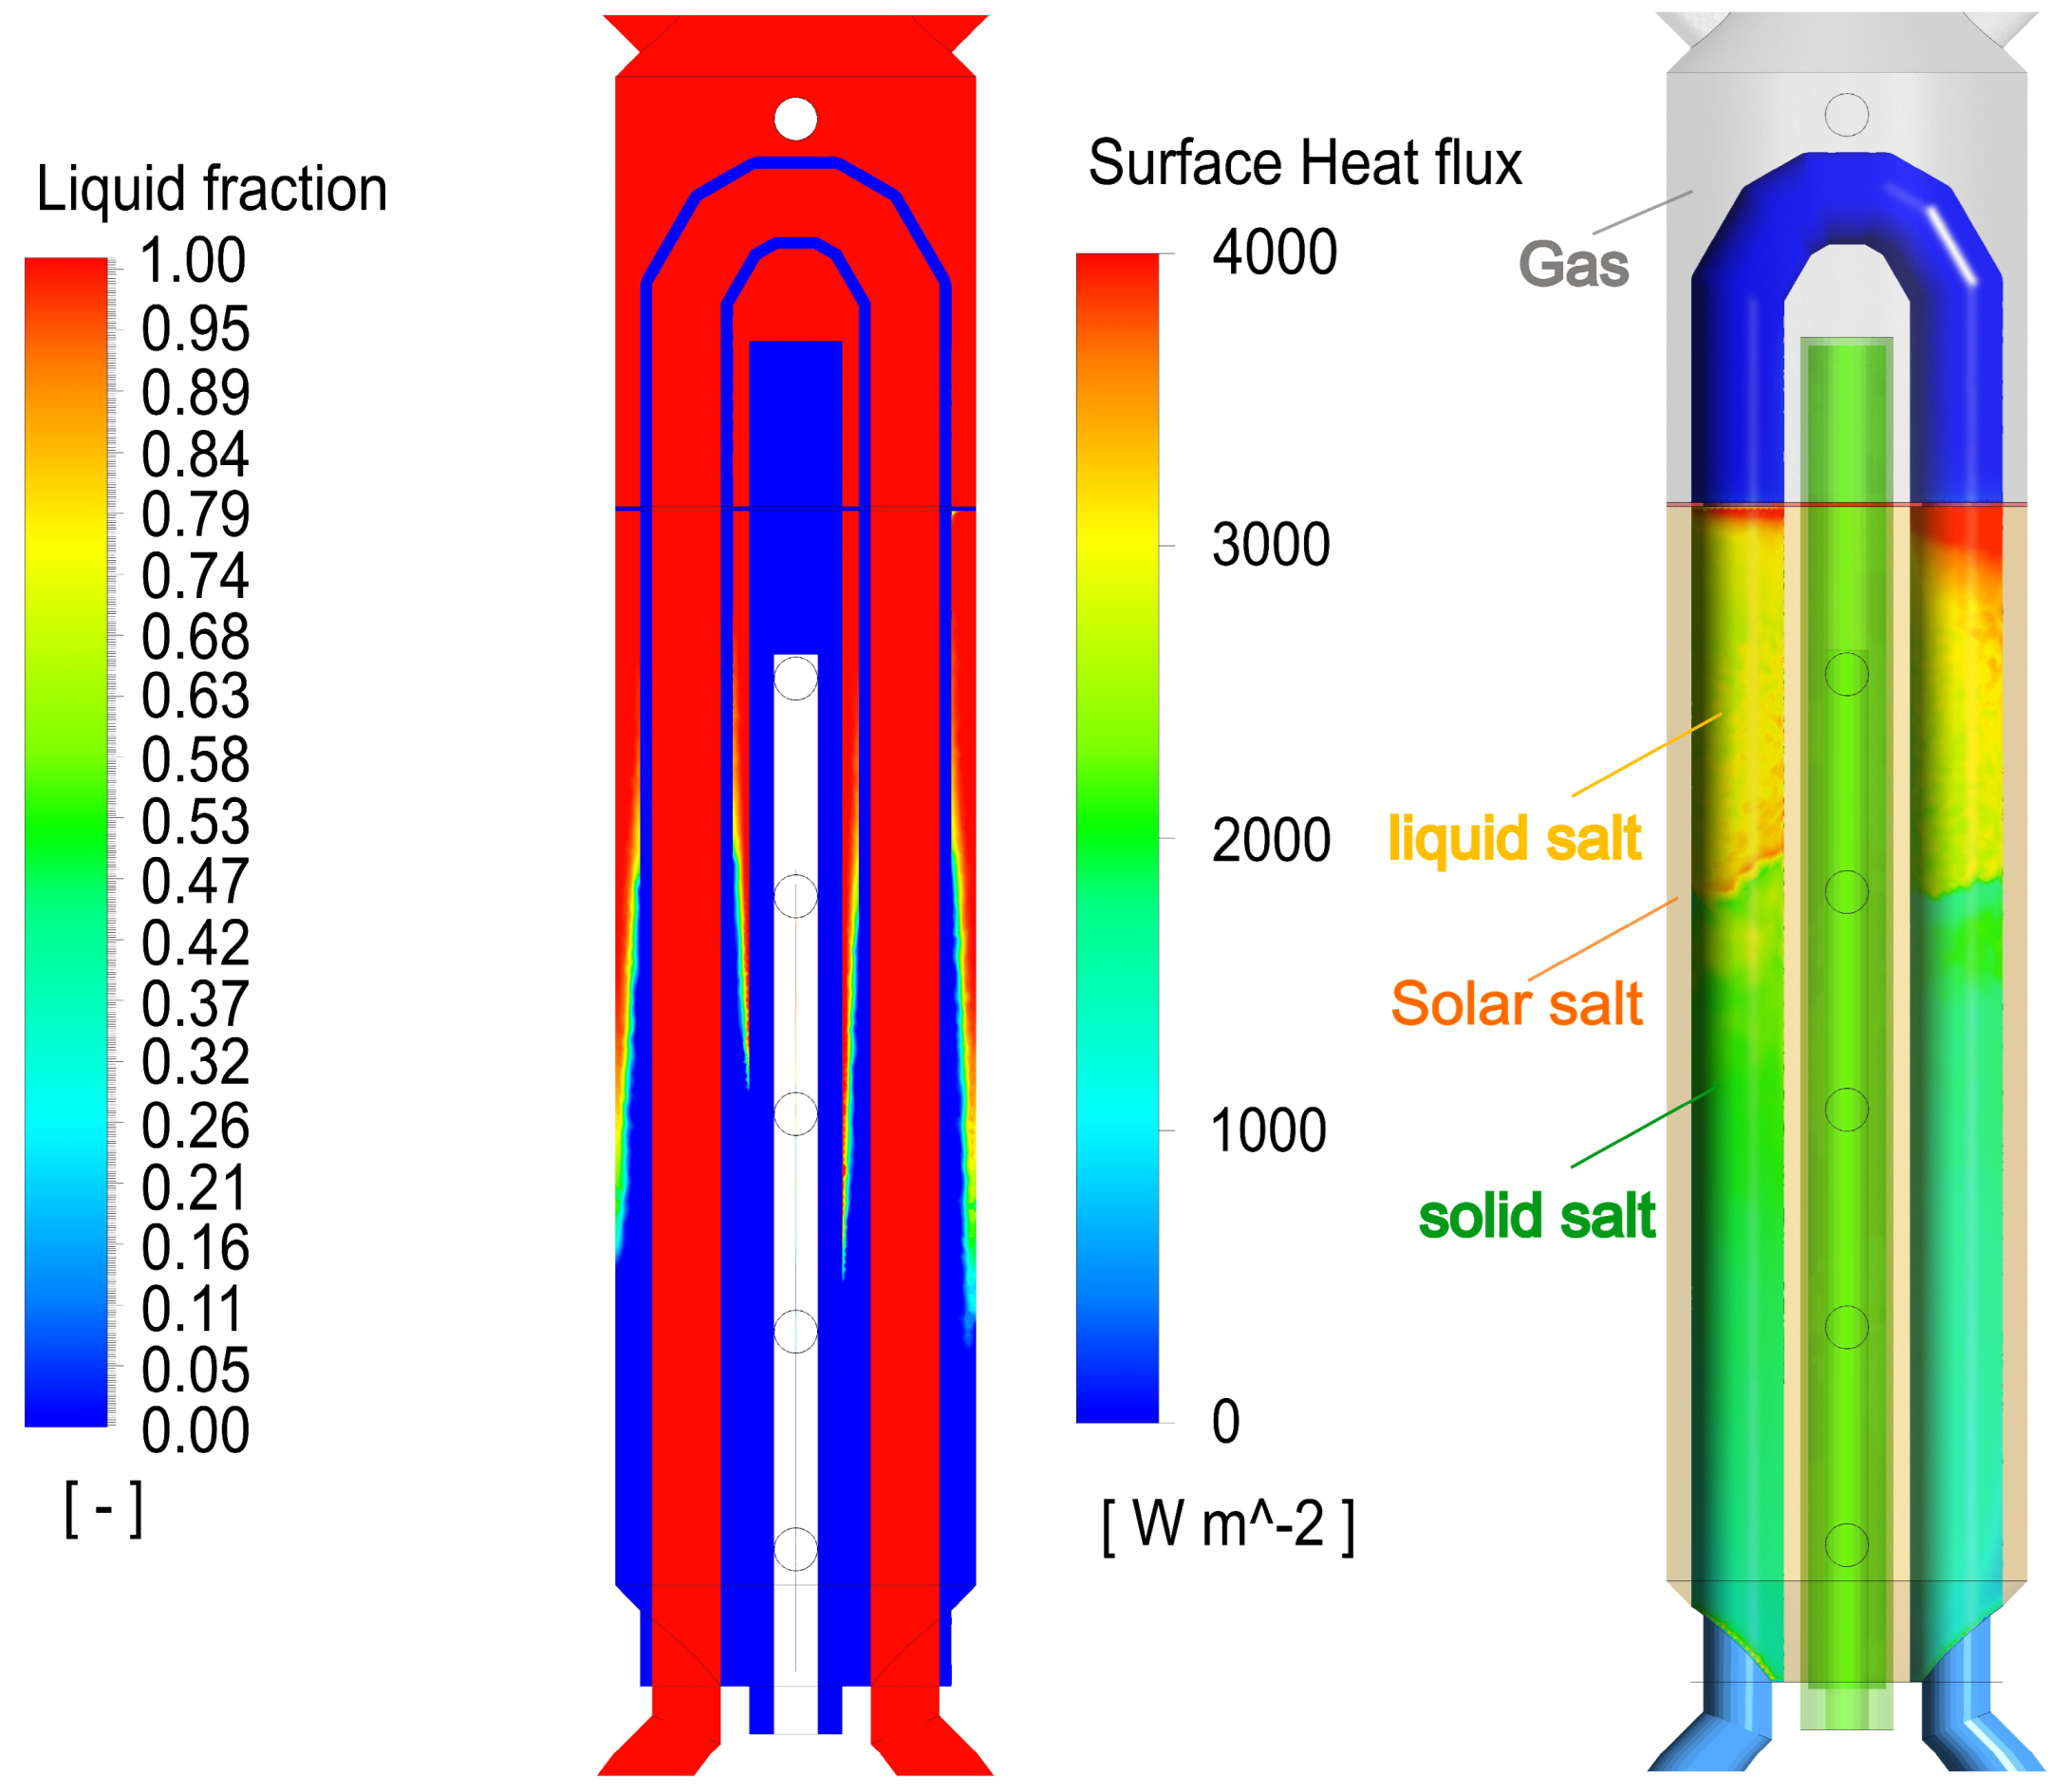
Figure 15.
flow within the molten salt phase (natural convection) during thermal discharge and salt solidification.
Figure 15.
flow within the molten salt phase (natural convection) during thermal discharge and salt solidification.
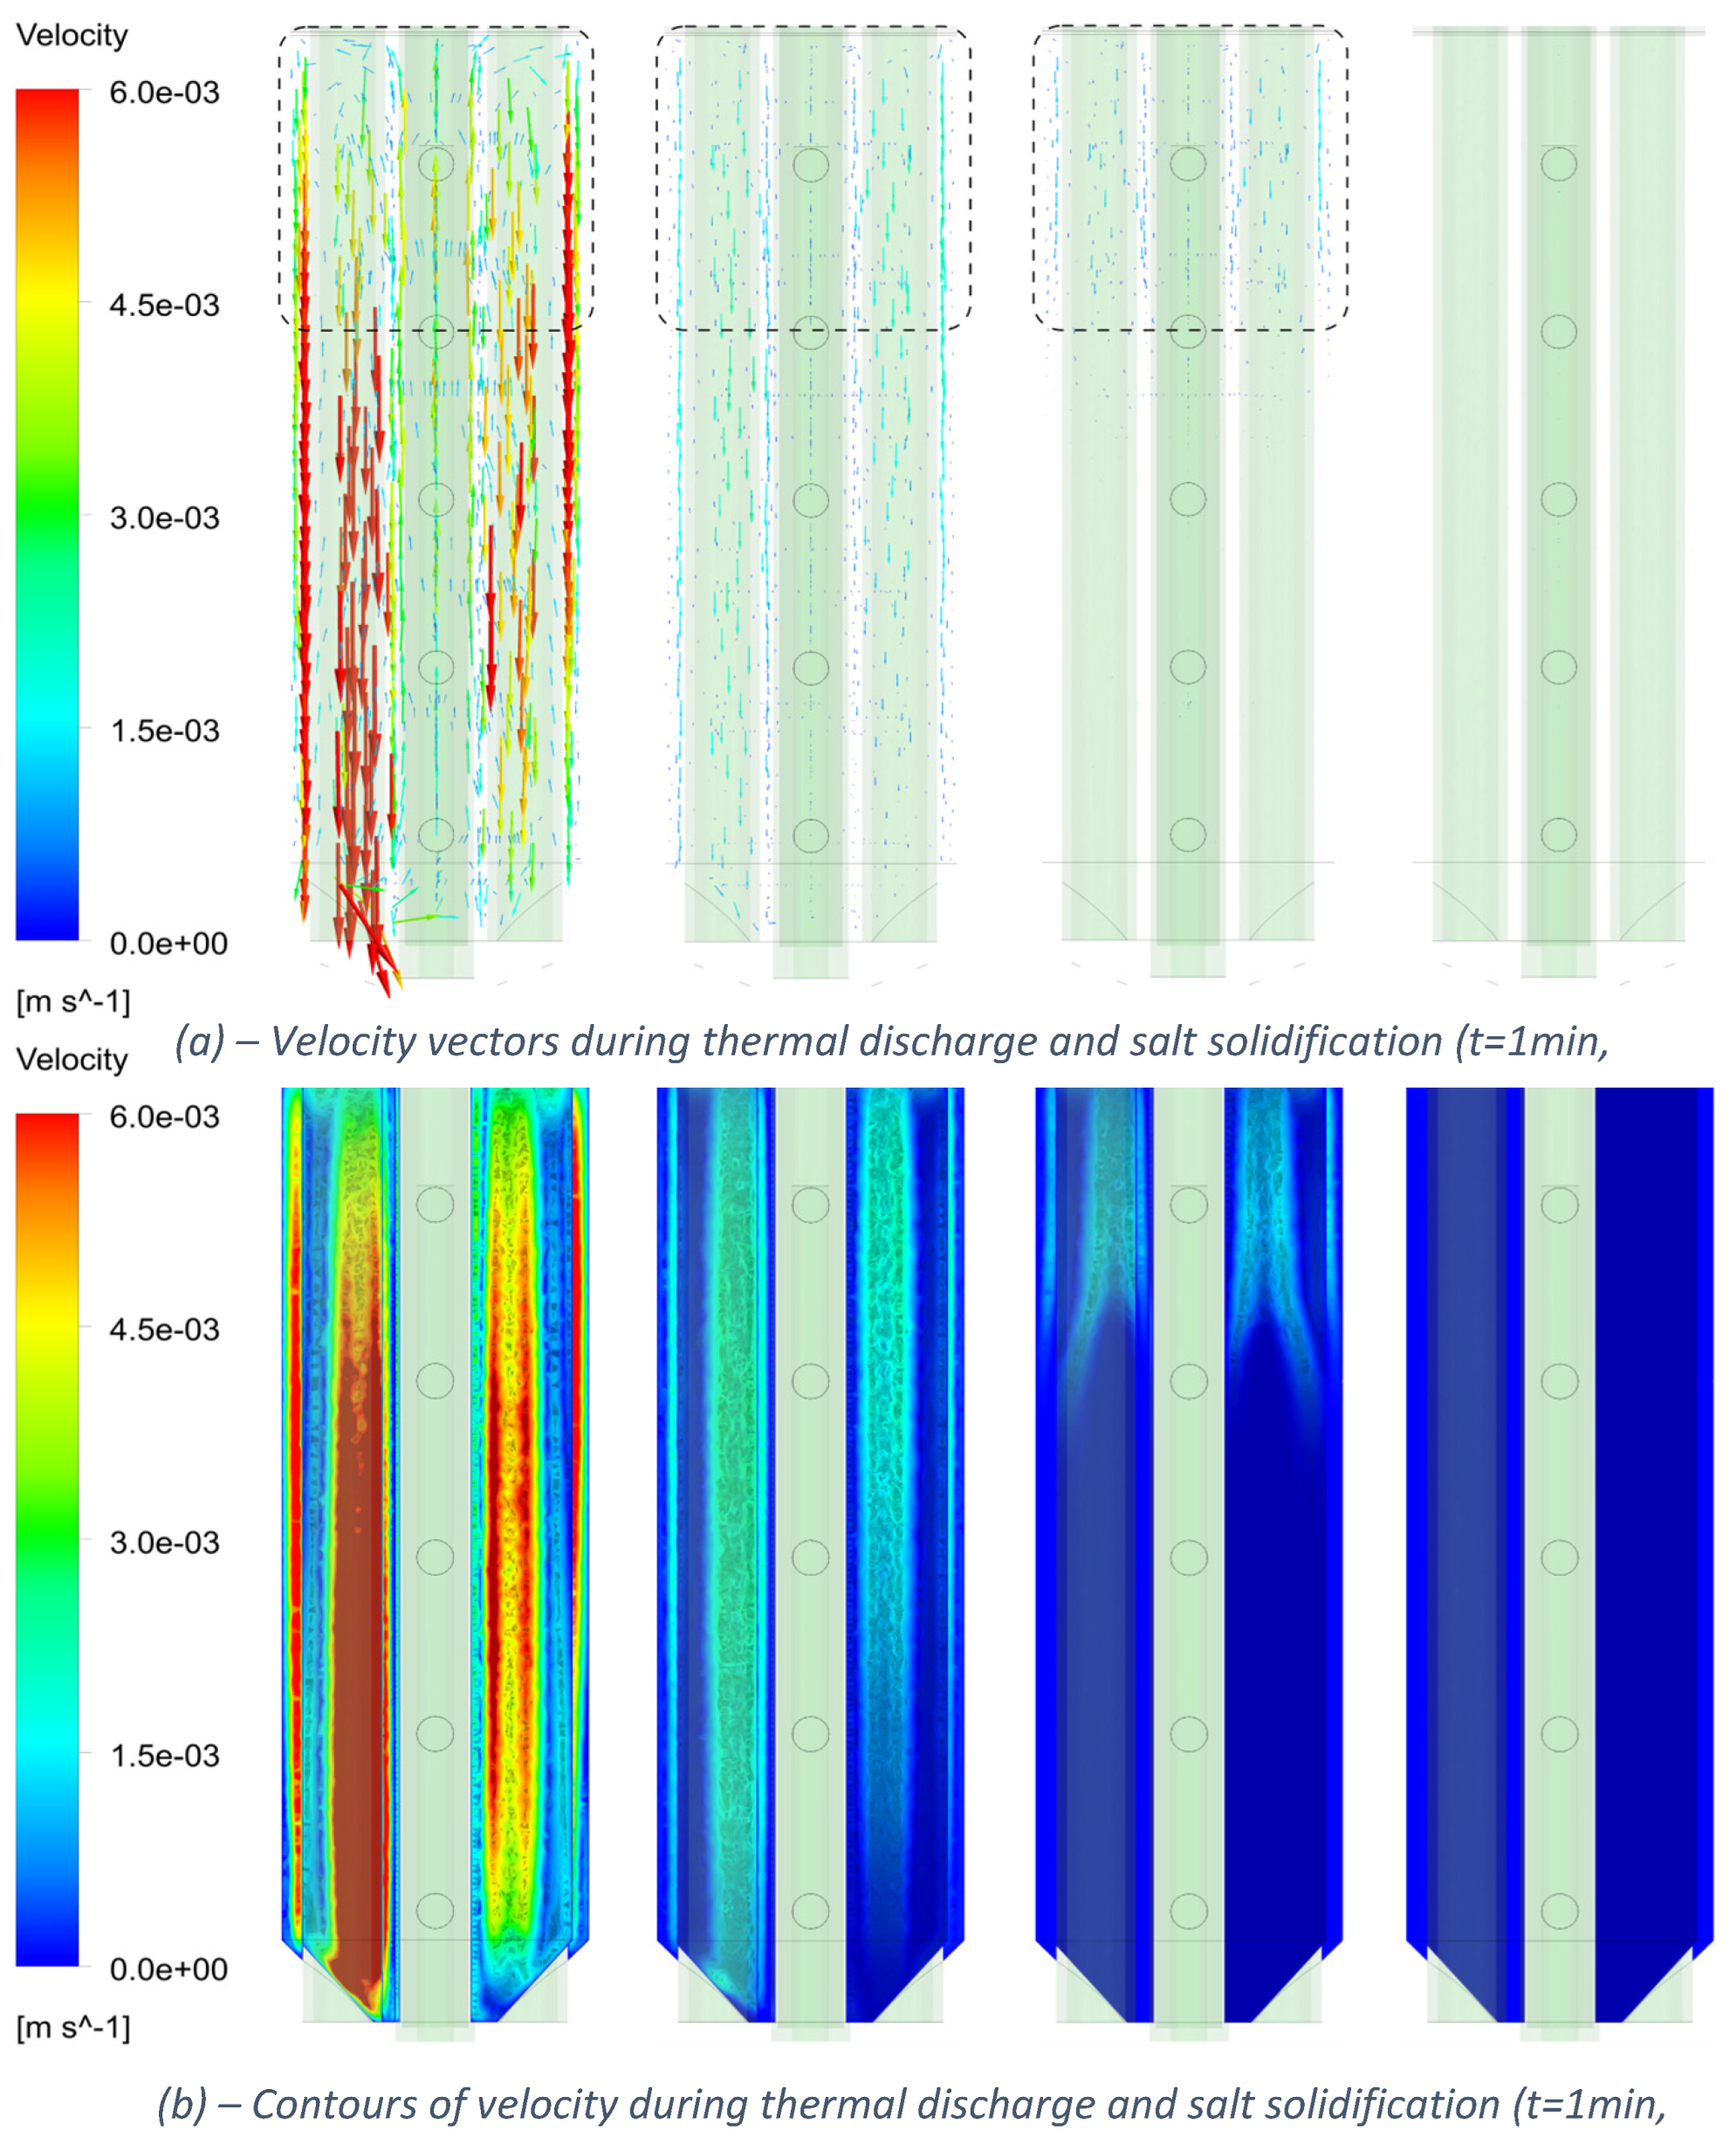

Disclaimer/Publisher’s Note: The statements, opinions and data contained in all publications are solely those of the individual author(s) and contributor(s) and not of MDPI and/or the editor(s). MDPI and/or the editor(s) disclaim responsibility for any injury to people or property resulting from any ideas, methods, instructions or products referred to in the content. |
© 2026 by the authors. Licensee MDPI, Basel, Switzerland. This article is an open access article distributed under the terms and conditions of the Creative Commons Attribution (CC BY) license (http://creativecommons.org/licenses/by/4.0/).
Copyright: This open access article is published under a Creative Commons CC BY 4.0 license, which permit the free download, distribution, and reuse, provided that the author and preprint are cited in any reuse.