

Submitted:
07 August 2026
Posted:
07 August 2026
You are already at the latest version
Abstract
Effective mass reflects the body mass mechanically coupled during impact. Acceleration-based effective-mass estimates require noise-sensitive differentiation of segment kinematics. This study introduced an impulse-based estimate (Me,imp = J/vpre) and evaluated its reliability, agreement with an acceleration-based estimate (Me,acc), and sensitivity to a carried-load condition. Forty male military cadets performed five maximal front kicks onto a force plate synchronized with three-dimensional motion capture under two fixed-order conditions: barefoot without load (NL) and with 30 kg of carried equipment (WL). Reliability was assessed using intraclass correlation coefficients; condition differences using paired tests with effect sizes and FDR correction; method agreement using correlations, ICCs, and Bland–Altman analysis; and isokinetic strength interactions using body-mass-adjusted mixed-effects models. Me,imp showed poor-to-moderate single-kick reliability but good reliability for the five-kick mean (ICC = 0.84–0.87). It was higher in WL than NL (25.95 ± 5.44 vs. 21.89 ± 5.14 kg; p < 0.001; dz = 0.92), reflecting a 21% greater net impulse, while pre-impact foot velocity (vpre) remained unchanged. Contact duration increased and the force–time profile became more push-like under WL. In a subsample with usable impact-phase marker trajectories (n = 20), Me,imp and Me,acc were not significantly correlated (r = 0.10, p = 0.54) and showed negligible agreement (ICC = 0.02; Bland–Altman bias = −21.5 kg). Stronger concentric hip rotators were associated with a smaller WL–NL increase in Me,imp (Bonferroni-adjusted p = 0.044–0.050). Me,imp should be interpreted as a contact-integrated index of impulse-transfer capacity, reliable when averaged across repeated kicks, rather than as true inertial mass or an interchangeable substitute for Me,acc.
Keywords:
striking biomechanics
; isokinetic dynamometry
; military equipment
; kinetics
; kinematics
1. Introduction
In combat sports, the effectiveness of a strike depends on the amount of momentum and energy transferred to the target, which is determined by the mass and velocity of the striking segment and the coordination of the kinetic chain [1,2,3,4,5,6,7]. Although Newton’s second law describes the force of a rigid body as the product of mass and acceleration, the human body is a deformable, multi-segmental system in which only a portion of body mass becomes mechanically coupled to the striking limb at impact [8,9,10,11]. This mechanically coupled portion is commonly referred to as the effective mass [8,12]. Previous work has demonstrated that effective mass is not a simple function of total body mass but depends on skill, timing, and pre-impact muscular stiffening [8,9,12,13,14,15,16]. These factors imply that individuals of similar body mass may engage substantially different effective masses, depending on muscle co-contraction, joint stiffness, postural alignment at impact, and kinetic chain sequencing [4,8,9,13]. Two operational definitions dominate the literature. The momentum-conservation approach estimates effective mass from the post-impact motion of a movable target [10,11,14,17,18]. The Newton-based approach, more recently adopted in taekwondo [8,9], computes effective mass as the ratio of peak force to segment acceleration at impact (Me,acc = Fpeak/a). While conceptually simple, this approach is highly sensitive to the filtering and numerical differentiation required to obtain acceleration during the brief collision phase, and its reliability under field-like conditions has not been systematically examined.
Moreover, peak force alone does not fully characterize the mechanical exchange at impact: contact duration shapes how force and energy are delivered to the target, with short high-force contacts representing explosive “strike-like” actions and longer contacts reflecting more “push-like” force transmission [9,12,19,20]. This temporal dimension is captured by the net impulse, the time integral of force over the contact phase, which several authors argue is a more reliable determinant of momentum transfer than instantaneous peak force [12,21,22,23,24]. Recently, Walters et al. [25] validated an impulse-based striking method (the Impulse Block Method) and reported good within- and between-day reliability (CV ≈ 5–12%; ICC 0.72–0.99) for linear palm strikes, confirming the promise of impulse-based estimates. That method, however, uses a dedicated instrumented impact block and has not been applied to kicks, to whole-body carried-load conditions, or in combination with three-dimensional motion capture, the setting addressed here.
The front kick is frequently used in martial arts [26,27,28] and is the most frequently used lower-limb strike in military close combat [29,30,31,32,33], where soldiers often operate while carrying personal protective equipment weighing up to 30 kg or more [34,35,36,37]. A series of studies by Vagner et al. [30,31,33] has demonstrated that carrying a military load alters front kick dynamics in systematic ways: peak velocities of the proximal segments (hip, shoulder) decrease, contact duration lengthens, and impact force increases [30,33,38]. Previous work has shown that stance-leg hip-rotator strength, together with kicking-leg hip flexor and extensor strength, is associated with front kick impact performance [15,39,40]. However, whether hip-rotator strength of the dominant kicking leg is associated with a contact-integrated measure of impulse transfer under carried-load conditions remains unknown. Two primary methodological gaps also remain. First, the effective mass concept has not yet been applied to front kicks performed under military load, despite being conceptually well-suited to quantifying how much of the body-equipment system is mechanically engaged at impact. Second, existing effective mass methods based on peak force and acceleration are particularly vulnerable in loaded conditions, where pre-impact kinematics are more variable and proximal deceleration is more pronounced. The transition from a predominantly strike-like to a more push-like force–time profile under carried load, as already implied by Vagner et al. [30,31], further suggests that metrics integrating the entire contact phase, rather than its peak alone, may better capture the biomechanical reorganization of the kick under tactical constraints.
The primary aim was to introduce an impulse-based effective-mass estimate that avoids the impact-phase acceleration extraction and second numerical differentiation required by acceleration-based estimates and to evaluate its between-trial reliability and its agreement with the conventional acceleration-based estimate. As a demonstration of its sensitivity, the estimate was applied to the front kick of military cadets under two conditions: barefoot without an external load (NL) and with a 30 kg carried load (WL). The approach derives directly from the impulse–momentum theorem. Assuming that the foot transfers the majority of its momentum to the rigid target during contact, an impulse-equivalent effective-mass estimate can be operationalized as Me,imp = J/vpre, where J is the net force impulse over the contact phase and vpre is the pre-impact foot velocity; this estimate should be interpreted as an operational proxy rather than as the true inertial mass of the limb–body system (see Section 2.7). This formulation is conceptually aligned with the momentum-conservation approach used in boxing and martial arts research [10,11,14,17,41,42], but adapted for kicks delivered into a stationary rigid target, where both J and vpre can be obtained without differentiating a noisy impact-phase acceleration signal. The method comparison was performed between Me,imp and the Newton-based Me,acc on a subsample for which both could be computed. We additionally examined whether the concentric isokinetic strength of the dominant kicking-leg hip rotators was associated with and whether this association differed between loading conditions.
Previous studies showed that wearing military equipment prolongs front kick contact duration and reduces proximal-segment velocity while largely preserving pre-impact foot velocity [30,31]. Based on this evidence and on the distinct mechanical formulations of the two effective-mass estimates, we hypothesized that: (H1) would be higher in the 30 kg carried-load condition (WL) than in the unloaded barefoot condition (NL). We expected the between-condition difference to reflect a greater net impulse and a longer contact duration, whereas pre-impact foot velocity and peak force were expected to remain largely unchanged, consistent with a shift toward a more push-like delivery under load; and (H2) the association between the concentric isokinetic strength of the dominant kicking-leg hip rotators and would be stronger in the carried-load (WL) than in the unloaded (NL) condition.
2. Materials and Methods
2.1. Study Design
This study used a within-subject, repeated-measures laboratory design to compare front kick biomechanics between an unloaded barefoot condition (NL) and a condition with a 30 kg carried load (WL). The experimental protocol closely followed previous work on front kick dynamics under military load [30,31,39,43] adapted here to focus on two loading conditions and to incorporate the impulse-based effective mass (Me,imp) as the primary outcome. All procedures were approved by the institutional Ethics Committee (No. 085/2022) and conducted in accordance with the Declaration of Helsinki.
2.2. Participants
Forty male military cadets participated in this study (age: 22.5 ± 2.3 years; body mass: 82.0 ± 6.6 kg; height: 180.9 ± 5.9 cm). All participants were enrolled in the Department of Military Studies at the Faculty of Physical Education and Sport, Charles University, with compulsory close-combat training as part of their curriculum (two times per week during the semester). Inclusion criteria were: (i) at least two years of close combat or martial arts training; (ii) absence of any musculoskeletal injury or muscle soreness in the three months preceding testing; (iii) prior familiarization with the front kick technique and with the experimental setup; and (iv) the ability to deliver the kick at maximal effort using the self-reported dominant leg. Participants were instructed to refrain from strenuous physical activity during the three days preceding the measurement. A subsample of 20 participants was used to compute the acceleration-based effective mass () and to evaluate agreement between the two approaches (see Section 2.6.1). All participants were fully informed of the testing protocols and provided written informed consent before data collection.
2.3. Experimental Setup and Instrumentation
2.3.1. Target and Force Measurement
The experimental setup was identical to that described by Vagner et al. [29]. Kicks were executed into the force plate (Kistler 9281; Winterthur, Switzerland; sampling frequency of 1000 Hz) mounted at the front as the target. The height of the force plate was individualized for each participant. The force plate was covered with a mat (tatami, 400 × 300 × 25 mm, StrongGear, Praha, Czech Republic) to reduce the risk of injury. Because target compliance can influence the force-time characteristics, the reported values should be interpreted as specific to this padded rigid-target configuration. The plate was connected to a computer with a 16-bit A/D board and BioWare V5.3.2.9 software.
During data processing, the instantaneous resultant force was calculated from the three orthogonal components (, , and ) as . The force plate was zeroed before each recording, and no additional smoothing or high-pass filtering was applied to the force signal. Because all force-derived variables were evaluated only within the contact phase (resultant force above the 40 N threshold) and the residual pre-contact baseline was on the order of 1–2 N, its contribution to the force–time integral was negligible (<0.5%). Peak force (, N) was defined as the maximum instantaneous resultant net force recorded during the contact phase. Impact force (, N) was defined as the mean resultant force during the force-rise phase from contact onset to peak force and was calculated as , where is the resultant net force impulse accumulated from contact onset to peak force and is the corresponding time to peak force. Net impulse (, N·s) was calculated as the time integral of the resultant net force over the complete contact phase. All force-derived variables were calculated using MATLAB software (R2019b; MathWorks, Natick, MA, USA) in accordance with the previously described procedures [31,32]. Between-trial reliability was quantified within each loading condition across the five repeated maximal-effort kicks using intraclass correlation coefficients (two-way random-effects model, absolute agreement): ICC (2,1) for single measures and ICC (2,k) for the average of the five kicks, with 95% confidence intervals. Single-measure ICCs are reported as the primary, more conservative estimate of trial-to-trial reliability, and average-measure ICCs are additionally reported because all subsequent analyses used each participant’s mean of the five kicks. Relative variability was expressed as the within-participant coefficient of variation (CV), computed per participant across the five kicks and averaged across participants. ICCs were interpreted as poor (<0.50), moderate (0.50–0.75), good (0.75–0.90), or excellent (>0.90) [44].
2.3.2. Loading Conditions
To assess the influence of external military gear on the effective mass and momentum transfer, the front kicks were evaluated under two distinct conditions. The baseline condition consisted of kicks performed barefoot with no external load (NL). The experimental condition involved approximately 30 kg of carried military equipment (WL; carried-load condition), including military boots (2 kg), a mock rifle (3 kg), a ballistic vest (10 kg), and a backpack (15 kg) [31]. Because the carried-load condition differed from the unloaded condition not only in added mass but also in footwear (military boots vs barefoot) and in the spatial distribution of that mass across the body, the NL–WL contrast should be interpreted as the effect of a carried-load condition rather than of 30 kg of mass in isolation.
2.3.3. Motion Capture and Kinematics
Three-dimensional kinematics were recorded using a six-camera optical motion-capture system (Qualisys Oqus, Qualisys AB, Göteborg, Sweden) operating at 200 Hz. Following the previously described front kick protocol [29,30], retro-reflective markers were placed on the lateral malleolus (ankle), the lateral epicondyle of the femur (knee), the anterior superior iliac spine (hip), and the acromioclavicular joint (shoulder) of the kicking side, and the linear velocity of each marker was computed in Qualisys Track Manager (QTM) using the velocity calculation in the Analyze tool, expressed as the velocity magnitude (resultant speed); no smoothing filter was applied to the trajectories before or after the velocity calculation. The pre-impact foot velocity (vpre, in m·s−1) required for the impulse-based effective mass was extracted from the lateral-malleolus marker immediately before impact, whereas the peak knee, hip, and shoulder velocities were retained as secondary kinematic outcomes.
2.3.4. Synchronization
The force plate and motion-capture data were synchronized in Qualisys Track Manager (QTM) and shared a common time base. Force-derived events were mapped to the corresponding or nearest available kinematic frame, as described in Section 2.5.4 and Section 2.6.3.
2.4. Experimental Protocol
2.4.1. Warm-Up and Instructions
Prior to data collection, all participants completed a standardized 10-minute dynamic warm-up [29]. Following the warm-up, participants were instructed to execute the front kicks with maximal effort, specifically, to strike the target “as fast and as hard as possible”. These instructions are consistent with foundational methodologies assessing effective mass and the effect of force, ensuring comparability of maximal intent across studies. The kicks were performed without time constraints or external pacing (e.g., no metronome), allowing participants to initiate the strike naturally and focus solely on maximizing momentum transfer.
2.4.2. Stance, Side, and Target Height
All kicks were executed from a standardized fighting stance. The target (padded shield on the force plate) was vertically adjusted to correspond to the individual participant’s mid-torso height, representing the typical middle strike zone [29]. Additionally, participants were allowed to freely adjust their starting horizontal distance from the target to their preferred optimal fighting range. This approach avoids forcing an unnatural distance or height that could confound the individual’s kicking technique and kinematics. Consistent with the established methodology, all recorded kicks were performed exclusively with the participant’s self-reported dominant leg.
2.4.3. Trials per Condition and Rest
The testing protocol consisted of two loading conditions (without load and with load). For each condition, participants performed a series of five consecutive maximal-effort front kicks into the force plate. To minimize the confounding effects of neuromuscular fatigue, a standardized 30-second rest interval was strictly enforced between individual kicks, and a 3-minute rest period was provided between the two loading conditions [32]. For each participant and condition, all valid kicks were detected and processed, and participant-level outcomes were computed as the mean across valid trials to stabilize estimates. A comprehensive visual representation of the entire experimental protocol is provided in Figure 1. The unloaded (barefoot) condition was always performed before the carried-load condition, so the order of the two conditions was fixed rather than counterbalanced (see Section 4.5).
2.4.4. Isokinetic Strength Testing
In a separate session, conducted at least 24 h before the kicking session, the isokinetic strength of the hip internal and external rotators was assessed using a calibrated isokinetic dynamometer (Humac Norm; CSMi, Stoughton, MA, USA). After a standardized warm-up, participants were positioned supine with the knee extended, and the dynamometer axis and lever arm were aligned with the long axis of the tested limb to isolate hip internal and external rotation. The rotators of the dominant kicking leg were tested at two angular velocities, 30°·s−1 and 90°·s−1, presented in a randomized order. The slower velocity of 30°·s−1 was included to assess maximal hip-rotator strength, consistent with the protocol used in our previous front kick studies [32,39]. At each velocity, participants performed three maximal-effort repetitions in two consecutive antagonist sets, concentric internal/external rotation followed by eccentric internal/external rotation, over a minimum range of motion of 35°, with a 90 s rest interval between sets and velocities. The peak net moment (N·m) was recorded for each muscle action and velocity. The dynamometer was calibrated before the testing day according to the manufacturer’s guidelines.
2.5. Signal Processing and Event Detection
2.5.1. Identifying Individual Kicks Within a Recording
Because multiple kicks occurred in a single continuous recording, individual kick events were identified from the force signal as local maxima.
2.5.2. Contact Onset/Offset and Contact Duration
For each kick, the contact onset (ton) and contact offset (toff) were operationally defined using a fixed 40 N force threshold to reduce noise-triggered transitions and to delimit the impact phase consistently across trials. The total contact duration (Tcontact) was computed as:
Tcontact = toff − ton.
2.5.3. Force-Derived Variables
Based on the defined contact phase, the following kinetic variables were computed for each kick to describe the impact dynamics thoroughly [5]:
- Peak force (Fmax, N): The maximum instantaneous net force registered during the contact phase (the single highest force sample).
- Impact force (Fimpact, N): The mean resultant force during the force-rise phase, calculated as the resultant net force impulse accumulated from contact onset to peak force divided by the time to peak force: Fimpact = Jpeak/Tpeak, where Jpeak is the net force impulse from ton to tpeak, and Tpeak = tpeak − ton.
- Time to peak force (Tpeak, s): The time elapsed from the contact onset to the occurrence of Fmax.
- Net Impulse (J, N·s): The time integral of the magnitude of the instantaneous resultant force over the complete contact phase, from contact onset to contact offset. In the present study, J denotes the time integral of the instantaneous resultant-force magnitude rather than the magnitude of the vector impulse:
J = ∫ Fres(t) dt, integrated from ton to toff.
- Average force (Favg, N): The mean force exerted during the contact phase, computed as:
Favg = J/Tcontact.
The relationships among these force–time variables are illustrated schematically in Figure 2.
2.5.4. Kinematic Variables and Velocity Extraction
To operationalize the pre-impact velocity required by the impulse-based effective mass (Me,imp), the reference instant was defined precisely as follows. The linear foot velocity (vpre) was derived from the 3D trajectory of the lateral malleolus marker using the same time base as the force signal. Specifically, vpre (m·s−1) was extracted at the exact kinematic frame immediately preceding ton (i.e., the last frame before the force signal exceeded the 40 N threshold). This frame was used to estimate foot speed immediately before contact and before the principal impact-related deceleration. Because the motion-capture (200 Hz) and force (1000 Hz) sampling rates differed, the identified pre-impact velocity frame could precede the true contact onset by up to approximately 5 ms, on the order of a few centimeters of foot travel at pre-impact speed, introducing a small temporal uncertainty into vpre.
2.6. Acceleration Extraction and Newton-Based Effective Mass (Subsample)
2.6.1. Rationale for the Method-Comparison Subsample
Acceleration derived from optical motion capture is highly sensitive to marker-trajectory quality, filtering, and numerical differentiation, particularly around rigid impacts. Therefore, the acceleration-based calculation was restricted to a subsample of 20 participants for whom the lateral-malleolus marker trajectory around the impact event was sufficiently complete and interpretable to allow foot acceleration at the time of peak force to be extracted with acceptable confidence in both loading conditions. For the remaining 20 participants, the impact-phase trajectories did not permit sufficiently objective and reliable extraction of acceleration. These participants were excluded only from the method-comparison analysis and remained included in all primary analyses based on .
2.6.2. Motion Capture Processing Settings
In the Qualisys Track Manager (QTM 2019.3), the acceleration of the foot segment was computed using the built-in kinematic analysis function with a 2nd-degree polynomial curve fit. The window length for the calculation was set to 15 frames (corresponding to a 0.075 s window at 200 Hz). The output was generated as a 3D resultant magnitude. To avoid data distortion through double-smoothing, filtering after the calculation was disabled. The resulting acceleration was exported in mm·s−2 and subsequently converted to m·s−2 for analysis.
2.6.3. Acceleration Value Used for Effective Mass
To align with previous Newton-based effective-mass studies, the acceleration value (a) used for the effective mass calculation (Me = Fmax/a) was time-locked to the impact event [8,9]. Specifically, the resultant foot acceleration was extracted from the synchronized kinematic frame temporally corresponding most closely to the occurrence of maximal force ().
2.6.4. Acceleration-Based Effective Mass (Me,acc)
Following Newton’s second law approach established in recent effective mass literature for combat sports, the acceleration-based effective mass was computed as:
where Fmax represents the peak force registered by the force plate during the contact phase, and a is the selected foot acceleration metric at the moment of impact [8,9]. This established metric serves as a direct baseline for comparison when evaluating the newly introduced impulse-based estimate (Me,imp).
Me,acc = Fmax/a,
2.7. Primary Proposed Metric: Impulse-Based Effective Mass (Me,imp)
2.7.1. Definition and Rationale
In this study, the impulse-based effective mass (Me,imp) is defined as an impulse-equivalent estimate of effective mass. It is not intended to represent the true inertial mass of the limb–body system, but an operational proxy quantifying the amount of impulse delivered to the target per unit of pre-impact foot velocity. Throughout the manuscript, “effective mass” is therefore used as an umbrella construct; “true (inertial) effective mass” denotes the physically coupled mass that neither estimate measures directly; and Me,imp and Me,acc denote two operational proxies for it based on impulse and acceleration, respectively.
Because acceleration derived from optical motion capture can be highly sensitive to filtering and numerical differentiation, the primary effective mass estimate in this study was computed using an impulse–velocity formulation motivated by the impulse–momentum relationship. This operationalization expresses the estimate as the resultant force–time integral defined in Section 2.5.3 divided by the striking segment’s pre-impact speed [45]. For each kick, the impulse-based effective mass was calculated as:
where J is the time integral of the instantaneous resultant-force magnitude over the complete contact phase, as defined in Section 2.5.3, and vpre is the linear foot velocity at the predefined reference instant immediately before impact (as defined in Section 2.5.4). This formulation provides an impulse-equivalent effective mass under the simplifying assumption that the strike meaningfully dissipates the incoming foot momentum during contact (i.e., the change in velocity is proportional to J). In the present implementation, is the time integral of the instantaneous resultant net-force signal, , over the complete contact phase, and is the resultant speed of the foot marker; both quantities are therefore resultant rather than strictly target-normal. Because the metric integrates the entire contact phase, J reflects not only the momentum carried into the impact by the pre-impact foot but also any force actively developed by the body–equipment system during contact; Me,imp is therefore best read as a contact-integrated index of impulse-transfer capacity rather than as the instantaneous coupled mass at the moment of impact.
Me,imp = J / vpre,
To account for inter-individual differences and to express the operational estimate relative to total body mass, this value was additionally expressed as a percentage of body mass (BM):
Me,imp (%) = (Me,imp / BM) × 100.
For transparency, the impulse-based effective mass was computed for each kick as follows: (i) the contact phase was delimited using a fixed 40 N force threshold (Section 2.5.2); (ii) the resultant force–time integral was calculated over the contact phase; (iii) the pre-impact foot velocity was taken at the last kinematic frame before contact onset (Section 2.5.4); (iv) Me,imp was obtained as the ratio of net impulse to pre-impact foot velocity (Equation (5)); and (v) participant-level values were averaged across the valid trials in each condition.
2.7.2. Methodological Considerations
It is critical to note that Me,imp is not claimed to be a perfect physical representation of the “true effective mass” of the limb system. During a real strike, the foot velocity (vpre) is not necessarily reduced to absolute zero, and the resulting estimate depends directly on the specific pre-impact instant chosen for kinematic extraction. Instead, the metric is introduced here as an operational proxy that showed good reliability when averaged across repeated kicks and may therefore be suitable for within-study comparisons in applied settings. Its primary purpose is to enable robust within-study comparisons of contact-integrated impulse-transfer capacity across carried-load conditions, where direct impact-phase acceleration data may be compromised by filter-driven noise. Accordingly, Me,imp and the acceleration-based Me,acc are treated here as two non-interchangeable operational proxies that emphasize different mechanical aspects of the contact (whole-contact impulse vs the peak-instant acceleration). Their comparison (Section 2.9) is framed as a method comparison rather than as a test of convergent validity.
2.8. Effect of Force (EF): Original and Modified Definitions
2.8.1. Original EF Coefficient
To maintain methodological continuity with recent combat sports literature, the original “effect of force” coefficient (EF) was calculated. This metric is defined as the ratio of peak force to total contact duration, scaled by 100 to avoid excessively large values:
where Fmax is the peak force, and Tcontact is the total contact duration. This definition is motivated by the biomechanical concept that contact time strongly influences the nature of the interaction; it quantitatively differentiates between a short, destructive “strike-like” action (high force, short contact) and a “push-like” action (lower force, longer contact).
EF = Fmax / (Tcontact × 100),
2.8.2. Modified EF Coefficient (EFmod)
While EF provides valuable insights into the overall strike, the total contact duration (Tcontact) can be highly sensitive to the definition of the contact offset (the “tail” of the force-time curve). Therefore, to specifically focus on the critical impact build-up phase, we propose a modified coefficient analogous to the original EF, replacing the total contact duration with the time to peak force (Tpeak):
where Tpeak is the time elapsed from the contact onset to the occurrence of Fmax. This novel formulation retains the fundamental logic of dividing force by a relevant time scale but targets a more impact-specific time interval that describes the explosiveness of the initial collision. In the present study, EFmod is reported as a secondary, exploratory effect-of-force metric, alongside the original coefficient, to ensure comparability with prior research.
EFmod = Fmax / (Tpeak × 100),
2.9. Statistical Analysis
2.9.1. Data Inclusion and Preprocessing
The primary inferential dataset included 40 participants with complete paired values for both the unloaded (NL) and loaded (WL) conditions. Outliers were managed proactively based on predefined criteria: individual kick trials were excluded if marker dropout occurred within 50 ms of contact onset or if the force curves exhibited clipping or saturation artifacts. For each participant and condition, the outcomes were computed as the mean across the valid kicks to stabilize the estimates. As a post hoc sensitivity analysis, the primary NL–WL comparison for Me,imp was repeated after excluding one participant whose loaded-condition contact duration exceeded the group mean by more than 3 SD.
2.9.2. Primary Outcomes and Hypothesis Tests
To maintain a focused analytical framework, the primary confirmatory outcomes were defined as the newly proposed impulse-based effective mass in absolute terms (Me,imp, kg) and relative to body mass (Me,imp %). The original and modified effect of force coefficients ( and ) were treated as secondary exploratory outcomes. The remaining secondary exploratory outcomes were peak force (), impact force (), net impulse (), total contact duration (), time to peak force (), average force (), and pre-impact linear foot velocity ().
The normality of within-subject differences between the NL and WL conditions was assessed using the Shapiro–Wilk test. For normally distributed data, a paired-samples t-test was used to assess differences. The effect sizes for the t-tests were reported as Cohen’s dz (the mean of the paired differences divided by their standard deviation) with 95% confidence intervals (CI). If the assumption of normality was violated, the nonparametric Wilcoxon signed-rank test was used, with effect sizes estimated using the rank-biserial correlation accompanied by 95% CIs.
2.9.3. Method-Comparison Analysis (Subsample)
To compare the newly proposed impulse-based metric with the established acceleration-based metric, the acceleration-based effective mass (Me,acc) was computed using the Newton-based formulation for the subsample of 20 participants with usable impact-phase foot-marker acceleration traces, yielding 40 paired observations across the two loading conditions. Because the two metrics are expected to capture different mechanical aspects of the contact, this analysis is framed as a method comparison (agreement analysis) rather than as a test of convergent validity. The relationship between Me,imp and Me,acc was assessed using both Pearson’s product-moment and Spearman’s rank-order correlation coefficients. Furthermore, a Bland–Altman analysis was conducted to describe the limits of agreement and to evaluate any potential systematic bias between the two approaches. Because the 40 paired observations were nested within 20 participants, this dependence was addressed explicitly: the two estimates were additionally correlated within each loading condition separately and with a repeated-measures correlation (rmcorr); the repeated-measures Bland–Altman limits of agreement were computed as the mean difference ± 1.96 times the total standard deviation of the differences, with the total variance obtained by summing the within-participant variance of the differences and the between-participant variance of the participant-mean differences. The 95% confidence interval for the mean Bland–Altman bias was estimated using a participant-level cluster bootstrap with 20,000 resamples, in which participants rather than individual condition-specific observations were resampled.
2.9.4. Multiplicity and Transparency
To control for the inflation of Type I errors across the secondary exploratory endpoints, the false discovery rate was controlled using the Benjamini–Hochberg procedure (FDR, q = 0.05). The FDR correction was applied jointly across all nine predefined secondary exploratory outcomes: peak force, impact force, net impulse, total contact duration, time to peak force, average force, pre-impact foot velocity, and the original and modified effect-of-force coefficients. The two primary impulse-based effective-mass outcomes were excluded from this correction. Other kinematic descriptors, including peak knee, hip, and shoulder velocities, were reported without FDR adjustment. All statistical analyses were performed in R (version 4.4; R Core Team, Vienna, Austria) using the lme4 and lmerTest packages for the linear mixed-effects models, the psych and irr packages for the intraclass correlation coefficients, the rmcorr package for the repeated-measures correlation, and base R for the Benjamini–Hochberg correction, the Bland–Altman analysis, and the participant-level cluster bootstrap; the alpha level was set a priori at 0.05.
2.9.5. Statistical Sensitivity (Minimum Detectable Effect)
A statistical sensitivity (minimum detectable effect) analysis was conducted using G*Power software (version 3.1.9.7; Kiel University, Kiel, Germany) to determine the minimum detectable effect sizes for the given sample sizes. For the primary within-subject comparison between the NL and WL conditions (n = 40), assuming a two-tailed paired samples t-test with an alpha error probability set at 0.05 and a statistical power (1-β) of 0.80, the computed sensitivity revealed that the study was adequately powered to detect a minimum effect size of Cohen’s dz = 0.46. For the method-comparison subsample (), the sensitivity analysis was limited to the correlation component of the analysis. An exact two-tailed bivariate correlation test (, ) yielded a minimum detectable correlation of . This calculation does not constitute a formal power or precision analysis for the absolute-agreement ICC or the Bland–Altman limits of agreement; these estimates of agreement should therefore be interpreted with appropriate caution. For the correlational analyses performed on the full sample (n = 40), the corresponding minimum detectable correlation was approximately r = 0.43 at 80% power (critical |r| ≈ 0.31 for two-tailed significance at α = 0.05); the r = 0.58 bound applies specifically to the n = 20 method-comparison subsample. Associations weaker than these bounds were estimated with reduced power and warrant replication.
2.9.6. Mechanistic, Interaction, and Exploratory Analyses
To describe whether the within-subject WL–NL difference in Me,imp primarily reflected changes in net impulse or pre-impact foot velocity (H1), within-subject change scores (WL minus NL) for Me,imp were correlated with the corresponding change scores for net impulse and pre-impact foot velocity. Because Me,imp is defined as J/vpre, these correlations are not independent of the metric; they are therefore reported as a descriptive decomposition of the change in Me,imp into its impulse and velocity components rather than as independent mechanistic evidence. Based on the isokinetic protocol used in our previous front kick studies [32,39], concentric internal and external hip rotation at 30°·s−1 were specified a priori as the primary strength variables for testing H2. The condition-dependence of the strength–effective-mass relationship was tested using linear mixed-effects models with Me,imp as the outcome and loading condition (NL vs. WL), standardized isokinetic hip-rotation strength, standardized body mass, and the condition-by-strength interaction as fixed effects, with a random intercept for participant. Separate models were fitted for concentric internal and external rotation at 30°·s−1, and the interaction term tested whether the strength–effective-mass relationship differed between conditions independently of body mass. Because H2 was evaluated using two prespecified primary interaction models (concentric internal and external rotation at 30°·s−1), the corresponding interaction p-values were additionally adjusted using a Bonferroni correction. As supplementary distribution-free checks, Spearman correlations between isokinetic strength and Me,imp were computed within each loading condition, with Benjamini–Hochberg correction applied separately across the eight isokinetic variables. Correlations between each isokinetic variable and the within-subject WL–NL change in Me,imp were treated as a separate exploratory family and were likewise corrected across the eight variables using the Benjamini–Hochberg procedure. Agreement was further quantified by a two-way, absolute-agreement intraclass correlation coefficient between Me,imp and Me,acc, complementing the Bland–Altman analysis. Finally, exploratory Spearman correlations examined the dependence of Me,imp (absolute and as % body mass) on total body mass and its association with peak and impact force.
2.9.7. Supplementary Robustness Analyses
Three exploratory, non-prespecified analyses were performed on the raw signals to probe the robustness of the main findings. First, the sensitivity of the net impulse to the contact-threshold definition was examined by recomputing the impulse using contact thresholds of 20, 30, 40, and 50 N and expressing the differences relative to the primary 40 N threshold. Second, for the kicks in which the kicking-foot lateral-malleolus marker was tracked continuously through contact, the minimum foot speed during contact, its timing relative to the mean contact duration, and the occurrence of substantial post-minimum reacceleration (defined as a rise in resultant foot speed above 2.5 m/s after the minimum) were examined. Third, participants included in the method-comparison subsample were compared with the remaining participants in body mass, peak force, and pre-impact foot velocity using Welch t-tests and Mann–Whitney U tests, without correction for multiple comparisons. These analyses were exploratory; the force and kinematic signals were synchronized but sampled at different frequencies.
3. Results
3.1. Participants and Data Overview
Forty male military cadets completed both loading conditions and were included in the primary analysis (age: 22.5 ± 2.3 years; body mass: 82.0 ± 6.6 kg; height: 180.9 ± 5.9 cm). For each participant and condition, outcomes were averaged across valid maximal-effort kicks. For individual kicks, single-measure reliability ranged from poor to good across the kinetic and velocity variables (ICC(2,1) = 0.46–0.77 across conditions). For example, ICC(2,1) values for net impulse were 0.76 in NL and 0.70 in WL, whereas those for impact force were 0.64 and 0.57, respectively. The impulse-based effective mass showed poor-to-moderate single-kick reliability (ICC(2,1) = 0.46 in NL and 0.52 in WL). Because all analyses used participant-level means across repeated kicks, average-measures reliability was good to excellent for all variables (ICC(2,k) = 0.84–0.95), including the impulse-based effective mass (0.84 in NL and 0.87 in WL). Within-participant coefficients of variation ranged from 8% to 17%; for the impulse-based effective mass, they were 11.7% in NL and 17.4% in WL.
Descriptive statistics and within-subject comparisons for all kinetic, kinematic, and derived variables are summarized in Table 1.
3.2. Impulse-Based Effective Mass (Primary Outcome)
The impulse-based effective mass was significantly higher in the loaded (WL) than in the unloaded (NL) condition, both in absolute terms (NL: 21.89 ± 5.14 kg; WL: 25.95 ± 5.44 kg; p < 0.001, Cohen’s dz = 0.92) and when expressed relative to body mass (NL: 26.8 ± 6.1%; WL: 31.9 ± 7.2%; p < 0.001, dz = 0.92; Figure 3). Consistent with hypothesis H1, this between-condition difference reflected a 21% greater net impulse in WL (NL: 168.0 ± 38.8 N·s; WL: 203.8 ± 47.1 N·s; p < 0.001, dz = 1.17), whereas pre-impact foot velocity did not differ between conditions (NL: 7.80 ± 1.37 m·s−1; WL: 7.94 ± 1.33 m·s−1; p = 0.41). The mean WL–NL difference in Me,imp was 4.06 kg (95% CI 2.66 to 5.46) in absolute terms and 5.12 percentage points of body mass (95% CI 3.34 to 6.91). Because Me,imp is defined as J/vpre, the within-subject WL–NL difference primarily reflected the increase in net impulse, whereas pre-impact foot velocity remained essentially unchanged. Consistent with this decomposition, and reported as such rather than as independent mechanistic evidence, given the definitional link, the within-subject change in Me,imp covaried with the change in net impulse (Pearson r = 0.73, p < 0.001, 95% CI 0.54 to 0.85) and, more weakly and inversely, with the change in pre-impact foot velocity (Pearson r = −0.46, p = 0.003, 95% CI −0.67 to −0.17). A post hoc sensitivity analysis excluding the participant whose loaded-condition contact duration exceeded the group mean by more than 3 SD left the primary effect essentially unchanged (+3.83 kg, p < 0.001).
3.3. Secondary Kinetic and Kinematic Outcomes
The force–time profile differed between the NL and WL conditions. Total contact duration lengthened under load (NL: 0.145 ± 0.041 s; WL: 0.174 ± 0.057 s; p < 0.001, dz = 0.70), and impact force increased (NL: 2884 ± 839 N; WL: 3217 ± 749 N; p = 0.001, dz = 0.55). Peak force showed a small decrease under load (NL: 5849 ± 1647 N; WL: 5408 ± 1268 N; dz = −0.33) that did not survive correction for multiple comparisons. The proximal segment velocities were markedly reduced under load: peak hip velocity (NL: 2.51 ± 0.54 m·s−1; WL: 2.06 ± 0.49 m·s−1; p < 0.001, dz = −1.11) and peak shoulder velocity (NL: 1.47 ± 0.33 m·s−1; WL: 1.27 ± 0.27 m·s−1; p < 0.001, dz = −1.07) both declined, whereas pre-impact foot velocity did not differ between conditions. Knee velocity did not differ significantly between conditions (p = 0.077). Average force and time to peak force did not differ between conditions (p = 0.51 and p = 0.11, respectively).
Consistent with the lengthening of contact and with peak force no longer differing significantly after FDR correction, the original effect-of-force coefficient decreased under load (NL: 427.9 ± 156.1; WL: 337.5 ± 128.3; p < 0.001, dz = −0.61). The modified coefficient EFmod, which refers to the time to peak force rather than the total contact duration, did not differ between conditions (NL: 5705 ± 2603; WL: 5534 ± 1887; p = 0.82).
3.4. Agreement with the Acceleration-Based Estimate (Method Comparison)
In the method-comparison subsample (20 participants with usable impact-phase foot-marker acceleration traces in both conditions, yielding 40 paired observations), the impulse-based and acceleration-based estimates showed essentially no agreement, consistent with the anticipated limited interchangeability of the two methods (Table 2). The two metrics were not significantly correlated (Pearson r = 0.10, p = 0.54; Spearman ρ = 0.10, p = 0.54), and their absolute agreement was negligible (two-way absolute-agreement ICC = 0.02, 95% CI −0.09 to 0.18). The lack of a statistically significant association was also observed when each loading condition was analysed separately (NL: r = 0.25, p = 0.28; WL: r = −0.07, p = 0.78) and in a repeated-measures correlation (rrm = 0.13, 95% CI −0.32 to 0.54, p = 0.56), and the Bland–Altman limits of agreement widened only marginally when recomputed for the repeated-measures structure (−61 to +18 kg). On average, the acceleration-based estimate was about twice the impulse-based estimate (Me,acc 44.8 ± 16.6 kg, ≈54% of body mass, vs. Me,imp 23.3 ± 4.7 kg, ≈28% of body mass). The Bland–Altman analysis showed a mean bias of −21.5 kg with wide limits of agreement (−55 to +11 kg); the plot visually suggested that the discrepancy increased at higher mean values (Figure 4). These findings indicate that the two operational estimates are not interchangeable.
Figure 4.
Bland–Altman plot of the agreement between the impulse-based (Me,imp) and acceleration-based (Me,acc) effective mass estimates (40 paired observations from 20 participants). The solid line denotes the mean bias (−21.5 kg) and the dashed lines the 95% limits of agreement (−55 to +11 kg); the dotted line marks zero difference. Open circles, no load (NL); filled circles, carried load (WL). The widening negative difference at higher values visually suggests that the discrepancy increased as the mean of the two estimates increased.
Figure 4.
Bland–Altman plot of the agreement between the impulse-based (Me,imp) and acceleration-based (Me,acc) effective mass estimates (40 paired observations from 20 participants). The solid line denotes the mean bias (−21.5 kg) and the dashed lines the 95% limits of agreement (−55 to +11 kg); the dotted line marks zero difference. Open circles, no load (NL); filled circles, carried load (WL). The widening negative difference at higher values visually suggests that the discrepancy increased as the mean of the two estimates increased.
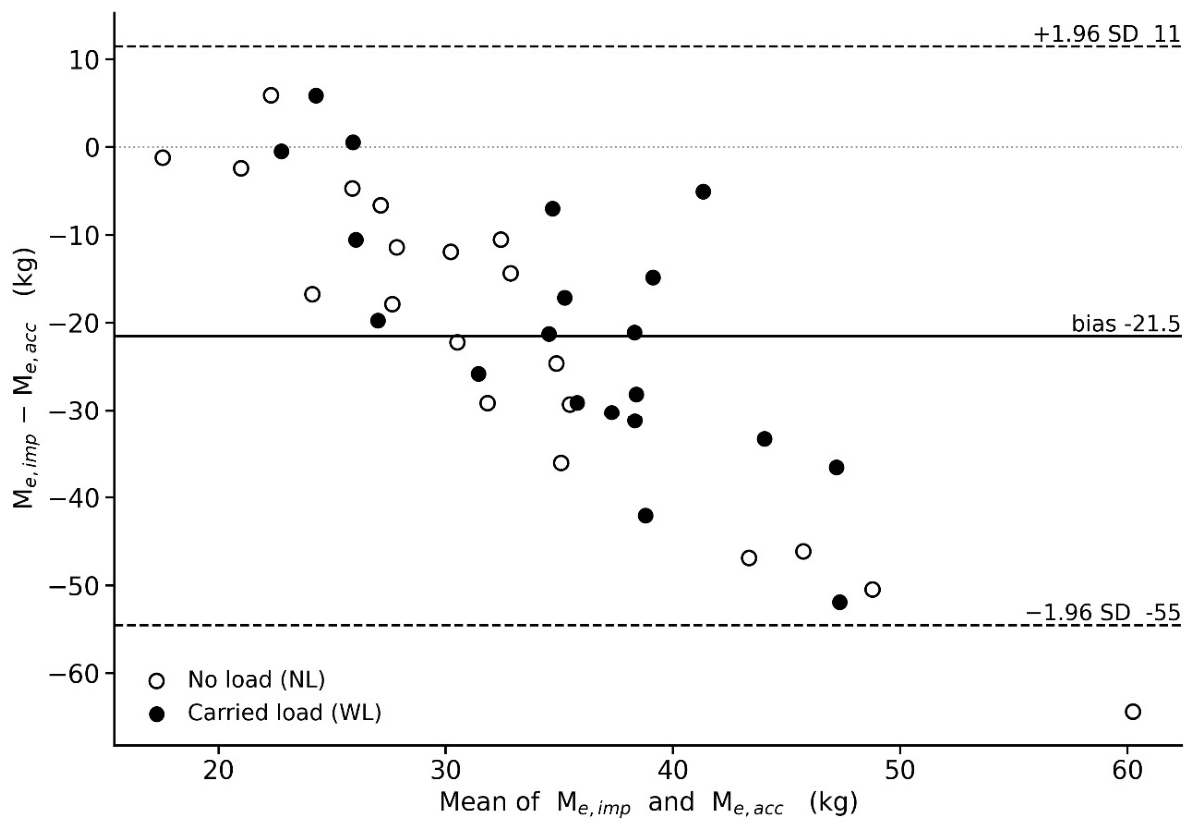

Table 2.
Agreement between the impulse-based (Me,imp) and acceleration-based (Me,acc) effective mass estimates in the method-comparison subsample.
Table 2.
Agreement between the impulse-based (Me,imp) and acceleration-based (Me,acc) effective mass estimates in the method-comparison subsample.
| Parameter | Value |
|---|---|
| Me,imp (kg) | 23.3 ± 4.7 |
| Me,imp (% body mass) | ≈28% |
| Me,acc (kg) | 44.8 ± 16.6 |
| Me,acc (% body mass) | ≈54% |
| Pearson r | 0.10 (p = 0.54) |
| Spearman ρ | 0.10 (p = 0.54) |
| Bland–Altman bias (kg) | −21.5 (95% CI −27.1 to −16.0) |
| 95% limits of agreement (kg) | −55 to +11 |
| Agreement ICC (two-way, absolute) | 0.02 (95% CI −0.09 to 0.18) |
| Pearson r, NL only | 0.25 (p = 0.28) |
| Pearson r, WL only | −0.07 (p = 0.78) |
| Repeated-measures correlation | 0.13 (95% CI −0.32 to 0.54; p = 0.56) |
| Bland–Altman LoA, repeated measures (kg) | −61 to +18 |
Descriptive values are pooled across both loading conditions (40 paired observations from 20 participants). The 95% CI for the mean bias was obtained by a participant-level (cluster) bootstrap; the limits of agreement are reported without confidence intervals because the paired observations are nested within participants.
3.5. Relationship with Isokinetic Hip-Rotator Strength
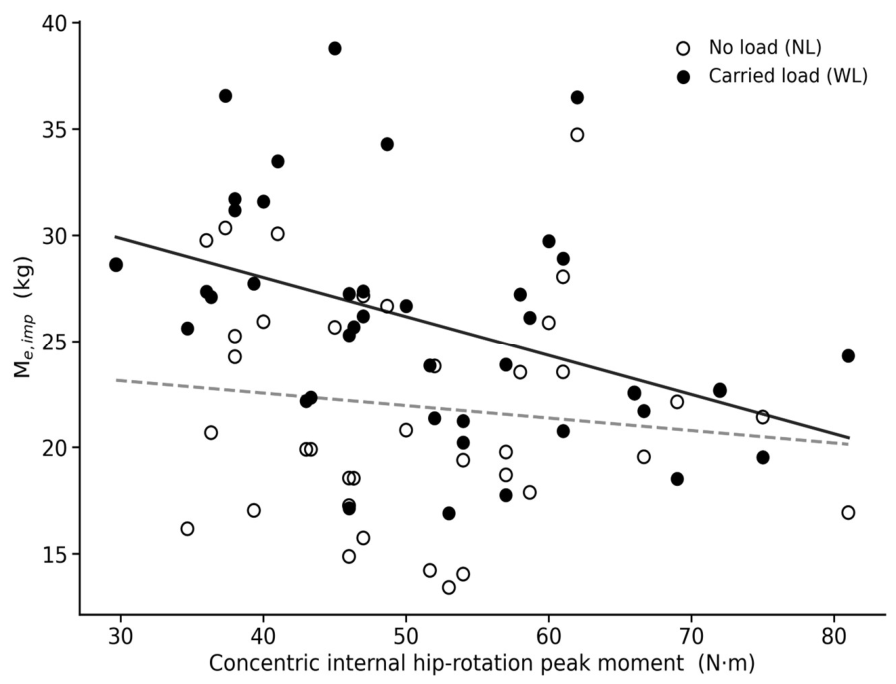
The condition-by-strength interactions were consistent with H2, although the negative direction of the associations in the WL condition was not hypothesized and is interpreted post hoc (Table 3, Figure 5). In the linear mixed-effects models adjusted for body mass, the loading-condition × strength interaction was significant for both concentric internal rotation at 30°·s−1 (b = −1.52 kg per SD, 95% CI −2.85 to −0.20, p = 0.025) and concentric external rotation at 30°·s−1 (b = −1.55 kg per SD, 95% CI −2.87 to −0.23, p = 0.022). The Bonferroni-adjusted -values for the two primary interaction tests were 0.050 for internal rotation and 0.044 for external rotation. A one-standard-deviation higher rotator strength corresponded to an approximately 1.5 kg smaller NL-to-WL increase in Me,imp. The main effect of load was +4.07 kg (p < 0.001), whereas neither the strength main effect nor body mass reached significance. The supplementary correlation analyses (Table 4) were consistent with the models: in the unloaded condition, no statistically significant association was observed between any isokinetic variable and Me,imp (all p > 0.27), whereas in the carried-load condition Me,imp correlated negatively with concentric internal (ρ = −0.45) and external (ρ = −0.40) rotation at 30°·s−1, both surviving Benjamini–Hochberg correction (FDR-adjusted p = 0.031 and 0.045).
The supplementary correlations between isokinetic strength and the within-subject WL–NL change in Me,imp were directionally consistent (ρ = −0.36 and −0.41) but did not remain significant after Benjamini–Hochberg correction across the eight isokinetic variables (adjusted p = 0.10 and 0.07); they are therefore regarded as exploratory. No statistically significant associations were observed between eccentric rotator strength and Me,imp in either condition. For the two primary condition × strength interaction tests, Bonferroni-adjusted p-values were 0.050 for internal rotation and 0.044 for external rotation. Other p-values in Table 3 are unadjusted.
Table 4.
Spearman correlations between isokinetic hip-rotation strength and the impulse-based effective mass (Me,imp) within each loading condition, and between strength and the within-subject WL–NL change in Me,imp. n = 40.
Table 4.
Spearman correlations between isokinetic hip-rotation strength and the impulse-based effective mass (Me,imp) within each loading condition, and between strength and the within-subject WL–NL change in Me,imp. n = 40.
| Isokinetic variable | NL ρ (p) | WL ρ (p) | WL p (FDR) | WL–NL change ρ (p) | WL–NL change p (FDR) |
|---|---|---|---|---|---|
| Internal rotation, concentric, 30°·s−1 | −0.13 (0.42) | −0.45 (0.004) | 0.031 | −0.36 (0.024) | 0.097 |
| External rotation, concentric, 30°·s−1 | −0.02 (0.91) | −0.40 (0.011) | 0.045 | −0.41 (0.009) | 0.071 |
| Internal rotation, concentric, 90°·s−1 | +0.09 (0.57) | −0.16 (0.33) | 0.330 | −0.31 (0.052) | 0.139 |
| External rotation, concentric, 90°·s−1 | −0.09 (0.56) | −0.34 (0.031) | 0.084 | −0.26 (0.102) | 0.200 |
| Internal rotation, eccentric, 30°·s−1 | +0.10 (0.53) | +0.18 (0.26) | 0.299 | +0.10 (0.55) | 0.591 |
| External rotation, eccentric, 30°·s−1 | +0.05 (0.74) | +0.27 (0.089) | 0.178 | +0.25 (0.13) | 0.200 |
| Internal rotation, eccentric, 90°·s−1 | +0.08 (0.63) | +0.22 (0.18) | 0.235 | +0.14 (0.39) | 0.513 |
| External rotation, eccentric, 90°·s−1 | +0.18 (0.27) | +0.26 (0.11) | 0.178 | +0.09 (0.59) | 0.591 |
Abbreviations: NL, no load; WL, carried load; ρ, Spearman coefficient; FDR, Benjamini–Hochberg adjusted p across the eight variables. The WL–NL change column reports the correlation between isokinetic strength and the within-subject difference in Me,imp (WL-NL). Benjamini–Hochberg correction was applied within each loading condition across the eight isokinetic variables; in the unloaded condition, no adjusted p-value fell below 0.80, so only the loaded-condition adjusted p-values are tabulated.
Figure 5.
Relationship between the concentric internal hip-rotation peak moment and the impulse-based effective mass (Me,imp) under no load (NL; open circles, dashed line) and carried load (WL; filled circles, solid line). The steeper negative slope under WL reflects the condition × strength interaction for concentric internal rotation (unadjusted p = 0.025; Bonferroni-adjusted p = 0.050; mixed-effects model adjusted for body mass).
Figure 5.
Relationship between the concentric internal hip-rotation peak moment and the impulse-based effective mass (Me,imp) under no load (NL; open circles, dashed line) and carried load (WL; filled circles, solid line). The steeper negative slope under WL reflects the condition × strength interaction for concentric internal rotation (unadjusted p = 0.025; Bonferroni-adjusted p = 0.050; mixed-effects model adjusted for body mass).
3.6. Exploratory Associations
Me,imp was not significantly related to total body mass in either condition (NL: ρ = 0.22, p = 0.17; WL: ρ = 0.00, p = 0.98). In NL, Me,imp was positively associated with peak force (ρ = 0.37, p = 0.018) and impact force (ρ = 0.33, p = 0.039); these associations were not statistically significant in WL. These analyses were exploratory and were not adjusted for multiple comparisons.
3.7. Supplementary Robustness Analyses
Varying the contact threshold between 20 and 50 N changed the net impulse by less than 2% on average (maximum individual difference 7%) relative to the primary 40 N threshold, indicating robustness to this choice. In the trajectory sub-analysis (140 kicks from 20 participants, 64 no-load and 76 carried-load, with continuous lateral-malleolus tracking; kicks were nested within participants), the foot decelerated from a pre-impact speed of approximately 8 m/s to a minimum below 1 m/s in every kick (mean minimum 0.4 m/s), with substantial post-minimum reacceleration meeting the predefined criterion in only 3% of kicks; the velocity minimum occurred descriptively earlier under carried load than without load (approximately 30% versus 60% of the mean contact duration). The method-comparison subsample (n = 20) did not differ significantly from the remaining participants in body mass (83.5 ± 6.8 vs. 80.4 ± 6.2 kg), peak force, or pre-impact foot velocity (all p > 0.05); nevertheless, data-quality-related selection bias, particularly for unmeasured characteristics, cannot be excluded.
4. Discussion
The aim of this study was to introduce an impulse-based effective-mass estimate for the front kick and to evaluate its sensitivity to a carried-load condition. Three main findings emerged. First, Me,imp was higher in WL than in NL; by construction, this difference primarily reflected a greater net impulse, whereas pre-impact foot velocity remained unchanged. Second, Me,imp and Me,acc were not significantly correlated and showed negligible absolute agreement, indicating that the two estimates capture different mechanical features of the impact and should not be used interchangeably. Third, the association between concentric hip-rotator strength and Me,imp differed between conditions: stronger rotators were associated with a smaller WL–NL increase in Me,imp, although the negative direction was not anticipated and should be interpreted cautiously.
4.1. Higher Impulse-Based Effective Mass in the Carried-Load Condition
The central finding was that Me,imp was higher in the carried-load condition than in the unloaded barefoot condition, increasing from approximately 27% to 32% of body mass. Because Me,imp is operationally defined as J/vpre, a higher value necessarily reflects a greater impulse relative to pre-impact foot velocity. In the present data, net impulse was 21% greater in WL, whereas pre-impact foot velocity did not differ between conditions. This result should therefore be interpreted as a greater contact-integrated impulse-transfer index under WL, rather than as direct evidence that a larger true inertial mass was mechanically coupled to the foot. This is consistent with the conception of effective mass as the degree to which the kinetic chain is coupled to the striking segment, shaped by pre-impact muscular stiffening and co-contraction rather than by limb speed alone [9,13,14,15,16]. The magnitudes are biologically plausible: single-subject taekwondo data reported about 44% of body mass for the front kick [9], whereas a small ITF group reported roughly 20% for the turning kick and 73% for the side kick [8]. Our group-level front kick values (27–32%) fall within this broad, technique-dependent range, although direct numerical comparison is limited because acceleration-, momentum-, and impulse-based estimates differ in their mathematical formulation and mechanical interpretation. The Impulse Block Method [25] estimates pre-impact momentum using a different, phase-specific formulation. Because the present method integrates force over the complete contact phase, absolute effective-mass magnitudes are not directly comparable across methods, and a phase-specific decomposition of the present force–time curves would be required to quantify their numerical relationship. Previous research on effective mass likewise suggests that total body mass alone does not determine the operation of effective mass estimates [8,9,12,14]. Consistent with this, no statistically significant association between Me,imp and total body mass was observed in either condition, although a modest association cannot be excluded given the sensitivity of the present sample.
The accompanying changes in the secondary outcomes clarify how the kick is biomechanically reorganized under load. Contact duration lengthened, impact force increased, and the effect-of-force coefficient decreased, while peak force showed a small decrease that did not remain statistically significant after FDR correction, collectively describing a shift from a short, strike-like action toward a longer, more push-like force transmission as the body–equipment system becomes heavier. This is consistent with the series of front kick studies in which the carried load increased impulse and contact time, and lowered the peak velocity of the proximal segments [31,32,33]. The present data replicate this proximal slowing: peak hip and shoulder velocities were approximately 18% and 14% lower, respectively, whereas pre-impact foot velocity was maintained. The strike-versus-push distinction itself originates in the effect-of-force framework [9]. The original EF coefficient decreased in WL, whereas EFmod, which references the time to peak force, did not differ between conditions. Because the absence of a statistically significant difference in EFmod does not establish equivalence, and because the force-decay phase was not analyzed independently, these findings only suggest that the WL-related changes were more evident across the complete contact phase than during the initial rise to peak force. Further phase-specific force–time analyses are required to confirm whether the principal reorganization occurred after peak force.
4.2. Methodological Interpretation and Potential Advantages of the Impulse-Based Estimate
The poor agreement between Me,imp and Me,acc should not be interpreted as evidence that one method is universally superior. Rather, it reflects their different mathematical formulations and mechanical content: Me,acc is based on peak force and impact-phase acceleration, whereas Me,imp integrates force over the complete contact phase and relates it to pre-impact foot velocity. It also speaks to a recognized gap in the effective-mass literature, where existing models have been shown not to fully capture the complexity of real impacts [12,21]. Estimating effective mass as Fmax/a requires the foot acceleration at the instant of peak force, obtained by double-differentiating an optical marker trajectory across a rigid collision; this amplifies high-frequency noise and is acutely sensitive to the filter and differentiation window [21]. The differentiation required to obtain impact-phase acceleration makes Me,acc particularly sensitive to marker quality, polynomial or filtering settings, and the temporal alignment of peak force with the kinematic frame, and in the present dataset this sensitivity limited the number of participants for whom acceleration could be extracted with acceptable confidence. In our data, the two estimates were not significantly correlated (r = 0.10, p = 0.54) and showed negligible absolute agreement (ICC = 0.02). The acceleration-based estimate (about 54% of body mass) was of the same order as values reported with acceleration- and momentum-based methods elsewhere [8,10,14,17,41], so the issue is not that it is physically impossible; the present findings therefore caution against interpreting Me,acc and Me,imp as equivalent estimates or substituting one for the other in individual-level comparisons. The impulse-based estimate avoids the second numerical differentiation and impact-phase acceleration extraction required by , relying instead on the time integral of the measured force signal and a pre-impact velocity estimate [21,22]. It should therefore be read not as the true inertial mass of the limb but as an operational proxy that showed good reliability when averaged across repeated kicks and may therefore be useful for within-study comparisons in applied settings, precisely the setting in which a contact-integrated estimate is most informative and in which differentiating a noisy acceleration signal is most problematic. A further interpretive point follows from how the metric is built. Because Me,imp integrates the whole contact phase, the impulse it uses reflects not only the momentum carried into the impact by the pre-impact foot but also any force the body–equipment system actively develops during contact. Under carried load, where contact lengthens and the delivery becomes more push-like, Me,imp therefore plausibly captures a broader impulse-transfer capacity of the whole body–equipment system rather than the instantaneous coupled mass alone. This broader construct may be useful for applied front kick assessment, but it should not be interpreted as validation against a criterion measure of true effective mass.
4.3. Condition-Dependent Association with Hip-Rotator Strength
Concentric hip-rotator strength showed a condition-dependent association with Me,imp, as demonstrated by the condition × strength interactions in the mixed-effects models. However, the negative direction was not hypothesized, the Bonferroni-adjusted result for internal rotation was exactly at p = 0.050, and the supplementary change-score correlations did not remain significant after FDR correction. The finding should therefore be considered preliminary. The involvement of hip rotation is nevertheless biomechanically coherent: isokinetic strength of the stance-leg rotators together with the kicking-leg hip flexors and extensors predicts a substantial portion of front kick force, with the rotators contributing to whole-body stabilization and momentum transfer during the strike [15,39], and targeted strength training has been shown to improve front kick dynamics [32]. Because previous studies primarily linked stance-leg hip-rotator strength and kicking-leg flexor or extensor strength to front kick performance, the present analysis, which examines the rotators of the dominant kicking leg, should be viewed as an extension of those findings rather than a direct replication. The interaction demonstrates that the strength–Me,imp slope differed between conditions, but the present design cannot determine whether this difference arose from neuromuscular recruitment, kicking technique, contact duration, segmental coordination, or another correlated factor. Stronger concentric rotators were associated with a smaller WL–NL increase in Me,imp. One possible explanation, consistent with the strike-versus-push continuum, is that stronger participants used a more rapid, strike-like strategy under WL, whereas others transferred force over a longer contact period [4,9]. However, this explanation was not directly tested because neither muscle activation nor mediation through contact duration was analyzed. These interpretations remain associative: the design establishes a load-dependent statistical relationship between rotator strength and Me,imp, rather than a causal mechanism, and the directional account above should be treated as a hypothesis for future experimentally controlled testing.
4.4. Practical Implications
These findings have practical implications for assessing front kick performance under operationally relevant conditions. Operationally, soldiers must deliver effective strikes while wearing personal protective equipment that can weigh 30 kg or more [29,30,34,35,36,37]. Because the NL and WL conditions produced different force–time and segmental-velocity profiles, testing performed only barefoot and without equipment may not fully characterize front kick mechanics during military tasks; when performance under a carried load is of interest, assessment should therefore include a representative carried-load condition. Peak force should be complemented by net impulse, contact duration, and Me,imp, because these variables provide information about force transfer over the complete contact phase. Based on the broader training literature, exercises emphasizing trunk and hip control may complement explosive lower-limb training, which has previously been associated with kicking performance [24,32,39,43]. However, the cross-sectional and unexpectedly negative association with hip-rotator strength does not by itself justify a specific hip-rotator training prescription. Finally, may be feasible for repeated applied testing because it requires force-plate data and a distal-segment velocity measurement, but does not require the extraction of impact-phase acceleration.
4.5. Limitations
Several limitations temper these conclusions. The impulse-based estimate assumes that the foot transfers the majority of its momentum to the rigid target; a supplementary analysis of the kicking-foot lateral-malleolus trajectory (Section 3.7) indicated that residual foot velocity was small (foot speed fell below 1 m/s, with substantial post-minimum reacceleration in only 3% of kicks), consistent with this assumption, so the estimate is best interpreted as an operational proxy rather than a true inertial mass; the absolute magnitude of all dynamic variables also depends on the stiffness of the target, here a rigid instrumented plate rather than a compliant body [5,18,46]. The sample comprised only male military cadets of relatively homogeneous training background, limiting generalization to female personnel, elite martial artists, and other strike types. The method-comparison analysis was based on 40 observations from 20 participants with usable impact-phase acceleration traces and therefore involved some dependence between the two conditions, which we addressed by also analyzing the conditions separately and using a repeated-measures correlation (Section 3.4). Because inclusion in the method-comparison subsample depended on the availability of usable impact-phase marker trajectories, data-quality-related selection bias cannot be excluded, and the agreement findings may not generalize to recordings with poorer trajectory quality. The subsample size also limited the precision of the ICC and the limits-of-agreement estimates. The cross-sectional design precludes causal inference about the strength–effective-mass relationship. The strength-by-condition findings should also be considered preliminary because the observed direction was not anticipated, one Bonferroni-adjusted interaction reached exactly p = 0.050, and the supplementary WL–NL change correlations did not remain significant after FDR correction. Finally, only the dominant kicking leg, a single target height, and two loading conditions were examined; whether the effective mass increase scales monotonically with intermediate loads remains to be tested [31]. Several further caveats concern the impulse-based estimate itself. First, J and vpre were implemented as resultant quantities (net force across the three plate axes and resultant marker speed) rather than as strictly target-normal components so that tangential contributions may enter the estimate, and a target-normal decomposition (Jnormal/vpre, normal) could yield somewhat different absolute values. Moreover, because J was calculated as the time integral of the instantaneous resultant-force magnitude rather than as the magnitude of the vector impulse, changes in force direction during contact could affect its absolute value. Second, because the metric integrates the whole contact, part of J may reflect force actively developed during contact rather than the pre-impact momentum alone, so Me,imp is best interpreted as a contact-integrated impulse-transfer index (Section 4.2). Third, the estimate was computed with a single fixed contact threshold (40 N) and a single pre-impact velocity frame. As the choice of threshold and pre-impact window can each influence the force–time integral (J) and the extracted vpre, the robustness of the net impulse (J) to the choice of contact threshold was confirmed in a supplementary analysis (Section 3.7). However, because the threshold also determines the reference contact onset used to select vpre, the sensitivity of the complete Me,imp estimate to the threshold-dependent velocity frame was not evaluated; sensitivity to alternative pre-impact velocity frames or windows therefore remains to be examined. Finally, the unloaded and loaded conditions differed in footwear (barefoot vs boots) and in mass distribution as well as in total mass, and were performed in a fixed, non-counterbalanced order; the NL–WL contrast therefore reflects a complete carried-load condition rather than 30 kg of added mass in isolation, and potential order, learning or fatigue effects cannot be fully excluded despite the standardized rest intervals. A related caveat concerns the source of the acceleration used for the acceleration-based estimate. Unlike the taekwondo studies that proposed it [8,9], where acceleration was measured directly with an accelerometer at a much higher sampling rate, here it was reconstructed from optical marker trajectories (200 Hz) by double differentiation; the present agreement findings therefore apply specifically to this optical-motion-capture implementation of Me,acc and should not be generalized to acceleration measured directly with higher-frequency accelerometers. Our formulation also differs from the recently validated Impulse Block Method [25] in how the impulse is used. Walters et al. [25] isolated the pre-impact (initial) momentum by separating the braking phase of the contact, whereas we integrated the net force over the complete contact and related it to a single pre-impact velocity. Consequently, our Me,imp would be expected to differ from an estimate restricted to the impulse that arrests the incoming segment momentum; the magnitude of that difference cannot be assumed a priori and should be evaluated by directly partitioning the force–time curve in future work. This reinforces the interpretation of Me,imp as a contact-integrated impulse-transfer index rather than an estimate of the instantaneous coupled mass; a pre-impact-momentum formulation would be expected to yield lower absolute values and may be preferred when a mechanically stricter estimate is required. This interpretation is supported by the trajectory sub-analysis (Section 3.7): the foot decelerated to a near-zero speed with substantial post-minimum reacceleration in only 3% of kicks, supporting the assumption that residual foot velocity was small, and reached its velocity minimum earlier under carried load, compatible with a longer, more push-like contact profile. However, this descriptive analysis does not establish how much of the later-contact impulse arose from active force generation by the body–equipment system rather than the foot’s incoming momentum.
5. Conclusions
This study introduced as a contact-integrated index of impulse-transfer capacity for the front kick and demonstrated good reliability for the mean of five kicks, although single-kick reliability was poor in the no-load and moderate in the carried-load condition. In this fixed-order within-subject comparison, was higher in the carried-load condition than in the unloaded barefoot condition, increasing from approximately 27% to 32% of body mass. By construction, this difference primarily reflected a greater net impulse, whereas pre-impact foot velocity remained unchanged; it was also accompanied by longer contact duration and a more push-like force–time profile. showed negligible absolute agreement with the acceleration-based , indicating that the two estimates are non-interchangeable operational measures of different mechanical features of the impact. should therefore not be interpreted as true inertial mass, but it may offer practical advantages for within-study comparisons because it does not require impact-phase acceleration extraction and integrates force over the complete contact phase. Stronger concentric hip rotators were associated with a smaller WL–NL increase in ; because the direction was unexpected and the supporting analyses were partly borderline or exploratory, this finding should be considered preliminary. Assessment of front kick performance under representative carried-load conditions may benefit from the inclusion of net impulse, contact duration, and alongside peak force.
Author Contributions
Conceptualization, M.V. and P.S.; methodology, M.V., V.O. and J.M.; software, M.V., V.H., J.S. and V.O.; validation, M.V. and P.S.; formal analysis, M.V. and J.M.; investigation, V.Z., T.N. and M.P.; resources, M.V. and V.Z.; data curation, M.V., V.H., J.S. and M.P.; writing—original draft preparation, M.V.; writing—review and editing, P.S., V.H., T.N. and J.M.; visualization, M.V. and M.P.; supervision, P.S.; project administration, M.V. and V.O.; funding acquisition, P.S. All authors have read and agreed to the published version of the manuscript.
Funding
This research was funded by UNCE24/SSH/012 and Charles University Cooperatio Sport Science Biomedical and Rehabilitation Medicine.
Institutional Review Board Statement
The study conformed to ethical sports and health research standards and received approval from the Faculty of Physical Education and Sport Ethics Committee, Charles University (No. 085/2022, approved 30.03.2022). All procedures were conducted in accordance with the Declaration of Helsinki.
Informed Consent Statement
Informed consent was obtained from all subjects involved in the study.
Data Availability Statement
The processed participant-level dataset, codebook, and reliability summary supporting the reported analyses are available at the Open Science Framework (OSF) repository: URL: https://osf.io/85aep/files/osfstorage/6a2d1629913dcfacb8d3d4e2.
Acknowledgments
During the preparation of this work, the authors used Claude 4.8 Opus in order to check grammar and improve the English language of the manuscript. Additionally, Claude 4.8 Opus was used to assist in generating and formatting the illustrative figures (Figure 1 and Figure 2). After using this tool, the authors thoroughly reviewed and edited the content as needed and take full responsibility for the publication’s final content.
Conflicts of Interest
The authors declare no conflicts of interest.
References
- Estevan, I.; Falco, C.; Silvernail, J.F.; Jandacka, D. Comparison of Lower Limb Segments Kinematics in a Taekwondo Kick. An Approach to the Proximal to Distal Motion. J. Hum. Kinet. 2015, 47, 41. [Google Scholar] [CrossRef] [PubMed]
- Estevan, I.; Álvarez, O.; Falco, C.; Molina-García, J.; Castillo, I. Impact Force and Time Analysis Influenced by Execution Distance in a Roundhouse Kick to the Head in Taekwondo. J. Strength Cond. Res. 2011, 25, 2851–2856. [Google Scholar] [CrossRef] [PubMed]
- Falco, C.; Alvarez, O.; Castillo, I.; Estevan, I.; Martos, J.; Mugarra, F.; Iradi, A. Influence of the Distance in a Roundhouse Kick’s Execution Time and Impact Force in Taekwondo. J. Biomech. 2009, 42, 242–248. [Google Scholar] [CrossRef] [PubMed]
- Kim, Y.K.; Kim, Y.H.; Im, S.J. Inter-Joint Coordination in Producing Kicking Velocity of Taekwondo Kicks. J. Sports Sci. Med. 2011, 10, 31–38. [Google Scholar] [PubMed]
- Pȩdzich, W.; Mastalerz, A.; Urbanik, C. The Comparison of the Dynamics of Selected Leg Strokes in Taekwondo WTF. Acta Bioeng. Biomech. 2006, 8, 83–90. [Google Scholar] [CrossRef] [PubMed]
- Sorensen, H.; Zacho, M.; Simonsen, E.; Dyhre-Poulsen, P.; Klausen, K. Dynamics of the Martial Arts High Front Kick. J. Sports Sci. 1996, 14, 483–495. [Google Scholar] [CrossRef]
- Gavagan, C.J.; Sayers, M.G.L. A Biomechanical Analysis of the Roundhouse Kicking Technique of Expert Practitioners: A Comparison between the Martial Arts Disciplines of Muay Thai, Karate, and Taekwondo. PLoS ONE 2017, 12, 1–15. [Google Scholar] [CrossRef] [PubMed]
- Gora, T.; Mosler, D.; Podstawski, R.; Wasik, J. The Impact of Effective Mass on the Strength of Side and Turning Kick in Taekwon-Do Male Practitioners. Appl. Sci. 2024, 14, 23–29. [Google Scholar] [CrossRef]
- Wąsik, J.; Mosler, D.; Góra, T.; Scurek, R. Conception of Effective Mass and Effect of Force – Measurement of Taekwon-Do Master. Phys. Act. Rev. 2023, 11, 11–16. [Google Scholar] [CrossRef]
- Walilko, T.J.; Viano, D.C.; Bir, C.A. Biomechanics of the Head for Olympic Boxer Punches to the Face. Br. J. Sports Med. 2005, 39, 710–719. [Google Scholar] [CrossRef] [PubMed]
- Bolander, R.P.; Neto, O.P.; Bir, C.A. The Effects of Height and Distance on the Force Production and Acceleration in Martial Arts Strikes. J. Sports Sci. Med. 2009, 8, 47–52. [Google Scholar] [PubMed]
- Lenetsky, S.; Nates, R.J.; Brughelli, M.; Harris, N.K. Is Effective Mass in Combat Sports Punching above Its Weight? Hum. Mov. Sci. 2015, 40, 89–97. [Google Scholar] [CrossRef] [PubMed]
- McGill, S.M.; Chaimberg, J.D.; Frost, D.M.; Fenwick, C.M.J. Evidence of a Double Peak in Muscle Activation to Enhance Strike Speed and Force: An Example with Elite Mixed Martial Arts Fighters. J. Strength Cond. Res. 2010, 24, 348–357. [Google Scholar] [CrossRef] [PubMed]
- Neto, O.P.; Magini, M.; Saba, M.M.F. The Role of Effective Mass and Hand Speed in the Performance of Kung Fu Athletes Compared with Nonpractitioners. J. Appl. Biomech. 2007, 23, 139–148. [Google Scholar] [CrossRef] [PubMed]
- Sbriccoli, P.; Camomilla, V.; Di Mario, A.; Quinzi, F.; Figura, F.; Felici, F. Neuromuscular Control Adaptations in Elite Athletes: The Case of Top Level Karateka. Eur. J. Appl. Physiol. 2010, 108, 1269–1280. [Google Scholar] [CrossRef] [PubMed]
- Quinzi, F.; Camomilla, V.; Felici, F.; Di Mario, A.; Sbriccoli, P. Differences in Neuromuscular Control between Impact and No Impact Roundhouse Kick in Athletes of Different Skill Levels. J. Electromyogr. Kinesiol. 2013, 23, 140–150. [Google Scholar] [CrossRef] [PubMed]
- Neto, O.P.; Silva, J.H.; Marzullo, A.C. de M.; Bolander, R.P.; Bir, C.A. The Effect of Hand Dominance on Martial Arts Strikes. Hum. Mov. Sci. 2012, 31, 824–833. [Google Scholar] [CrossRef] [PubMed]
- Ramakrishnan, K.R.; Wang, H.; Shankar, K.; Fien, A. A New Method for the Measurement and Analysis of Biomechanical Energy Delivered by Kicking. Sports Eng. 2018, 21, 53–62. [Google Scholar] [CrossRef]
- Pozo, J.; Bastien, G.; Dierick, F. Execution Time, Kinetics, and Kinematics of the Mae-Geri Kick: Comparison of National and International Standard Karate Athletes. J. Sports Sci. 2011, 29, 1553–1561. [Google Scholar] [CrossRef] [PubMed]
- Portela, B.S.; Barbosa, M.R.; Cavazzotto, T.G.; Tartaruga, M.P. Kinematics Analysis of the Front Kick with and without Impact on Traditional Karate. Arch. Budo 2014, 10, 47–51. [Google Scholar]
- Lenetsky, S.; Uthoff, A.; Coyne, J.; Cronin, J. A Review of Striking Force in Full-Contact Combat Sport Athletes: Methods of Assessment. Strength Cond. J. 2022, 44, 71–83. [Google Scholar] [CrossRef]
- Beránek, V.; Votápek, P.; Stastny, P. Force and Velocity of Impact during Upper Limb Strikes in Combat Sports: A Systematic Review and Meta-Analysis. Sports Biomech. 2023, 22, 921–939. [Google Scholar] [CrossRef] [PubMed]
- Beranek, V.; Stastny, P.; Novacek, V.; Votapek, P.; Formanek, J. Upper Limb Strikes Reactive Forces in Mix Martial Art Athletes during Ground and Pound Tactics. Int. J. Environ. Res. Public Health 2020, 17, 1–15. [Google Scholar] [CrossRef] [PubMed]
- Uthoff, A.; Lenetsky, S.; Reale, R.; Falkenberg, F.; Pratt, G.; Amasinger, D.; Bourgeois, F.; Cahill, M.; French, D.; Cronin, J. A Review of Striking Force in Full-Contact Combat Sport Athletes: Effects of Different Types of Strength and Conditioning Training and Practical Recommendations. Strength Cond. J. 2023, 45, 67–82. [Google Scholar] [CrossRef]
- Walters, S.; Walters, L.; Hoffman, B.; Coltman, C.E.; Mills, D.E. Validity and Reliability of a Novel Impulse-Based Method to Analyse Human Striking Performance. J. Sports Sci. 2025, 43, 842–851. [Google Scholar] [CrossRef] [PubMed]
- VencesBrito, A.M.; Branco, M.A.C.; Fernandes, R.M.C.; Ferreira, M.A.R.; Fernandes, O.J.S.M.; Figueiredo, A.A.A.; Branco, G. Characterization of Kinesiological Patterns of the Frontal Kick, Mae-Geri, in Karate Experts and Non-Karate Practitioners. Rev. De Artes. Marciales Asiáticas 2014, 9, 20–31. [Google Scholar] [CrossRef]
- Wąsik, J.; Czarny, W.; Małolepszy, E.; Drozdek-Małolepsza, T. Kinematics of Taekwon-Do Front Kick. Arch. Budo Sci. Martial Arts Extrem Sports 2015, 11, 23–28. [Google Scholar]
- Wąsik, J.; Ortenburger, D.; Góra, T.; Shan, G.; Mosler, D.; Wodarski, P.; Michnik, R.A. The Influence of Gender, Dominant Lower Limb and Type of Target on the Velocity of Taekwon-Do Front Kick. Acta Bioeng. Biomech. 2018, 20, 133–138. [Google Scholar] [CrossRef]
- Vagner, M.; Malecek, J.; Olah, V.; Stastny, P. Associations between Body Segment Mass and Punch, Front Kick, or Countermovement Jump Performance in Military Cadets. Sports 2024, 12, 1–13. [Google Scholar] [CrossRef] [PubMed]
- Vagner, M.; Maleček, J.; Hojka, V.; Kubový, P.; Stastny, P. A Carried Military Load Increases the Impact Force and Time of a Front Kick but Reduces the Peak Velocity of the Hip and Shoulder of the Kicking Leg. Arch. Budo 2020, 16, 69–76. [Google Scholar]
- Vagner, M.; Cleather, D.; Kubovy, P.; Hojka, V.; Stastny, P. Kinematic Determinants of Front Kick Dynamics Across Different Loading Conditions. Mil. Med. 2022, 187, 147–153. [Google Scholar] [CrossRef] [PubMed]
- Vagner, M.; Cleather, D.; Kubovy, P.; Hojka, V.; Stastny, P. Effect of Strength Training Programs on Front Push Kick Dynamics and Kinematics. Arch. Budo 2021, 17, 237–251. [Google Scholar]
- Vagner, M.; Thiel, D.; Jelen, K.; Tomšovský, L.; Kubový, P.; Tufano, J.J. Wearing Ballistic and Weighted Vests Increases Front Kick Forces. Arch. Budo 2018, 14, 231–237. [Google Scholar]
- Larsen, B.; Netto, K.; Skovli, D.; Vincs, K.; Vu, S.; Aisbett, B. Body Armor, Performance, and Physiology during Repeated High-Intensity Work Tasks. Mil. Med. 2012, 177, 1308–1315. [Google Scholar] [CrossRef] [PubMed]
- Swain, D.P.; Onate, J.A.; Ringleb, S.I.; Naik, D.N.; Demaio, M. Effects of Training on Physical Performance Wearing Personal Protective Equipment. Mil. Med. 2010, 175, 664–670. [Google Scholar] [CrossRef] [PubMed]
- Jaworski, R.L.; Jensen, A.; Niederberger, B.; Congalton, R.; Kelly, K.R. Changes in Combat Task Performance under Increasing Loads in Active Duty Marines. Mil. Med. 2015, 180, 179–186. [Google Scholar] [CrossRef] [PubMed]
- Botta, W.C.; Franchini, E.; Gabriel-Costa, D.; Campos, F.A.D. Physical Tests to Predict Combat Task Performance among Brazilian Air Force Infantry Cadets. Mil. Med. 2022, 188, 3095–3101. [Google Scholar] [CrossRef] [PubMed]
- Vagner, M.; Cleather, D.J.; Olah, V.; Vacek, J.; Stastny, P. A Systematic Review of Dynamic Forces and Kinematic Indicators of Front and Roundhouse Kicks across Varied Conditions and Participant Experience. Sports 2023, 11, 141. [Google Scholar] [CrossRef] [PubMed]
- Vagner, M.; Malecek, J.; Tomšovský, L.; Kubový, P.; Levitova, A.; Stastny, P. Isokinetic Strength of Rotators, Flexors and Hip Extensors Is Strongly Related to Front Kick Dynamics in Military Professionals. J. Hum. Kinet. 2019, 68, 145–155. [Google Scholar] [CrossRef] [PubMed]
- Moreira, P.V.S.; Falco, C.; Menegaldo, L.L.; Goethel, M.F.; de Paula, L.V.; Gonçalves, M. Are Isokinetic Leg Torques and Kick Velocity Reliable Predictors of Competitive Level in Taekwondo Athletes? PLoS ONE 2021, 16. [Google Scholar] [CrossRef] [PubMed]
- Pierce, J.D.; Reinbold, K.A.; Lyngard, B.C.; Goldman, R.J.; Pastore, C.M. Direct Measurement of Punch Force During Six Professional Boxing Matches. J. Quant. Anal. Sports 2006, 2, 1–17. [Google Scholar] [CrossRef]
- Bingul, B.M.; Bulgan, C.; Tore, O.; Aydin, M.; Bal, E. The Effects of Impact Forces and Kinematics of Two Different Stances at Straight Punch Techniques in Boxing. Arch. Budo Sci. Martial Arts Extrem. Sports 2017, 13, 35–39. [Google Scholar]
- Olah, V.; Trebicky, V.; Malecek, J.; Michalička, V.; Wasik, J.; Vagner, M. Is Countermovement Jump Height and One Repetition Maximum Back Squat Associated With the Peak Force of a Front Kick With and Without Carried Load? J. Strength Cond. Res. 2025, 39, 880–889. [Google Scholar] [CrossRef] [PubMed]
- Koo, T.K.; Li, M.Y. A Guideline of Selecting and Reporting Intraclass Correlation Coefficients for Reliability Research. J. Chiropr. Med. 2016, 15, 155–163. [Google Scholar] [CrossRef]
- Özkaya, N.; Leger, D.; Goldsheyder, D.; Nordin, M. Fundamentals of Biomechanics: Equilibrium, Motion, and Deformation, 4th ed.; Springer: Cham, Switzerland, 2017; ISBN 978-3-319-44737-7. [Google Scholar]
- Del Vecchio, L.; Whitting, J.W.; Hollier, J.; Keene, A.; Climstein, M. Reliability and Practical Use of a Commercial Device for Measuring Punch and Kick Impact Kinetics. Sports 2022, 10, 206. [Google Scholar] [CrossRef] [PubMed]
Figure 1.
Overview of the two-session experimental protocol. In Session 1, the isokinetic strength of the hip internal and external rotators of the dominant leg was assessed (Humac Norm; concentric and eccentric actions at 30 and 90°·s−1 in randomized order). In Session 2, at least 24 h later, front kick dynamics were recorded under two loading conditions, barefoot no load (NL) and carried load (WL), in fixed order (NL before WL), on a force plate (Kistler 9281, 1000 Hz) with synchronized six-camera motion capture (Qualisys Oqus, 200 Hz).
Figure 1.
Overview of the two-session experimental protocol. In Session 1, the isokinetic strength of the hip internal and external rotators of the dominant leg was assessed (Humac Norm; concentric and eccentric actions at 30 and 90°·s−1 in randomized order). In Session 2, at least 24 h later, front kick dynamics were recorded under two loading conditions, barefoot no load (NL) and carried load (WL), in fixed order (NL before WL), on a force plate (Kistler 9281, 1000 Hz) with synchronized six-camera motion capture (Qualisys Oqus, 200 Hz).
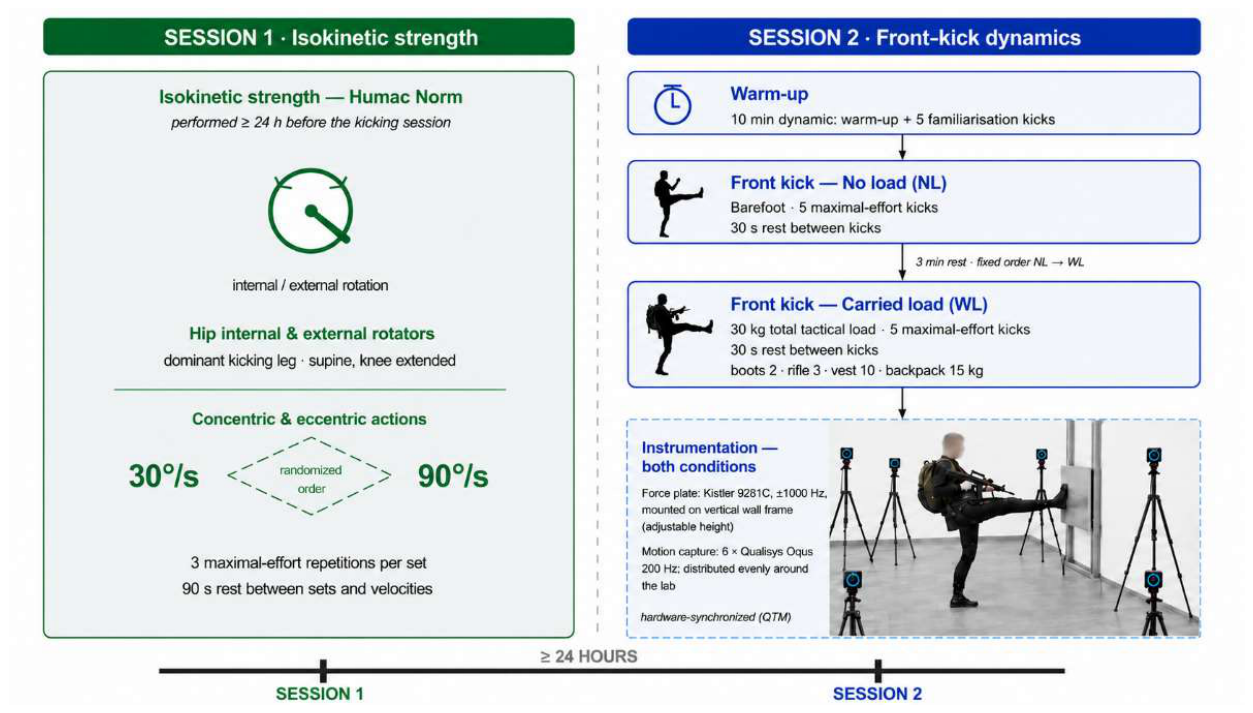
Figure 2.
Schematic of the force–time curve of a single front kick contact, illustrating the force-derived variables. The curve represents the instantaneous resultant net force. Fmax is the peak force, and Tpeak is the time from contact onset (ton) to peak force (tpeak). Impact force (Fimpact = Jpeak/Tpeak) is the mean force during this force-rise phase, where Jpeak is the area under the curve from ton to tpeak. Tcontact is the total contact duration (toff − ton). The gold-shaded rise area represents Jpeak, whereas the blue-shaded area over the full contact phase is the resultant force–time integral, hereafter referred to as net impulse (J = ∫Fres(t)dt), and Favg = J/Tcontact is the mean force over the entire contact phase. The diagram is schematic and not drawn to scale.
Figure 2.
Schematic of the force–time curve of a single front kick contact, illustrating the force-derived variables. The curve represents the instantaneous resultant net force. Fmax is the peak force, and Tpeak is the time from contact onset (ton) to peak force (tpeak). Impact force (Fimpact = Jpeak/Tpeak) is the mean force during this force-rise phase, where Jpeak is the area under the curve from ton to tpeak. Tcontact is the total contact duration (toff − ton). The gold-shaded rise area represents Jpeak, whereas the blue-shaded area over the full contact phase is the resultant force–time integral, hereafter referred to as net impulse (J = ∫Fres(t)dt), and Favg = J/Tcontact is the mean force over the entire contact phase. The diagram is schematic and not drawn to scale.
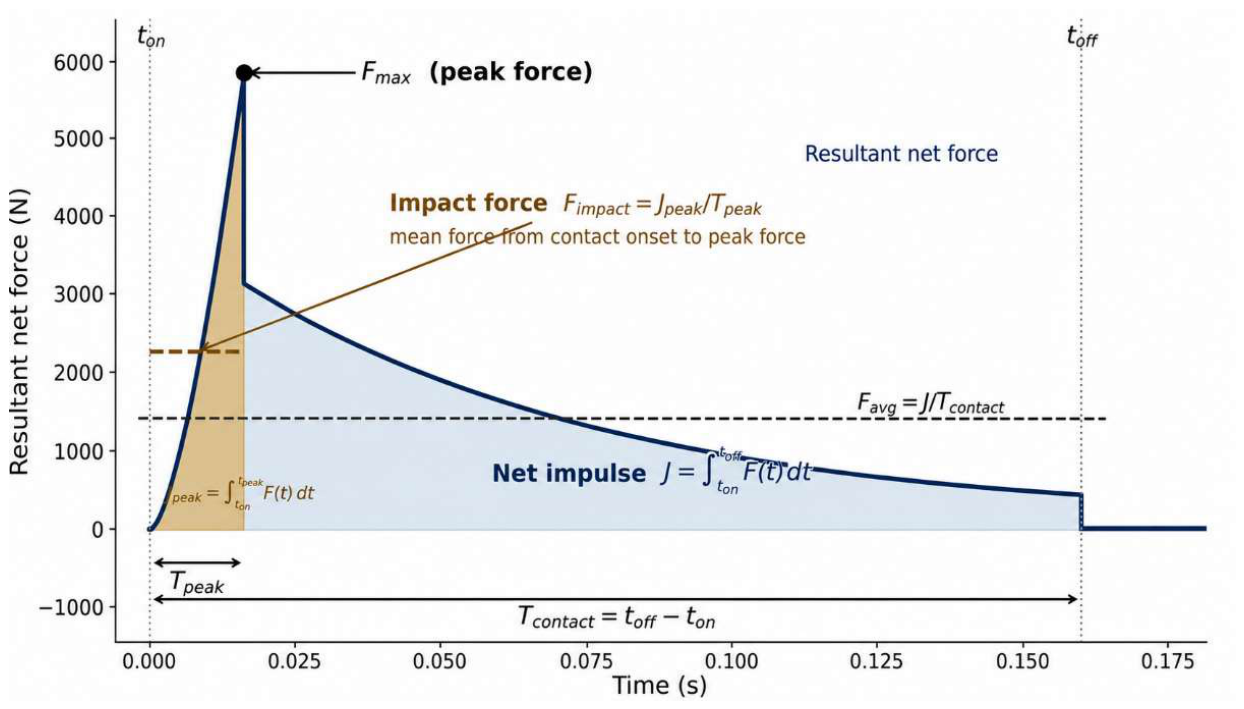
Figure 3.
Impulse-based effective mass (Me,imp) without load (NL) and under the 30 kg carried-load condition (WL), expressed (a) in absolute terms and (b) relative to body mass. Boxes show the median and interquartile range; whiskers extend to the most extreme values within 1.5× the interquartile range, and thin grey lines connect individual participants. *** p < 0.001 (paired t-test; dz = 0.92, WL − NL).
Figure 3.
Impulse-based effective mass (Me,imp) without load (NL) and under the 30 kg carried-load condition (WL), expressed (a) in absolute terms and (b) relative to body mass. Boxes show the median and interquartile range; whiskers extend to the most extreme values within 1.5× the interquartile range, and thin grey lines connect individual participants. *** p < 0.001 (paired t-test; dz = 0.92, WL − NL).
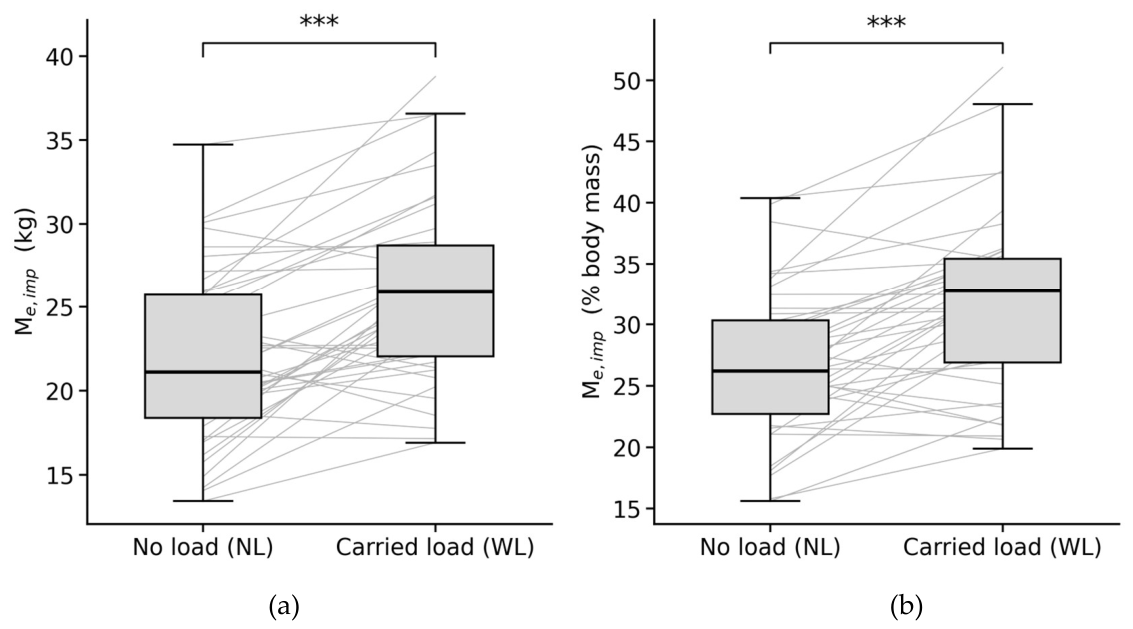
Table 1.
Kinetic, kinematic, and derived variables of the front kick in the unloaded (NL) and carried load (WL) conditions. Values are mean ± SD (n = 40).
Table 1.
Kinetic, kinematic, and derived variables of the front kick in the unloaded (NL) and carried load (WL) conditions. Values are mean ± SD (n = 40).
| Variable | NL (mean ± SD) | WL (mean ± SD) | p | FDR-adjusted p | Effect size (95% CI) |
|---|---|---|---|---|---|
| Pre-impact foot velocity (m·s−1) | 7.80 ± 1.37 | 7.94 ± 1.33 | 0.41 | 0.524 | dz = 0.13 (−0.18 to 0.44) |
| Peak knee velocity (m·s−1) | 5.28 ± 0.84 | 5.14 ± 0.87 | 0.077 | — | dz = −0.29 (−0.60 to 0.03) |
| Peak hip velocity (m·s−1) | 2.51 ± 0.54 | 2.06 ± 0.49 | <0.001 | — | dz = −1.11 (−1.50 to −0.71) |
| Peak shoulder velocity (m·s−1) | 1.47 ± 0.33 | 1.27 ± 0.27 | <0.001 | — | dz = −1.07 (−1.45 to −0.67) |
| Peak force (N) | 5849 ± 1647 | 5408 ± 1268 | 0.043 | 0.077 | dz = −0.33 (−0.65 to −0.01) |
| Impact force (N) | 2884 ± 839 | 3217 ± 749 | 0.001 | 0.003 | dz = 0.55 (0.22 to 0.88) |
| Net impulse (N·s) | 168.0 ± 38.8 | 203.8 ± 47.1 | <0.001 | <0.001 | dz = 1.17 (0.76 to 1.57) |
| Average force (N) | 1205 ± 320 | 1228 ± 303 | 0.51 | 0.569 | dz = 0.11 (−0.21 to 0.42) |
| Contact duration (s) | 0.145 ± 0.041 | 0.174 ± 0.057 | <0.001 | <0.001 | dz = 0.70 (0.35 to 1.04) |
| Time to peak force (s) | 0.012 ± 0.004 | 0.010 ± 0.002 | 0.11 | 0.163 | rrb = −0.29 (−0.61 to 0.06) |
| Effect of force, EF | 427.9 ± 156.1 | 337.5 ± 128.3 | <0.001 | 0.001 | dz = −0.61 (−0.94 to −0.27) |
| Modified effect of force, EFmod | 5705 ± 2603 | 5534 ± 1887 | 0.82 | 0.816 | rrb = −0.04 (−0.40 to 0.31) |
| Effective mass, Me,imp (kg) | 21.89 ± 5.14 | 25.95 ± 5.44 | <0.001 | — | dz = 0.92 (0.55 to 1.29) |
| Effective mass, Me,imp (% body mass) | 26.8 ± 6.1 | 31.9 ± 7.2 | <0.001 | — | dz = 0.92 (0.54 to 1.29) |
Abbreviations: NL, no load; WL, 30 kg carried load condition. p-values from paired-samples t-tests or Wilcoxon signed-rank tests. FDR-adjusted p, Benjamini–Hochberg correction across the nine secondary exploratory outcomes; — denotes outcomes outside the FDR family (the two primary Me,imp outcomes and the peak knee/hip/shoulder velocities). Effect sizes are Cohen’s dz for t-tests and rank-biserial correlations (rrb) for Wilcoxon signed-rank tests; effect-size direction was calculated as WL minus NL.
Table 3.
Linear mixed-effects models of the impulse-based effective mass (Me,imp) with a random intercept per participant; isokinetic strength and body mass are standardized (per SD). The condition-by-strength interaction is the primary test of H2.
Table 3.
Linear mixed-effects models of the impulse-based effective mass (Me,imp) with a random intercept per participant; isokinetic strength and body mass are standardized (per SD). The condition-by-strength interaction is the primary test of H2.
| Fixed effect | Internal rotation 30°·s−1 b (95% CI) | p | External rotation 30°·s−1 b (95% CI) | p |
|---|---|---|---|---|
| Intercept (NL) | 21.79 (20.18 to 23.40) | <0.001 | 21.79 (20.12 to 23.46) | <0.001 |
| Load effect (WL–NL), kg | 4.07 (2.74 to 5.39) | <0.001 | 4.07 (2.74 to 5.39) | <0.001 |
| Strength (per SD), kg | −0.80 (−2.42 to 0.81) | 0.330 | −0.11 (−1.81 to 1.58) | 0.897 |
| Body mass (per SD), kg | 0.39 (−1.08 to 1.86) | 0.606 | 0.49 (−1.07 to 2.05) | 0.535 |
| Load × strength interaction, kg | −1.52 (−2.85 to −0.20) | 0.025 | −1.55 (−2.87 to −0.23) | 0.022 |
Abbreviations: NL, no load; WL, carried load; SD, standard deviation. The interaction term tests whether the strength–Me,imp relationship differs between loading conditions.
Disclaimer/Publisher’s Note: The statements, opinions and data contained in all publications are solely those of the individual author(s) and contributor(s) and not of MDPI and/or the editor(s). MDPI and/or the editor(s) disclaim responsibility for any injury to people or property resulting from any ideas, methods, instructions or products referred to in the content. |
© 2026 by the authors. Licensee MDPI, Basel, Switzerland. This article is an open access article distributed under the terms and conditions of the Creative Commons Attribution (CC BY) license (http://creativecommons.org/licenses/by/4.0/).
Copyright: This open access article is published under a Creative Commons CC BY 4.0 license, which permit the free download, distribution, and reuse, provided that the author and preprint are cited in any reuse.