
Submitted:
06 August 2026
Posted:
07 August 2026
You are already at the latest version
Abstract
Ice accumulation on aerodynamic surfaces remains a major safety and efficiency challenge for aircraft. Conventional electrothermal deicing systems are reliable but often require more electrical power than is available on small, medium-sized, and unmanned aircraft, whereas electro-impulsive deicers introduce structural fatigue and mechanical complexity. Recently developed Ice Cavitation Deicing (ICD) demonstrated highly efficient ice removal by explosively vaporizing a thin interfacial water layer. However, the original high-temperature ICD (HTICD) operates at heating rates above 106 K/s and cavitation temperatures near 300 °C, producing foil temperatures exceeding 400 °C and requiring high-voltage film capacitors. This study develops and experimentally validates Low-Temperature and Medium-Temperature Ice Cavitation Deicing (LTICD and MTICD), extending the concept of impulse cavitation deicing into the previously unexplored intermediate heating-rate regime. Analytical modeling based on energy conservation, transient heat diffusion, water thermodynamics, and thermal-stress analysis was combined with finite-element simulations and extensive experimental testing. Stainless steel 17-7PH, titanium Grade 5, titanium Grade 1, Invar, and other foil materials were evaluated over heating rates ranging from approximately 104 to 107 K/s using capacitor banks from 0.1 to 35 mF. The experimental results demonstrate that both LTICD and MTICD effectively remove thick and thin ice while operating at cavitation temperatures of approximately 120–200 °C, substantially below those of HTICD. The lower operating temperatures and heating rates reduce thermal stress, operating voltage, and current, enable the use of practical low-voltage electrolytic capacitors, and expand the range of suitable foil and substrate materials. These results demonstrate that the cavitation-deicing mechanism can be implemented at substantially lower temperatures and with a more practical electrical architecture than HTICD, making LTICD and MTICD promising candidates for future aircraft ice-protection systems.
Keywords:
aircraft de-icing
; electro-thermal de-icing
; cavitation
; explosive vaporization
; ice protection systems
; energy efficiency
; explosive evaporation
1. Introduction
The accumulation of ice on aerodynamic surfaces remains a major safety and operational challenge for modern aviation. Ice accretion degrades aerodynamic performance, increases drag and weight, and may lead to loss of lift or controllability. Conventional electrothermal deicing systems are reliable but often require more electrical power or bleed air than is available on small, medium-sized, and unmanned aircraft. In contrast, electro-impulse deicers (EID) consume very little energy but introduce structural fatigue, additional mechanical complexity, and long-term durability concerns. Repetitive high-power electrothermal systems, including Pulse Electro-Thermal Deicing (PETD) [1,2] and cyclic deicers [3,4,5], substantially reduce energy consumption and average power requirements. However, once the ice/structure interface has melted, these systems still rely on aerodynamic forces or gravity to remove the detached ice.
Recently, Ice Cavitation Deicing (ICD) was introduced as a fundamentally different deicing concept [6]. Instead of treating the melted interfacial water layer as a by-product of melting, ICD uses it as the working fluid for a microscopic vapor explosion. When the thin water layer is rapidly heated to the temperature of explosive vaporization, the resulting cavitation event generates a high-pressure pulse that ejects the ice layer from the surface. The first generation of ICD, hereafter referred to as High-Temperature Ice Cavitation Deicing (HTICD), operated on the high-temperature branch of homogeneous water nucleation at heating rates exceeding 106 K/s and cavitation temperatures near 300 °C [7,8]. The method demonstrated efficient ice removal, ejecting ice fragments at velocities of up to 10 m/s. However, the high operating temperatures produced foil temperatures exceeding 400 °C in ice-free regions, resulting in high thermal stresses, restricted material selection, and the need for high-voltage film-capacitor energy-storage systems.
The dependence of the homogeneous nucleation temperature of water on heating rate has been investigated extensively. Nevertheless, experimentally validated correlations are available primarily for the low-heating-rate region (102–104 K/s) and the very high-heating-rate region (106–109 K/s). Reliable experimental data for the intermediate range of approximately 104–106 K/s remain scarce [9], with only limited measurements reported for rapidly heated SS304 wire [10]. Figure 1, adopted from [9], shows the three regions.
In addition, previous investigations of explosive water evaporation have almost exclusively employed platinum or gold microheaters because of their stable electrical properties and suitability for resistance thermometry. Comparable studies using engineering structural materials, such as stainless steel 17-7PH, titanium alloys, or Invar foils, have not been reported.
The review by Skripov et al. [9] identifies three heating-rate regimes for explosive water nucleation and highlights the lack of reliable experimental data in the intermediate region. This observation motivated the present work. We hypothesized that efficient cavitation deicing could be achieved within this transition regime, thereby reducing the operating temperature, thermal stress, and electrical requirements of HTICD while preserving the impulse-deicing mechanism.
To investigate this hypothesis, experiments were performed over a heating-rate range of approximately 104–107 K/s using capacitor banks from 0.1 to 35 mF together with several foil materials, including SS17-7PH stainless steel, titanium Grade 1, titanium Grade 5, Invar, and SS304, in various thicknesses and aspect ratios. These combinations covered the low-, intermediate-, and high-heating-rate nucleation regimes. The effects of heating rate, energy density, foil material, surface treatment, and support structure on deicing performance and ice-ejection velocity were systematically investigated. Analytical calculations and finite-element simulations were used to interpret the experimental results and to establish practical design guidelines.
An analytical design methodology based on energy conservation, transient heat transfer, thermal-stress analysis, and finite-element modeling was developed and validated experimentally. The resulting LTICD and MTICD systems demonstrated efficient removal of both thick and thin ice while operating at substantially lower temperatures than HTICD.
2. Analytical Theory and Finite Element Analysis (FEA)
The operation of Ice Cavitation Deicing (ICD) is governed by two fundamental requirements. First, the interfacial water layer must reach the heating-rate-dependent nucleation temperature, . Second, the electrical energy delivered to the ICD must be sufficient to heat the foil and the adjacent substrate and ice/water layers until this condition is attained.
Figure 1, adopted from Skripov et al. [9], shows the experimentally established relationship between homogeneous nucleation temperature and heating rate. The available experimental data define two well-characterized regions: the low-temperature branch (heating rates below approximately K/s) and the high-temperature branch (above approximately K/s). Reliable experimental data remain scarce in the intermediate heating-rate range.
The present study focuses primarily on this intermediate region (approximately – K/s), where Sazhin et al. [11] proposed the following approximation for the nucleation temperature:
where TN is the nucleation temperature in K and is the heating rate (K/s). The resulting dependence is shown in Figure 2.
The low-temperature branch provides the basis for Low-Temperature Ice Cavitation Deicing (LTICD), whereas the high-temperature branch was previously used for High-Temperature Ice Cavitation Deicing (HTICD) [7]. The present study also investigates the previously unexplored transition region centered near K/s.
2.1. ICD Minimum Energy Requirement Calculations
The minimum energy density required for ICD was estimated using the First Law of Thermodynamics by accounting for the energy required to heat the metal foil, the adjacent substrate, and the ice layer to the nucleation temperature. At the threshold operating condition, the required energy density is:
where is the minimum ICD energy density, is the nucleation temperature, is the initial temperature, is the latent heat of melting, and the remaining symbols have their usual thermophysical meanings. The subscripts , , and denote the metal foil, substrate, and ice, respectively.
where is the pulse duration and , , and are the thermal conductivity, specific heat, and density of the corresponding material. For the overdamped discharge circuit used throughout this study,
where Rtot is total power circuit resistance and CC is capacitance of the power bank. Equation 4 provides a good approximation of the pulse duration. The thickness of the melted water layer was also estimated using the classical two-phase Stefan (Neumann) solution, [12,13]:
where is the Stefan (Neumann) similarity parameter, obtained as the numerical root of the corresponding transcendental equation:
where αdw is water diffusivity and αdi is ice diffusivity.
Both approaches were compared with finite-element simulations. The COMSOL calculations consistently showed that the thermal diffusion length predicted the melted-layer thickness more accurately than the classical Stefan solution, which systematically overestimated the melt thickness under the rapid heating conditions encountered in ICD. Consequently, the diffusion-length approximation was adopted for the engineering design calculations presented below, while the Stefan solution was retained for comparison.
Figure 3 presents the predicted nucleation temperature and minimum ICD energy density as functions of heating rate using equations 2, 3 and 4.
The calculations indicate a shallow minimum in the required energy density at heating rates of approximately – K/s, corresponding to nucleation temperatures near 150 °C. This region was therefore selected as the primary design target for LTICD.
2.2. COMSOL 5.4 Modeling Validation
The analytical model presented above, based on the First Law of Thermodynamics, provides approximate design parameters for an ICD system. More accurate calculations were performed using COMSOL Multiphysics 5.4. Time-dependent simulations were carried out using the Heat Transfer in Solids and Fluids module coupled with Joule Heating, Phase Change, Solid Mechanics (including thermal stress), Electrical Circuits, Electric Currents, and Magnetic Fields. Three phases of water (ice, liquid water, and steam) and two-phase transitions (melting and evaporation) were included in the model.
Figure 4 presents a representative simulation for a 0.05 mm Ti Grade 5 foil bonded to a 0.2 mm Duralco 4703 high-temperature epoxy adhesive and covered by a 0.2 mm ice layer. The nucleation temperature was set to 150 °C, which closely corresponds to the experimentally observed threshold for this LTICD.
The simulations revealed several important features of the ICD process. Owing to the relatively low thermal conductivity of Ti Grade 5, a significant temperature gradient developed across the foil thickness. After 2 ms of heating, approximately 5 μm of the interfacial water had vaporized, while approximately 20 μm of ice had melted. The predicted thickness of the melted layer agreed closely with the thermal diffusion length calculated using Equation (3), whereas the classical Stefan solution (Equations (5) and (6)) consistently predicted a substantially thicker melted layer. Consequently, the thermal diffusion-length approximation was adopted in the subsequent energy calculations.
2.3. Calculations of the Maximum Expansion Work by Water Vapor
The maximum mechanical work available for ice ejection was estimated by assuming an ideal isentropic expansion of the superheated water layer produced during the ICD process. Under these conditions, the maximum expansion work equals the difference between the initial internal energy of the liquid water immediately before nucleation and the final internal energy of the resulting water/steam mixture after expansion to atmospheric pressure:
where is the internal energy of liquid water immediately before the nucleation event, is the internal energy of saturated liquid water at atmospheric pressure, and is the internal energy of saturated water vapor at the same pressure. The thermodynamic properties of water used in the calculations were taken from the steam tables in Ref. [14].
As a first approximation, the temperature across the thin melted water layer was assumed to vary linearly from the foil temperature, , to the melting temperature at the moving water–ice interface. During the rapid pressure release, a fraction of the superheated liquid, , flashes into steam. Assuming the expansion is isentropic, the flash fraction is determined from conservation of entropy:
where and are the specific entropies of liquid water and saturated steam, respectively. Solving Equation (8) gives:
Figure 5 shows the calculated flash fraction as a function of the initial water temperature. As expected, the fraction of water converted into steam increases rapidly with increasing temperature. The final internal energy of the water/steam mixture is therefore:
and the corresponding maximum mechanical work available from the expansion becomes:
The expansion work per unit interface area was obtained by integrating the available work through the melted water layer:
where is the ice–metal contact area and is the melted-layer thickness calculated from Equation (3). Assuming that all of this work is converted into the kinetic energy of an ice plate of thickness , the theoretical upper limit of the ice-ejection velocity is:
Equation (13) represents an ideal upper limit because it assumes that all the expansion work is converted into translational kinetic energy of the ice. In practice, part of the available work is dissipated by viscous losses, shock-wave generation, deformation, and residual fluid motion.
Figure 6 presents the predicted maximum velocity of a 10 mm thick ice plate together with the corresponding nucleation temperature as functions of heating rate. The calculations indicate that the theoretical maximum ice velocity reaches a broad maximum near a heating rate of approximately K/s, which lies within the transition region between the low- and high-heating-rate nucleation branches.
2.4. Overheating Ice-Free Areas of ICD
One of the principal design constraints of an ICD system is the maximum temperature reached in the ice-free regions of the foil. In these areas, the electrical energy is not consumed by melting ice or vaporizing water and therefore produces substantially higher foil temperatures than beneath the ice. If the ICD is not properly designed, the temperature in these regions may exceed the allowable service temperature of either the foil or the supporting substrate. Applying the First Law of Thermodynamics to an ice-free region gives the maximum foil temperature:
where Tno_ice is the maximum temperature of the foil in the absence of ice.
Equation (14), together with Equations (2) and (3), was used to optimize the ICD geometry and operating conditions for each foil material investigated in this study. The optimization simultaneously minimized the required ICD energy density and the maximum temperature of the ice-free regions.
Figure 7 presents a representative design optimization for a 0.05 mm Ti Grade 5 foil bonded to a Duralco 4703 high-temperature epoxy adhesive. Because the total circuit resistance depends on the foil aspect ratio, the required energy density, the total energy consumption, and the maximum ice-free temperature are all functions of the foil geometry.
The calculations demonstrate that the optimum aspect ratio depends on the primary design objective. Designs intended to minimize energy consumption differ from those intended to minimize the maximum temperature of the ice-free regions. Consequently, the final ICD geometry represents a compromise between electrical efficiency and thermal reliability.
2.5. Thermal Stress in the Foil and Adhesive Layer
The adhesive layer plays a critical role in ICD performance. Besides attaching the foil to the supporting structure, it influences the required energy density, the maximum temperature of the ice-free regions, the thermal stress developed in the foil, and the efficiency with which the pressure impulse is transmitted to the ice layer. Consequently, thermal stresses in both the foil and the adhesive must remain below their allowable limits to ensure reliable long-term operation.
The thermal stresses generated during rapid ICD heating were estimated using the classical Volkersen shear-lag model for bonded laminates [15,16]. Assuming a thin metal foil bonded to a rigid substrate through an adhesive layer, the maximum compressive stress in the foil occurs at its center and is given by
where is the shear-lag parameter. Here, and are the thicknesses of the metal foil and adhesive layer, respectively, is the Young’s modulus of the foil, is the adhesive shear modulus, is the coefficient of thermal expansion of the foil material, and is the temperature difference between the foil and the adhesive.
The corresponding maximum shear stress in the adhesive occurs near the foil ends and is given by:
The calculations assumed that the ICD heating pulse is sufficiently short that only a thin thermal diffusion layer of the adhesive is heated, while the remaining adhesive thickness remains close to its initial temperature. This approximation is consistent with the short heating times and the thermal diffusion lengths predicted by the COMSOL simulations.
Figure 8 and Figure 9 present calculated thermal stresses for laminates consisting of 0.076 mm SS17-7PH foil bonded to a 1 mm layer of four representative high-temperature adhesives.
Figure 8 shows the maximum compressive stress developed in the foil. The calculated stresses remain below the elevated-temperature yield strength of SS17-7PH for the more compliant adhesive systems, whereas stiffer ceramic adhesives produce substantially higher thermal stresses.
Figure 9 shows the corresponding maximum shear stress in the adhesive layer. Softer adhesives experience relatively low interfacial shear stresses, whereas high-modulus ceramic adhesives develop considerably larger stresses that may approach their bond-strength limits for long foils. These results demonstrate that adhesive mechanical properties are as important as their thermal resistance when designing reliable ICD systems.
Although the adhesive layer is 1 mm thick, the short duration of the ICD pulse limits heat penetration to only several tens of micrometers. Consequently, most of the adhesive remains near the initial temperature and acts as a mechanically rigid support during the pulse.
3. Experimental Work
All experiments were conducted at the Ice Research Lab of Petrenko-Multiphysics LLC. Various metals and metal alloys were investigated through theoretical calculations to identify the optimal foil and substrate materials for experimental testing. A detailed description of the experimental setup, materials, and electronics is provided in Section 3.1, Section 3.2, Section 3.3 and Section 3.4. A general view of the ICD inside the refrigerator can be seen in the provided complemental video clip. The author believes that this information is sufficient for followers of the method to set up their own experiments.
3.1. Metals Selection and Preparation
Cold rolled Titanium Grade 5 (Al6%, V4%) is the titanium alloy known for its very high mechanical strength and a record high electrical resistivity. It also has a very low Cm∙ρm product, a CTE of approximately one half that of SS304 and SS316 stainless steel and high corrosion resistance up to 426 °C. When treated with UV light it demonstrated near zero contact angle of water. The surface of titanium was degreased with acetone and isopropyl alcohol and then exposed to 254 nm UV (no-ozone) light for from 1 to 12 hours. That treatment resulted in durable hydrophilic surface. 0.1mm thick nickel foil bus bars were connected to the titanium ICD foils with a double-pulse spot welder. The contact BB/Ti resistance was approximately 1 mΩ per each BB having 20 spot-weld nuggets.
Cold rolled 17-7PHC stainless steel was selected for its exceptional strength, high electrical resistivity, lower CTE than SS 304/316, and high corrosion resistance. The SS 17-7PH surface was degreased with acetone and isopropyl alcohol and then polished with 1500 grit sandpaper and rinsed in distilled water. The treatment provided hydrophilic properties which had to be restored every day. Much more robust hydrophilic surface of SS17-7PH can be created with common nano-meters scale coating on metals with Sol-Gel SiO2–TiO2 coating technology. It can be used to create self-cleaning hydrophilic surface of stainless steel [17]. Additional exposition to 254 nm UV radiation for 4 h didn’t improve hydrophilicity of SS. The samples were usually iced within 30 min after the treatments.
Titanium Grade 5 samples, while tested daily, didn’t need repetitive cleaning and remained their hydrophilic properties. SS17-7PH foils took the abrasion in between the LTICD tests. HTICD testing cleaned all the samples well.

Table 1.
Metals used in this study. σTS = αm∙Em∙400 K.
| Metal | σTS/σyield at 400 °C |
ρe, Ω∙m Experimental |
Oxidation resistance to intermittent 400 °C pulses |
| Ti Grade 5, cold worked | 0.66 | 1.64∙10-6 | High |
| Ti Grade 3 cold worked | 1.32 | 0.52∙10-6 | High |
| Copper | 1.92 | 1.72∙10-8 | High |
| Invar | 0.24 | 0.82∙10-6 | modest |
| SS17_7PH | 0.63 | 1.02∙10-6 | High |
| SS304, cold rolled thin foil | 1.34 | 0.72∙10-6 | High |
| Tantalum cold worked | 0.825 | 1.35∙10-7 | High |
3.2. Substrate Materials Selection
Adhesives that can withstand temperatures up to and over 400 °C are primarily based on inorganic components, such as ceramics (CA), glass, or silicates (Si). These materials, while exceptionally heat-resistant (only when they are slowly heated), form rigid and brittle bonds with metals rather than elastic ones. They are also more likely to fail under thermal shock or stress because of their significant CTE and low flexibility. Cotronics 905 silicate-based adhesive which was specifically designed to withstand thermal shocks can be an exception. After evaluating many commercially available CA and silicone adhesives (SA), only two were chosen. The first was Cotronics 905 silicate-based very low CTE thermal-shock resistant adhesives. The second was Permotex Optimum silicone adhesive having its maximum intermittent temperature of Tmax = 399 °C. Even better may be SA Duraseal 1531 (Tmax = 427 C), but it takes over one month RTV for wide and thin layers to be cured, which makes it very inconvenient for laboratory testing. Array of thin (2mm) neodymium permanent magnets coated with 50 µm single-sided Kapton film was used to test ferromagnetic stainless steel and Invar foils. Permotex silicone adhesive demonstrated very high adhesion strength and withstood several dozen ICD pulses without any signs of damage or delamination.
Table 2.
Adhesives use in this study.
| Adhesive |
ρ kg/m3 |
C J(/kg∙K) |
k W/(m∙K) |
E GPa |
α 10-5/K |
Kg2/(s5∙K2) |
σbond MPa |
σmax MPa |
Tmax °C |
| CA Resbond 905 | 1310 | 800 | 1.44 | 7.5 | 0.054 | 1228 | 22 | 1370 | |
| CA Resbond 907 | 1281 | 1050 | 0.865 | 190 | 3.9 | 1080 | 4 | 24 | |
| SA Permatex Optimum 399 | 1180 | 1050 | 0.2 | 0.0014 | 30 | 665 | 2.8 | 1.9 | 399 |
| SA Duraseal 1531 | 998 | 1465 | 0.3 | 0.0012 | 2 | 1710 | 1.9 | NA | 427 |
| Duralco 4703 | 1800 | 1043 | 2.59 | 5 | 2.6 | 2200 | 21 | NA | 343 |
| 3M HT VHB 4646 tape | 840 | 1000 | 0.11 | 520kPa | 18 | 304 | NA | 232 |
3.3. Measurements of Ice Velocity
Two methods were used to measure the maximum initial velocity of the ice fragment. In the first method, video clips of ICD deicing were played frame by frame with 1/60 s between frames. During the ICD tests, the ice fragments were propelled rapidly away from the deicing surface. In many demonstrations, the fragments reached velocities on the order of 10 m/s. At typical smartphone frame rates (30–60 fps), the fragments move between 0.17m and 1 m per frame, leaving the field of view in 1–2 frames. This provides an insufficient temporal resolution for accurate frame-based tracking. Therefore, video footage was primarily used for the qualitative confirmation of ICD performance.
In the second method, the initial horizontal velocity was obtained using a simple ballistic equation. The ICD was positioned 1.0 m above the carpeted floor, and the horizontal travel distance of the detached ice fragments was measured. Assuming a negligible initial vertical velocity, the flight time is determined by free fall:
where and
The initial horizontal velocity is then expressed as
This method significantly improves the velocity precision compared to frame counting. For the demonstrated ICD configurations, the measured velocities were typically . These experimental results agree well with the theoretical estimates based on vapor expansion impulse generation.
3.4. Electronics
Figure 10 shows the electric circuit used in this study. The MOC223 optocoupler isolates the low-voltage trigger circuit (left) from the high-voltage ICD circuit (right). The two diodes protect the capacitor and thyristor-diode module MCD312-12io1 (SCR) from reverse-voltage peaks. The peak capacitor discharge currents during testing varied from 200 A to 10 kA. Because the low resistance of the tested ICDs, most connections were soldered, and 12 and 14 AWG leads were used to minimize the total resistance in high-current circuits. The capacitor charger module delivered an output power of 60 W with a maximum output voltage of 900 V. The film capacitors used in this study (0.1 mF to 3 mF) had very low estimated series resistance (ESR) of approximately 1 mΩ. The large aluminum electrolytic capacitors (15 mF and 35 mF) had ESR = 5 mΩ. The circuit shown in Figure 10 was used for several hundred pulses during the testing period. A two-channel digital oscilloscope recorded the voltage and current of the ICD, and a digital voltmeter was used to monitor initial voltage of the capacitors.
3.5. Experimental Results
Trate was calculated as TICD/(Rtot∙C), where Rtot is the total power circuit resistance.
TICD and Tno_ice were calculated using experimental QICD and the ECL (equation 2).
Notice that at the thresholds (typed in bold in Table 3) TICD = TN. Threshold TICD temperature was TICD = 144.5 °C at QICD = 40kJ/m2 for 0.05 mm Ti5 foil powered with 35 mF capacitor, TICD = 160 °C at 80kJ/m2 for 0.105mm Ti5 foil powered with 15 mF capacitor.
Table 3 summarizes representative experiments covering the complete range of ICD operating conditions investigated in this study. The selected results include LTICD, MTICD, and HTICD configurations employing different foil materials, geometries, and capacitor banks. For each experiment, the measured ice-ejection velocity is compared with the corresponding energy density, COMSOL-predicted temperatures, and estimated heating rate.
3.6. Principal Experimental Findings
The experimental investigation led to the following principal observations.
- Explosive vaporization of the melted interfacial water layer was reproducibly observed whenever the applied ICD energy density exceeded the threshold value for a given foil material, geometry, and heating rate.
Figure 11.
Maximum ice cube’s velocity, m/s, vs the energy density QICD, kJ/m2. Ti5.
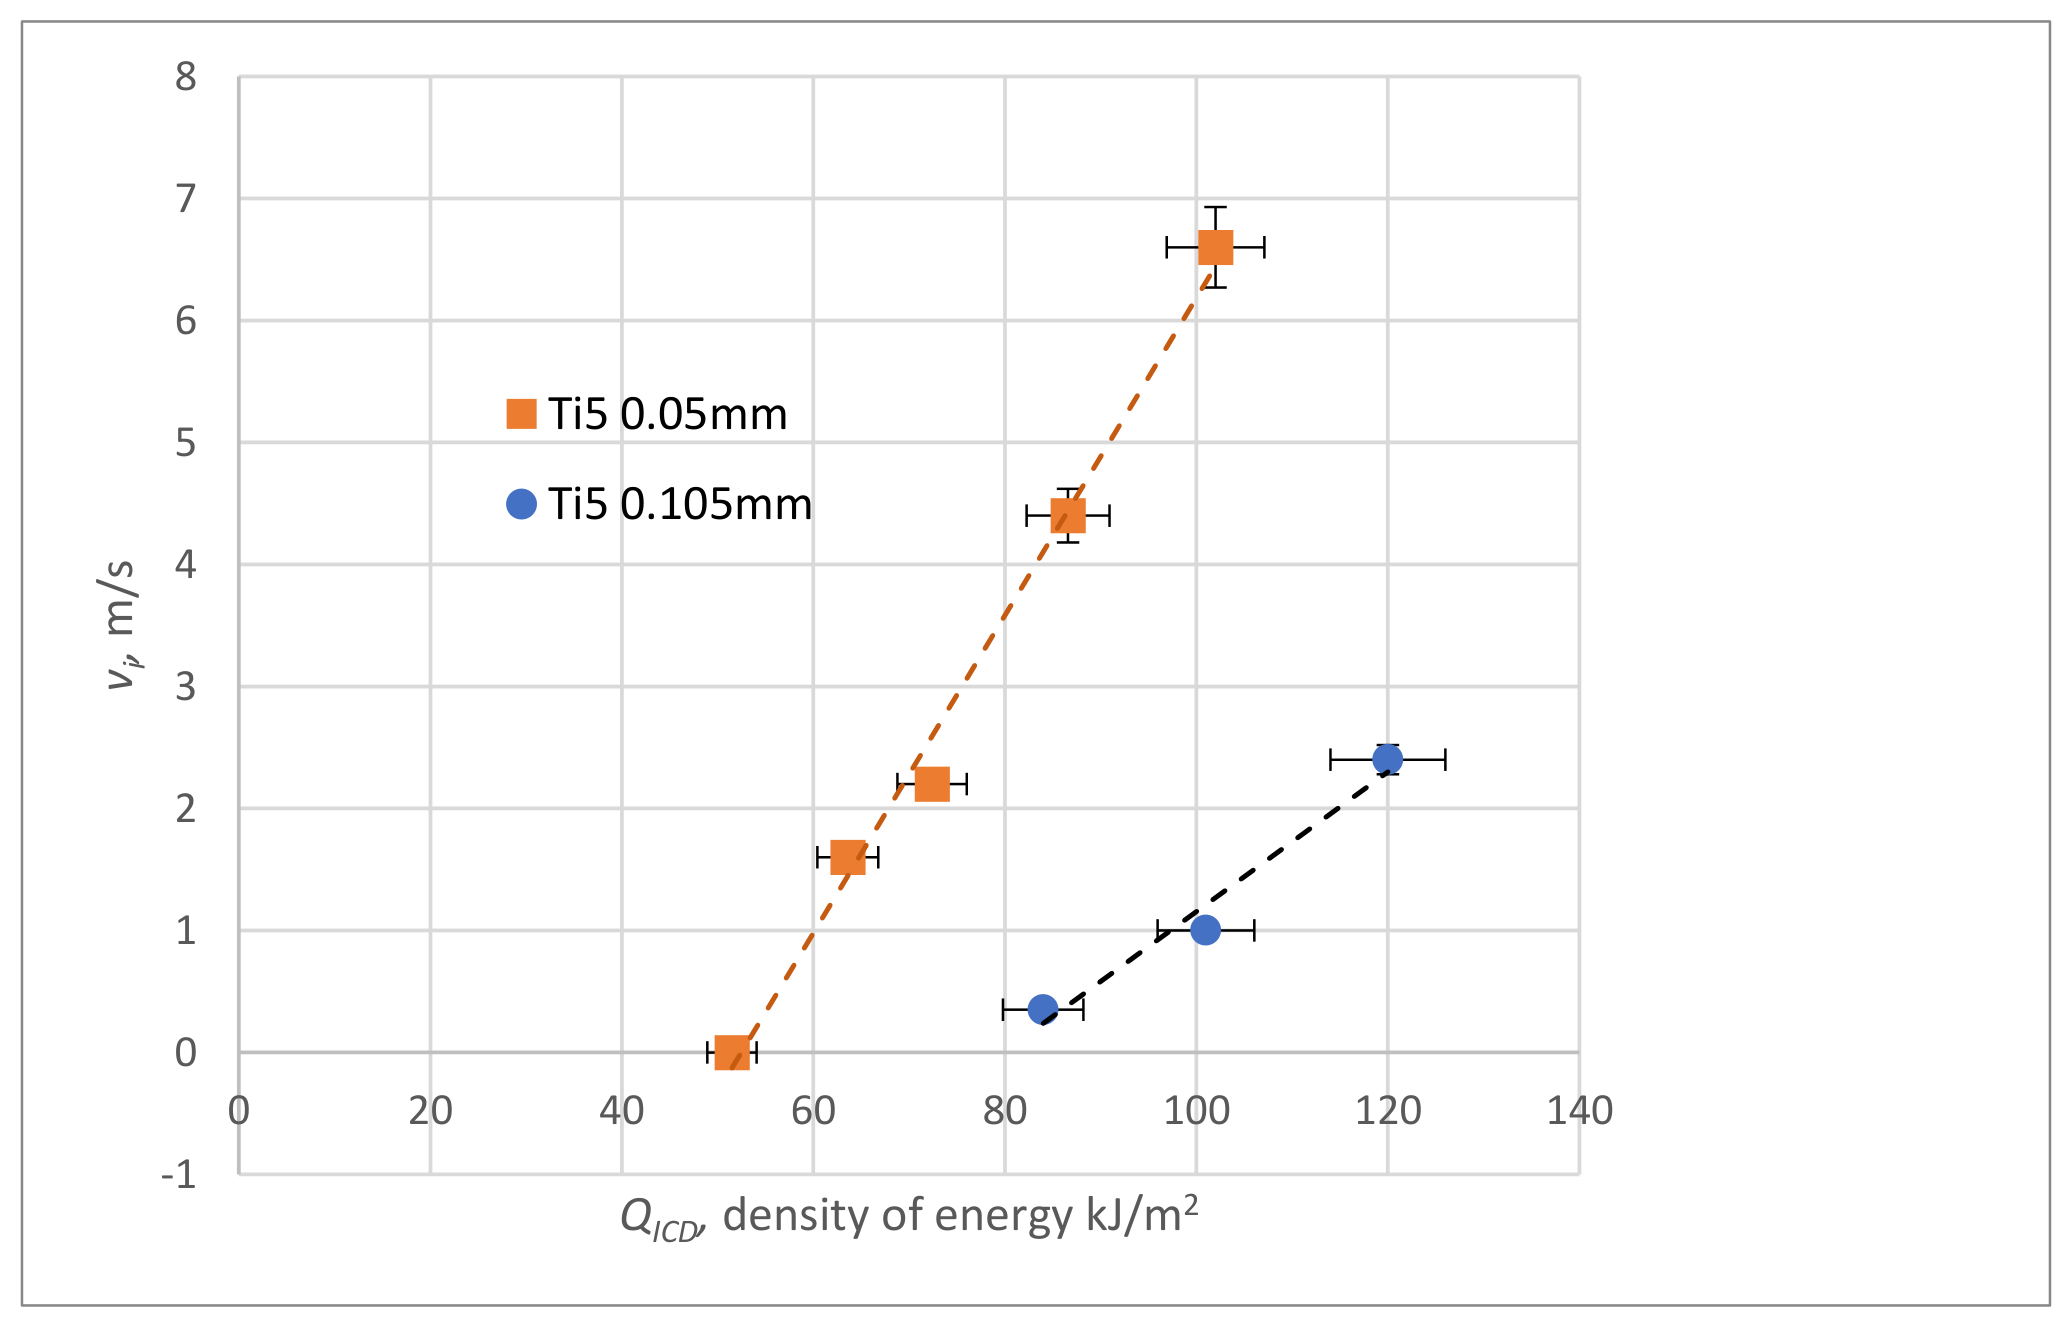
Figure 12.
Maximum ice cube’s velocity, m/s, vs the energy density QICD, kJ/m2. SS17-7PH.
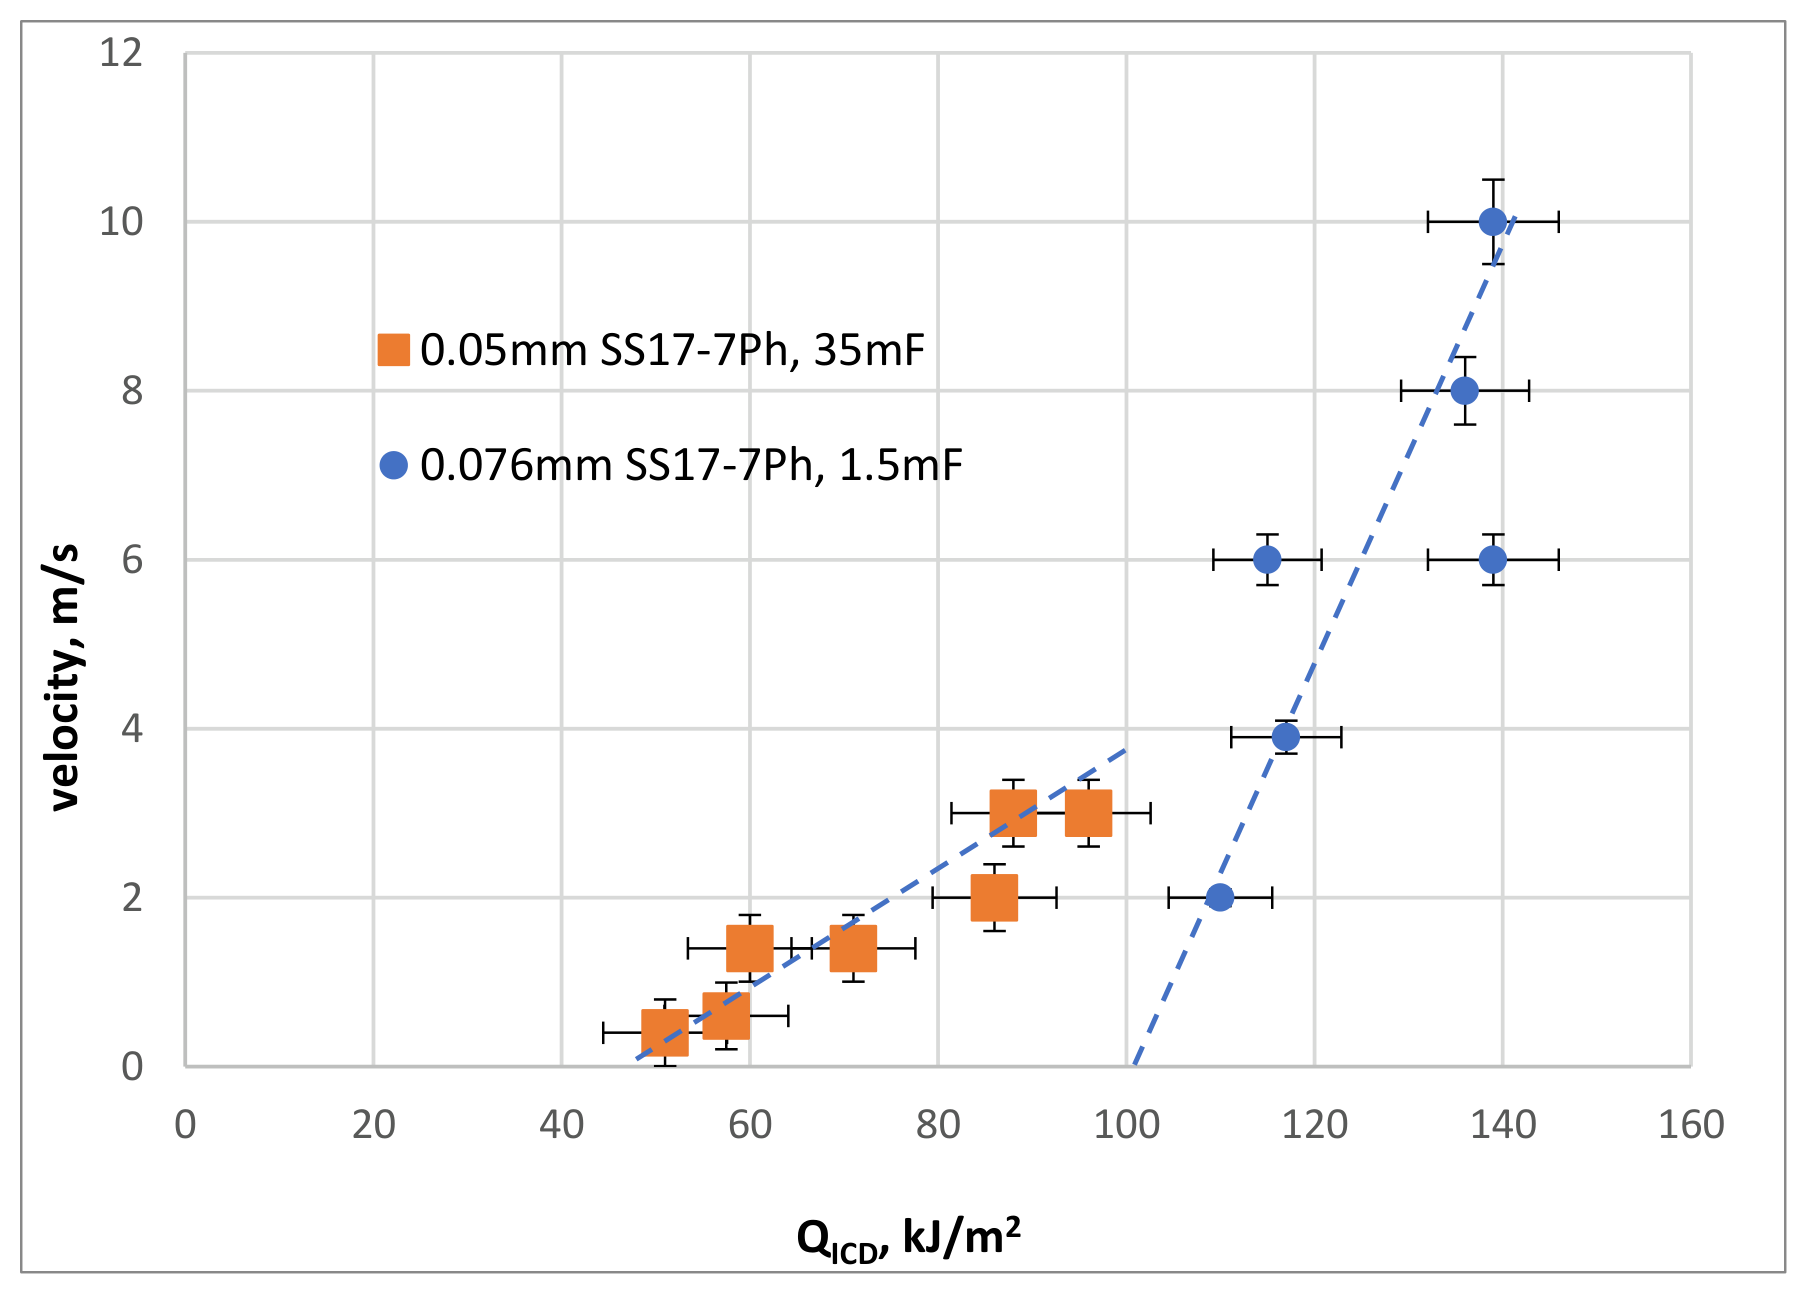
Figure 13.
Maximum velocity, m/s, of ejected 1cm3 ice cubes vs heating rate, K/s. Trate was calculated as TICD/(Rtot∙C), where Rtot is the total power circuit resistance.
Figure 13.
Maximum velocity, m/s, of ejected 1cm3 ice cubes vs heating rate, K/s. Trate was calculated as TICD/(Rtot∙C), where Rtot is the total power circuit resistance.
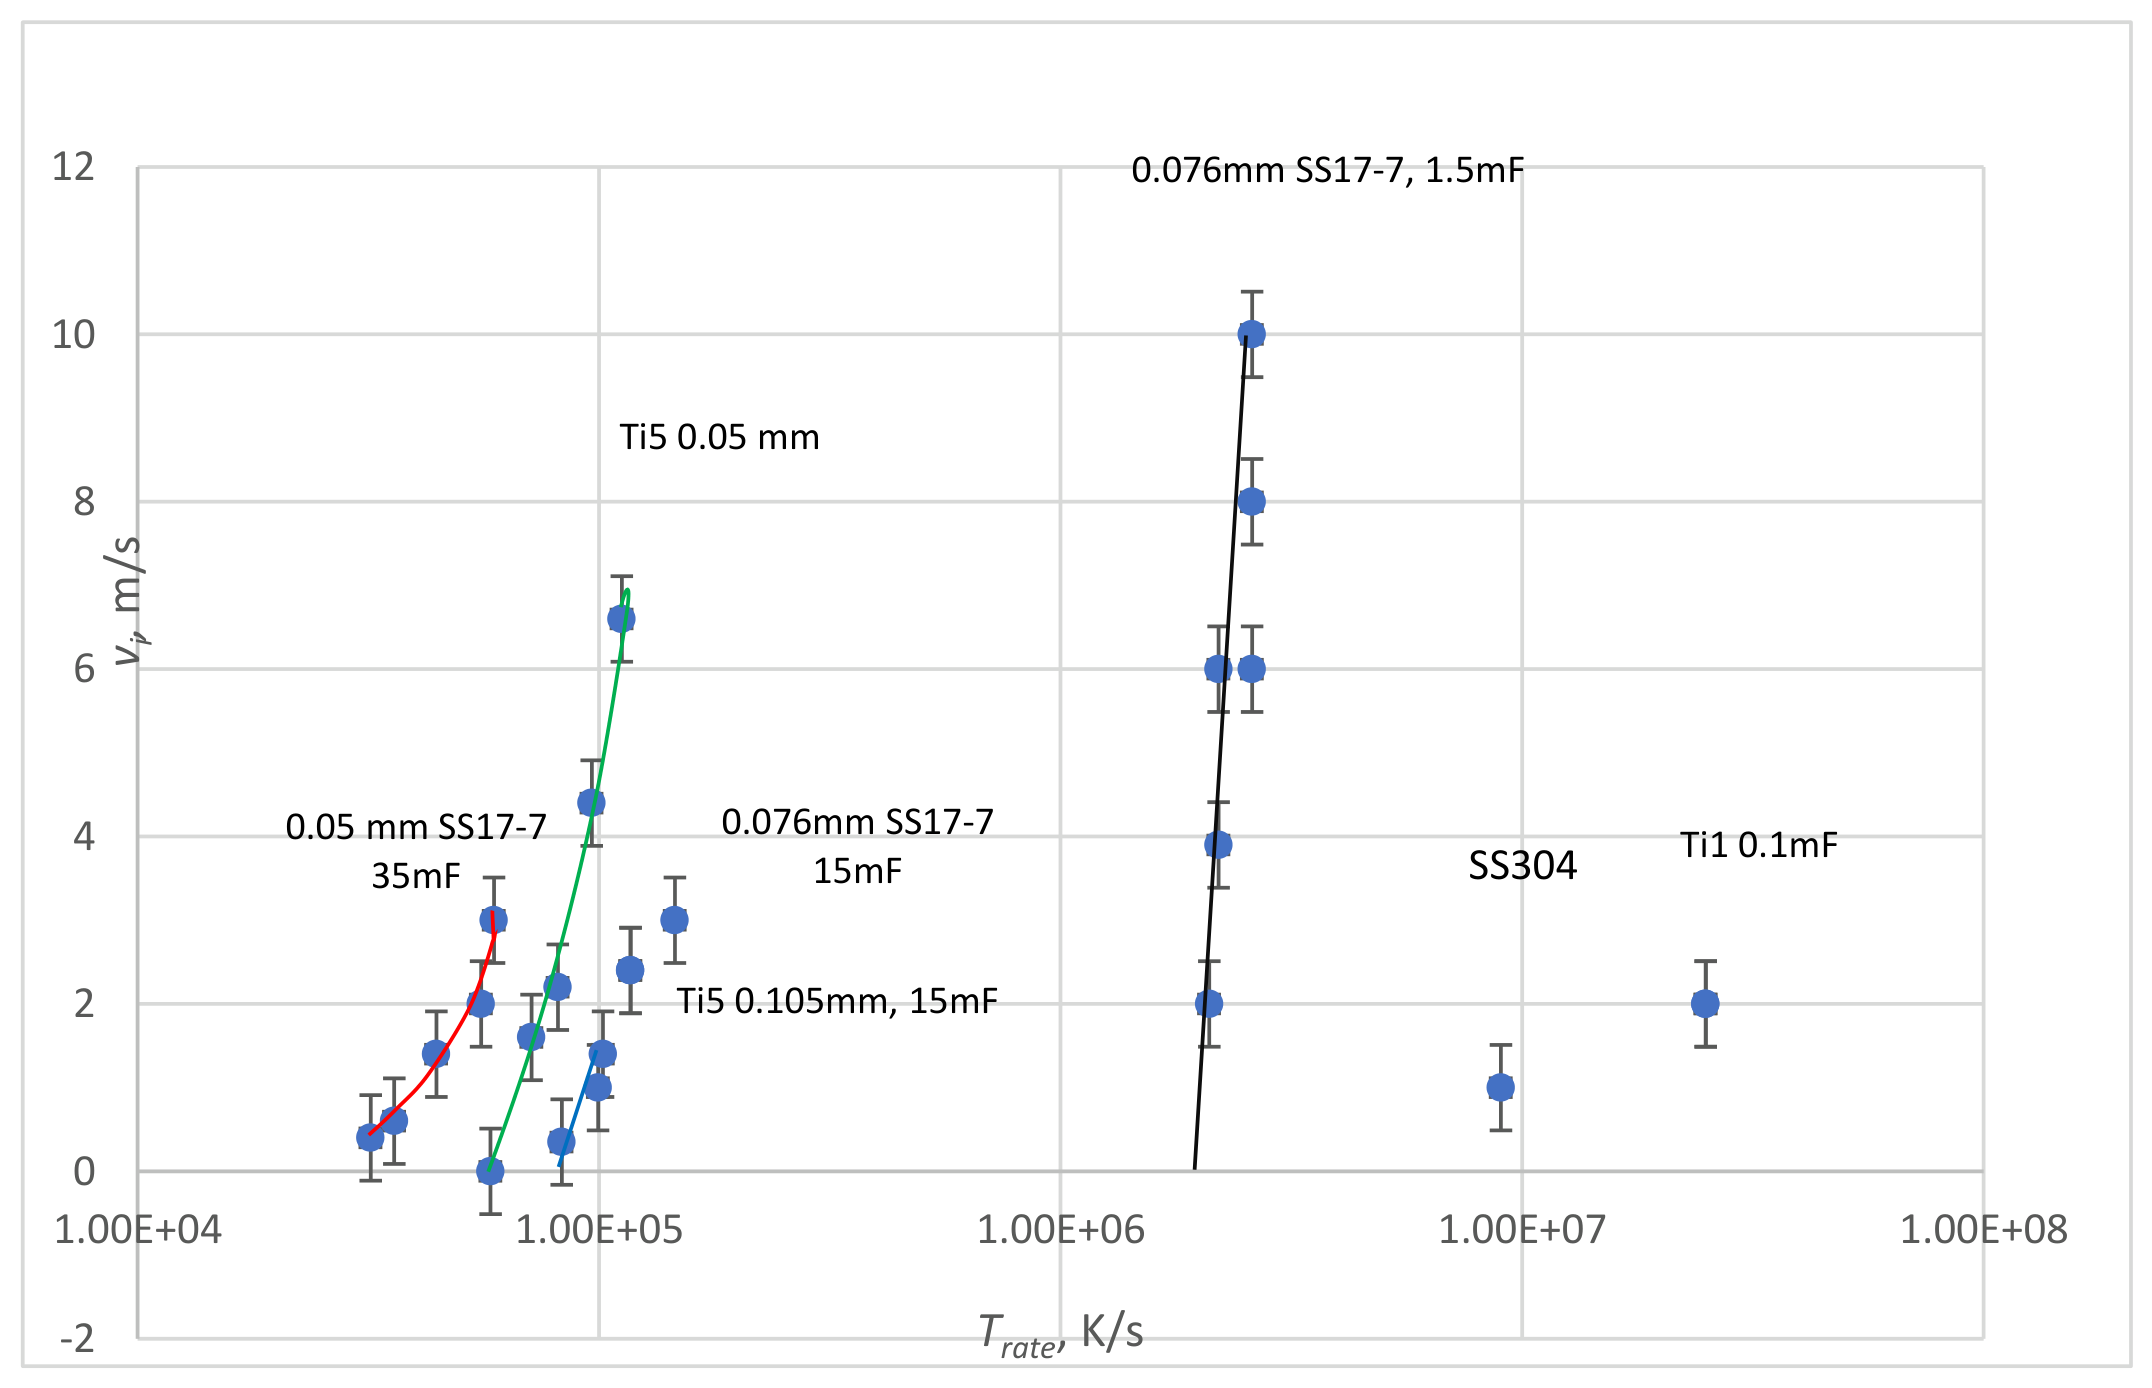
- The majority of successful LTICD and MTICD experiments were conducted within the intermediate heating-rate range of approximately – K/s identified by Skripov et al. [9].
- The experimentally determined threshold temperatures approximately followed the heating-rate dependence of the nucleation temperature shown in Figure 1.
- Hydrophilic foil surfaces consistently produced higher and more reproducible ice-ejection velocities than untreated hydrophobic surfaces.
- Functional Low-Temperature, Medium-Temperature, and High-Temperature Ice Cavitation Deicing (LTICD, MTICD, and HTICD) systems were successfully designed and experimentally demonstrated.
- Equation (13) provided reasonable estimates of the experimentally observed ice-ejection velocities for LTICD and MTICD (approximately 2–4 m/s). The model was less accurate for HTICD, where cavitation pressures substantially exceed the equilibrium vapor pressure assumed in the present analysis [7,8].
- Once the threshold energy density had been exceeded, ice cubes were consistently ejected with velocities ranging from approximately 1 to 10 m/s, depending on the applied ICD energy density.
3.7. Engineering Observations
The experiments also provided several practical design recommendations.
- Permatex Optimum 399 silicone adhesive demonstrated the best combination of reliability and durability, although complete curing required several days.
- 3M HT VHB tape performed well up to maximum intermittent temperatures of approximately 300 °C, exceeding its nominal continuous service temperature.
- Magnetic support proved to be highly effective for ferromagnetic foils (SS17-7PH, SS430, and Invar). Although slight foil displacement occurred during the ICD pulse, full contact was restored within approximately one second.
- Thermal strains were greatest near the massive electrical bus bars. This effect can be reduced by using thinner bus bars that are heated by the same discharge current, thereby reducing differential thermal expansion.
- Compared with HTICD, LTICD required approximately one-half of the operating voltage and one-fifth of the peak current.
- The use of high-capacitance aluminum electrolytic capacitors increased the area deiced by a single pulse by approximately one order of magnitude compared with the original HTICD implementation.
4. Discussion
The present investigation demonstrates that ice cavitation deicing is not limited to the high-temperature regime previously reported for HTICD [6]. By operating in the intermediate heating-rate region identified by Skripov et al. [9], efficient cavitation deicing was achieved at substantially lower temperatures while preserving the fundamental mechanism of rapid vapor generation and impulse loading of the ice layer.
The experimental and analytical results indicate that LTICD operating near provides the best overall engineering compromise. At this operating point, the required energy density is near its minimum, the maximum temperature of the ice-free regions remains moderate, thermal stresses are substantially reduced, and useful ice-ejection velocities of up to approximately 3 m/s were obtained. These prototypes demonstrated stable and reproducible operation and therefore represent the preferred LTICD design.
Operation in the transition and high-heating-rate regimes produced considerably higher ice-ejection velocities, reaching 10 m/s for HTICD. These improvements, however, were accompanied by significantly higher foil temperatures, larger pulse currents, and increased thermal stresses. Consequently, the transition regime appears to offer opportunities for further optimization, whereas the present results suggest that operation near and K/s provides the most practical balance between performance and reliability.
Among the materials investigated, Ti Grade 5 and SS17-7PH provided the most favorable combination of electrical, thermal, and mechanical properties. In addition, the development of a reliable two-pulse spot-welding procedure for joining nickel bus bars to titanium foils solved a long-standing practical problem associated with titanium-based ICD systems. Ultraviolet treatment of titanium also significantly improved deicing performance, most likely through improved surface wettability.
The experiments further suggest that the heater surface should be regarded as an active nucleation surface rather than a passive thermal boundary. Controlled micro-roughening or shallow micro-grooving may provide stable heterogeneous nucleation sites, thereby reducing sensitivity to surface contamination, polishing condition, and oxide morphology. Such surface engineering may improve the repeatability of LTICD operation while maintaining explosive boiling near 150 °C.
Although LTICD is expected to exhibit a degree of self-cleaning through thermal desorption, vapor generation, and subcritical-water cleaning, this effect is likely to be less pronounced than in HTICD operating at 300–350 °C. LTICD should therefore remove loosely adhered contaminants effectively but should not be expected to eliminate strongly adsorbed hydrocarbon or hydraulic-fluid films as efficiently as HTICD.
Compared with HTICD, LTICD offers several important engineering advantages. The lower operating temperature substantially expands the range of suitable adhesive systems and structural materials while reducing thermal stresses in both the foil and adhesive layer. Lower operating voltages and pulse currents simplify the power electronics, and the use of large aluminum electrolytic capacitors makes it possible to store significantly more energy than practical HTICD systems. This enables considerably larger deicing areas to be protected by a single discharge pulse.
HTICD nevertheless retains important advantages. Its higher operating temperature produces stronger pressure pulses and higher initial steam pressures, which are beneficial for fragmenting thick or strongly adhered ice. The higher temperatures also provide a more aggressive self-cleaning action of the heater surface.
Overall, the present work extends the concept of ice cavitation deicing from a proof-of-concept high-temperature technology to a broader family of deicing systems operating over a wide range of heating rates and temperatures. While HTICD established the feasibility of cavitation deicing, the present results demonstrate that the same physical mechanism can be implemented using substantially lower temperatures and a more practical electrical architecture, making LTICD and MTICD promising candidates for future aircraft ice-protection systems.
5. Conclusion
This study developed and experimentally validated Low-Temperature Ice Cavitation Deicing (LTICD) and Medium-Temperature Ice Cavitation Deicing (MTICD) as new variants of impulse cavitation deicing. An analytical design methodology based on energy conservation, transient heat transfer, thermal-stress analysis, and finite-element modeling was developed and successfully applied to the design of LTICD, MTICD, and HTICD prototypes. The analytical predictions showed good agreement with the experimental observations and provided practical design guidelines for selecting foil materials, adhesives, and operating conditions.
The experimental results demonstrate that efficient impulse cavitation deicing can be achieved at substantially lower operating temperatures than previously required for HTICD. Compared with HTICD, LTICD and MTICD reduced the required energy by approximately a factor of two and lowered both the operating and maximum heater temperatures by more than 100 °C while maintaining effective ice removal. Operating in the intermediate heating-rate regime also reduced thermal stresses, lowered the required operating voltage and pulse current, and enabled the use of high-capacitance aluminum electrolytic capacitors, increasing the deiced area achievable with a single discharge pulse by approximately one order of magnitude.
Although HTICD remains advantageous where very high pressure impulses and aggressive self-cleaning are required, the present work demonstrates that the same cavitation-deicing mechanism can be implemented using substantially lower temperatures and a more practical electrical architecture. These results extend ice cavitation deicing from a proof-of-concept high-temperature technology to a broader family of practical deicing systems suitable for future aircraft ice-protection applications.
Supplementary Materials
The following supporting information can be downloaded at the website of this paper posted on Preprints.org. Supplementary Video S1. Representative LTICD experiment showing the removal of 10 mm ice cubes from a 0.105 mm Ti Grade 5 foil.
References
- Petrenko, V.F. Systems and Methods for Modifying an Ice-To-Object Interface. U.S. Patent 6,870,139, 2005. [Google Scholar]
- Petrenko, V.F.; Sullivan, C.R.; Kozlyuk, V.; Petrenko, F.V.; Veerasamy, V. Pulse electro-thermal de-icer (PETD). Cold Reg. Sci. Technol. 2011, 65, 70–78. [Google Scholar] [CrossRef]
- Meier, O.; Scholz, D. Handbook Method for Estimating Power Requirements for Electrical De-Icing Systems; Hamburg University of Applied Sciences, 2010, Hamburg, Germany. 2010. Available online: https://www.fzt.hawhamburg.de/pers/Scholz/MOZART/MOZART_PRE_DLRK_10-08-31.pdf.
- AIR 1168/4; SAE: Ice, Rain, Fog, and Frost Protection. Society of Automotive Engineers: Warrendale, PA, USA, 1990.
- Khodakarami, S.; Agarwal, V.; Kabirzadeh, P.; Solecki, A.; Hoque, M.J.; Yang, W.; Stokowski, N.; Jacobs, J.; Chatterji, A.; Lovelace, E.; et al. Aircraft Electrothermal Pulse Deicing. J. Heat Mass Transf. 2025, 147, 012401. [Google Scholar]
- Petrenko, V.F. Ice Cavitation Deicing for Aerospace Applications. Aerospace 2026, 13, 217. [Google Scholar] [CrossRef]
- Caupin, F.; Herbert, E. Cavitation in water: A review. Comptes Rendus Phys. 2006, 7, 1000–1017. [Google Scholar] [CrossRef]
- Caupin, F. Liquid-vapor interface, cavitation, and the phase diagram of water. Phys. Rev.E. 2005, 71, 051605-1–051605-5. [Google Scholar] [CrossRef] [PubMed]
- Skripov, P.V.; Bar-Kohany, T.; Antonov, D.V.; Strizhak, P.A.; Sazhin, S.S. Approximations for the nucleation temperature of water. Int. J. Heat Mass Transf. 2023, 207, 123970. [Google Scholar] [CrossRef]
- Shoji, M.; Ueno, I.; Yamazaki, M.; Wakamatsu, K. Pressure generation by rapid heating of a metal wire in water. Trans. Jpn. Soc. Mech. Eng. Ser. B 1996, 62, Paper No. 95–1564. [Google Scholar] [CrossRef]
- Sazhin, S.S.; Bar-Kohany, T.; Nissar, Z.; Antonov, P.A.; Strizhak; Rybdylova, O.D. A new approach to modelling micro-explosions in composite droplets. Int. J. Heat Mass Transf. 2020, 161, 120238. [Google Scholar] [CrossRef]
- V. Alexiades, V.; A. D. Solomon, A.D. Mathematical Modeling of Melting and Freezing Processes, Chapter 2.; Hemisphere Publishing CRC Press reprint, 1993. [Google Scholar]
- Crank, J. Free and Moving Boundary Problems.; Clarendon Press: Oxford, 1984. [Google Scholar]
- Wagner, W.; Kretzschmar, H.-J. International Steam Tables: Properties of Water and Steam Based on the Industrial Formulation IAPWS-IF97; Springer International Publishing, 2008. [Google Scholar]
- Volkersen, O. Die Nietkraftverteilung in zugbeanspruchten Nietverbindungen mit konstanten Laschenquerschnitten. Luftfahrtforschung 1938, 15, 41–47. [Google Scholar]
- da Silva, L.F.M.; Oechsner, A.; Adams, R.D. Handbook of Adhesion Technology; Springer: Cham, Switzerland, 2018. [Google Scholar]
- Boroujeny, B. S.; A. Afshar, A.; Dolati, A. Photoactive and self-cleaning TiO2–SiO2 thin films on 316L stainless steel. Thin Solid Films 2012, 520, 6355–6360. [Google Scholar] [CrossRef]
Figure 1.
Nucleation temperature vs. heating rate. Adopted from Skripov et al. [9].
Figure 1.
Nucleation temperature vs. heating rate. Adopted from Skripov et al. [9].
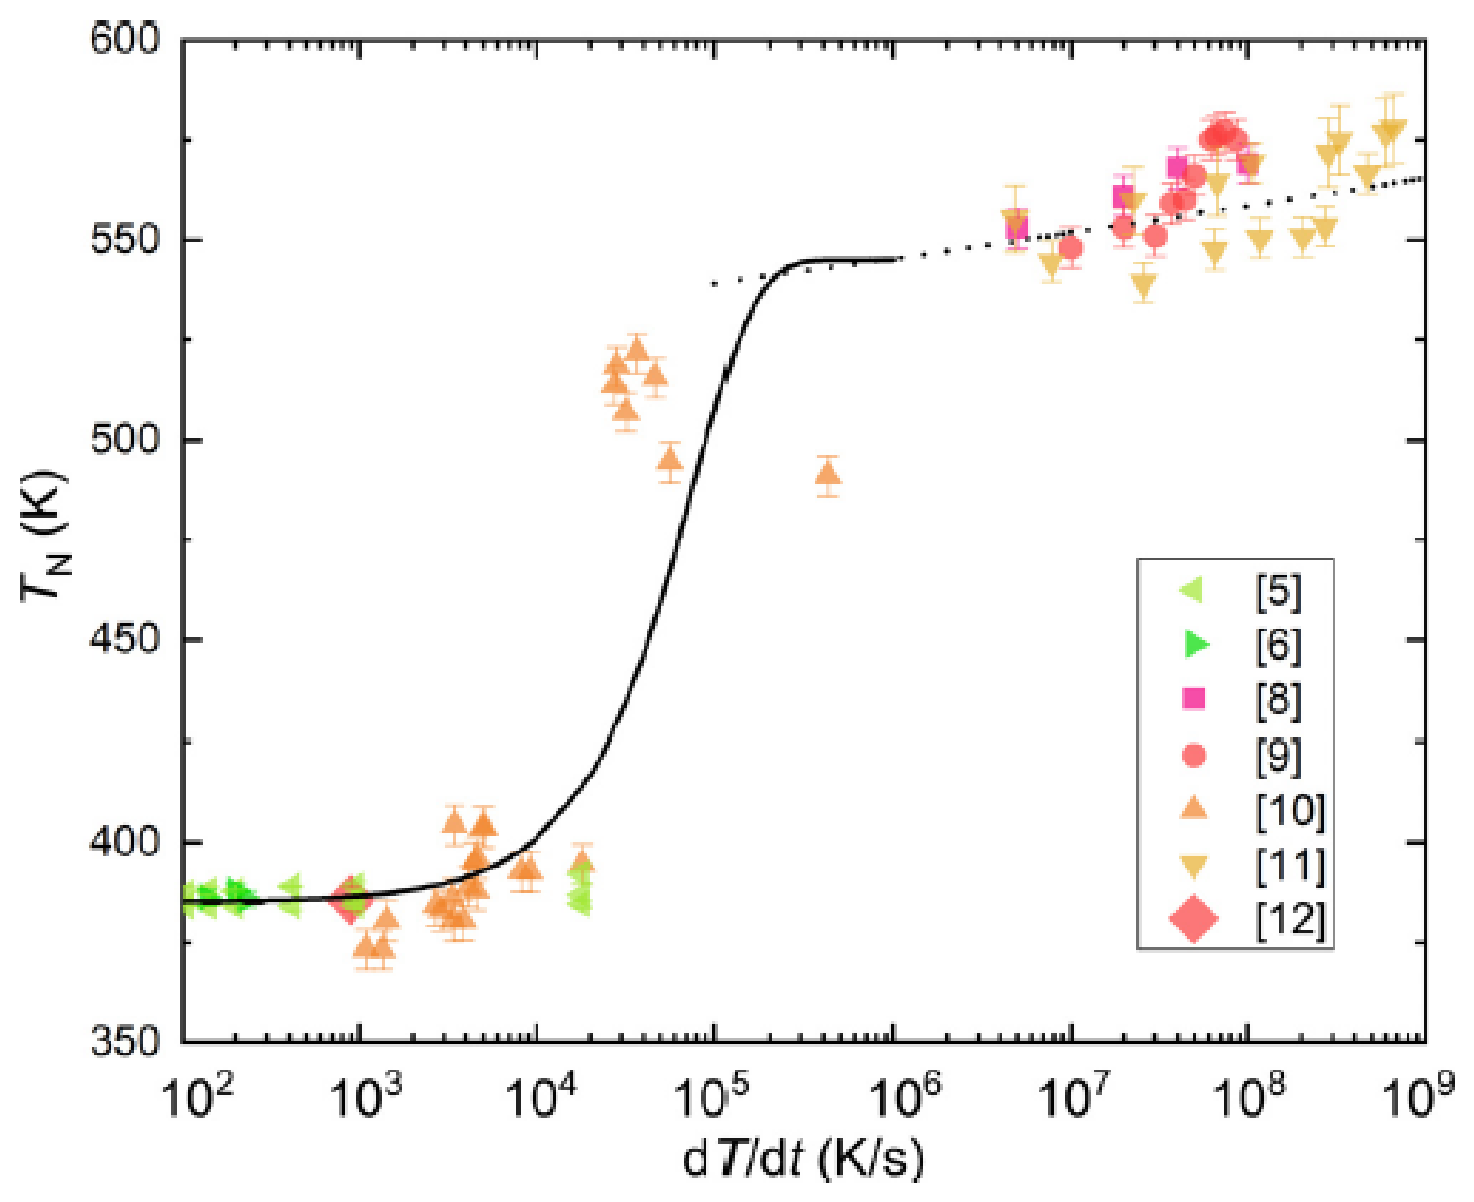
Figure 2.
Nucleation temperature, TN, °C vs. heating rate Trate (°C/s).
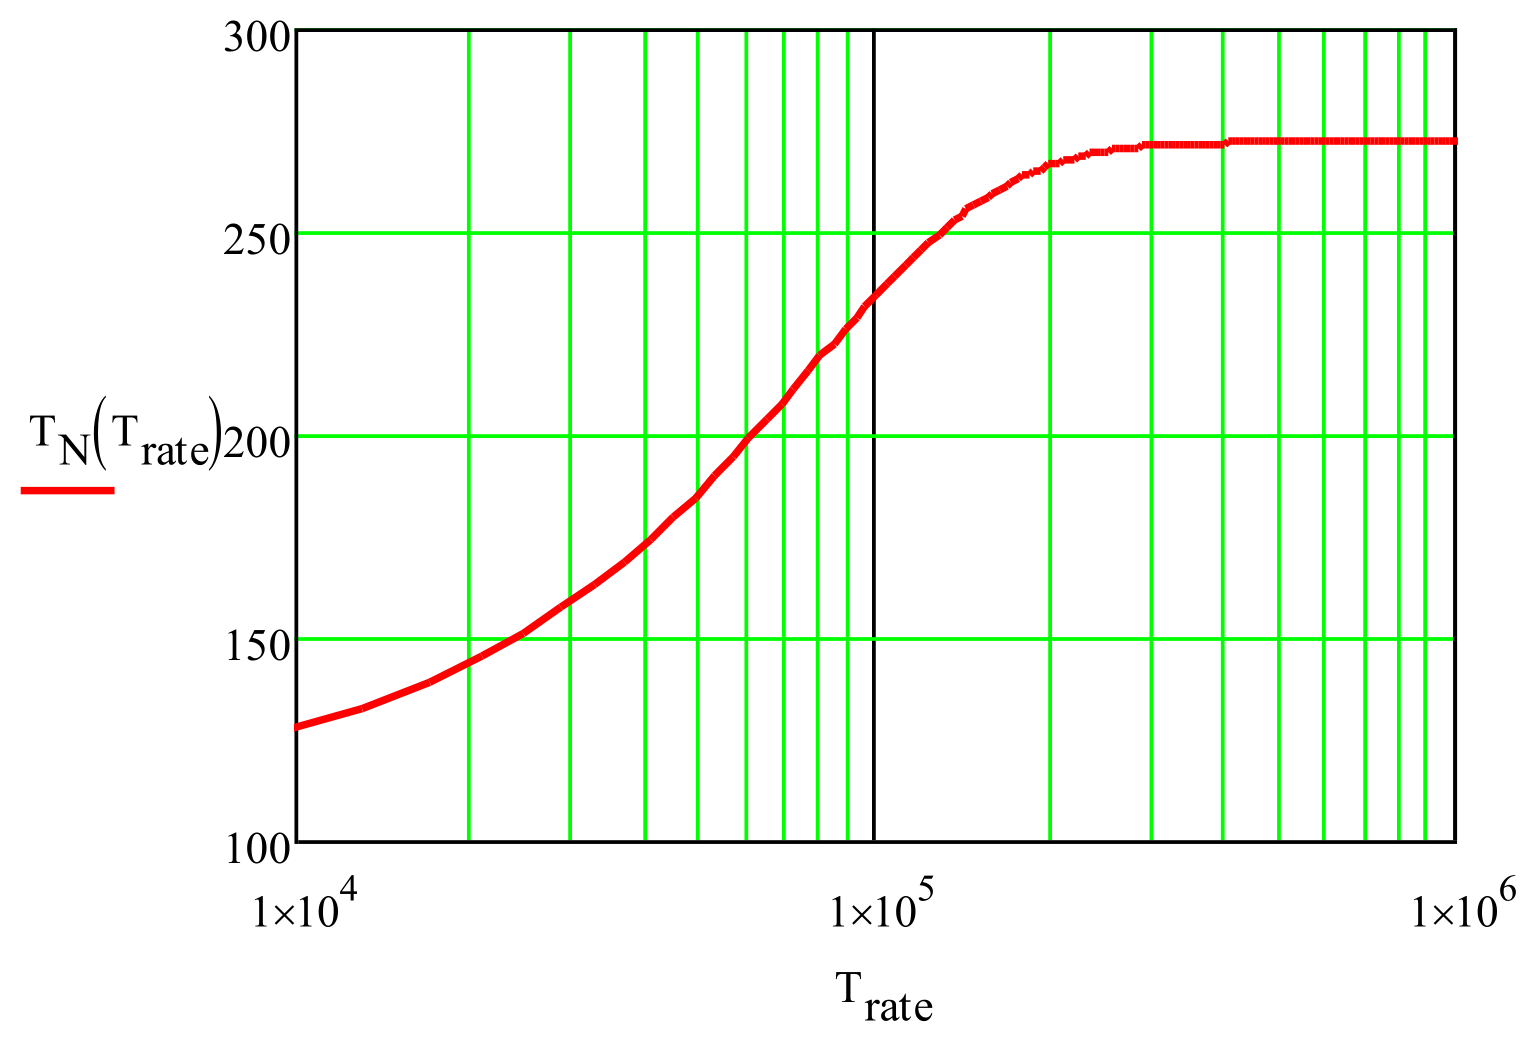
Figure 3.
The minimum energy density Qrate (J/m2) calculated using equations 2-6, and the water evaporation temperature TN (°C) versus heating rate Trate (K/s). Initial ice temperature was -10 °C and the ICD foil was made of 0.05 mm SS17-7PH steel.
Figure 3.
The minimum energy density Qrate (J/m2) calculated using equations 2-6, and the water evaporation temperature TN (°C) versus heating rate Trate (K/s). Initial ice temperature was -10 °C and the ICD foil was made of 0.05 mm SS17-7PH steel.
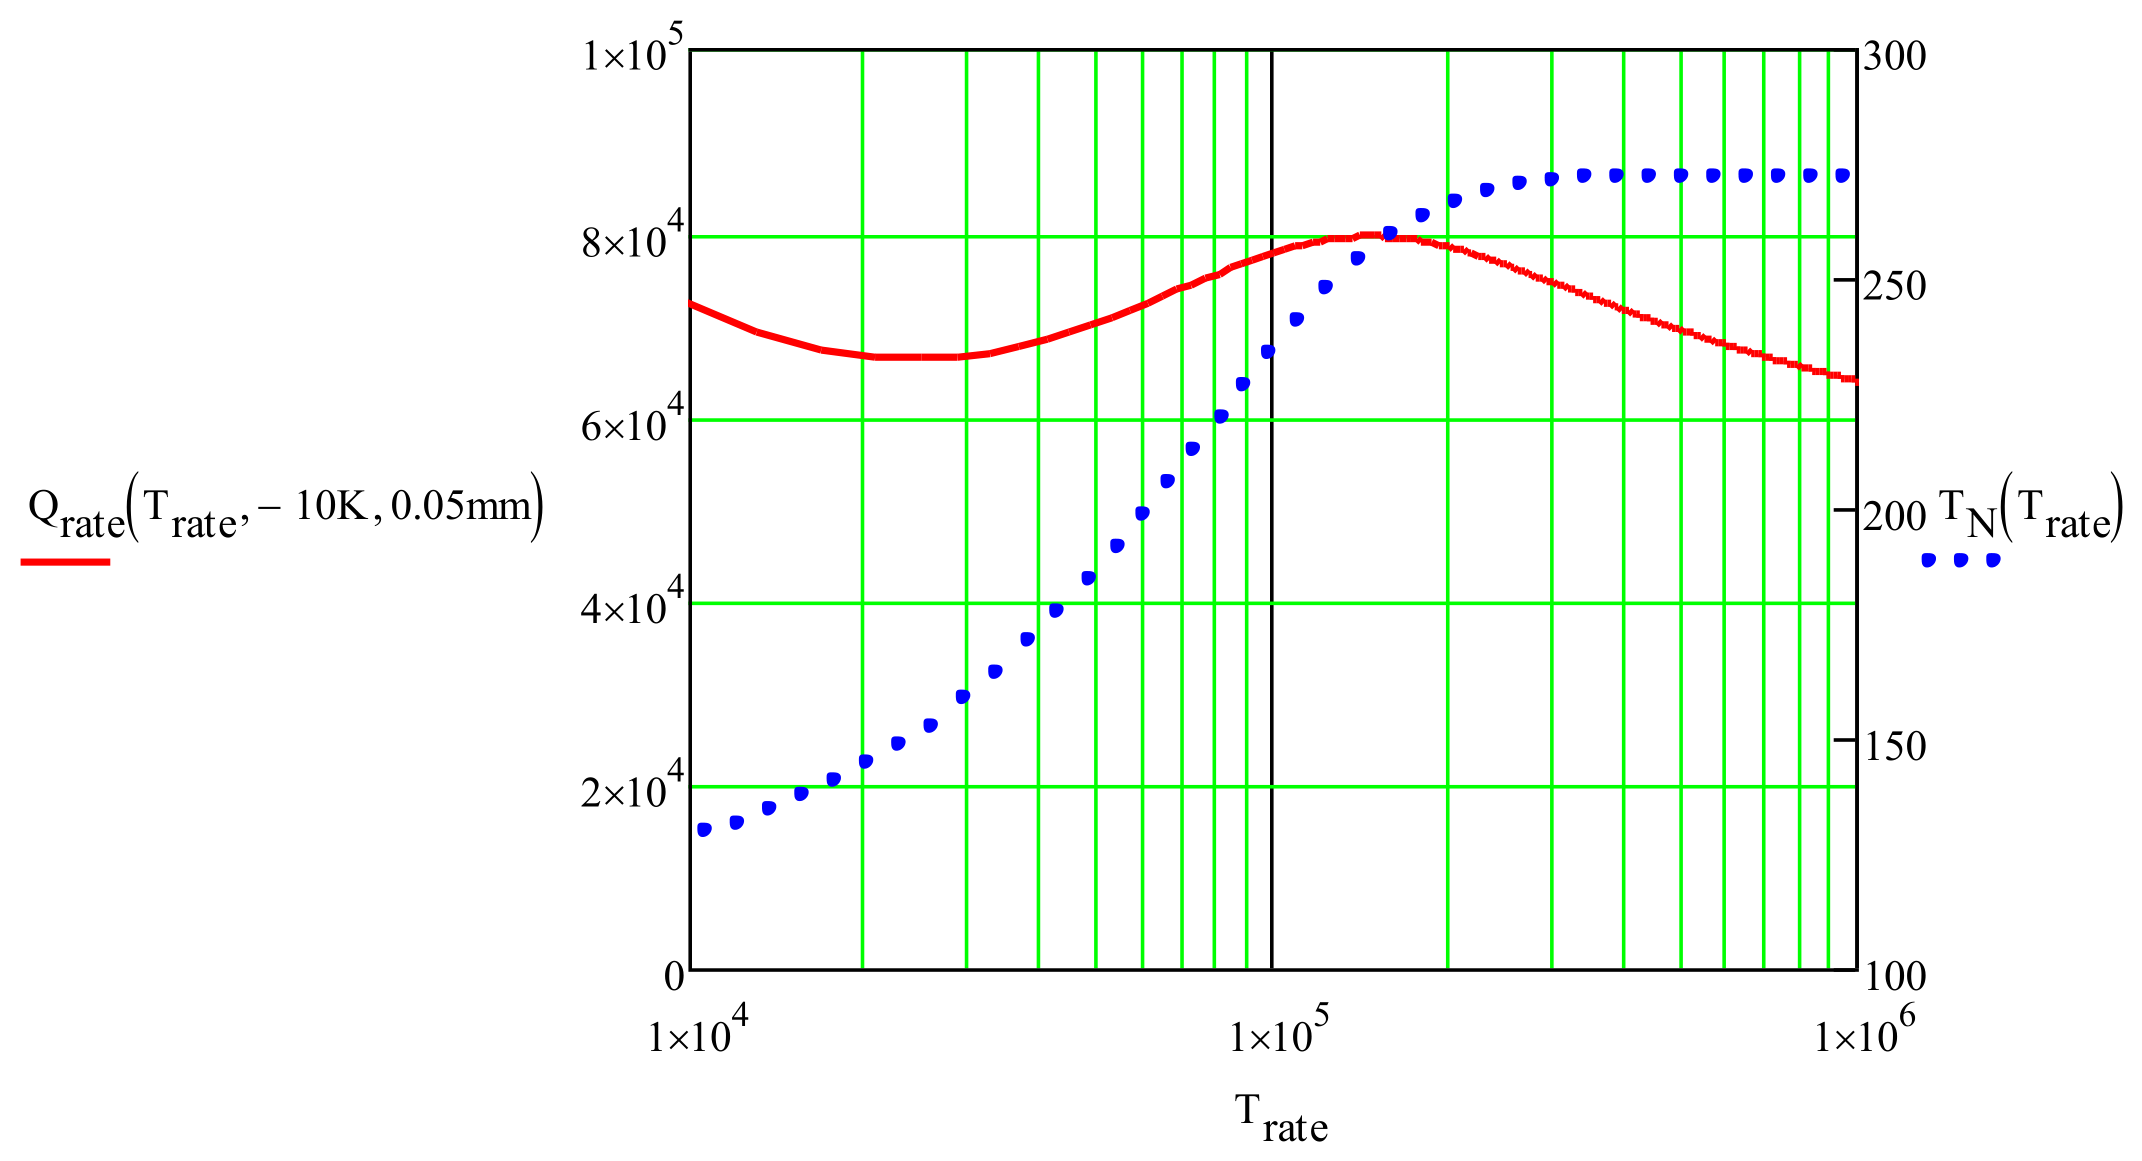
Figure 4.
COMSOL Multiphysics 5.4 simulation of a 0.05 mm Ti Grade 5 ICD foil bonded to a 0.2 mm Duralco 4703 HT epoxy adhesive and covered by a 0.2 mm ice layer. Capacitance C = 35 mF, charging voltage V0 = 300 V, energy density Q₍rate₎ = 77.8 kJ/m2, simulation time t = 2 ms, and prescribed nucleation temperature Tₙ = 150 °C.
Figure 4.
COMSOL Multiphysics 5.4 simulation of a 0.05 mm Ti Grade 5 ICD foil bonded to a 0.2 mm Duralco 4703 HT epoxy adhesive and covered by a 0.2 mm ice layer. Capacitance C = 35 mF, charging voltage V0 = 300 V, energy density Q₍rate₎ = 77.8 kJ/m2, simulation time t = 2 ms, and prescribed nucleation temperature Tₙ = 150 °C.
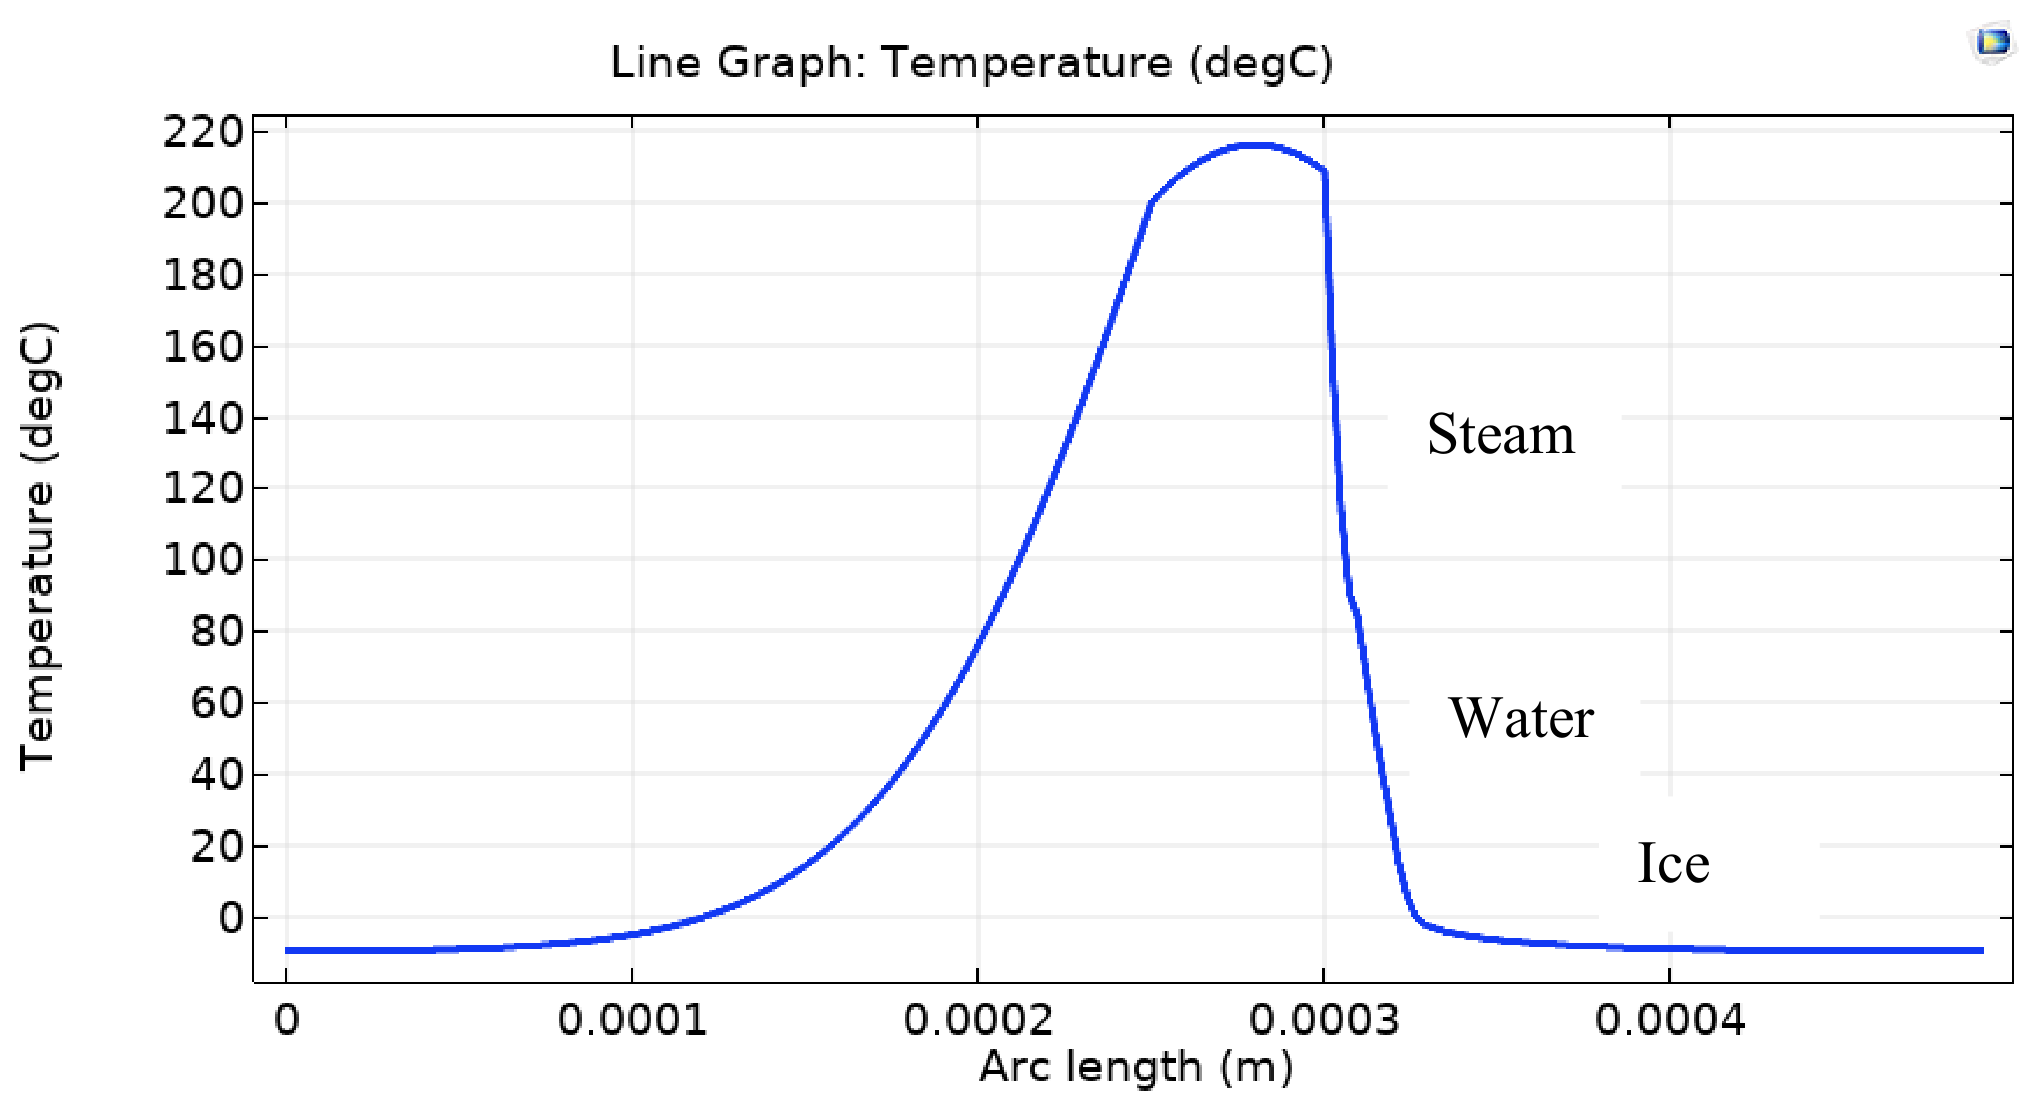
Figure 5.
Water flash fraction, fr, as a function of initial water temperature, °C.
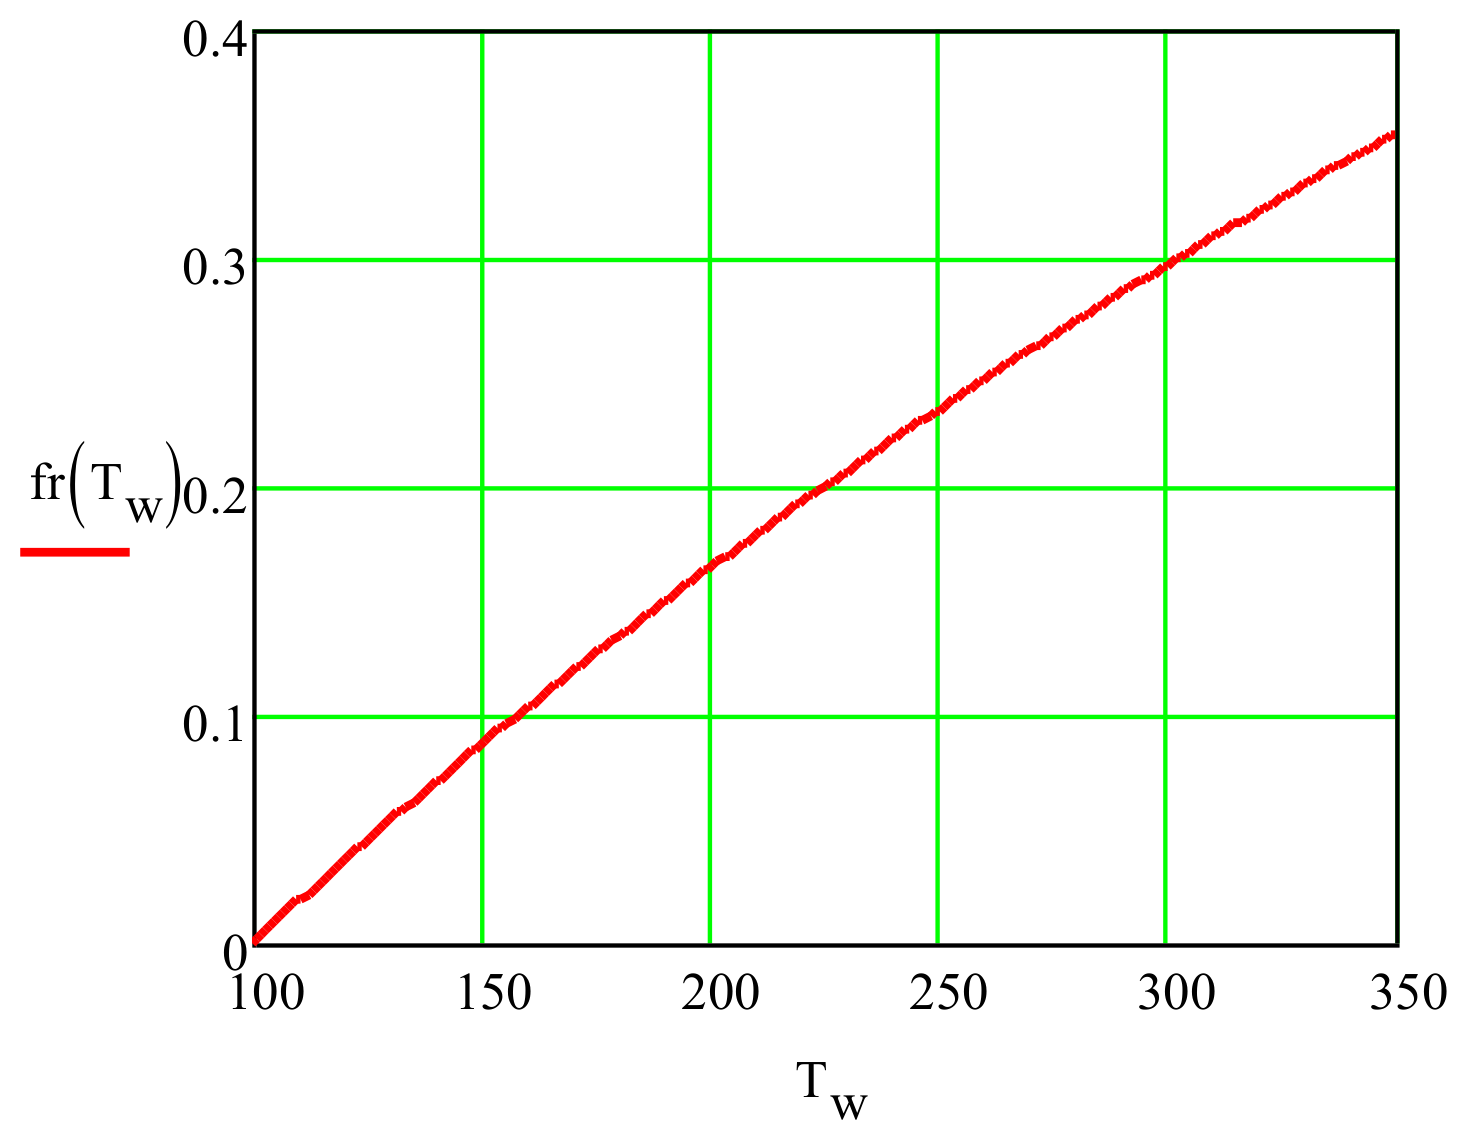
Figure 6.
Dependence of the maximum velocity of 10 mm ice plate, vi, m/s, and nucleation temperature, TN, °C, versus ICD heating rate, °C /s. The water thickness layer lw was calculated using equation 3.
Figure 6.
Dependence of the maximum velocity of 10 mm ice plate, vi, m/s, and nucleation temperature, TN, °C, versus ICD heating rate, °C /s. The water thickness layer lw was calculated using equation 3.
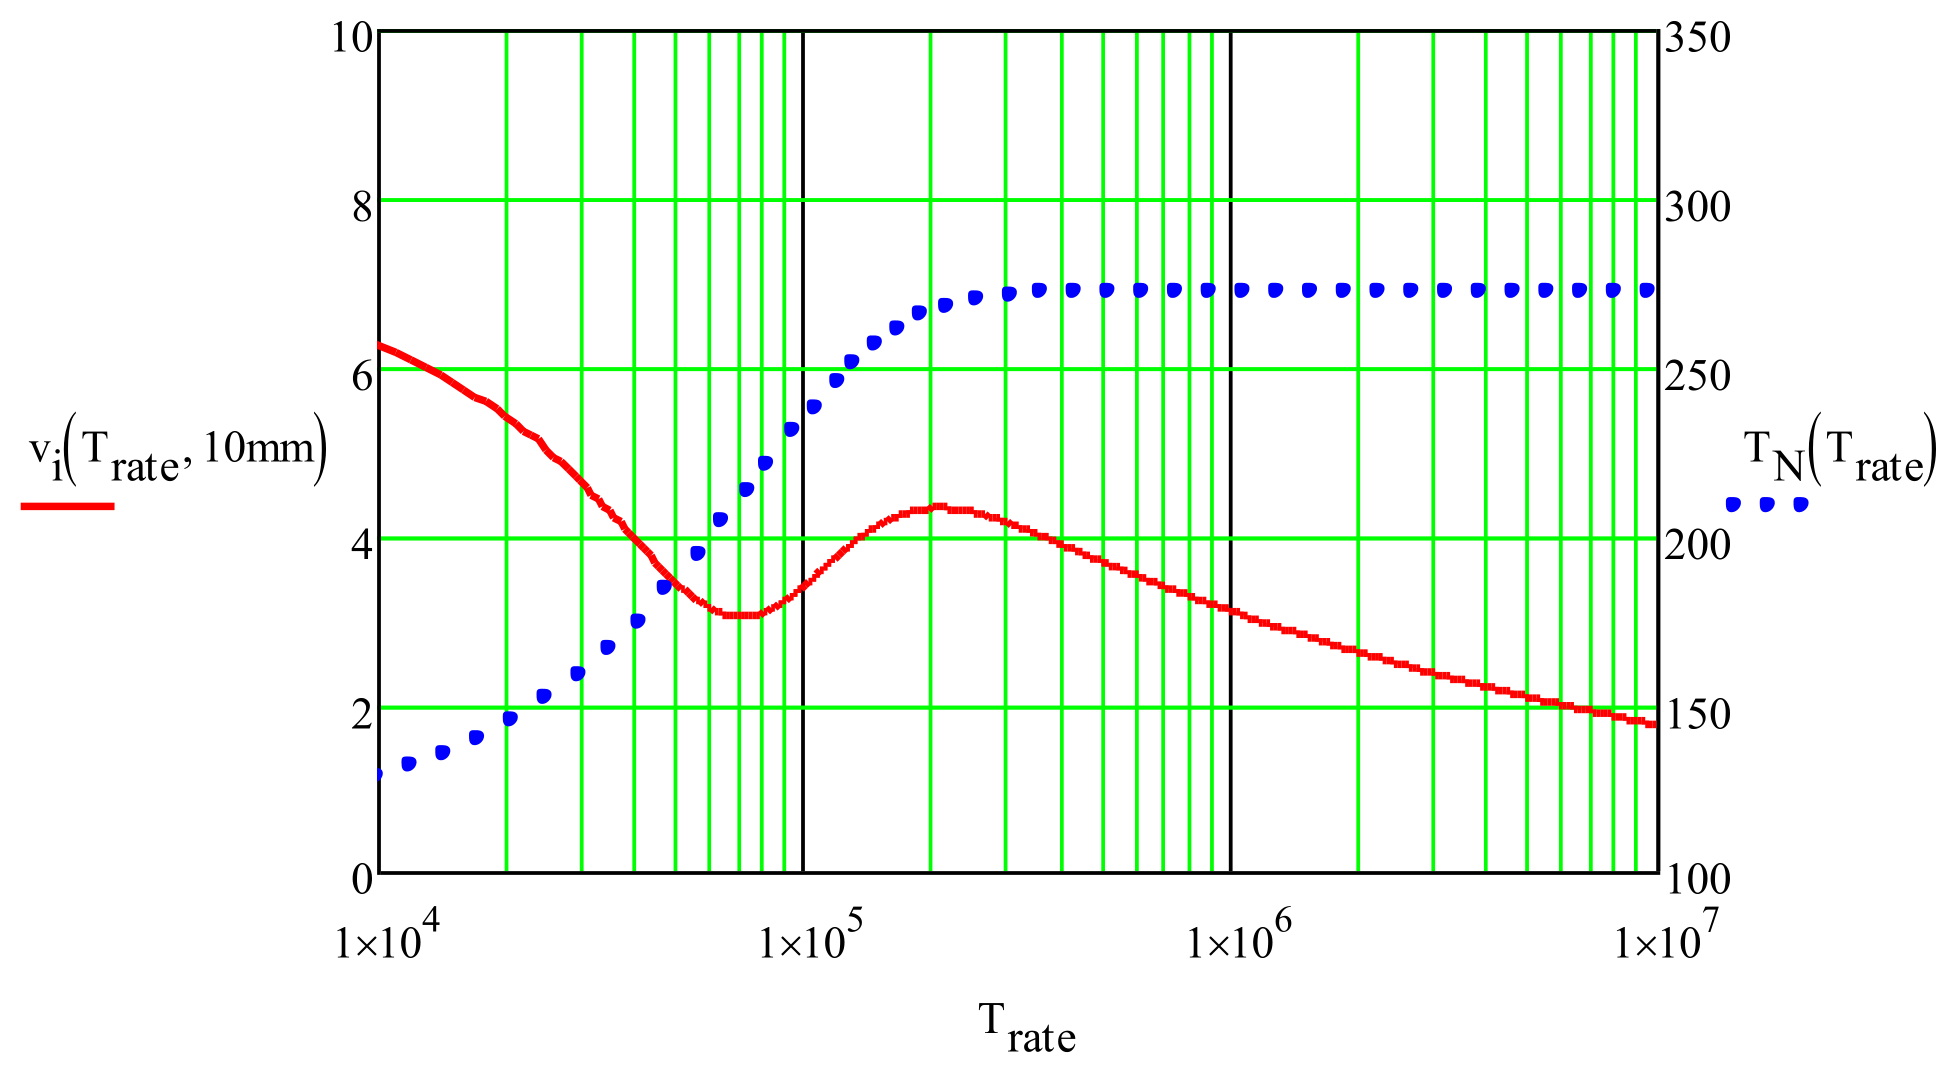
Figure 7.
An example of design optimization analysis. Total energy density requirement, Qtot (J/mm2), ICD energy density requirement, Qrate (J/m2), and maximum temperature of no-ice area LTICD, as functions of ICD aspect ratio, rTi5 = L/w. TN = 150 °C. Ti = -10 °C, Trate = 150C/(Rtot(rTi5)∙CC). Titanium Grade 5 0.05 mm foil on Duralco 4703 HT epoxy adhesive. Qrate_tot includes power circuit losses. Total circuit resistance Rtot(rTi5) is a function of aspect ratio of an ICD.
Figure 7.
An example of design optimization analysis. Total energy density requirement, Qtot (J/mm2), ICD energy density requirement, Qrate (J/m2), and maximum temperature of no-ice area LTICD, as functions of ICD aspect ratio, rTi5 = L/w. TN = 150 °C. Ti = -10 °C, Trate = 150C/(Rtot(rTi5)∙CC). Titanium Grade 5 0.05 mm foil on Duralco 4703 HT epoxy adhesive. Qrate_tot includes power circuit losses. Total circuit resistance Rtot(rTi5) is a function of aspect ratio of an ICD.
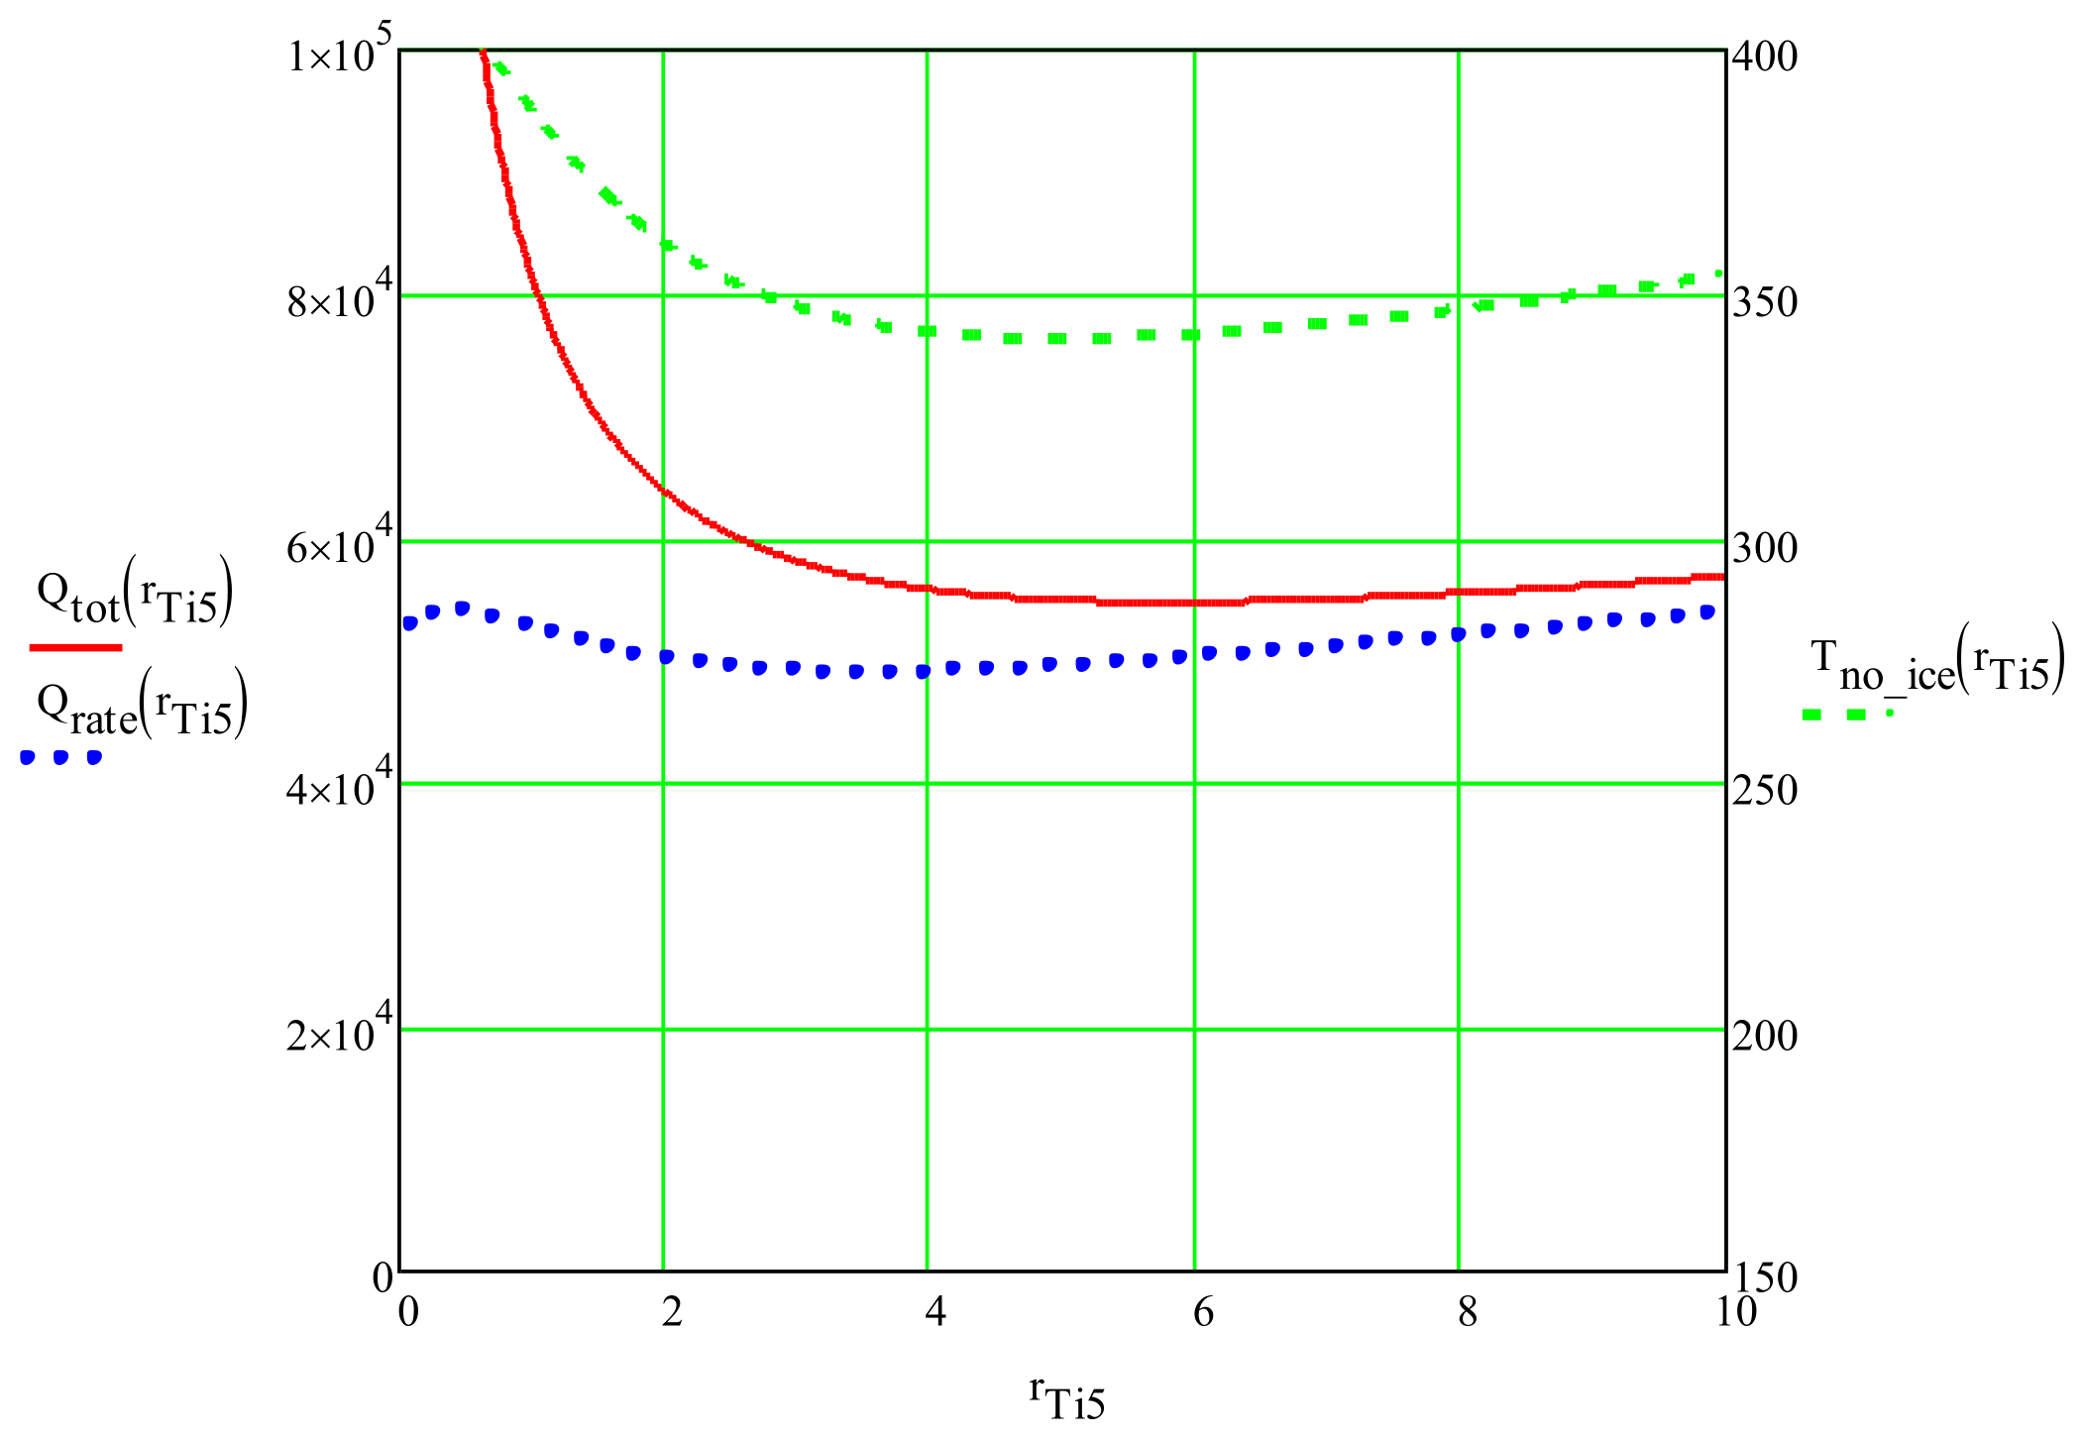
Figure 8.
Maximum tangential compressive stress σmax, Pa, in 0.076 mm SS17-7PH steel foil vs foil length, L, m. Silicone Permatex Optimum 399 (SA solid red line), 3M HT VHB 4646 tape (T, blue dot line), Loctite 2000 composite adhesive (green dash line) and Resbond 905 ceramic adhesive (magenta dash-dot line). SS17-7PHCH900 yield stress at 400C (solid green line) is shown as a reference. Thickness of all adhesive layers was 1mm. The maximum stress in the laminates was calculated using equation 16.
Figure 8.
Maximum tangential compressive stress σmax, Pa, in 0.076 mm SS17-7PH steel foil vs foil length, L, m. Silicone Permatex Optimum 399 (SA solid red line), 3M HT VHB 4646 tape (T, blue dot line), Loctite 2000 composite adhesive (green dash line) and Resbond 905 ceramic adhesive (magenta dash-dot line). SS17-7PHCH900 yield stress at 400C (solid green line) is shown as a reference. Thickness of all adhesive layers was 1mm. The maximum stress in the laminates was calculated using equation 16.
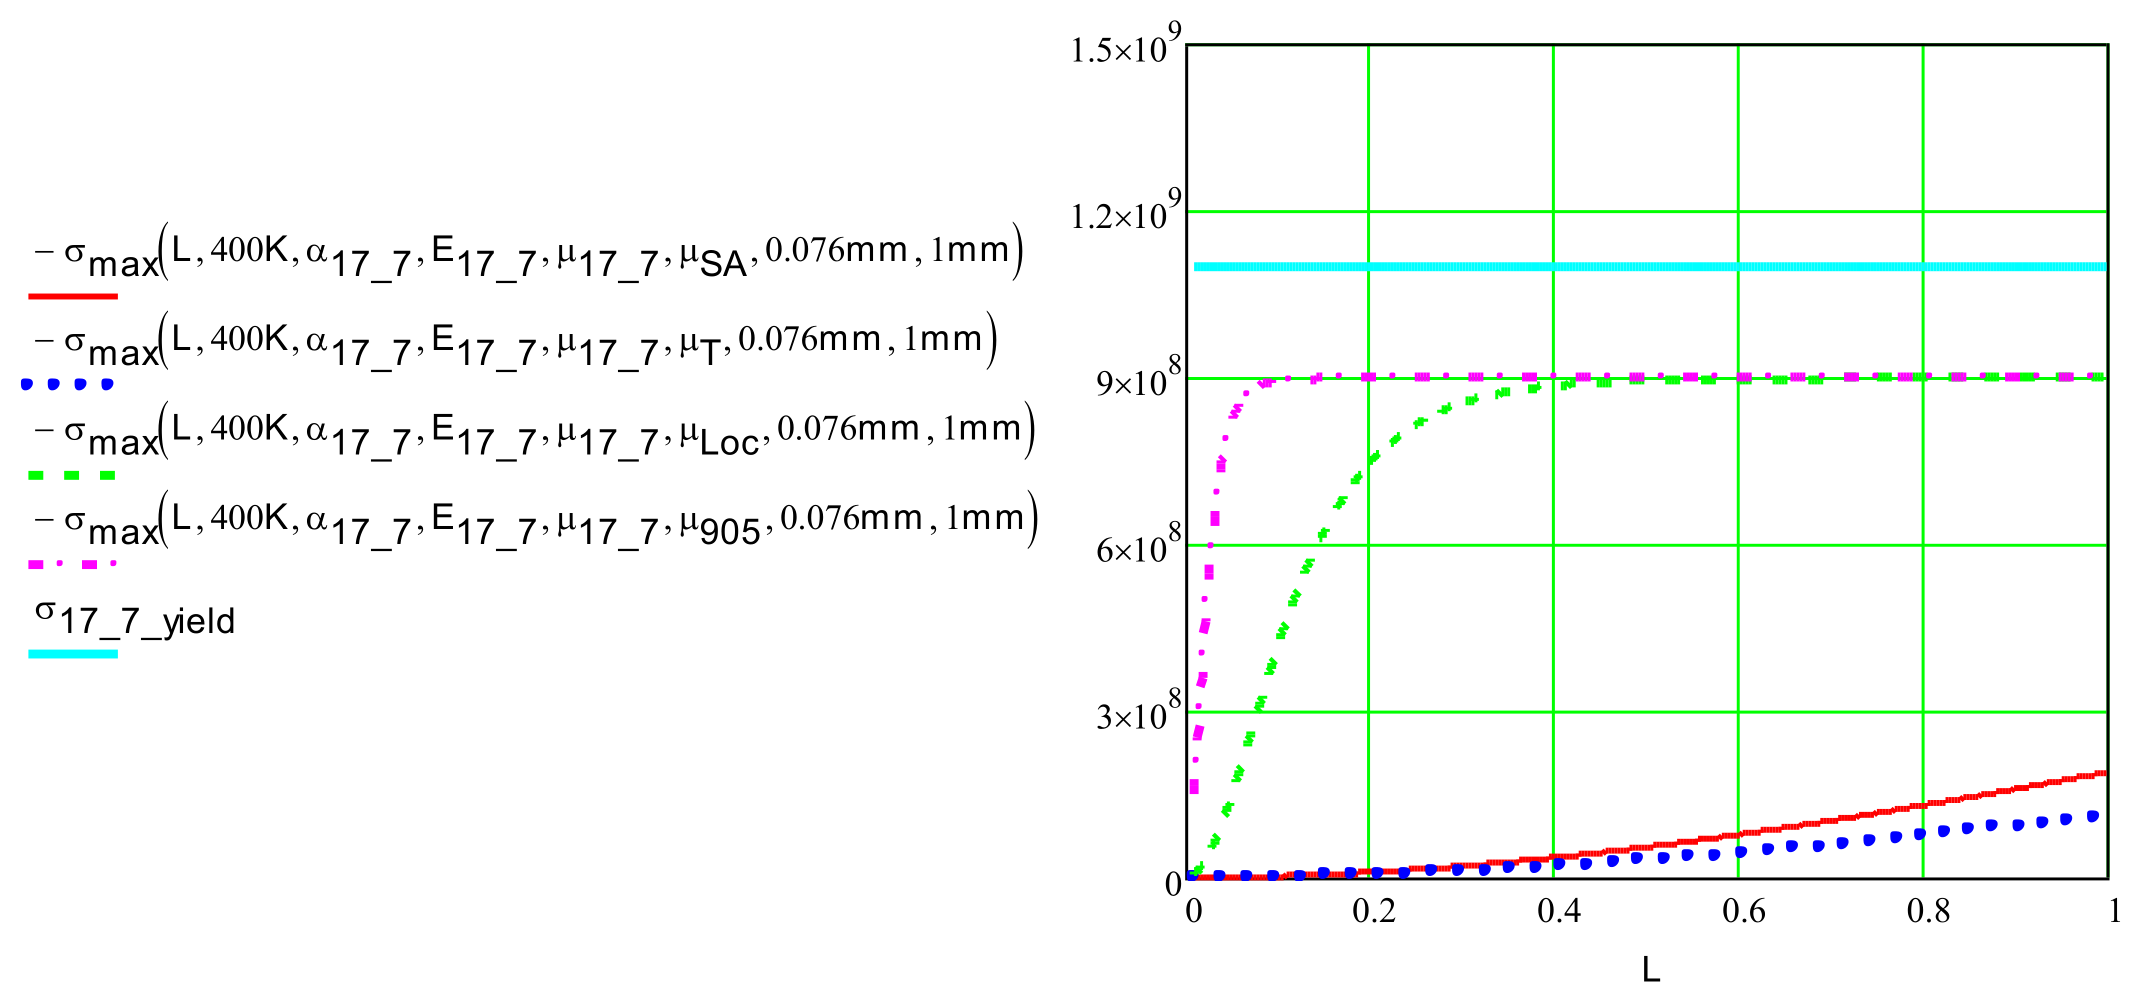
Figure 9.
Maximum shear stress τmax, Pa, in 1 mm adhesive vs foil length, L, m. Silicone Permatex Optimum 399 (SA solid red line), 3M HT VHB 4646 tape (T, blue dot line), Loctite 2000 composite adhesive (green dash line) and Resbond 905 ceramic adhesive (magenta dash-dot line). The maximum shear stress in the laminates was calculated using equation 17.
Figure 9.
Maximum shear stress τmax, Pa, in 1 mm adhesive vs foil length, L, m. Silicone Permatex Optimum 399 (SA solid red line), 3M HT VHB 4646 tape (T, blue dot line), Loctite 2000 composite adhesive (green dash line) and Resbond 905 ceramic adhesive (magenta dash-dot line). The maximum shear stress in the laminates was calculated using equation 17.
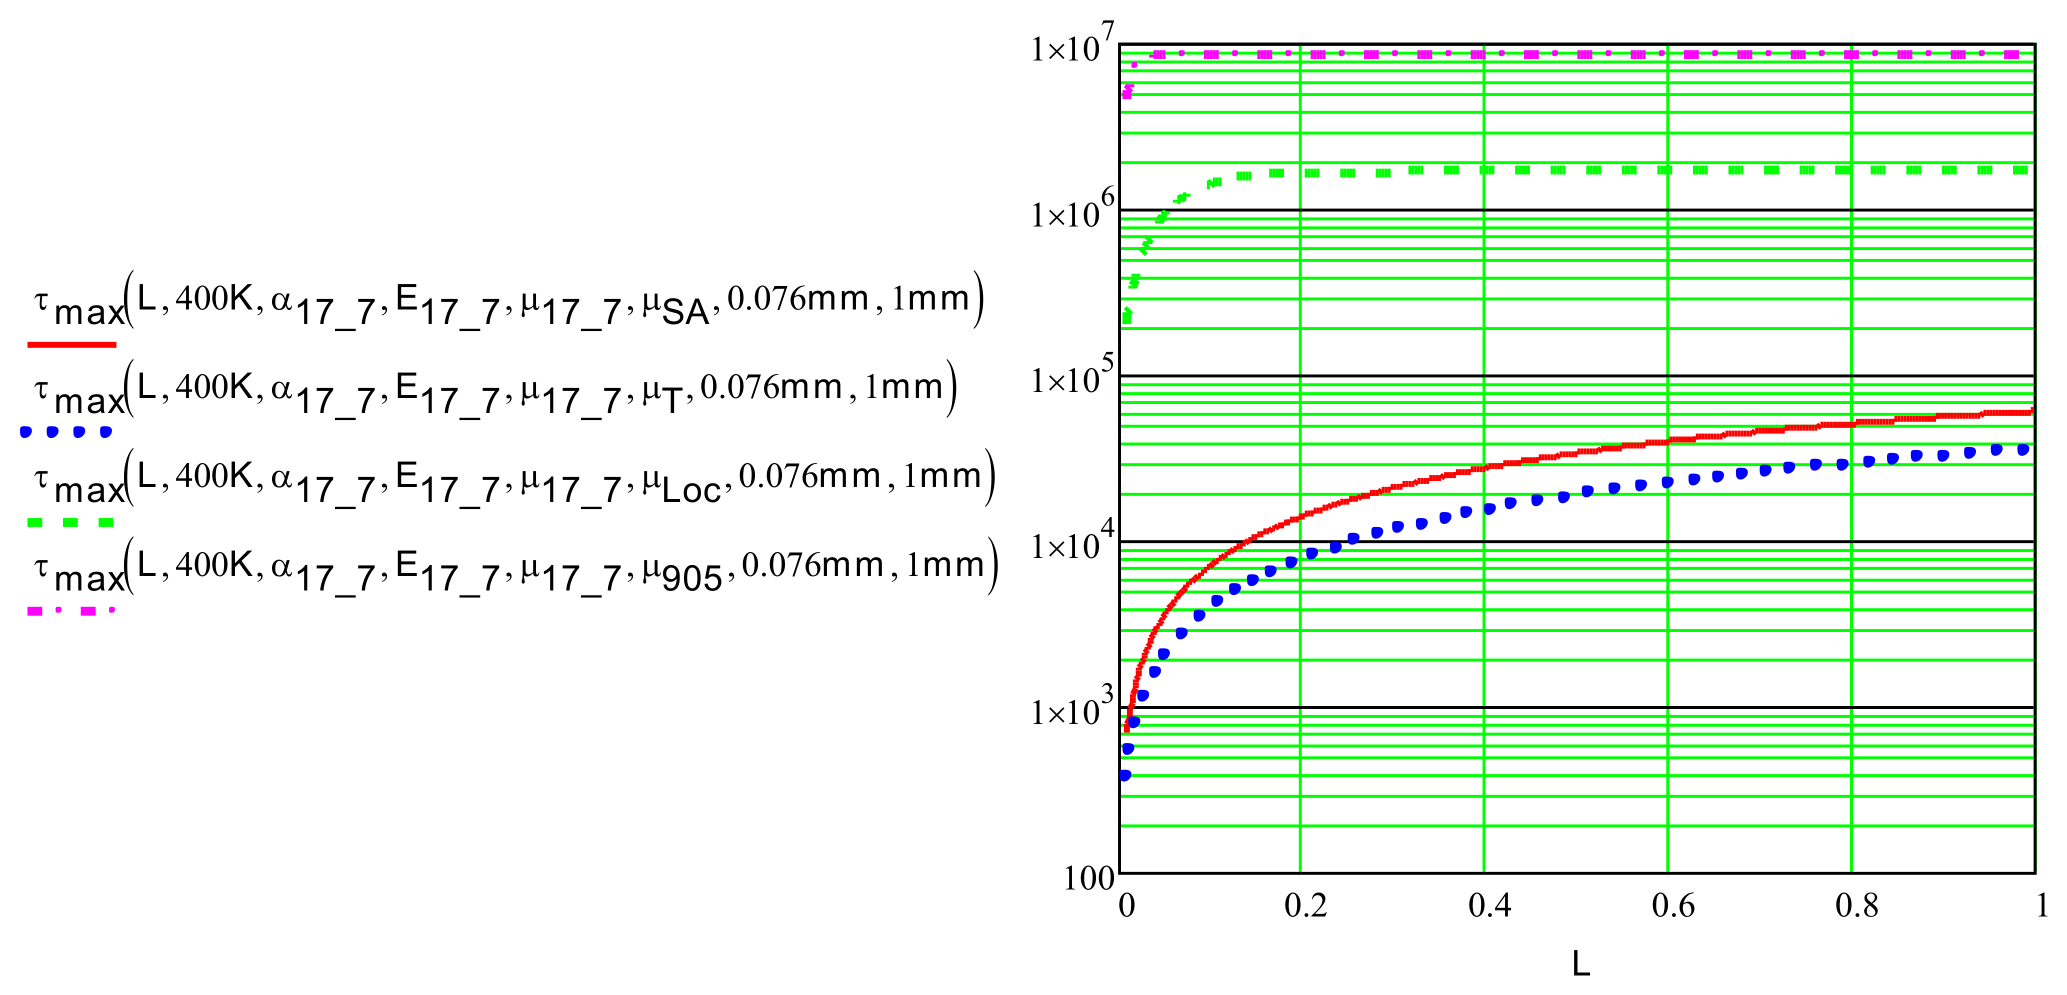
Figure 10.
Schematic diagram of the electronics used to test the ICD prototypes.
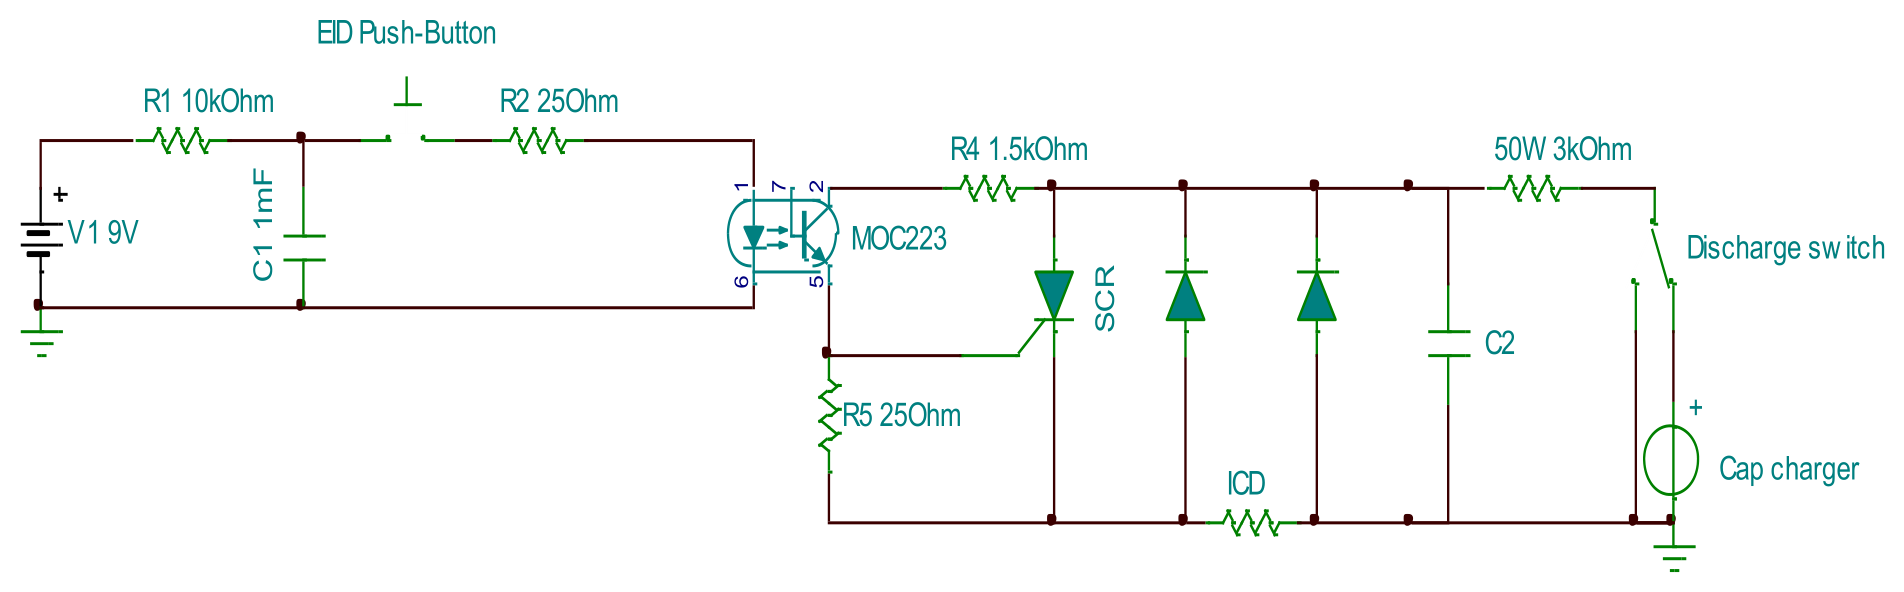
Table 3.
Selected experimental results.
| Size, mm | V0 | C | Qrate | TICD°C | Tno_ice | vi | Trate |
| V | mF | kJ/m2 | °C,COMSOL | °C,COMSOL | m/s | K/s | |
| SS17-7PHC | |||||||
| 0.05 x 40x 210 SS17-7PH, on Kapton | 170 | 35 | 51 | 130 | 245 | 0.4 | 3.2e4 |
| 0.05 x 40x 210 SS17-7PH, on Kapton | 180 | 35 | 57.5 | 148 | 276 | 0.6 | 3.6e4 |
| 0.05 x 40x 210 SS17-7PH, on Kapton | 200 | 35 | 71 | 184 | 342 | 1.4 | 4.44e4 |
| 0.05 x 40x 210 SS17-7PH, on Kapton | 220 | 35 | 86 | 223 | 414 | 2 | 5.55e4 |
| 0.05 x 40x 210 SS17-7PH on Kapton | 250 | 35 | 96 | 248 | 462 | 3 | 5.92e4 |
| 0.05 x 40x 210 SS17-7PH on Kapton | 290 | 15 | 58 | 182 | 284 | 1.4 | 1.02e5 |
| 0.05 x 40x 210 SS17-7PH on Kapton | 350 | 15 | 84 | 264 | 416 | 3 | 1.46e5 |
| 0.076 x 20 x 150 SS17-7PH on 907 | 700 | 1.5 | 115 | 358 | 404 | 6 | 2.2e6 |
| 0.076 x 20 x 150 SS17-7PH on 907 | 720 | 1.5 | 136 | 423 | 479 | 8 | 2.6e6 |
| 0.076 x 20 x 150 SS17-7PH on 907 | 760 | 1.5 | 139 | 432 | 490 | 10 | 2.6e6 |
| 0.076 x 20 x 150 SS17-7PH on 907 | 760 | 1.5 | 139 | 432 | 490 | 6 | 2.6e6 |
| 0.076 x 20 x 150 SS17-7PH on 907 | 700 | 1.5 | 117 | 364 | 411 | 3.9 | 2.2e6 |
| 0.076 x 20 x 150 SS17-7PH on 907 | 675 | 1.5 | 110 | 342 | 386 | 2 | 2.1e6 |
| 0.0257 x 25.4 x 38 SS304 on 3M 4611 | 314 | 0.383 | 19.6 | ≈ 300 | 1 | 9e6 | |
| Titanium Grade 5 and 1 | 3M/905/4703 | 3M/905/4703 | |||||
| 0.05 x 50 x 85 Ti5 on 3M 4646, UV | 190 | 35 | 102 | 413/332/281 | 689/477/360 | 6.6 | 1.12e5 |
| 0.05 x 50 x 85 Ti5 on 3M 4646, UV | 175 | 35 | 86.6 | 330/280/223 | 584/404/304 | 4.4 | 9.64e4 |
| 0.05 x 50 x 85 Ti5 on 3M 4646, UV | 160 | 35 | 72.4 | 278/220/173 | 486/336/253 | 2.2 | 8.14e4 |
| 0.05 x 50 x 85 Ti5 on 3M 4646, UV | 150 | 35 | 63.6 | 213/175/143 | 426/294/222 | 1.6 | 7.14e4 |
| 0.05 x 50 x 85 Ti5 on 3M 4646, UV | 135 | 35 | 51.5 | 153/124/104 | 343/237/177 | 0 | 5.82e4 |
| 0.105 x 25 x 185 Ti5 on 3M 4611, UV | 250 | 15 | 83.7 | 165 | 301 | 0.35 | 8.3e4 |
| 0.105 x 25 x 185 Ti5 on 3M 4611, UV | 275 | 15 | 101 | 247 | 366 | 1 | 9.95e4 |
| 0.105 x 25 x 185 Ti5 on 3M 4611, UV | 300 | 15 | 120 | 293 | 436 | 2.4 | 1.17e5 |
| 0.01 x 37 x 75 Ti1 on Porcelain | 790 | 0.1 | 11.3 | ≈ 300 | 2 | 2.5e7 | |
| 0.05 x 25 140 Invar on 3M 4646 | 160 | 35 | 101 | 177 | 304 | 2 | 4.3e4 |
Disclaimer/Publisher’s Note: The statements, opinions and data contained in all publications are solely those of the individual author(s) and contributor(s) and not of MDPI and/or the editor(s). MDPI and/or the editor(s) disclaim responsibility for any injury to people or property resulting from any ideas, methods, instructions or products referred to in the content. |
© 2026 by the authors. Licensee MDPI, Basel, Switzerland. This article is an open access article distributed under the terms and conditions of the Creative Commons Attribution (CC BY) license (http://creativecommons.org/licenses/by/4.0/).
Copyright: This open access article is published under a Creative Commons CC BY 4.0 license, which permit the free download, distribution, and reuse, provided that the author and preprint are cited in any reuse.


