
Submitted:
05 August 2026
Posted:
07 August 2026
You are already at the latest version
Abstract
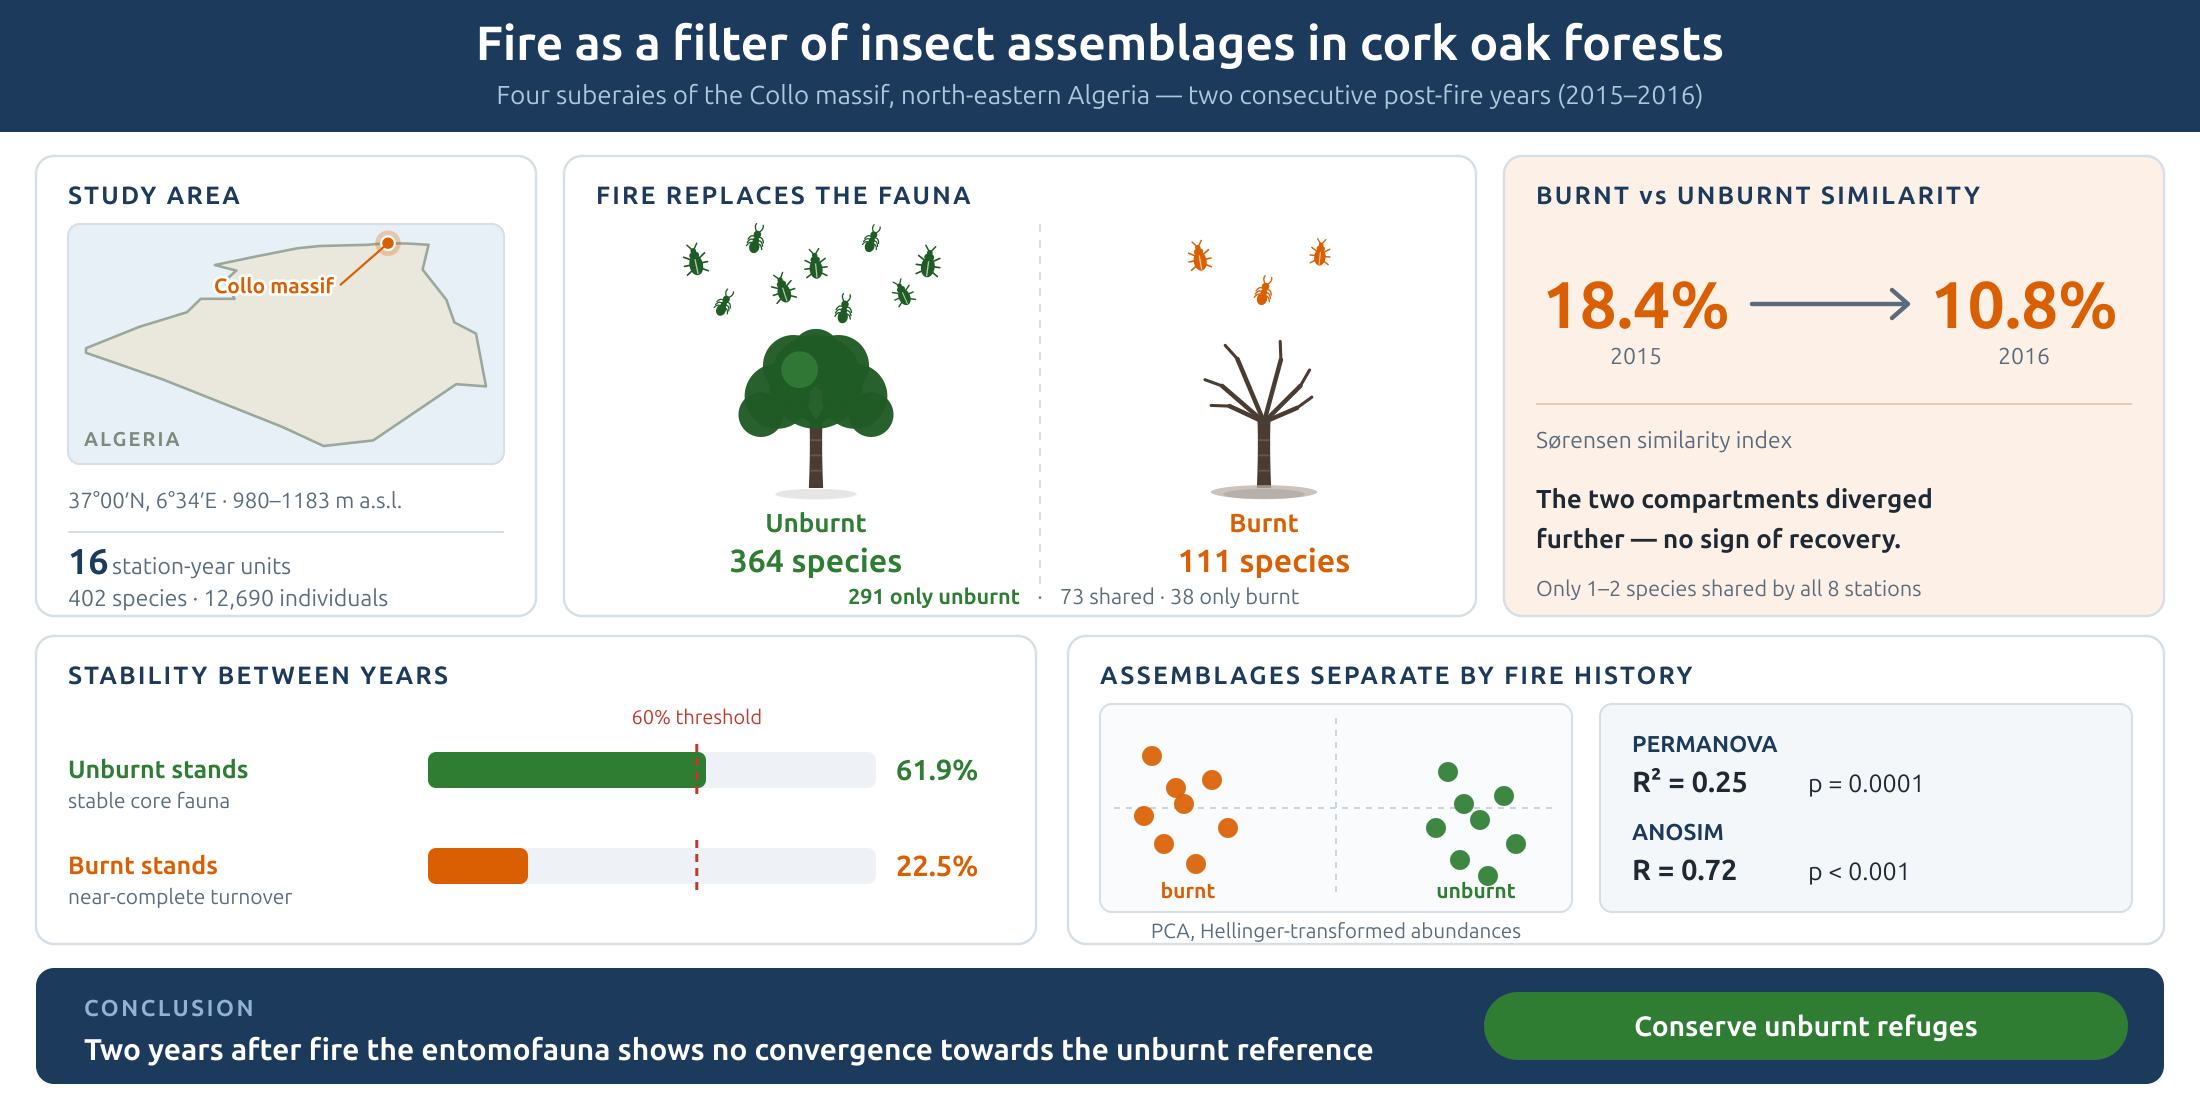
Wildfire is a dominant disturbance in Mediterranean cork oak (Quercus suber) ecosystems, yet its medium-term consequences for insect assemblages remain poorly documented in North Africa. We compared burnt and unburnt stands in four suberaies of north-eastern Algeria (Djebel El Goufi/Lemdjalba, El Maktoua, Oued Agouf and Ain Fegoune) during two consecutive post-fire years (2015 and 2016). Across 16 station-year units, 402 insect species were recorded. Unburnt stands harboured 364 species against 111 in burnt stands, and 291 species were exclusive to unburnt stands. Sorensen similarity between burnt and unburnt stands was consistently low (mean 18.4% in 2015 and 10.8% in 2016), whereas unburnt stands remained comparatively stable between years (mean 61.9%) and burnt stands did not (22.5%). Principal component analysis of Hellinger-transformed abundances separated burnt from unburnt units along PC1, and PERMANOVA confirmed a significant effect of fire history (R2 = 0.25, p = 0.0001; ANOSIM R = 0.72, p < 0.001) with no significant year or interaction effect. UpSet and chord diagrams showed that species overlap was concentrated within, rather than between, fire-history classes, with only one to two species shared by all eight stations. Two years after fire, assemblages had not begun to converge towards the unburnt reference, indicating slow entomofaunal resilience and supporting the retention of unburnt refuges in post-fire management.
Keywords:
wildfire
; Quercus suber
; entomofauna
; Sorensen similarity
; beta diversity
; PERMANOVA
; UpSet plot
; chord diagram
; Algeria
; post-fire succession
1. Introduction
Cork oak forests are among the most emblematic and economically valuable ecosystems of the western Mediterranean Basin. In Algeria they cover approximately 230,000 ha and support a rich invertebrate fauna that contributes to pollination, decomposition, nutrient cycling and pest regulation [1,2]. These forests are also among the most fire-prone landscapes of the region: recurrent summer wildfires, amplified by drought, fuel accumulation and human ignition, have accelerated markedly in recent decades [3].
Fire acts simultaneously as a destructive and a structuring agent. It removes canopy cover, consumes litter, alters soil microclimate and abruptly modifies the availability of trophic and nesting resources. For insects, these changes operate as an ecological filter: species with narrow habitat requirements are eliminated, while mobile, thermophilous or pyrophilous taxa may temporarily benefit from newly opened habitat [4,5]. The resulting assemblage is therefore not a depauperate subset of the pre-fire fauna but a compositionally distinct community.
Most work on post-fire insect responses in the Mediterranean has focused on Coleoptera in pine and holm oak systems, and on the first months following fire. Cork oak forests have received comparatively little attention, and studies that follow assemblages over successive post-fire years while maintaining paired unburnt controls remain scarce, particularly in North Africa. Without such controls it is impossible to distinguish the effect of fire from natural interannual turnover.
Here we address this gap using a paired burnt/unburnt design replicated across four Algerian suberaies and repeated in two consecutive post-fire years. Our objectives were: (i) to quantify the effect of fire history on species richness, abundance and diversity; (ii) to measure compositional similarity between burnt and unburnt stands using the Sorensen index; (iii) to test whether unburnt stands are temporally stable, thereby validating them as references; and (iv) to visualise and statistically test assemblage structure using ordination, set-overlap and chord representations. We hypothesised that fire history would explain more compositional variation than either site identity or year, and that burnt assemblages would show high interannual turnover consistent with early successional dynamics.
2. Materials and Methods
2.1. Study Area
The Collo Massif, located at coordinates 37° 0′ 23″ N, 6° 33′ 39″ E, is a densely forested moun-tain range located in the north-eastern region of Algeria, where it constitutes an integral part of the Tellian Atlas. It ranges in altitude from 980 to 1,183 metres and experiences a humid to sub-humid Mediterranean climate characterised by distinct seasonal variations. The region has a tem-perate and wet winter from December to March, followed by a hot, dry summer from June to Sep-tember. Three unburnt study sites were selected across diverse locations within the massif for this investigation. Cork is derived from the bark of the cork oak (Quercus suber L.), a species char-acterised by semi-evergreen foliage, moderate longevity, and considerable resistance drought and fire conditions, as noted by [6]. The study was conducted in four cork oak (Quercus suber L.) forests of north-eastern Algeria: Djebel El Goufi (locally Lemdjalba), El Maktoua, Oued Agouf and Ain Fegoune. The region has a sub-humid Mediterranean climate with hot, dry summers and mild, wet winters. Each suberaie included a stand burnt by wildfire and an adjacent unburnt stand of comparable altitude, slope, aspect and pre-fire structure, separated by a few hundred metres. This paired design allows the effect of fire to be isolated from broader landscape and climatic variation (Figure 1).
2.2. Sampling Design
Eight stations were surveyed (four suberaies x two fire-history classes: burnt, hereafter FI; unburnt, hereafter FNI) and each station was sampled during two consecutive post-fire years, 2015 and 2016, yielding 16 station-year units. Sampling combined complementary techniques (pitfall traps, coloured water traps, sweep netting and direct searching) applied with identical effort at every station and on every occasion, so that captures are directly comparable among stations and years. Specimens were preserved in 70% ethanol and identified to species whenever possible, otherwise to morphospecies within genus.
2.3. Data Analysis
All analyses were performed in R version 4.3 [7]. Species richness (S), total abundance (N), the Shannon index (H’), the Simpson index (1-D) and Pielou evenness (J’) were computed with vegan [8]. Compositional similarity between pairs of stations was quantified with the Sorensen index [9], Cs (%) = 2c / (a + b) x 100, where a and b are the numbers of species in the two samples and c the number of species common to both. Following common biocoenotic practice we treated Cs >= 60% as indicating assemblages belonging to the same faunal unit and Cs < 60% as indicating distinct assemblages [10]; values are reported so that the more permissive 50% threshold can also be applied.
Assemblage structure was ordinated by principal component analysis (PCA) of Hellinger-transformed abundances, a transformation that renders Euclidean-based ordination appropriate for species count data by down-weighting dominant taxa and avoiding the double-zero problem [11]. Differences among fire-history classes and years were tested by permutational multivariate analysis of variance (PERMANOVA, adonis2, Bray-Curtis distance, 9999 permutations) [12] and by ANOSIM; homogeneity of multivariate dispersion was checked with PERMDISP (betadisper). Patterns of species sharing among the eight stations were visualised with an UpSet plot [13], which generalises the Venn diagram beyond five sets, and with chord diagrams [14] in which ribbon width is proportional to the number of species shared by a pair of stations. Figures were produced with ggplot2 [15] and base graphics.
3. Results
3.1. Abundance, Richness and Diversity
Across the 16 station-year units, 402 insect species were recorded. Unburnt stands accumulated 364 species and burnt stands only 111; 73 species occurred in both classes, 291 were exclusive to unburnt stands and 38 to burnt stands. Species richness per station was consistently lower in burnt stands (8-57 species) than in the paired unburnt stands (57-153 species), and the contrast widened in 2016 (Table 1). Shannon diversity followed the same pattern (burnt 1.79-3.42; unburnt 3.11-4.28), whereas Pielou evenness remained comparatively high in burnt stands, indicating assemblages that are species-poor but not strongly dominated.
3.2. Sorensen Similarity
Similarity between paired burnt and unburnt stands was low in every suberaie and in both years (Table 2). In 2015, Cs ranged from 10.53% (Ain Fegoune) to 26.59% (El Maktoua), mean 18.42%. In 2016 values declined further (6.41-16.51%, mean 10.82%), because unburnt stands continued to accumulate species while burnt stands remained depauperate. Pooling both years raised the values only slightly (16.11-28.57%, mean 20.24%), confirming that the low similarity is not an artefact of incomplete sampling within a single season.
The two temporal comparisons behaved in opposite ways. Unburnt stands compared between 2015 and 2016 retained a large shared core (41-90 species) and reached a mean similarity of 61.87%, with El Maktoua (77.51%) and Ain Fegoune (66.42%) exceeding the 60% threshold and El Goufi (51.90%) and Oued Agouf (51.66%) falling just below it. Burnt stands, by contrast, shared only four to six species between years and averaged 22.51%, revealing near-complete turnover of the assemblage from one post-fire year to the next.
3.3. Ordination of Assemblages
PCA of Hellinger-transformed abundances separated the 16 station-year units primarily according to fire history (Figure 2). PC1 explained 22.1% and PC2 14.6% of the total variance (36.7% cumulatively, a value typical of species-rich assemblage matrices). All unburnt units occupied positive PC1 scores (0.249 to 0.343) whereas burnt units were displaced towards negative scores (-0.636 to 0.038). Burnt units were also more widely scattered than unburnt units, reflecting the idiosyncratic composition of each post-fire assemblage.
Ordinations computed separately for each year confirmed this structure and showed that it was already fully expressed in the first post-fire year and maintained in the second (Figure 3). In 2015, PC1 explained 30.6% and PC2 15.9% of the variance (46.5% cumulatively), with the four burnt stands occupying exclusively negative PC1 scores (-0.459 to -0.326) and the four unburnt stands exclusively positive scores (0.282 to 0.471). In 2016 the separation was equally clear and slightly stronger on the first axis (PC1 33.2%, PC2 15.5%, 48.7% cumulatively), burnt stands ranging from -0.658 to 0.243 and unburnt stands from 0.307 to 0.420. In neither year did a burnt station fall within the unburnt group. Site-level ordinations conducted separately for each suberaie gave the same result (Supplementary Figures S1–S4).
3.4. Patterns of Species Sharing
The UpSet analysis of all eight stations (Figure 4) showed that the largest intersections were those uniting unburnt stations, and that single-station (exclusive) species were far more numerous in unburnt stands. In 2015, exclusive species numbered 15, 28, 34 and 65 in the unburnt stands of El Goufi, El Maktoua, Oued Agouf and Ain Fegoune respectively, against 4, 17, 4 and 3 in the corresponding burnt stands; the pattern was even more pronounced in 2016 (46, 28, 78 and 50 versus 6, 3, 1 and 5; Figure 5). Only two species, the ants Cataglyphis viaticus and Pheidole pallidula, were present in all eight stations in 2015, and a single species, the dung beetle Sisyphus schaefferi, in 2016.
Chord diagrams conveyed the same structure in a pairwise form (Figure 6). Ribbons connecting unburnt stations were markedly wider than those linking burnt to unburnt stations: in 2015, unburnt pairs shared 25 to 61 species, whereas burnt-unburnt pairs shared only 5 to 23. In 2016 the contrast increased further, unburnt pairs sharing 26 to 46 species and burnt-unburnt pairs no more than nine (Figure 7).
3.5. Statistical Tests
PERMANOVA on Bray-Curtis distances confirmed the ordination: fire history explained a significant and substantial fraction of compositional variation (R2 = 0.252, F = 4.97, p = 0.0001), whereas the effect of year (R2 = 0.077, p = 0.099) and the fire x year interaction (R2 = 0.065, p = 0.195) were not significant. ANOSIM gave a high separation statistic (R = 0.724, p = 0.0003). PERMDISP indicated that multivariate dispersion also differed between classes (F = 8.75, p = 0.010), burnt assemblages being the more heterogeneous; part of the PERMANOVA signal may therefore reflect this greater dispersion in addition to a shift in centroid position. Because the ordination shows a clear centroid displacement along PC1 and the two effects act in the same ecological direction, we interpret the result as a genuine compositional shift accompanied by increased variability among burnt stands.
4. Discussion
Our results show that wildfire restructures cork oak insect assemblages far more strongly than either site identity or interannual variation. The similarity between burnt and unburnt stands never approached the threshold conventionally used to recognise a common faunal unit, and the compositional distance between the two classes was significant in every multivariate test applied. The magnitude of the contrast, 364 species in unburnt stands against 111 in burnt stands, with 291 species found only in unburnt stands, indicates that fire does not simply thin the community but replaces it.
The most informative element of the design is the temporal control. Because unburnt stands retained a mean similarity of 61.87% between the two years, the low burnt-unburnt similarity cannot be attributed to sampling noise or to natural turnover: it is attributable to fire. Conversely, burnt stands shared only four to six species between consecutive years, a turnover characteristic of early successional systems in which pioneer colonists of bare ground are replaced as herbaceous and shrubby vegetation re-establishes and modifies resources and microhabitats [4].
The widening of the gap in 2016 deserves emphasis, because it runs counter to a simple expectation of progressive recovery. It arises from two divergent trajectories: unburnt stands continued to accumulate species, whereas burnt stands remained impoverished. Oued Agouf illustrates the extreme case, with eight species in the burnt stand against 148 in the unburnt control. Two years after fire, therefore, the entomofauna had not begun to converge on the reference assemblage. This slow trajectory is consistent with reports that saproxylic and litter-dependent taxa, which depend on structural attributes that take decades to redevelop, are the last guilds to return [5,15].
The composition of the residual shared fauna supports a filtering interpretation. The few species present in every station were ants of the genera Cataglyphis and Pheidole and the dung beetle Sisyphus schaefferi, all mobile, thermotolerant and trophically generalist taxa. Such species buffer the loss of specialists in indices based on presence alone, which is why abundance-based ordination and set-overlap analyses provide a more complete picture than similarity indices used in isolation.
Two limitations should be acknowledged. First, the design comprises eight spatial units per year, so the statistical tests, although clearly significant, rest on a modest number of replicates, and the significant PERMDISP result means that heterogeneity and location effects cannot be fully separated. Second, sampling covers only the first two post-fire years; longer series will be required to determine when, and whether, convergence begins. Standardising effort across stations and retaining paired controls, as done here, remains the most effective safeguard against these constraints.
From a management perspective, the persistence of a distinct and impoverished assemblage two years after fire argues for protecting unburnt patches within and around burnt perimeters, since they act as refuges and as sources for recolonisation. Retaining deadwood and litter where safety permits, and avoiding salvage operations that remove the residual structural complexity of burnt stands, would be expected to accelerate the return of the specialised fauna.
5. Conclusions
In four Algerian cork oak forests, fire history was the dominant determinant of insect assemblage composition. Burnt and unburnt stands shared only a small fraction of their species, similarity between them declined rather than increased between the first and second post-fire year, and unburnt stands proved temporally stable while burnt stands turned over almost completely. Ordination, set-overlap and chord analyses converged on the same conclusion, and PERMANOVA attributed a significant quarter of the compositional variance to fire history. Two years is therefore too short a period for the entomofauna of cork oak forests to recover, and the conservation of unburnt refuges should be treated as a priority in post-fire management.
Supplementary Materials
The following supporting information can be downloaded at: Preprints.org, Figures S1-S4: site-level PCA for Djebel El Goufi, El Maktoua, Oued Agouf and Ain Fegoune; Table S1: full species x station abundance matrix.
Author Contributions
SL, a PhD student in agronomy, conducted the field sampling of arthropods, analysed the data, and drafted the manuscript. MF, a professor of agronomy, was responsible for data processing and manuscript revision, contributed to the identification of species. CG, a professor of agronomy, supervised the project and finalized the manuscript. All authors have read and approved the final version of the manuscript.
Funding
This research received no external funding.
Data Availability Statement
The species x station abundance matrices and the R scripts used to produce all analyses and figures are available from the corresponding author on reasonable request.
Conflicts of Interest
The authors declare no conflicts of interest.
Acknowledgments
The authors thank the Conservation des Forets for access to the study sites and for logistical support.
References
- Bugalho, M.N.; Caldeira, M.C.; Pereira, J.S.; Aronson, J.; Pausas, J.G. Mediterranean cork oak savannas require human use to sustain biodiversity and ecosystem services. Front. Ecol. Environ. 2011, 9, 278–286. [Google Scholar] [CrossRef]
- Aronson, J.; Pereira, J.S.; Pausas, J.G. (Eds.) Cork Oak Woodlands on the Edge; Island Press: Washington, DC, USA, 2009. [Google Scholar]
- Moreira, F.; Ascoli, D.; Safford, H.; et al. Wildfire management in Mediterranean-type regions. Environ. Res. Lett. 2020, 15, 011001. [Google Scholar] [CrossRef]
- Moretti, M.; Duelli, P.; Obrist, M.K. Biodiversity and resilience of arthropod communities after fire disturbance in temperate forests. Oecologia 2006, 149, 312–327. [Google Scholar] [CrossRef] [PubMed]
- Bouget, C.; Duelli, P. The effects of windthrow on forest insect communities: a literature review. Biol. Conserv. 2004, 118, 281–299. [Google Scholar] [CrossRef]
- Villemant, C.; Fraval, A. Les insectes ennemis du liège. [Insect enemies of cork]. In-sectes 2002, 25(125), 1–6. [Google Scholar]
- R Core Team. R: A Language and Environment for Statistical Computing; R Foundation for Statistical Computing: Vienna, Austria, 2025. [Google Scholar]
- Oksanen, J.; Simpson, G.L.; Blanchet, F.G.; et al. vegan: Community Ecology Package, R package version 2.6-4. 2024.
- Sorensen, T. A method of establishing groups of equal amplitude in plant sociology based on similarity of species content. Biol. Skr. 1948, 5, 1–34. [Google Scholar]
- Magurran, A.E. Measuring Biological Diversity; Blackwell Publishing: Oxford, UK, 2004. [Google Scholar]
- Legendre, P.; Gallagher, E.D. Ecologically meaningful transformations for ordination of species data. Oecologia 2001, 129, 271–280. [Google Scholar] [CrossRef] [PubMed]
- Anderson, M.J. A new method for non-parametric multivariate analysis of variance. Austral Ecol. 2001, 26, 32–46. [Google Scholar] [CrossRef]
- Conway, J.R.; Lex, A.; Gehlenborg, N. UpSetR: an R package for the visualization of intersecting sets and their properties. Bioinformatics 2017, 33, 2938–2940. [Google Scholar] [CrossRef] [PubMed]
- Gu, Z.; Gu, L.; Eils, R.; Schlesner, M.; Brors, B. circlize implements and enhances circular visualization in R. Bioinformatics 2014, 30, 2811–2812. [Google Scholar] [PubMed]
- Wickham, H. ggplot2: Elegant Graphics for Data Analysis; Springer: New York, NY, USA, 2016. [Google Scholar]
- Gongalsky, K.B.; Persson, T. Recovery of soil macrofauna after wildfires in boreal forests. Soil Biol. Biochem. 2013, 57, 182–191. [Google Scholar] [CrossRef]
Figure 1.
Location of the study sites in the Collo massif (Skikda). The sampled sites are marked with blue stars (LAOUIRA, 2025, modified).
Figure 1.
Location of the study sites in the Collo massif (Skikda). The sampled sites are marked with blue stars (LAOUIRA, 2025, modified).
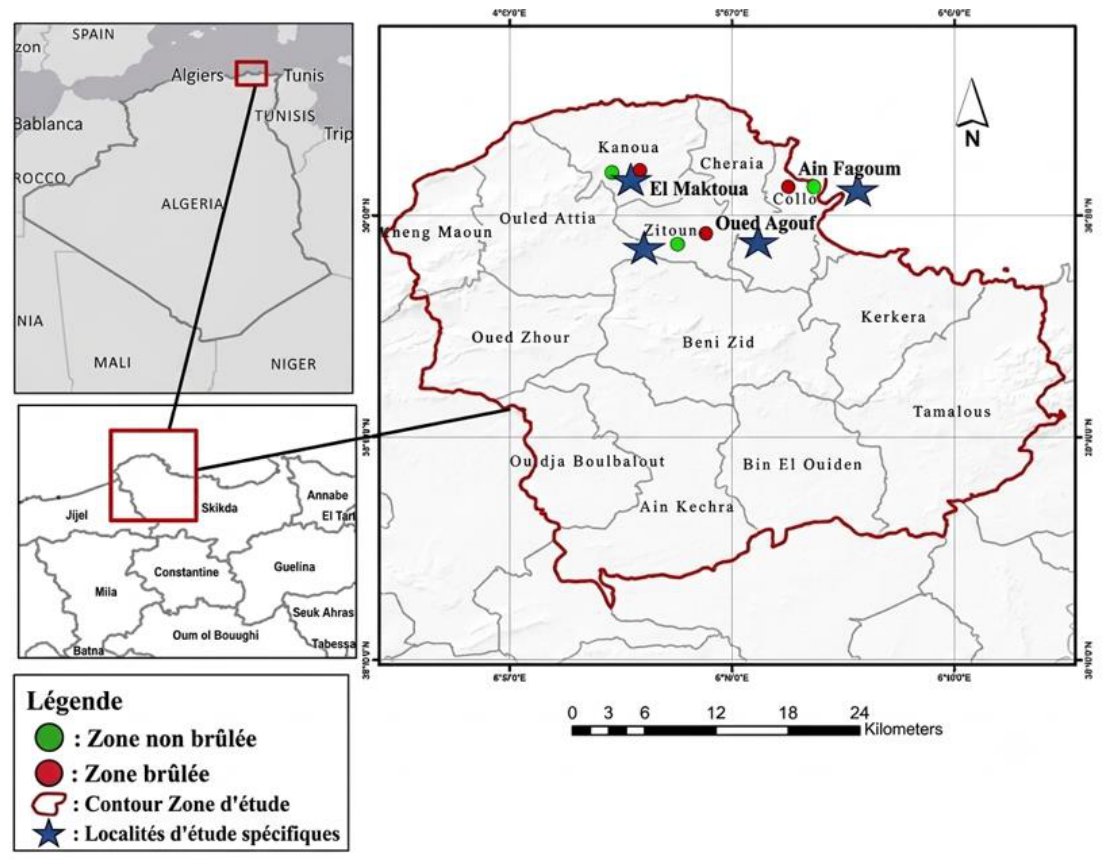
Figure 2.
Principal component analysis of insect assemblages (Hellinger-transformed abundances) in the eight stations during 2015 and 2016. Colour denotes fire history (orange, burnt; green, unburnt) and symbol shape denotes year.
Figure 2.
Principal component analysis of insect assemblages (Hellinger-transformed abundances) in the eight stations during 2015 and 2016. Colour denotes fire history (orange, burnt; green, unburnt) and symbol shape denotes year.
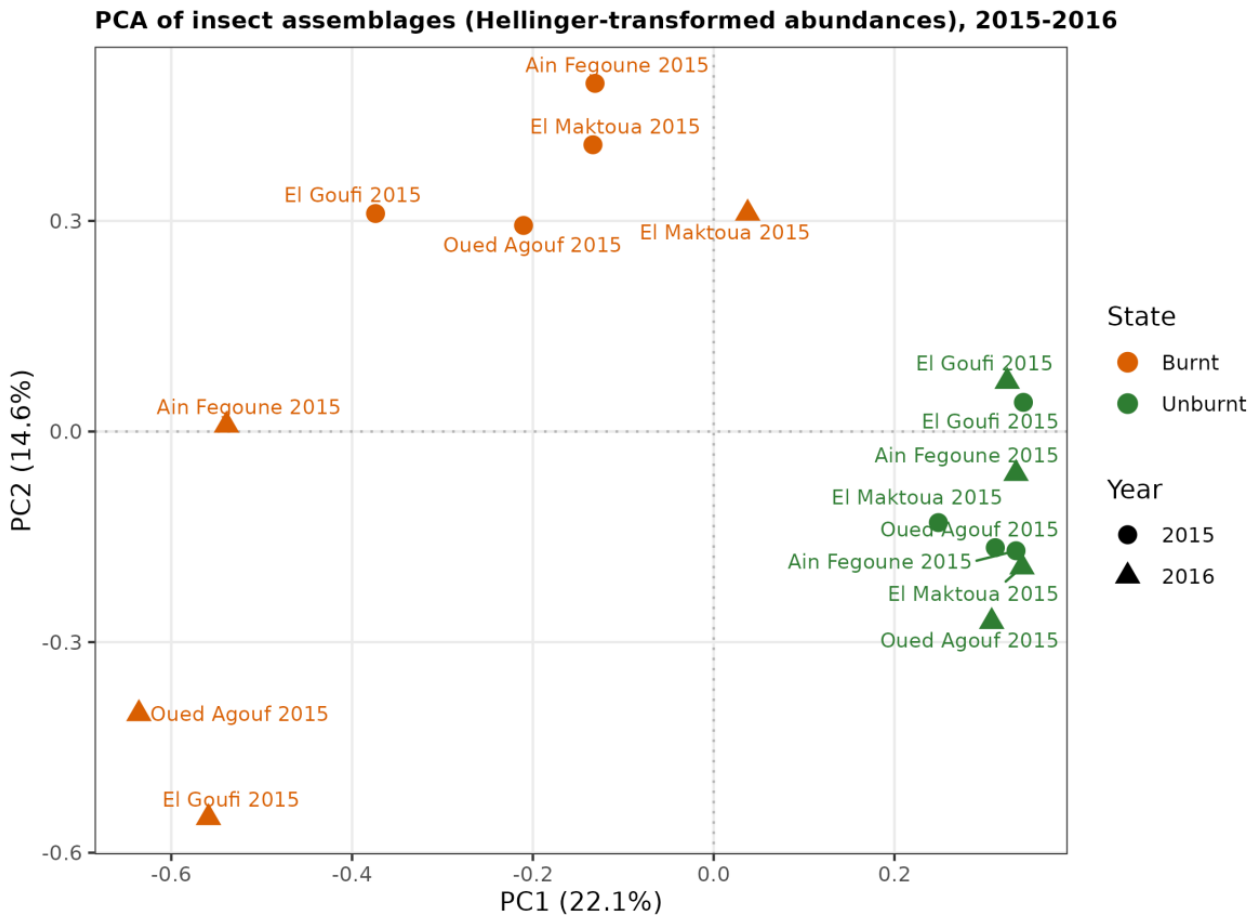
Figure 3.
Principal component analysis of insect assemblages in the four suberaies, computed separately for each year: (a) 2015; (b) 2016. Each panel contains the eight stations (four suberaies x two fire-history classes). Colour denotes fire history (orange, burnt; green, unburnt).
Figure 3.
Principal component analysis of insect assemblages in the four suberaies, computed separately for each year: (a) 2015; (b) 2016. Each panel contains the eight stations (four suberaies x two fire-history classes). Colour denotes fire history (orange, burnt; green, unburnt).
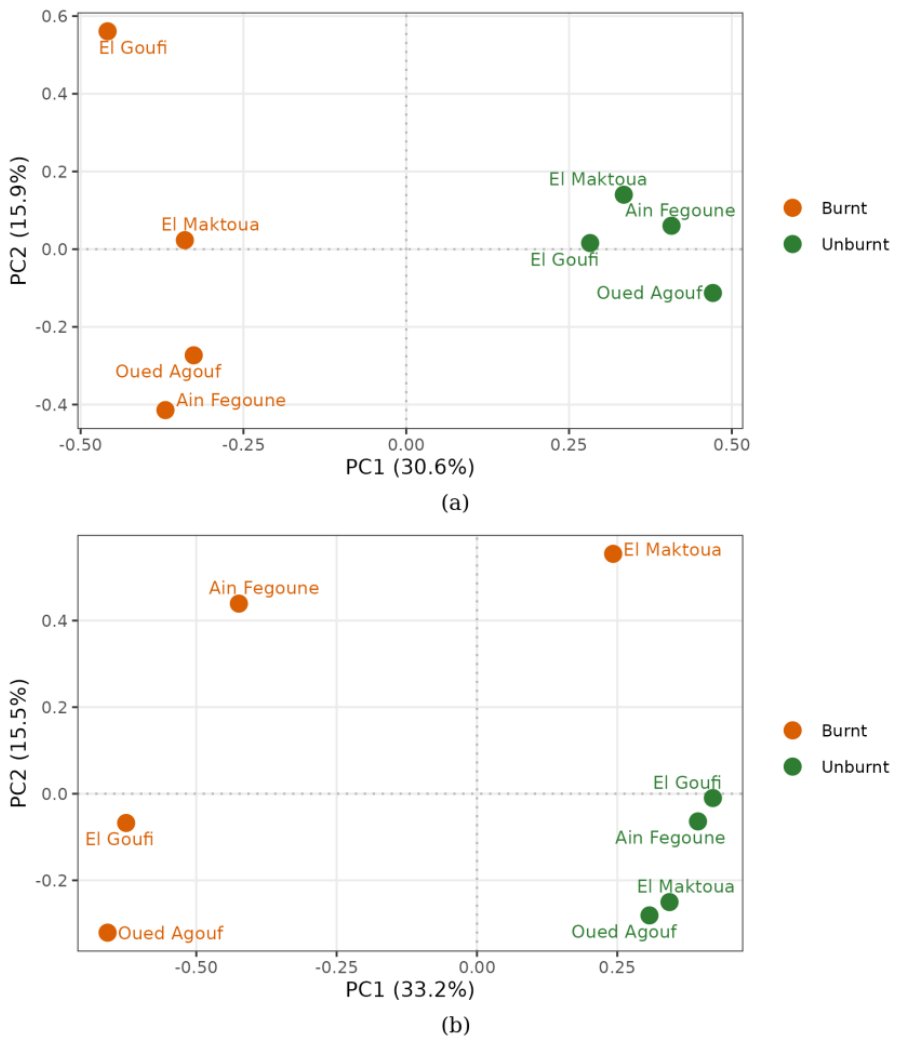
Figure 4.
UpSet plot of species sharing among the eight stations in 2015. Horizontal bars give the richness of each station (green, unburnt; orange, burnt); vertical bars give the size of each intersection, ordered by frequency.
Figure 4.
UpSet plot of species sharing among the eight stations in 2015. Horizontal bars give the richness of each station (green, unburnt; orange, burnt); vertical bars give the size of each intersection, ordered by frequency.
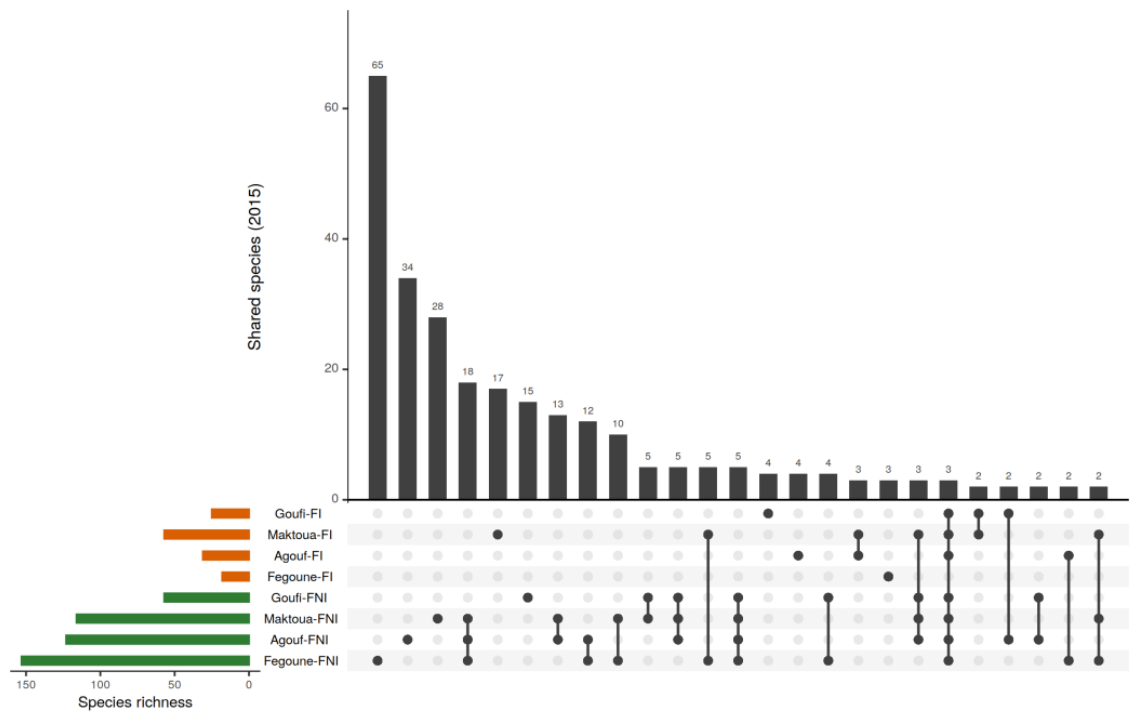
Figure 5.
UpSet plot of species sharing among the eight stations in 2016. Horizontal bars give the richness of each station (green, unburnt; orange, burnt); vertical bars give the size of each intersection, ordered by frequency.
Figure 5.
UpSet plot of species sharing among the eight stations in 2016. Horizontal bars give the richness of each station (green, unburnt; orange, burnt); vertical bars give the size of each intersection, ordered by frequency.
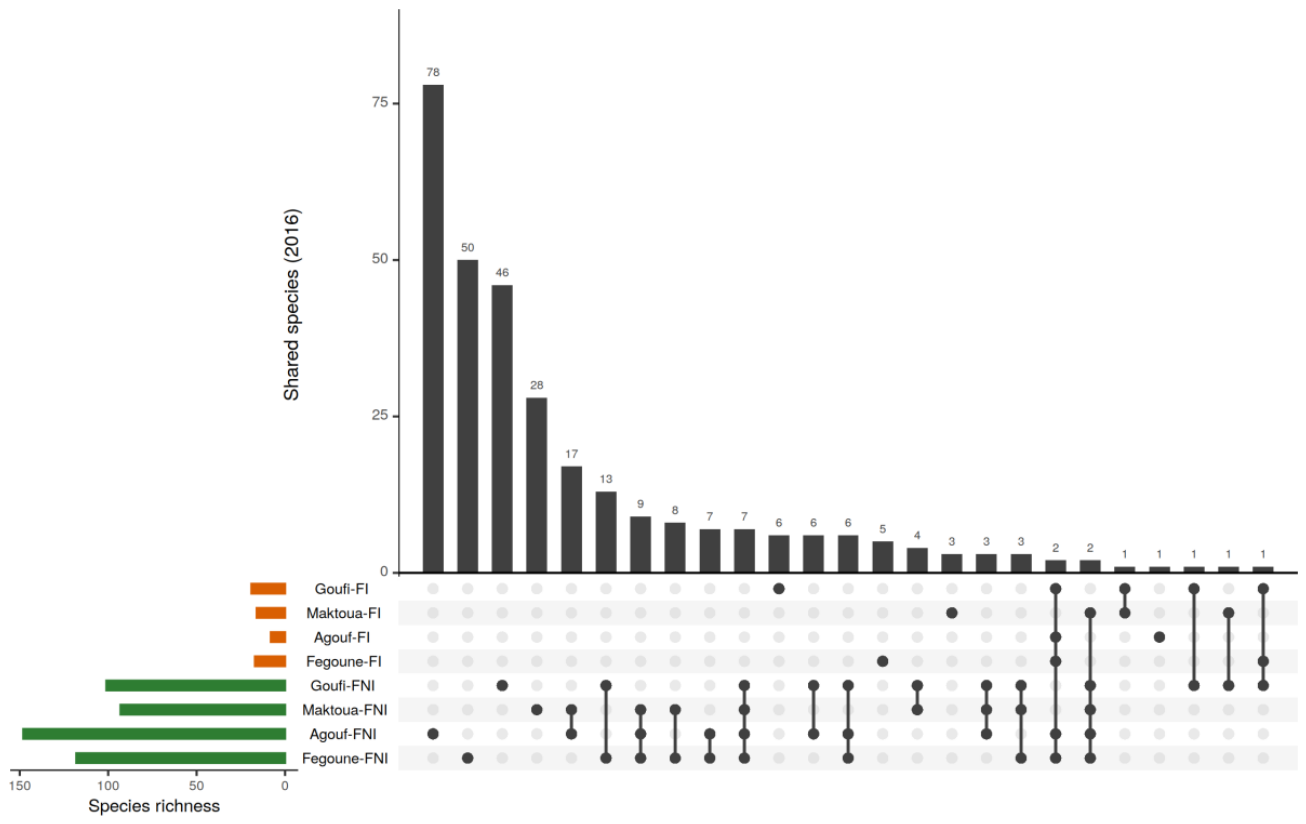
Figure 6.
Chord diagram of species shared among the eight stations in 2015. Ribbon width is proportional to the number of species common to a pair of stations; sector colour denotes fire history (green, unburnt; orange, burnt).
Figure 6.
Chord diagram of species shared among the eight stations in 2015. Ribbon width is proportional to the number of species common to a pair of stations; sector colour denotes fire history (green, unburnt; orange, burnt).
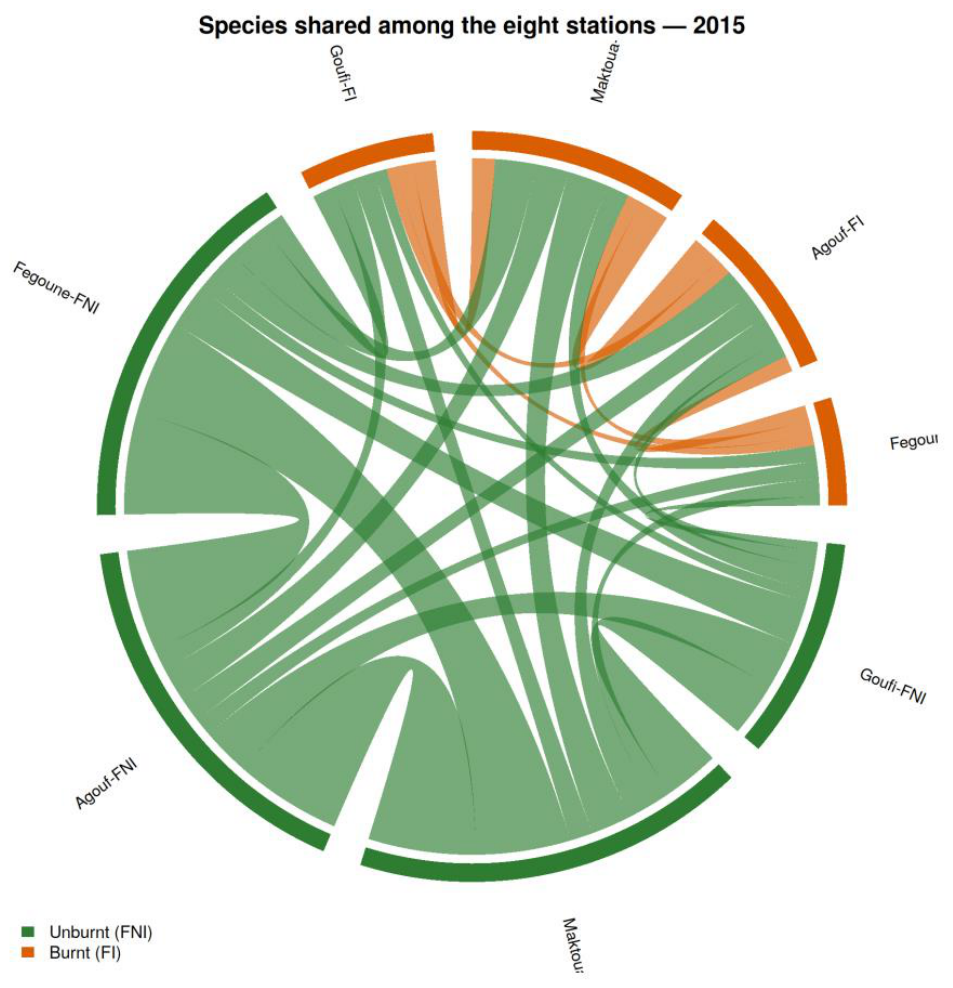
Figure 7.
Chord diagram of species shared among the eight stations in 2016. Ribbon width is proportional to the number of species common to a pair of stations; sector colour denotes fire history (green, unburnt; orange, burnt).
Figure 7.
Chord diagram of species shared among the eight stations in 2016. Ribbon width is proportional to the number of species common to a pair of stations; sector colour denotes fire history (green, unburnt; orange, burnt).
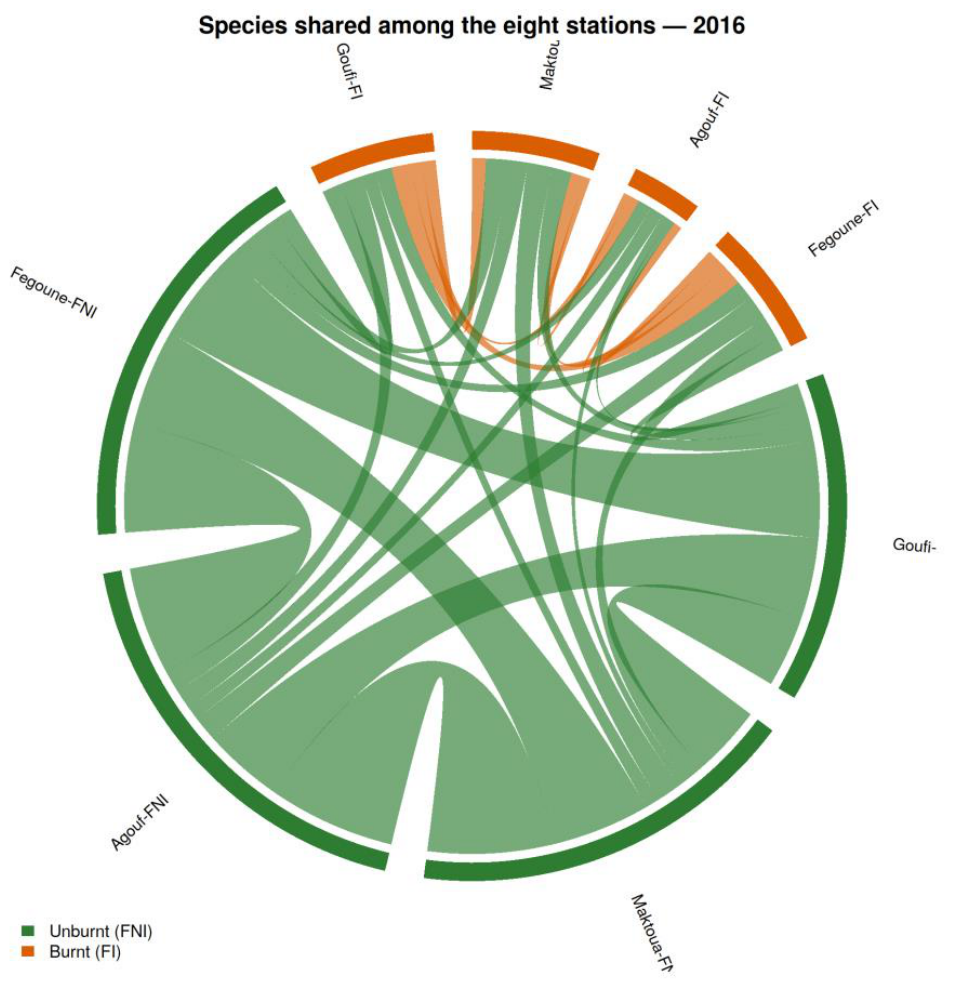

Table 1.
Total abundance (N), species richness (S), Shannon (H’), Simpson (1-D) and Pielou evenness (J’) for the eight stations in 2015 and 2016. FI = burnt, FNI = unburnt.
Table 1.
Total abundance (N), species richness (S), Shannon (H’), Simpson (1-D) and Pielou evenness (J’) for the eight stations in 2015 and 2016. FI = burnt, FNI = unburnt.
| Station | Year | N | S | H’ | 1-D | J’ |
|---|---|---|---|---|---|---|
| El Goufi FI | 2015 | 451 | 25 | 2.59 | 0.889 | 0.805 |
| El Maktoua FI | 2015 | 855 | 57 | 3.42 | 0.946 | 0.847 |
| Oued Agouf FI | 2015 | 462 | 31 | 3.02 | 0.932 | 0.880 |
| Ain Fegoune FI | 2015 | 396 | 18 | 2.64 | 0.919 | 0.915 |
| El Goufi FNI | 2015 | 468 | 57 | 3.11 | 0.898 | 0.770 |
| El Maktoua FNI | 2015 | 1424 | 116 | 4.23 | 0.978 | 0.889 |
| Oued Agouf FNI | 2015 | 1433 | 123 | 4.06 | 0.957 | 0.844 |
| Ain Fegoune FNI | 2015 | 2627 | 153 | 4.28 | 0.971 | 0.851 |
| El Goufi FI | 2016 | 41 | 19 | 2.58 | 0.892 | 0.878 |
| El Maktoua FI | 2016 | 132 | 16 | 1.94 | 0.790 | 0.701 |
| Oued Agouf FI | 2016 | 53 | 8 | 1.79 | 0.802 | 0.861 |
| Ain Fegoune FI | 2016 | 95 | 17 | 2.45 | 0.888 | 0.865 |
| El Goufi FNI | 2016 | 829 | 101 | 3.54 | 0.916 | 0.767 |
| El Maktoua FNI | 2016 | 810 | 93 | 3.55 | 0.924 | 0.784 |
| Oued Agouf FNI | 2016 | 1148 | 148 | 3.98 | 0.956 | 0.796 |
| Ain Fegoune FNI | 2016 | 1120 | 118 | 3.84 | 0.942 | 0.805 |
Table 2.
Sorensen similarity index Cs (%) for the five comparisons in the four suberaies. FI = burnt, FNI = unburnt.
Table 2.
Sorensen similarity index Cs (%) for the five comparisons in the four suberaies. FI = burnt, FNI = unburnt.
| Comparison | El Goufi | El Maktoua | Oued Agouf | Ain Fegoune | Mean |
|---|---|---|---|---|---|
| FI vs FNI, 2015 | 17.07 | 26.59 | 19.48 | 10.53 | 18.42 |
| FI vs FNI, 2016 | 10.00 | 16.51 | 6.41 | 10.37 | 10.82 |
| FI vs FNI, pooled | 16.77 | 28.57 | 19.49 | 16.11 | 20.24 |
| FNI 2015 vs FNI 2016 | 51.90 | 77.51 | 51.66 | 66.42 | 61.87 |
| FI 2015 vs FI 2016 | 27.27 | 13.70 | 20.51 | 28.57 | 22.51 |
Disclaimer/Publisher’s Note: The statements, opinions and data contained in all publications are solely those of the individual author(s) and contributor(s) and not of MDPI and/or the editor(s). MDPI and/or the editor(s) disclaim responsibility for any injury to people or property resulting from any ideas, methods, instructions or products referred to in the content. |
© 2026 by the authors. Licensee MDPI, Basel, Switzerland. This article is an open access article distributed under the terms and conditions of the Creative Commons Attribution (CC BY) license.
Copyright: This open access article is published under a Creative Commons CC BY 4.0 license, which permit the free download, distribution, and reuse, provided that the author and preprint are cited in any reuse.