

Submitted:
07 August 2026
Posted:
07 August 2026
You are already at the latest version
Abstract
Indirect dry cooling system (IDCS) serves as critical cooling equipment for power plants, whose cooling performance is strongly affected by ambient meteorological con-ditions. Thus, accurate cooling performance prediction is essential for the safe and ef-ficient operation of power plants. In this paper, a half-tower numerical model of the typical IDCS in a 2×660MW power plant is established due to geometric symmetry, and a multi-scale heat conservation model between the condenser and air-cooled heat exchanger is developed. Grid independence verification and validation under typical operating conditions prove that the model possesses satisfactory engineering accuracy for subsequent variable-condition simulations. Numerical results reveal that ambient wind enhances heat transfer of windward cooling sectors while degrading that of lat-eral cooling sectors. Higher ambient temperature also weakens the system’s cooling capacity and tower ventilation performance. Based on the numerical results, multiple regression prediction models are established using ambient temperature and wind speed as independent variables. With these models, the overall system performance, inlet airflow rate, inlet air temperature and sector heat transfer characteristics are predicted rapidly and accurately. Most of the models have a coefficient of determina-tion (R2) over 0.99 and low root mean square errors, demonstrating high prediction precision. The proposed models effectively improve the computational efficiency for off-design conditions. It provides reliable theoretical and data support for operational optimization, performance prediction and structural modification of IDCS in power plants.
Keywords:
indirect dry cooling system
; air-cooled heat exchanger
; cooling performance prediction
; heat and mass transfer
; environmental meteorological conditions
; numerical simulation
1. Introduction
Dry cooling systems in power plant can be classified into direct dry cooling systems and indirect dry cooling systems according to the cooling method used for turbine exhaust steam. Among them, indirect dry cooling systems are widely applied in the northwestern region of China because of their excellent water-saving performance and high operational efficiency [1]. However, indirect dry cooling systems are sensitive to environmental meteorological conditions, and limitations in operational control often prevent the systems from fully utilizing their cooling capacity, thereby adversely affecting both the operational safety and thermal efficiency of power units.
Scholars both domestically and internationally have conducted extensive studies on the adverse effects of environmental meteorological conditions on indirect dry cooling systems. Jiang et al. [2] reported that, under crosswind conditions, increasing ambient wind speed around naturally ventilated dry cooling towers not only reduces the overall heat transfer capacity of the system but also prolongs the response time of the tower owing to enhanced turbulence and vortex formation inside the tower. Wang Weiliang et al. [3] summarized the mechanisms by which environmental crosswinds deteriorate the heat transfer performance of indirect air-cooling towers, including the non-uniform distribution of inlet airflow, plume deviation at the tower outlet, and reverse airflow near the tower edges. These factors increase the overall inlet air resistance of the tower, reduce the airflow rate, and consequently increase the coal consumption of the power unit. Experimental results obtained by Chen Tiefeng et al. [4] demonstrated that the airflow and wall temperature distributions in the cooling triangular cells on both the windward and leeward sides are significantly non-uniform. Ma et al. [5] investigated the influence of environmental meteorological conditions on the heat transfer performance of a “two-unit-one-tower” indirect dry cooling system, and the results showed that increasing wind speed significantly aggravates the non-uniform distribution of heat exchanger performance. Based on field measurement data collected from power plants, Zhai Yingjun et al. [6] concluded that ambient temperature variation has a significant effect on the return water temperature of indirect dry cooling systems; although the overall trends are generally consistent, a certain time lag exists between them. Jahangiri et al. [7] analyzed the operational data of air-cooling towers under different ambient wind speeds and temperatures and concluded that increases in both ambient wind speed and ambient temperature reduce the heat transfer performance of air-cooling towers.
To predict and mitigate the adverse effects of environmental meteorological conditions on indirect dry cooling systems, numerous researchers have developed many advanced algorithms and predictive models. Wang Shenghu et al. [8] employed a cold-end mathematical model to analyze the relationship between pump combination modes and the operating frequency of variable-frequency pumps under different circulating water inlet temperatures and unit loads, and integrated the results into the DCS system to achieve closed-loop optimization control of circulating water flow. Yan Mingwen et al. [9] proposed an optimization strategy combining electrically driven trailing curtains with precise circulating water temperature control, which effectively accommodated deep load regulation and reduced system energy consumption. Liu Xueliang [10] proposed an operational optimization method for indirect dry cooling systems based on the economic benefits of coal-fired power generation. Zhang et al. [11] applied a GA-BP neural network method to analyze the heat transfer performance of indirect air-cooling towers and conducted optimization calculations under operating conditions with varying output power and ambient temperature at fixed backpressure. Liu Bo [12] developed an algorithm based on the Monte Carlo method combined with composite confidence intervals to analyze variations in system performance. Dong Zijian et al. [13] established both a transfer function model and an ambient wind speed disturbance model for indirect dry cooling systems and performed optimization using the DE-VPPSO algorithm. The results demonstrated that the proposed method possesses excellent control performance and robustness. Wei et al. [14] introduced a combustion heat balance equation to alleviate the adverse effects of ambient wind by optimizing the distribution of circulating water flow among heat exchangers, thereby improving the heat transfer performance of the cooling tower. Ma Huan et al. [15] developed a coupled numerical simulation model for a 600 MW indirect air-cooled unit and established a rapid backpressure calculation model based on LSSVM to provide operational guidance under variable operating conditions. Wang Weijia et al. [16] established a freeze protection prediction model for the tube bundles of indirect air-cooled heat exchangers, revealing the freezing characteristics and critical freeze protection modes under different air-water flow patterns, thereby providing theoretical support for winter freeze protection operation in indirect dry cooling systems.
In summary, existing studies on the optimization of indirect dry cooling systems have primarily focused on local control strategies or performance prediction under specific operating conditions. However, systematic investigations into the overall flow heat transfer characteristics of high-power units under complex environmental meteorological conditions remain insufficient.
This study focuses on the indirect dry cooling system of a 2 × 660 MW thermal power unit and conducts numerical simulation under variable operating conditions with different ambient temperatures and wind speeds. A qualitative analysis of the flow heat transfer characteristics of the indirect dry cooling system is performed from both system-wide and sector-specific perspectives, while a quantitative analysis of the thermodynamic performance parameters of the system is also conducted. Based on a large amount of numerical simulation data, a simplified model for predicting the performance of the indirect dry cooling system is established, and the predictive accuracy of the simplified model is evaluated using validation datasets. The research results provide a theoretical reference for the optimized operation of indirect dry cooling system.
2. Materials and Methods
2.1. Physical Model of the Indirect dry cooling system
The indirect dry cooling system was shared by two power generating units. The structure and geometric model of the indirect dry cooling system are illustrated in Figure 1. Owing to the structural and flow-field symmetry, a half-tower numerical model is developed to boost simulation efficiency.
The air-cooled heat exchanger consists of 214 cooling deltas vertically arranged along the outer circumference of the tower inlet. According to the layout of the circulating water piping system, the cooling triangles distributed around the entire tower are divided into 14 sectors, with each power unit occupying 7 sectors and the sectors of the two units arranged alternately. The sector distribution is illustrated in Figure 2, where #1-1-a and #2-4-a represent one-half of sectors #1-1 and #2-4, respectively, in the half-tower numerical simulation model. The main structural characteristics and parameters of the indirect dry cooling system are presented in Table 1.
2.2. Mathematical Model of the Indirect dry Cooling System
In indirect dry cooling systems, the internal flow heat transfer process involves multiscale transport phenomena. During actual operation, the process primarily includes two stages of surface heat exchange among three working fluids: turbine exhaust steam, circulating water, and cooling air.
The first stage of surface heat exchange occurs in the condenser, where circulating water is used to cool the turbine exhaust steam. The heat balance equations are presented in Equations (1)–(3) [17,18]:
In the equations:Qs represents the heat released by the turbine exhaust steam, W; Q’represents the heat transfer rate of the condenser, W; Qw’ represents the heat absorbed by the circulating water, W; ms represents the turbine exhaust steam flow rate, kg/s; hs represents the steam enthalpy, J/kg; hw represents the condensate enthalpy, J/kg; K’ represents the heat transfer coefficient of the condenser, W/(m2·K); A’ represents the heat transfer area of the condenser, m2; ts represents the steam condensation temperature, K; twin’ and twout’ represent the inlet and outlet water temperatures of the condenser, respectively, K; cpw represents the specific heat capacity of circulating water at constant pressure, J/(kgK); mw represents the circulating water flow rate, kg/s.
The second stage of surface heat transfer occurs in the air-cooled heat exchanger, where circulating water is cooled by ambient air. The heat balance equations are presented in Equations (4)–(6):
In the equations, Q represents the heat exchange rate of the indirect dry cooling system, W; Qw represents the heat released by the circulating water, W; Qa represents the heat absorbed by ambient air, W; K represents the heat transfer coefficient of the radiator, W/(m2·K); A represents the heat exchange area of the radiator,m2; ψ represents a correction factor smaller than 1; twin and twout represent the inlet and outlet water temperatures of the radiator, respectively, and their values are equal to twin’ and twout’, K; ma represents the mass flow rate of cooling air, kg/s; cpa represents the specific heat capacity of cooling air at constant pressure, J/(kg·K); tain and taout represent the inlet and outlet air temperatures, respectively, K.
Assuming that no heat loss occurs in the circulating water between the condenser and the air-cooled heat exchanger, the heat load remains constant during the two stages of surface heat exchange; that is, it satisfies Equation (7):
To improve the computational efficiency of numerical simulation for multiscale transport processes in indirect dry cooling systems, the following assumptions are adopted in the model:
- The flow heat transfer process in the numerical simulation is assumed to be steady-state;
- Air is assumed to be an ideal incompressible gas, and adiabatic no-slip boundary conditions are applied to the walls in contact with the fluid;
- The thermal resistance of the finned tube bundle walls and radiative heat transfer between all surfaces are neglected;
- The X-column and auxiliary equipment inside the cooling tower are simplified because their influence on the numerical simulation results is negligible.
The following governing equations [19,20] are used to describe the air-side transport processes in the naturally ventilated indirect dry cooling system. To close the governing equation system and accurately predict vortex generation, boundary layer separation, and vortex shedding during turbulent flow, the two-equation Realizable k–ε turbulence model is adopted in this numerical simulation. The variables and corresponding expressions in the governing equations are listed in Table 2.
In the equations, ρ represents the air density, m3/s; uj represents the velocity component in the xj direction, m/s; φ represents a general variable; Sφ and Γφ represent the source term and diffusion term, respectively.
In the numerical simulation, a pressure-based solver was employed, and the governing equations were solved using the SIMPLE algorithm for pressure–velocity coupling. A second-order upwind scheme was adopted for the spatial discretization of all physical quantities. The convergence criterion for the residuals of the energy equation was set to 10−8, whereas that for the remaining governing equations was set to 10−6. During the iterative calculation process, the residuals of each governing equation, together with the mass flow rate and air temperature at the outlet of the air-cooled tower, were monitored in real time to comprehensively evaluate the convergence of the numerical simulation results and maintain the computational error within an acceptable range. In the numerical simulation, a porous media model was introduced to simulate the indirect air-cooled heat exchanger. The finned tube bundle was simplified as a plane with negligible thickness, and the plane was defined as a Radiator boundary condition [21]. By specifying the drag coefficient and heat transfer coefficient, the flow heat transfer process of air passing through the air-cooled heat exchanger was simulated. The relationship between the pressure drop Δp across the heat exchanger and the air velocity is presented in Equation (9):
In this equation, v represents the upstream airflow velocity, m/s; kL represents the pressure loss coefficient of air flowing through the heat sink, and its expression is presented in Equation (10):
kn are the empirical coefficients of the resistance polynomial.
In the air-cooled heat exchanger, the heat transfer rate q between circulating water and air can be expressed by Equation (11):
In this equation, Tref represents the reference temperature of the heat exchanger model, which is equal to the arithmetic mean of the inlet and outlet water temperatures of the air-cooled heat exchanger, K; Ta,d represents the ambient air temperature near the heat exchanger, K; h represents the overall heat transfer coefficient of the indirect air-cooled heat exchanger, W/(m2·K), as presented in Equation (12):
hn are the empirical coefficients of the heat transfer polynomial.
2.3. Mesh Generation and Boundary Conditions
Figure 3 illustrate the mesh distribution of the numerical simulation model. To obtain high-quality mesh quality, a block-based mesh generation method is adopted in this study [22]. In the core region of the air-cooled heat exchanger, a locally refined hexahedral structured mesh is employed, and the mesh size gradually transitions in layers from this region toward the inner and outer regions. A hybrid mesh consisting of structured and unstructured elements is used in the peripheral regions of the cooling tower, whereas a relatively coarse structured mesh is applied in the external region far from the tower.
Figure 4 illustrates the computational domain and boundary conditions of the numerical simulation model for the indirect dry cooling system. Under all operating conditions, the bottom surface of the computational domain is defined as a wall boundary condition, and the symmetry plane of the tower is defined as a symmetric boundary condition. Under windless conditions, the four side surfaces of the computational domain are defined as pressure inlet boundary conditions, whereas the top surface is defined as a pressure outlet boundary condition. Under environmental meteorological conditions with ambient wind, the windward side is defined as a velocity inlet boundary condition, and the transverse wind speed is determined by Equation (13); the leeward side is defined as a pressure outlet boundary condition; and the top surface is defined as a symmetric boundary condition.
In the equation, uz represents the horizontal wind speed, m/s; u10 represents the wind speed at a height of 10 m above the ground, m/s; e represents the wind speed profile index, which is generally taken as 0.2.
2.4. Model Validation
To verify the accuracy of the numerical simulation results, the heat transfer rate and air intake volume of the indirect dry cooling system were evaluated under two typical operating conditions: turbine maximum continuous rating (TMCR) and turbine rated load (TRL).
Under TMCR operating conditions, the numerical simulation results for the heat transfer rate and air flow rate were 1531.90 MW and 70124.28 m3/s, respectively, with relative errors of 0.99% and 1.75% compared with the design values. Under TRL operating conditions, the numerical simulation results for the heat transfer rate and air flow rate were 1602.06 MW and 71422.51 m3/s, respectively, with relative errors of −0.09% and −0.04% compared with the design values. Based on the validation results, it can be concluded that the numerical simulation model of the indirect dry cooling system provides satisfactory accuracy and can be used for variable-condition calculations of the flow heat transfer performance of indirect air-cooling towers.
During the mesh independence verification phase, three scenarios were generated by adjusting the mesh size, with a total of 5,632,590, 6,433,092, and 7,268,482 cells, respectively. Comparison results show that the relative deviations in heat transfer and ventilation rates for these three schemes were all within 0.5%, indicating that the effect of the number of grid cells on heat transfer and ventilation rates is negligible. After comprehensively considering computational accuracy and speed, this study ultimately adopted the grid scheme with a total of 6,433,092 cells.
2.5. Computational Logic
There is a coupled relationship among the steam turbine, condenser, and indirect air-cooled heat exchanger. Variations in environmental meteorological conditions can change the heat transfer performance of the indirect air-cooled heat exchanger, thereby disturbing the heat transfer balance of the condenser and further affecting the exhaust backpressure of the steam turbine. Therefore, coupled calculations of the system are required during variable-condition calculations. Figure 5 illustrates the construction process of the theoretical model for variable-condition calculations and performance prediction of the indirect dry cooling system. The specific procedures are as follows:
- The unit load and total circulating water flow rate are specified, and the circulating water flow rate distribution is determined using a uniform distribution scheme. Under the initial assumption of steam turbine backpressure, the condenser outlet water temperature and theoretical total heat transfer rate are calculated using the heat balance equation.
- Based on the initial estimated outlet water temperature of each sector, the reference temperature and theoretical heat transfer rate of each sector are calculated.
- A numerical simulation model of the indirect dry cooling system is established in Fluent. The ambient temperature, ambient wind speed, and reference temperature of each sector are specified, and numerical simulation is performed to obtain the air-side flow rate and inlet/outlet air temperatures of each sector. Based on the heat balance equations, the heat transfer rates of each sector and the overall system are then calculated.
- The calculated heat transfer rate of each sector is compared with the corresponding theoretical heat transfer rate. If the relative error of each sector is less than 0.5%, the calculation proceeds to step 5; otherwise, the outlet water temperature of each sector is updated, and the iterative calculation returns to step 2.
- The calculated total heat transfer rate is compared with the theoretical total heat transfer rate. If the relative error is less than 0.5%, the calculation is terminated, and the steam turbine backpressure, total heat transfer rate, and performance parameters of each sector, including airflow, inlet air temperature, and heat transfer rate, are obtained under the corresponding ambient temperature and ambient wind speed conditions. Otherwise, the steam turbine backpressure is updated, and the iterative calculation returns to step 1.
- Using the fitting tools in MATLAB to process the numerical simulation data, formulas for the total heat transfer rate, airflow rate, inlet air temperature, and heat transfer rate of the indirect dry cooling system were established as functions of ambient temperature and ambient wind speed, thereby constructing a simplified model for predicting the performance of the indirect dry cooling system.
3. Results
3.1. Overall and Sector-Specific Performance Analysis of the Indirect Dry Cooling System
3.1.1. Overall Performance Analysis of the Indirect Dry Cooling System
Figure 6 illustrates the variations in steam turbine backpressure and total heat transfer rate of the indirect dry cooling system with ambient wind speed and ambient temperature. The total heat transfer rate exhibits an approximately linear inverse relationship with ambient temperature, whereas it shows a nonlinear quadratic polynomial relationship with ambient wind speed. Based on the prediction of the total heat transfer rate, the exhaust backpressure of the steam turbine can be further determined.
At a constant ambient temperature, the total heat transfer rate of the indirect dry cooling system gradually decreases with increasing ambient wind speed, while the steam turbine backpressure correspondingly increases. Taking an ambient temperature of 34 °C as an example, under windless conditions, the heat transfer rate is uniformly distributed among all sectors, and the air-cooled heat exchanger exhibits optimal heat transfer performance, with a total heat transfer rate of 1605.08 MW and a steam turbine backpressure of 28.05 kPa. When the ambient wind speed increases to 4 m/s, the total heat transfer rate and steam turbine backpressure become 1602.05 MW and 30.10 kPa, respectively. As the ambient wind speed further increases to 10 m/s, the total heat transfer rate decreases to 1592.37 MW, whereas the steam turbine backpressure increases to 40.65 kPa. These results indicate that ambient wind weakens the heat transfer performance of the air-cooled heat exchanger, and the reduction in total heat transfer rate becomes more pronounced with increasing ambient wind speed, leading to a corresponding increase in steam turbine backpressure.
Under constant ambient wind speed conditions, an increase in ambient temperature also reduces the total heat transfer rate and increases the steam turbine backpressure, and its influence is more significant than that of ambient wind speed. Taking an ambient wind speed of 4 m/s as an example, when the ambient temperature is 5 °C, the total heat transfer rate and steam turbine backpressure are 1653.67 MW and 6.98 kPa, respectively. When the ambient temperature increases to 25 °C, the total heat transfer rate decreases to 1618.95 MW, whereas the steam turbine backpressure increases to 19.80 kPa. An increase in ambient temperature directly increases the inlet air temperature, weakens the cooling capacity of air, reduces the heat transfer temperature difference across the air-cooled heat exchanger, increases the outlet water temperature of circulating water, and disturbs the heat transfer balance of the condenser, thereby resulting in an increase in steam turbine backpressure.
3.1.2. Sector-Specific Performance Analysis of the Indirect Dry Cooling System
Under windless conditions, the flow and temperature fields inside and outside the indirect air-cooling tower exhibit central symmetry, and the heat transfer performance is uniformly distributed among all sectors. Therefore, sector-specific characteristic analysis and optimization of the circulating water flow rate are not required. In this study, sectors #1-1, #1-2, #2-3, and #2-4 are selected as representative sectors for analysis.
- Analysis of Airflow Characteristics at the Fan Inlet
Figure 7 illustrates the variation in airflow rate at the inlet of each sector. As shown in the figure, the airflow rate in each sector exhibits an approximately linear relationship with ambient temperature, whereas it shows a nonlinear polynomial relationship with ambient wind speed
At a constant ambient temperature, as ambient wind speed increases, the airflow rate in Sector #1-1 continuously increases, and the rate of increase becomes more pronounced at higher wind speeds. The airflow rates in Sectors #1-2 and #2-3 gradually decrease, with Sector #1-2 exhibiting a relatively smaller variation, while the airflow rate in Sector #2-4 increases slowly. For example, at an ambient temperature of 5 °C and a wind speed of 4 m/s, the airflow rates in Sectors #1-1, #1-2, #2-3, and #2-4 are 7787.26 kg/s, 6851.07 kg/s, 6077.02 kg/s, and 6902.87 kg/s, respectively. When the wind speed increases to 10 m/s, the corresponding changes in airflow rate for these four sectors are 2935.51 kg/s, −499.58 kg/s, −3361.17 kg/s, and 961.16 kg/s, respectively, compared with the condition at 4 m/s.
Under constant ambient wind speed conditions, the airflow rates in each sector exhibit a consistent trend with changes in ambient temperature, decreasing as ambient temperature increases. At a wind speed of 4 m/s and an ambient temperature of 15 °C, the airflow rates in the four sectors are 7482.47 kg/s, 6581.35 kg/s, 5844.31 kg/s, and 6599.86 kg/s, respectively. When the ambient temperature increases to 34 °C, the corresponding changes in airflow rate in each sector are −517.61 kg/s, −478.75 kg/s, −446.09 kg/s, and −408.66 kg/s, respectively, relative to the values at 15 °C. These results indicate that the influence of ambient temperature on airflow rate is significantly weaker than that of ambient wind speed.
- 2.
- Analysis of Air Temperature Characteristics at the Sector Inlet
After absorbing heat as it flows through the indirect dry cooling system heat exchanger, air is discharged into the atmosphere from the top of the cooling tower under the suction force of the cooling tower. However, under strong crosswind disturbances, a wake recirculation zone forms on the leeward side of the tower, causing part of the hot air to be recirculated toward the heat exchanger inlet on the leeward side or crosswind side. In addition, under medium- to high-wind-speed conditions, localized hot air recirculation occurs within the cooling triangles of certain sectors. Due to these effects, the actual inlet air temperature in each sector is generally higher than the ambient temperature. To evaluate heat transfer performance more accurately, this study introduces the inlet air temperature deviation (defined as the difference between the actual inlet air temperature and the ambient temperature) as an analytical metric.
Figure 8 illustrates the variation in inlet air temperature deviation for each sector. As shown in the figure, the temperature deviation in each sector exhibits an approximately linear positive correlation with ambient temperature, whereas it follows a nonlinear polynomial relationship with ambient wind speed.
At a constant ambient temperature, the inlet air temperature deviation in each sector increases with rising wind speed. In terms of both magnitude and rate of increase, Sector #1-1 exhibits the smallest values, followed by Sectors #1-2 and #2-4, while Sector #2-3 shows the largest values. Taking an ambient temperature of 34 °C as an example, when the wind speed increases from 2 m/s to 10 m/s, the maximum deviation in Sector #1-1 is only 0.0090 °C, with an increase of 0.0085 °C, indicating that it is almost unaffected by hot air recirculation. The maximum deviation values in Sectors #1-2 and #2-4 are 1.7160 °C and 1.0135 °C, respectively, with corresponding increases of 1.6696 °C and 0.8215 °C. Meanwhile, Sector #2-3, which is most strongly affected, exhibits a maximum deviation of 5.2468 °C and an increase of 5.0968 °C.
Under constant ambient wind speed conditions, the inlet air temperature deviation in each sector increases with rising ambient temperature. A comparative analysis shows that the influence of ambient temperature on the deviation is significantly weaker than that of ambient wind speed. Taking Sector #2–3, which is most sensitive to environmental meteorological conditions, as an example: at an ambient wind speed of 10 m/s, when the ambient temperature increases from 5 °C to 34 °C, the change in inlet air temperature deviation is only 0.6966 °C, which is far smaller than the variation caused by changes in ambient wind speed under the same ambient temperature condition.
- 3.
- Analysis of Heat Transfer Characteristics in the Sector
Since the total heat transfer rate of an indirect dry cooling system is significantly influenced by ambient wind speed and ambient temperature, direct comparison of heat transfer rates among different sectors under varying operating conditions may lead to inaccurate conclusions. Therefore, this paper introduces the sectoral heat transfer ratio (defined as the ratio of each sector’s heat transfer rate to the total heat transfer rate) as an analytical metric to more accurately characterize heat transfer patterns in each sector.
Figure 9 illustrates the variation in the proportion of heat transfer for each sector. As shown in the figure, the sectoral heat transfer ratio is largely insensitive to ambient temperature; its variation is primarily governed by ambient wind speed and exhibits a nonlinear polynomial relationship with wind speed.
At a constant ambient temperature, as ambient wind speed increases, the heat transfer proportion in Sector #1-1 continues to rise, while that in Sector #2-3 gradually decreases. The heat transfer proportions in Sectors #1-2 and #2-4 also gradually increase, with relatively moderate rates of increase. At an ambient temperature of 34 °C and a wind speed of 4 m/s, the heat transfer proportions in Sectors #1-1, #1-2, #2-3, and #2-4 are 8.50%, 7.37%, 6.68%, and 7.76%, respectively. When the wind speed increases to 10 m/s, the corresponding values become 12.97%, 8.52%, 4.25%, and 10.25%, respectively.
Under constant ambient wind speed conditions, variations in ambient temperature do not result in significant changes in the heat transfer proportion among different sectors. This indicates that, although increasing ambient temperature reduces the overall heat transfer performance of the indirect dry cooling system, this degradation is uniformly distributed across the tower, leaving the relative heat transfer proportions among sectors essentially unchanged.
3.2. Development and Validation of a Theoretical Model for Predicting the Performance of the Indirect Dry Cooling System
To develop a simplified model for predicting the performance of an indirect dry cooling system, cross-condition numerical simulations were conducted for six ambient wind speeds (0, 2, 4, 6, 8, and 10 m/s) under different ambient temperatures. Four sets of results corresponding to ambient temperatures of 5 °C, 15 °C, 25 °C, and 34 °C were selected to construct a fitting dataset. Using the Curve Fitting Toolbox in MATLAB, polynomial models were applied to perform regression analysis of the thermodynamic parameters based on multiple regression methods.
For model reliability evaluation, the coefficient of determination (R2) and root mean square error (RMSE) were used as quantitative indicators of fitting accuracy, and the Bayesian Information Criterion (BIC) was introduced to assess the risk of overfitting. Based on the established fitting model, predictions were performed, and results corresponding to ambient temperatures of 10 °C, 20 °C, and 30 °C were calculated as a validation dataset to verify the predictive accuracy of the constructed polynomial model.
3.2.1. Development and Validation of the Overall Heat Transfer Model
Based on the preceding analysis, the total heat transfer rate of the indirect dry cooling system exhibits an approximately linear inverse relationship with ambient temperature and a nonlinear relationship with ambient wind speed. The mathematical relationship between the total heat transfer rate and ambient temperature and ambient wind speed is expressed in Equation (14):
In the equation, Q represents the total heat transfer rate of the indirect dry cooling system, MW; aij denotes the fitting coefficients, with values provided in Table 5; T represents the ambient temperature, °C; v represents the ambient wind speed, m/s。
Table 6 and Figure 10 present the comprehensive evaluation metrics of the model and the residual distributions for the training and validation datasets, respectively. The results show that the coefficient of determination (R2) of the model is 0.9985. The maximum absolute residual of the training set is 1.62 MW, corresponding to a root mean square error (RMSE) of 0.8466 MW, while the maximum absolute residual of the validation set is 1.83 MW, corresponding to an RMSE of 0.9725 MW. Compared with the total heat transfer rate of the indirect dry cooling system, the residual variations are very small, indicating that the established total heat transfer rate fitting model exhibits high fitting accuracy.
3.2.2. Model Development and Validation of Sector Performance Parameters in the Indirect dry cooling system
- Airflow at the sector inlet
Given that the air inlet flow rate in each sector exhibits an approximately linear relationship with ambient temperature and a nonlinear polynomial relationship with ambient wind speed, the mathematical relationship between the air inlet flow rate and ambient temperature and ambient wind speed is expressed in Equation (15):
In the equation,Ma#m-n represents the air inlet flow rate of sector #m-n,kg/s; bij denotes the fitting coefficients, with specific values provided in Table 7.
Table 8 and Figure 11 present the comprehensive evaluation metrics of the model and the residual distributions for the training and validation datasets, respectively. The results indicate that the prediction errors for all sectors remain at a low level during both the training and validation phases. For Sector #1-1, the maximum absolute residuals in the training and validation datasets are 62.57 kg/s and 46.81 kg/s, respectively, with root mean square errors (RMSEs) of 41.2266 kg/s and 19.9308 kg/s. For Sector #1-2, the maximum absolute residuals are 25.32 kg/s and 37.56 kg/s, respectively, with RMSEs of 17.3423 kg/s and 13.2153 kg/s. For Sector #2-3, the maximum absolute residuals are 28.41 kg/s and 31.82 kg/s, respectively, with RMSEs of 22.4918 kg/s and 18.1722 kg/s. For Sector #2-4, the maximum absolute residuals are 73.59 kg/s and 63.15 kg/s, respectively, with RMSEs of 34.1981 kg/s and 29.4176 kg/s. Overall, the coefficient of determination (R2) of the fitting models for each sector exceeds 0.99. In summary, the model exhibits high fitting accuracy and can meet the requirements for subsequent calculations related to the optimized allocation of circulating water flow.
- 2.
- Inlet air temperature
Given that the inlet air temperature deviation in each sector of the indirect dry cooling system exhibits an approximately linear relationship with ambient temperature and a nonlinear polynomial relationship with ambient wind speed, the mathematical relationship between the inlet air temperature deviation and ambient temperature and ambient wind speed is expressed in Equation (16). The actual inlet air temperature of each sector can then be calculated using Equation (17).
In the equation, ΔT#m-n represents the inlet air temperature deviation of sector #m-n,K; represents the actual inlet air temperature of sector #m-n, K; cij denotes the fitting coefficients, with specific values provided in Table 9.
Table 10 and Figure 12 present the comprehensive evaluation metrics of the model and the residual distributions for the training and validation datasets, respectively. The results indicate that the prediction errors for all sectors remain at a low level during both the training and validation phases. Sector #1-1 exhibits extremely low maximum absolute residuals in both the training and validation datasets (0.0002 K and 0.0003 K, respectively), with an RMSE of 0.0002 K for both datasets. Sector #1-2 has maximum absolute residuals of 0.0733 K and 0.0547 K, respectively, with RMSEs of 0.0072 K for both datasets. For Sector #2-3, the maximum absolute residuals are 0.9134 K and 0.6028 K, respectively, with RMSEs of 0.0469 K and 0.0583 K. For Sector #2-4, the maximum absolute residuals are 1.1933 K and 1.0158 K, respectively, with RMSEs of 0.0116 K and 0.0254 K. Overall, the coefficient of determination (R2) of the fitting models for each sector exceeds 0.99. In summary, the established inlet air temperature fitting model exhibits high fitting accuracy and meets the requirements for subsequent calculations of optimized circulating water flow distribution.
- 3.
- Heat transfer rate per sector
Based on the observation that the proportion of heat transfer in each sector exhibits a nonlinear polynomial relationship with ambient wind speed, the mathematical relationship between the heat transfer proportion and ambient wind speed is expressed in Equation (18). The heat transfer rate of each sector can then be calculated using Equation (19).
In the equation, η#m-n represents the heat transfer proportion of sector #m–n; represents the heat transfer rate of sector #m–n, MW; d0、d1、d2、d3 denotes the fitting coefficients, with specific values provided in Table 11.
Table 12 and Figure 13 present the comprehensive evaluation metrics of the model and the residual distributions for the training and validation datasets, respectively. The results indicate that the prediction errors for each sector remain at a low level during both the training and validation phases. For Sector #1-1, the maximum absolute residuals in the training and validation datasets are 3.59 MW and 1.60 MW, respectively, with root mean square errors (RMSEs) of 1.2461 MW and 0.8250 MW. For Sector #1-2, the maximum absolute residuals are 1.25 MW and 0.65 MW, respectively, with RMSEs of 0.4769 MW and 0.3257 MW. For Sector #1-3, the maximum absolute residuals are 1.65 MW and 1.42 MW, respectively, with RMSEs of 0.6085 MW and 0.5532 MW. For Sector #2-4, the maximum absolute residuals are 2.90 MW and 2.99 MW, respectively, with RMSEs of 0.8978 MW and 1.2625 MW. Overall, the coefficient of determination (R2) of the fitting models for each sector exceeds 0.99, except for Sector #1-4, which is 0.9841. In summary, the established sector heat transfer fitting models exhibit high fitting accuracy and meet the computational requirements for subsequent optimization of circulating water flow distribution.
4. Discussion
The numerical simulations and predictive modeling conducted in this study elucidate the complex multiscale flow and heat transfer characteristics of the indirect dry cooling system under varying meteorological conditions. The results confirm that ambient crosswinds deteriorate the overall thermal performance of the cooling tower by inducing non-uniform airflow distributions. However, our sector-specific analysis extends beyond macroscopic evaluations by quantifying the degree of performance degradation across different circumferential regions of the tower. Notably, the data reveals a distinct asymmetry under windy conditions: while windward sectors experience enhanced heat transfer due to increased forced convection, lateral (crosswind) sectors suffer performance drops caused by flow separation and localized hot air recirculation. This detailed sector-level insight provides a more complete understanding of localized thermal imbalances within the system.
Regarding ambient temperature, the present study demonstrates a linear inverse relationship between ambient temperature and total heat transfer rate. Unlike ambient wind, which disrupts the circumferential symmetry of the flow field, temperature variations uniformly weaken cooling capacity across all sectors without significantly altering their relative heat transfer proportions. The stability of the sectoral heat transfer distribution under varying temperatures suggests that operational adjustments targeting temperature fluctuations can be uniformly applied across the entire cooling system. In contrast, wind-induced disturbances create distinct thermal gradients that require localized, sector-specific interventions to maintain optimal turbine backpressure.
A significant contribution of this research is the development of an accurate, simplified multiple regression prediction model. Traditional full-scale numerical simulations and data-heavy algorithmic approaches can be computationally intensive and time-consuming. By translating multiscale transport phenomena into polynomial equations—most demonstrating a coefficient of determination (R2) exceeding 0.99 and low root mean square errors—this study bridges the gap between theoretical fluid dynamics and practical power plant operation. Plant operators can utilize these models to rapidly predict turbine exhaust backpressure, overall heat transfer, and sector-specific thermal parameters without relying on iterative computations. This rapid prediction capability is essential for implementing dynamic control strategies in real time.
Despite the predictive capabilities demonstrated, the current study possesses certain limitations that outline directions for future research. First, the numerical model operates under the assumption of a uniform distribution of circulating water across all sectors. Given our findings that crosswinds create significant thermal imbalances, future research should focus on developing non-uniform, optimized water flow allocation strategies to compensate for lateral sector degradation. Second, the predictive model primarily evaluates dry ambient temperature and horizontal wind speed. Subsequent investigations could incorporate additional environmental variables, such as ambient humidity and rainfall, to create a more comprehensive meteorological model. Finally, the integration of these predictive models into the Distributed Control System of operational power plants, followed by validation against empirical field data, will be a critical step toward realizing optimized IDCS operations under variable weather conditions.
5. Conclusions
This study performs a variable-condition analysis based on a numerical simulation model of an indirect dry cooling system, focusing on the effects of ambient wind speed and ambient temperature on the flow and heat transfer characteristics of the system under a uniform circulating water distribution scheme. Through quantitative analysis of the overall system performance and sector-specific performance parameters, a simplified model for predicting the performance of the indirect dry cooling system is developed. The main conclusions of this study are as follows.
- This study reveals the influence patterns of environmental meteorological conditions on the multiphysics field distribution in the indirect dry cooling system. Under windless conditions, the flow field and pressure field inside and outside the tower exhibit uniform and symmetric distributions. Under ambient wind conditions, the air outside the tower exhibits a cylindrical flow-like behavior, leading to non-uniform circumferential distributions of the multiphysics fields. Specifically, the pressure difference between the inside and outside of the tower is greatest in the windward sector, where the heat transfer performance is optimal; in the crosswind sector, the heat transfer performance decreases significantly due to intensified airflow disturbance; and in the leeward sector, the influence of ambient wind is relatively weak. An increase in ambient temperature directly reduces the dry cooling capacity, leading to a decrease in the pressure difference between the inside and outside of the tower, as well as a decline in the overall air intake and heat transfer performance of the indirect dry cooling system.
- In terms of overall performance, increases in ambient wind speed and ambient temperature both lead to a reduction in the total heat transfer of the indirect dry cooling system and an increase in turbine exhaust backpressure. Specifically, the total heat transfer exhibits a linear inverse relationship with ambient temperature and a quadratic nonlinear relationship with ambient wind speed. Regarding sector performance, the deviations of sector inlet air flow rate and inlet air temperature show an approximately linear relationship with ambient temperature, while exhibiting a nonlinear polynomial variation with ambient wind speed. The proportion of heat transfer in each sector varies only in a nonlinear polynomial form with ambient wind speed. As wind speed increases, the air flow rate and heat transfer proportion in the windward sector continue to rise; the air intake in the crosswind sector decreases significantly, and the inlet air temperature deviation reaches its maximum. Although increasing ambient temperature weakens the overall heat transfer performance of the indirect dry cooling system, it has a relatively minor impact on the relative distribution of heat transfer among sectors, indicating a certain degree of stability in sectoral heat transfer distribution.
- A simplified model for predicting the performance of the indirect dry cooling system was developed and validated. Based on multiple regression analysis, predictive models were established for the total heat transfer of the indirect dry cooling system, as well as for the inlet air flow rate, inlet air temperature, and heat transfer rate in each sector. Error evaluation results indicate that the coefficient of determination (R2) for most models exceeds 0.99, with small root mean square errors (RMSEs). This indicates that the model has high prediction accuracy and can reduce the number of operating-condition calculations and the computational time required for iterative simulations.
Supplementary Materials
The following supporting information can be downloaded at the website of this paper posted on Preprints.org, Figure S1: title; Table S1: title; Video S1: title.
Author Contributions
Conceptualization, Hui Wang, Lei Chen and Jianhui Zeng; methodology, Hui Wang,Xinning Song; software, Hui Wang,Zhanyang Li; validation, Hui Wang, Jianhui Zeng and Xinning Song; formal analysis, Hui Wang; investigation, Hui Wang,Zhanyang Li; resources, Hui Wang; data curation, Hui Wang,Xiaopeng Wu; writing—original draft preparation, Hui Wang,Xinning Song; writing—review and editing, Hui Wang; visualization, Hui Wang,Xiaopeng Wu; supervision, Hui Wang; project administration, Hui Wang; funding acquisition, Jianhui Zeng All authors have read and agreed to the published version of the manuscript.
Funding
This research is supported by the Fundamental Research Funds for the Central Universities(2026SL016).
Data Availability Statement
The data presented in this study are available on request from the corresponding author.
Conflicts of Interest
The authors declare no conflicts of interest.
Abbreviations
The following abbreviations are used in this manuscript:
| IDCS | Indirect dry cooling system |
References
- BU, Yongdong; YANG, Lijun; DU, Xiaoze; et al. Review of dry cooling technologies in power plants[J]. Mod. Electr. Power 2013, 30(3), 69–79. [Google Scholar]
- Jiang, X.; Zhang, X.; Wang, S.; et al. Impact of Crosswind on Steady-State and Dynamic Performance of Natural Draft Dry Cooling Tower Group: A Numerical Analysis[J]. Front. Heat Mass Transf. 2024, 22(01), 193–216. [Google Scholar] [CrossRef]
- WANG Weiliang, NI Weidou, WANG Zhe, et al. Review on research of indirect dry cooling towers affected by crosswind[J]. Proc. CSEE 2015, 35(04), 882–890.
- CHEN Tiefeng, CHEN Qingjie, WANG Lidong, et al. Experimental study on flow and heat transfer characteristics of indirect dry cooling cooling triangle on air side[J]. Proc. CSEE 2020, 40(S1), 188–194.
- HAN, Huafeng; CHEN, Qingjie; ZHAO, Yuanbin; et al. Analysis and evaluation of cooling characteristics of indirect dry cooling tower based on cooling amplitude height[J]. Proc. CSEE 2021, 41(06), 2212–2222. [Google Scholar]
- ZHAI, Yingjun; QU, Kaiheng; LIU, Jingyue; et al. Study on influence of measured ambient temperature and wind speed on IDCS[J]. Jilin Electr. Power 2025, 53(04), 19–21. [Google Scholar]
- Jahangiri, A.; Rahmani, F. Power production limitations due to the environmental effects on the thermal effectiveness of NDDCT in an operating powerplant[J]. Appl. Therm. Eng. 2018, 141, 444–455. [Google Scholar] [CrossRef]
- Modeling and Optimal Control of Variable Frequency Speed Regulating Circulating Water Pumps for 2×660 MW Thermal Power Units[J]. WANG Shenghu DONG Chunsen ZHOU Xiangyang;Ind. Control Comput. 2024, 37(08), 151–153.
- YAN, Mingwen; QIAO, Wenyi; WEI, Jingchun; et al. Energy Consumption Optimization of Cold End System and Precise Control Method of Circulating Water Temperature for Thermal Power Units[J]. Die Mould Manuf. 2025, 25(12), 162–164. [Google Scholar]
- LIU, Xueliang. Research on Off-Design Operation Characteristics and Operation Optimization Method of Cold End System for Surface Condensing Indirect Air-Cooled Units[D]; Xi’an Thermal Power Research Institute Co., Ltd.: Xi’an, 2018. [Google Scholar]
- Zhang, W.; Ma, L.; Jia, B.; et al. Optimization of the circulating cooling water mass flow in IDCS of thermal power unit using artificial neural network based on genetic algorithm[J]. Appl. Therm. Eng. 2023, 223, 120040. [Google Scholar] [CrossRef]
- LIU, Bo. Optimization of Circulating Water System Under Uncertain Conditions[D]; China University of Petroleum (Beijing): Beijing, 2023; p. fang1. [Google Scholar]
- DONG Zijian, GAO Yang, RAN Ning. Parameter optimization of generalized predictive control for IDCS based on improved particle swarm optimization[J/OL]. Thermal Power Generation, (2025-11-19) [2026-03-16]. [CrossRef]
- Wei, H.; Wu, T.; Ge, Z.; et al. Entransy analysis optimization of cooling water flow distribution in a dry cooling tower of power plant under summer crosswinds[J]. Energy 2019, 166, 1229–1240. [Google Scholar] [CrossRef]
- Huan, M.A.; Fengqi, S.I.; Lan, L.I.; et al. A Fast Calculation Model for Off-Design Conditions of IDCSs[J]. J. Southeast Univ. (Natural Science Edition) 2015, 45(01), 79–84. [Google Scholar]
- WANG, Weijia; KONG, Yanqiang; WEN, Xinyu; et al. Anti-freezing prediction model, numerical verification and experimental study of indirect air cooling radiator tube bundles in power stations[J]. Proc. CSEE 2022, 42(17), 6357–6368. [Google Scholar]
- Zhao, Y.; Long, G.; Sun, F.; et al. Numerical study on the cooling performance of dry cooling tower with vertical two-pass column radiators under crosswind[J]. Appl. Therm. Eng. 2015, 75, 1106–1117. [Google Scholar] [CrossRef]
- WANG, Weijia; CHEN, Lei; KONG, Yanqiang; et al. Control logic and numerical verification of anti-freezing and high-efficiency operation for IDCS in power stations[J]. Proc. CSEE 2022, 42(06), 2258–2268. [Google Scholar]
- Wang, W.; Chen, L.; Kong, Y.; et al. Cooling performance evaluation for double-layer configuration of air-cooled heat exchanger[J]. Int. J. Heat Mass Transf. 2020, 151, 119396. [Google Scholar] [CrossRef]
- Yang, L.; Wu, X.; Du, X.; et al. Dimensional characteristics of wind effects on the performance of IDCS with vertically arranged heat exchanger bundles[J]. Int. J. Heat Mass Transf. 2013, 67, 853–866. [Google Scholar] [CrossRef]
- Yang, L.; Du, X.; Yang, Y. Space characteristics of the thermal performance for air-cooled condensers at ambient winds[J]. Int. J. Heat Mass Transf. 2011, 54(15-16), 3109–3119. [Google Scholar] [CrossRef]
- Kong, Y.; Yang, L.; DU, X.; et al. Effects of continuous and alternant rectangular slots on thermo-flow performances of plain finned tube bundles in in-line and staggered configurations[J]. Int. J. Heat Mass Transf. 2016, 93, 97–107. [Google Scholar] [CrossRef]
Figure 1.
IDCS structure and geometric model diagram.
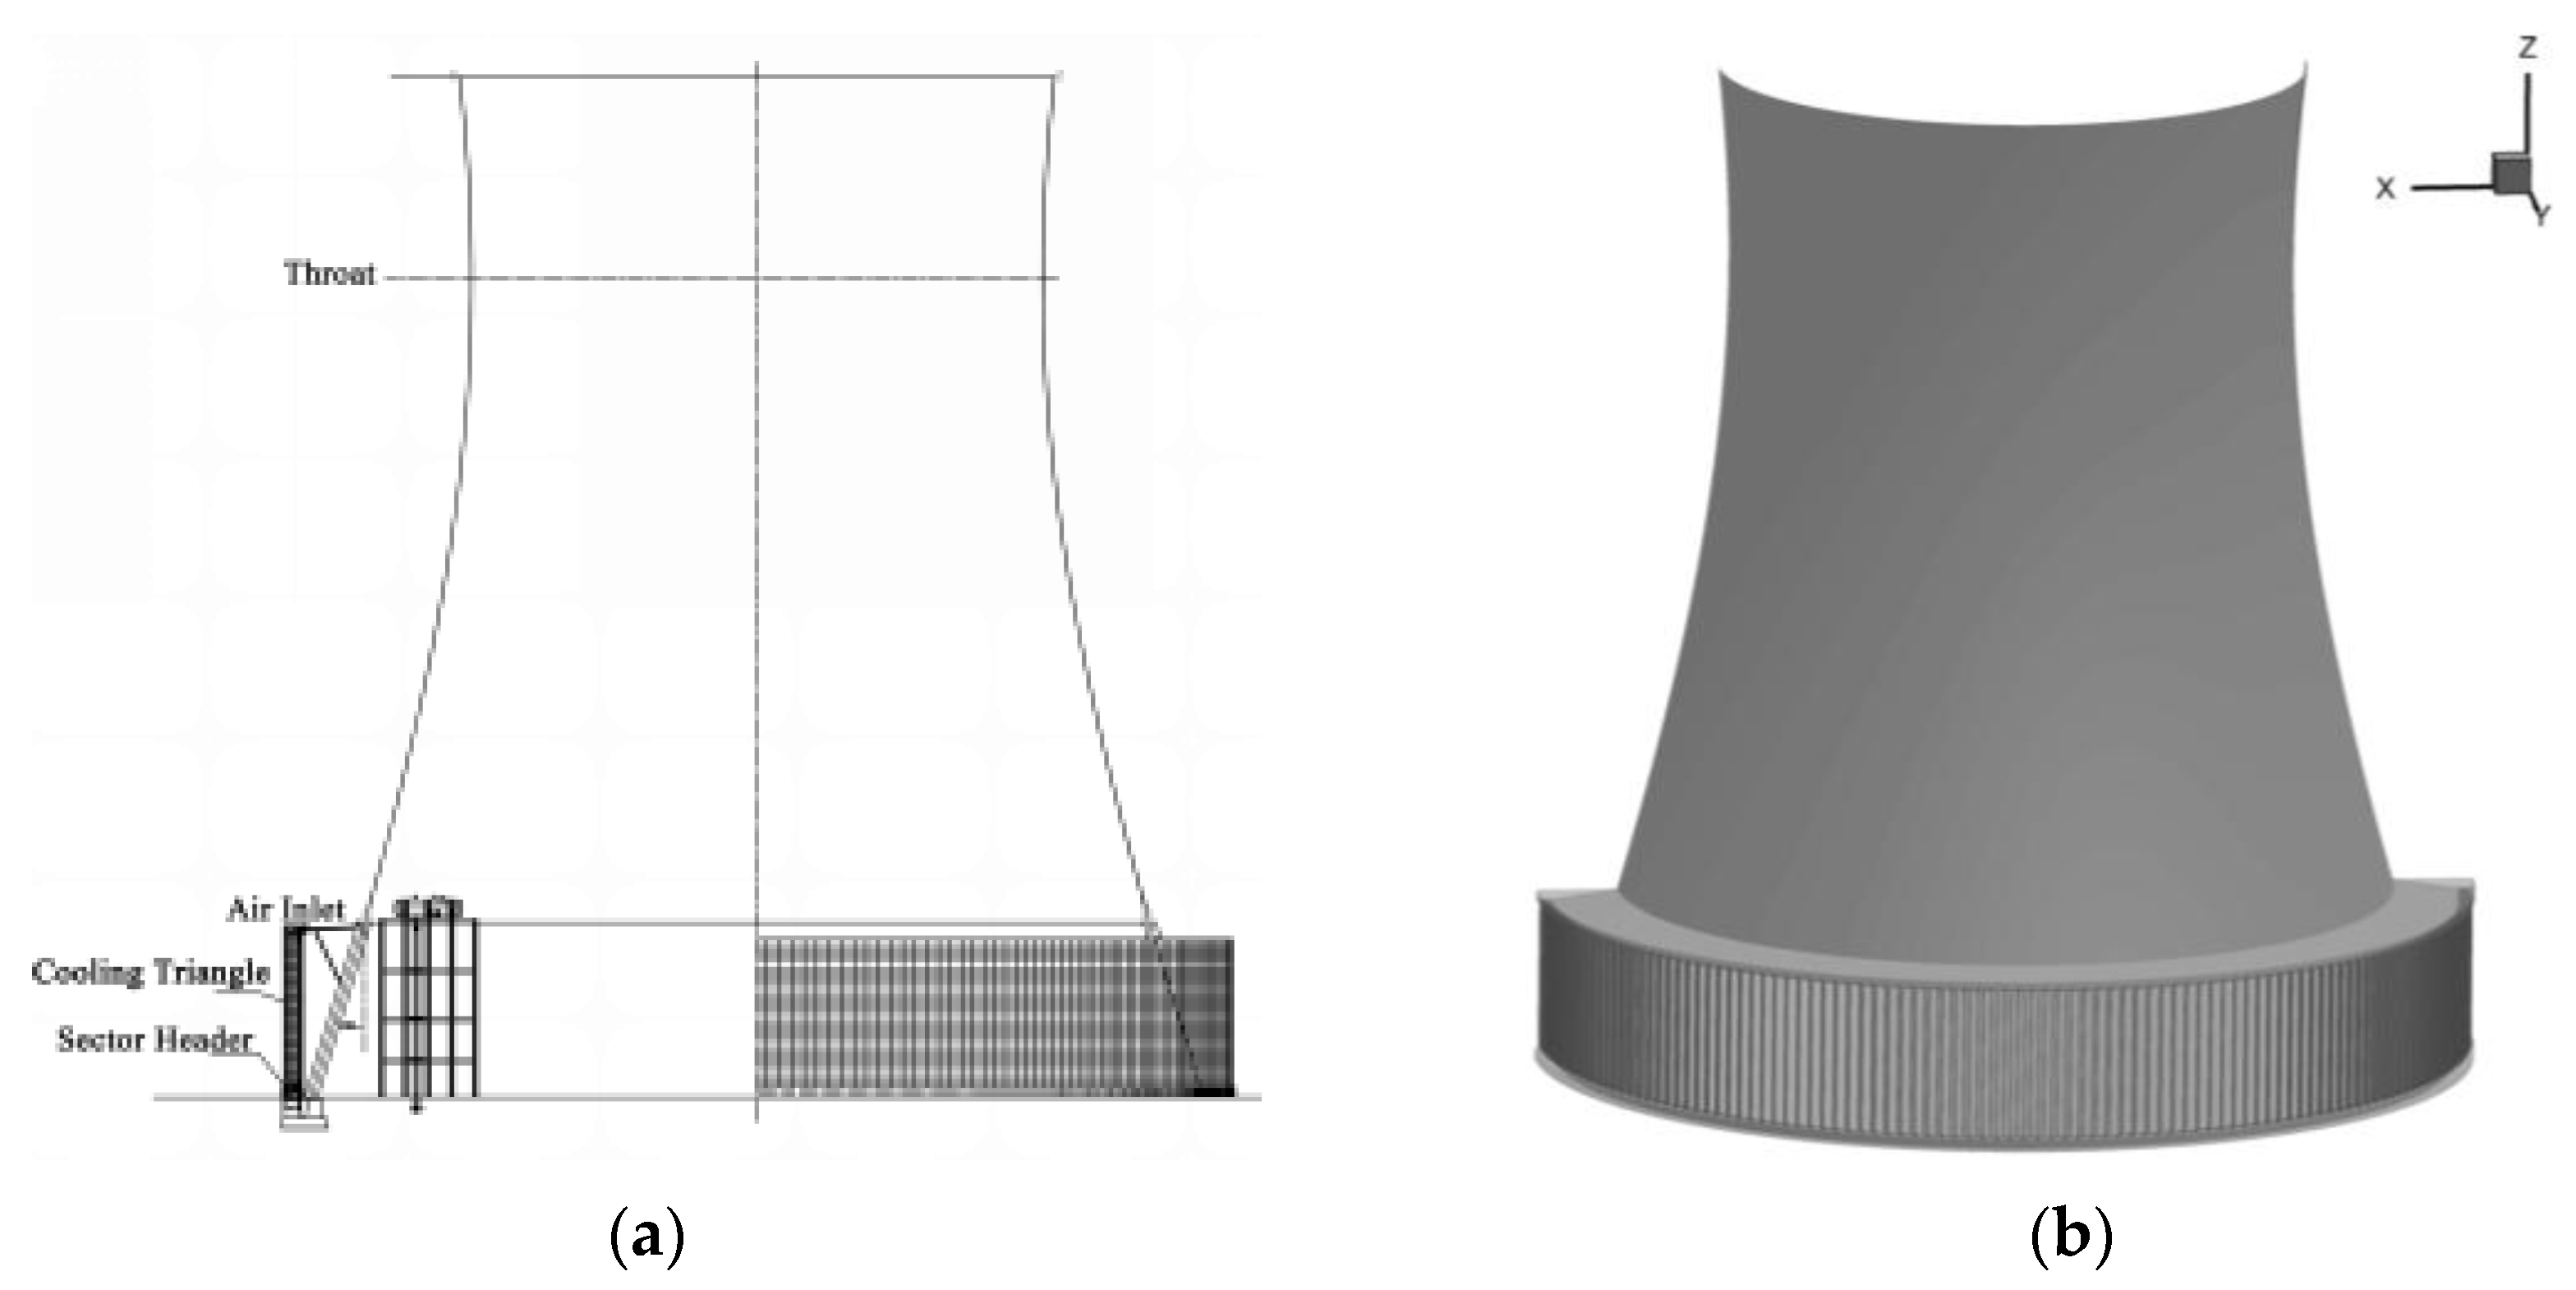
Figure 2.
Indirect air-cooled radiator sector distribution diagram.
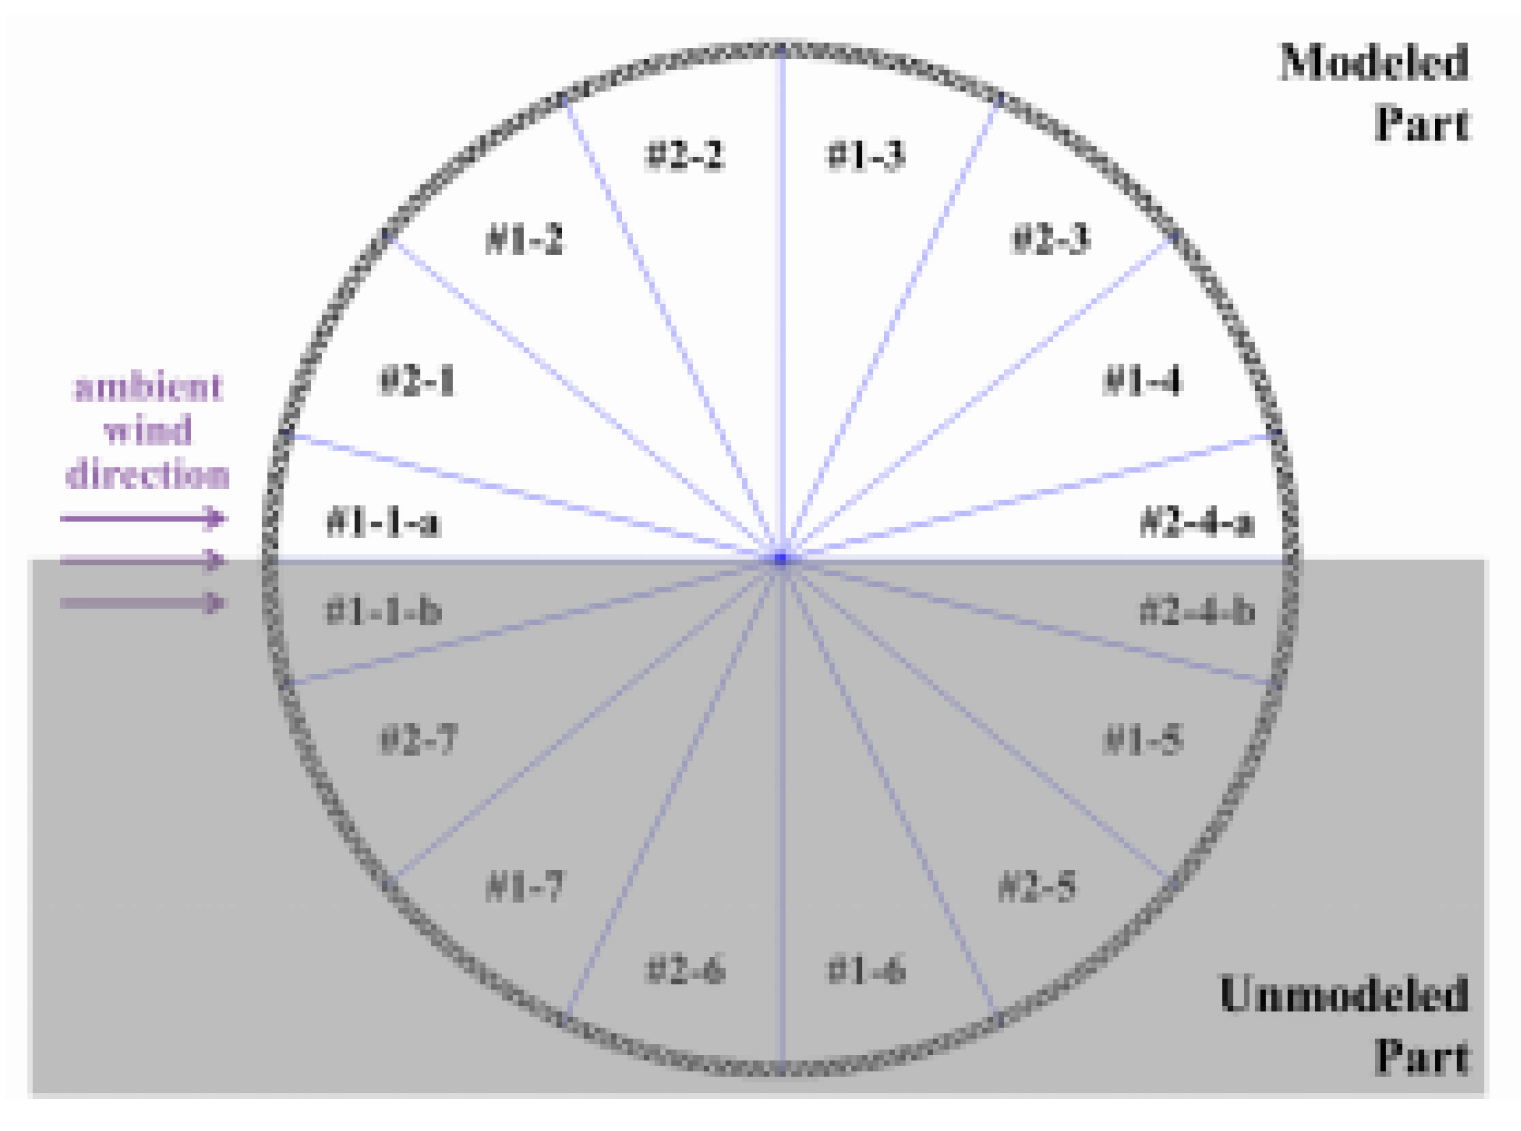
Figure 3.
(a)Local grid division(b)Overall grid division.
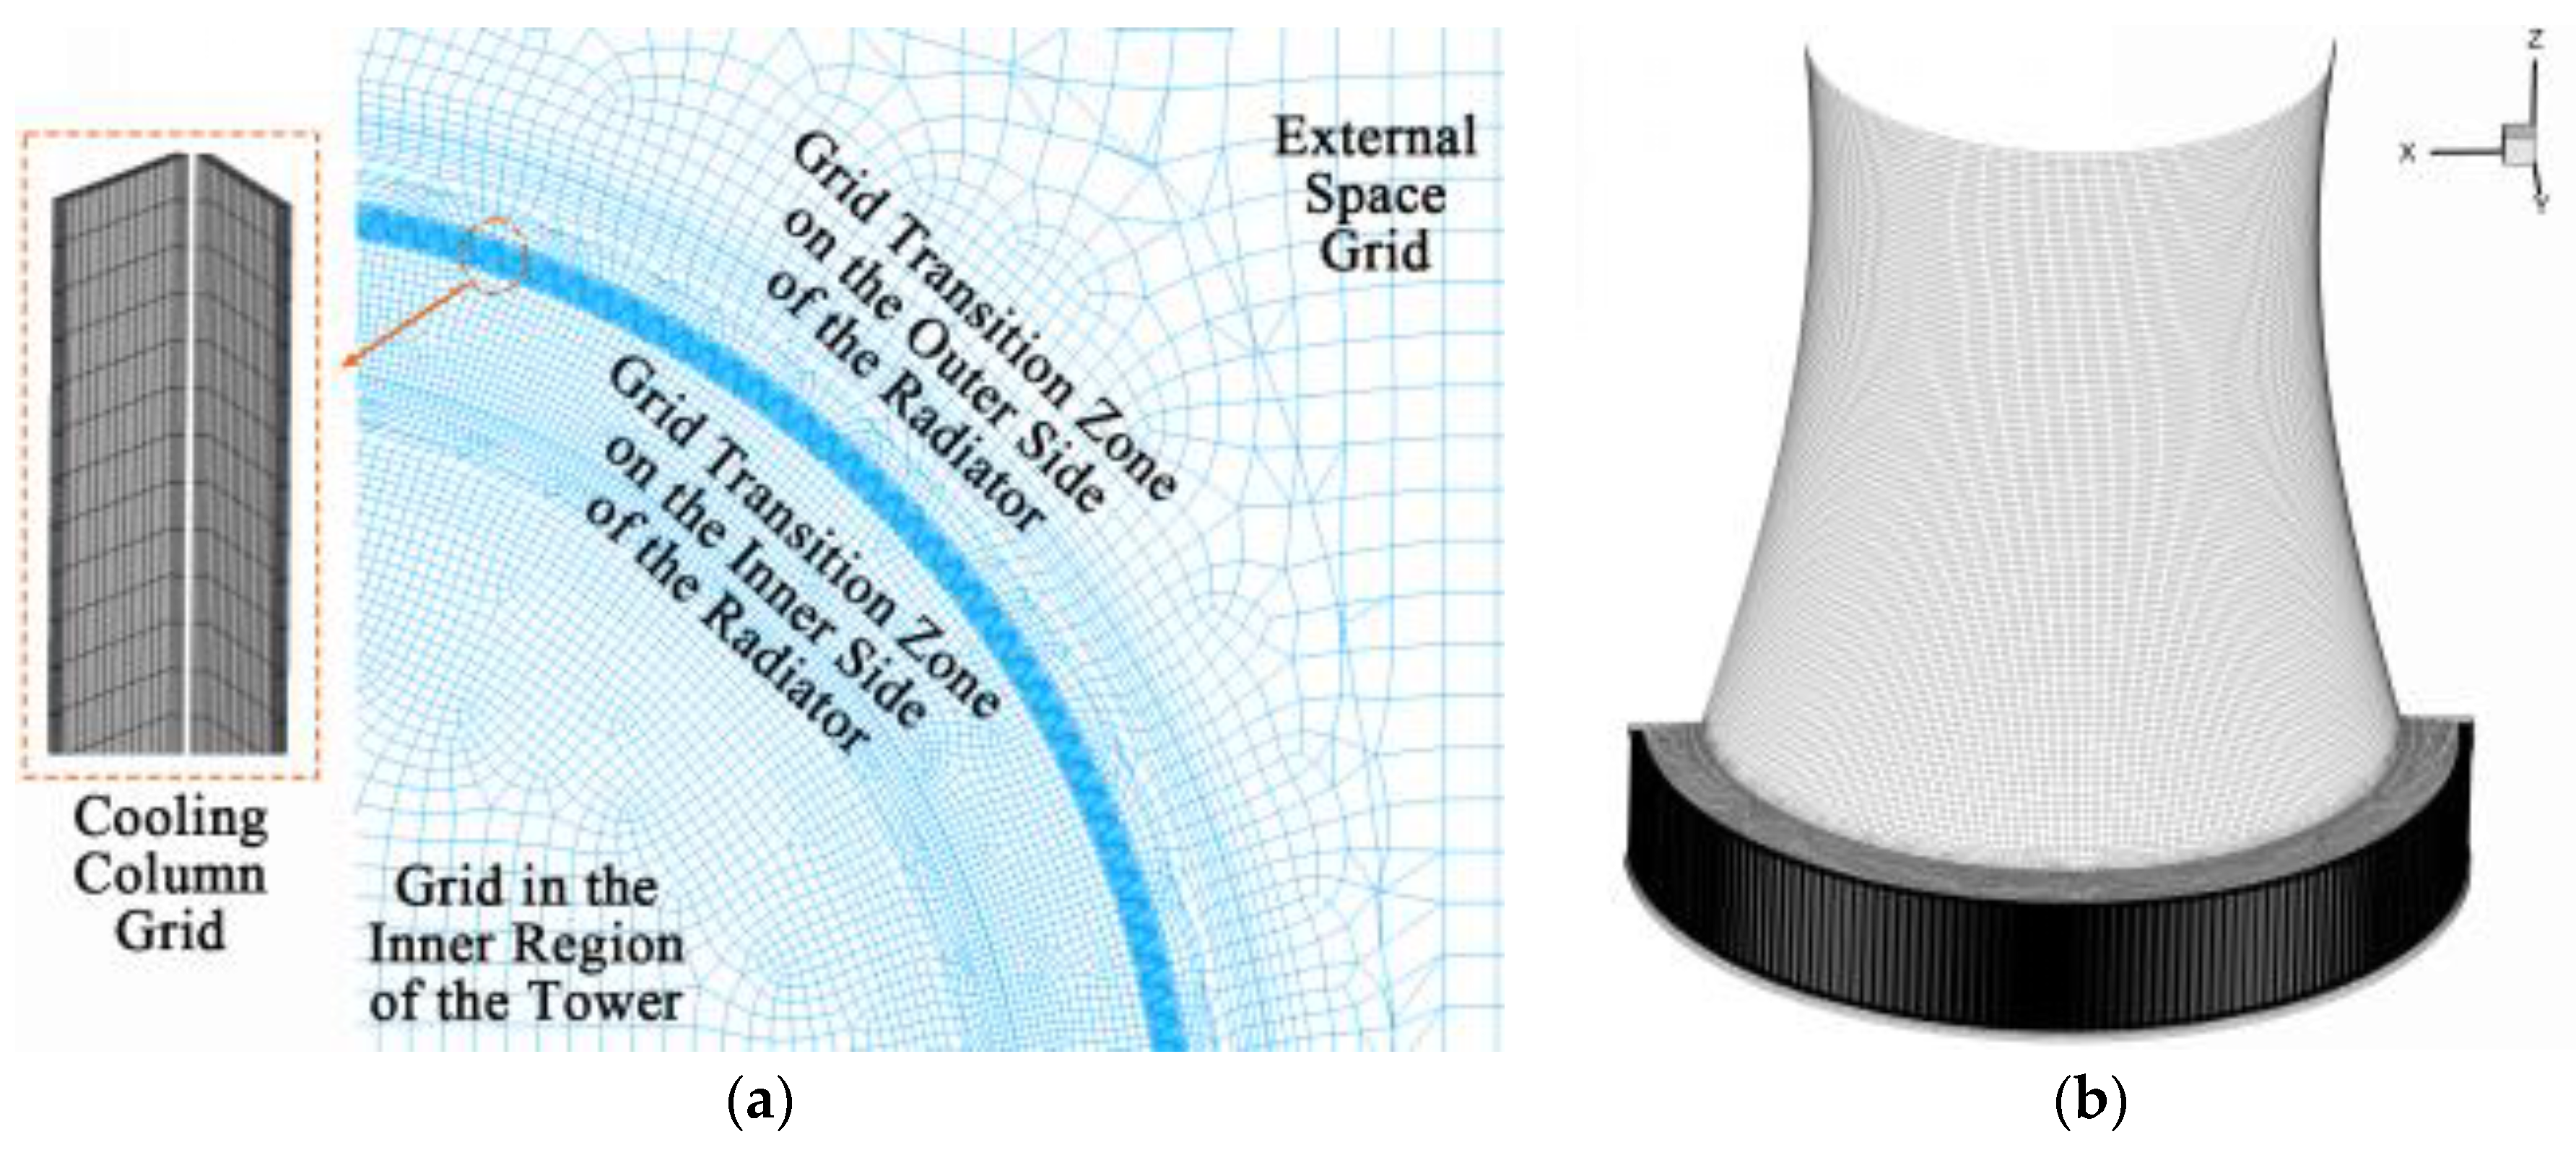
Figure 4.
Computational domain and boundary conditions of numerical model.
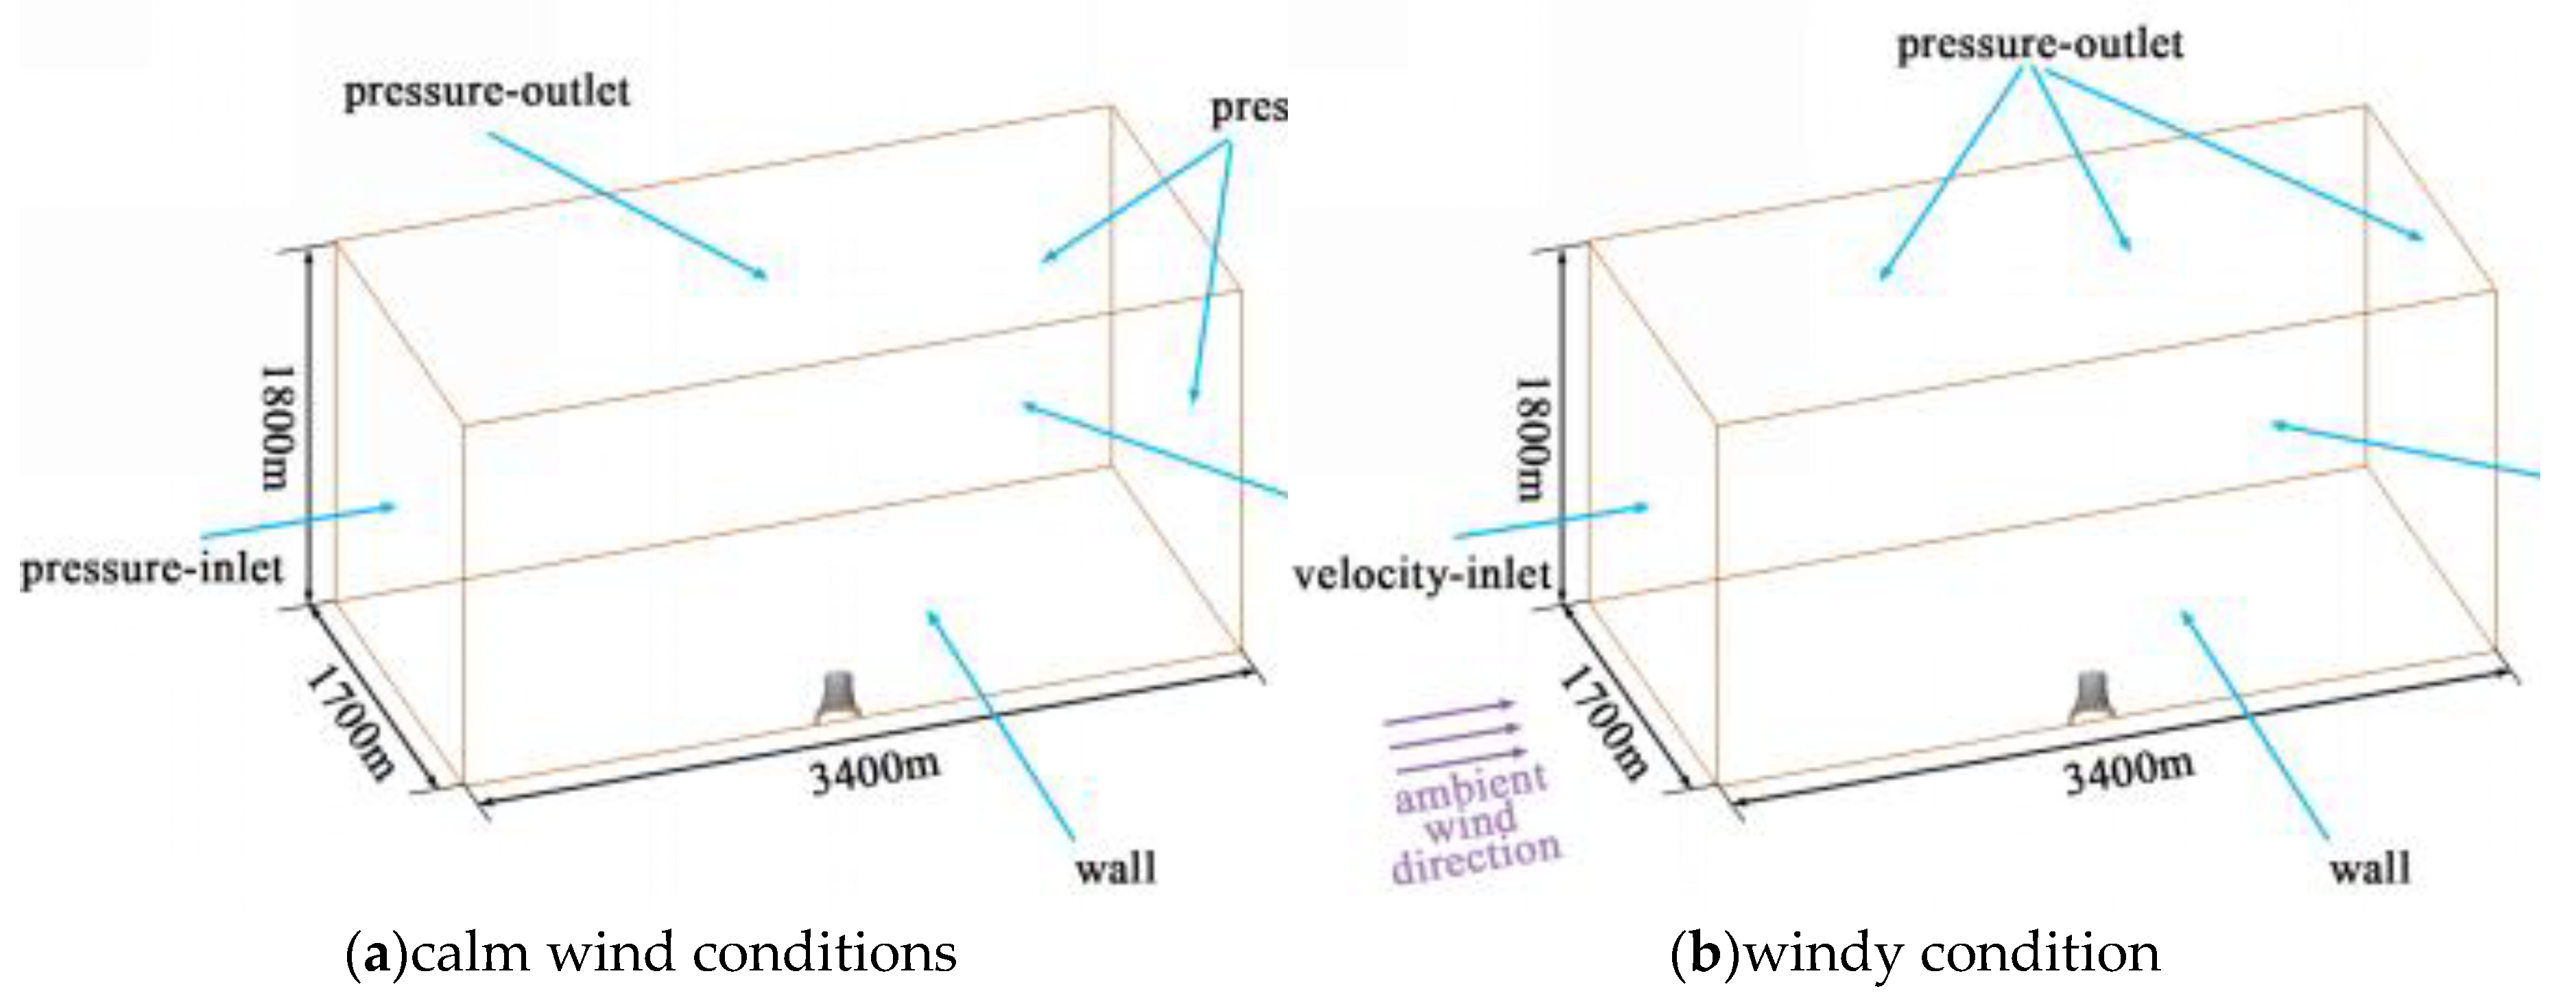
Figure 5.
Construction process of the theoretical mode.
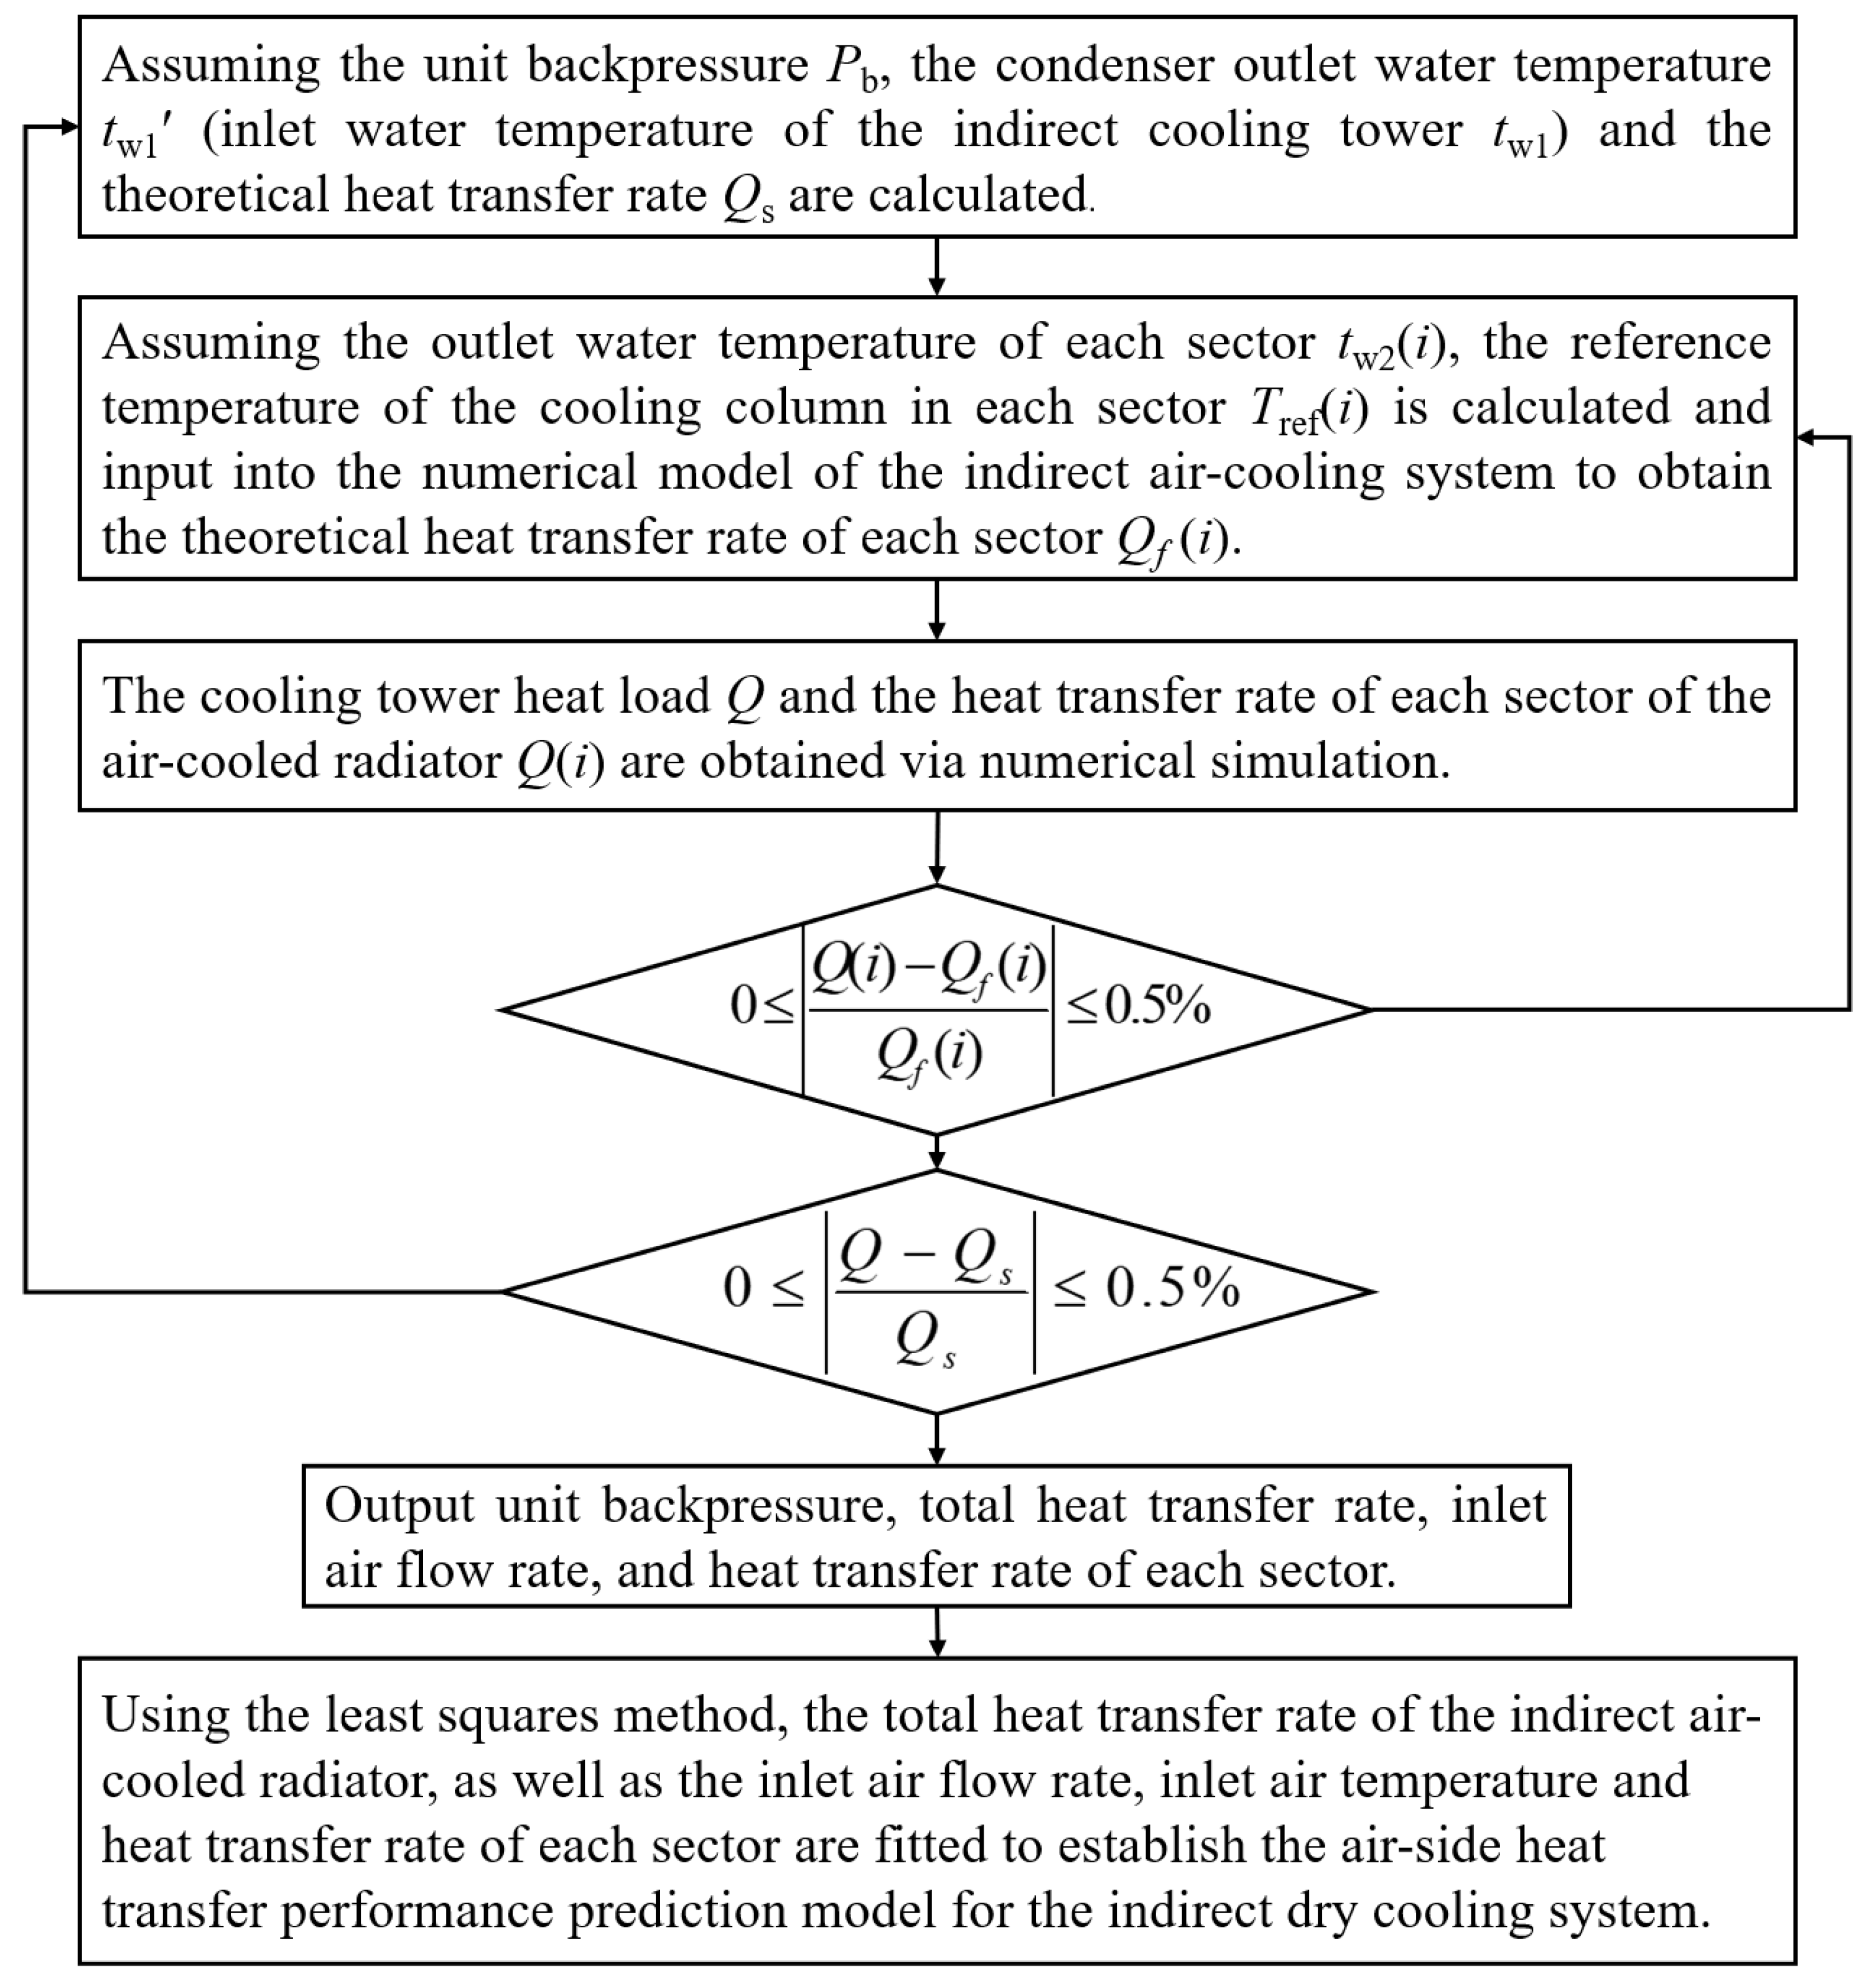
Figure 6.
The overall heat transfer and back pressure change of IDCS under the influence of ambient wind speed and ambient temperature.
Figure 6.
The overall heat transfer and back pressure change of IDCS under the influence of ambient wind speed and ambient temperature.
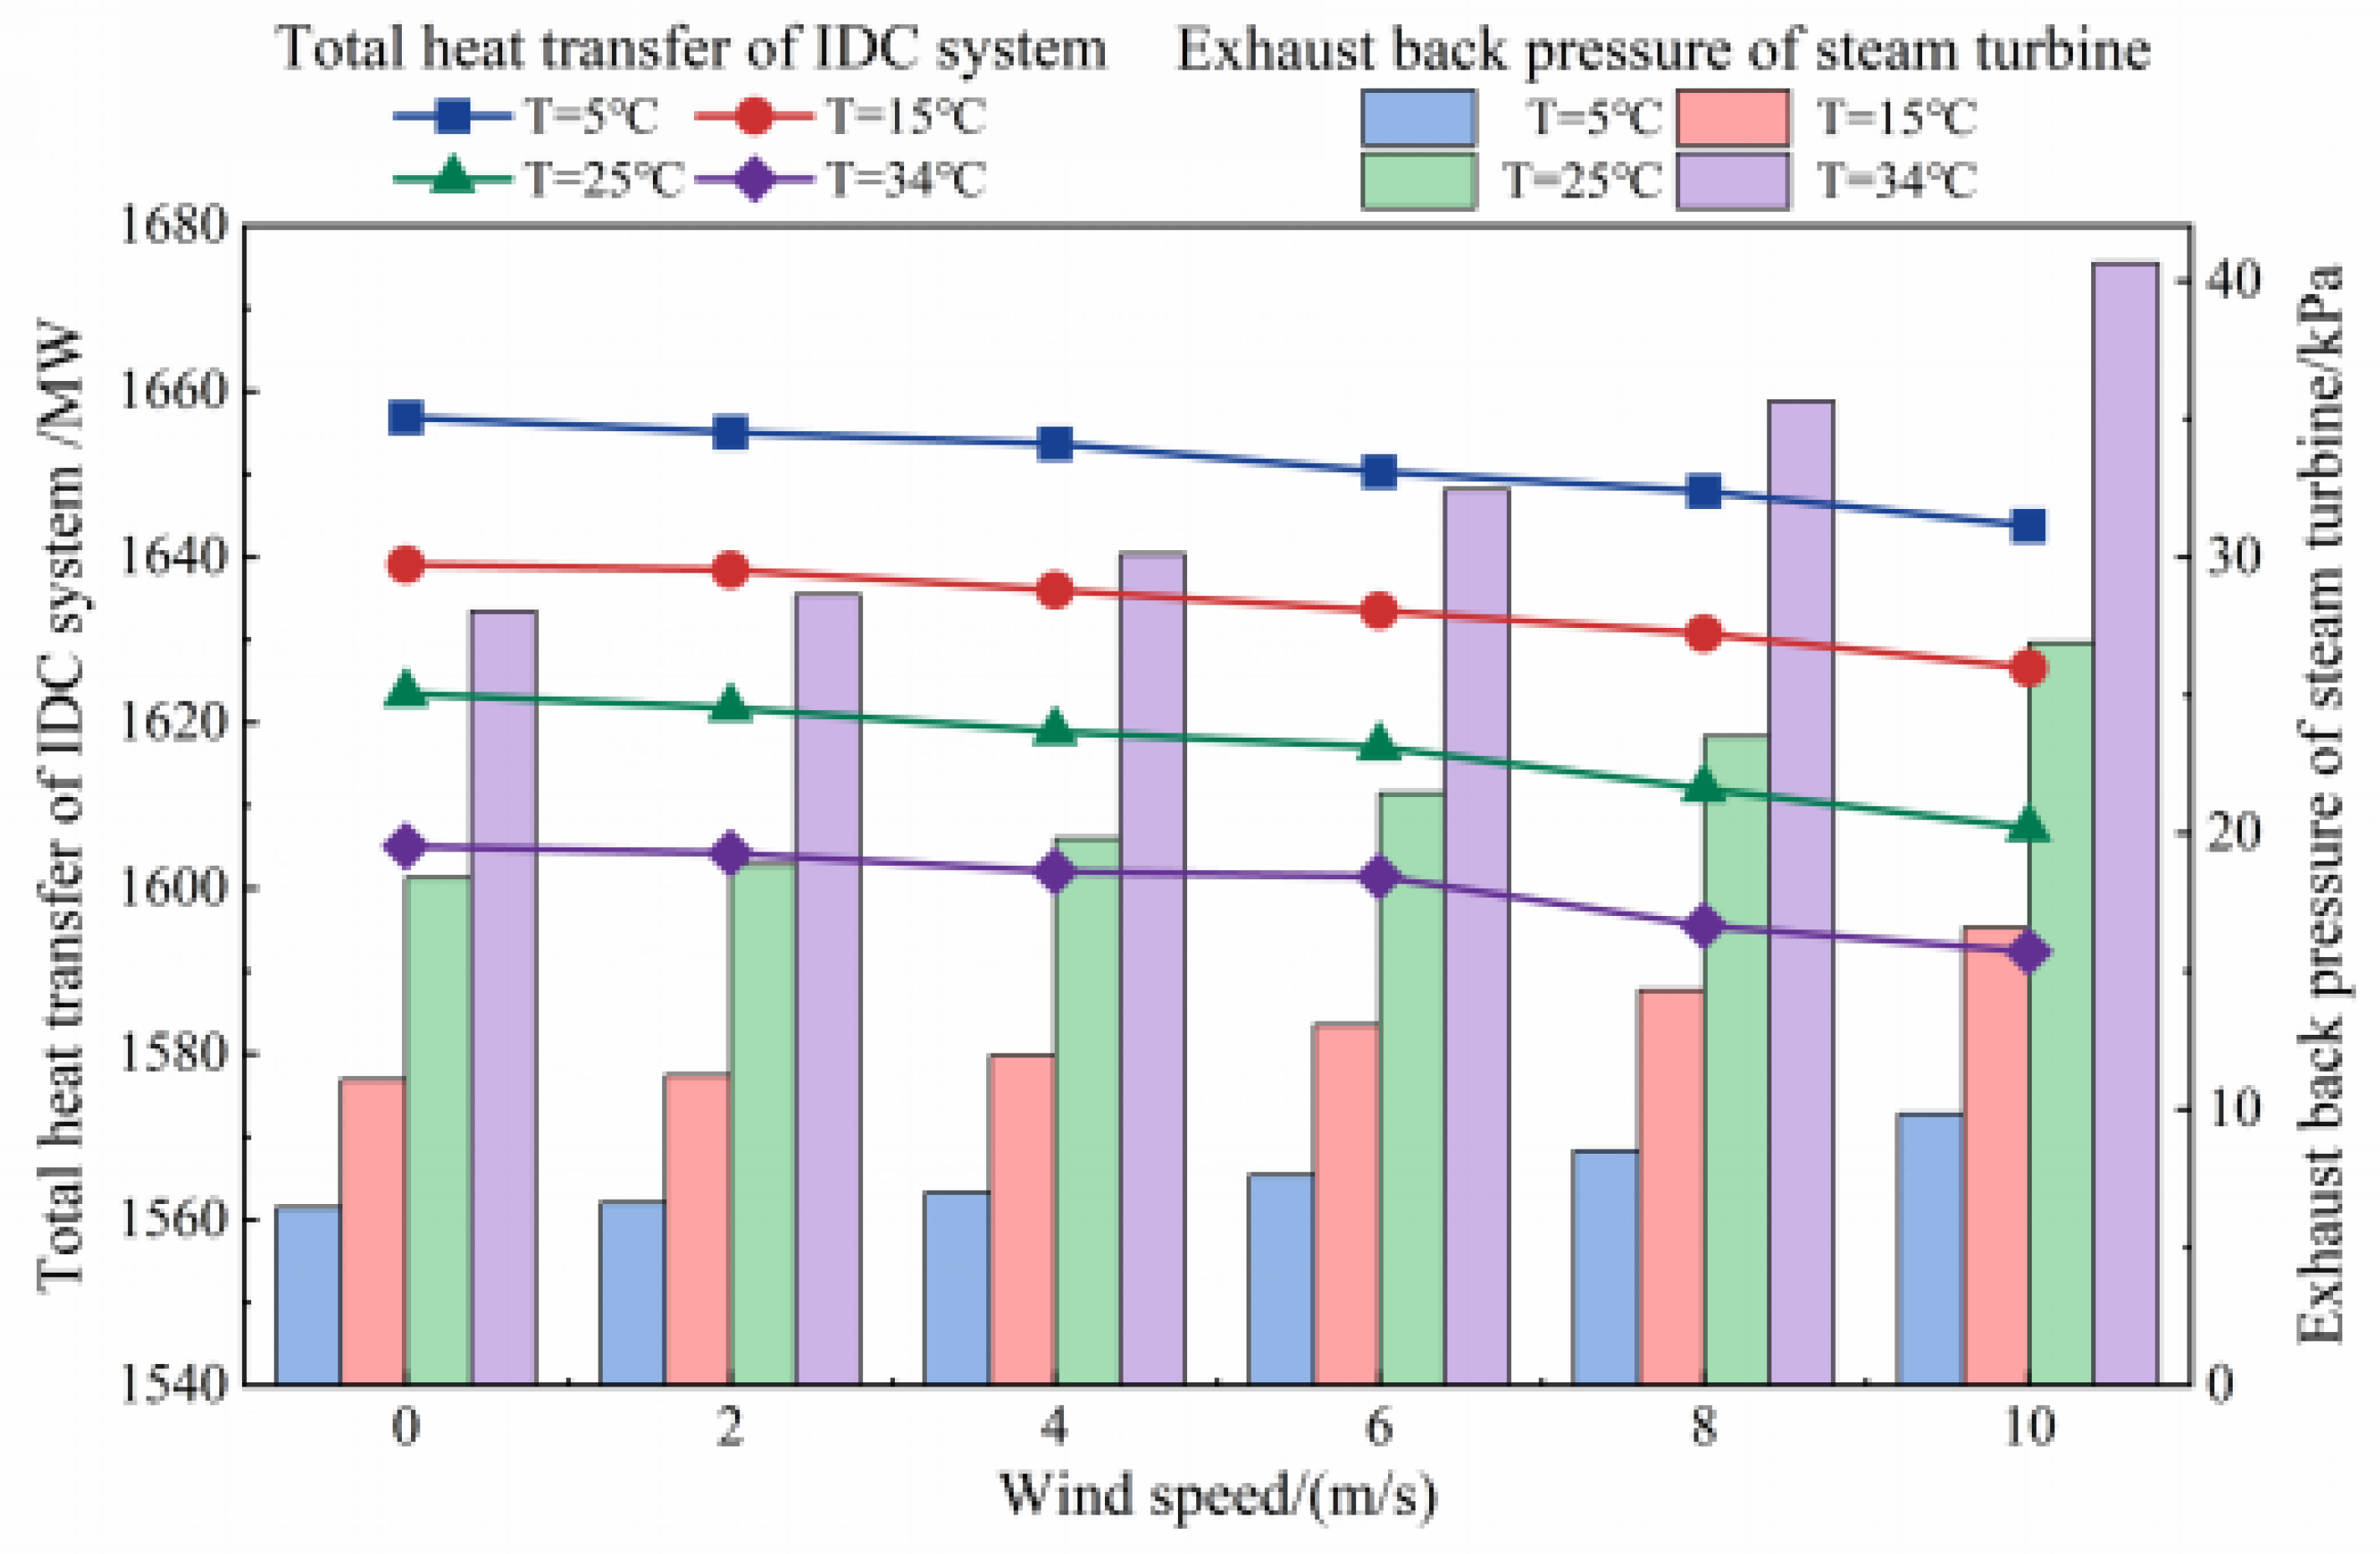
Figure 7.
The variation law of air flow at the entrance of each sector under the influence of ambient wind speed and ambient temperature.
Figure 7.
The variation law of air flow at the entrance of each sector under the influence of ambient wind speed and ambient temperature.
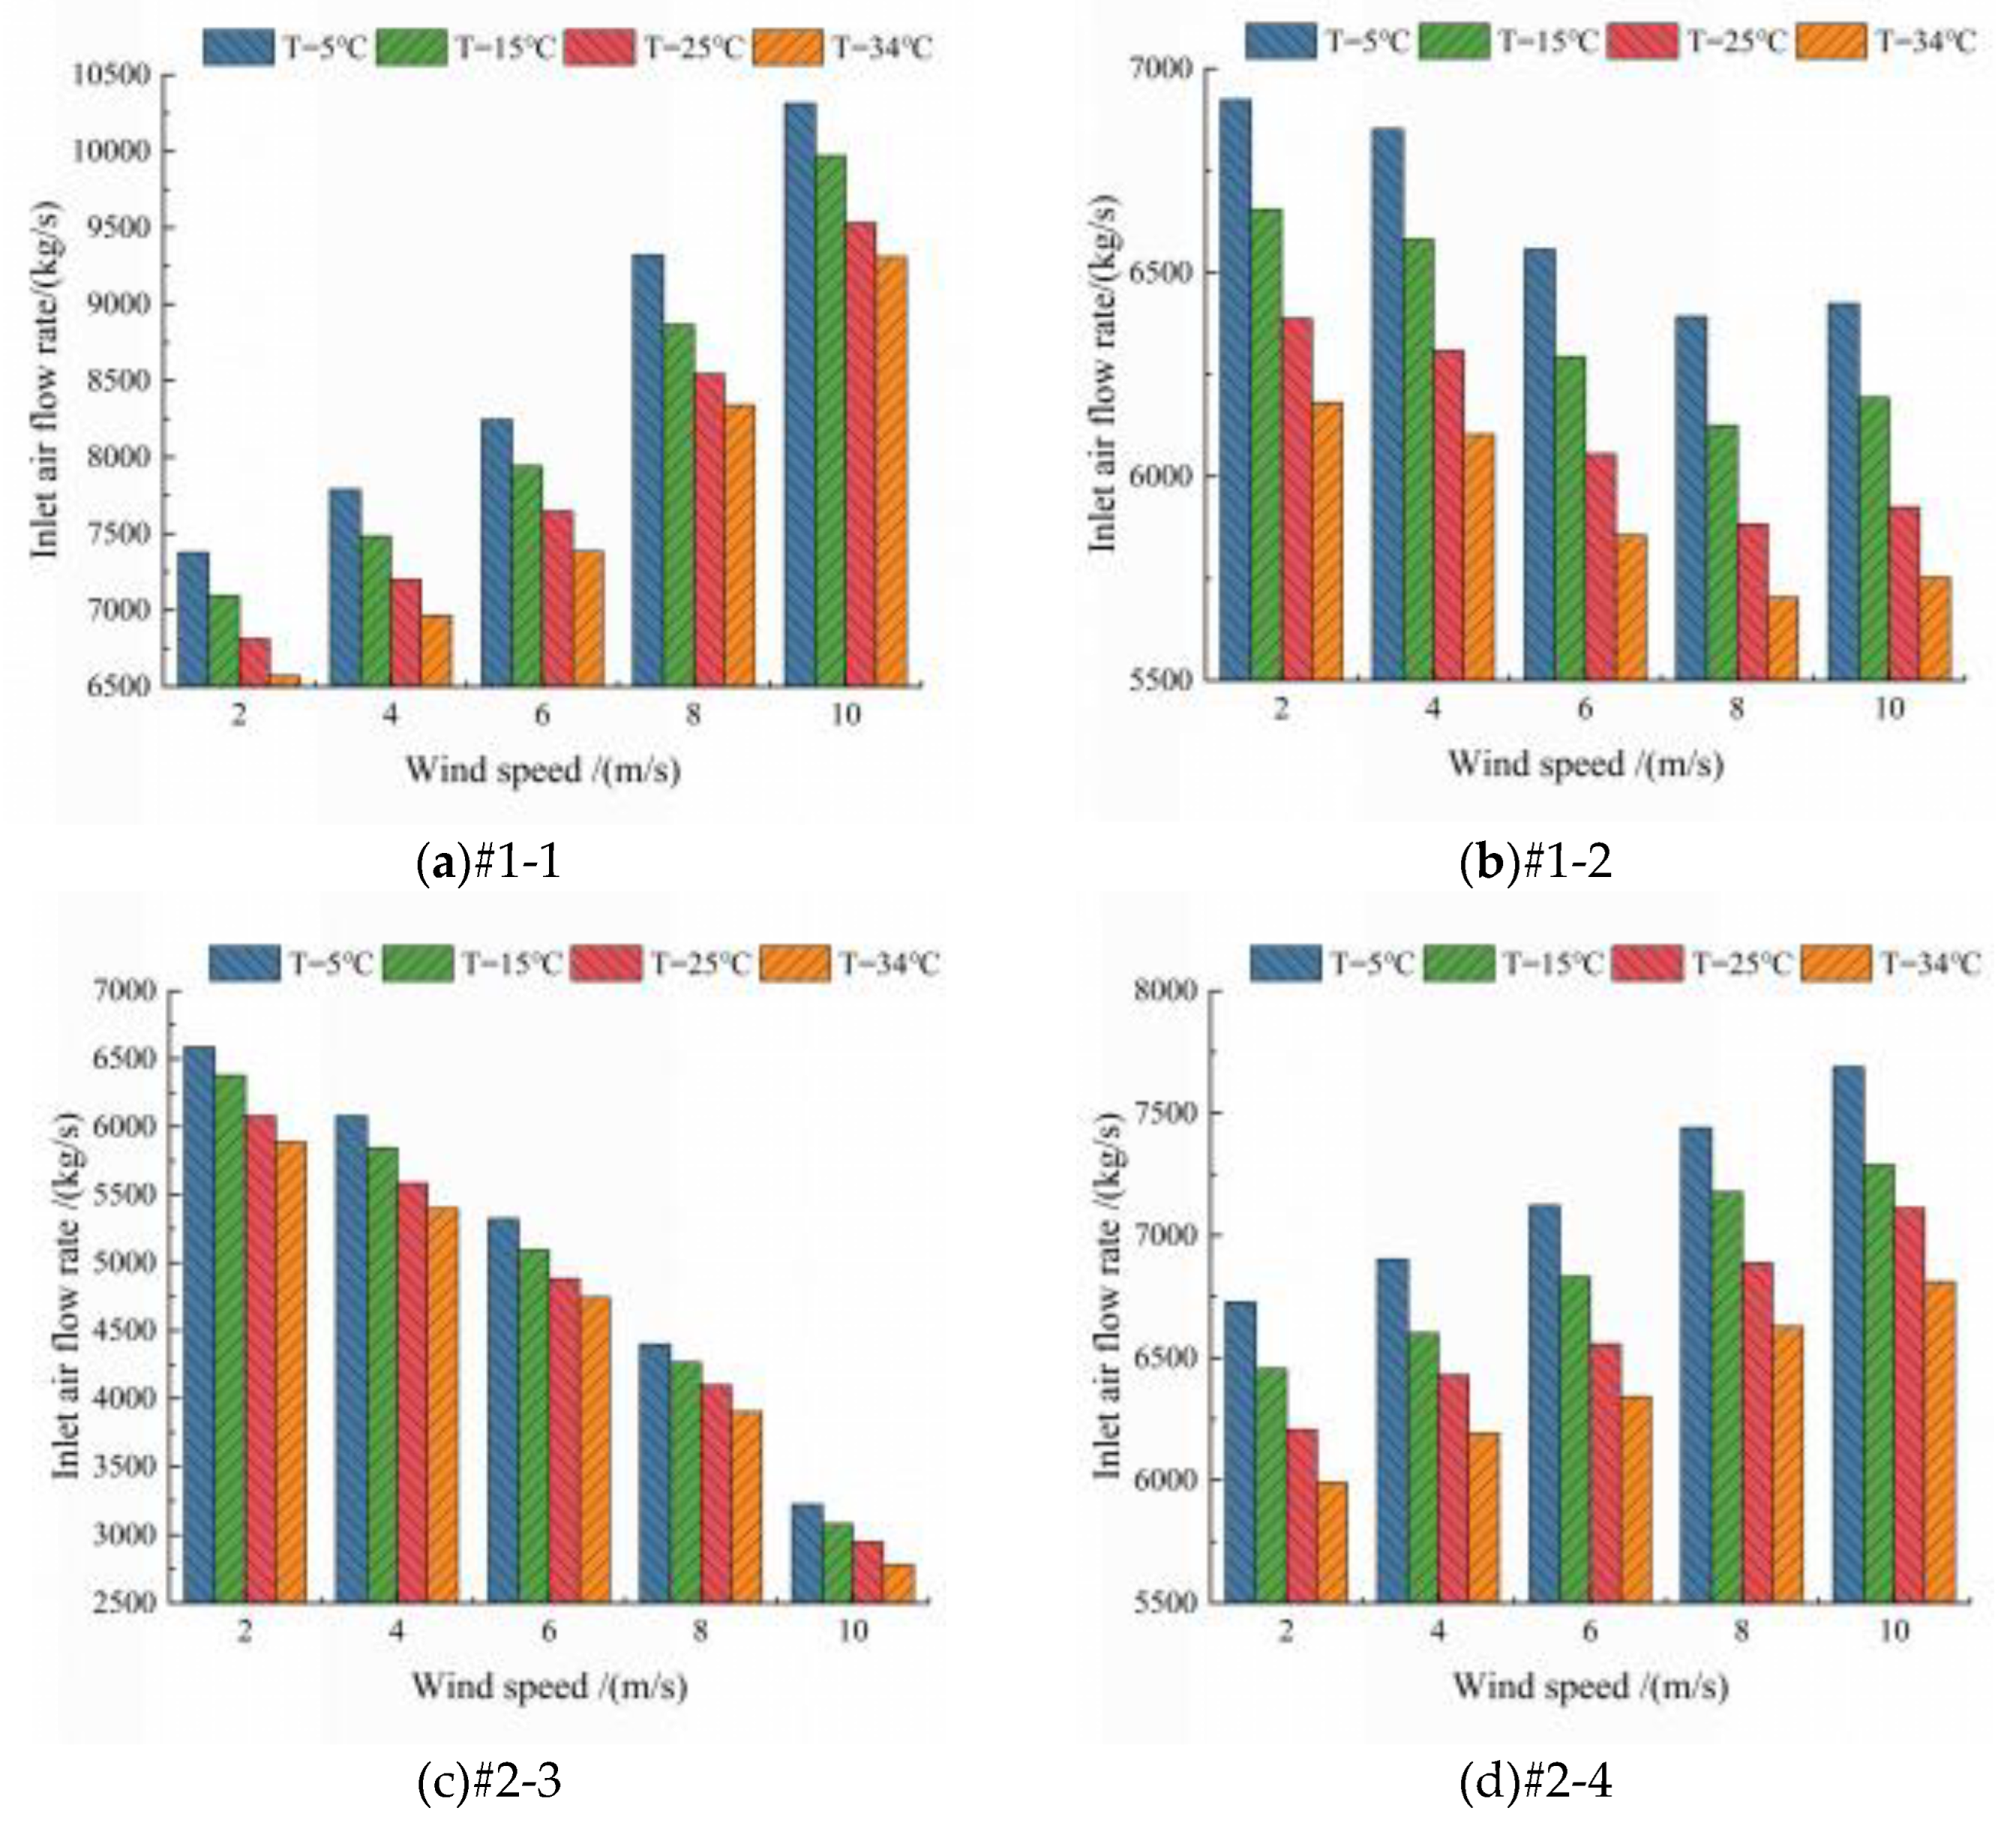
Figure 8.
The variation law of air temperature deviation at the inlet of each sector under the influence of ambient wind speed and ambient temperature.
Figure 8.
The variation law of air temperature deviation at the inlet of each sector under the influence of ambient wind speed and ambient temperature.
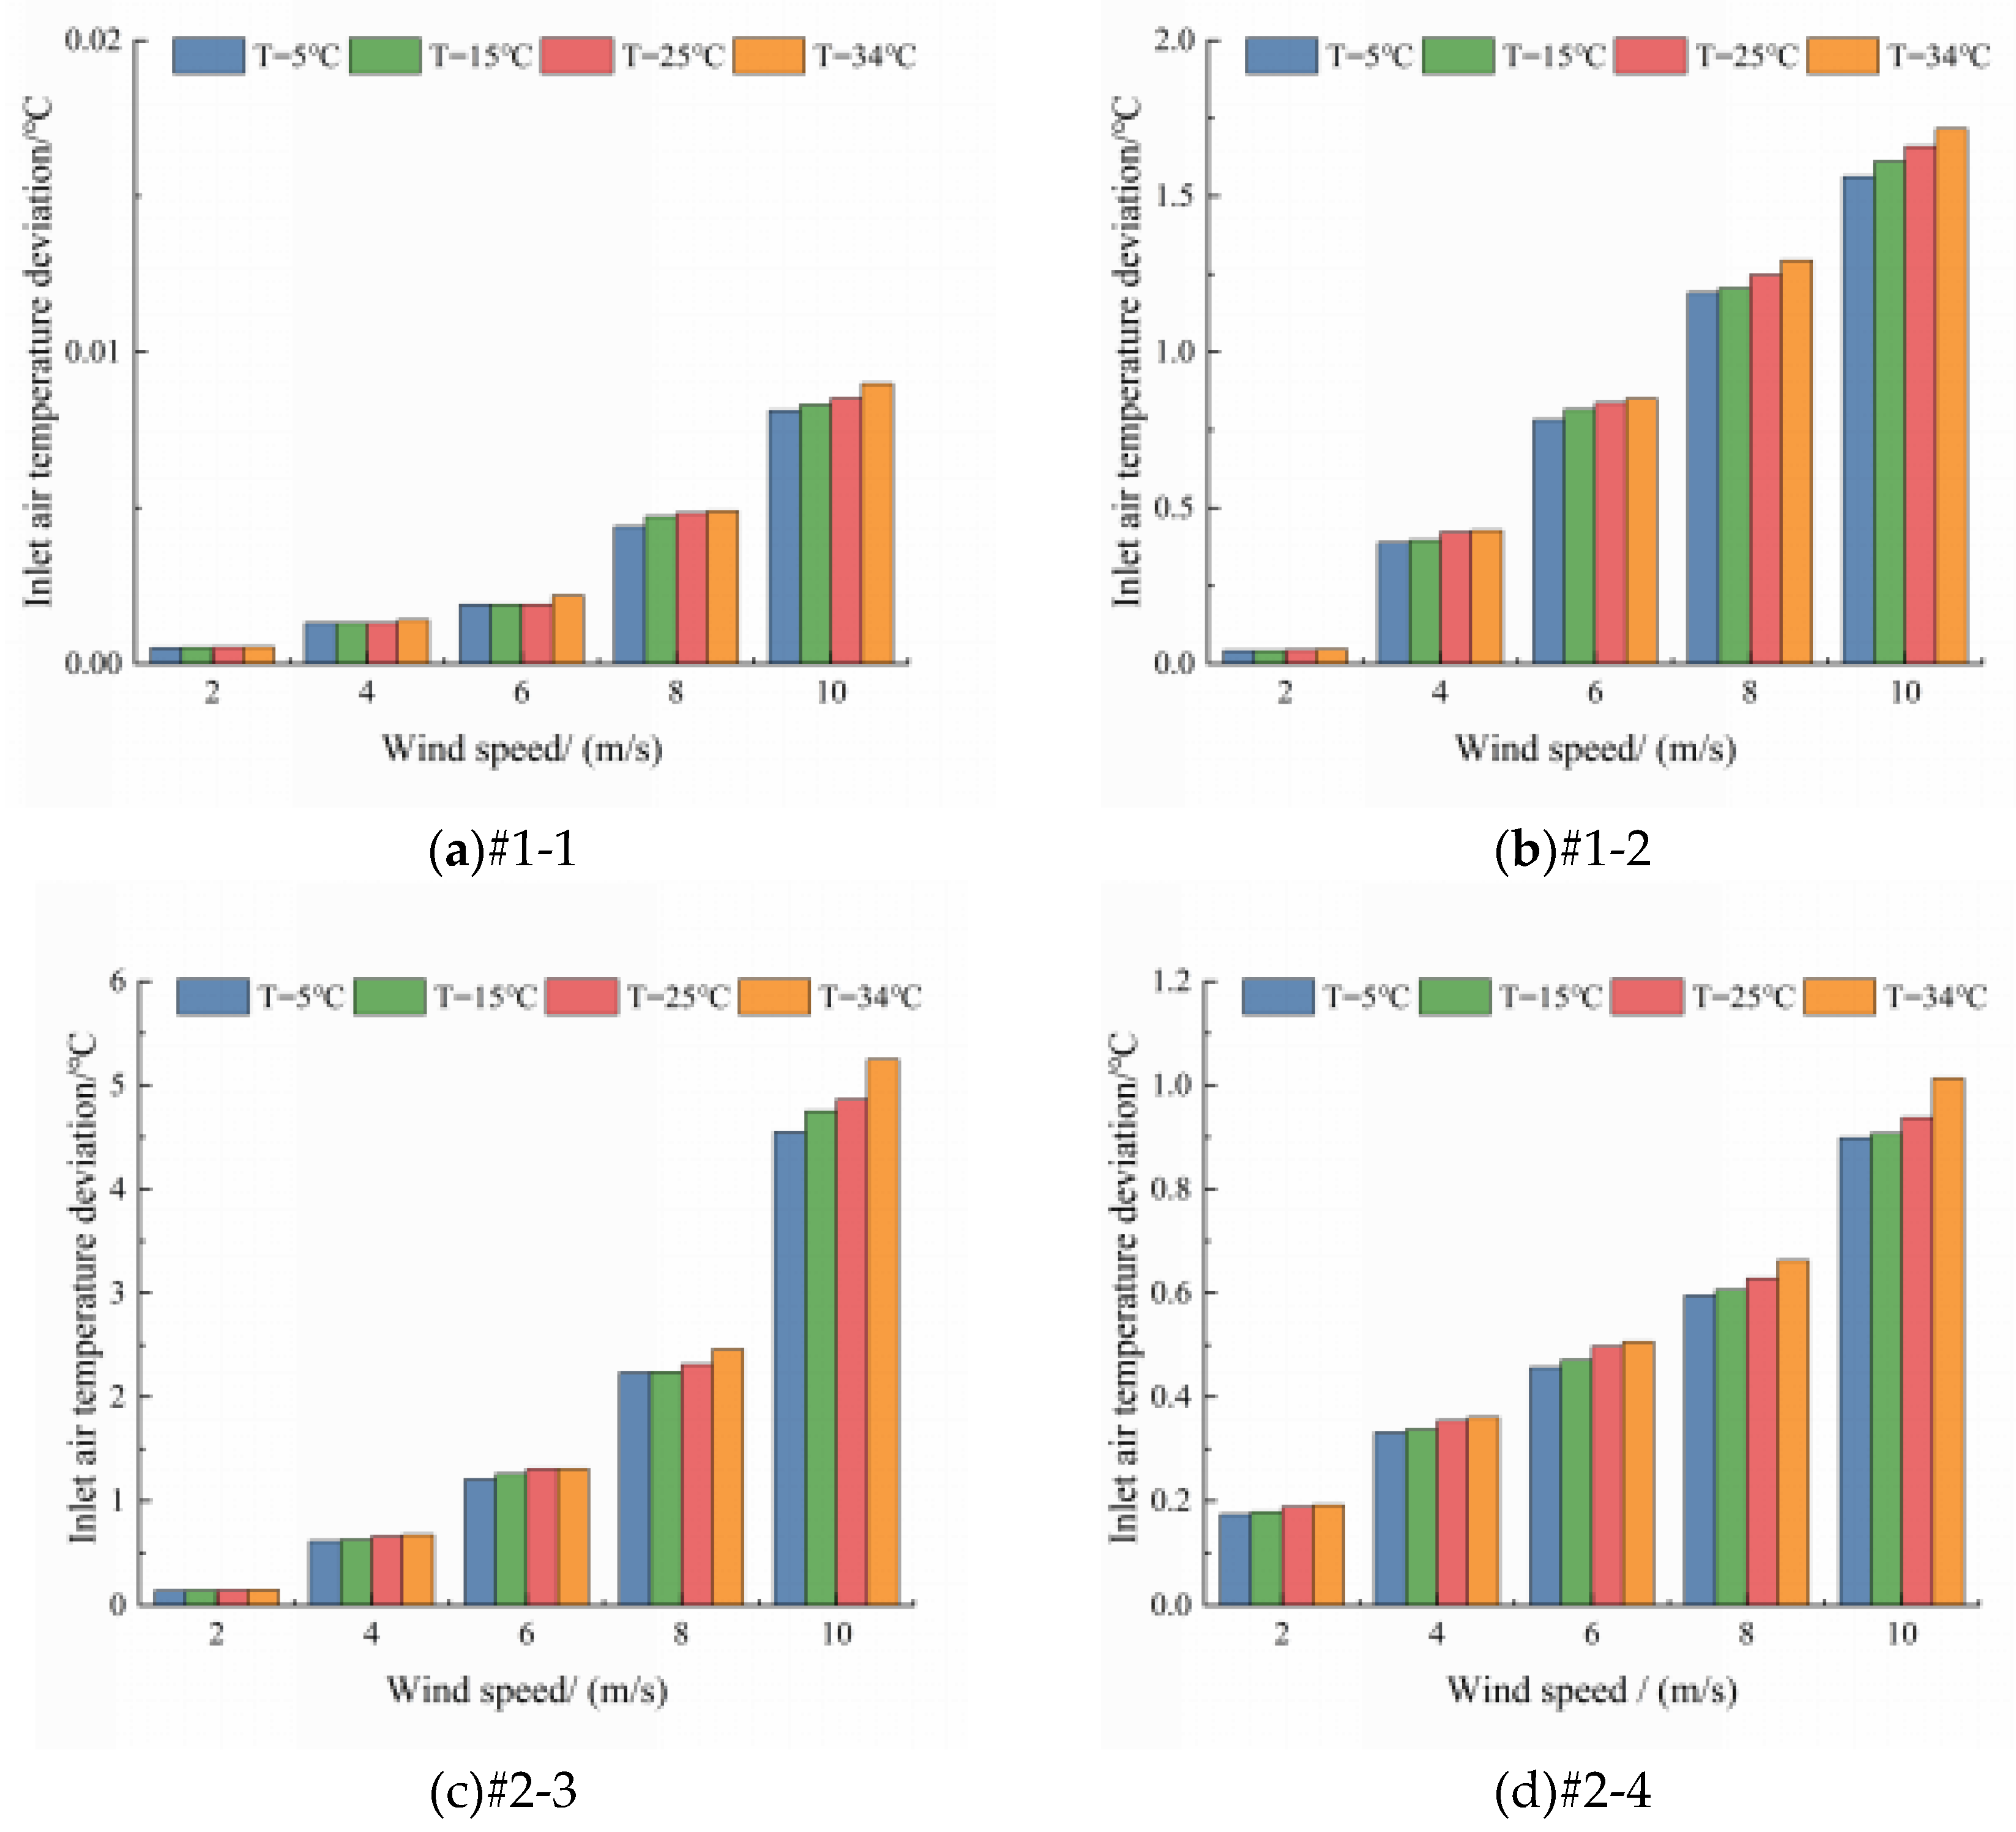
Figure 9.
The variation law of the proportion of heat transfer in each sector under the influence of ambient wind speed and ambient temperature is analyzed.
Figure 9.
The variation law of the proportion of heat transfer in each sector under the influence of ambient wind speed and ambient temperature is analyzed.
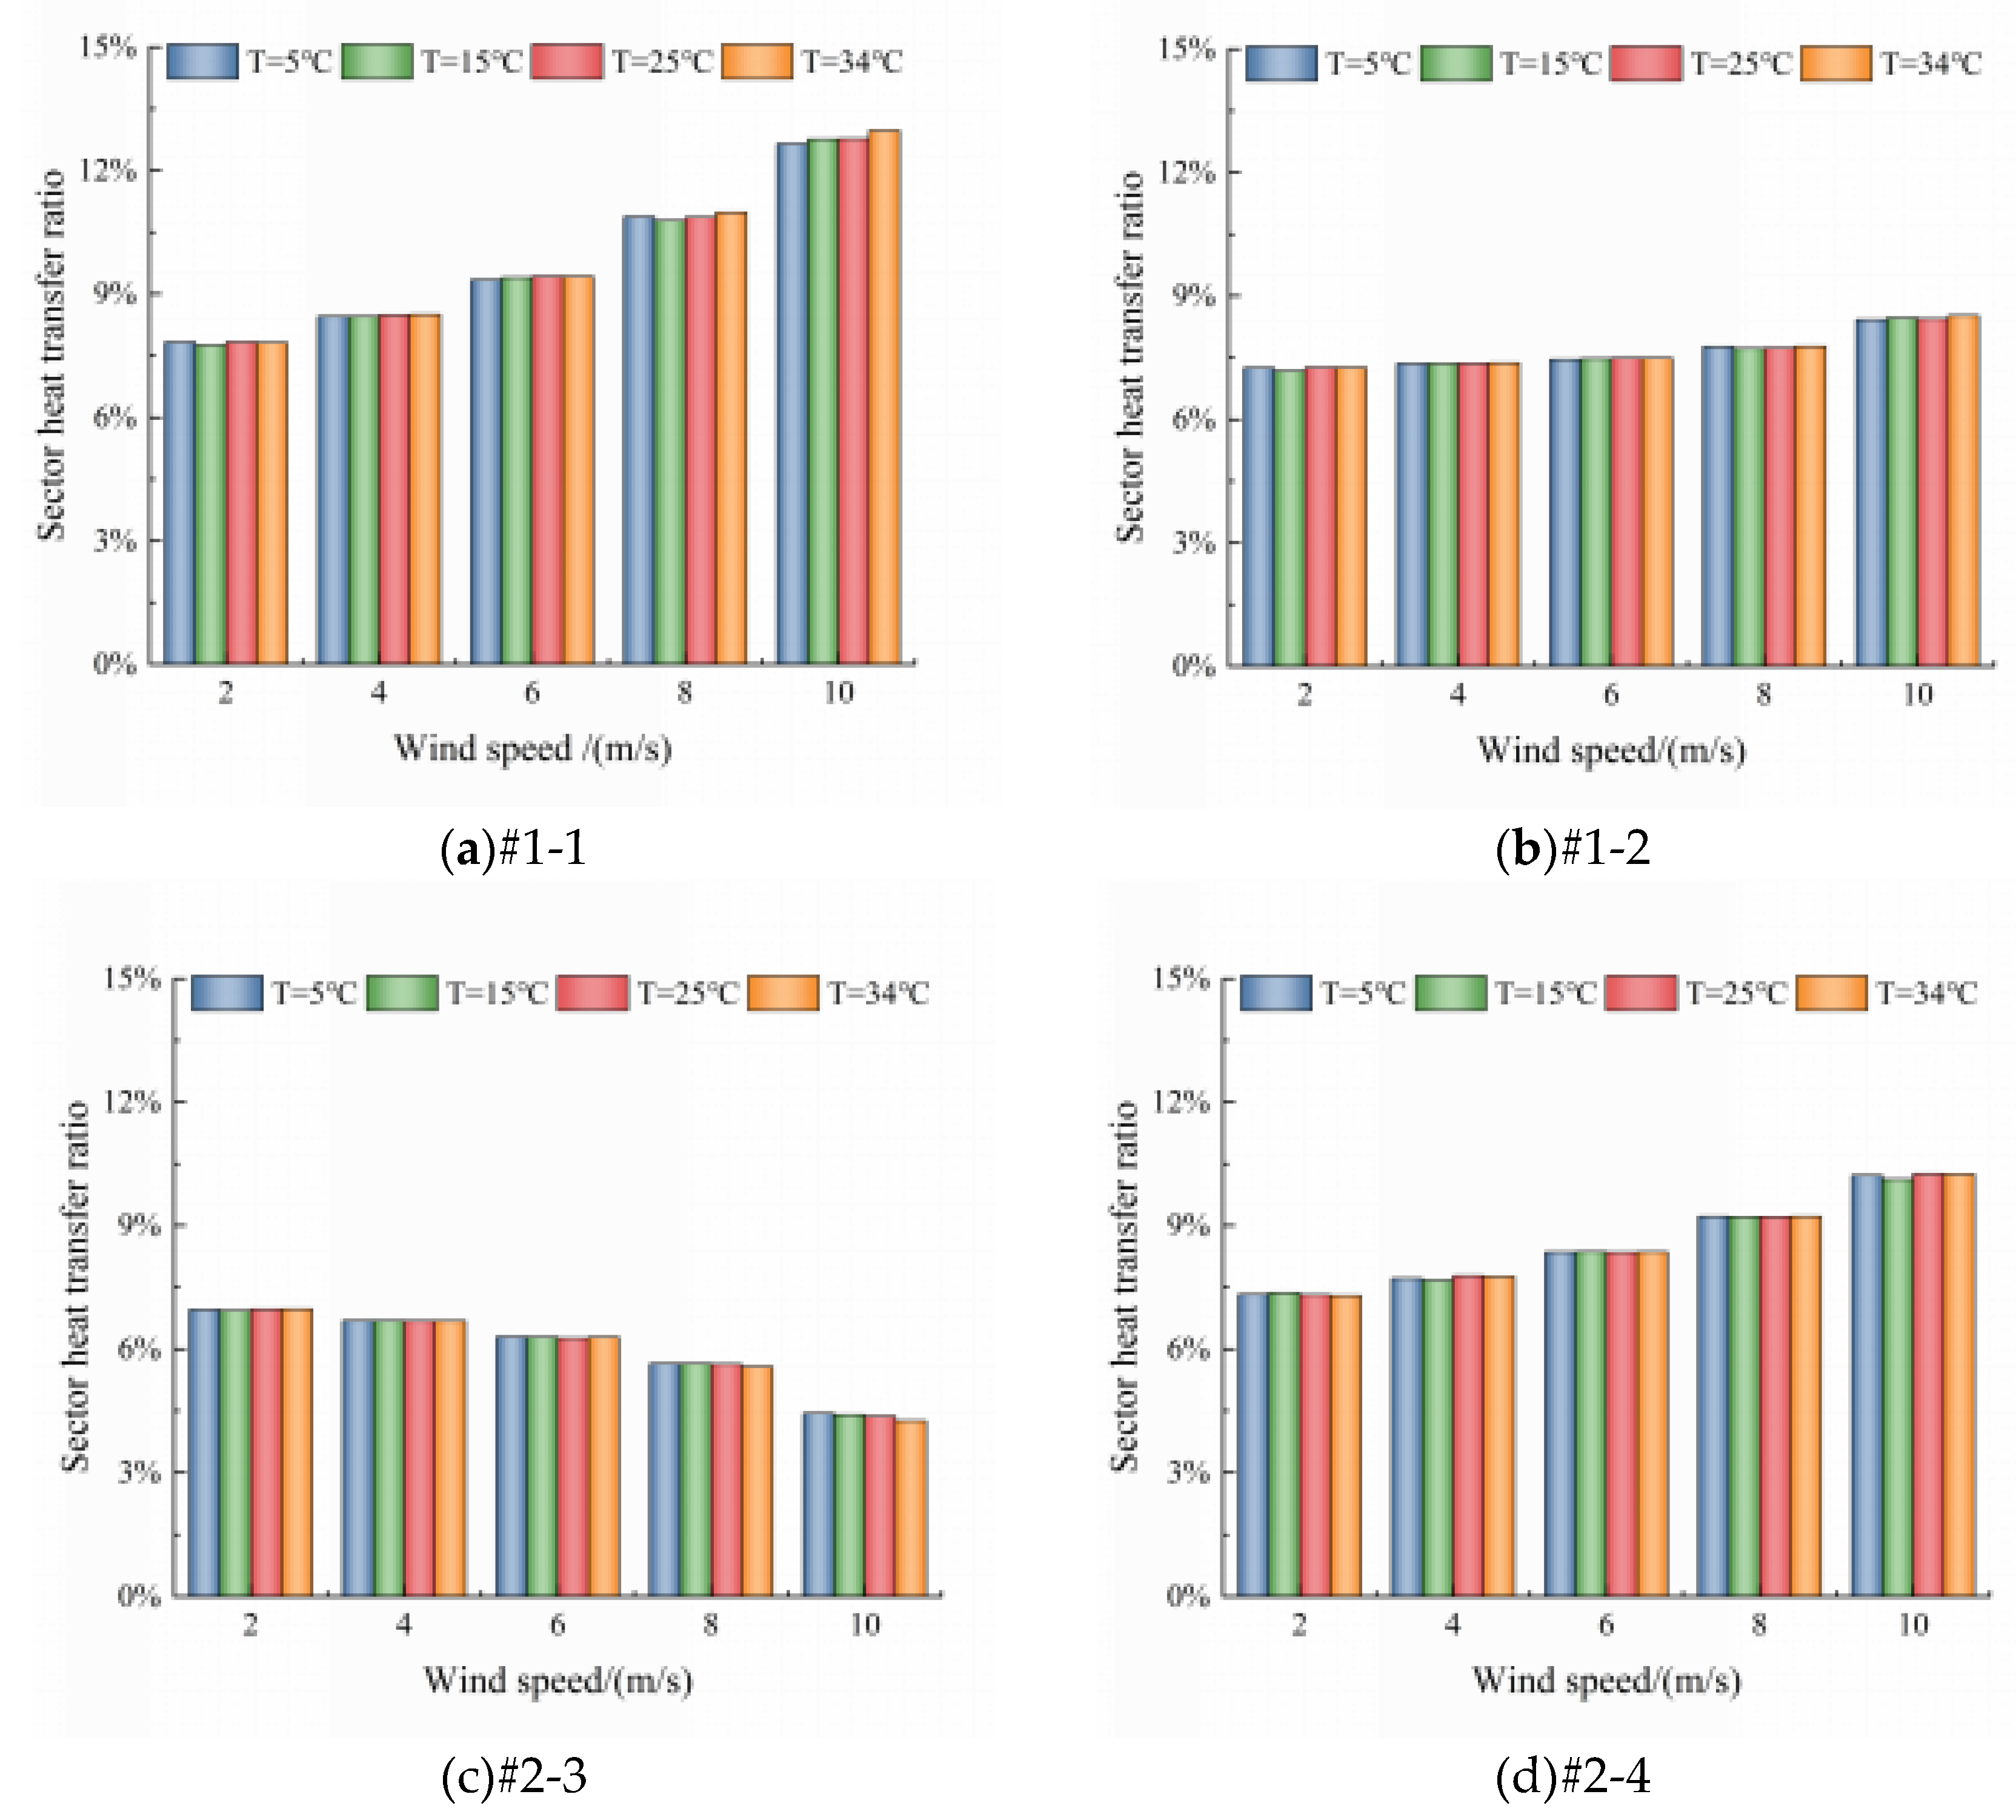
Figure 10.
Overall heat transfer fitting residual of IDCS.
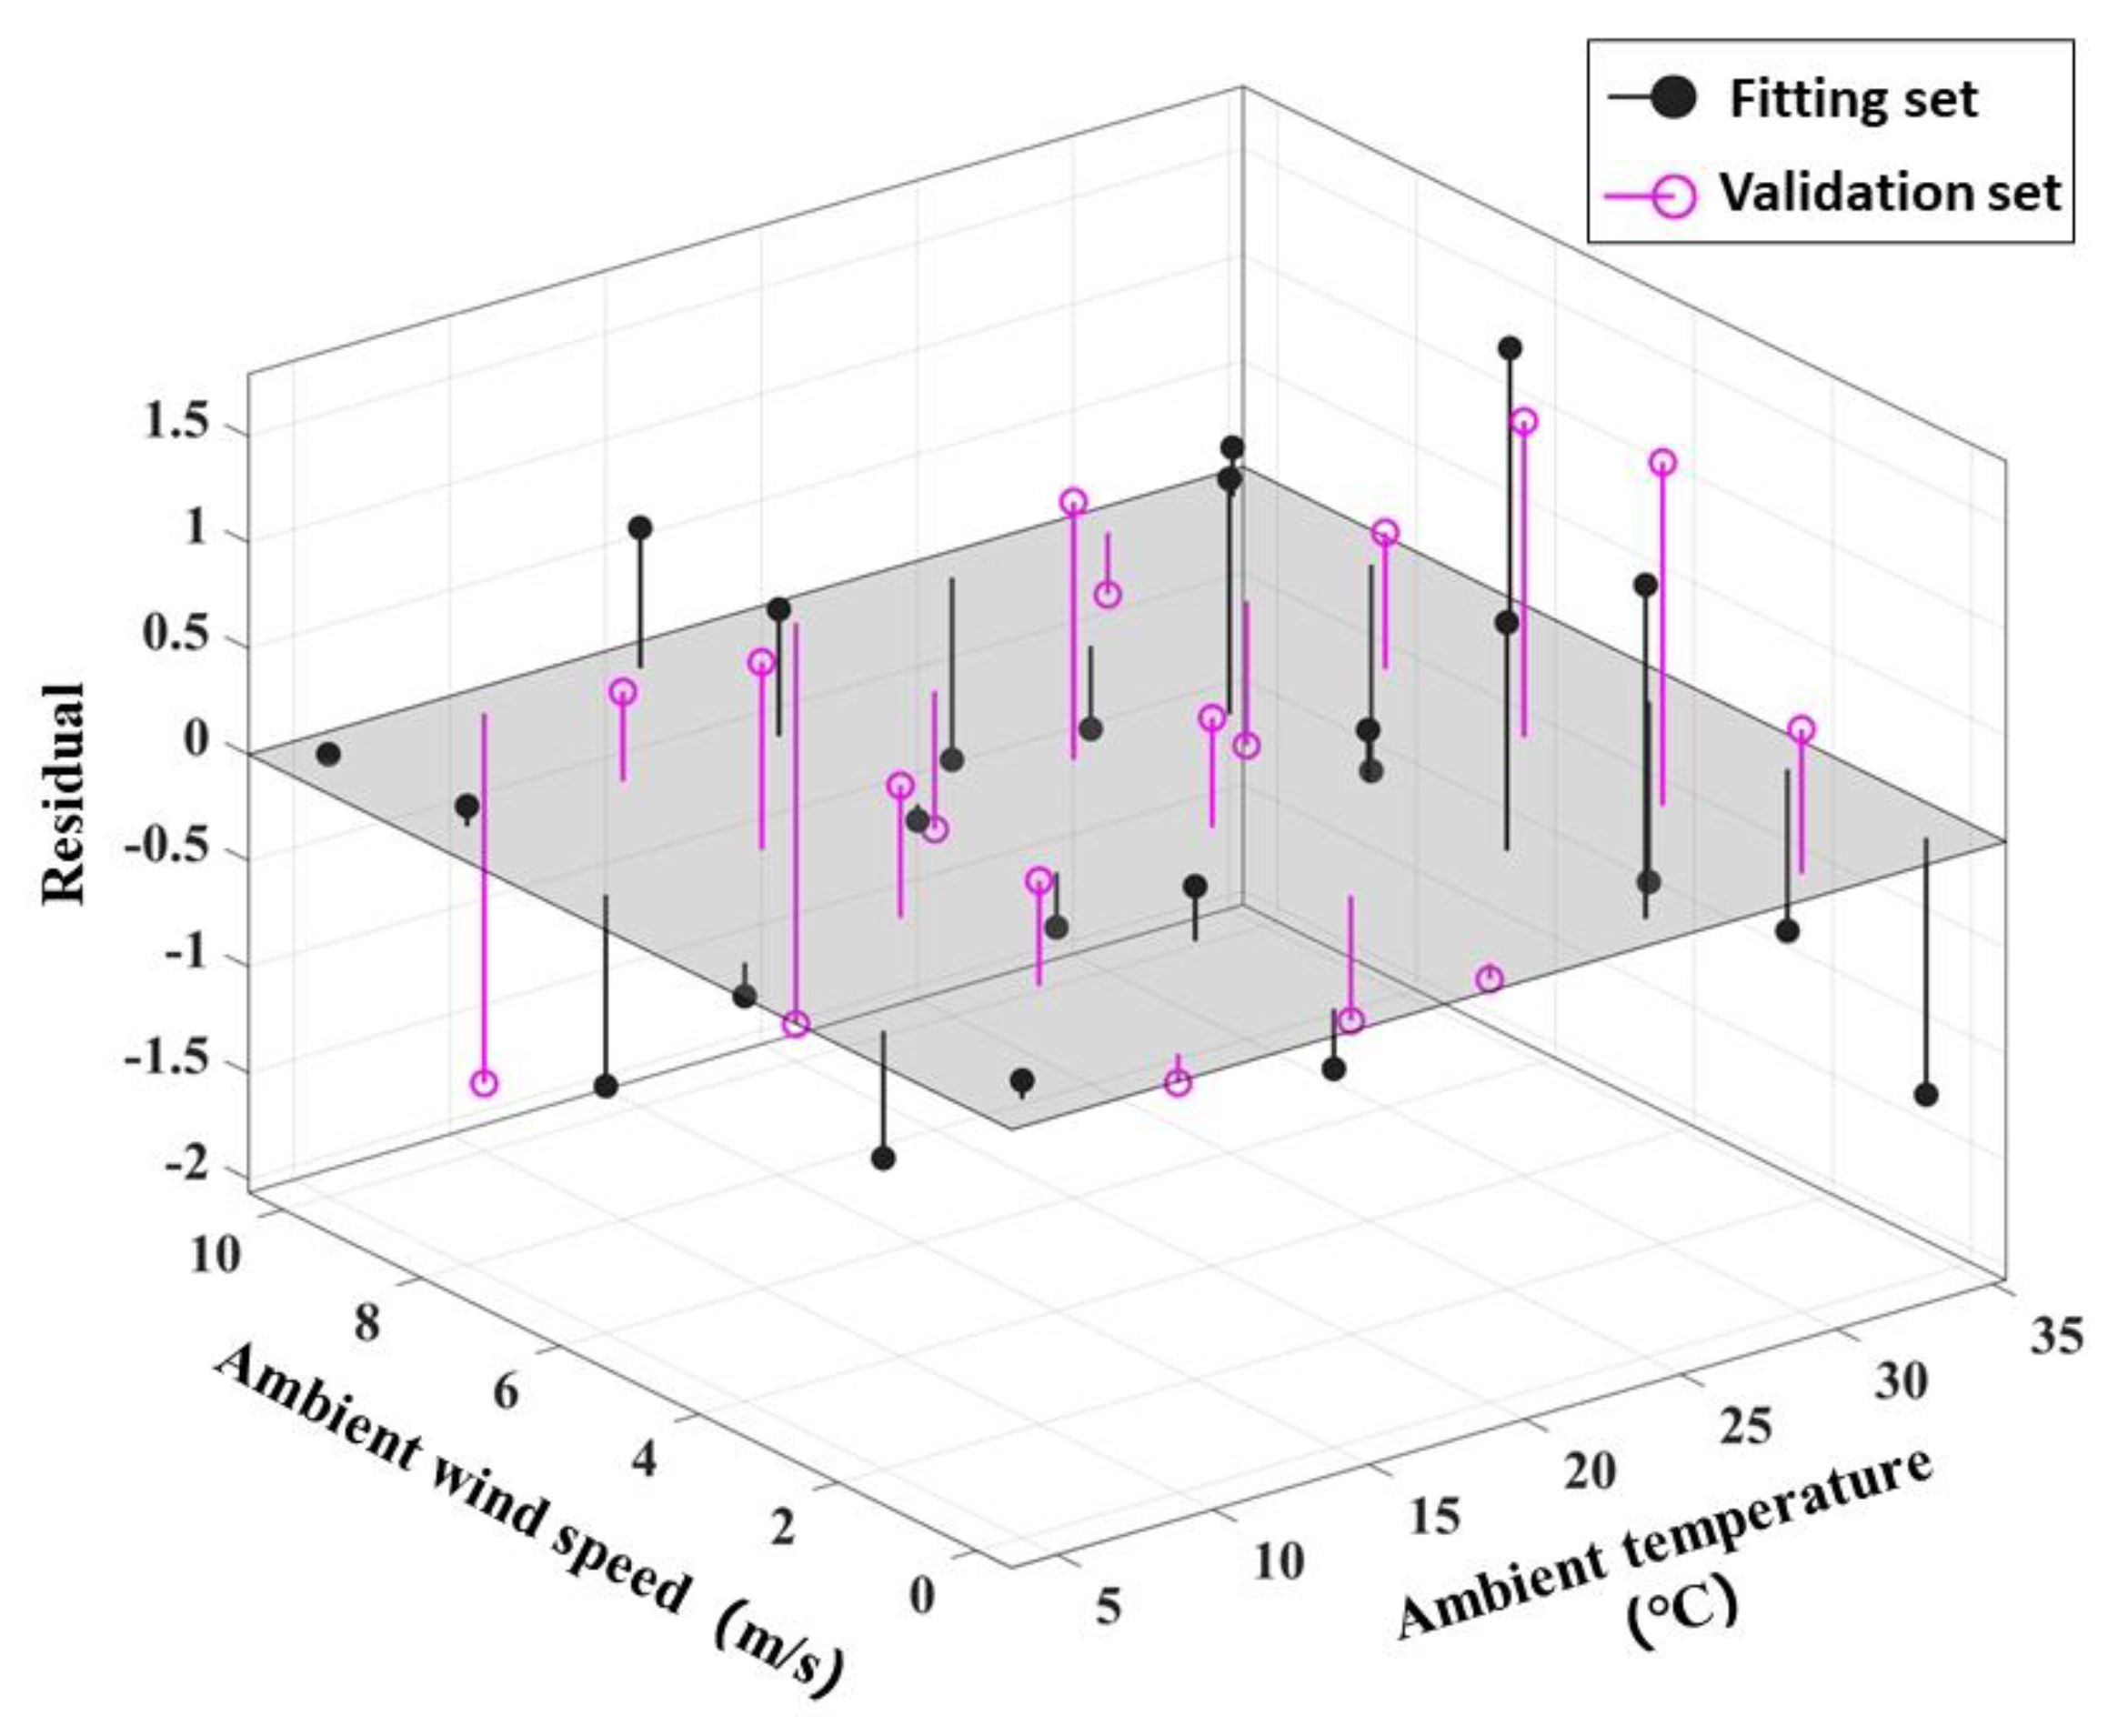
Figure 11.
Air flow fitting residual of each sector in IDCS.
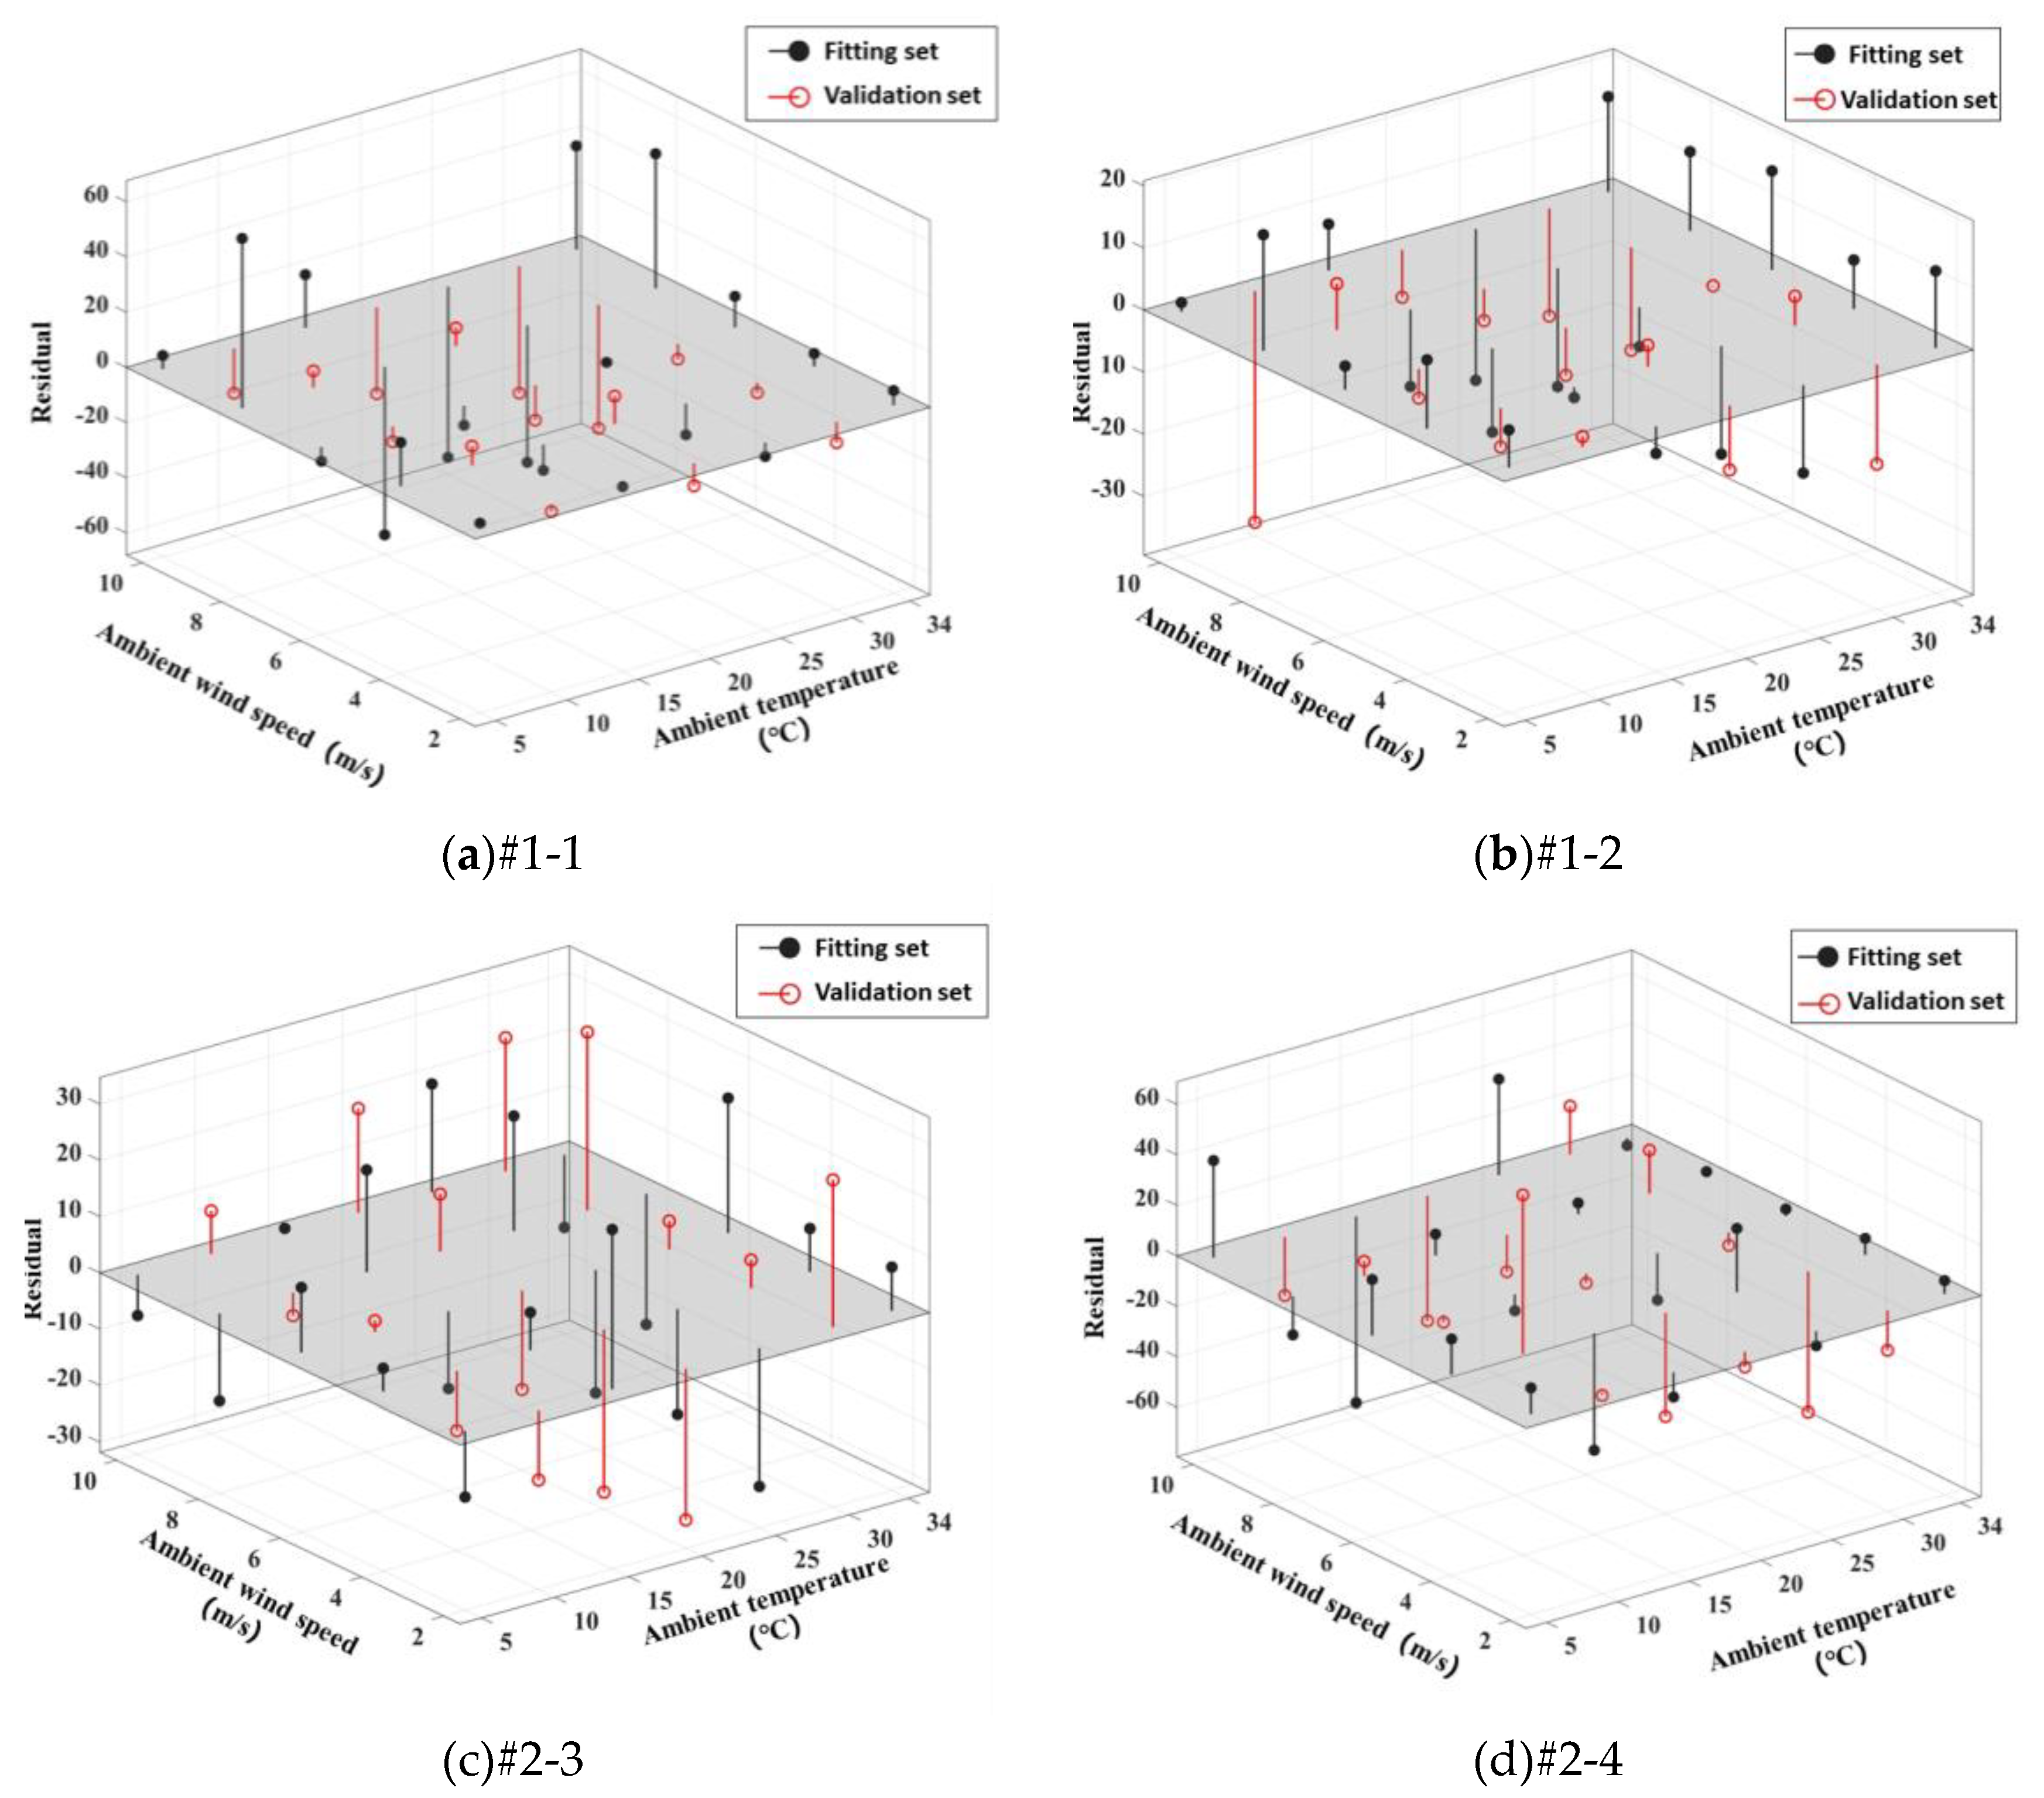
Figure 12.
IDCS of each sector inlet air temperature fitting residual error.
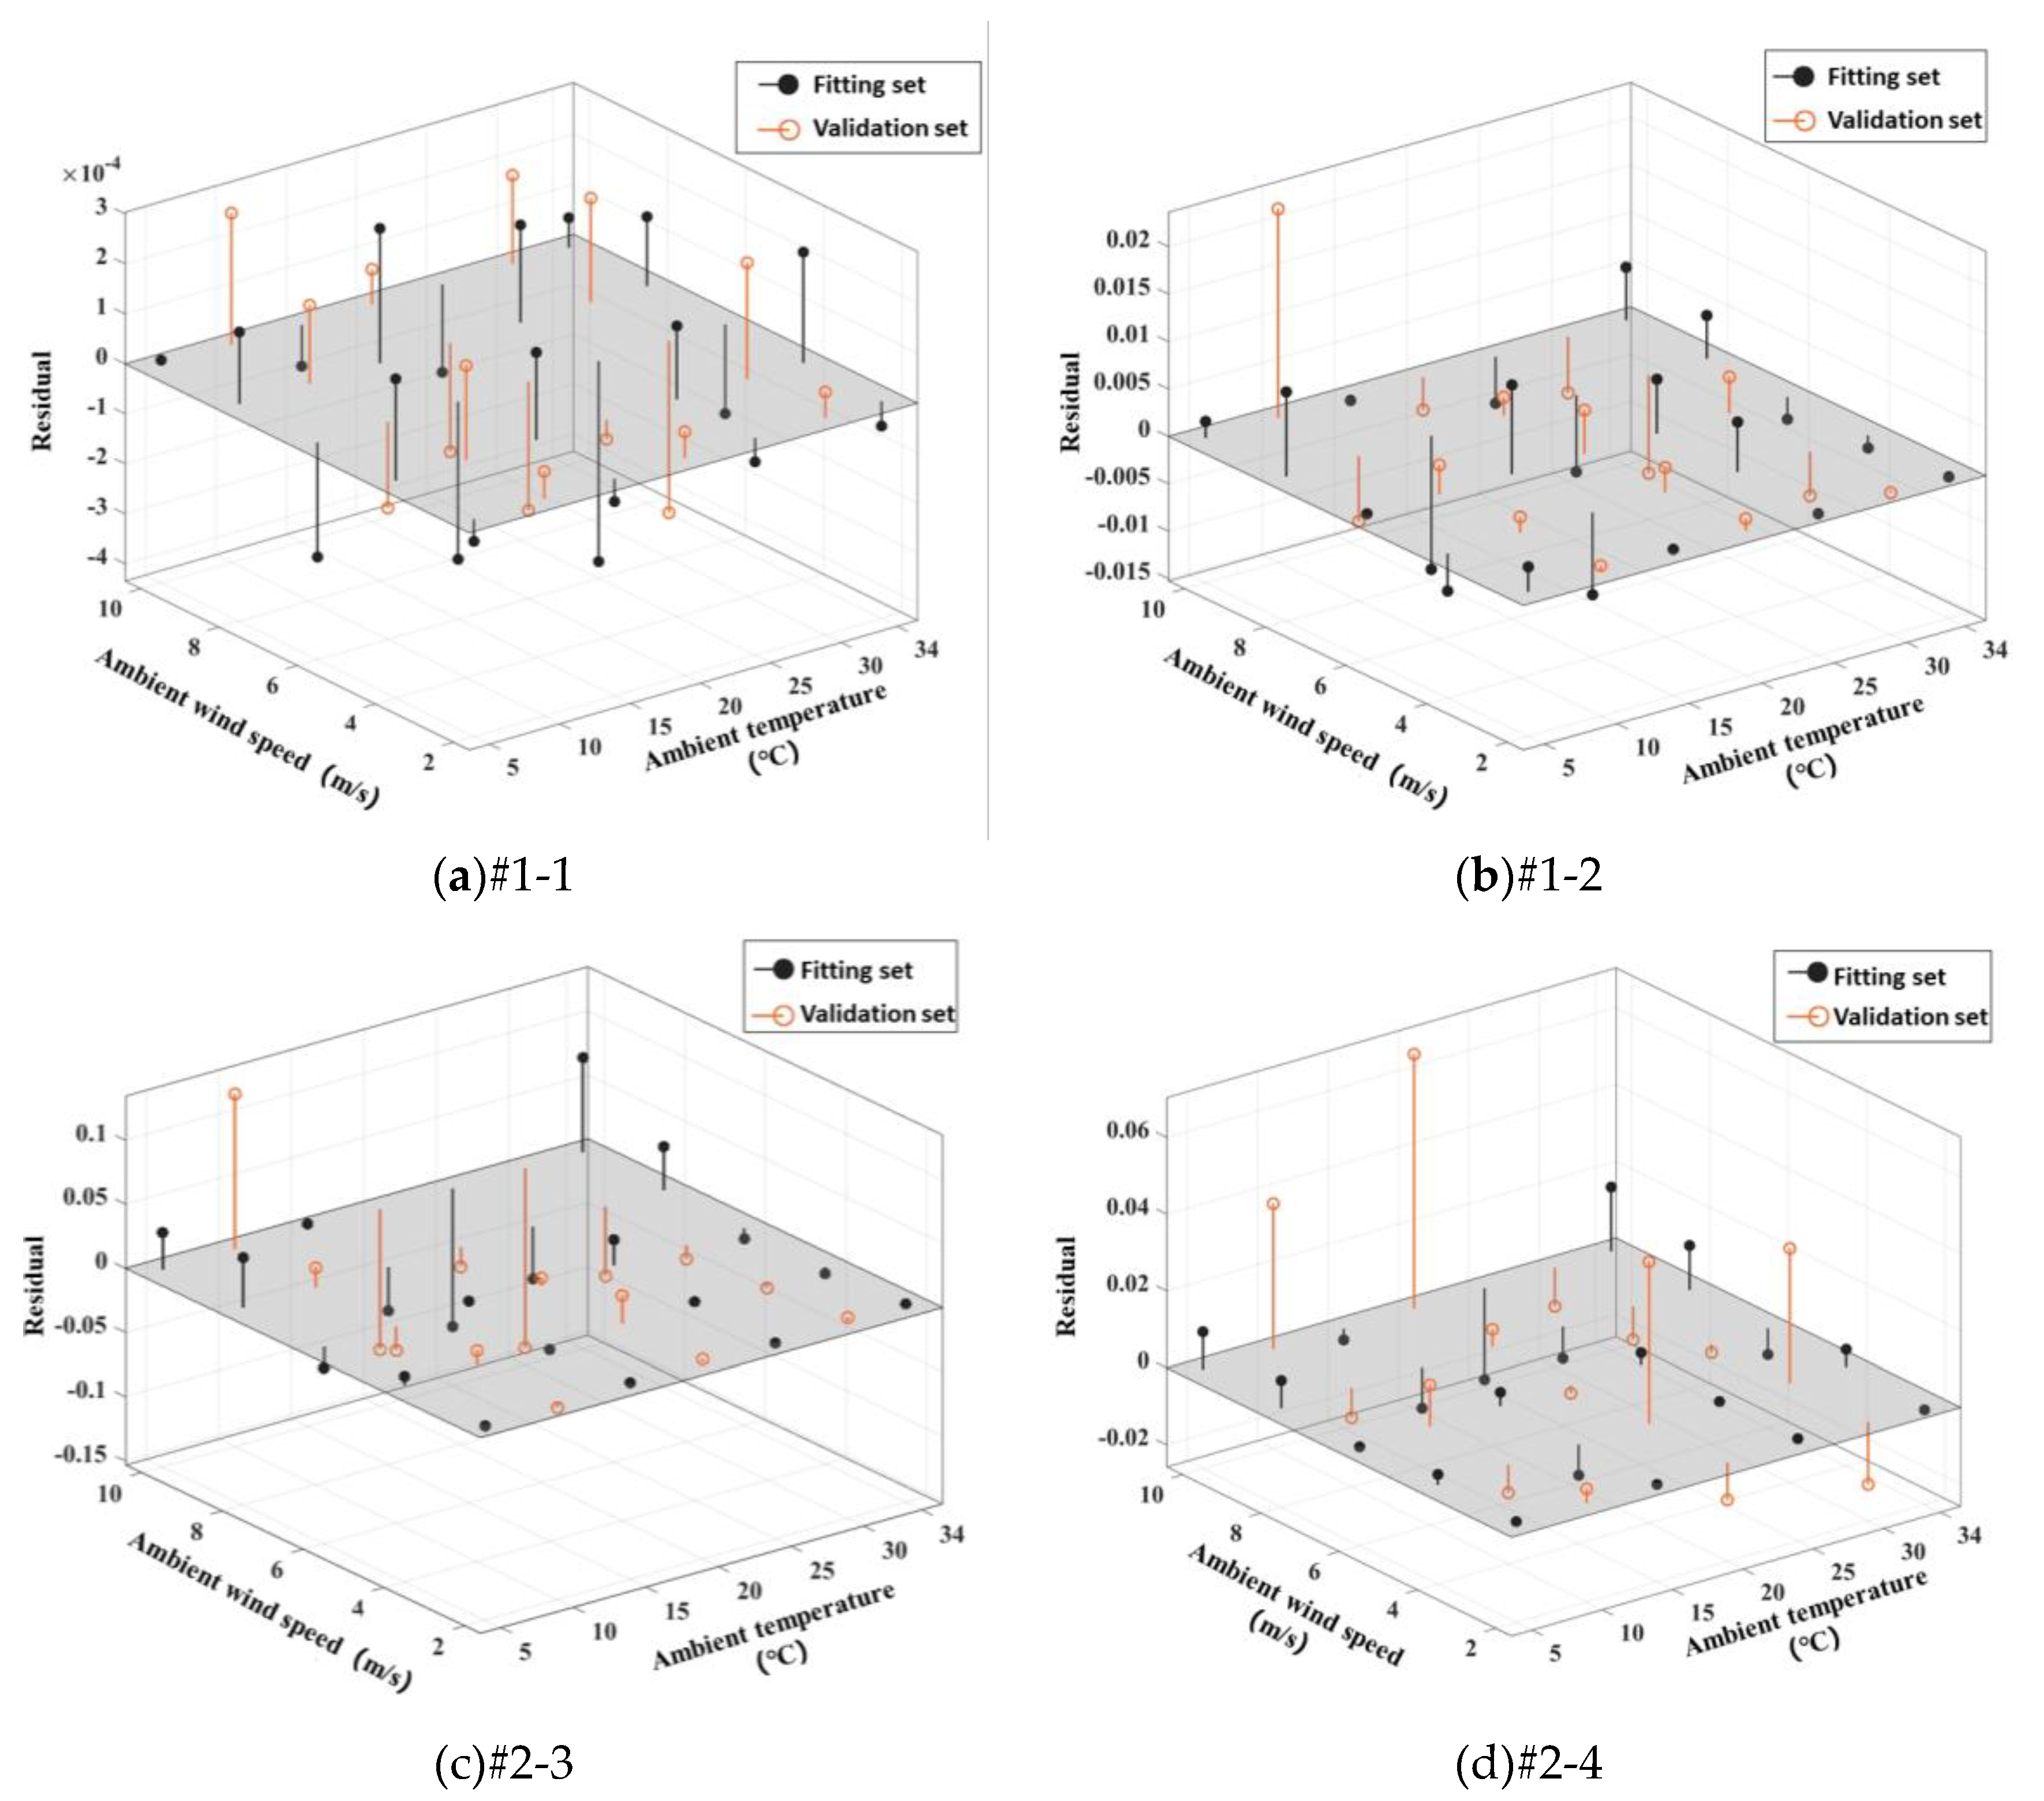
Figure 13.
Fitting residual error of heat transfer in each sector of IDCS.
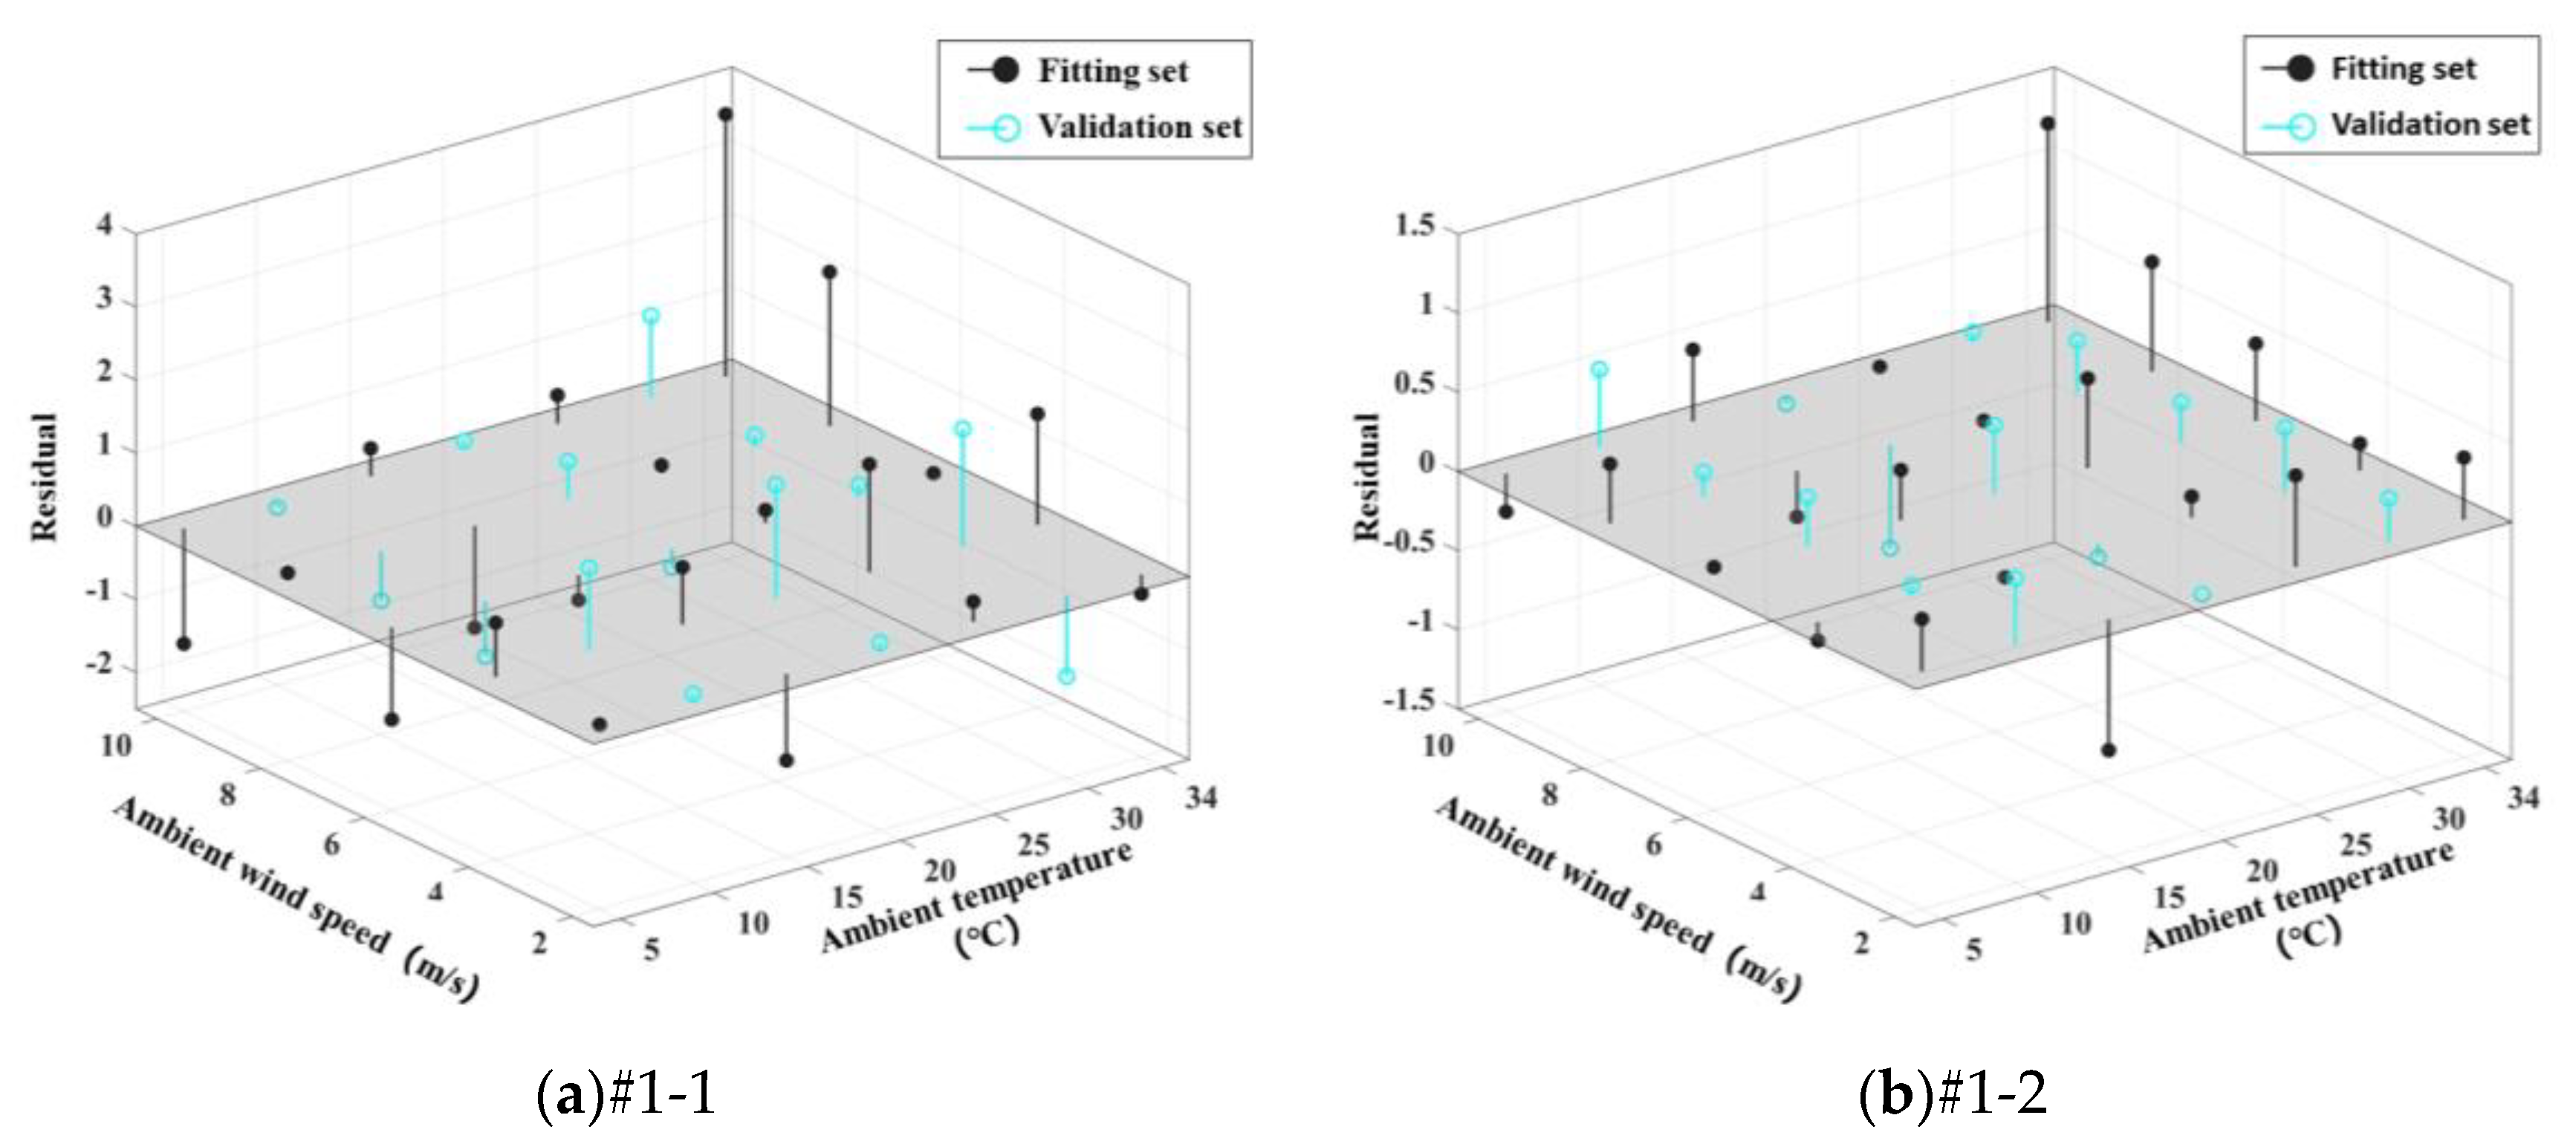
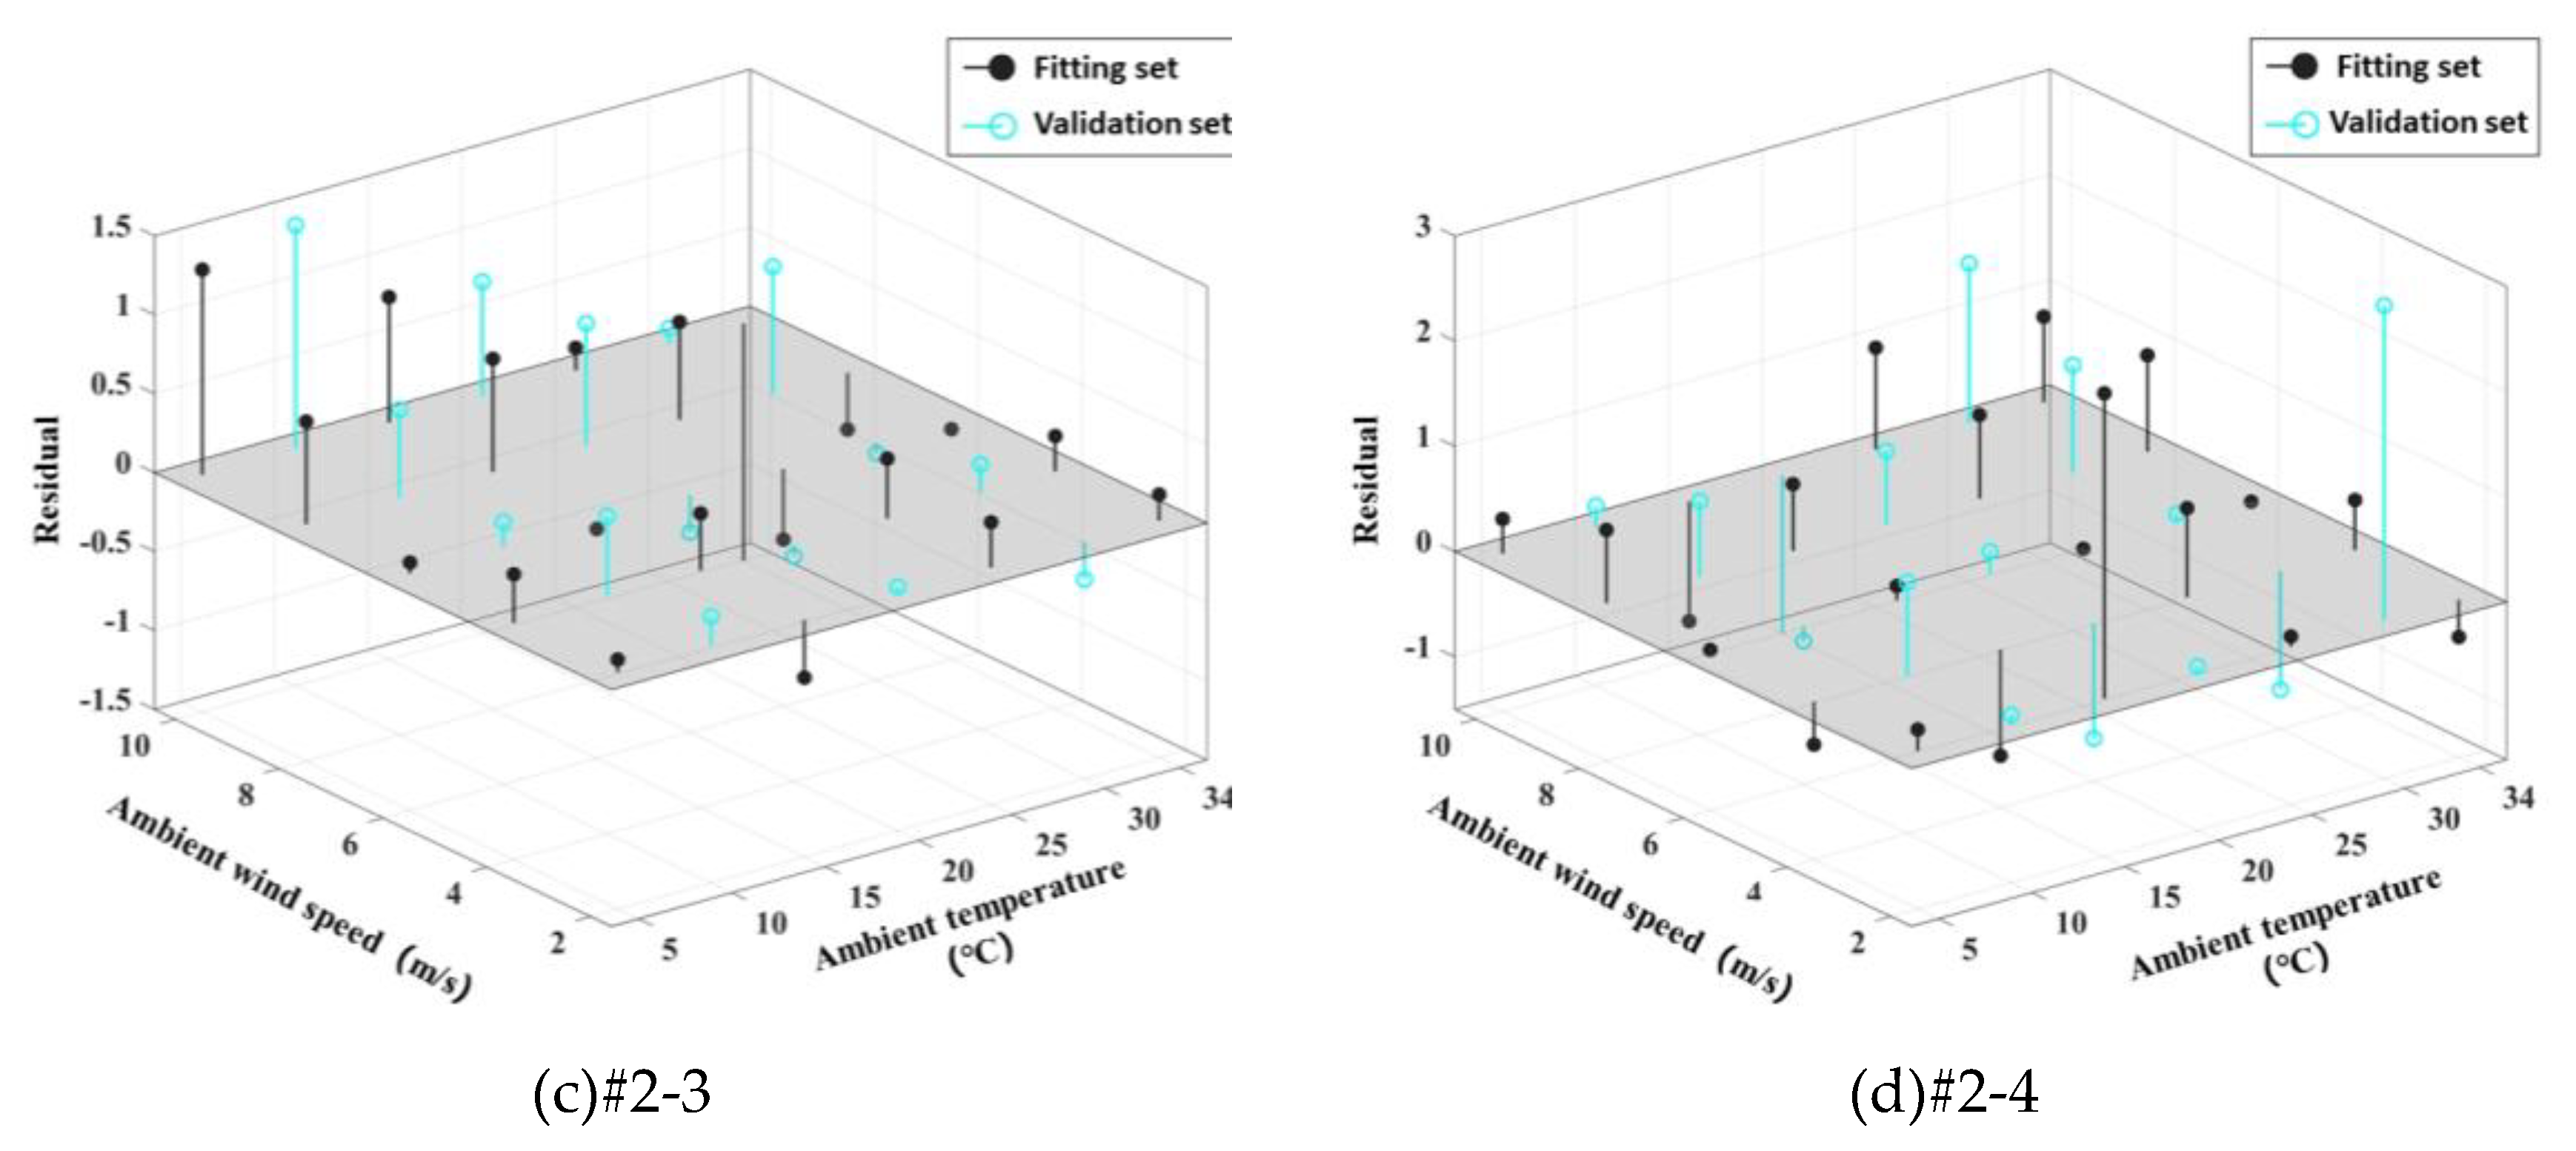

Table 1.
Main structures and parameters of the indirect dry cooling system.
| item | numerical value |
| Total height of the tower /m | 210 |
| Dry cooling tower inlet height / diameter /m | 36/161.5 |
| Dry cooling tower throat height / diameter /m | 168.6/117.4 |
| Outlet height / diameter of dry cooling tower /m | 210/122.4 |
| Outer edge diameter of dry cooling tower /m | 194.4 |
| Air-cooled radiator height /m | 34.9 |
| Number of cooling deltas Number of sectors |
214 14 |
Table 2.
Variable expression of control equation.
| equation | |||
| continuity equation | 1 | 0 | 0 |
| x-momentum equation | |||
| y-momentum equation | |||
| z-momentum equation | |||
| energy equation | 0 | ||
| turbulent kinetic equation | |||
| Turbulent dissipation rate equation |
Table 5.
Overall heat transfer fitting coefficient of IDCS.
| 1665.4 | -1.7399 | -0.3319 | -0.0040 | -0.0949 |
Table 6.
IDCS overall heat transfer fitting and verification results.
| Fitting | Validation | |||
| R2 | SSE/(MW)2 | RMSE/(MW) | SSE/(MW)2 | RMSE/(MW) |
| 0.9985 | 13.6183 | 0.8466 | 17.0229 | 0.9725 |
Table 7.
Air flow fitting coefficient of each sector in IDCS.
| #1-1 | #2-1 #2-7 |
#1-2 #1-7 |
#2-2 #2-6 |
#1-3 #1-6 |
#2-3 #2-5 |
#1-4 #1-5 |
#2-4 | |
| 5835.3 | 6027.7 | 6390 | 6720.6 | 6965.4 | 6610.2 | 6447.8 | 6229.3 | |
| -31.9605 | -27.8208 | -23.771 | -27.4285 | -26.8377 | -22.2784 | -14.2137 | -31.7043 | |
| 1510.4 | 1161.7 | 621.9313 | 220.3711 | -80.0402 | 313.7946 | 184.4448 | 553.2098 | |
| 3.1725 | 0.8383 | -1.7153 | 1.1353 | 1.2799 | -2.4432 | -7.9557 | 5.0337 | |
| -441.4075 | -333.6554 | -178.7736 | -113.1597 | -62.3628 | -159.7736 | -86.1287 | -165.335 | |
| -0.6696 | -0.2223 | 0.3985 | 0.0323 | 0.0584 | 0.6761 | 1.5109 | -1.0077 | |
| 58.1949 | 42.5023 | 16.8969 | 5.4837 | 1.3242 | 16.5999 | 12.0982 | 23.219 | |
| 0.0314 | 0.0094 | -0.0225 | 0 | 0 | -0.0359 | -0.0825 | 0.0533 | |
| -2.4506 | -1.7413 | -0.5089 | 0 | 0 | -0.7065 | -0.5225 | -1.0653 |
Table 8.
IDCS each sector air flow fitting and verification results.
| #1-1 | #2-1 #2-7 |
#1-2 #1-7 |
#2-2 #2-6 |
#1-3 #1-6 |
#2-3 #2-5 |
#1-4 #1-5 |
#2-4 | ||
| Fitting | R2 | 0.9992 | 0.9989 | 0.9985 | 0.9998 | 0.9997 | 0.9998 | 0.9953 | 0.9966 |
| SSE/(kg/s)2 | 18696 | 13164 | 3308.3 | 6948.8 | 16769 | 5564.7 | 7644.4 | 12865 | |
| RMSE/(kg/s) | 41.2266 | 34.5931 | 17.3423 | 23.1198 | 35.9155 | 22.4918 | 26.3618 | 34.1981 | |
| Validation | SSE/(kg/s)2 | 5958.5 | 5209.4 | 2619.7 | 1994.3 | 6463.6 | 4953.4 | 12257 | 12981 |
| RMSE/(kg/s) | 19.9308 | 18.6357 | 13.2153 | 11.5305 | 20.7583 | 18.1722 | 28.5853 | 29.4176 |
Table 9.
IDCS of each sector inlet air temperature fitting results.
| #1-1 | #2-1 #2-7 |
#1-2 #1-7 |
#2-2 #2-6 |
#1-3 #1-6 |
#2-3 #2-5 |
#1-4 #1-5 |
#2-4 | |
| -1.42e-4 | 0.0695 | -0.2449 | -0.36 | 1.1782 | 0.4982 | -0.0447 | 0.1479 | |
| 6.05e-7 | -0.0002 | -0.0006 | 0.0013 | -0.0096 | -0.0097 | -0.0096 | -0.0033 | |
| 4.8e-4 | -0.0692 | 0.1202 | 0.2462 | -1.2404 | -0.5887 | 0.081 | -0.0532 | |
| -9.86e-7 | 0.0001 | 0.0004 | -0.0006 | 0.0086 | 0.0078 | 0.0079 | 0.003 | |
| -9.49e-5 | 0.0207 | 0.0117 | -0.0062 | 0.5287 | 0.2738 | 0.0229 | 0.0414 | |
| 3.86e-7 | 0 | 0 | 0.0002 | -0.0021 | -0.0017 | -0.0014 | -0.0006 | |
| 1.27e-5 | -0.001 | -0.0006 | 0.0025 | -0.0767 | -0.0386 | -0.0033 | -0.0058 | |
| 0 | 0 | 0 | 0 | 0.0002 | 0.0001 | 0.0001 | 0 | |
| 0 | 0 | 0 | 0 | 0.0043 | 0.0021 | 0.0002 | 0.0003 |
Table 10.
IDCS of each sector inlet air temperature fitting and verification results.
| #1-1 | #2-1 #2-7 |
#1-2 #1-7 |
#2-2 #2-6 |
#1-3 #1-6 |
#2-3 #2-5 |
#1-4 #1-5 |
#2-4 | ||
| Fitting | R2 | 0.9959 | 0.9999 | 0.9999 | 0.9998 | 0.9994 | 0.9996 | 0.9995 | 0.9989 |
| SSE/K2 | 7.04e-7 | 0.0001 | 0.0007 | 0.0078 | 0.1174 | 0.0242 | 0.0034 | 0.0015 | |
| RMSE/K | 0.0002 | 0.0024 | 0.0072 | 0.0245 | 0.1033 | 0.0469 | 0.0175 | 0.0116 | |
| Validation | SSE/K2 | 5.36e-7 | 0.0001 | 0.0008 | 0.0098 | 0.2886 | 0.051 | 0.0131 | 0.0097 |
| RMSE/K | 0.0002 | 0.0027 | 0.0072 | 0.0256 | 0.1387 | 0.0583 | 0.0296 | 0.0254 |
Table 11.
The heat transfer fitting of each sector of IDCS.
| #1-1 | #2-1 #2-7 |
#1-2 #1-7 |
#2-2 #2-6 |
#1-3 #1-6 |
#2-3 #2-5 |
#1-4 #1-5 |
#2-4 | |
| 0.0768 | 0.0706 | 0.0684 | 0.0674 | 0.0713 | 0.0740 | 0.0721 | 0.0710 | |
| -3.51e-4 | 0.0021 | 0.0030 | 0.0028 | -0.0015 | -0.0029 | -0.0027 | 6.00e-4 | |
| 5.44e-4 | -5.95e-5 | -6.10e-4 | -9.13e-4 | -1.24e-5 | 4.77e-4 | 5.83e-4 | 2.52e-4 | |
| 0 | 2.73e-5 | 4.72e-5 | 3.85e-5 | -4.00e-5 | -4.86e-5 | -1.85e-5 | 0 |
Table 12.
IDCS of each sector inlet air temperature fitting and verification results.
| #1-1 | #2-1 #2-7 |
#1-2 #1-7 |
#2-2 #2-6 |
#1-3 #1-6 |
#2-3 #2-5 |
#1-4 #1-5 |
#2-4 | ||
| Fitting | R2 | 0.9981 | 0.9980 | 0.9953 | 0.9986 | 0.9991 | 0.9984 | 0.9841 | 0.9971 |
| SSE | 31.0577 | 19.0462 | 4.5496 | 7.3316 | 18.1937 | 7.4053 | 28.1505 | 16.1217 | |
| RMSE | 1.2461 | 0.9759 | 0.4769 | 0.6055 | 0.9538 | 0.6085 | 1.1864 | 0.8978 | |
| Validation | SSE | 10.2101 | 4.0782 | 1.5908 | 3.2077 | 5.5771 | 4.5898 | 25.4790 | 23.9101 |
| RMSE | 0.8250 | 0.5214 | 0.3257 | 0.4624 | 0.6098 | 0.5532 | 1.3033 | 1.2625 |
Disclaimer/Publisher’s Note: The statements, opinions and data contained in all publications are solely those of the individual author(s) and contributor(s) and not of MDPI and/or the editor(s). MDPI and/or the editor(s) disclaim responsibility for any injury to people or property resulting from any ideas, methods, instructions or products referred to in the content. |
© 2026 by the authors. Licensee MDPI, Basel, Switzerland. This article is an open access article distributed under the terms and conditions of the Creative Commons Attribution (CC BY) license (http://creativecommons.org/licenses/by/4.0/).
Copyright: This open access article is published under a Creative Commons CC BY 4.0 license, which permit the free download, distribution, and reuse, provided that the author and preprint are cited in any reuse.