

Submitted:
06 August 2026
Posted:
07 August 2026
You are already at the latest version
Abstract
Fine particulate matter (PM2.5) is a major air pollutant in South Asian cities; however, information on its carbonaceous composition and multi-wavelength optical properties remains limited for Lahore, Pakistan. This study investigated PM2.5 collected at an urban site in Lahore between 15 March and 29 April 2025. A total of 30 filter samples were collected; owing to sample losses during transportation, 25 filters were available for gravimetric and optical analyses, while a subset of 15 filters, selected to cover the sampling period and a broad range of PM2.5 concentrations, was used for carbonaceous aerosol analysis. Aerosol light absorption was determined using the Multi-Wavelength Absorbance Analyzer (MWAA) at five wavelengths (375, 407, 532, 635, and 850 nm). PM2.5 concentrations ranged from 40 to 417 μg m⁻³, with an average of 137 ± 84 μg m⁻³, indicating severe particulate pollution throughout the sampling period. Organic carbon was the dominant carbonaceous component, contributing 76.6% of total carbon, whereas elemental carbon accounted for 23.4%. The MWAA measurements showed the expected decrease in aerosol absorption with increasing wavelength, reflecting the spectral behaviour of carbonaceous aerosols. The average Absorption Ångström Exponent (AAE) was 1.17 ± 0.30, indicating generally weak-to-moderate wavelength dependence, with occasional enhancement of short-wavelength absorption. Based on empirical AAE intervals, 56% of the samples had values between 1.0 and 1.5, 32% had values below 1.0, and 12% exhibited values above 1.5, indicating enhanced short-wavelength absorption during a limited number of events. These intervals provide qualitative information on spectral variability rather than unambiguous source attribution. Overall, this study provides new multi-wavelength optical observations of PM2.5 from a six-week field campaign conducted in Lahore during March–April 2025 and contributes to the characterization of carbonaceous aerosols in the Indo-Gangetic Plain. The generated dataset provides a useful basis for future source-apportionment studies, air-quality management, and assessments of aerosol radiative effects in highly polluted South Asian urban environments.
Keywords:
PM2.5
; carbonaceous aerosols
; multi-wavelength absorbance analyzer (MWAA)
; absorption Ångström exponent
; Lahore
1. Introduction
Atmospheric particulate matter (PM) is one of the most important air pollutants affecting both the environment and human health [1]. Fine particulate matter (PM2.5), with an aerodynamic diameter smaller than 2.5 μm, is especially harmful because it can penetrate deep into the lungs and enter the bloodstream [2]. Exposure to elevated PM2.5 concentrations has been associated with respiratory and cardiovascular diseases, reduced life expectancy, and increased premature mortality. As a result, PM2.5 is considered a major environmental and public health concern worldwide [3,4,5].
Urban areas in developing countries frequently experience severe PM2.5 pollution due to rapid population growth, urbanization, industrial activities, fossil fuel combustion, biomass burning, and increasing transportation demands [6]. South Asia is recognized as one of the most polluted regions globally, where dense populations and intensive anthropogenic activities contribute substantially to atmospheric aerosol loading [7]. In this region, PM2.5 concentrations often exceed the air quality guidelines established by the World Health Organization (WHO), posing significant risks to public health and regional environmental sustainability [4,5].
Pakistan has experienced substantial decline in air quality over recent decades, with major urban centers frequently reporting hazardous levels of particulate pollution [8,9]. Among these cities, Lahore, the second-largest city in Pakistan and a major economic and industrial hub, is particularly exposed to severe air pollution episodes. The city is characterized by dense traffic, industrial emissions, construction activities, residential fuel combustion, and periodic biomass burning, all of which contribute to elevated concentrations of atmospheric particulate matter [10,11,12]. In addition, unfavorable meteorological conditions and regional transport of pollutants from surrounding areas can further exacerbate PM2.5 levels, especially during stagnant atmospheric conditions [10,11,13].
Carbonaceous aerosols, consisting primarily of organic carbon (OC) and elemental carbon (EC), often represent a substantial fraction of fine particulate matter in urban environments [14,15,16,17] . These components influence atmospheric radiative forcing, visibility reduction, and cloud formation processes. Elemental carbon (EC) is operationally defined by thermal–optical analysis, whereas black carbon (BC) is defined according to its strong light-absorbing properties. Although EC and BC are closely related components of combustion-generated aerosols, they are not directly interchangeable. The spectral absorption properties of carbonaceous aerosols depend on fuel type, combustion conditions, aerosol composition, and atmospheric processing, with some organic components exhibiting enhanced absorption at shorter wavelengths [18,19,20,21]. The characterization of carbonaceous aerosols and their optical properties is therefore essential for understanding aerosol-climate interactions and identifying dominant emission sources.
Although air pollution has become a major environmental challenge in Pakistan, studies simultaneously investigating PM2.5 mass concentrations, carbonaceous aerosol composition, and optical properties remain limited. Previous studies in Pakistan have mainly focused on PM₂.₅ mass concentrations or selected chemical constituents, whereas integrated chemical and multi-wavelength optical measurements remain limited [22,23,24]. Such integrated investigations are essential for improving our understanding of the sources, composition, and light-absorbing properties of urban aerosols, thereby supporting the development of effective air quality management and mitigation strategies.
Recent studies across the Indo-Gangetic Plain (IGP) have further highlighted the importance of integrating chemical characterization with aerosol optical measurements to improve understanding of carbonaceous aerosol sources and their radiative impacts. Investigations conducted at highly polluted IGP sites have reported elevated PM2.5 concentrations, substantial contributions of organic and elemental carbon, and pronounced wavelength-dependent aerosol absorption associated with fossil-fuel combustion, biomass burning, and atmospheric aging. These findings emphasize the need for comprehensive chemical and optical characterization of urban aerosols across South Asia, while such integrated observations remain scarce for Lahore, Pakistan [25,26,27].
The present study provides a characterization of PM2.5, mass concentrations, carbonaceous composition, and multi-wavelength optical properties in Lahore, Pakistan, during a field campaign conducted between March and April 2025. Aerosol samples were collected on quartz fiber filters and analyzed using gravimetric, thermal–optical, and multi-wavelength optical techniques. PM2.5 mass concentrations were determined gravimetrically, carbonaceous aerosol fractions were quantified using thermal–optical analysis, and aerosol light-absorption properties were measured using the Multi-Wavelength Absorbance Analyzer (MWAA) [28].
The objectives of this study were to: (i) determine the concentration levels and temporal variability of PM2.5 in Lahore; (ii) characterize the carbonaceous composition of urban aerosols; (iii) investigate the wavelength-dependent optical absorption properties of PM2.5 using the Multi-Wavelength Absorbance Analyzer (MWAA); and (iv) evaluate the Absorption Ångström Exponent (AAE) to investigate variations in the spectral dependence of aerosol absorption and obtain qualitative indications of changes in light-absorbing aerosol composition. By combining gravimetric, thermal–optical, and multi-wavelength optical measurements, this study provides an integrated springtime dataset for urban PM2.5 in Lahore. The results establish a basis for future source-apportionment, air-quality, and aerosol radiative-effect studies in South Asian megacities. To the authors’ knowledge, this study represents one of the first attempts to combine gravimetric PM2.5 measurements, thermal–optical OC/EC analysis, and MWAA-based multi-wavelength absorption measurements for urban aerosols in Lahore
2. Materials and Methods
2.1. Study Area
Ambient PM2.5 sampling was conducted in Lahore, Pakistan (Figure 1), one of the largest metropolitan areas in South Asia and a major economic, industrial, and transportation hub. The sampling site was located on the rooftop of the Institute of Energy and Environmental Engineering (IEE), University of the Punjab, Lahore, Pakistan (31.4953° N, 74.2950° E). The sampling platform was situated approximately 10 m above ground level, reducing the influence of direct resuspension while providing measurements representative of rooftop urban air at the sampling location. The site is potentially influenced by several urban and regional emission processes, including vehicular traffic, industrial activities, residential combustion, construction operations, and regional pollutant transport, making it suitable for investigating the chemical and optical properties of urban aerosols [8,11,24]. In addition to local emissions, Lahore is influenced by regional atmospheric circulation over the Indo-Gangetic Plain (IGP), one of the most densely populated and polluted regions in the world. The relatively flat topography of the IGP, together with regional air-mass transport and stagnant meteorological conditions, favors the accumulation and long-range transport of particulate matter across northern India and Pakistan, thereby contributing to elevated PM2.5 concentrations in Lahore [29,30].
2.2. PM2.5 Sampling
PM2.5 samples were collected on pre-fired quartz fiber filters (Pall Tissuquartz™, 2500QAO-UP, 47 mm diameter). Sampling was performed using a PM2.5 sampler equipped with a Sharp Cut Cyclone (SCC; Met One Instruments, USA) for aerodynamic size selection.
The sampler consisted of two parallel sampling channels operating simultaneously. Ambient air first passed through the PM2.5 Sharp Cut Cyclone (SCC), after which the flow was divided by a flow splitter into two sampling lines, each operating at 8.3 L min⁻¹, resulting in a total cyclone flow rate of 16.6 L min⁻¹. Filters were collected simultaneously on both sampling lines throughout the campaign. However, only the quartz filters from one sampling line were used in the present study, whereas the filters collected on the second sampling line were reserved for an independent parallel investigation. Each sample was collected over a 23-h period, corresponding to an average actual sampled air volume of approximately 11.5 m³, calculated from the sampling flow rate (8.3 L min⁻¹) and collection time.
Before and after sampling, the filters were conditioned at 20 ± 1 °C and 50 ± 5% relative humidity for at least 24 h and weighed using a Sartorius MC5 microbalance. PM2.5 mass concentrations were determined gravimetrically following the European reference method for PM2.5 measurements [31,32]. After sampling, the filters were stored in clean Petri dishes and transported to the laboratory for gravimetric, carbonaceous, and optical analyses.
2.3. Gravimetric Analysis
PM2.5 mass concentrations were determined gravimetrically following standard atmospheric aerosol sampling procedures [31], The particulate mass collected on each filter was calculated from the difference between the post-sampling and pre-sampling filter masses. The PM2.5 mass concentration was calculated as:
where:
= PM2.5 concentration (µg m⁻³), = initial filter mass (µg), = final filter mass (µg) and = sampled air volume (m³).
2.4. Carbonaceous Aerosol Analysis
Carbonaceous aerosol fractions were determined using a Sunset Laboratory thermal–optical carbon analyzer following the NIOSH 870 protocol. The NIOSH 870 protocol was selected because it is one of the most widely used methods for the determination of organic carbon (OC) and elemental carbon (EC) in atmospheric aerosol samples, allowing direct comparison with previous studies conducted in South Asia and other urban environments [33,34].
For each sample, a 1 cm² punch was taken from the quartz fiber filter and analysed using the thermal–optical transmittance (TOT) method. The analysis was carried out under successive inert and oxidizing atmospheres, while pyrolytic carbon formation was corrected by continuous laser transmittance monitoring. The measured OC and EC concentrations were subsequently used to characterize the carbonaceous fraction of PM2.5. The OC/EC ratio was calculated as a qualitative indicator of variations in carbonaceous aerosol composition. Because this ratio is affected by source type, atmospheric processing, and the selected thermal–optical protocol, it was not interpreted as a unique tracer of primary or secondary aerosol contributions. [35,36].
2.5. Multi-Wavelength Absorbance Analyzer (MWAA)
The optical properties of the PM2.5 filter samples were analysed using the Multi-Wavelength Absorbance Analyzer (MWAA) at five wavelengths (375, 407, 532, 635, and 850 nm). The MWAA determines the sample absorbance from measurements of transmitted and angularly resolved scattered radiation according to the procedure described by Massabò et al. [39]. The aerosol absorption coefficient was subsequently calculated from the measured absorbance, the effective filter deposition area, and the sampled air volume.[39]. The aerosol absorption coefficient was then calculated as:
where:
is the aerosol absorption coefficient (m⁻¹), is the effective filter deposition area (m2), is the sampled air volume (m3), and is the aerosol absorbance determined by the MWAA.
The wavelength dependence of aerosol absorption was evaluated using the Absorption Ångström Exponent (AAE). The AAE values reported throughout this study were obtained by fitting a power-law relationship to the aerosol absorption coefficients measured at the five MWAA wavelengths (375, 407, 532, 635, and 850 nm).
3. Results
3.1. PM₂.₅ Mass Concentrations
The temporal variation of PM2.5 concentrations during the March–April 2025 sampling campaign is shown in Figure 2, while the corresponding descriptive statistics are summarized in Table 1. PM2.5 concentrations ranged from 40 to 417 µg m⁻³, with a mean value of 137 ± 84 µg m⁻³ and a median of 111 µg m⁻³. The high coefficient of variation (61%) indicates substantial day-to-day variability in particulate matter levels throughout the study period.
All measured PM2.5 concentrations exceeded the numerical value of the WHO 24-h PM2.5 guideline (15 µg m⁻³), indicating persistently elevated particulate matter concentrations throughout the sampling campaign. Several pronounced pollution episodes were observed, with concentrations exceeding 200 µg m⁻³ and reaching a maximum of 417 µg m⁻³. These pollution episodes may have resulted from temporal variations in local emissions, regional pollutant transport, and atmospheric dispersion conditions. However, in the absence of concurrent meteorological measurements and source-specific tracer data, a quantitative attribution of the individual pollution episodes was not possible [8,10].
The average PM2.5 concentration observed in this study is consistent with previous measurements reported for Lahore and the wider Indo-Gangetic Plain, one of the most polluted regions globally [37,38]. Overall, the results highlight the severity of particulate pollution in Lahore and emphasize the importance of sustained emission-control measures and long-term air quality monitoring.
3.2. Carbonaceous Aerosol Characteristics
OC and EC analyses were performed on a representative subset of 15 PM2.5 filters. The measured concentrations and their relative carbon contributions are presented in Figure 3. Organic carbon was the dominant carbonaceous component in most of the analysed samples, indicating that organic material generally constituted the largest fraction of carbonaceous PM2.5 in the representative subset selected for OC/EC analysis.
The measured OC concentrations ranged from 34.1 to 69.8 μg m⁻³ (mean 50.9 ± 11.6 μg m⁻³), while EC varied between 3.5 and 48.9 μg m⁻³ (mean 15.5 ± 12.1 μg m⁻³). Consequently, total carbon (TC) ranged from 40.1 to 88.1 μg m⁻³, with an average concentration of 66.4 ± 15.0 μg m⁻³. As shown in Figure 3a, across the 15 analysed samples, OC accounted for 76.6% of the measured total carbon, whereas EC contributed 23.4%. For the matched samples, TC represented 57.3 ± 23.2% (mean ± SD) of the gravimetrically determined PM2.5 mass.
The OC/EC ratio exhibited substantial variability among the analysed samples, ranging from 0.70 to 10.88 with an average value of 5.14 ± 3.09 (Figure 3b). Sample 6 showed the lowest OC/EC ratio (0.70), owing to its comparatively high EC concentration compared to OC. This observation is consistent with an enhanced contribution from EC-rich primary emissions, although the OC/EC ratio alone does not allow unambiguous source of attribution. In contrast, Samples 12 and 15 displayed the highest OC/EC ratios (10.09 and 10.88, respectively), indicating an enhanced contribution from organic-rich aerosol. This may reflect secondary organic aerosol formation, atmospheric ageing, organic-rich primary emissions, or a combination of these processes.
3.3. Multi-Wavelength Aerosol Absorption Properties
The aerosol absorption coefficients () measured using the Multi-Wavelength Absorbance Analyzer (MWAA) at five wavelengths (375, 407, 532, 635, and 850 nm) are presented in Figure 4. The MWAA is an offline, filter-based instrument widely used for the multi-wavelength optical characterization of carbonaceous aerosols and source apportionment studies [39,40]. A clear wavelength-dependent absorption pattern was observed throughout the sampling campaign, with absorption progressively decreasing from 375 to 850 nm.
Considerable variability in aerosol absorption was observed among the collected PM2.5 samples. Most samples exhibited moderate absorption coefficients, whereas Samples 4, 6, 18, and 20 showed substantially higher values than the remaining samples. Among these, Sample 20 exhibited the highest absorption at all wavelengths, reaching 1113 Mm⁻¹ at 375 nm. Although this value is exceptionally high, the spectral behaviour remained physically consistent, with aerosol absorption decreasing progressively from 375 to 850 nm. This indicates that the measurement was internally consistent and likely reflects a genuine high-loading aerosol episode. Nevertheless, measurements obtained under very high aerosol loadings should be interpreted with appropriate caution, as retrieval uncertainties may increase under extreme loading conditions.
The separation among the absorption spectrum became more pronounced during these high-absorption episodes, particularly for Samples 18 and 20, whereas samples with relatively low absorption exhibited similar spectral profiles across all five wavelengths. Overall, these observations indicate that the magnitude of aerosol absorption varied considerably during the campaign, while the wavelength-dependent optical behaviour remained generally consistent
To further investigate the relationship between carbonaceous composition and aerosol optical properties, the elemental carbon (EC) concentrations obtained from the thermal–optical analysis were compared with the aerosol absorption coefficient measured at 850 nm by the MWAA (Figure 5). A positive association was observed between EC concentration and the aerosol absorption coefficient measured at 850 nm (R² = 0.68; Figure 5). This relationship indicates that increasing EC concentrations were generally associated with higher near-infrared aerosol absorption. However, the observed correlation alone does not permit attribution of aerosol absorption exclusively to EC, as other aerosol components and atmospheric processes may also contribute to the observed variability.
The observed relationship is consistent with the well-established role of elemental carbon as the principal absorber of visible and near-infrared radiation. Although other aerosol components may influence the overall optical properties, the positive association between EC and babs@850 nm supports the major role of EC in near-infrared absorption, although the remaining variability suggests that mixing state, measurement uncertainty, and other aerosol properties may also influence the observed absorption.
The statistical summary of the MWAA absorption coefficients is presented in Table 2. The mean absorption coefficient decreased from 280 ± 272 Mm⁻¹ at 375 nm to 95 ± 67 Mm⁻¹ at 850 nm, corresponding to an overall reduction of approximately 66% across the measured spectral range. Similar decreasing trends were observed for the median and maximum values, while the relatively larger standard deviations at shorter wavelengths reflect the influence of episodic high-absorption events.
3.4. Aerosol Absorption Ångström Exponent (AAE)
AAE values calculated over 375–850 nm ranged from 0.92 to 1.96, with a mean of 1.17 ± 0.30 and a median of 1.08. Most samples had values close to unity, whereas Samples 4, 6, and 18 exhibited distinctly higher values, indicating stronger wavelength dependence during these events.
The sample-wise variation in AAE is presented in Figure 6. Most samples exhibited AAE values close to unity, indicating relatively weak wavelength dependence of aerosol absorption, whereas Samples 4, 6, and 18 displayed noticeably higher AAE values than the remaining samples. The elevated AAE values observed for Samples 4, 6, and 18 may indicate enhanced wavelength dependence of aerosol absorption and are consistent with increased contributions from light-absorbing organic compounds (brown carbon), biomass-burning emissions, changes in aerosol ageing, or a combination of these processes. However, AAE alone does not allow a unique source attribution and should therefore be interpreted together with complementary chemical information and local emission characteristics [41,42,43].
The influence of wavelength selection on AAE is further illustrated in Figure 7. When the ultraviolet wavelength (375 nm) was excluded, the mean AAE decreased from 1.17 (375–850 nm) to 0.94 (407–850 nm) and 0.85 (532–850 nm), while the overall variability also became progressively smaller. This behaviour indicates that the near-ultraviolet region contributes most strongly to the observed spectral dependence of aerosol absorption. Source-specific studies of biomass-combustion aerosol have shown that brown-carbon compounds can produce pronounced absorption enhancements at short wavelengths and that this behaviour depends strongly on their molecular composition [40,43,44].
For a qualitative interpretation, the AAE values were grouped into three commonly adopted categories (Figure 8): AAE < 1.0, AAE = 1.0–1.5, and AAE > 1.5, which are generally associated with fossil-fuel-dominated aerosols, mixed urban emissions, and enhanced brown carbon or biomass-burning influence, respectively [41,45]. Based on this classification, 8 samples (32%) were associated with fossil-fuel-dominated aerosols, 14 samples (56%) were classified as mixed urban aerosols, and only 3 samples (12%) exhibited characteristics consistent with enhanced brown carbon or biomass-burning influence. These findings are consistent with the urban environment of Lahore, where traffic emissions, industrial activities, domestic fuel combustion, and secondary atmospheric processing collectively influence the optical properties of carbonaceous aerosols rather than a single dominant emission source.
4. Discussion
The present study provides a six-week assessment of the carbonaceous composition and wavelength-dependent optical properties of PM2.5 collected at an urban rooftop site in Lahore. The MWAA measurements consistently showed a gradual decrease in aerosol absorption coefficients from the ultraviolet to the near-infrared wavelengths, reflecting the expected spectral behaviour of carbonaceous aerosols. This wavelength dependence is a characteristic feature of light-absorbing carbonaceous particles and is consistent with previous laboratory and field observations reported for urban aerosols.
The comparison between elemental carbon (EC) concentrations determined by thermal–optical analysis and the MWAA-derived aerosol absorption coefficient at 850 nm (Figure 5) revealed a positive association (R² = 0.68), indicating that higher EC concentrations were generally accompanied by stronger near-infrared aerosol absorption. This agreement demonstrates the overall consistency between the thermal–optical and optical measurements. However, the observed correlation should be interpreted as an association rather than direct evidence that EC alone controls aerosol absorption, since the remaining variability may reflect contributions from aerosol composition, particle mixing state, atmospheric ageing, and measurement uncertainty.
The AAE analysis provided additional insight into the wavelength dependence of aerosol absorption. The average AAE of 1.17 ± 0.30 indicates that most samples exhibited AAE values close to unity, consistent with relatively weak wavelength dependence of aerosol absorption. Nevertheless, three sampling events displayed noticeably higher AAE values, suggesting enhanced spectral dependence during specific pollution episodes. Elevated AAE values may reflect increased contributions from light-absorbing organic compounds (brown carbon), biomass-burning emissions, atmospheric ageing, or a combination of these processes. However, AAE alone does not provide a unique source of attribution and should therefore be interpreted together with complementary chemical and meteorological information. Recent laboratory investigations have further demonstrated that the spectral optical properties of soot depend on particle composition and formation conditions, highlighting that AAE should not be regarded as a unique source fingerprint [46].
The comparison of AAE calculated using different wavelength intervals further demonstrated the importance of the ultraviolet region. Excluding the 375 nm wavelength reduced both the average AAE and its variability, indicating that short wavelengths contributed most strongly to the observed spectral dependence of aerosol absorption. This behaviour agrees with previous studies showing that ultraviolet absorption is generally more sensitive to light-absorbing organic compounds, whereas absorption at visible and near-infrared wavelengths is more strongly associated with black carbon. The lower variability observed for the 407–850 nm and 532–850 nm wavelength ranges further support the greater spectral stability of aerosol absorption at longer wavelengths.
For a qualitative interpretation, the measured AAE values were classified into three commonly adopted ranges. More than half of the analysed samples (56%) fell within the mixed urban category (AAE = 1.0–1.5), whereas 32% exhibited AAE values below 1.0. Only 12% of the samples showed AAE values above 1.5, indicating episodic enhancement of wavelength-dependent absorption. This distribution is consistent with the complex urban emission environment of Lahore, where traffic emissions, industrial activities, domestic fuel combustion, and atmospheric processing collectively influence the optical characteristics of carbonaceous aerosols. Similar patterns have also been reported for other urban locations across the Indo-Gangetic Plain.
Overall, the gravimetric, carbonaceous, and optical measurements indicate that combustion-related carbonaceous aerosols contributed substantially to PM2.5 during the sampling campaign. However, the available measurements do not permit a quantitative separation of fossil-fuel, biomass-burning, secondary organic aerosol, and other urban emission sources. The observed variability in OC/EC ratios, the EC–babs@850 nm relationship, and the AAE values suggests a changing mixture of primary emissions and atmospheric processing throughout the campaign. These findings provide a valuable observational basis for future source-apportionment studies integrating chemical tracers, meteorological observations, and receptor-modelling approaches.
5. Conclusions
This study characterized PM2.5 mass concentrations, carbonaceous composition (OC and EC), and multi-wavelength aerosol light-absorption properties at an urban site in Lahore, Pakistan, during 15 March–29 April 2025. The measured PM2.5 concentrations confirmed persistent particulate pollution throughout the sampling period, highlighting the poor air quality in Lahore.
Organic carbon accounted for 76.6% of total carbon, whereas elemental carbon contributed 23.4%, indicating the predominance of organic carbon within the carbonaceous aerosol fraction. MWAA measurements showed a systematic decrease in aerosol light absorption from 375 to 850 nm, while the average AAE of 1.17 ± 0.30 indicated that most samples exhibited a relatively weak wavelength dependence of absorption, with occasional events characterized by enhanced short-wavelength absorption. Based on the AAE classification, most samples (56%) showed spectral behaviour consistent with mixed urban aerosols, whereas 32% exhibited weak wavelength dependence broadly compatible with BC-dominated absorption. Only a small fraction of samples (12%) showed enhanced short-wavelength absorption, possibly influenced by brown carbon or biomass-burning-related aerosol.
Overall, this work provides new multi-wavelength optical observations of PM2.5 in Lahore using the Multi-Wavelength Absorbance Analyzer (MWAA). These findings improve the current understanding of carbonaceous aerosols in the Indo-Gangetic Plain and provide a useful basis for future source-apportionment studies, air-quality management, and assessments of aerosol radiative effects in highly polluted South Asian urban environments.
Author Contributions
Muhammad Irfan: Conceptualization, methodology, formal analysis, data curation, visualization, interpretation of results, writing - original draft preparation, and writing - review and editing. Zaeem Bin Babar & Aqeel Afzal: Field campaign coordination, sampling supervision, scientific discussion, manuscript review and editing. Franco Parodi: Methodology, coordination of sample shipment, logistical support. Marco Brunoldi, Elena Gatta, Federico Mazzei, and Virginia Vernocchi: Analytical support, scientific discussion, manuscript review, and editing. Muhammad Waqas: Visualization, figure refinement, scientific discussion, and manuscript review. Dario Massabò and Paolo Prati: Supervision, project administration, scientific guidance, manuscript review, and editing. All authors have read and agreed to the published version of the manuscript.
Funding
This research has been supported by IR0000032–ITINERIS, Italian Integrated Environmental Research Infrastructures System (D.D. n. 130/2022 - CUP B53C22002150006) funded by the EU (Next Generation EUPNRR, Mission 4 “Education and Research”, Component 2 “From research to business”, Investment 3.1, “Fund for the realisation of an integrated system of research and innovation infrastructures”), and the Project 101131261 — IRISCC (Integrated Research Infrastructure Services for Climate Change risks) — HORIZON-INFRA-2023-SERV-01.
Data Availability Statement
The data presented in this study are available from the corresponding author upon reasonable request.
Acknowledgments
The authors gratefully acknowledge the Department of Physics, University of Genoa, the National Institute for Nuclear Physics (INFN), the Institute of Energy and Environmental Engineering, University of the Punjab, Lahore, and all personnel involved in the Lahore field campaign for providing laboratory facilities, instrumentation, logistical assistance, and technical support during sample collection and analysis.
Conflicts of Interest
The authors declare no conflict of interest.
References
- Pope, C. A.; Dockery, D. W. Health effects of fine particulate air pollution: Lines that connect. J. Air Waste Manag. Assoc. 2006, vol. 56(no. 6), 709–742. [Google Scholar] [CrossRef] [PubMed]
- Sangkham, S.; et al. An update on adverse health effects from exposure to PM2.5. In Elsevier Ltd; 01 Dec 2024. [Google Scholar] [CrossRef]
- Burnett, R.; et al. Global estimates of mortality associated with longterm exposure to outdoor fine particulate matter. Proc. Natl. Acad. Sci. U. S. A. 2018, vol. 115(no. 38), 9592–9597. [Google Scholar] [CrossRef] [PubMed]
- Ouyang, H.; et al. Toward Better and Healthier Air Quality Implementation of WHO 2021 Global Air Quality Guidelines in Asia. Bull. Am. Meteorol. Soc. 2022, vol. 103(no. 7), E1696–E1703. [Google Scholar] [CrossRef]
- Orellano, P.; Kasdagli, M. I.; Pérez Velasco, R.; Samoli, E. Long-Term Exposure to Particulate Matter and Mortality: An Update of the WHO Global Air Quality Guidelines Systematic Review and Meta-Analysis. In Frontiers Media SA; 2024. [Google Scholar] [CrossRef] [PubMed]
- Valavanidis, P. Athanasios. Countries and Megacities with the Highest Urban Air Pollution. The world’s most polluted cities, driven by industrialization, vehicular emissions and urban density and planning. [CrossRef]
- Ansari, K.; Ramachandran, S. Radiative effects of absorbing aerosol types over South Asia. Sci. Total Environ. 2023, vol. 858. [Google Scholar] [CrossRef] [PubMed]
- Colbeck; Nasir, Z. A.; Ahmad, S.; Ali, Z. Exposure to PM 10, PM 2.5, PM 1 and carbon monoxide on roads in Lahore, Pakistan. Aerosol Air Qual. Res. 2011, vol. 11(no. 6), 689–695. [Google Scholar] [CrossRef]
- Sher, M.; Khetran, B. “HEALTH HAZARDS CAUSED BY INCREASING AIR POLLUTION IN PAKISTAN,” 2023. Available online: https://aqli.epic.uchicago.edu/wp-content/uploads/2023/08/Pakistan-FactSheet-2023_Final.pdf.
- Imran Bukhari, S. S.; Ali, Z. “Characterization of bioaerosols and particulate matter (PM) in residential settings of asthmatic patients of Lahore, Pakistan,” Iran. J. Allergy Asthma Immunol. 2021, vol. 20(no. 2), 147–159. [Google Scholar] [CrossRef]
- Mohyuddin, S.; et al. Characterization and source identification of PM2.5 during intense haze episodes in an urban environment of Lahore. Atmos. Environ. X 2024, vol. 23. [Google Scholar] [CrossRef]
- Waris, U.; Tariq, S. Temporal dynamics and forecasting of aerosol optical depth in megacities Lahore and Karachi: Insights from the Indo-Gangetic Basin and southern Pakistan, and implications for Sustainable development. Atmos. Pollut. Res. 2024, vol. 15(no. 7). [Google Scholar] [CrossRef]
- Gurjar, B. R.; Ravindra, K.; Nagpure, A. S. Air pollution trends over Indian megacities and their local-to-global implications. In Elsevier Ltd; 01 Oct 2016. [Google Scholar] [CrossRef]
- Turpin, B. J.; Lim, H. J. Species contributions to pm2.5 mass concentrations: Revisiting common assumptions for estimating organic mass. Aerosol Sci. Technol. 2001, vol. 35(no. 1), 602–610. [Google Scholar] [CrossRef]
- Kaskaoutis, D. G.; et al. Carbonaceous aerosols in contrasting atmospheric environments in Greek cities: Evaluation of the EC-tracer methods for secondary organic carbon estimation. Atmosphere 2020, vol. 11(no. 2). [Google Scholar] [CrossRef]
- Skiba, et al. Source attribution of carbonaceous fraction of particulate matter in the urban atmosphere based on chemical and carbon isotope composition. Sci. Rep. 2024, vol. 14(no. 1). [Google Scholar] [CrossRef] [PubMed]
- Saarikoski, S.; et al. “Atmospheric Chemistry and Physics Sources of organic carbon in fine particulate matter in northern European urban air,” 2008. Available online: www.atmos-chem-phys.net/8/6281/2008/.
- Danelli, S. G.; et al. Measurement report: Investigation of optical properties of carbonaceous aerosols from the combustion of different fuels by an atmospheric simulation chamber. Atmos. Chem. Phys. 2025, vol. 25(no. 16), 9387–9401. [Google Scholar] [CrossRef]
- Andreae, M. O.; Gelencsér, A. “Atmospheric Chemistry and Physics Black carbon or brown carbon? The nature of light-absorbing carbonaceous aerosols,” 2006. Available online: www.atmos-chem-phys.net/6/3131/2006/.
- Rimoldi, S.; et al. Atmospheric aerosol light scattering and absorption properties in the urban area of Milan (Italy): A focus on aerosol typing. Atmos. Res. 2026, vol. 334. [Google Scholar] [CrossRef]
- Siemens, K.; et al. Light Absorption and Chemical Composition of Brown Carbon Organic Aerosol Produced from Burning of Selected Biofuels. ACS Earth Space Chem. 2024, vol. 8(no. 7), 1416–1428. [Google Scholar] [CrossRef]
- Zeb, B.; Nasir, J.; Alam, K.; Ditta, A.; Aman, M. A.; Shafiq, M. PM2.5 pollution and its correlation with meteorological parameters over the four capital cities of Pakistan. Environ. Monit. Assess. 2025, vol. 197(no. 11). [Google Scholar] [CrossRef] [PubMed]
- Rasheed; Aneja, V. P.; Aiyyer, A.; Rafique, U. Measurement and analysis of fine particulate matter (PM2.5) in urban areas of Pakistan. Aerosol Air Qual. Res. 2015, vol. 15(no. 2), 426–439. [Google Scholar] [CrossRef]
- Zeb; Alam, K.; Sorooshian, A.; Blaschke, T.; Ahmad, I.; Shahid, I. On the morphology and composition of particulate matter in an urban environment. Aerosol Air Qual. Res. 2018, vol. 18(no. 6), 1431–1447. [Google Scholar] [CrossRef] [PubMed]
- Kapoor, T. S.; et al. Optical Properties and Refractive Index of Wintertime Aerosol at a Highly Polluted North-Indian Site. J. Geophys. Res. Atmos. 2023, vol. 128(no. 14). [Google Scholar] [CrossRef]
- Wadhwa, S.; Khan, A. A.; Kumar, A.; Jindal, P. Temporal Dynamics and Long-Term Trends in Aerosol Optical Properties over Two Sites of Indo Gangetic Plains (IGP): Insights from AERONET Observations. Atmosphere 2025, vol. 16(no. 3). [Google Scholar] [CrossRef]
- Budhavant, K.; et al. Changing optical properties of black carbon and brown carbon aerosols during long-range transport from the Indo-Gangetic Plain to the equatorial Indian Ocean. Atmos. Chem. Phys. 2024, vol. 24(no. 20), 11911–11925. [Google Scholar] [CrossRef]
- Bernardoni, V.; Pileci, R. E.; Caponi, L.; Massabò, D. The multi-wavelength absorption analyzer (MWAA) model as a tool for source and component apportionment based on aerosol absorption properties: Application to samples collected in different environments. Atmosphere 2017, vol. 8(no. 11). [Google Scholar] [CrossRef]
- Lawrence, M. G.; Lelieveld, J. Atmospheric pollutant outflow from southern Asia: A review; 2010. [Google Scholar] [CrossRef]
- Kumar, M.; et al. Long-term aerosol climatology over Indo-Gangetic Plain: Trend, prediction and potential source fields. Atmos. Environ. 2018, vol. 180, 37–50. [Google Scholar] [CrossRef]
- CEN. EN 12341:2014. Ambient air – Standard gravimetric measurement method for the determination of the PM10 or PM2.5 mass concentration of suspended particulate matter; European Committee for Standardization: Brussels, Belgium, 2014. [Google Scholar]
- Italian Quality Assurance Procedure Ministero dell’Ambiente e della Tutela del Territorio e del Mare; 2017.
- Giannoni, M.; et al. A comparison between thermal-optical transmittance elemental carbon measured by different protocols in PM2.5 samples. Sci. Total Environ. 2016, vol. 571, 195–205. [Google Scholar] [CrossRef] [PubMed]
- Cavalli, Fabrizia.; Putaud, J.-Philippe. Toward a standardized thermal-optical protocol for measuring atmospheric organic and elemental carbon: the EUSAAR protocol; Publications Office, 2008. [Google Scholar]
- Turpin, B. J.; Huntzicker, J. J. IDENTIFICATION OF SECONDARY ORGANIC AEROSOL EPISODES AND QUANTITATION OF PRIMARY AND SECONDARY ORGANIC AEROSOL CONCENTRATIONS DURING SCAQS. 1995, vol. 29(no. 23), 97006–1999. [Google Scholar]
- Pio, C.; et al. OC/EC ratio observations in Europe: Re-thinking the approach for apportionment between primary and secondary organic carbon. Atmos. Environ. 2011, vol. 45(no. 34), 6121–6132. [Google Scholar] [CrossRef]
- Ramachandran, S.; Rupakheti, M. Aerosol pollution across the Indo-Gangetic plain and the Himalayas: Seasonal patterns and implications for air quality and climate. Air Qual. Atmos. Health 2026, vol. 19(no. 3). [Google Scholar] [CrossRef]
- Iqbal; Muzamil, A. Evaluation of Particulate Matter (PM2.5) Levels in Major Cities of Pakistan: A Review. Int. J. Adv. Sustain. Dev. (IJASD) 2024, vol. 1(no. 2), 1–11. [Google Scholar] [CrossRef]
- Massabò, D.; et al. Multi-wavelength optical determination of black and brown carbon in atmospheric aerosols. Atmos. Environ. 2015, vol. 108, 1–12. [Google Scholar] [CrossRef]
- Massabò, D.; et al. A multi-wavelength optical set-up for the characterization of carbonaceous particulate matter. J. Aerosol Sci. 2013, vol. 60, 34–46. [Google Scholar] [CrossRef]
- Lack, D. A.; Langridge, J. M. On the attribution of black and brown carbon light absorption using the Ångström exponent. Atmos. Chem. Phys. 2013, vol. 13(no. 20), 10535–10543. [Google Scholar] [CrossRef]
- Moosmüller, H.; Chakrabarty, R. K.; Arnott, W. P. Aerosol light absorption and its measurement: A review. 2009. [Google Scholar] [CrossRef]
- Kirchstetter, T. W.; Novakov, T.; Hobbs, P. V. Evidence that the spectral dependence of light absorption by aerosols is affected by organic carbon. J. Geophys. Res. D. Atmos. 2004, vol. 109(no. 21). [Google Scholar] [CrossRef]
- Moschos, V.; et al. Quantifying the Light-Absorption Properties and Molecular Composition of Brown Carbon Aerosol from Sub-Saharan African Biomass Combustion. Environ. Sci. Technol. 2024, vol. 58(no. 9), 4268–4280. [Google Scholar] [CrossRef] [PubMed]
- Zotter, P.; et al. Evaluation of the absorption Ångström exponents for traffic and wood burning in the Aethalometer-based source apportionment using radiocarbon measurements of ambient aerosol. Atmos. Chem. Phys. 2017, vol. 17(no. 6), 4229–4249. [Google Scholar] [CrossRef]
- Heuser, J.; et al. Spectral optical properties of soot: Laboratory investigation of propane flame particles and their link to composition. Atmos. Chem. Phys. 2025, vol. 25(no. 12), 6407–6428. [Google Scholar] [CrossRef]
- Salteri, F.; et al. Is fossil fuel combustion still a major contributor to atmospheric aerosol carbonaceous fractions in the Po Valley? Results from a 14C-based source apportionment. Environ. Pollut. 2025, vol. 367. [Google Scholar] [CrossRef] [PubMed]
- Isolabella, T.; et al. A new software toolkit for optical apportionment of carbonaceous aerosol. Atmos. Meas. Tech. 2024, vol. 17(no. 4), 1363–1373. [Google Scholar] [CrossRef]
Figure 1.
Study area and location of the PM₂.₅ sampling site in Lahore, Pakistan.
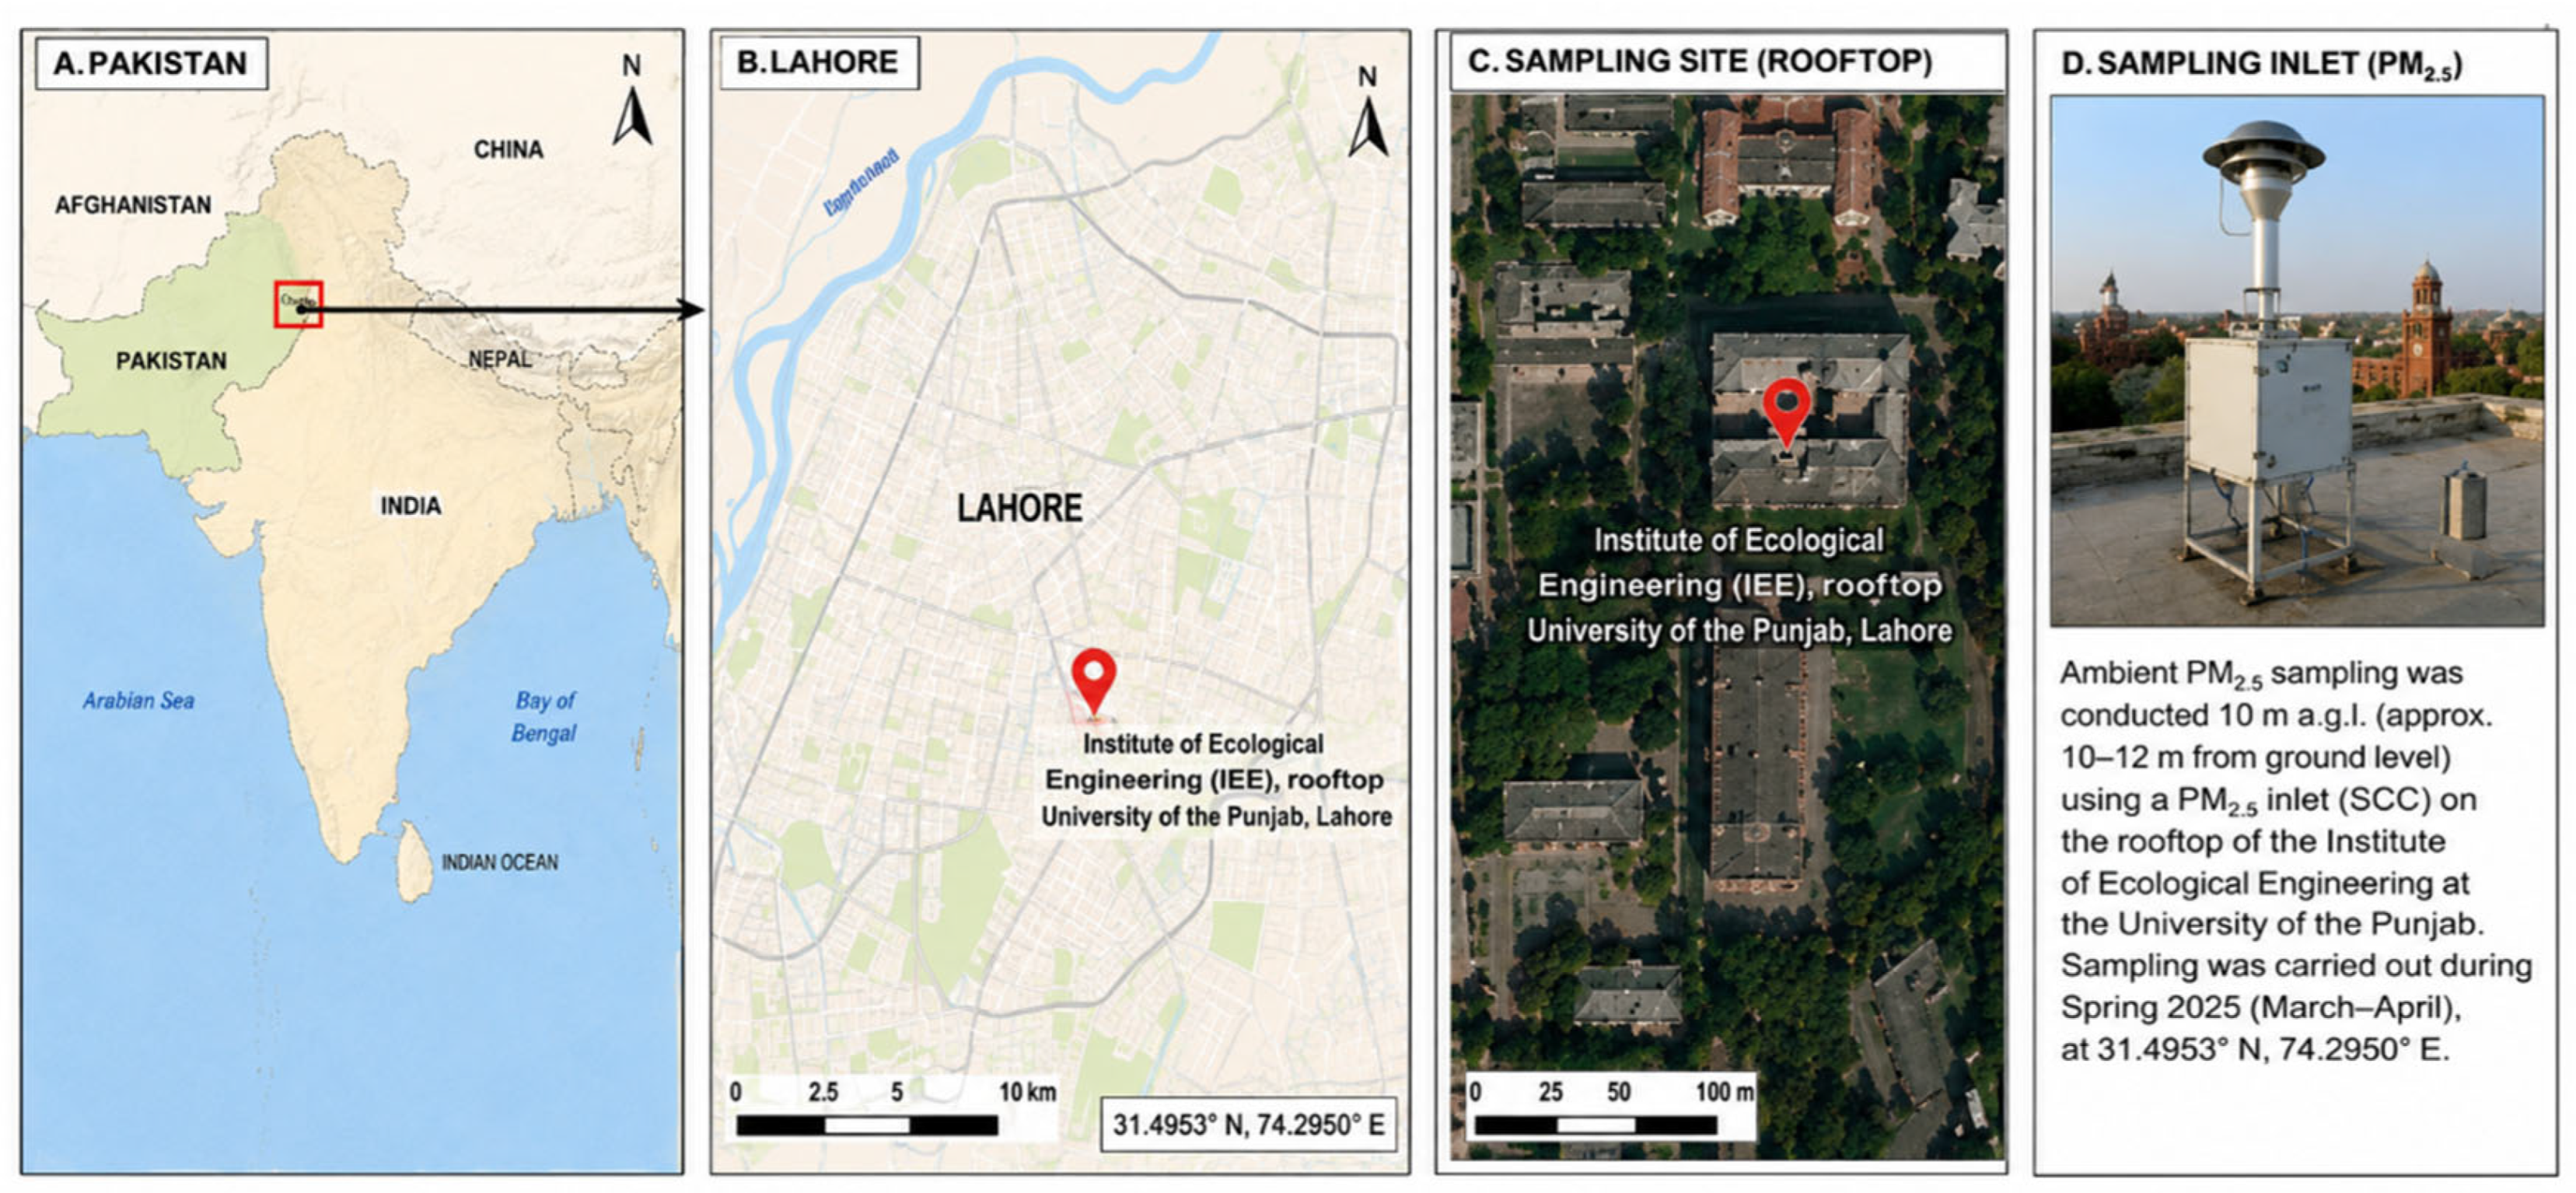
Figure 2.
Sample-wise PM2.5 mass concentrations measured during the Lahore field campaign conducted between 15 March and 29 April 2025.
Figure 2.
Sample-wise PM2.5 mass concentrations measured during the Lahore field campaign conducted between 15 March and 29 April 2025.
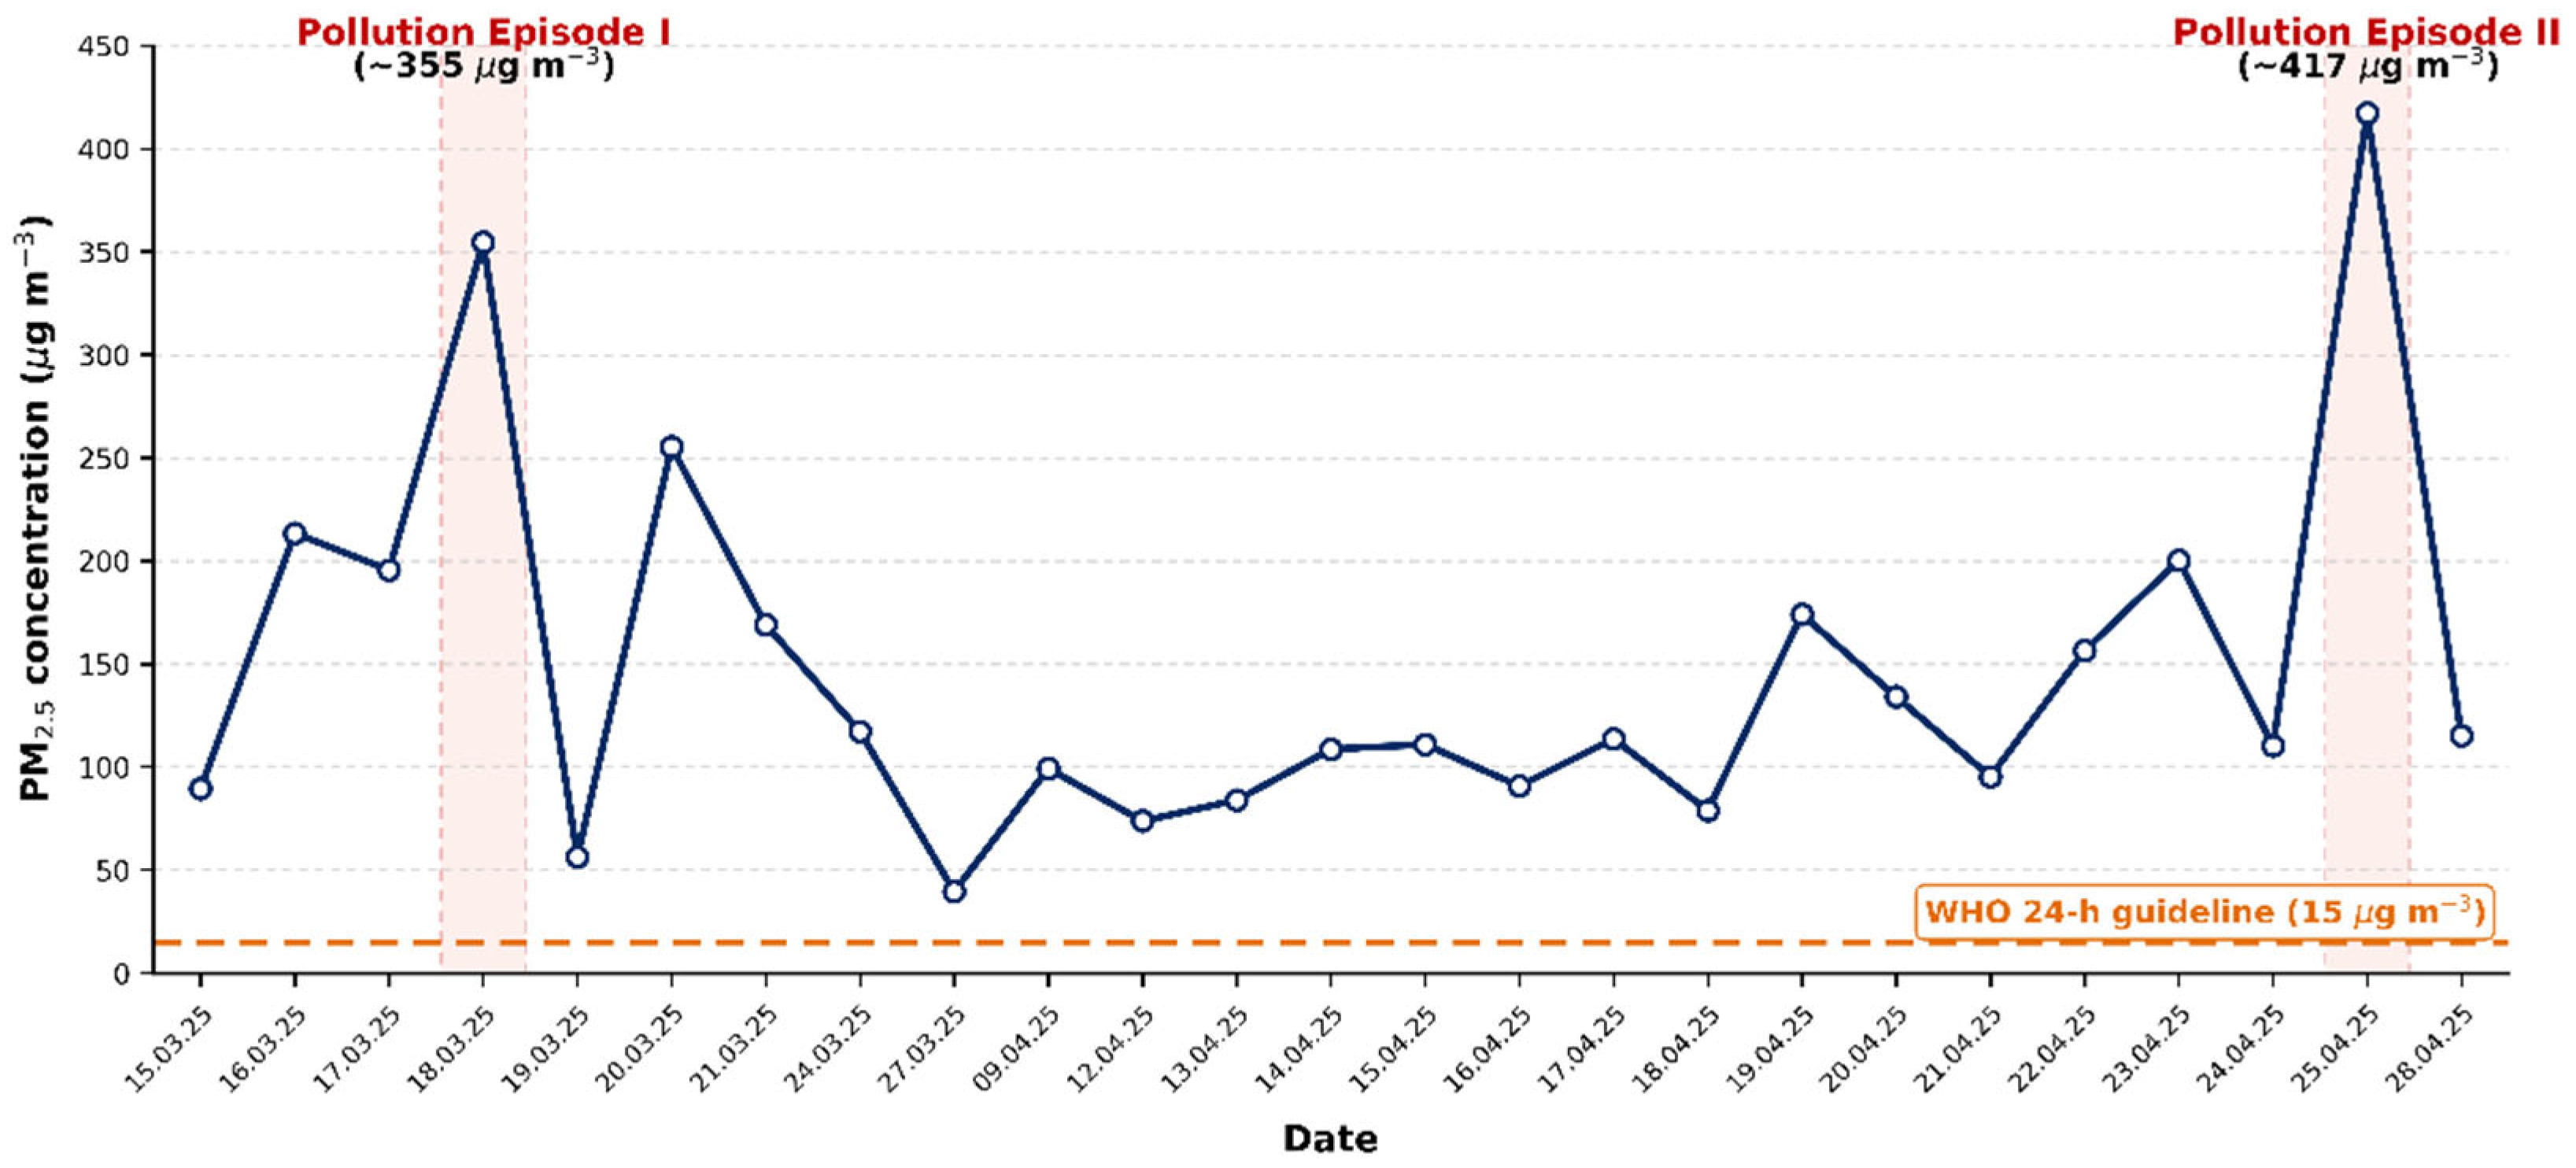
Figure 3.
Carbonaceous aerosol characteristics of the 15 PM2.5 samples selected for OC/EC analysis: (a) relative contribution of organic carbon (OC) and elemental carbon (EC) to total carbon (TC); (b) sample-wise variation of the OC/EC ratio. The dashed horizontal line represents the mean OC/EC ratio, while the shaded region indicates ±1 standard deviation. Samples with the lowest (S6) and highest (S12 and S15) OC/EC ratios are highlighted.
Figure 3.
Carbonaceous aerosol characteristics of the 15 PM2.5 samples selected for OC/EC analysis: (a) relative contribution of organic carbon (OC) and elemental carbon (EC) to total carbon (TC); (b) sample-wise variation of the OC/EC ratio. The dashed horizontal line represents the mean OC/EC ratio, while the shaded region indicates ±1 standard deviation. Samples with the lowest (S6) and highest (S12 and S15) OC/EC ratios are highlighted.
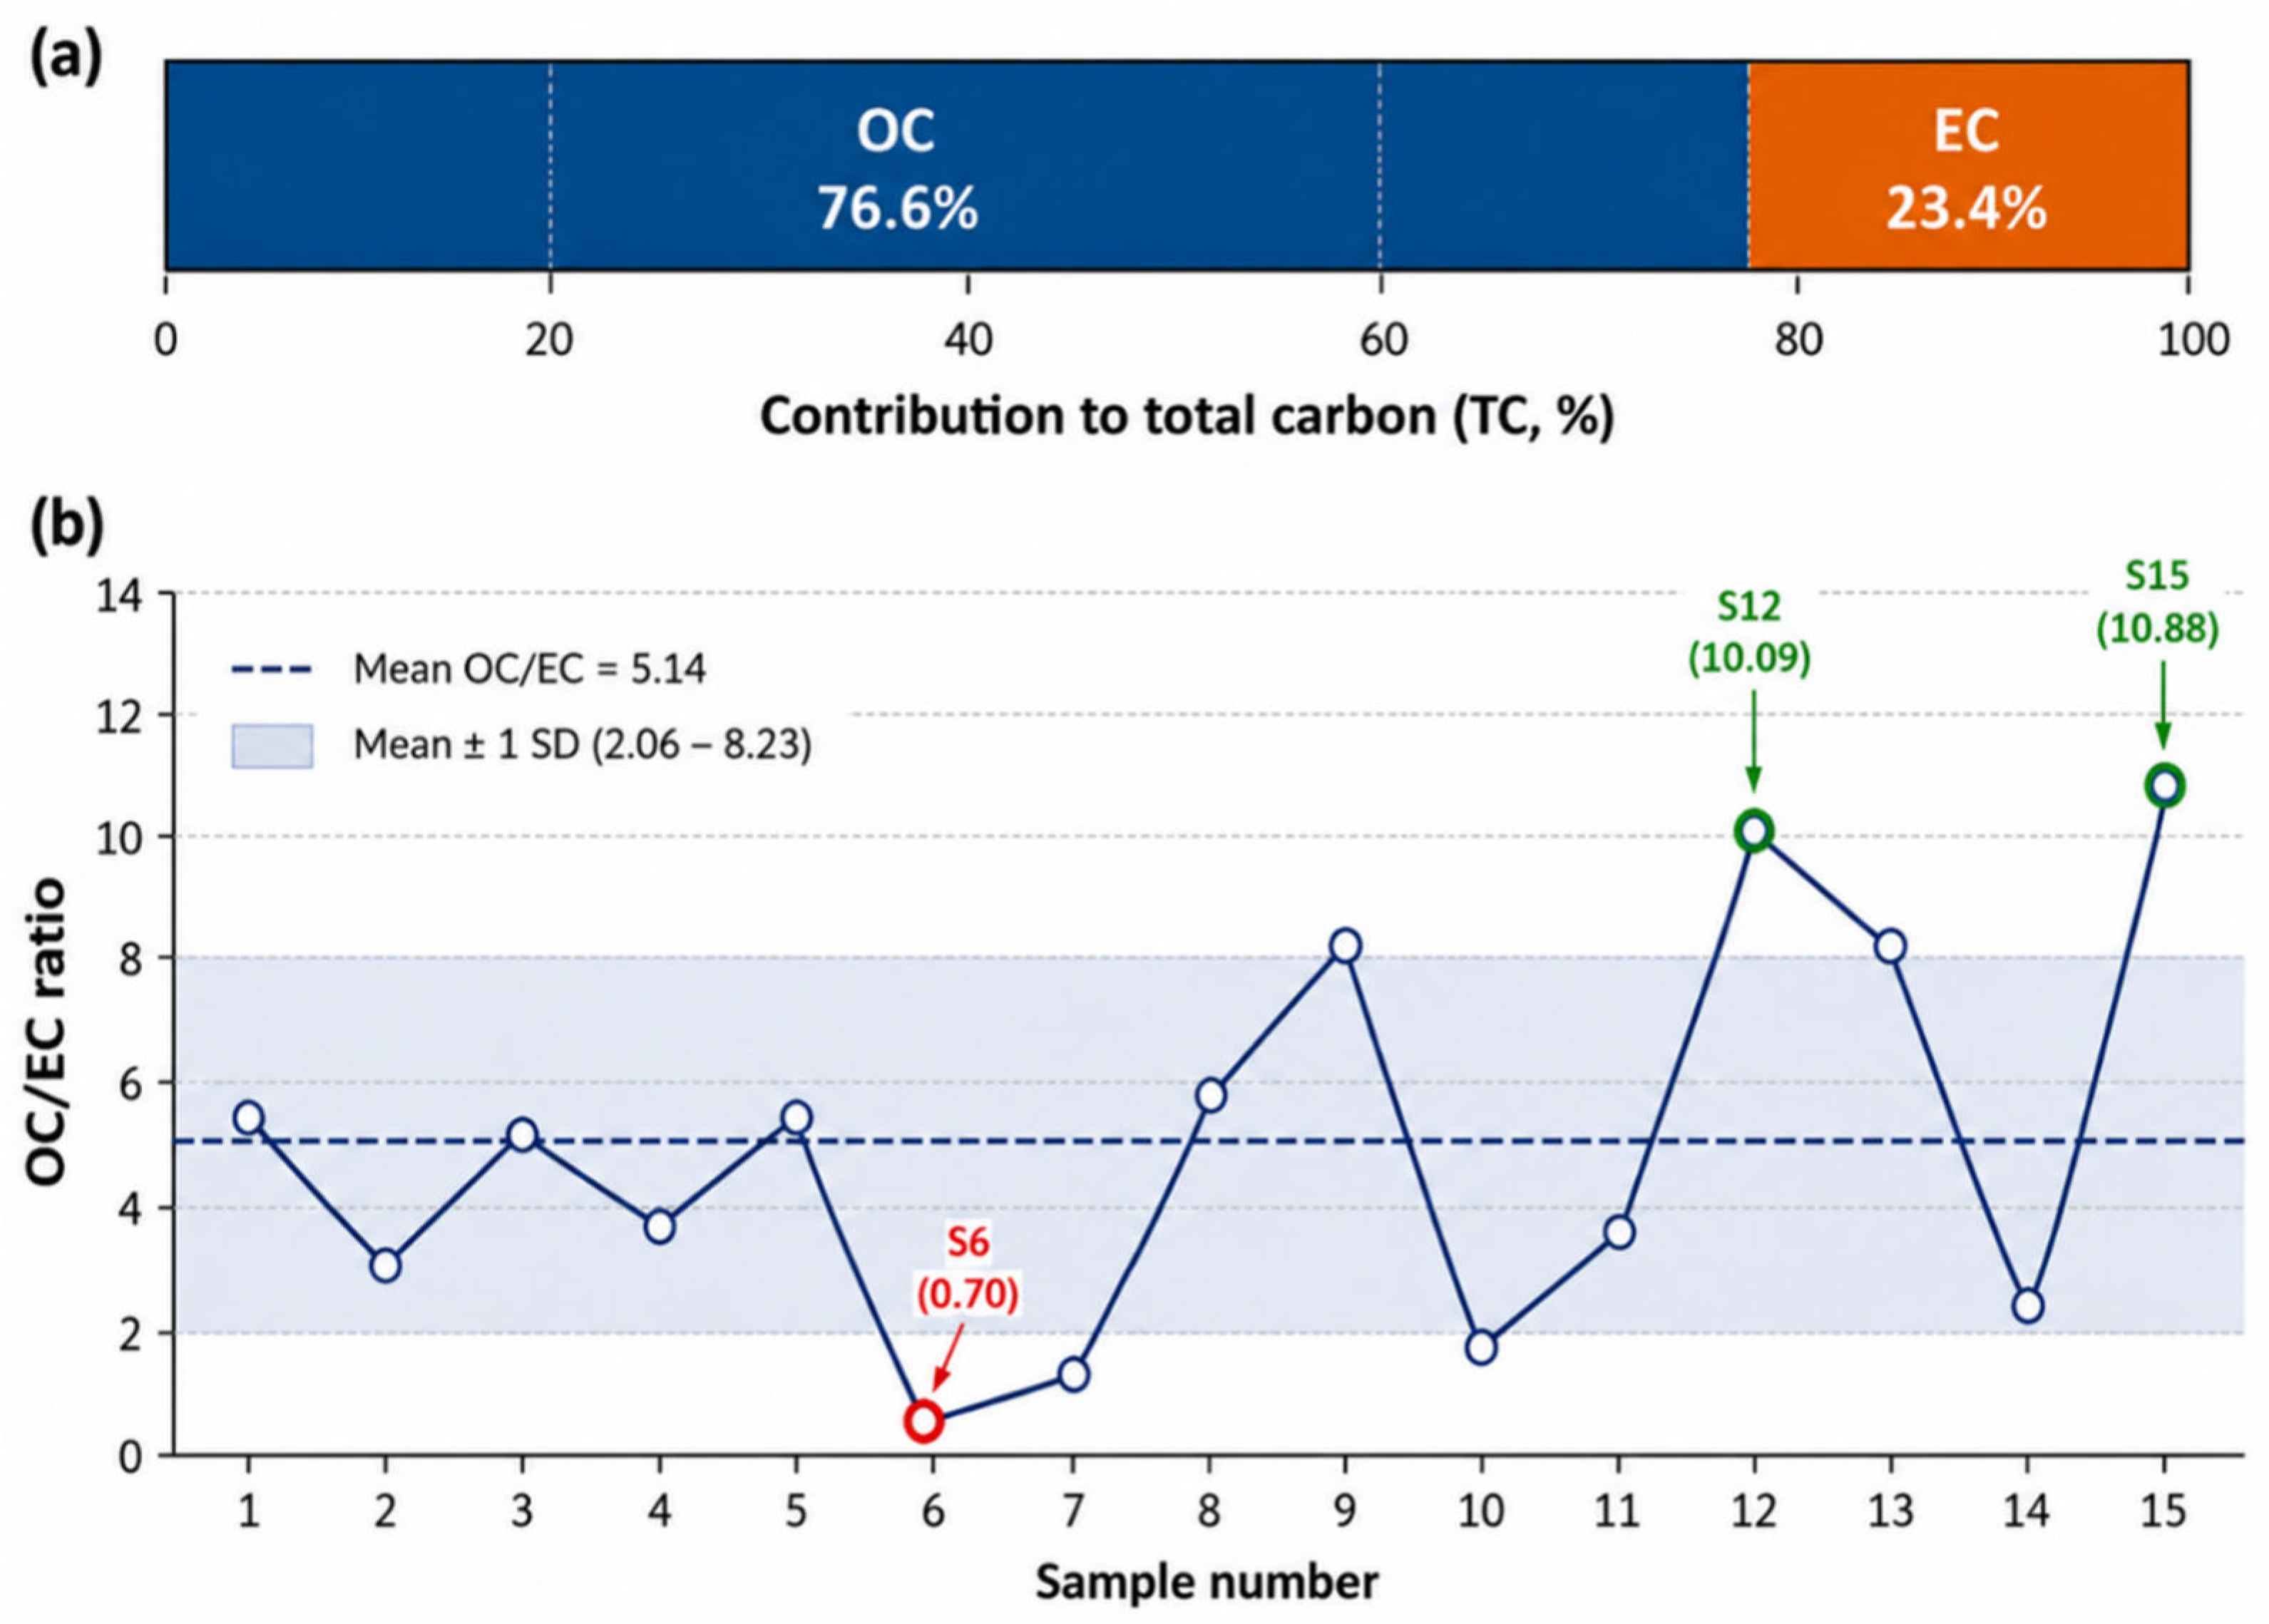
Figure 4.
Sample-wise aerosol absorption coefficients () measured by the Multi-Wavelength Absorbance Analyzer (MWAA) at five wavelengths (375, 407, 532, 635, and 850 nm) for the 25 PM2.5 samples collected during the Lahore field campaign.
Figure 4.
Sample-wise aerosol absorption coefficients () measured by the Multi-Wavelength Absorbance Analyzer (MWAA) at five wavelengths (375, 407, 532, 635, and 850 nm) for the 25 PM2.5 samples collected during the Lahore field campaign.
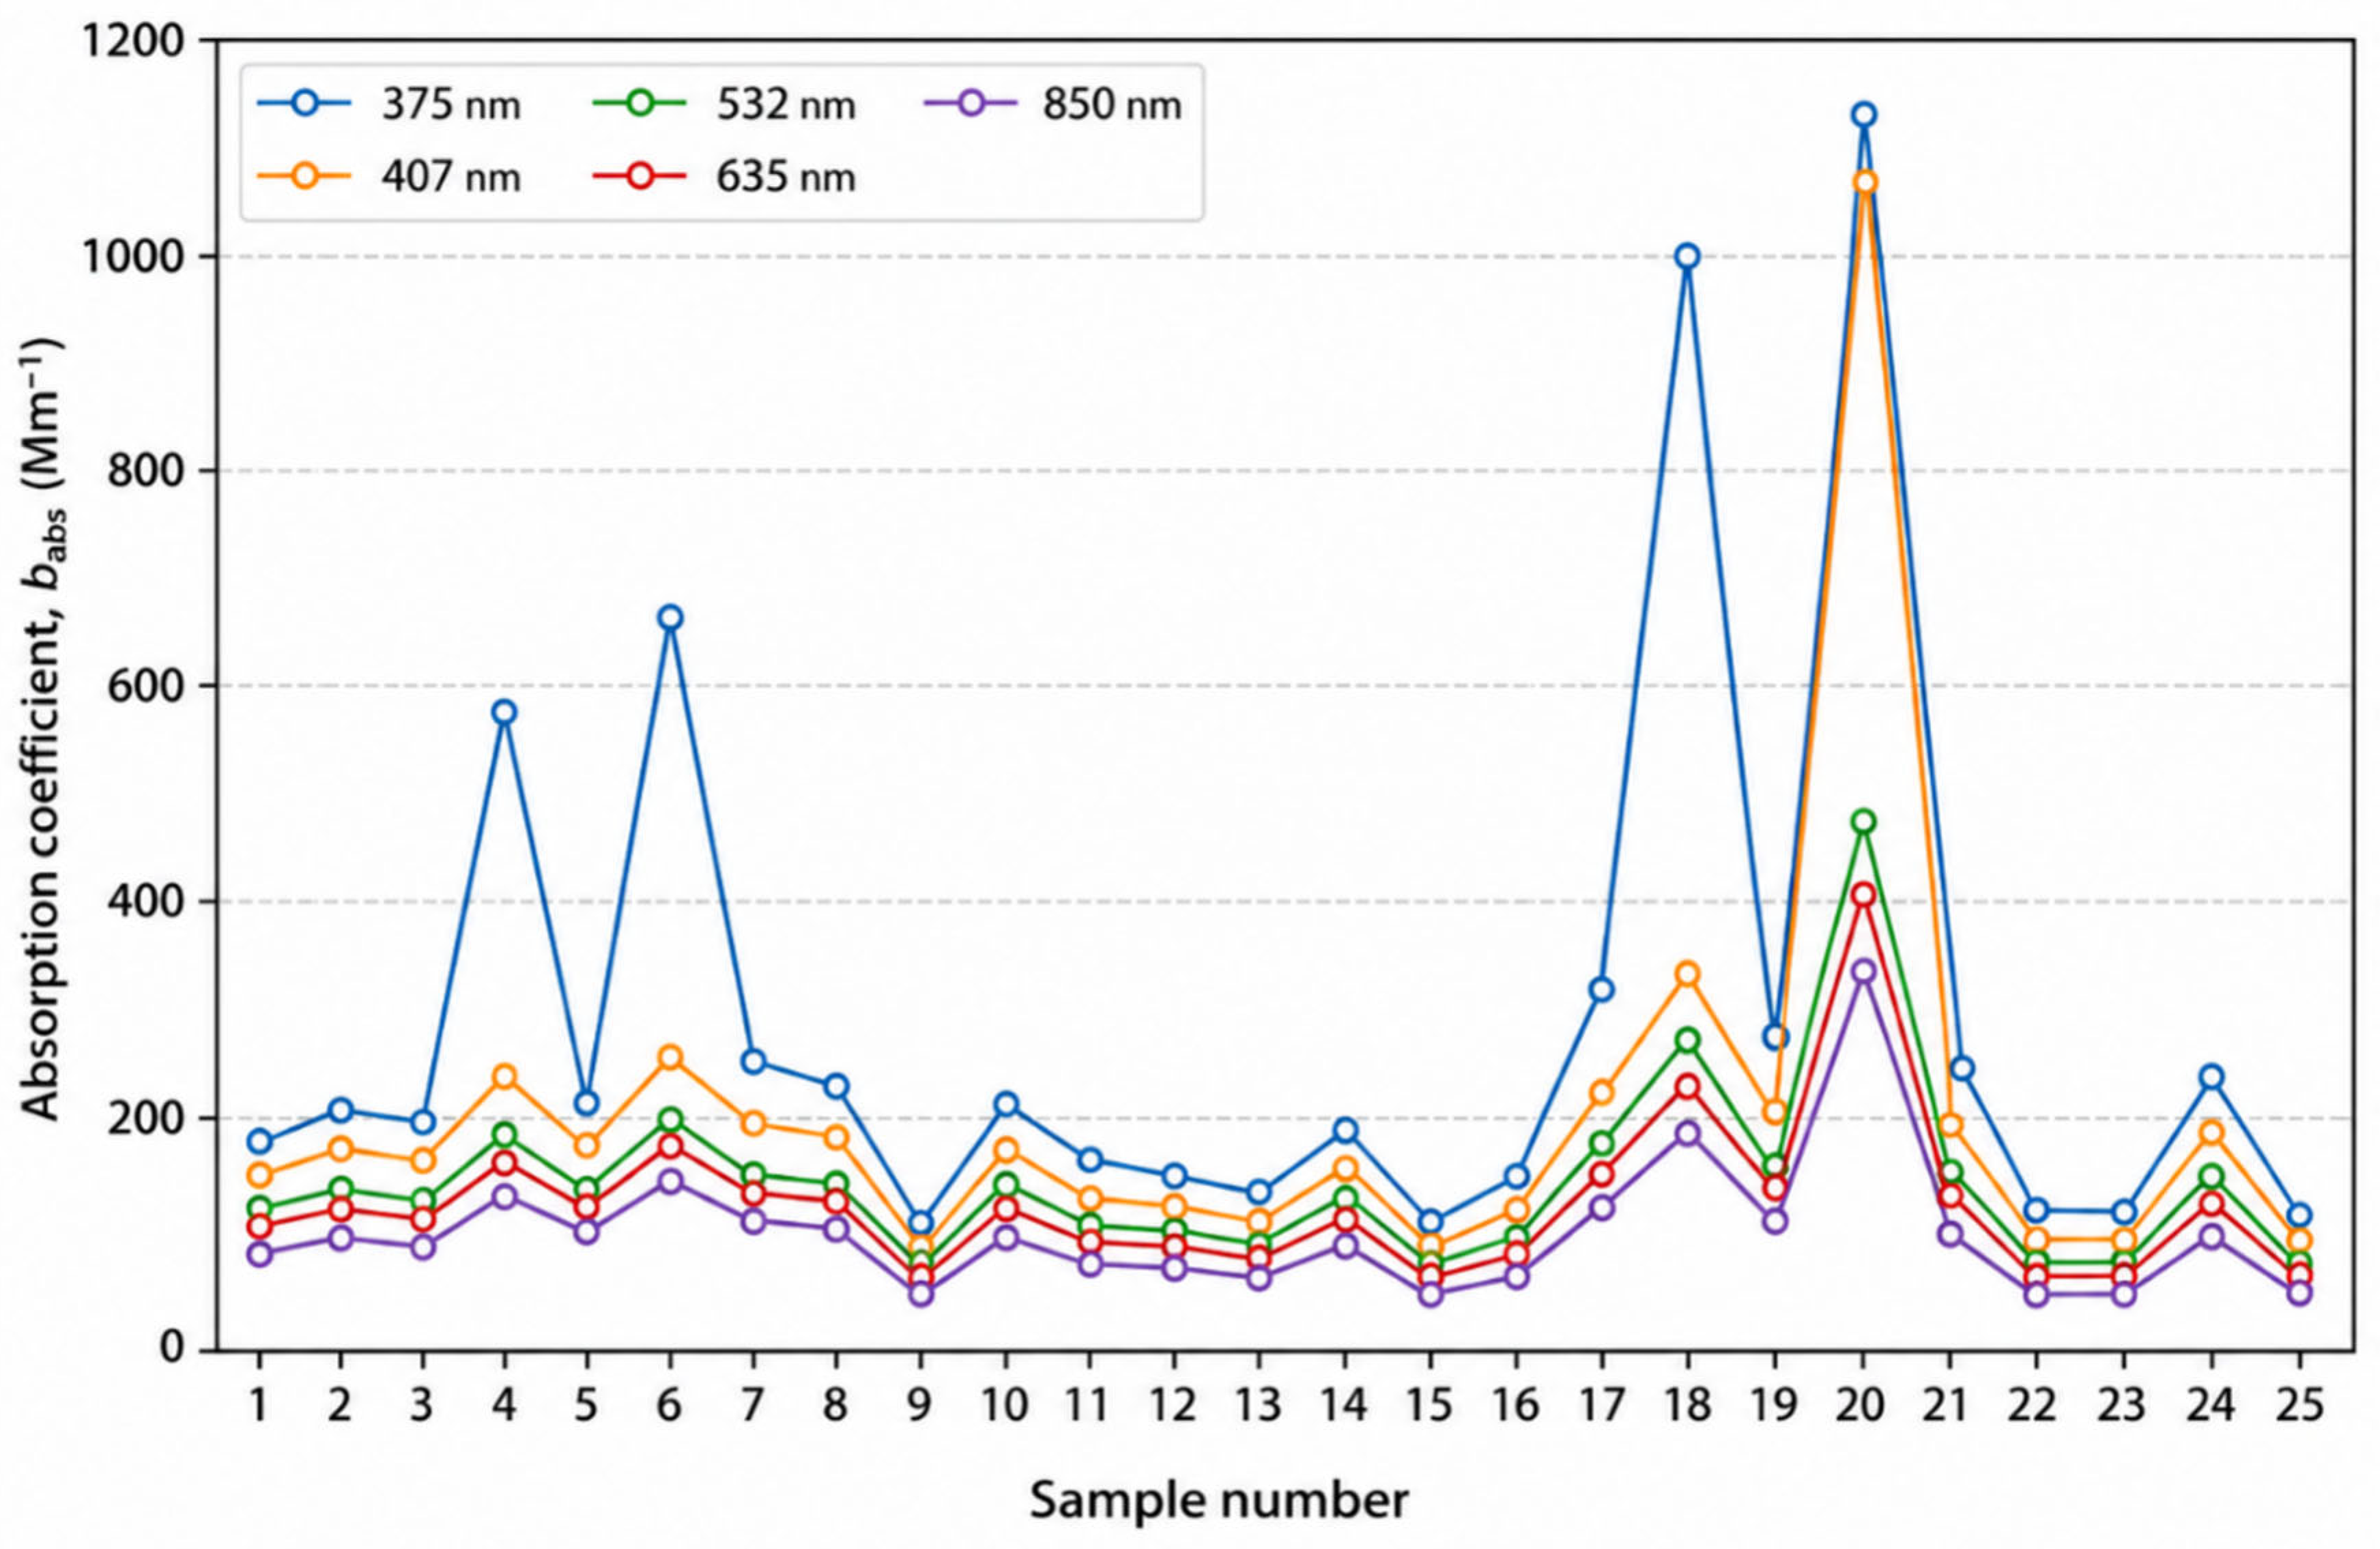
Figure 5.
Relationship between elemental carbon (EC) concentration determined by thermal–optical analysis (Sunset OC/EC analyzer) and the aerosol absorption coefficient measured at 850 nm by the Multi-Wavelength Absorbance Analyzer (MWAA). The solid line represents the linear regression, while the shaded area indicates the 95% confidence interval.
Figure 5.
Relationship between elemental carbon (EC) concentration determined by thermal–optical analysis (Sunset OC/EC analyzer) and the aerosol absorption coefficient measured at 850 nm by the Multi-Wavelength Absorbance Analyzer (MWAA). The solid line represents the linear regression, while the shaded area indicates the 95% confidence interval.
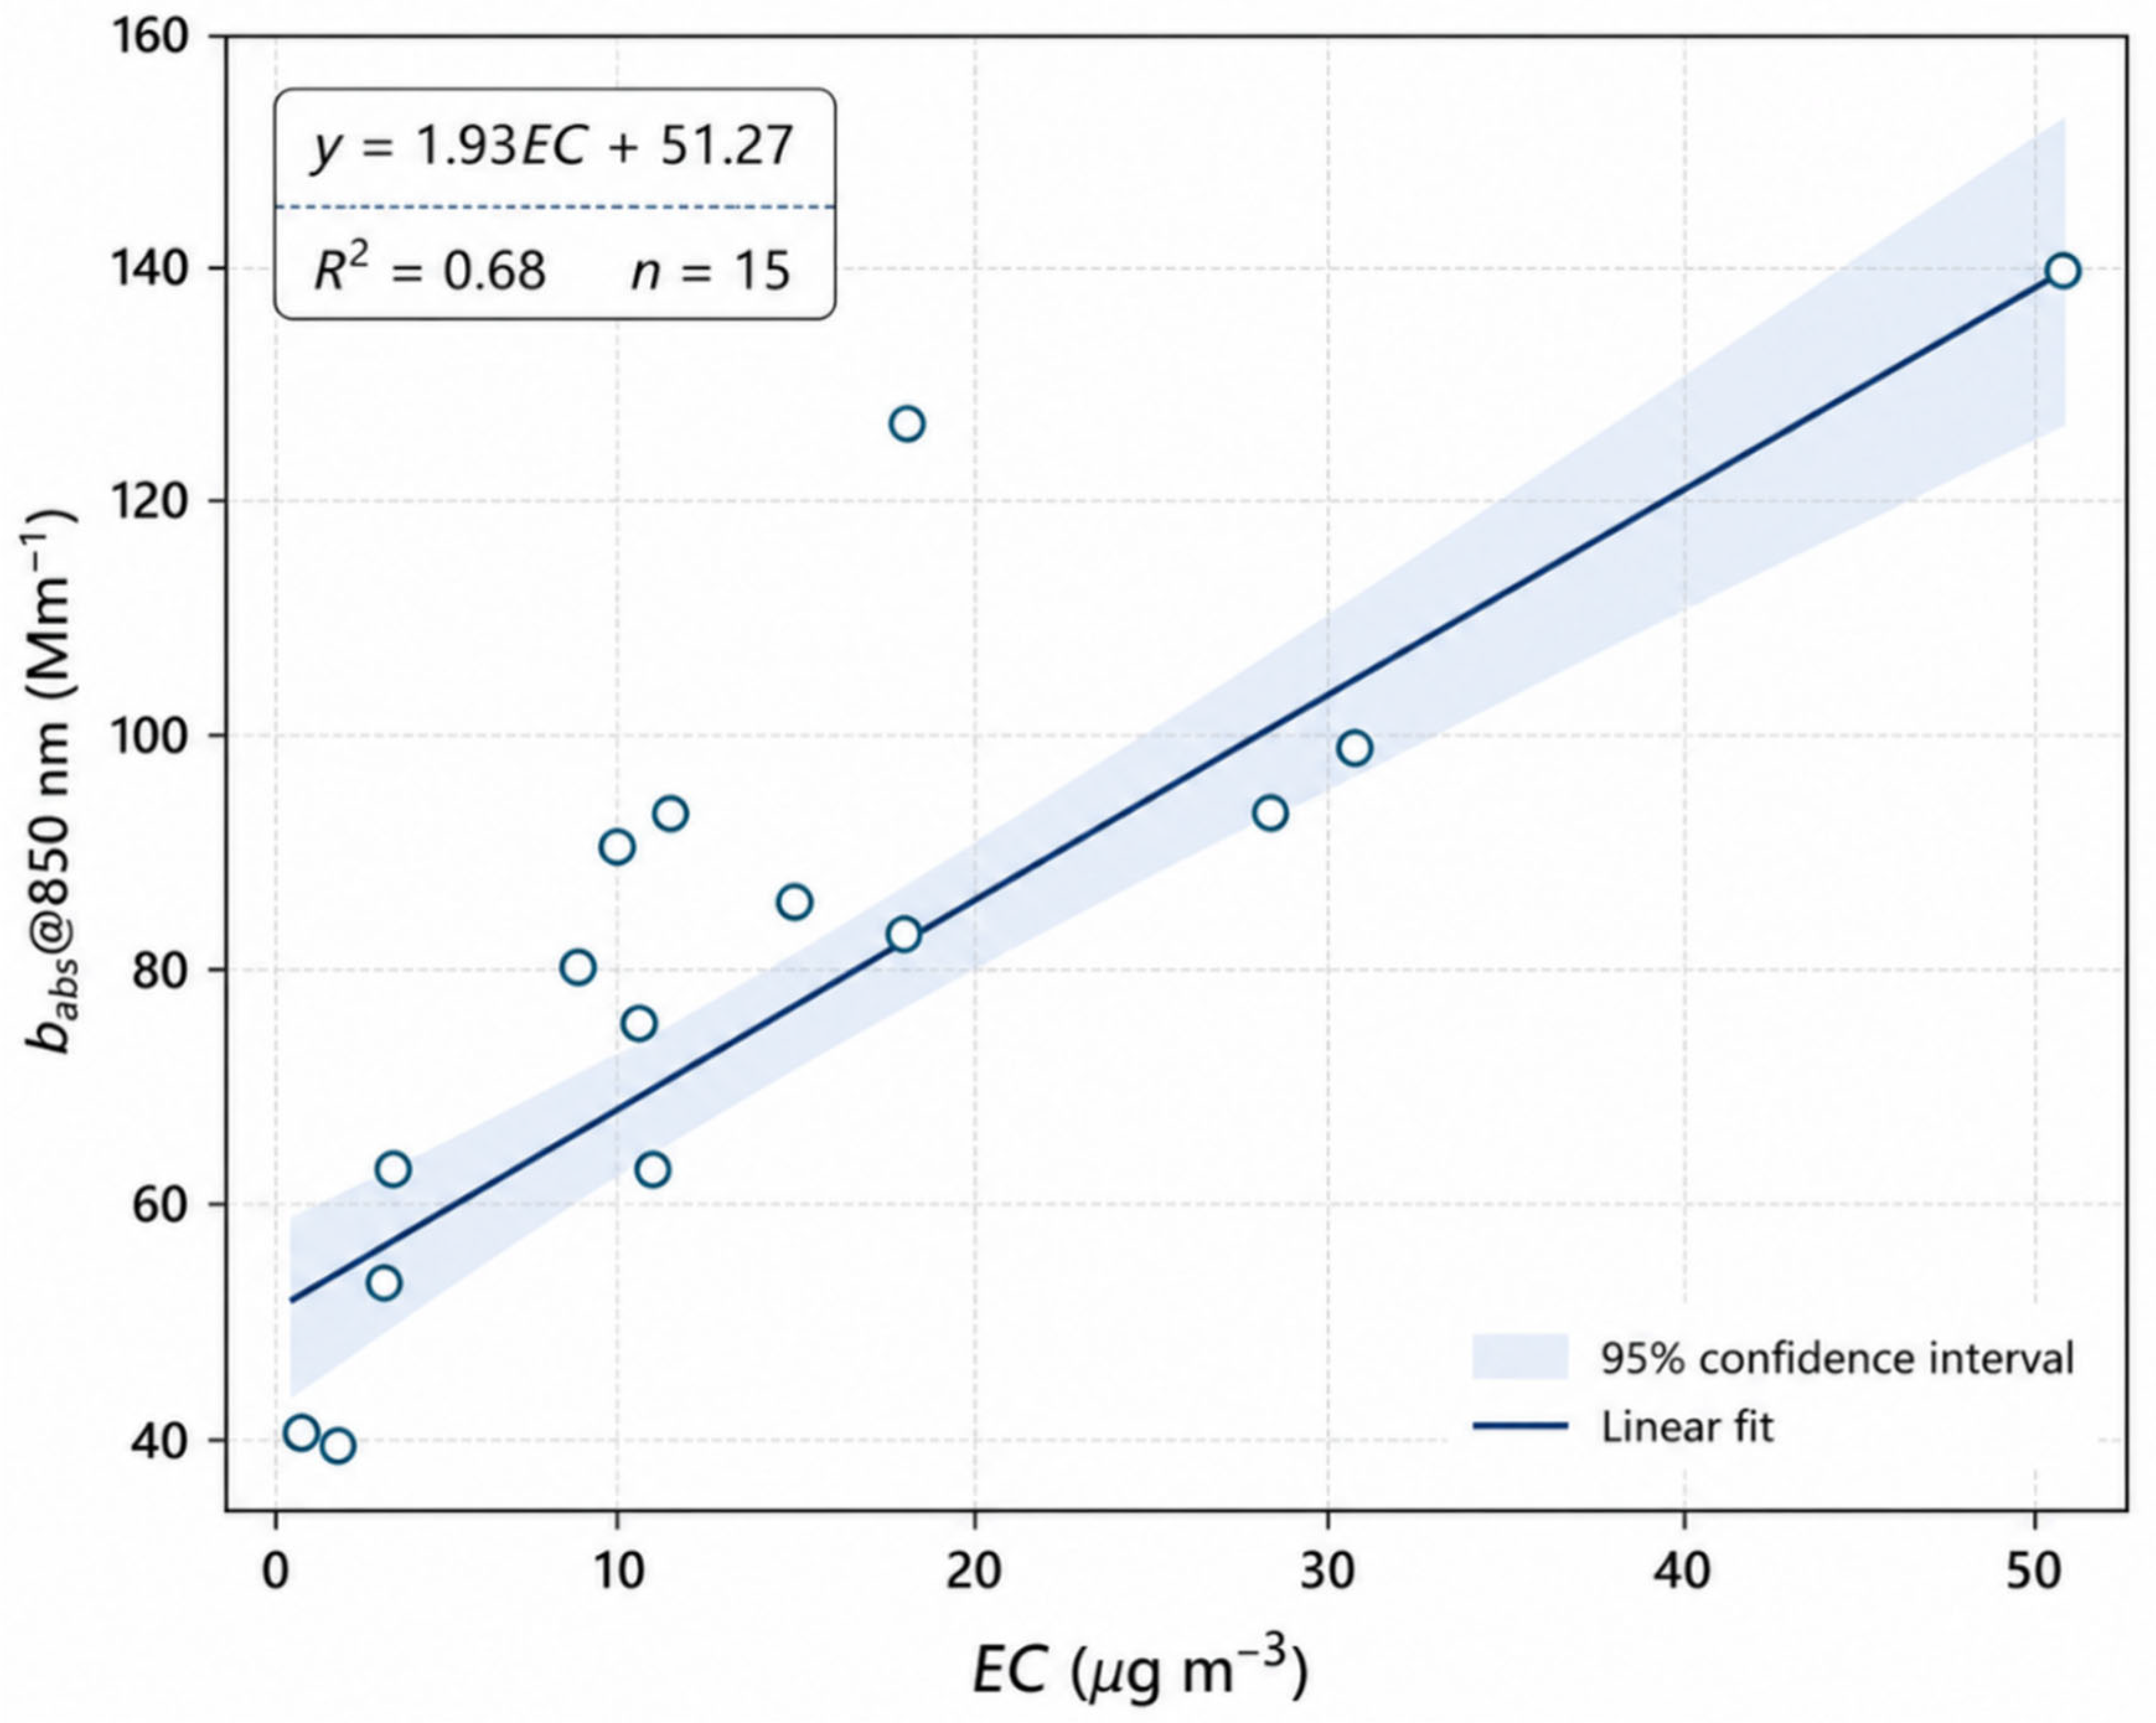
Figure 6.
Sample-wise variation of the absorption Ångström exponent (AAE) calculated over three wavelength ranges (375–850, 407–850, and 532–850 nm) for PM2.5 samples collected in Lahore. The solid black line represents AAE calculated using the full wavelength range (375–850 nm), whereas the grey dashed lines correspond to AAE derived from the 407–850 and 532–850 nm wavelength intervals. The horizontal dashed line at AAE = 1 indicates the approximate threshold commonly associated with black carbon from fossil-fuel combustion.
Figure 6.
Sample-wise variation of the absorption Ångström exponent (AAE) calculated over three wavelength ranges (375–850, 407–850, and 532–850 nm) for PM2.5 samples collected in Lahore. The solid black line represents AAE calculated using the full wavelength range (375–850 nm), whereas the grey dashed lines correspond to AAE derived from the 407–850 and 532–850 nm wavelength intervals. The horizontal dashed line at AAE = 1 indicates the approximate threshold commonly associated with black carbon from fossil-fuel combustion.
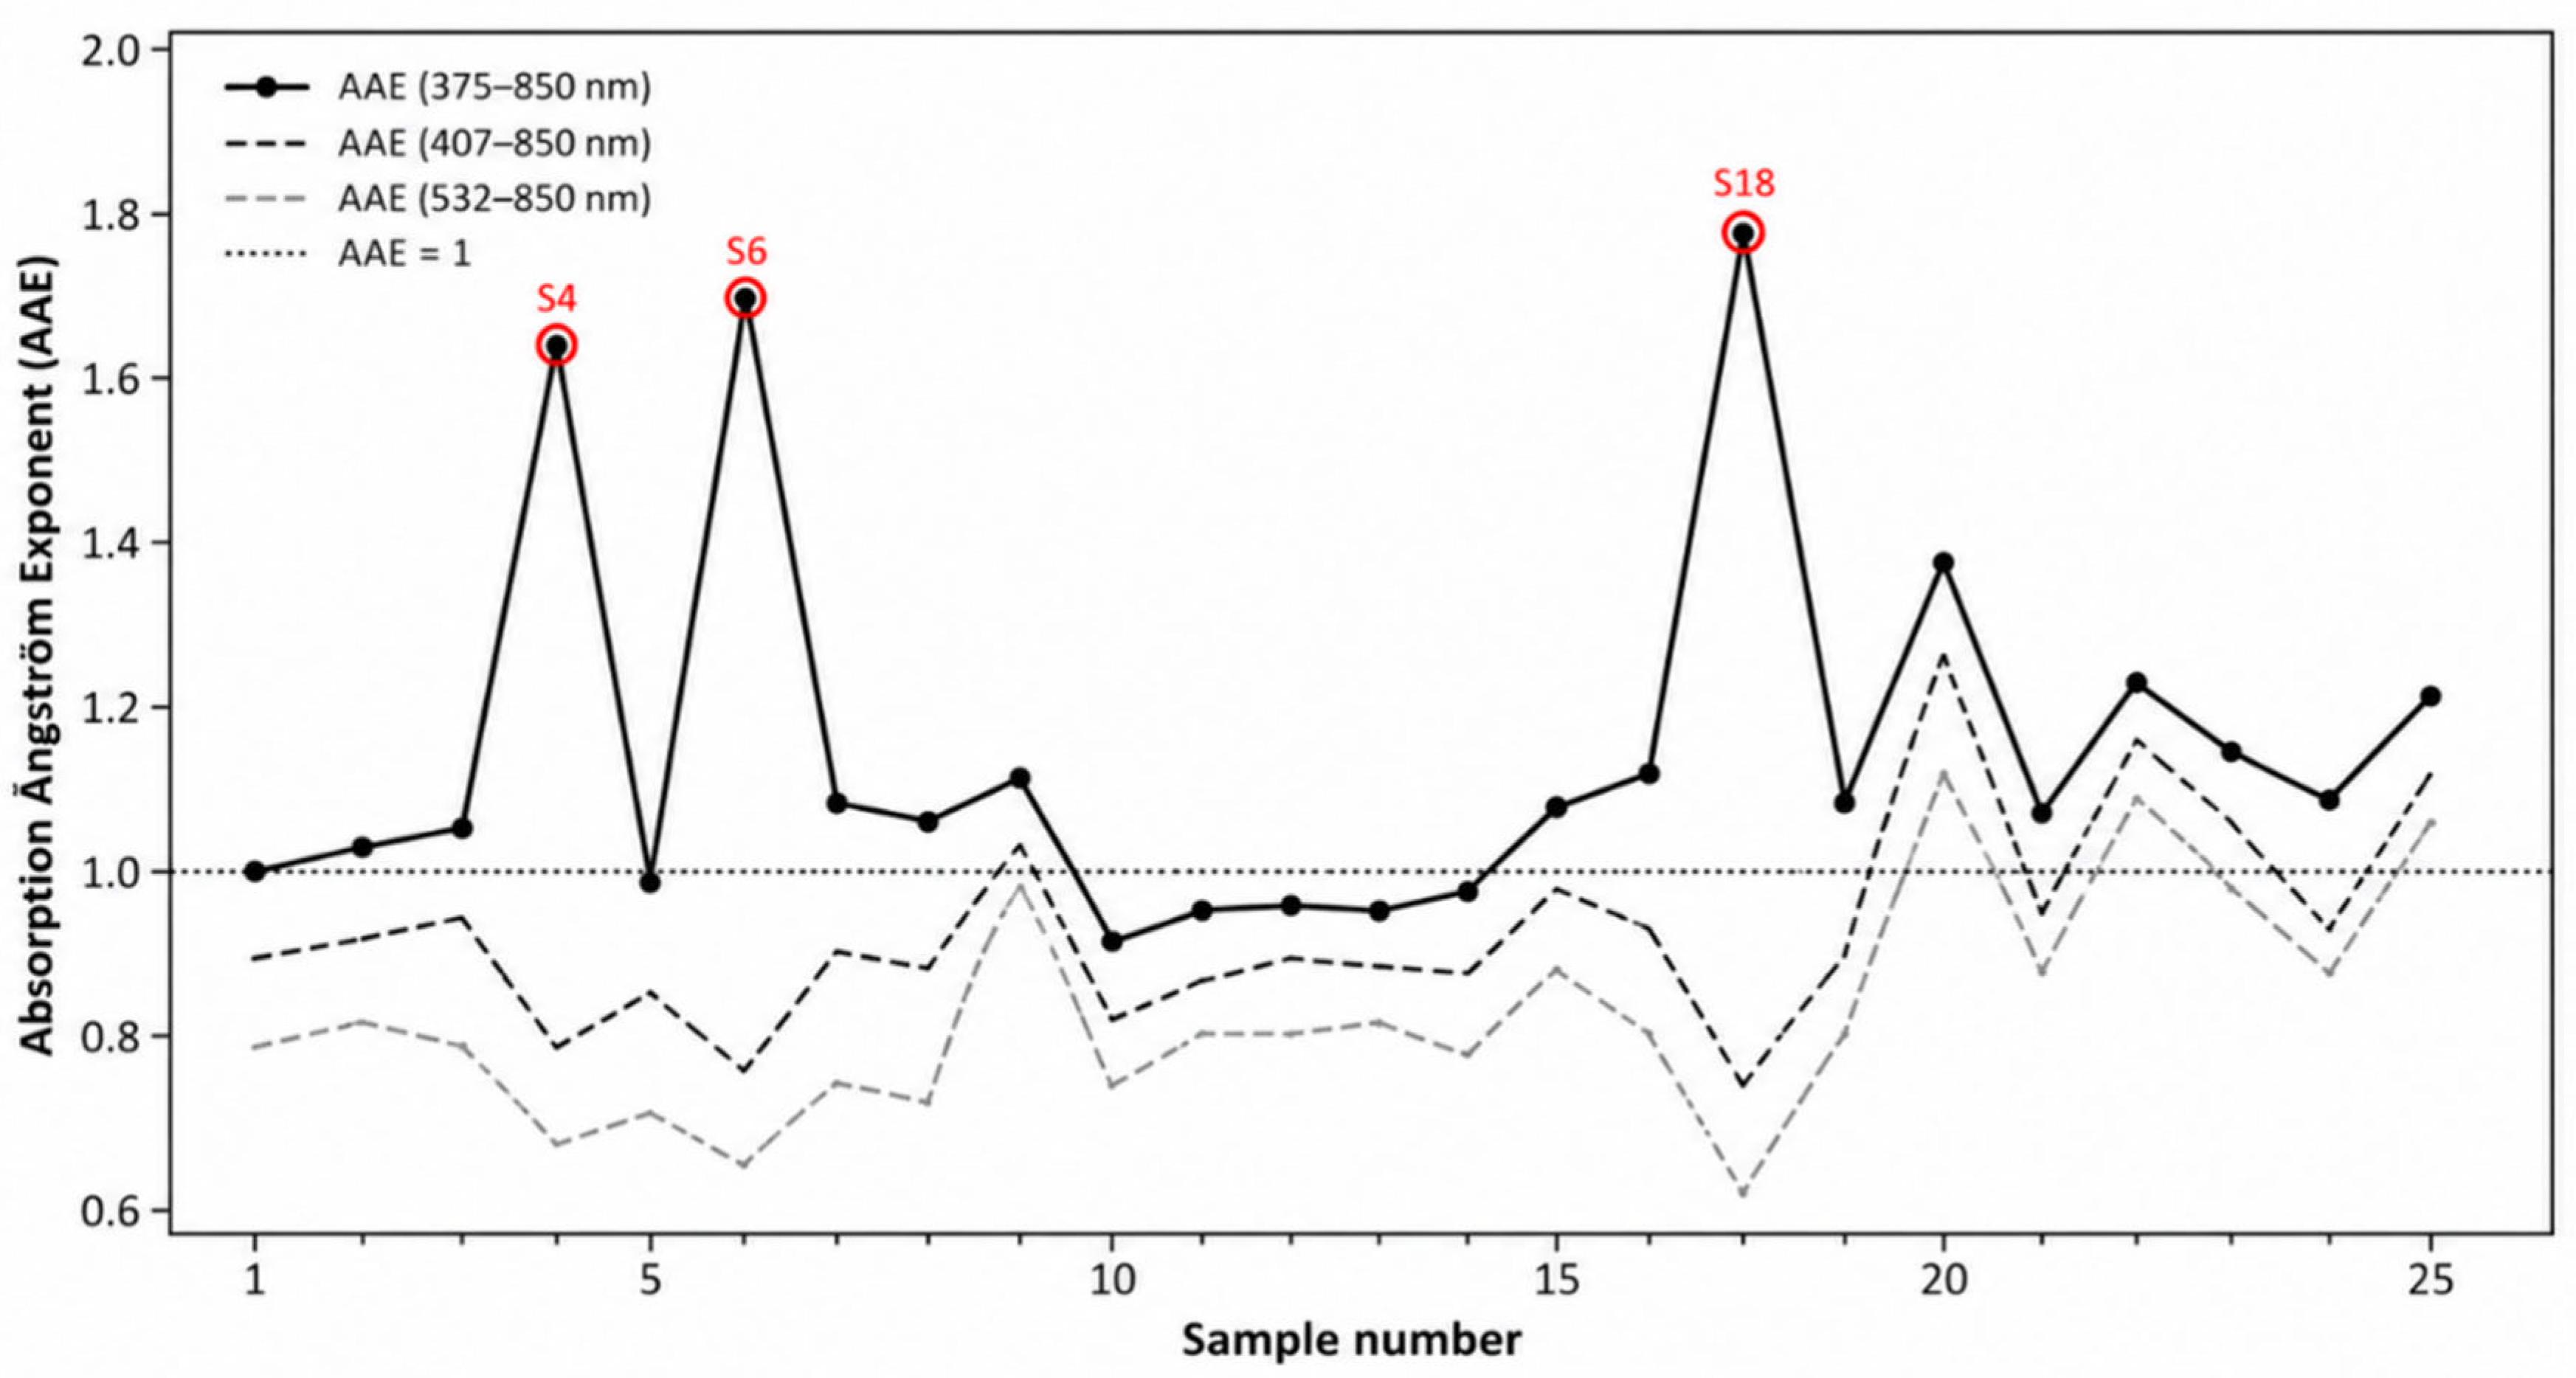
Figure 7.
Comparison of the absorption Ångström exponent (AAE) calculated over three wavelength ranges (375–850, 407–850, and 532–850 nm). Boxes represent the interquartile range (IQR), the central horizontal line indicates the median, whiskers extend to 1.5×IQR, and open circles represent outliers. Red diamonds denote the mean AAE values.
Figure 7.
Comparison of the absorption Ångström exponent (AAE) calculated over three wavelength ranges (375–850, 407–850, and 532–850 nm). Boxes represent the interquartile range (IQR), the central horizontal line indicates the median, whiskers extend to 1.5×IQR, and open circles represent outliers. Red diamonds denote the mean AAE values.
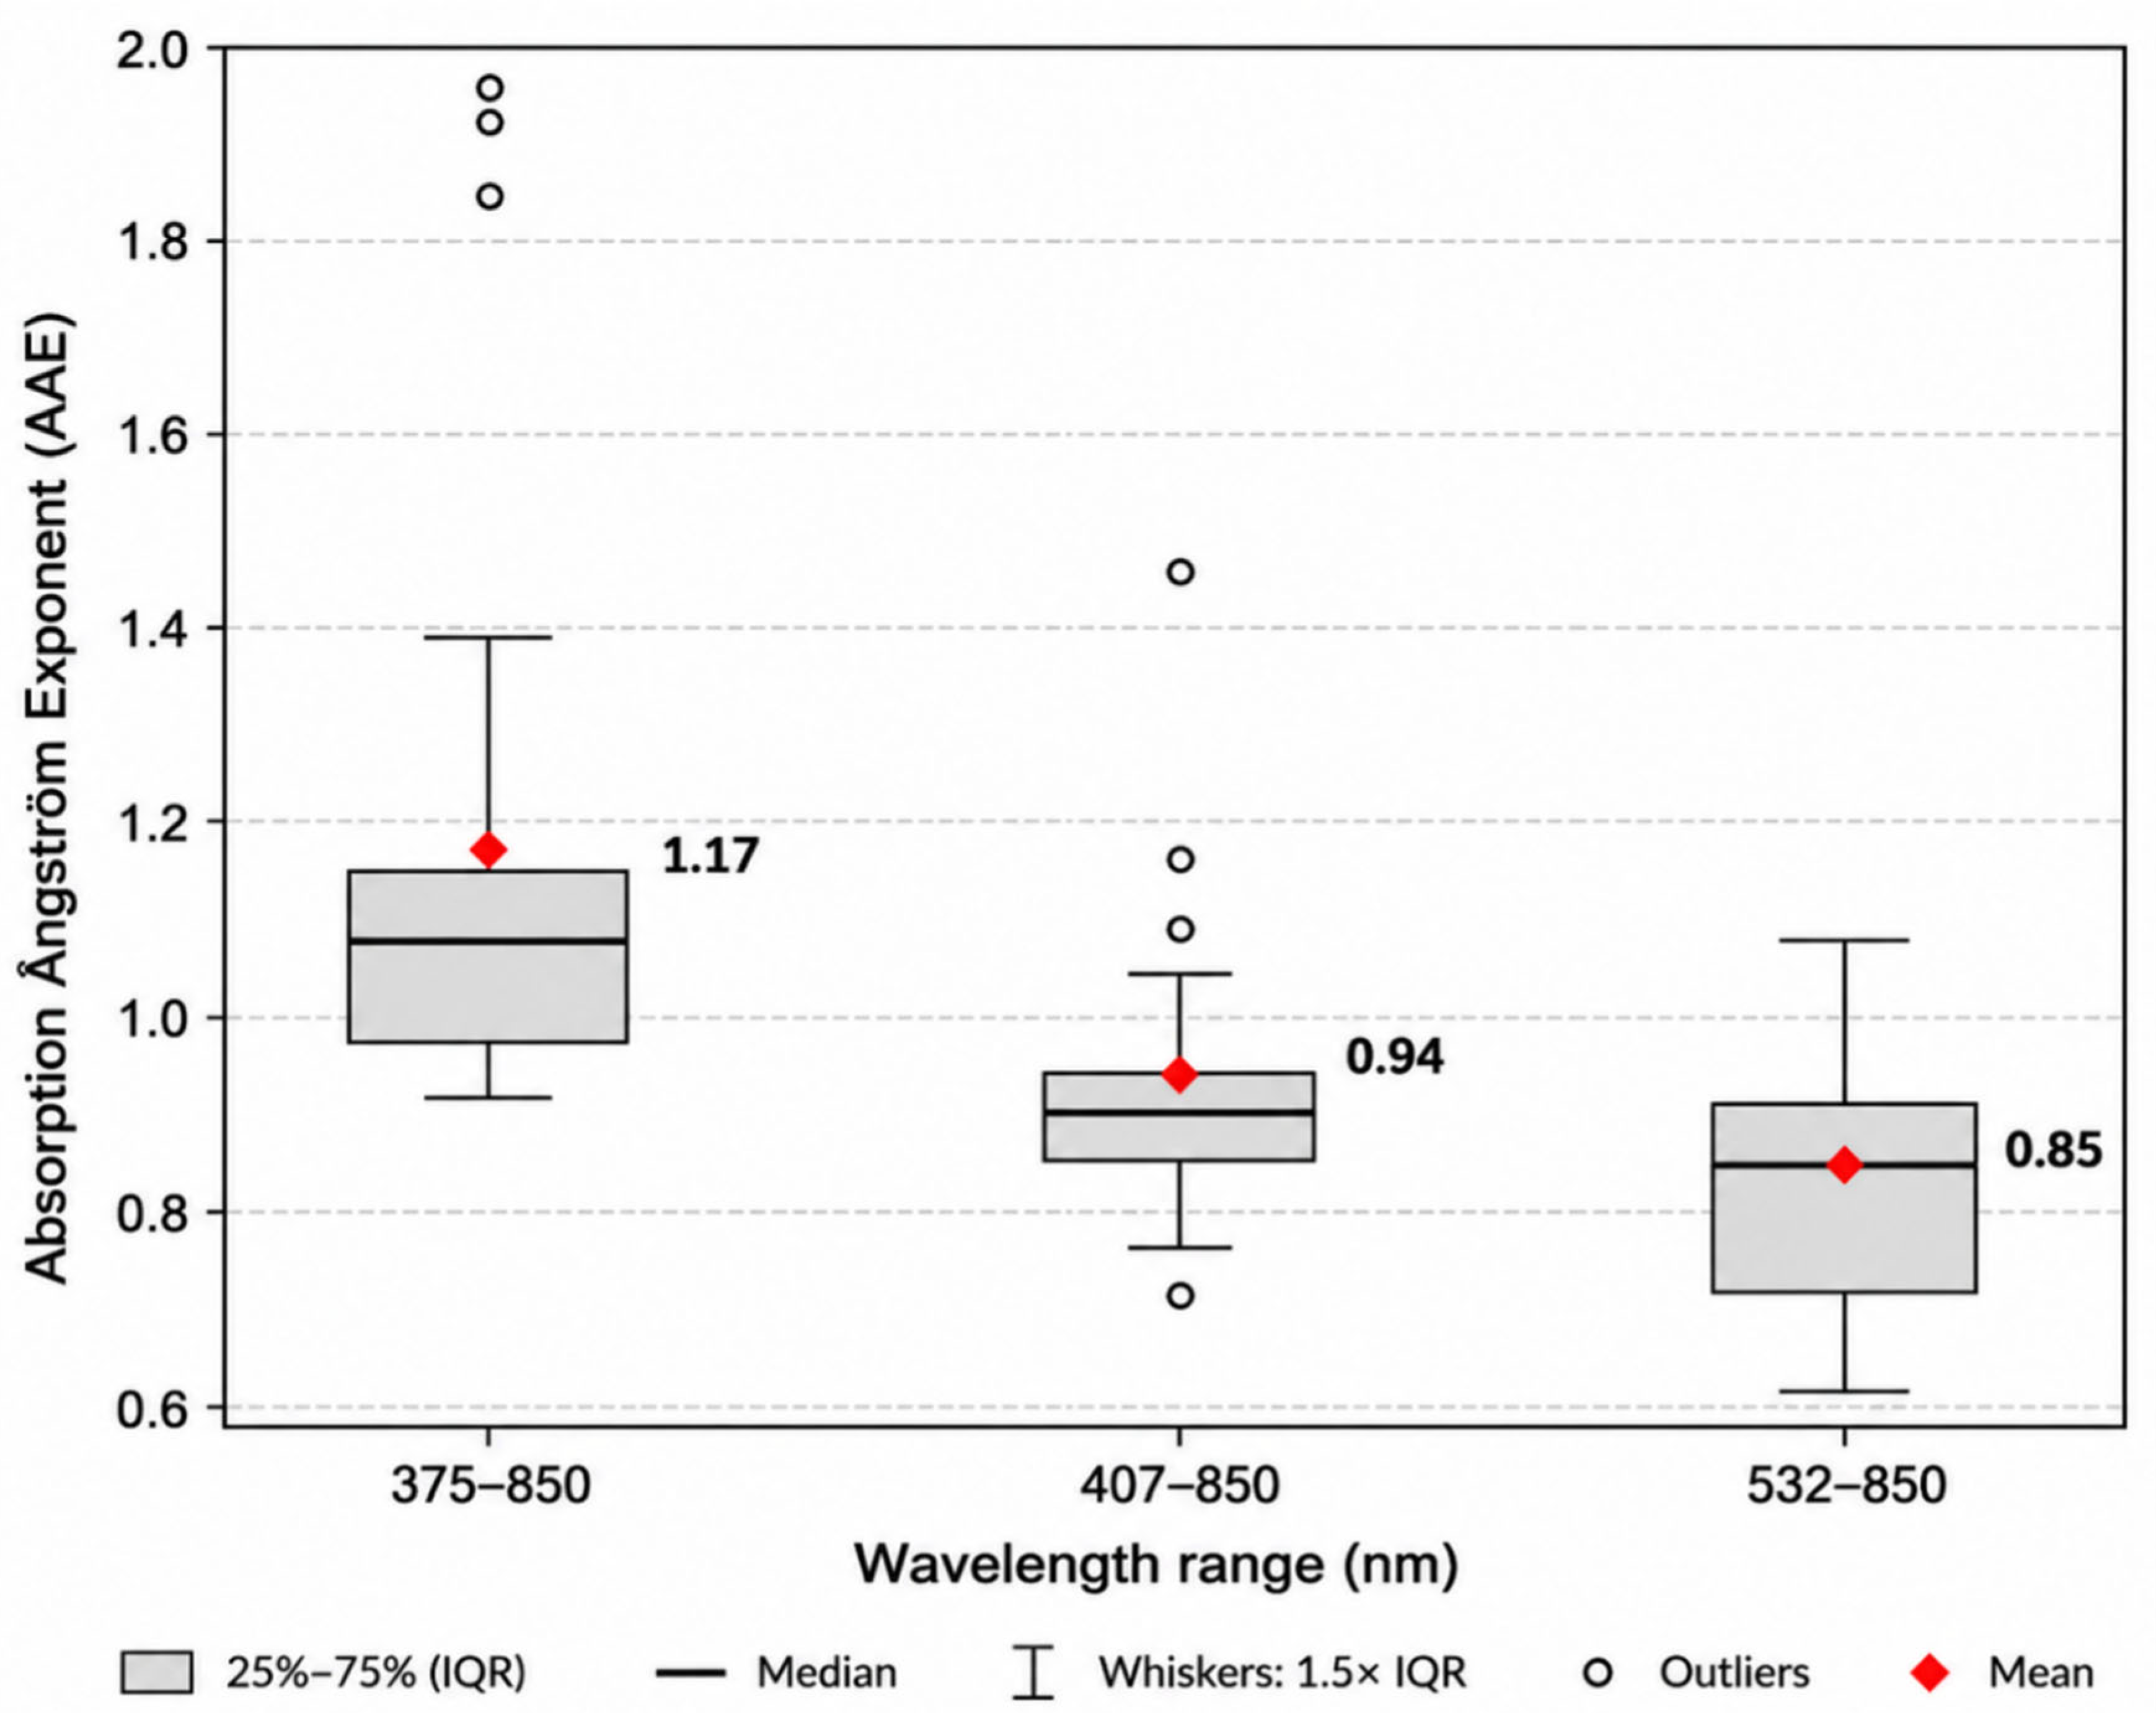
Figure 8.
Percentage distribution of PM₂.₅ samples among AAE-based source-influence categories calculated over the 375–850 nm wavelength range.
Figure 8.
Percentage distribution of PM₂.₅ samples among AAE-based source-influence categories calculated over the 375–850 nm wavelength range.
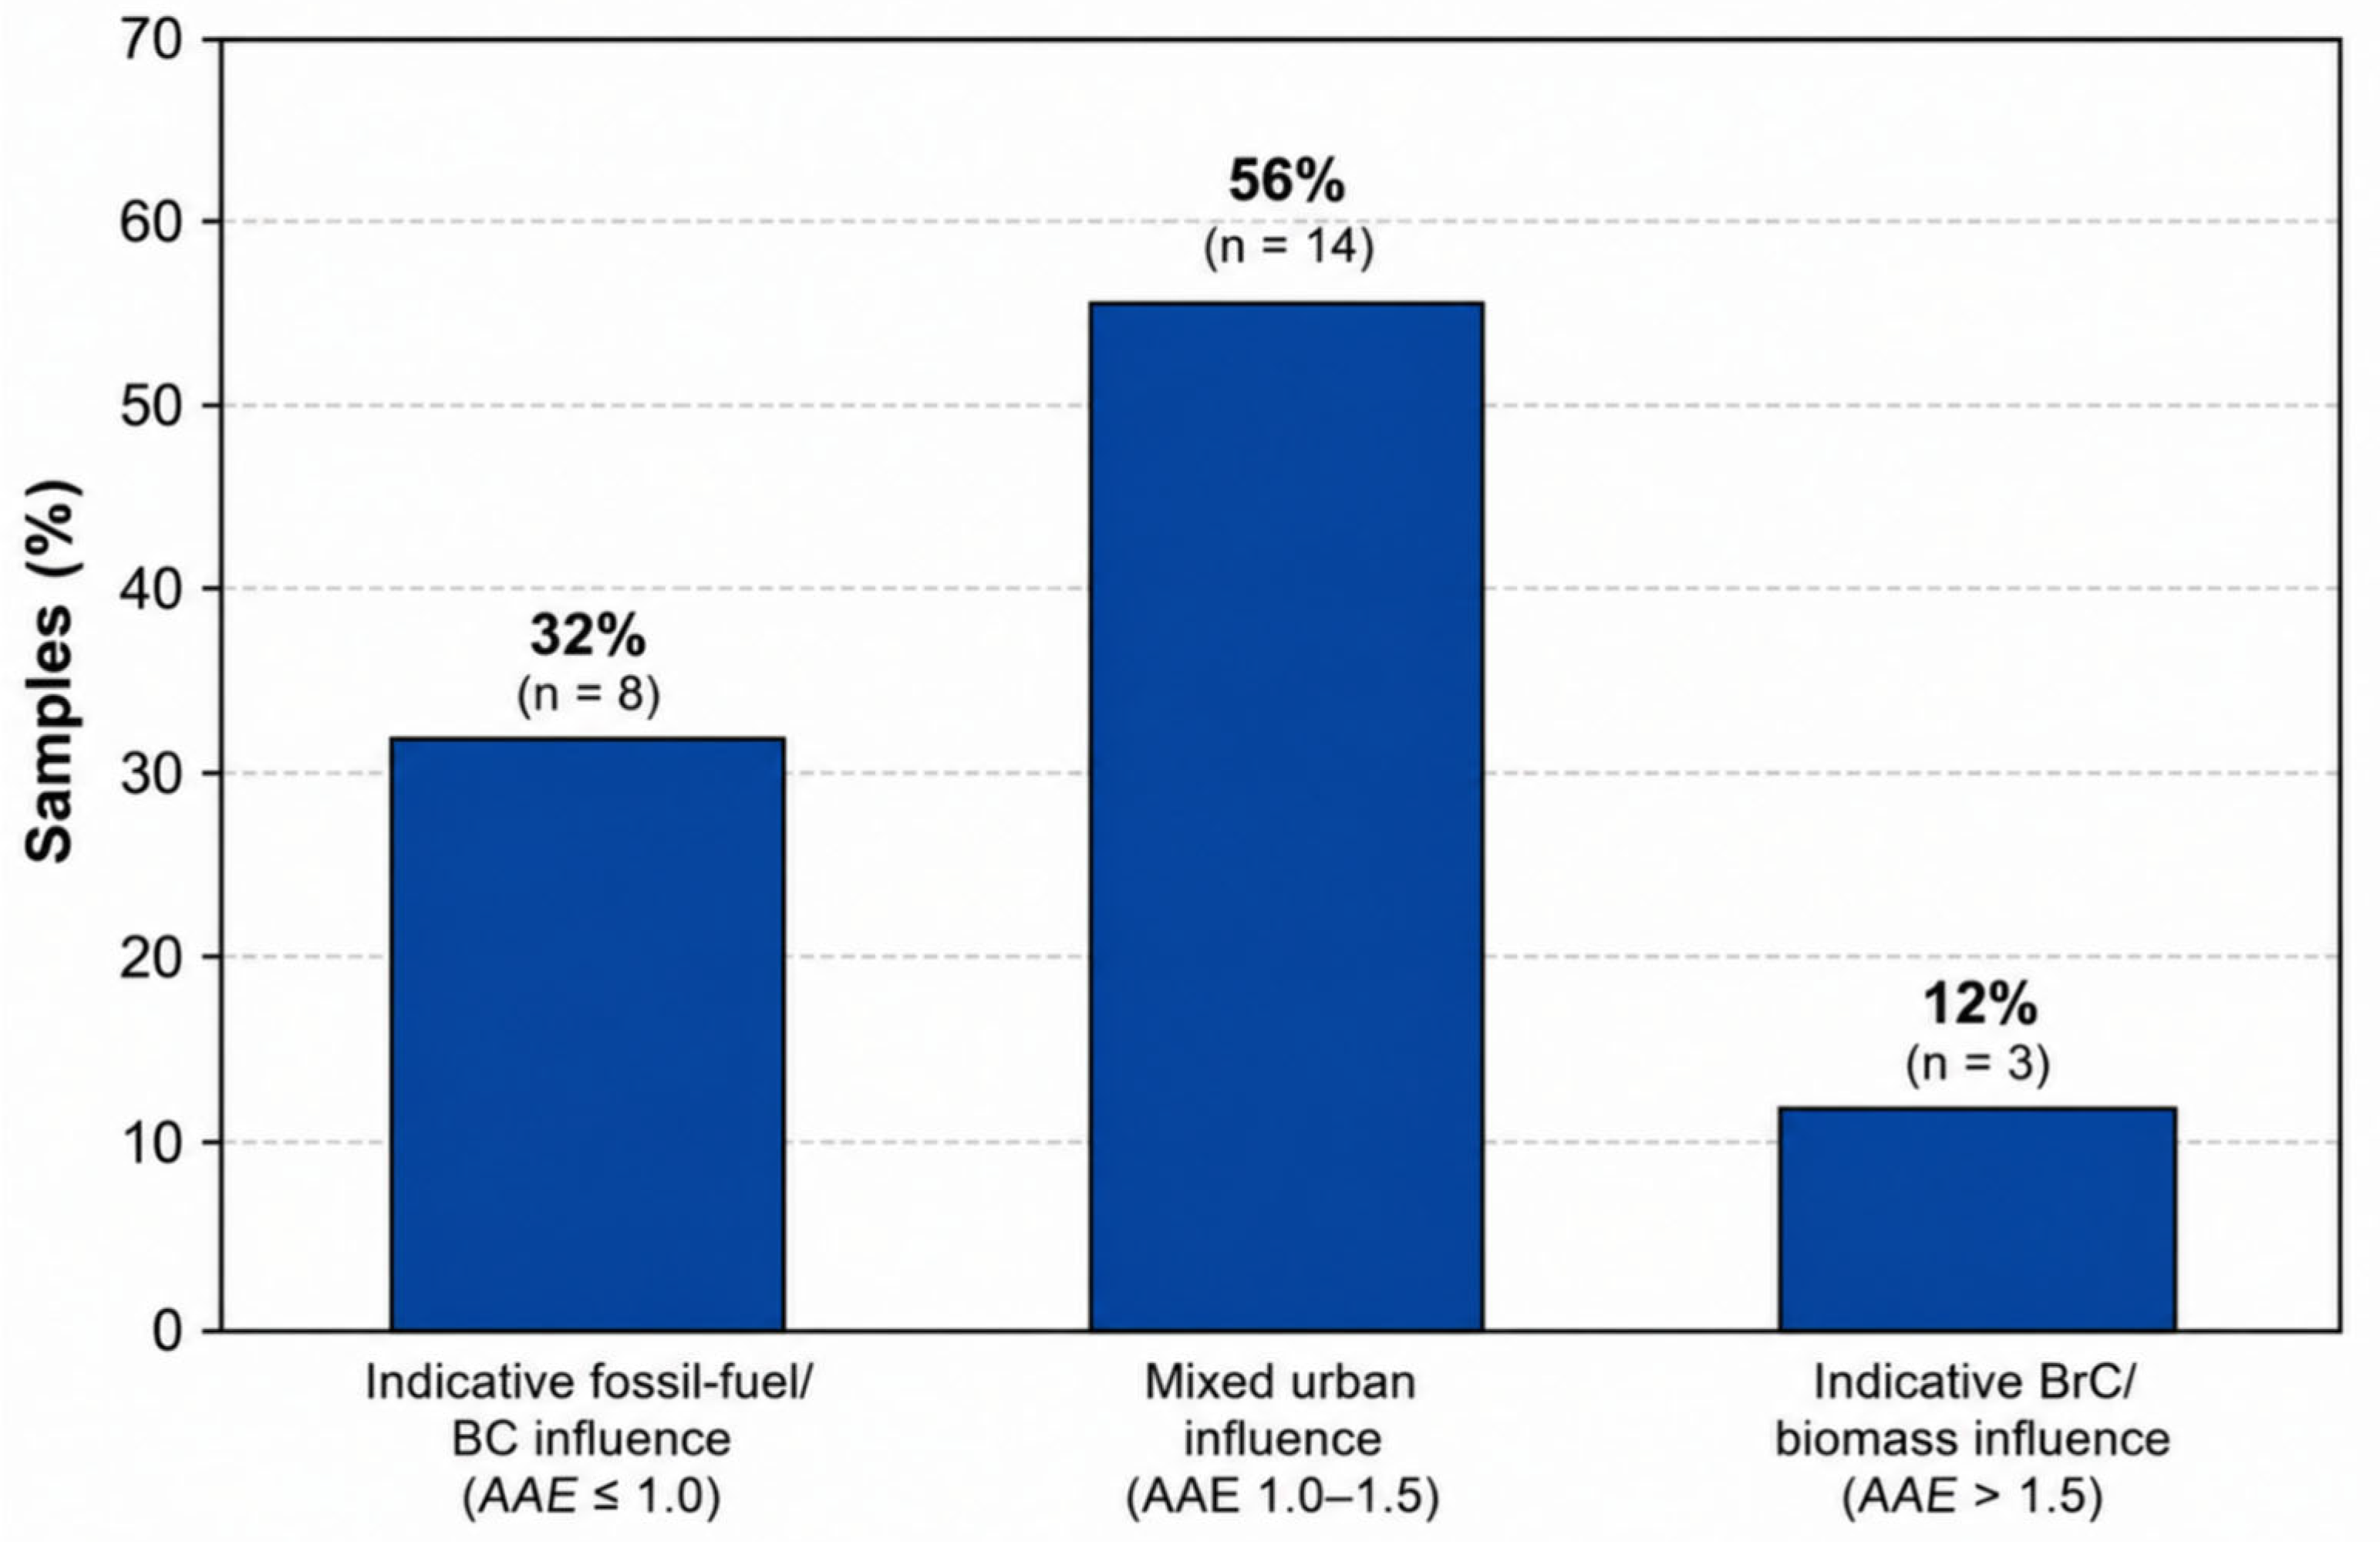

Table 1.
Descriptive statistics of PM2.5 concentrations measured during the March–April 2025 sampling campaign in Lahore, Pakistan.
Table 1.
Descriptive statistics of PM2.5 concentrations measured during the March–April 2025 sampling campaign in Lahore, Pakistan.
| Parameter | Value (µg m-3) |
|---|---|
| Number of samples (n) | 25 |
| Mean ± SD | 137 ± 84 |
| Median | 111 |
| Minimum | 40 |
| Maximum | 417 |
| Coefficient of Variation (CV, %) | 61 |
Table 2.
Summary statistics of aerosol absorption coefficients () measured by the Multi-Wavelength Absorbance Analyzer (MWAA) at five wavelengths.
Table 2.
Summary statistics of aerosol absorption coefficients () measured by the Multi-Wavelength Absorbance Analyzer (MWAA) at five wavelengths.
| Wavelength (nm) |
Mean ± SD (Mm⁻¹) | Median (Mm⁻¹) |
Minimum (Mm⁻¹) |
Maximum (Mm⁻¹) |
|---|---|---|---|---|
| 375 | 280 ± 272 | 197 | 88 | 1113 |
| 407 | 196 ± 188 | 165 | 79 | 1052 |
| 532 | 137 ± 87 | 127 | 61 | 479 |
| 635 | 119 ± 78 | 111 | 50 | 424 |
| 850 | 95 ± 67 | 85 | 38 | 358 |
Disclaimer/Publisher’s Note: The statements, opinions and data contained in all publications are solely those of the individual author(s) and contributor(s) and not of MDPI and/or the editor(s). MDPI and/or the editor(s) disclaim responsibility for any injury to people or property resulting from any ideas, methods, instructions or products referred to in the content. |
© 2026 by the authors. Licensee MDPI, Basel, Switzerland. This article is an open access article distributed under the terms and conditions of the Creative Commons Attribution (CC BY) license.
Copyright: This open access article is published under a Creative Commons CC BY 4.0 license, which permit the free download, distribution, and reuse, provided that the author and preprint are cited in any reuse.


