

Submitted:
06 August 2026
Posted:
07 August 2026
You are already at the latest version
Abstract
Al-NiO thermites are recognized for their high energy density, low gas emission, and stable at normal conditions, making them ideal for applications requiring high concentrated heat. This study investigates the influence of three physical mixing techniques—mortar-pestle, magnetic stirring, and ball milling—on the morphology, reactivity, and thermal behaviour of Al-NiO thermites under different heating rates (20, 35, 50 oC/min). Advanced characterization techniques, including SEM/EDS, particle size distribution (PSD) analysis, zeta potential (ZP), DSC/TGA, and electrothermal ignition tests, were employed. The results reveal that ball milling significantly reduces particle size to the nanoscale and enhances ignition properties, despite limited improvements in homogeneity due to agglomeration tendencies. Thermal analyses showed that, while all techniques produced good thermal properties, the ball-milled thermite demonstrated activation energy and ignition characteristics consistent with nanoscale systems. Faster heating rates revealed distinct morphological outcomes and reaction pathways among mixing techniques. Importantly, this study demonstrates that cost-effective mixing methods can still yield thermites with promising thermal and ignition properties, suggesting their potential for scalable industrial applications. These findings contribute to optimizing Al-NiO thermites for advanced energetic systems in both civilian and military domains.
Keywords:
Al-NiO nano and micro thermite
; physical mixing techniques
; thermal reactivity
; chemical and structural characterization
1. Introduction
Thermite mixtures are renowned for their ability to produce intense heat via highly exothermic reactions, making them essential in diverse applications such as ignition systems, welding, and propulsion technologies [1,2,3]Among these, the Al-NiO thermite mixture has gained significant attention due to its high energy density, relatively low gas production, and favourable thermal characteristics [4,5,6].
The stoichiometric reaction between aluminium and nickel oxide follows the equation (1):
where the reaction products, alumina (Al2O3) and metallic nickel, are formed alongside with a substantial energy release comparable to that of TNT [1,7]. Its low gas emission makes it particularly suitable for applications requiring controlled and concentrated heat, such as in microelectromechanical systems and micro propulsion devices [3,6,8,9]. The reactivity of Al-NiO thermites is largely influenced by the morphology, particle size, and distribution of the reactive components, which can be determined by the preparation techniques used. Traditional physical mixing techniques often result in inhomogeneous composites, which can adversely affect their performance [1,4,6]. In contrast, advanced approaches like high-energy ball milling techniques have demonstrated improved interfacial contact and enhanced reactivity. For instance, high-energy ball milling facilitates mechanical activation of the components, significantly increasing the contact area and altering the reaction pathways, although it may introduce higher sensitivity to external stimuli [1,10,11].
The heating rate is another crucial factor that affects thermite reactivity, influencing key parameters such as ignition temperature, activation energy, and reaction kinetics [1,3,4,5,10]. Faster heating rates generally lead to reduced induction times and higher combustion velocities, while slower rates enable detailed kinetic analysis and control over the reaction progress [1,3]. Studies using differential scanning calorimetry (DSC) [1,5,11,12] have revealed distinct differences in the thermal behaviour of Al-NiO composites prepared under various conditions, highlighting the interplay between particle morphology and heating dynamics [1,4,10].
Beyond their thermal behaviour, the morphological and compositional characteristics of Al-NiO composites play a vital role in determining their application potential. High-energy ball milling technique has been particularly effective in synthesizing Al-NiO nanocomposites [10], enabling the formation of nanosized particles with improved magnetic properties Invalid source specified. and controlled morphology [4]. These technical advancements have paved the way for Al-NiO thermites to be tailored for specific applications, from micro-initiators to advanced thermal management systems [1,2,3,5].
This study aims to investigate the influence of three different physical mixing techniques on the reactivity and morphology of Al-NiO thermite under different heating rates. The choice of the mixing techniques was done according to the common accessibility in laboratories, easy and low-cost to scale up for industrial purposes. By combining advanced characterization techniques, such as scanning electron microscopy / energy dispersive X-ray spectroscopy (SEM/EDS), zeta potential (ZP) analysis, differential scanning calorimetry / thermogravimetric analysis (DSC/TGA) and electrothermal ignition, this work seeks to elucidate the relationships between mixing techniques, thermal properties, and morphological characteristics of Al-NiO thermite. The findings will provide insights into optimizing Al-NiO thermites for both civilian and military applications, contributing to the development of efficient and reliable energetic materials produced at industrial scale.
2. Materials and Methods
2.1. Materials
The reactants used in this work were aluminium, purchased from the Aluminium Powder Company Limited, with 6µm as average particle size and with 99.7% purity; and nickel oxide (II), purchased from Merk, with an average particle size of 4.5µm and with 99% purity.
2.2. Mixing Techniques
Three different techniques were used to mix aluminium and nickel oxide based on the stoichiometric reaction (eq.1), preparing 10 g of thermite for each technique, measured with a FX-500i analytical balance. The procedures for mixing were:
- Mortar - pestle (MP) made of ceramics: the reactants were weighed, poured into the mortar, and grinded for 12 minutes.
- Magnetic stirrer (MS): the mixture was stirred in hexane at 1300 rpm for 1 hour in a 250 mL flask. Afterward, hexane was filtered out, and the mixture dried at 60 °C for 24 hours in a HERATHERM® oven.
- Homemade planetary ball mill (HPBM): using 100 mL stainless steel cups and balls (5- and 10-mm diameter), the reactants were mixed for 1 or 3 hours, with 30 min directional changes at 350 rpm, at a 10:1 ratio (balls: reactants mass). The HPBM consisted of a container from a planetary mixer that was assembled on a lathe (Figure 1).
2.3. Particle Size Distribution (PSD)
PSD analysis for MP and MS mixtures was performed with a Mastersizer 3000 (Malvern Instruments Ltd., MAL1062507) using water as particle dispersant, through a Hydro MV unit, and the Fraunhofer model for particle size estimation. HPBM mixture was analysed with a Mastersizer 2000 (Malvern Instruments Ltd. 34264-43), using water at 25 °C as dispersant, through a Hydro 2000MU unit, and the Mie model for particle size estimation. Each sample was tested in a triplicate with laser obscuration between 5-50%.
Scanning Electron Microscopy/Energy Dispersive X-Ray Spectroscopy (SEM/EDS)
For SEM/EDS analysis of the thermite mixtures, a Zeiss Merlin FEG-SEM (Field Emission Gun – Scanning Electron Microscope) with 2 kV and 100 pA was used. Samples were placed on conductive tape and analysed in a high vacuum medium. EDS analysis used an Oxford X-MaXN 20 with 15 kV beam energy.
The analysis of the reaction products of the mixtures was performed using a Hitachi SU3800 scanning electron microscope/energy dispersive X-ray spectroscopy (SEM/EDS) with fully integrated EDS from Oxford Instruments. The SEM analysis was conducted with 15 kV and 49000 nA, and for EDS, 15kV beam energy.
2.4. Zeta Potential (ZP) Analysis
The ZP measurements were performed, with a Malvern Instruments Zetasizer Nano ZS. All samples were analysed at a temperature of 25 °C, and water was used as the dispersant. Six replicates were made for each sample.
2.5. Differential Scanning Calorimetry/Thermogravimetric Analysis (DSC/TGA)
DSC/TGA were performed with a Simultaneous Thermal Analyzer (STA), from Rheometric Scientific Ltc, using argon as inert gas at a flow rate of 53 mL/min, with heating rates of 20, 35, and 50 ˚C/min up to 1500 ˚C. Alumina crucibles were used, and samples were sonicated and dried before analysis.
2.6. Electrothermal Ignition
For thermites’ ignition was used the Joule effect produced in 5 mm tungsten filaments (supplied by Merck®). Depending on the voltage (up to 40 V), the energy transferred to the wire ranged from 183 to 410 mJ. Thermite pellets (5 mm diameter, 3 mm high, 100-200 mg) from the three different mixing techniques, pressed with a hydraulic press (Carver Laboratory Press) at 50 MPa, were ignited by contacting the tungsten filament under the pellet, as shown in Figure 2. The thermites were sonicated and dried before pressing.
3. Results and Discussion
3.1. Particle Size Distribution (PSD) of Reactants and Mixtures
The PSD analysis evaluated reactants, and a thermite mixture mixed by three different techniques, to determine if each mixing technique reduced particle size. Table 1 shows Dv (10), Dv (50), and Dv (90) percentile values of the cumulative curve.
Table 1 reveals that Al particles alone are slightly larger than NiO, as per producers’ data. Mortar and pestle and magnetic stirring methods showed minimal particle size reduction, with Dv (50) and Dv (90) values close to the isolated reactants, indicating slight reduction for Al and some NiO aggregation. The HPBM technique achieved the greatest reduction, bringing all Dv values to the nanometer scale, without significant improvement from increasing the mixing time.
3.2. SEM/EDS of Mixtures
SEM/EDS analysis characterized the morphology, chemical composition, and homogeneity of the mixtures and their reaction products. Results for the three mixtures matched those in Figure 3 and Figure 4. The reaction products will be shown after the reaction tests (DSC/TGA and electrothermal ignition).
Figure 3 shows SEM images of Al-NiO mixtures: Al particles are spherical and homogeneous [4,7,13,14], while NiO forms clusters of “crystal-like” particles [15].
Figure 4 confirms these findings and maps the elements present, indicating oxygen mostly with Ni and some in Al due to oxidation.
Figure 5 compares the homogeneity of mixtures prepared by the different techniques. There are Al domains with little proximity to NiO and vice versa, indicating that homogeneity is compromised in these areas, as observed in the literature [4]. Coating is observed, and no significant differences were found between mixtures made with a HPBM for 1 and 3 hours. SEM measurements show particle sizes in micrometres (Figure 5): a) 3.947 – 9.435 µm, b) 4.273 – 10.67 µm, c) 4.089 – 8.094 µm and d) 2.459 – 8.061 µm, larger than PSD values, as SEM measures the agglomerates that adhered to the tape (only the bigger ones were measured), unlike dispersed particles in PSD. This discrepancy was further investigated through zeta potential analysis.
3.3. Zeta Potential (ZP) Analysis of Mixtures
Zeta Potential (ZP) analysis was conducted to investigate if sonication dispersion impacts the agglomeration of Al+NiO mixtures, as SEM and PSD results varied due to particle dispersion differences. Table 2 shows ZP values before and after dispersion, for each mixture.
The MP-mixed sample showed similar ZP values before and after dispersion (16.7 mV and 13.2 mV), indicating instability and aggregation. Samples mixed by MS and HPBM (1h and 3h) had low average ZP values, suggesting rapid aggregation before dispersion, and became instable after dispersion. There is no clear correlation between dispersion and ZP variation, and all mixtures presented tendency to aggregate before and after dispersion.
These findings support the SEM/EDS results, confirming the high agglomeration tendency of Al-NiO mixtures. They contrast the PSD analysis, because the particles do not have the time to aggregate, since they are being PSD analysed while being dispersed. Therefore, only HPBM samples mixed for 1 hour were analysed, as longer mixing time and dispersion did not affect particle size or homogeneity significantly.
3.4. Differential Scanning Calorimetry/Thermogravimetric Analysis (DSC/TGA)
Reactants
To study the thermal behaviour of thermite, DSC/TGA analysis was conducted on an empty alumina crucible, the individual reactants (Al and NiO), and nickel, as shown in Figure 6.
The heat flow curve of the empty crucible (Figure 6. a) displayed an exothermic curve between 1200–1500 °C, consistent across all heating rates. The aluminium thermogram (Figure 6b) revealed one endothermic melting peak between 661.94–666.85 °C, and two exothermic oxidation steps [4,7]: I) around 600 °C due to alumina phase change on the aluminium shell, and II) above 900 °C as molten aluminium causes Al2O3 shell breakage, allowing oxidation due to residual oxygen. This last exothermic peak indicates further phase transitions of Al2O3 [7,10,13,16].
Nickel oxide (NiO) and nickel (Ni) showed similar profiles to the empty crucible (Figure 6. c) and d). NiO did not reduce under these conditions, while Ni displayed a sharp endothermic melting peak between 1418–1436.5 °C, which was used to verifying NiO reduction after the thermite reaction.
Mixtures
Thermal analysis of thermite mixtures (Figure 7) showed similar profiles across all mixing techniques.
The initial oxidation stage of aluminium appears as a weak exothermic peak just before aluminium’s melting at around 660 °C. This is followed by a second Al oxidation stage, coupled with NiO reduction (a broad exothermic peak between 1050–1150 °C) [1,7,10,11]. The melting point of nickel at around 1450 °C indicates the presence of Ni, which is caused by the NiO reduction process. Results for mixtures ground for 1 and 3 hours with HPBM (Figure 7. d) showed that extended mixing time does not modify thermal behaviour, so only 1-hour data is presented from now on.
The observed heat flow profile aligns with literature for micrometre-sized thermite particles [1,10]. An expected exothermic peak between 400–600 °C for nanoscale behaviour was absent, indicating that despite particle size reduction, mixtures still behave as micrometric particles due to cluster formation. These results were consistent with Zeta Potential, PSD, and SEM analyses showing aggregation of particles. The minor mass losses are aligned with what is described in the literature [1,10,11], where the diffusion reaction of NiO with Al occurs in the solid-liquid states.
3.5. Onset Temperatures and Enthalpies Variations
Table 3 summarizes onset temperatures (Tonset) and enthalpy changes (ΔH) for endothermic and exothermic peaks from the thermograms of the thermite mixtures.
Endothermic peaks in the mixtures correspond to Al and Ni melting, with Tonset ranging from 661.65–663.67 °C for Al, and 1413.70–1437.60 °C for Ni, consistent with reactant values.
Exothermic peaks reflect alumina phase transitions and the thermite reaction, varying according to the mixing technique. For MP thermite, with Tonset from 961.4–997.4 °C and ΔH from 1381.3–1568.1 J/g, the Tonset increases and ΔH decreases as heating rate increases. The MS mixture had Tonset from 1007.4–1020.5 °C and ΔH from 1357.6–1680.5 J/g, without a clear trend with heating rate. The HPBM thermite achieved Tonset from 982.6–1011.3 °C and ΔH from 1342.6–1606.3 J/g, with ΔH increasing as heating rate increases. These results indicate that NiO provides oxygen for Al oxidation, as the ΔH values for the mixtures are significantly higher than for Al alone. At a heating rate of 20 °C/min, the oxidation of Al by NiO is 40 to 49 times greater than the oxidation caused by residual oxygen in the inert gas. Similarly, at a heating rate of 35 °C/min, this factor decreases between 13 to 15 times.
The agglomeration tendency of particles causes thermite to behave as if it were composed of microparticles, regardless of the nanoscale particles in the thermite produced by the HPBM technique.
3.6. Activation Energies
The activation energies (Ea) of the thermite obtained for each mixing method were calculated using the Kissinger method, which does not require knowledge of the reaction mechanism [1], according to equation (2), where C is the heating rate, TP is the temperature of the second exothermic peak, Ea is the activation energy, R is the ideal gas constant (8.314 J.mol−1.K−1), and A is a constant. [10]
The obtained activation energies for the Al-NiO thermites were: 242.2 kJ/mol when made with MP, 231.0 kJ/mol for the MS technique, and 160.1 kJ/mol when the HPBM was used.
These values are consistent with literature (150–277 kJ/mol for milled and unmilled Al-NiO thermites, respectively) [10]. The Ea values confirm the PSD results, where micrometric thermites (MP and MS) showed slight variation above 200 kJ/mol, while the thermite prepared by HPBM had an Ea value of 160.2 kJ/mol, which is characteristic of this nano-thermite according to the literature [10]. Despite the formation of clusters, the mixture produced by the HPBM requires less thermal energy to react than the mixture produced by other techniques. This indicates that the clusters are formed by nanoparticles.
3.7. Electrothermal Ignition
Five electrothermal ignition tests were performed for each thermite mixed by three different techniques. The results of Reaction/No Reaction are shown in Figure 8, where higher electric energy transferred to the tungsten filament leads to higher thermal energy dissipation, reaching 3200 °C (melting point) with 407 mJ.
The obtained results highlight the influence of the mixing technique and consequently the effect of particle size on ignition. Thermites with microparticles (Figure 8a and b) do not ignite under an energy pulse of 326 mJ, while 2 of 5 thermite samples prepared by HPBM ignites at 288 mJ (Figure 8 c), requiring less electric energy to ignite, which support the evidence of the formation of nanoparticles during the HPBM process. Comparing these results with those from DSC (Figure 7 and Table 3. Results extracted from the thermograms in Figure 7. Results obtained by DSC/TGA for the thermite compositions mixed by (a) MP (almofariz in the legend), (b) MS (A.M. in the legend), (c) HPBM (M.P. in the legend) mixed for 1 hour, for the three heating rates used, and (d) HPBM, during 1 hour and 3 hours, at a rate of 20 °C/min. of the Al-NiO compositions: analysed sample, used heating rate (HR), onset temperatures (Tonset), and variations in enthalpy (ΔH) for the endothermic peaks (melting of Al and Ni) and the exothermic peaks (oxidation stages I and II of Al and reduction of NiO), respectively. The thermites were made by MP, MS and HPBM (1h).), the exothermic reaction forming alumina and reducing nickel oxide is more energetic over short periods at high temperatures (as seen in the electrothermal ignition by very radiant reactions) than during slower heating in DSC (the exothermic peak is not sharp and intense as it should be for a very exothermic reaction). This shows that, while DSC predicts the reaction temperature between NiO and Al, low heating rates (4 minutes to reach 1000-1200 °C) do not mimic the rapid heating generated by the hot wire, where temperatures of 3200 °C are reached in less than 7 ms (determined by using a photodiode to detect the radiation emission of tungsten in synchrony with the measurement of the voltage and the current passing on it).
3.8. SEM/EDS Analysis of the Reaction Products
Slow Heating Rates (DSC/TGA)
SEM/EDS analysis was performed on all the mixed thermites to observe the reaction products at different slow heating rates. Just the thermite mixed by MP is shown in Figure 9, since there were no differences observed between mixing techniques when heated at these slow rates.
Figure 9 shows the reaction products of the thermite heated in DSC up to 1500 °C with heating rates of 20 °C/min, 35 °C/min and 50 °C/min respectively. No significant morphological changes were observed in the particles at different slow heating rates. The particles maintained their initial spherical shape. The distinction between aluminium and nickel oxide was no longer clear, indicating that the reaction had occurred. Some particles had round, spiky shapes, suggesting the formation of Ni and intermetallic compounds.
The EDS analysis to individual particles (or spot areas in Figure 10) also supports this statement, because they showed that Ni was never residual, being in amounts always up to 37% (in mass) in particles where the Al and the O were also present. However, it was possible to find particles of pure nickel (100% of the mass) and intermetallic particles (43% Al and 57% Ni), but never Al2O3 particles, neither pure Al nor pure NiO, showing that the reaction follows another path than the one described by eq. (1). This finding was caused by the loss of stoichiometry due to the lack of homogeneity resulting from the mixing processes, the tendency of the reagents to aggregate, and the reduced mass in the DSC samples, which is consistent with the literature [1,17,18,19].
Fast Heating Rates (Electrothermal Ignition)
The reaction products of thermite prepared using the different mixing techniques and initiated with a hot wire were also analysed using SEM/EDS, as is shown from Figure 11 to Figure 14. This process of initiating samples with 100–200 mg generates faster heating than when they are tested using DSC (≈ 5 mg).
In this situation, when the thermite was prepared by MP, the reaction products lost their original shape and looked like layered matter, indicating that the products melted (Figure 11 and Figure 12(a) left). However, it is possible to distinguish different product areas, as the white dense/crystalline particles area shown in Figure 11(a) and Figure 12 (b, left).
EDS analysis showed that aluminium and oxygen were more associated, while nickel appeared in clusters identified by white zones in Figure 12. The presence of carbon, higher than in DSC/TGA tests, was due to the polylactic acid (PLA) support and air trapped in the thermite pellets.
The EDS analysis performed to few particles (4 to 5) of the MP thermite mixture showed that the compounds found in Figure 12 (a) are mainly aluminium (39-47% in mass), oxygen (13–40% in mass) and carbon (13–42% in mass), with no nickel being found, while the ones in Figure 12 (b) are mainly formed by carbon (38-52% in mass) and nickel (46-59% in mass), being the aluminium and the oxygen almost residual (0–5% and 0–3% in mass, respectively). This indicates that, with this mixing technique and this ignition process, the thermite reaction follows the path of eq. (1), due to the presence of alumina and metallic Ni. There is also a coarse separation of alumina (Figure 12 (a)), which has a shape like that of molten lava, from nickel, which has a bright crystalline appearance (Figure 12 (b)).
In the electrothermal ignition of the thermite prepared with the MS, the reaction products (Figure 13 (a) and (b)) showed a rectangular layered shape with many small spheres, while the reaction products prepared with the HPBM presented a surface that looks liked molten, heterogeneous, smooth and cracked with few small spherical particles (Figure 13 (c) and (d)). This observation highlights the effect of the mixing techniques on the morphology of the reaction products when electrothermal ignition is used.
The EDS analysis performed in two different areas of the reaction products of the thermite mixed by MS and HPBM can be observed in Figure 14 (a), (b) and Figure 14 (c), (d), respectively.
In the MS-mixed thermite (Figure 14 (a) and (b)), area (a) showed a homogenous distribution of all atoms, while in area (b), aluminium and oxygen were separated from nickel, and carbon was more associated with nickel. EDS punctual analysis revealed that area (a) was mostly nickel (94–100%) with small amounts of oxygen (1%) and carbon (5–6%), while area (b) contained nickel (13–100%), aluminium (6–43%), oxygen (8–33%), and carbon (4–17%), indicating intermetallic formation, thus following another reaction path than eq. (1).
For the HPBM thermite (Figure 14 (c)), the spheres in white were mostly composed of nickel and carbon, while the homogeneous layer contained aluminium and oxygen. Particle EDS analysis showed that the layer and spheres consisted primarily of aluminium (47–56%), oxygen (48–55%), and carbon (7–13%), being the last just present in 3 particles. In the melted bright area (Figure 14 (d)), nickel (80–100%) and carbon (0–20%) were dominant, while the dark area showed a mix of nickel (32–69%), aluminium (2–9%), oxygen (4–13%), and carbon (0–22%), indicating the formation of intermetallic and oxidized compounds.
These results suggest that, at slow heating rates (DSC/TGA), the heating rate change does not significantly affect the reaction products obtained from the Al-NiO thermites. Additionally, the mixing techniques do not play a relevant role in the final reaction products, as all of them exhibited similar morphology and chemical composition. However, the lack of homogeneity in the mixtures (due to their high agglomeration tendency) leads to a loss of stoichiometry during DSC/TGA analysis. This is because only 5 mg of the sample is taken from a total of 10 g of thermite, which may not accurately represent the overall mixture. The deviation from stoichiometry influences the reaction pathway, as evidenced by the presence of intermetallic compounds, indicating that the reaction did not follow eq. (1) under slow heating rates.
In contrast, under fast heating rates (electrothermal ignition), the mixing technique significantly influences the chemical composition and morphology of the reaction products. When Al-NiO thermites are mixed using a MP and subjected to fast heating rates, EDS analysis suggests that the reaction follows eq. (1), as the expected products (Ni and Al2O3) are observed, and no intermetallic compounds are detected. However, for the other two mixing techniques, eq. (1) is not followed, as intermetallic compounds are present. It was also observed that electrothermal ignition promotes a rough separation between the ceramic and metallic/intermetallic phases. Furthermore, the mixing technique influences the morphology of the ceramic, metallic, and intermetallic compounds formed during the reaction when thermites are ignited using electrothermal energy.
4. Conclusions
The study analysed the effects of three physical mixing techniques on Al-NiO thermite and reaction products using PSD analysis, SEM/EDS, Zeta Potential, DSC/TGA, and electrothermal ignition. The main conclusions are the following:
1. Particle size and morphology of mixtures: MP and MS did not reduce particle size, while HPBM achieved nanoscale particles identified on PSD measurements. However, longer ball milling times did not further reduce particle size. SEM analysis showed aggregation trends and larger particles than PSD measurements due to no dispersion during SEM analysis. ZP analysis confirmed a high tendency toward agglomeration, unaffected by the mixing technique or time.
2. Chemical composition of mixtures: SEM/EDS identified spherical Al particles and NiO in crystal clusters. Oxygen was mostly associated with Ni. Mixing methods did not significantly improve homogeneity due to particle clustering.
3. Thermal behavior: DSC/TGA technique confirmed Al melting and oxidation reactions. NiO alone displayed no thermal changes. Ball-milled thermite did not exhibit the exothermic peak typical of this nanoscale thermite seen in literature, due to insufficient homogeneity and aggregation, behaving as micro thermites.
4. Activation energy and ignition: Ball-milled thermite showed activation energy consistent with nanoscale Al-NiO thermites described in the literature and required the least electric energy for ignition, highlighting the influence of mixing techniques on ignition properties, ranked as HPBM > MS > MP.
5. Heating Rate Effects: Slow heating produced similar reaction products across mixing techniques. Fast heating resulted in distinct products and morphologies depending on the mixing technique, such as layered, rectangular, or melted-cracked morphologies. Intermetallic compounds were observed and were common across almost all conditions, except for the thermite mixed by mortar-pestle and ignited with hot wire that followed the stoichiometric reaction path.
Overall, ball milling for one hour was effective for nanoscale particle production, improving thermal and ignition properties. However, this work also demonstrated that, even if the physical mixing technique lacks in homogeneity and does not avoid nanoparticles aggregation, they can achieve good thermal properties that, properly managed, can be applied to energetic systems, showing that less expensive mixing techniques can be explored for scale-up applications.
Author Contributions
Conceptualization, J.Q. and R.M.; methodology, J.Q., J.P. and L.A.; validation, J.Q., J.P., J.G. and R.M.; formal analysis, J.Q, J.G. and R.M.; investigation, J.Q., J.P., L.A. and F.F.; resources, J.G. and R.M.; data curation, J.Q., J.G. and R.M.; writing—original draft preparation, J.Q. and J.P.; writing—review and editing, J.Q, J.G. and R.M.; visualization, J.G and R.M.; supervision, J.Q. and R.M.; project administration, R.M.; funding acquisition, R.M. All authors have read and agreed to the published version of the manuscript.
Funding
This research was developed under the projects FreePyro Igniter CENTRO-01-0247-FEDER-079833 and IIMEX CENTRO2030-FEDER-00585600, supported by FEDER 2020, FEDER 2030 Portugal and the Portuguese Foundation for Science and Technology (FCT) (Grant No. UIDB/00285/2020 and LA/P/0112/2020). It is also supported by the Association for the Development of Industrial Aerodynamics (ADAI), Associate Laboratory of Energy, Transports and Aeronautics (LAETA) (Grant No. UIDB/50022/2020, UIDP/50022/2020).
Institutional Review Board Statement
Not applicable.
Informed Consent Statement
Not applicable.
Data Availability Statement
The authors declare that the data supporting of this study are available within the article.
Conflicts of Interest
The authors declare that they have no known competing financial interests or personal relationships that could have appeared to influence the work reported in the paper.
Acknowledgments
During the preparation of this manuscript, the authors used ChatGPT (GPT-5.4 Thinking, OpenAI) solely for text polishing and translation.
References
- Azizi-Toupkanloo, H.; Fathollahi, M. Thermal characterization and kinetic analysis of nano- and micro-Al/NiO thermites: Combined experimental and molecular dynamics simulation study. J. Chin. Chem. Soc. 2019, vol. 66, 909–918. [Google Scholar] [CrossRef]
- Guo, X.; Liang, T.; islam, M. L.; Wang, Z. Highly Reactive Thermite Energetic Materials: Preparation, Characterization, and Applications: A Review. molecules 2023, no. 28, 2520.1–2520.21. [Google Scholar] [CrossRef] [PubMed]
- Polis, M.; Stolarczyk, A.; Glosz, K.; Jarosz, T. Quo Vadis, Nanothermite? A Review of Recent Progress. Materials 2022, no. 15, 3215. [Google Scholar] [CrossRef] [PubMed]
- Lu, T.M. Synthesis, characterization and performance evaluation of nan-energetic composite; Nanyang Technological University: Singapore, 2019. [Google Scholar] [CrossRef]
- Sui, H.; Li, B.; Wen, J. Z. Interaction between Single-Walled Carbon Nanotubes and Reactive Nanoparticle Constituents in Multilayered Al/NiO Nanocomposite. ACS Appl. Energy Mater. 2018, no. 1, 5245–5256. [Google Scholar] [CrossRef]
- Zhang, D. Fabrication and Kinetics Study of Nano-Al/NiO Thermite Film by Electrophoretic Deposition. J. Phys. Chem. A 2015, no. 119, 4688–4694. [Google Scholar] [CrossRef] [PubMed]
- De Lucia, F.C., Jr.; Giri, L.; Pesce-Rodriguez, R.A.; Wu, C.; Dean, S.W.; Tovar, T.M.; Sausa, R.C.; Wainwright, E.R.; Gottfried, J.L. Commercial aluminum powders, Part I: Particle size characterization and slow heating rate thermal analysis. Powder Technol. 2022, vol. 399, 117162. [Google Scholar] [CrossRef]
- Yu, C.; Zhang, W.; Shen, R.; Xua, X.; Cheng, J.; Ye, J.; Qin, Z.; Chao, Y. 3D ordered macroporous NiO/Al nanothermite film with significantly improved higher heat output, lower ignition temperature and less gas production. Mater. Des. 2016, no. 110, 304–310. [Google Scholar] [CrossRef]
- Wang, N.; Hu, Y.; Ke, X.; Xiao, L.; Zhou, X.; Peng, S.; Hao, G.; Jiang, W. Enhanced-absorption template method for preparation of double-shell NiO hollow nanospheres with controllable particle size for nanothermite application. Chem. Eng. J. 2020, no. 379, 122330. [Google Scholar] [CrossRef]
- Udhayabanu, V.; Singh, N.; Murty, B.S. Mechanical activation of aluminothermic reduction of NiO by high energy ball milling. J. Alloys Compd. 2010, vol. 497, 142–146. [Google Scholar] [CrossRef]
- Padhan, A.M.; Sathish, M.; saravanan, P.; Perumal, A. Mechanical activation on aluminothermic reduction and magnetic properties of NiO powders. J. Phys. D. Appl. Phys. 2017, vol. 50, 21LT01 (10pp). [Google Scholar] [CrossRef]
- Sui, H.; Huda, N.; Shen, Z.; Wen, J. Al–NiO energetic composites as heat source for joining silicon wafer. J. Mater. Process. Tech 2020, no. 279, 116572. [Google Scholar] [CrossRef]
- Ao, W.; Fan, Z.; Liu, L.; An, Y.; Ren, J.; Zhao, M.; Liu, P.; Li, L.K.B. Agglomeration and combustion characteristics of solid composite propellants containing aluminum-based alloys. Combust. Flame 2020, vol. 220, 288–297. [Google Scholar] [CrossRef]
- Mursalat, M.; Hastings, D.L.; Schenitz, M.; Dreizin, E.L. Microspheres with Diverse Material Compositions Can be Prepared by Mechanical Milling. Adv. Eng. Mater. 2020, vol. 22, 1901204. [Google Scholar] [CrossRef]
- Guo, S.; Focke, W.W.; Tichapondwa, S.M. Al-Ni-NiO Pyrotechnic Time-Delays. Propellants Explos. Pyrotech. 2020, vol. 45, 665–670. [Google Scholar] [CrossRef]
- Lamouria, S.; Hamidouche, M.; Bouaouadja, N.; Belhouchet, H.; garnier, V.; Fantozzi, G.; Trelkat, J. F. Control of the gamma-alumina to alfa-alumina phase phase transformation for an optimized. [CrossRef]
- Oleszak, D. NiAl-Al2O3 intermetallic matrix composite prepared by reactive milling and consolidation of powders. J. Mater. Sci. 2004, vol. 39, 5169–5174. [Google Scholar] [CrossRef]
- Anvari, S.; Karimzadeh, F.; Enayati, M. Synthesis and characterization of NiAl–Al2O3 nanocomposite powder by mechanical alloying. J. Alloys Compd. 2009, vol. 477, 178–181. [Google Scholar] [CrossRef]
- Guo, X.; Liang, T.; Giwa, A.S. Remarkably convenient construction of self-protected nanoaluminum/nickel oxide/perfluorosilane energetic composite to largely enhance structural, antiwetting and exothermic stability. J. Alloys Compd. 2022, no. 903, 164017. [Google Scholar] [CrossRef]
Figure 1.
HPBM used in this work. In yellow frame is the container for the mixtures.
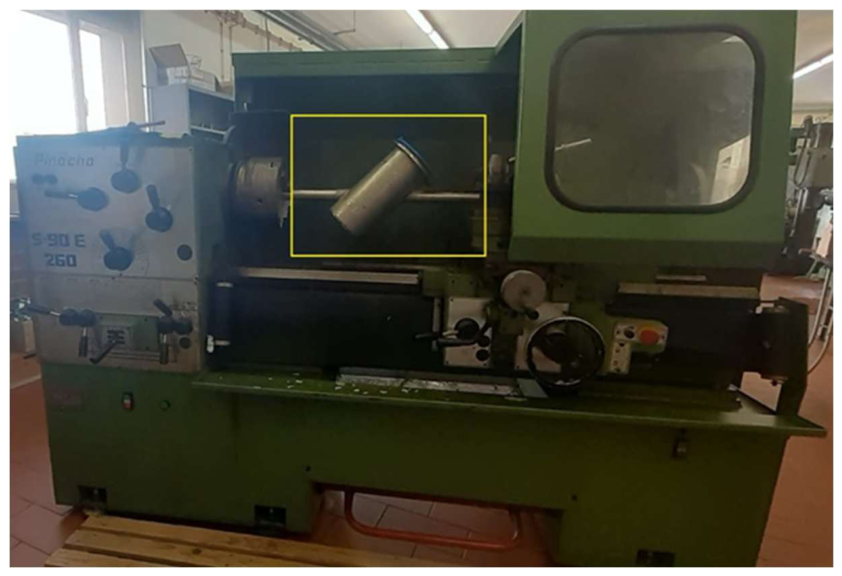
Figure 2.
Set-up used to ignite the thermite pellets (yellow frame) with the tungsten filament under the pellet.
Figure 2.
Set-up used to ignite the thermite pellets (yellow frame) with the tungsten filament under the pellet.
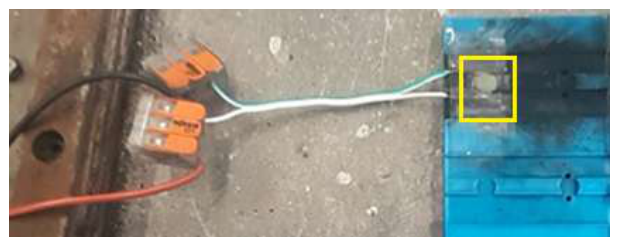
Figure 3.
SEM images, with 5K X magnification, of the Al-NiO mixtures: (a), prepared using MP (left) and. (b) prepared using HPBM for 1 hour.
Figure 3.
SEM images, with 5K X magnification, of the Al-NiO mixtures: (a), prepared using MP (left) and. (b) prepared using HPBM for 1 hour.
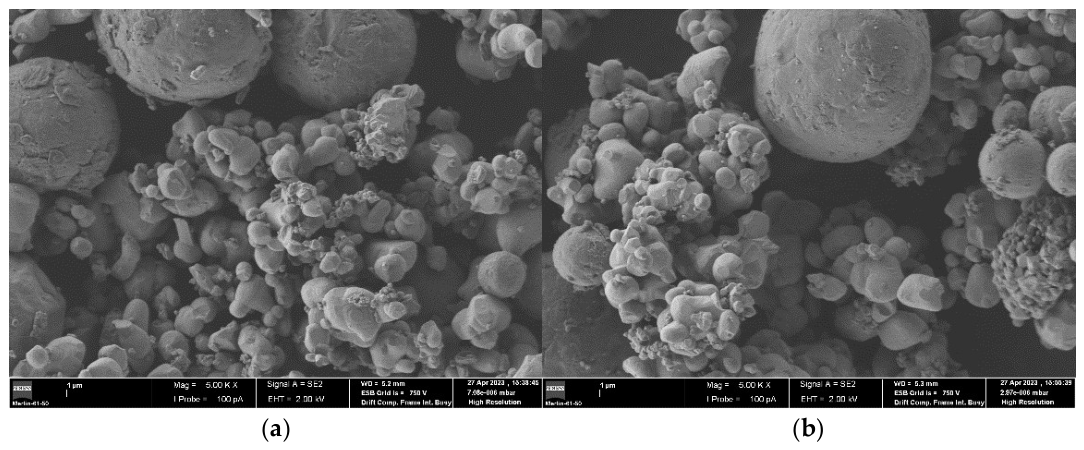
Figure 4.
SEM/EDS results for the Al-NiO mixture, made using MS, regarding the chemical composition of the marked points, showing an atomic spectrum and the results of the remaining points (top), and elemental analysis mapped across the image for the Al, Ni, O, and C atoms (bottom).
Figure 4.
SEM/EDS results for the Al-NiO mixture, made using MS, regarding the chemical composition of the marked points, showing an atomic spectrum and the results of the remaining points (top), and elemental analysis mapped across the image for the Al, Ni, O, and C atoms (bottom).
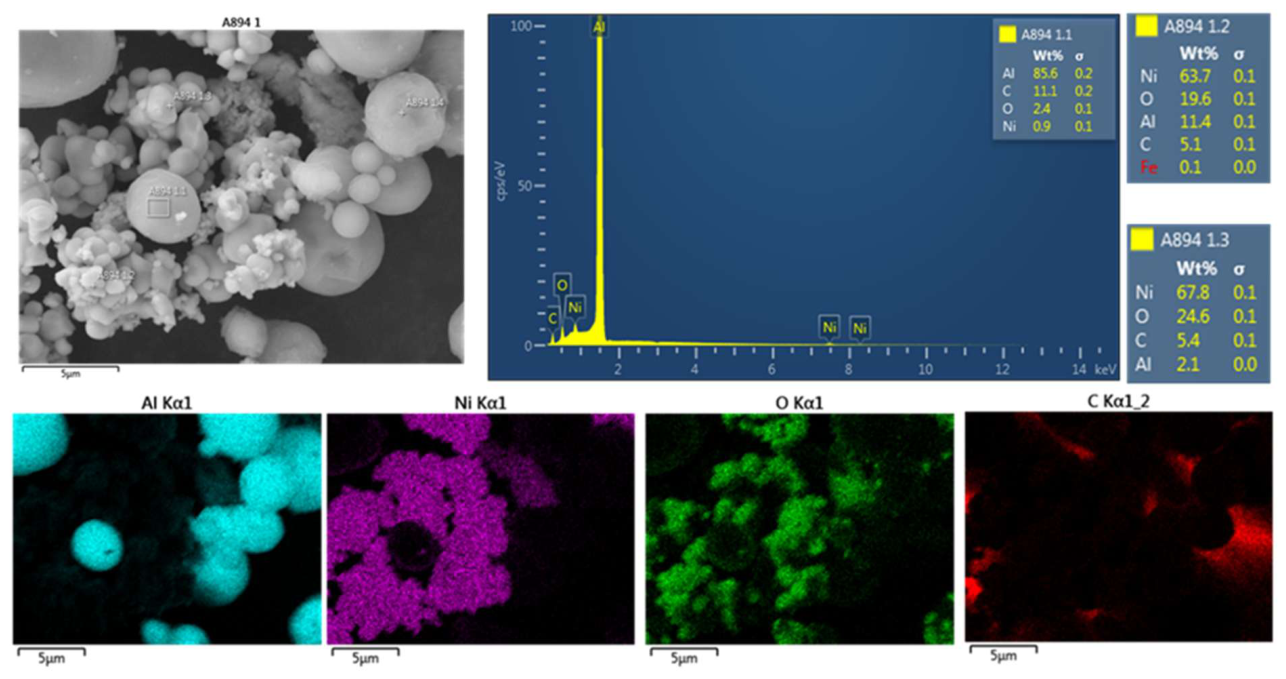
Figure 5.
SEM images of the Al-NiO thermites, with 1000X, mixture obtained by: (a) MP. (b) MS. (c) HPBM for 1 hour. (d) HPBM for 3 hours milling time.
Figure 5.
SEM images of the Al-NiO thermites, with 1000X, mixture obtained by: (a) MP. (b) MS. (c) HPBM for 1 hour. (d) HPBM for 3 hours milling time.
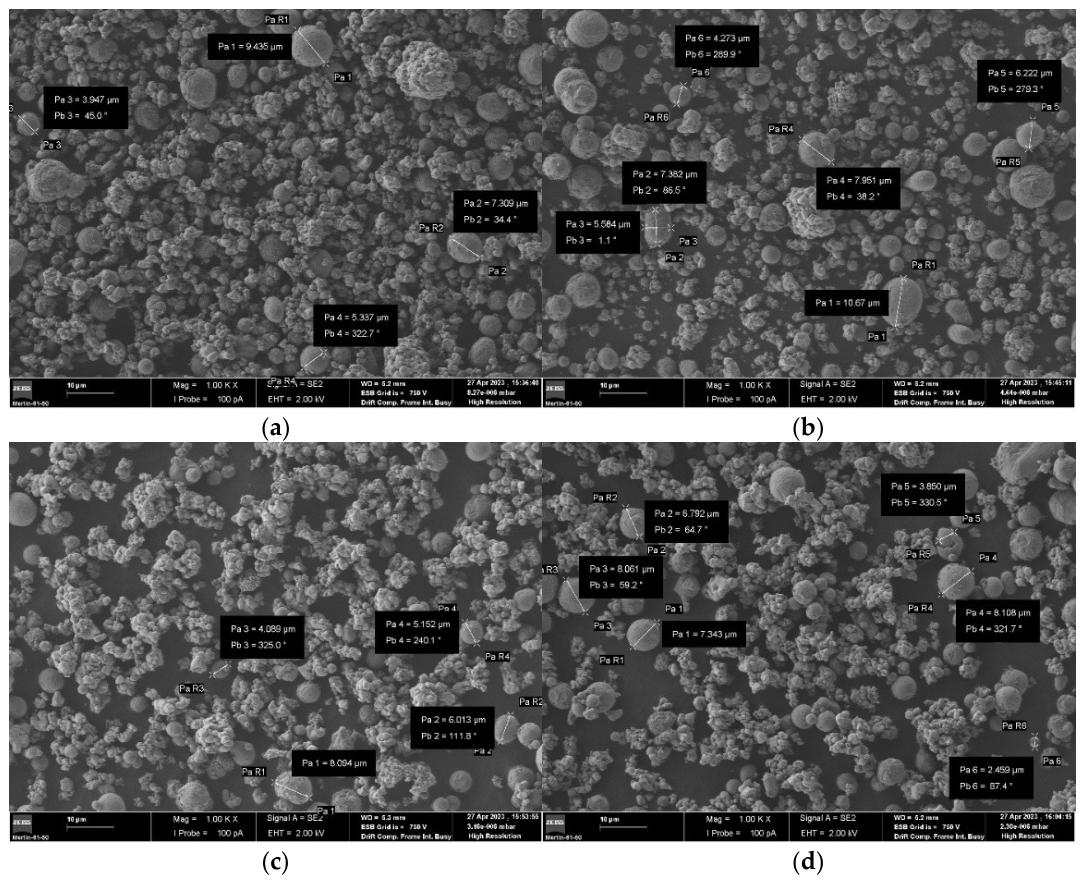
Figure 6.
DSC/TGA results for the (a) used empty crucible, (b)aluminium, (c)nickel oxide, and(d) nickel, at the heating rates of 20, 35, and 50 °C/min.
Figure 6.
DSC/TGA results for the (a) used empty crucible, (b)aluminium, (c)nickel oxide, and(d) nickel, at the heating rates of 20, 35, and 50 °C/min.
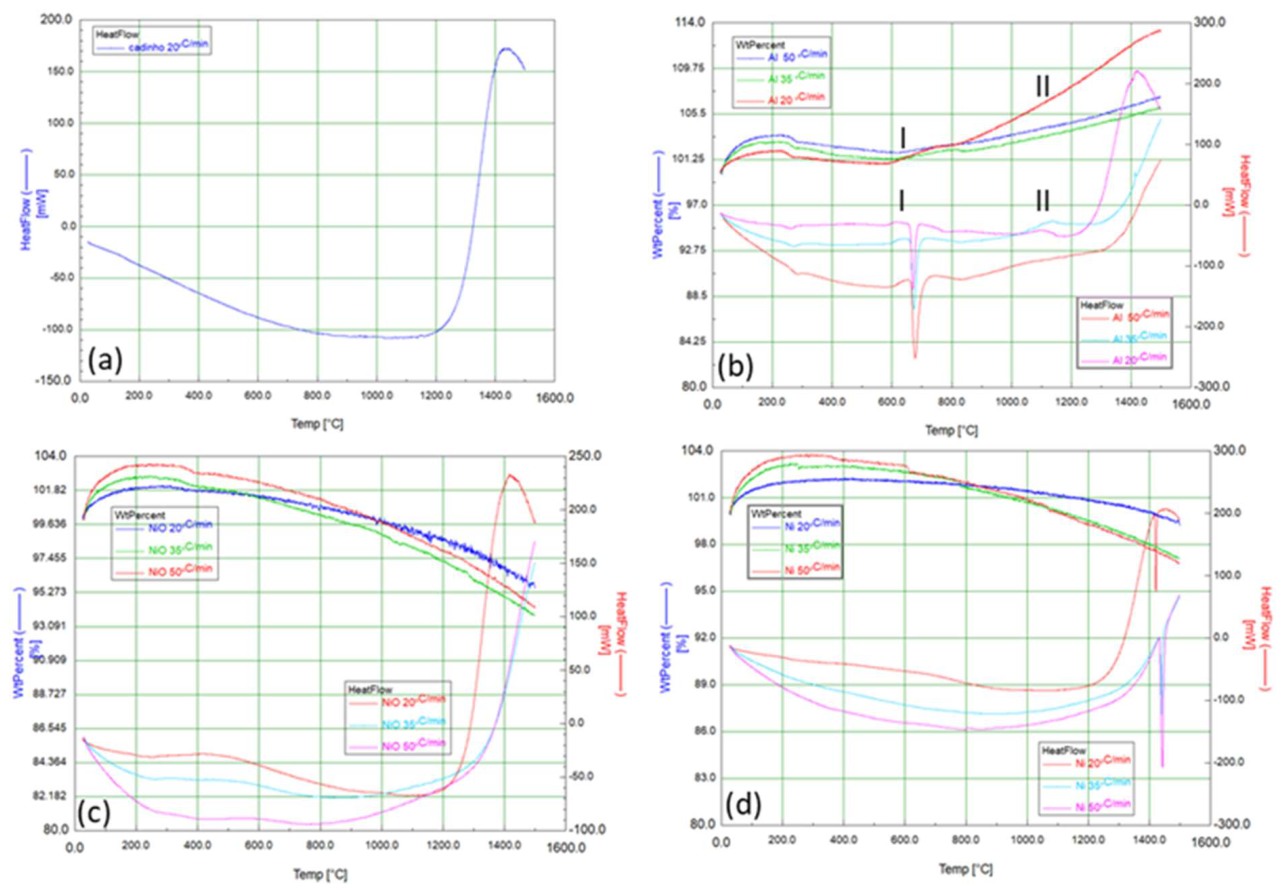
Figure 7.
Results obtained by DSC/TGA for the thermite compositions mixed by (a) MP (almofariz in the legend), (b) MS (A.M. in the legend), (c) HPBM (M.P. in the legend) mixed for 1 hour, for the three heating rates used, and (d) HPBM, during 1 hour and 3 hours, at a rate of 20 °C/min.
Figure 7.
Results obtained by DSC/TGA for the thermite compositions mixed by (a) MP (almofariz in the legend), (b) MS (A.M. in the legend), (c) HPBM (M.P. in the legend) mixed for 1 hour, for the three heating rates used, and (d) HPBM, during 1 hour and 3 hours, at a rate of 20 °C/min.
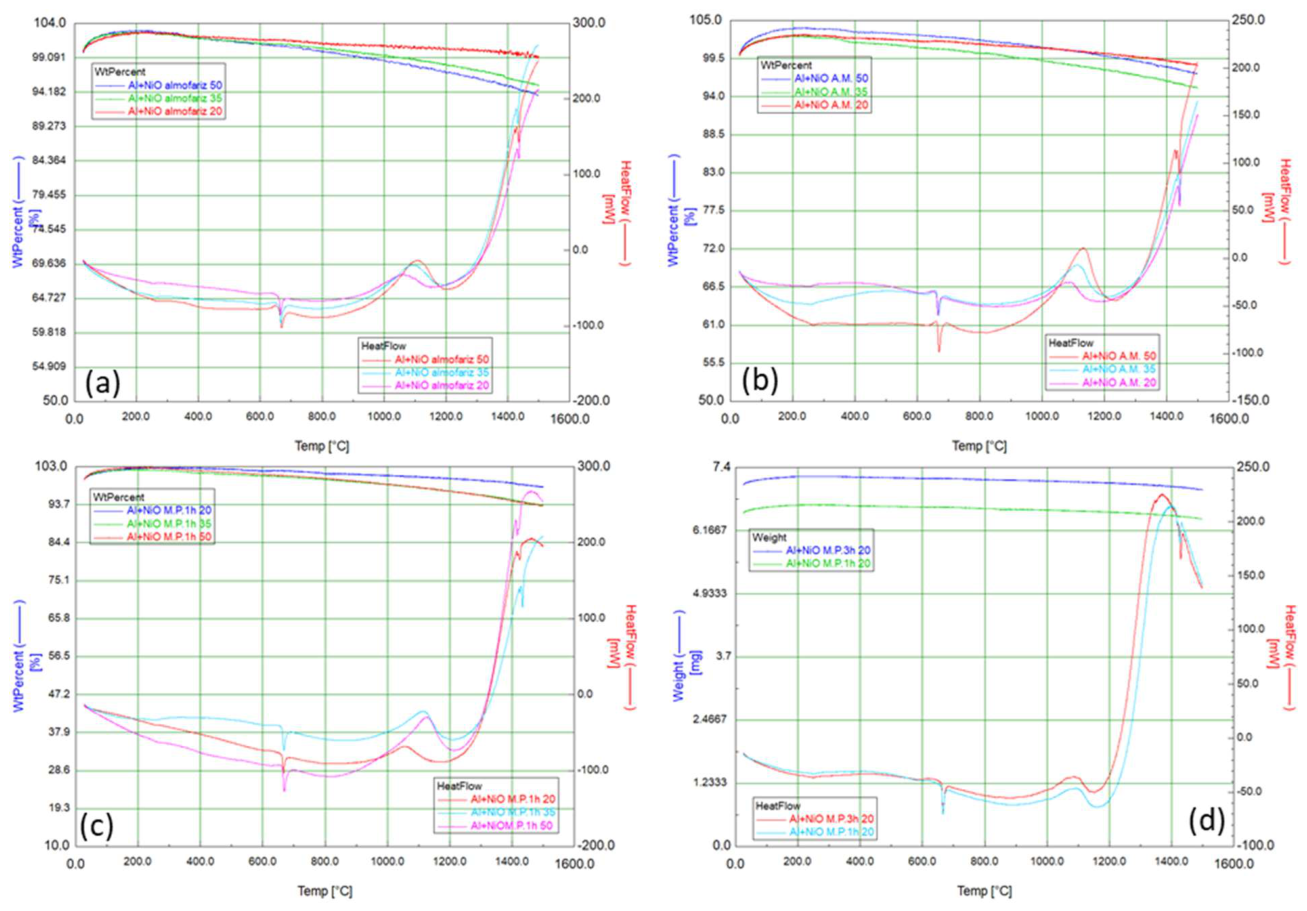
Figure 8.
Obtained results of 5 tests for the electrothermal ignition of the thermites’ pellets mixed by (a) MP, (b) MS, and (c) HPBM for 1h. The results in grey colour indicate no reaction, while the ones in black indicate reaction of the thermites.
Figure 8.
Obtained results of 5 tests for the electrothermal ignition of the thermites’ pellets mixed by (a) MP, (b) MS, and (c) HPBM for 1h. The results in grey colour indicate no reaction, while the ones in black indicate reaction of the thermites.
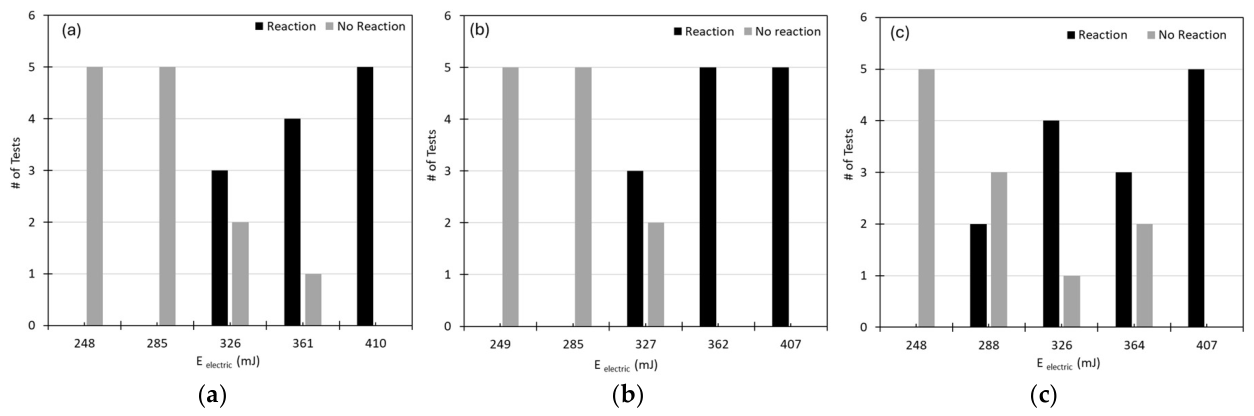
Figure 9.
SEM images with 10k X magnification of the thermite heated at heating rates of: (a) 20 °C/min, (b) 35 °C/min and (c) 50 °C/min.
Figure 9.
SEM images with 10k X magnification of the thermite heated at heating rates of: (a) 20 °C/min, (b) 35 °C/min and (c) 50 °C/min.
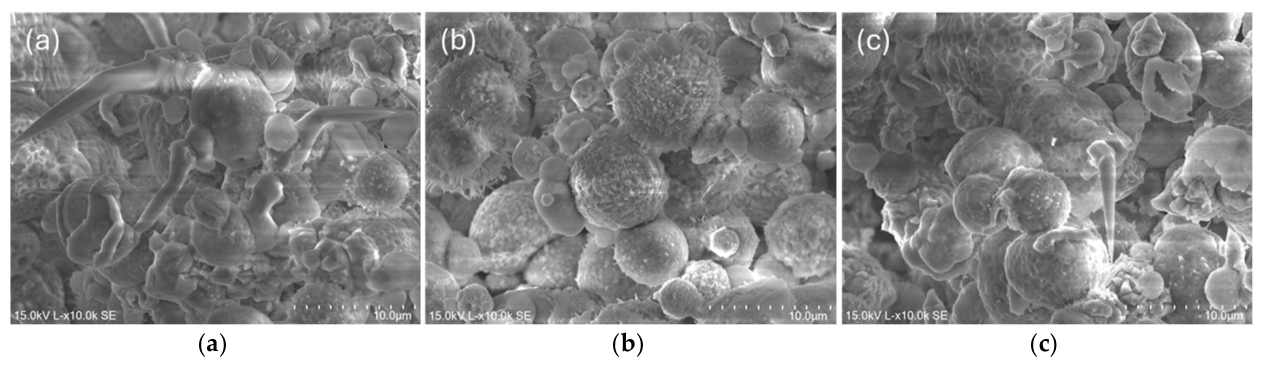
Figure 10.
EDS analysis of the reaction products of the thermite mixed by MP: (a) in green is shown the Ni atoms. (b) the yellow shows the oxygen atoms. (c) the orange shows the Al atoms. (d) the purple corresponds to the C atoms.
Figure 10.
EDS analysis of the reaction products of the thermite mixed by MP: (a) in green is shown the Ni atoms. (b) the yellow shows the oxygen atoms. (c) the orange shows the Al atoms. (d) the purple corresponds to the C atoms.
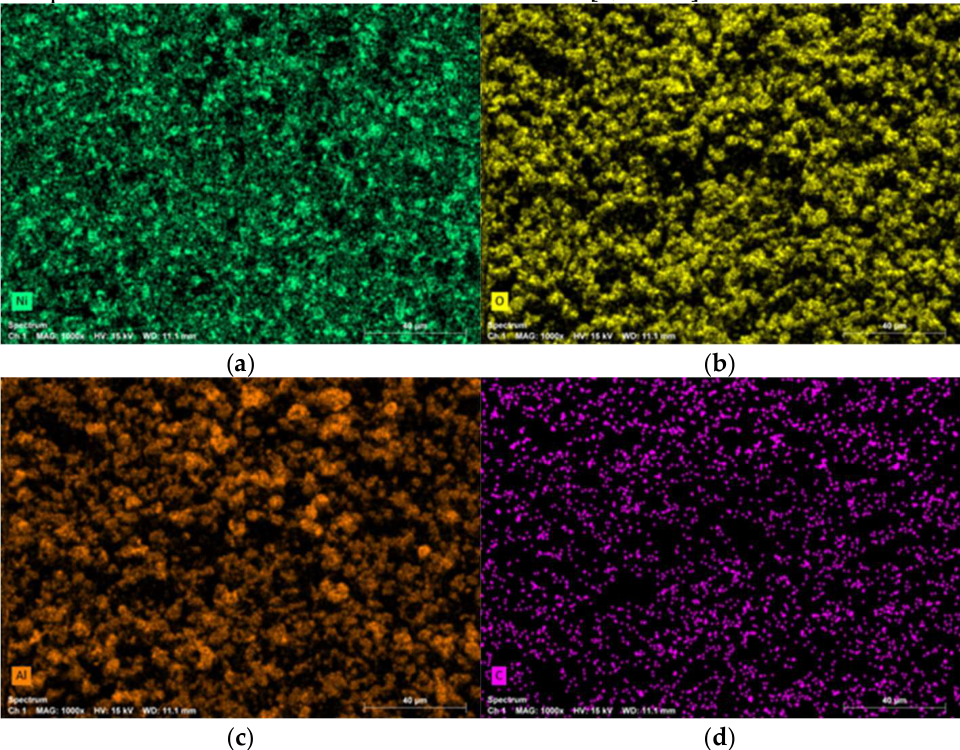
Figure 11.
SEM images of the reaction products of the thermite mixed by MP, after hot wire ignition. Magnification of 10k.
Figure 11.
SEM images of the reaction products of the thermite mixed by MP, after hot wire ignition. Magnification of 10k.
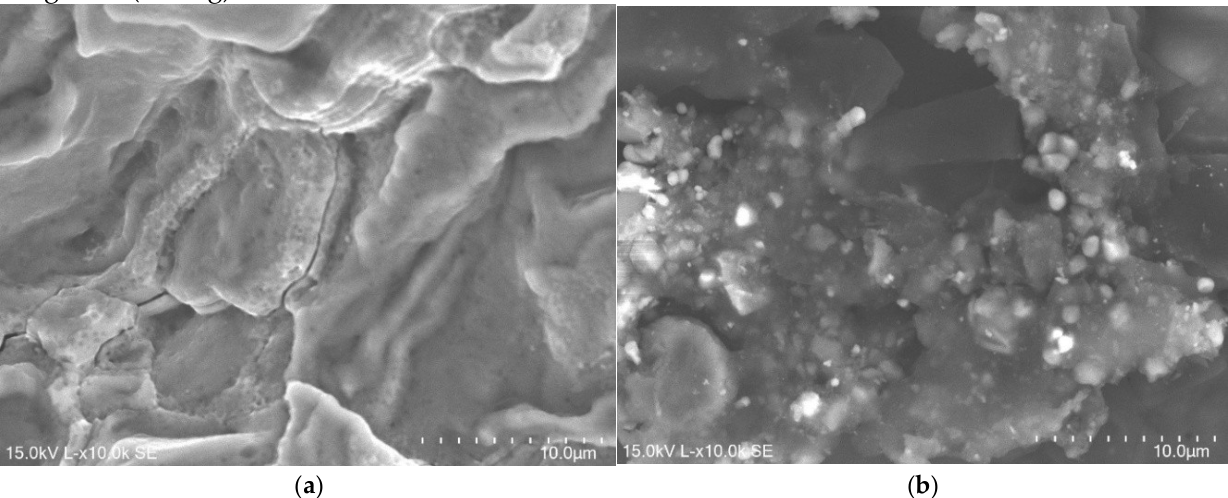
Figure 12.
SEM results for two different areas ((a) and (b)) of the reaction products of the thermite mixed by MP, when heated up by electrothermal energy. The EDS analysis show particles that contain nickel (in green), oxygen (yellow), aluminium (orange) and carbon (purple).
Figure 12.
SEM results for two different areas ((a) and (b)) of the reaction products of the thermite mixed by MP, when heated up by electrothermal energy. The EDS analysis show particles that contain nickel (in green), oxygen (yellow), aluminium (orange) and carbon (purple).
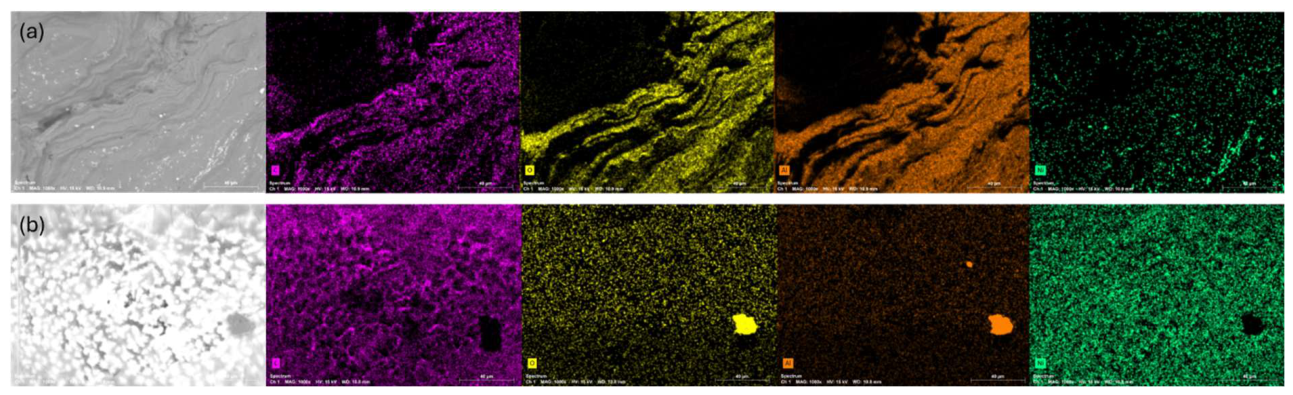
Figure 13.
SEM images with the magnifications of 1k and 3k of the reaction products of the thermite when heated up by electrothermal energy: mixed by MS (a) and (b). Mixed by HPBM (c) and (d).
Figure 13.
SEM images with the magnifications of 1k and 3k of the reaction products of the thermite when heated up by electrothermal energy: mixed by MS (a) and (b). Mixed by HPBM (c) and (d).
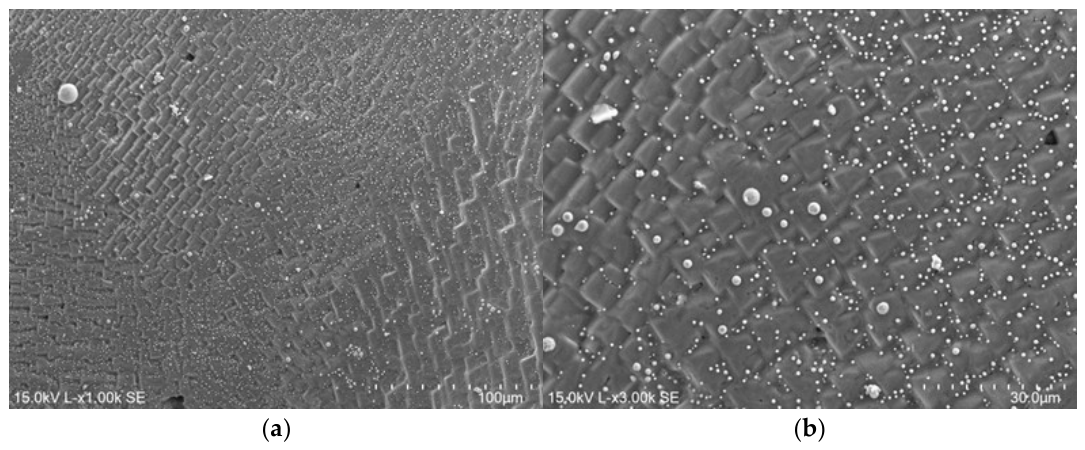
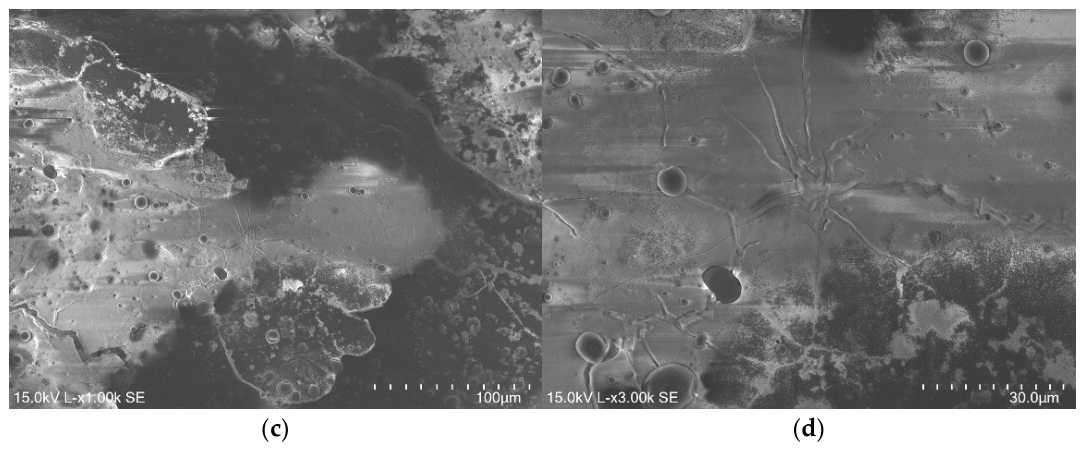
Figure 14.
SEM results for two different areas of the reaction products of the thermite mixed by MS((a) and (b)) and by HPBM ((c) and (d)), when heated up by electrothermal energy. The EDS analysis show particles that contain nickel (in green), oxygen (yellow), aluminium (orange) and carbon (purple).
Figure 14.
SEM results for two different areas of the reaction products of the thermite mixed by MS((a) and (b)) and by HPBM ((c) and (d)), when heated up by electrothermal energy. The EDS analysis show particles that contain nickel (in green), oxygen (yellow), aluminium (orange) and carbon (purple).
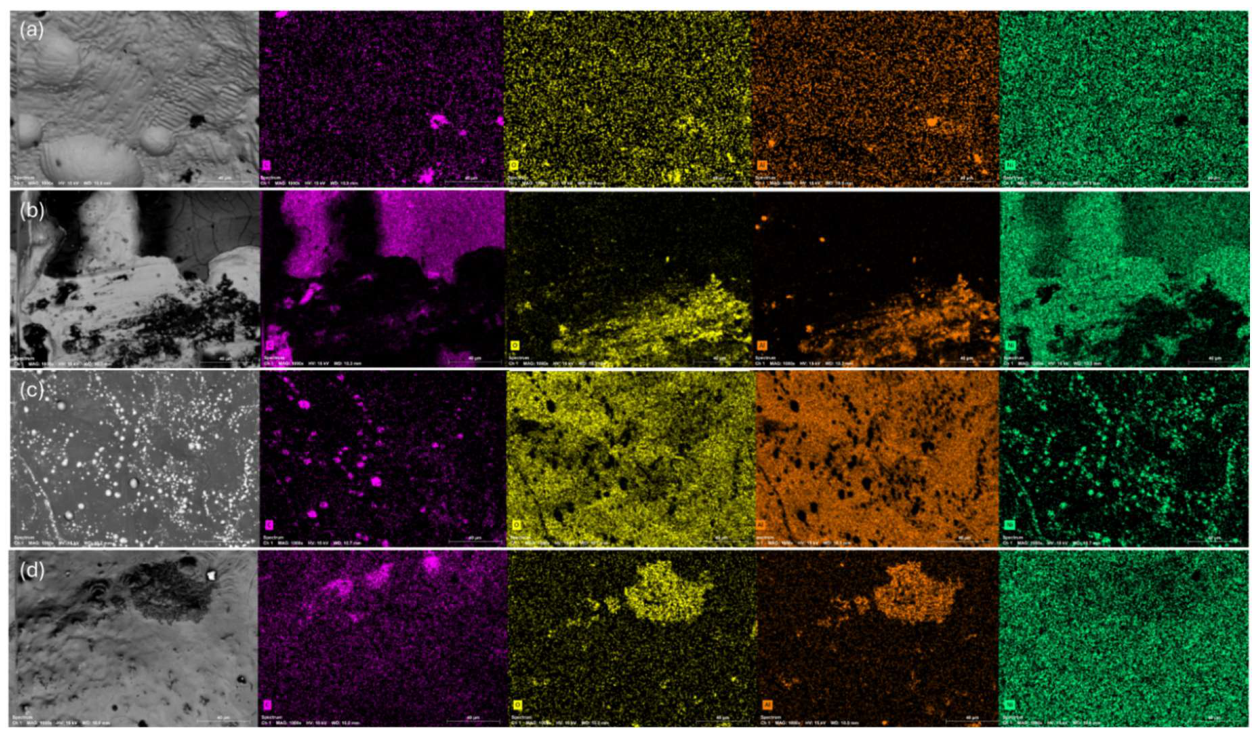

Table 1.
Results obtained experimentally by PSD analysis (Dv (10), Dv (50), and Dv (90)) for the reactants and for the mixtures made by different methods.
Table 1.
Results obtained experimentally by PSD analysis (Dv (10), Dv (50), and Dv (90)) for the reactants and for the mixtures made by different methods.
| Reactants and Mixture | Mixing technique | Dv (10) (µm) | Dv (50) (µm) | Dv (90) (µm) |
| Al | - | 2.140 | 7.290 | 22.600 |
| NiO | - | 1.940 | 4.230 | 7.320 |
| Al+NiO | MP | 3.190 | 6.130 | 10.300 |
| MS | 2.150 | 6.220 | 11.400 | |
| HPBM (1h) | 0.066 | 0.121 | 0.196 | |
| HPBM (3h) | 0.067 | 0.123 | 0.198 |
Table 2.
Results obtained for the average of the measured zeta potentials (ZPavg) and their respective standard deviations (σZP) of the thermite prepared by different techniques.
Table 2.
Results obtained for the average of the measured zeta potentials (ZPavg) and their respective standard deviations (σZP) of the thermite prepared by different techniques.
| Thermite mixing techniques | Before dispersion | After dispersion | ||
| ZPavg (mV) | σ ZP (mV) | ZPavg (mV) | σ ZP (mV) | |
| MP | 16.7 | 0.4 | 13.2 | 0.6 |
| MS | -1.4 | 0.1 | 16.5 | 2.6 |
| HPBM (1h) | 4.4 | 0.2 | -9.6 | 0.6 |
| HPBM (3h) | 5.3 | 0.4 | -10.4 | 0.5 |
Table 3.
Results extracted from the thermograms in Figure 7. Results obtained by DSC/TGA for the thermite compositions mixed by (a) MP (almofariz in the legend), (b) MS (A.M. in the legend), (c) HPBM (M.P. in the legend) mixed for 1 hour, for the three heating rates used, and (d) HPBM, during 1 hour and 3 hours, at a rate of 20 °C/min. of the Al-NiO compositions: analysed sample, used heating rate (HR), onset temperatures (Tonset), and variations in enthalpy (ΔH) for the endothermic peaks (melting of Al and Ni) and the exothermic peaks (oxidation stages I and II of Al and reduction of NiO), respectively. The thermites were made by MP, MS and HPBM (1h).
Table 3.
Results extracted from the thermograms in Figure 7. Results obtained by DSC/TGA for the thermite compositions mixed by (a) MP (almofariz in the legend), (b) MS (A.M. in the legend), (c) HPBM (M.P. in the legend) mixed for 1 hour, for the three heating rates used, and (d) HPBM, during 1 hour and 3 hours, at a rate of 20 °C/min. of the Al-NiO compositions: analysed sample, used heating rate (HR), onset temperatures (Tonset), and variations in enthalpy (ΔH) for the endothermic peaks (melting of Al and Ni) and the exothermic peaks (oxidation stages I and II of Al and reduction of NiO), respectively. The thermites were made by MP, MS and HPBM (1h).
| Sample |
HR (oC/min) |
Endothermic peaks | Exothermic peaks | ||||||
| Tonset (°C) | Tonset (°C) | ||||||||
| Al | 20 | 661.94 | 574.95 | - | - | 584.47 | 144.34 | 1043.90 | 239.13 |
| 35 | 662.96 | 500.55 | - | - | 598.64 | 95.12 | 1056.80 | 541.58 | |
| 50 | 666.85 | 1060.30 | - | - | 605.56 | 86.21 | - | - | |
| Ni | 20 | - | - | 1418.10 | 194.72 | - | - | - | - |
| 35 | - | - | 1436.50 | 263.95 | - | - | - | - | |
| 50 | - | - | 1433.70 | 523.83 | - | - | - | - | |
| Al-NiO (MP) | 20 | 661.61 | 122.13 | 1431.60 | 75.00 | 623.33 | 150.12 | 961.40 | 1568.10 |
| 35 | 661.65 | 67.82 | 1428.80 | 63.32 | 630.76 | 27.258 | 985.11 | 1509.90 | |
| 50 | 662.44 | 55.78 | 1427.20 | 51.61 | 634.76 | 12.13 | 997.44 | 1381.30 | |
| Al-NiO (MS) | 20 | 662.29 | 75.46 | 1437.60 | 87.38 | 625.14 | 50.66 | 1020.50 | 1437.00 |
| 35 | 662.71 | 64.24 | 1437.30 | 86.26 | 642.29 | 15.40 | 1007.40 | 1357.60 | |
| 50 | 663.67 | 61.33 | 1434.70 | 64.22 | 648.37 | 4.48 | 1010.40 | 1680.50 | |
| Al-NiO (HPBM-1h) | 20 | 662.48 | 65.16 | 1421.2 | 36.58 | 631.71 | 65.16 | 982.61 | 1342.50 |
| 35 | 662.43 | 82.57 | 1430.00 | 77.14 | 621.70 | 36.07 | 1011.30 | 1477.50 | |
| 50 | 663.44 | 71.54 | 1413.70 | 80.45 | 630.83 | 10.86 | 1001.00 | 1606.30 | |
Disclaimer/Publisher’s Note: The statements, opinions and data contained in all publications are solely those of the individual author(s) and contributor(s) and not of MDPI and/or the editor(s). MDPI and/or the editor(s) disclaim responsibility for any injury to people or property resulting from any ideas, methods, instructions or products referred to in the content. |
© 2026 by the authors. Licensee MDPI, Basel, Switzerland. This article is an open access article distributed under the terms and conditions of the Creative Commons Attribution (CC BY) license.
Copyright: This open access article is published under a Creative Commons CC BY 4.0 license, which permit the free download, distribution, and reuse, provided that the author and preprint are cited in any reuse.