

Submitted:
22 July 2026
Posted:
07 August 2026
You are already at the latest version
Abstract
Background: Unexplained cytopenia presents a common diagnostic challenge in clinical haematology, reflecting either benign conditions or early manifestations of myeloid neoplasms. Although genetic testing is increasingly becoming the standard reference for diagnosis, an initial cellular assessment of the bone marrow is often the first decisive diagnostic step. Methods: In this retrospective cross-sectional study, we analysed 557 patients with cytopenia who underwent initial diagnostic evaluation. The diagnostic performance of the initial cellular assessment defined in this study as morphological and ancillary studies excluding genetic analyses was evaluated against a genetically supported reference diagnosis established by a multidisciplinary haematology tumour board. We examined the extent to which the initial cellular diagnosis can reliably detect or rule out myeloid neoplasia. The analysis was performed for the entire cohort and stratified by specific myeloid neoplasm entities. Results: In the overall cohort, the initial cellular assessment showed high diagnostic performance (sensitivity, 0.864; specificity, 0.934). The misclassification analysis revealed more false negatives than false positives (31 vs. 21), with no significant asymmetry. In the entity-specific analysis, a sensitivity of 1.0 was observed for acute myeloid leukaemia, with a reduced specificity (0.400). Myelodysplastic neoplasms exhibited a higher rate of false-negative findings, whereas myelodysplastic/myeloproliferative overlap neoplasms were characterised by very high sensitivity (0.982) and limited specificity (0.632). A comparable diagnostic pattern was observed for myelofibrotic neoplasms. Conclusion: Initial cellular assessment demonstrates high overall diagnostic performance in cytopenia but shows important variation across individual entities. These findings highlight the need to consider entity-specific limitations and the role of genetic confirmation in the diagnostic work-up of specific entities.
Keywords:
cytopenia
; tumor board
; genetics
; NGS
; myeloid neoplasms
; leukemia
1. Introduction
Unexplained cytopenia is a common haematological issue in clinical practice [1] and poses a diagnostic challenge, as it can indicate either benign conditions or myeloid neoplasms [2,3].
In addition to an initial clinical evaluation, differentiation between benign and malignant causes in individuals with unexplained cytopenia often begins with assesment of the peripheral blood smear. If a haematological neoplasm is suspected based on the differential diagnosis, a bone marrow puncture is then performed [4]. The haematological work-up of a bone marrow puncture includes morphological assessment of the aspirate, immunocytological analysis (fluorescence-activated cell sorting; FACS), and histological examination including immunohistology. Genetic testing, including cytogenetic and molecular genetic analyses, is now widely used following cellular assessment in modern haematology practice. Next-generation sequencing (NGS) methods are widely used in molecular genetic testing, as they enable the examination of multiple genes or gene segments [5,6].
There is evidence for the value of clinical NGS in the routine diagnosis of myeloid neoplasms. Carbonell et al. evaluated 121 myeloid neoplasms and demonstrated that the more comprehensive genetic characterisation provided by NGS enhances diagnostic accuracy, leading to the reclassification of seven cases and providing additional therapeutic and prognostic value [7]. Thus, NGS plays an important role in the classification and subclassification of myeloid neoplasms. Furthermore, NGS can help correctly classify borderline cases and is particularly useful in clarifying difficult cases, for example, those involving low blast counts or unclear morphology [8]. It is essential to consider neoplastic diseases when investigating cytopenia. Myelodysplastic neoplasms (MDS) are predominantly characterised by anaemia; however, cytopenia can affect all cell lines and is associated with reduced health-related quality of life [9]. Likewise in chronic myelomonocytic leukaemia (CMML) thrombocytopenia is most common, however cytopenia can occur across all cell lines [10] Myeloid neoplasms exhibiting myelofibrosis such as Primar Myelofibrosis (PMF), prefibrotic Myelofibrosis (prePMF), post-ET Myelofibrosis(post-ET MF), post-PV Myelofibrosis (post-PV MF) and myelodysplastic/myeloproliferative neoplasms (MDS/MPN) are often identified via blood count abnormalities. These neoplasms also exhibit cytopenia and, depending on the stage of the disease, varying degrees of concomitant cytoses [11,12]. Fernandez-Pol et al. examined 53 patients with pancytopenia and no evidence of myeloid neoplasia in the bone marrow, comparing them with 38 cases of confirmed myeloid neoplasia and cytopenia. Their study demonstrated that somatic mutations in many MDS-associated genes also occur frequently in non-malignant cytopenias. These mutations often reflect clonal haematopoiesis and are not specific to MDS. In contrast, U2AF1 mutations appeared to be relatively specific to true myeloid neoplasms.
These findings emphasise the complex interplay between morphological assessment and genetic analysis in cytopenia [13].
Objectives
The aim of this study was to evaluate the diagnostic performance of initial cellular assessment in the investigation of cytopenia compared to a genetically supported reference diagnosis, thereby identifying entity-specific weaknesses in cellular diagnostics. In particular, we investigated whether individual myeloid neoplasms are associated with an increased rate of false-negative findings and thus a higher risk of being overlooked in the initial assessment, or conversely, if certain entities are characterised by an increased rate of false-positive findings, which can lead to a premature suspected diagnosis of myeloid neoplasia. In addition, we aimed to provide practice-relevant information to support clinical decision-making. Particularly in resource-limited healthcare contexts where genetic testing is not routinely available,is used selectively, or there are clinically significant delays in genetic results, this study provides guidance on which suspected diagnoses should be prioritised for further genetic evaluation.
2. Materials and Methods
Study Design
This retrospective cross-sectional study analysed data from electronic medical records of patients with cytopenia at the Wels-Grieskirchen Hospital. The study period covered December 2017, when NGS diagnostics for myeloid mutations were established at the centre, until 23 January 2025. The study design followed a stepwise diagnostic procedure of routine clinical practice in a multidisciplinary setting. The initial cellular assessment comprised primary cellular diagnostics, including morphological analysis of peripheral blood smears, bone marrow aspirates, and bone marrow biopsies, supplemented by immunomorphological procedures such as immunohistochemistry and flow cytometry. A preliminary diagnostic assessment based on the cellular test findings was documented during this initial evaluation. In the second diagnostic step, cytogenetic and molecular genetic tests, including NGS, were performed. All findings from cellular diagnostics, histology, cytogenetics, and molecular genetics were discussed in a multidisciplinary-haematologic tumour board. These discussions focused particularly on the classification of the NGS findings within the clinical context. The diagnosis agreed upon by the tumour board represented the definitive diagnostic classification. An overview of the tumour board’s diagnostic process is provided in Figure 1. Only patients who had undergone both complete cellular diagnostics and genetic testing, followed by a tumour board decision, were included in the analysis. Progress assessments or subsequent re-evaluations were not considered.
Diagnostic Procedures
For the initial cellular assessment, morphological diagnostics included the evaluation of peripheral blood smears and bone marrow aspirates. Microscopic evaluation of the aspirates was performed according to standardised haematologic criteria, and at least 500 nucleated cells were routinely differentiated and evaluated. In addition, a histological examination of bone marrow trephine biopsies was performed. The biopsies were processed according to established standard procedures and stained with haematoxylin and eosin. In addition, reticulin staining was performed when clinically indicated to assess the extent of possible fibrosis. Additional immunohistochemical staining was performed as indicated when necessary for diagnostic classification. Bone marrow cells were immunophenotypically characterisedusing a BD FACSLyric™ flow cytometer. Bone marrow samples were processed into single-cell suspensions and incubated with fluorochrome-conjugated antibodies against markers of myeloid neoplasms. The antibody panels were selected according to the indication and clinical question. Typically, 50,000–100,000 events were acquired per sample. Data analysis was performed using standardised FSC/SSC and CD45/SSC-based gating strategies. Cytogenetic examinations were performed as part of the primary diagnosis and included conventional chromosome banding analysis (G-banding). Fluorescence in situ hybridisation (FISH) was also applied, as needed, to detect clinically relevant chromosomal aberrations in myeloid neoplasms. Molecular genetic diagnostics were performed using NGS with Myeloid Solution Panels (Sophia Genetics). Paired-end sequencing was performed on an Illumina MiSeq platform. The analysis targeted somatic variants in genes and gene segments frequently affected in myeloid neoplasms in a phenotype-oriented manner. Bioinformatics analyses were performed using the SOPHiA DDM® analysis pipeline with the hg19 reference genome. The pipeline includes automated steps for quality control, alignment, variant detection, and annotation. Variants were filtered according to predefined quality criteria, including minimum requirements for sequencing depth and variant allele frequency. For single-nucleotide variants and insertions/deletions, analytical thresholds of ≥1% variant allele frequency were applied. Genomic positions with insufficient coverage (< 1000×) or problematic sequence contexts (e.g., long homopolymer regions) were considered or excluded according to pipeline standards.
Statistical Analysis
Statistical analysis was performed to evaluate the diagnostic performance of initial cellular assessment relative to genetically supported reference diagnosis established by the tumour board (“true state”). The cellular assessment was defined as a binary diagnostic test. Any initial diagnosis of myeloid neoplasia suspected in the cellular assessment was considered a positive test, regardless of the subsequent final entity assignment. The assessment was considered negative if there was no initial indication of myeloid neoplasia. For the overall cohort and predefined subgroups, 2×2 contingency tables were created to determine the absolute counts of true positives, true negatives, false positives, and false negatives. The diagnostic performance of cellular diagnostics was calculated according to sensitivity and specificity. All parameters were reported with 95% confidence intervals calculated using the Wilson score method. The McNemar test was used to investigate possible systematic asymmetry in misclassifications (more false positives than false negatives or vice versa) between cellular diagnostics and the genetic reference standard. Group comparisons between the overall cohort and individual diagnostic entities were performed using the chi-square test or Fisher’s exact test. A p-value < 0.05 was considered to indicate significance. All statistical analyses were performed using Microsoft’s “Analyse-it Medical Edition” software.
Legal and Ethical Considerations
All patient data were pseudonymised and transferred to an Excel database with sequential study numbers. The database was stored on a secure server at the Hospital Wels-Grieskirchen and was accessible only to authorised persons defined in the study protocol. The study was conducted as a retrospective database analysis without direct patient contact. The study was approved by the responsible Institutional Review Board of Johannes Kepler University Linz and the Province of Upper Austria, Austria. The study was conducted in accordance with the tenets of the Declaration of Helsinki and its subsequent amendments.
3. Results
This section may be divided by subheadings. It should provide a concise and precise description of the experimental results, their interpretation, and the experimental conclusions that can be drawn A total of 557 patients with cytopenias were included in the analysis. In the final diagnosis agreed upon by the tumour board, 129 cases were classified as MDS, 55 as MDS/MPN overlap neoplasms, 122 as acute myeloid leukaemia (AML), and 26 as MF-Ns defined as PMF, prePMF, post-ET MF or post-PV MF. No myeloid neoplasia was detected in 225 patients; thus, their cytopenia was diagnosed as benign. Regarding the cytopenia pattern, 128 patients had pancytopenia, 192 bicytopenia, and 237 had isolated single-lineage cytopenia. Among the single-lineage cytopenias, anaemia predominated (n = 151), followed by thrombocytopenia (n = 56) and leukopenia (n = 30). The baseline characteristics are summarised in Table 1.
In the overall cohort, initial cellular assessment showed high diagnostic performance, with a sensitivity of 0.864 and a specificity of 0.934. Thus, myeloid neoplasms were correctly identified in most cases, and a high proportion of non-neoplastic cases were correctly excluded. In addition, in the overall cohort analysis, there were more false-negative than false-positive findings (31 vs. 21), with no significant asymmetry between the two misclassifications (p = 0.26).
The sensitivity of the initial cellular diagnosis was > 0.8 in all myeloid neoplasms examined (Figure 1). Compared with the overall cohort, there was no significant deviation for MDS (0.845 vs. 0.864; p = 0.639) or MF-N (0.962 vs. 0.864; p = 0.218). In contrast, sensitivity for MDS/MPN was significantly higher than that in the overall cohort (0.982; p = 0.009). For AML, the maximum sensitivity of 1.0 was achieved (p < 0.001), indicating that no cases were misclassified as false negatives. The entity-specific sensitivity values and their 95% confidence intervals are shown in Figure 2 and Table 2, respectively.
The specificity of the initial cellular assessment was high across the overall cohort and was comparable to that for MDS (0.913 vs. 0.934; p = 0.391). Thus, MDS demonstrated the highest specificity among the entities examined. In contrast, specificity was significantly lower for several entities than in the overall cohort. The lowest specificity was observed for AML (0.400; p = 0.003), followed by MF-N (0.500; p = 0.006) and MDS/MPN (0.632; p < 0.001). These differences are summarised in Table 2 and graphically represented in Figure 3.
The distribution of false-positive and false-negative classifications within the individual entities is shown in Table 3. No significant asymmetry between false positives and false negatives was detected in any myeloid neoplasm. Descriptively, false-negative findings occurred more frequently in MDS and in the overall cohort. Numerically, more false-positive classifications were observed in MDS/MPN and AML. The highest proportion of primary misclassifications was found in MDS. In AML and MF-N, misclassifications in cellular diagnostics were low.
4. Discussion
In this retrospective cross-sectional study, the diagnostic performance of the initial cellular assessment in the investigation of cytopenia was compared with a genetically supported reference diagnosis, agreed upon by a multidisciplinary haematologic tumour board. In the overall cohort, the initial cellular assessment achieved a sensitivity of 0.864 and a high specificity of 0.934. These results demonstrate that myeloid neoplasms can be correctly identified or ruled out in most cases during initial cellular diagnostics. Notably, this diagnostic accuracy was achieved in an unselected, real-world cytopenia cohort including patients with both benign and malignant conditions. Thus, our findings underscore the high practical relevance of the initial diagnostic procedures. However, the entity-specific analysis revealed relevant differences in diagnostic performance. A sensitivity of 1.0 was achieved for AML; thus, no cases were initially overlooked in the present cohort. However, the specificity was significantly reduced, indicating a tendency toward overdiagnosis. This finding is clinically plausible, as even discrete morphological abnormalities or low blast counts often lead to a precautionary suspicion of AML to avoid overlooking potentially life-threatening diseases. The 2022 WHO classification softened the previously rigid paradigm of an obligatory blast percentage of ≥ 20% for numerous AML entities with defining genetic aberrations. This reflects the recognition that genetically defined AML subtypes have comparable biological and clinical relevance even at lower blast proportions and that a purely blast-centred diagnosis is obsolete [14,15]. The comparatively high rate of false-negative findings in MDS underscores the diagnostic complexity of this entity. MDS is not a clearly defined clinical picture, but rather exists on a diagnostic continuum, particularly in early or low-risk stages, with clonal precursor conditions such as clonal cytopenia of undetermined significance (CCUS). The somatic mutations detectable in CCUS are often identical to those typical of MDS, without necessarily fulfilling morphological dysplasia criteria. This biological and morphological overlap makes it challenging to establish a clear diagnosis and can lead to initial underdiagnosis, especially in cases with subtle findings [16,17]. Diagnostic analyses for MDS/MPN overlap neoplasms showed very high sensitivity with significantly reduced specificity. This finding underscores that the microscopic phenotype, with simultaneous dysplastic and proliferative features, enables reliable detection of myeloid neoplasms. However, due to pronounced morphological overlap, entity-specific differentiation is often unclear; thus, the initial morphologically suspected diagnosis was frequently revised in the context of genetic diagnostics and interdisciplinary evaluation [18]. Similar limitations were observed in MF-Ns. The histologically detectable degree of fibrosis favours a high sensitivity in the initial cellular assessment. However, limited specificity was observed, as low bone marrow fibrosis is not an entity-specific feature and can also be observed in various reactive and clonal non-MF-N conditions [19]. A key aspect of this study is the use of the diagnosis agreed upon by the tumour board as the reference standard. All final diagnostic and therapeutic decisions were made by clinical haematology specialists. This approach takes into account the clinical reality in which disciplines such as clinical pathology, laboratory medicine, and molecular biology are considered supportive departments.
Limitations
A major limitation of this study is that the initial cellular assessment is based on microscopic interpretation by experienced examiners and is therefore subject to a certain degree of interindividual variability. This interobserver variability is an inherent characteristic of morphological diagnosis. It also represents an important reason for the supplementary use of genetic testing in routine clinical practice. The research question was deliberately investigated in a large, representative single-center cohort with standardized diagnostic procedures to minimize the impact of this variability as much as possible. This approach strengthened the methodological consistency. A multicenter study design might increase the generalizability of the results, however, it would also introduce additional variability due to differing diagnostic standards. Future studies involving microscopic evaluations could benefit from artificial intelligence-supported digital pathology in terms of comparability [20].
5. Conclusions
The results show that the diagnostic performance of the initial cellular assessment in cytopenia varies by entity. This has important implications for clinical practice, helping physicians judge when findings from the initial cellular assessment are sufficiently reliable and when it is advisable to await genetic confirmation.
Supplementary Materials
The following supporting information can be downloaded at the website of this paper posted on Preprints.org.
Author Contributions
Conceptualization, B.S., R.S., J.M., S.M., M.H., E.W. and S.H.; methodology, B.S., R.S., E.W. and S.H.; validation, B.S., R.S., J.M., E.W. and S.H.; formal analysis, B.S.; investigation, B.S., R.S., J.M., S.M., M.H., E.W. and S.H.; resources, B.S., R.S., J.M., E.W. and S.H.; data curation, B.S. and M.H.; writing—original draft preparation, B.S.; writing—review and editing, B.S., R.S., J.M., S.M., M.H., E.W. and S.H.; visualization, B.S.; supervision, B.S., R.S., J.M., E.W. and S.H.; project administration, B.S.; funding acquisition, none. All authors have read and agreed to the published version of the manuscript.
Funding
This research received no external funding.
Institutional Review Board Statement
The study was approved by the responsible Institutional Review Board of Johannes Kepler University Linz and the Province of Upper Austria, Austria with the approval code 1029/2025 (approval date: 12.5.2025).
Informed Consent Statement
Patient consent was waived due to the retrospective study design.
Data Availability Statement
The original contributions presented in this study are included in the article/Supplementary Material. Further inquiries can be directed to the corresponding author.
Acknowledgments
Not applicable.
Conflicts of Interest
The authors declare no conflicts of interest.
Abbreviations
The following abbreviations are used in this manuscript:
| AML | Acute myeloid leukaemia |
| CCUS | Clonal cytopenia of undetermined significance |
| CMML | Chronic myelomonocytic leukaemia |
| FACS | Fluorescence-activated cell sorting |
| FISH | Fluorescence in situ hybridisation |
| FN | False negative |
| FP | False positive |
| FSC/SSC | Forward scatter/side scatter |
| IQR | Interquartile range |
| MDS | Myelodysplastic neoplasm |
| MDS/MPN | Myelodysplastic/myeloproliferative neoplasm |
| MF-N | Myelofibrotic neoplasm |
| NGS | Next-generation sequencing |
| PMF | Primary myelofibrosis |
| prePMF | Prefibrotic primary myelofibrosis |
| post-ET MF | Post-essential thrombocythaemia myelofibrosis |
| post-PV MF | Post-polycythaemia vera myelofibrosis |
| TN | True negative |
| TP | True positive |
| WHO | World Health Organization |
References
- Vargas-Carretero, C.J.; Fernandez-Vargas, O.E.; Ron-Magana, A.L.; Padilla-Ortega, J.A.; Ron-Guerrero, C.S.; Barrera-Chairez, E. Etiology and clinico-hematological profile of pancytopenia: experience of a Mexican Tertiary Care Center and review of the literature. Hematology 2019, 24, 399–404. [Google Scholar] [CrossRef] [PubMed]
- Beyler, O.; Demir, C.; Dogan, A. The impact of anti-HBc positivity on clinical outcomes and treatment response in immune thrombocytopenia. Wien. Klin. Wochenschr. 2025, 137, 579–584. [Google Scholar] [CrossRef] [PubMed]
- Weinberg, O.K. Clinical and pathologic challenges of clonal cytopenia of undetermined significance. Int. J. Lab Hematol. 2021, 43 Suppl 1, 82–85. [Google Scholar] [CrossRef] [PubMed]
- Chew, S.; Kamangar, M. Approach to pancytopenia: From blood tests to the bedside. Clin. Med. (Lond) 2024, 24, 100235. [Google Scholar] [CrossRef] [PubMed]
- Gnanaraj, J.; Parnes, A.; Francis, C.W.; Go, R.S.; Takemoto, C.M.; Hashmi, S.K. Approach to pancytopenia: Diagnostic algorithm for clinical hematologists. Blood Rev. 2018, 32, 361–367. [Google Scholar] [CrossRef] [PubMed]
- Wurm, S.; Waltersdorfer, M.; Loindl, S.; Moritz, J.M.; Herzog, S.A.; Bachmaier, G.; Berghold, A.; Kashofer, K.; Beham-Schmid, C.; Hoefler, G.; et al. Acute myeloid leukemia in the next-generation sequencing era: Real-world data from an Austrian tertiary cancer care center. Wien. Klin. Wochenschr. 2025, 137, 504–516. [Google Scholar] [CrossRef] [PubMed]
- Carbonell, D.; Suarez-Gonzalez, J.; Chicano, M.; Andres-Zayas, C.; Trivino, J.C.; Rodriguez-Macias, G.; Bastos-Oreiro, M.; Font, P.; Ballesteros, M.; Muniz, P.; et al. Next-Generation Sequencing Improves Diagnosis, Prognosis and Clinical Management of Myeloid Neoplasms. Cancers 2019, 11. [Google Scholar] [CrossRef] [PubMed]
- Ye, X.; Zheng, Z.; Wu, Y.; Zhang, Z.; Xu, Z.; Liu, Y.; Jiang, L.; Wu, J. NGS panel enhance precise diagnosis of myeloid neoplasms under WHO-HAEM5 and International Consensus Classification: An observational study. Medicine 2024, 103, e38556. [Google Scholar] [CrossRef] [PubMed]
- Wouters, H.; Conrads-Frank, A.; Koinig, K.A.; Smith, A.; Yu, G.; de Witte, T.; Wolffenbuttel, B.H.R.; Huls, G.; Siebert, U.; Stauder, R.; et al. The anemia-independent impact of myelodysplastic syndromes on health-related quality of life. Ann. Hematol. 2021, 100, 2921–2932. [Google Scholar] [CrossRef] [PubMed]
- Nosslinger, T.; Reisner, R.; Gruner, H.; Tuchler, H.; Nowotny, H.; Pittermann, E.; Pfeilstocker, M. Dysplastic versus proliferative CMML--a retrospective analysis of 91 patients from a single institution. Leuk. Res. 2001, 25, 741–747. [Google Scholar] [CrossRef] [PubMed]
- Mascarenhas, J.; Hoffman, R.; Talpaz, M.; Gerds, A.T.; Stein, B.; Gupta, V.; Szoke, A.; Drummond, M.; Pristupa, A.; Granston, T.; et al. Pacritinib vs Best Available Therapy, Including Ruxolitinib, in Patients With Myelofibrosis: A Randomized Clinical Trial. JAMA Oncol. 2018, 4, 652–659. [Google Scholar] [CrossRef] [PubMed]
- Montalban-Bravo, G.; Jabbour, E.; Chien, K.; Hammond, D.; Short, N.; Ravandi, F.; Konopleva, M.; Borthakur, G.; Daver, N.; Kanagal-Shammana, R.; et al. Phase 1 study of azacitidine in combination with quizartinib in patients with FLT3 or CBL mutated MDS and MDS/MPN. Leuk. Res. 2024, 142, 107518. [Google Scholar] [CrossRef] [PubMed]
- Fernandez-Pol, S.; Ma, L.; Ohgami, R.S.; Arber, D.A. Significance of myelodysplastic syndrome-associated somatic variants in the evaluation of patients with pancytopenia and idiopathic cytopenias of undetermined significance. Mod. Pathol. 2016, 29, 996–1003. [Google Scholar] [CrossRef] [PubMed]
- Khoury, J.D.; Solary, E.; Abla, O.; Akkari, Y.; Alaggio, R.; Apperley, J.F.; Bejar, R.; Berti, E.; Busque, L.; Chan, J.K.C.; et al. The 5th edition of the World Health Organization Classification of Haematolymphoid Tumours: Myeloid and Histiocytic/Dendritic Neoplasms. Leukemia 2022, 36, 1703–1719. [Google Scholar] [CrossRef] [PubMed]
- Loghavi, S.; Kanagal-Shamanna, R.; Khoury, J.D.; Medeiros, L.J.; Naresh, K.N.; Nejati, R.; Patnaik, M.M.; Project, W.H.O.t.E.C. Fifth Edition of the World Health Classification of Tumors of the Hematopoietic and Lymphoid Tissue: Myeloid Neoplasms. Mod. Pathol. 2024, 37, 100397. [Google Scholar] [CrossRef] [PubMed]
- Naqvi, K.; Sasaki, K.; Montalban-Bravo, G.; Alfonso Pierola, A.; Yilmaz, M.; Short, N.; Assi, R.; Jabbour, E.; Ravandi, F.; Kadia, T.; et al. Clonal hematopoiesis of indeterminate potential-associated mutations and risk of comorbidities in patients with myelodysplastic syndrome. Cancer 2019, 125, 2233–2241. [Google Scholar] [CrossRef] [PubMed]
- Huber, S.; Baer, C.; Hutter, S.; Wossidlo, N.; Hoermann, G.; Pohlkamp, C.; Walter, W.; Meggendorfer, M.; Kern, W.; Haferlach, T.; Haferlach, C. Genomic landscape of CCUS compared to MDS and its implications on risk prediction. Leukemia 2024, 38, 1634–1637. [Google Scholar] [CrossRef] [PubMed]
- Meggendorfer, M.; Jeromin, S.; Haferlach, C.; Kern, W.; Haferlach, T. The mutational landscape of 18 investigated genes clearly separates four subtypes of myelodysplastic/myeloproliferative neoplasms. Haematologica 2018, 103, e192–e195. [Google Scholar] [CrossRef] [PubMed]
- Zhao, Y.; Guo, J.; Zhao, S.; Wang, R.; Shi, L.; Fang, Y.; Zhang, Z.; Song, L.; Wu, D.; Chang, C. Bone Marrow Fibrosis at Diagnosis and during the Course of Disease Is Associated with TP53 Mutations and Adverse Prognosis in Primary Myelodysplastic Syndrome. Cancers 2022, 14. [Google Scholar] [CrossRef] [PubMed]
- Omoush, S.A.; Alzyoud, J.A.M.; El-Omari, N.K.T.; Alzyoud, A.J.A. The Role of Whole Slide Imaging in AI-Based Digital Pathology: Current Challenges and Future Directions—An Updated Literature Review. J. Mol. Pathol. 2026, 7, 2. [Google Scholar] [CrossRef]
Figure 1.
Schematic representation of the working method of the haematology tumour board.
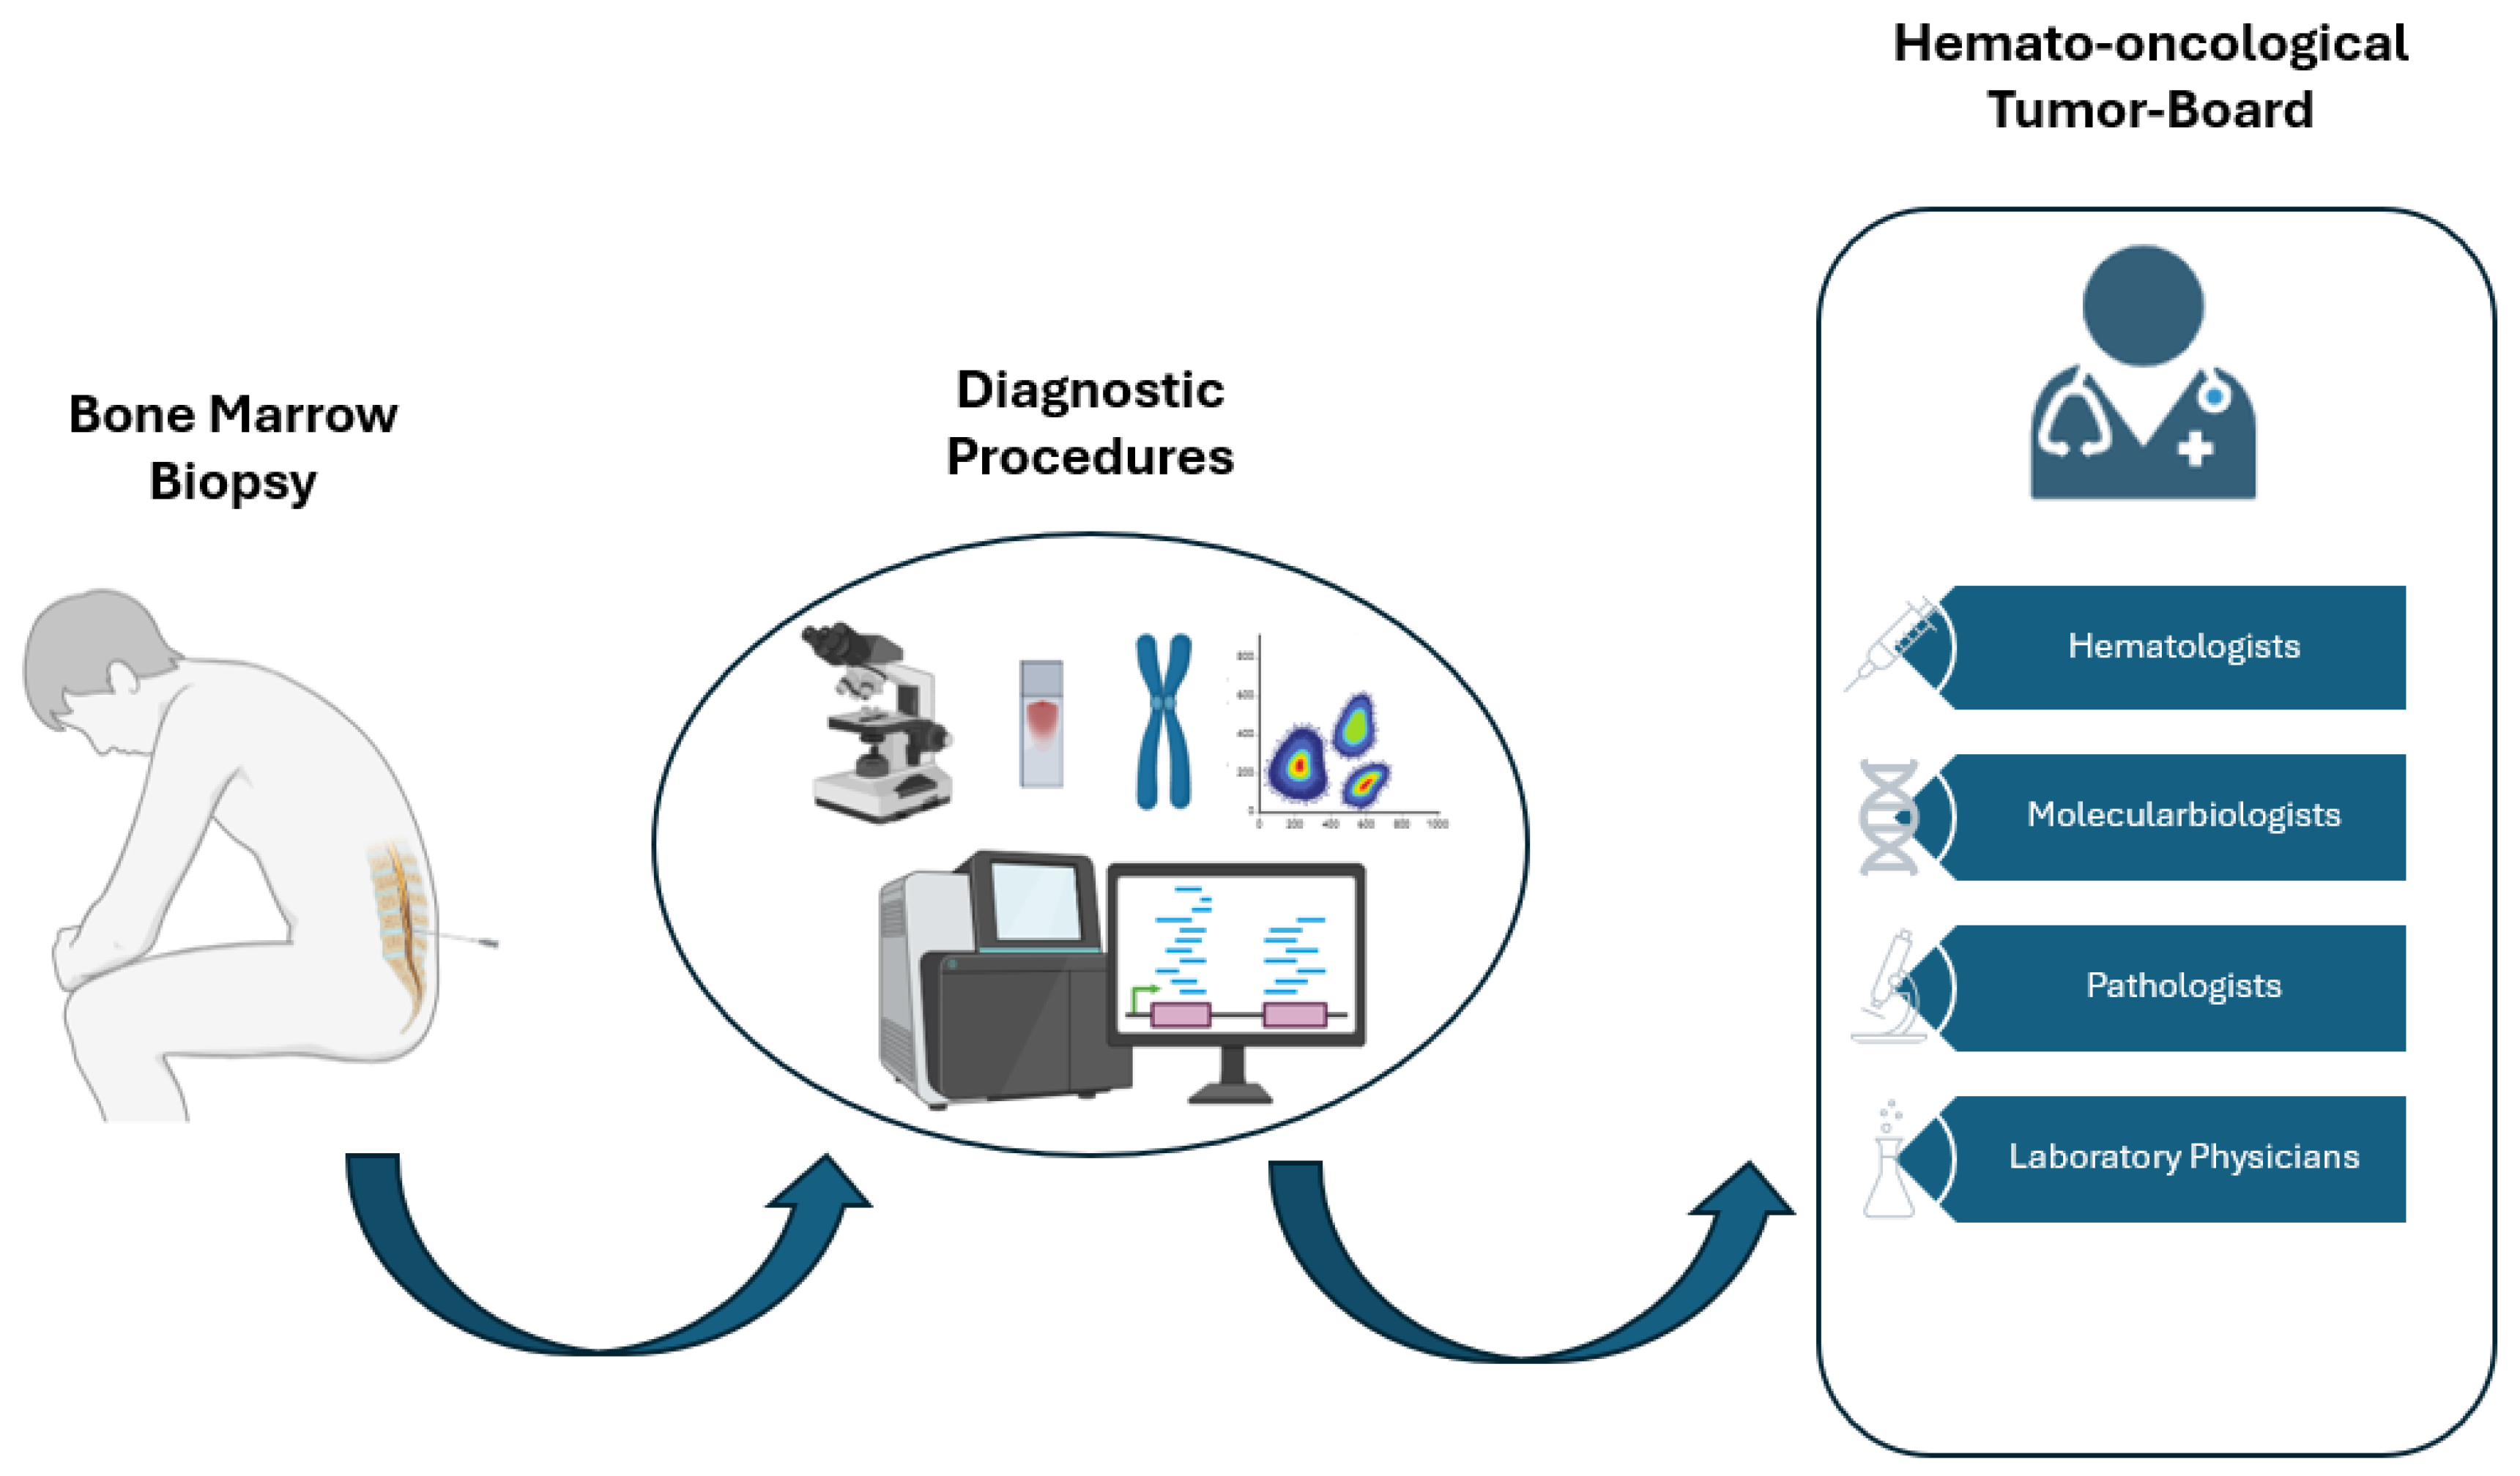
Figure 2.
Sensitivity of the initial cellular assessment for the detection of myeloid neoplasms in the overall cohort and stratified by diagnostic entity.
Figure 2.
Sensitivity of the initial cellular assessment for the detection of myeloid neoplasms in the overall cohort and stratified by diagnostic entity.
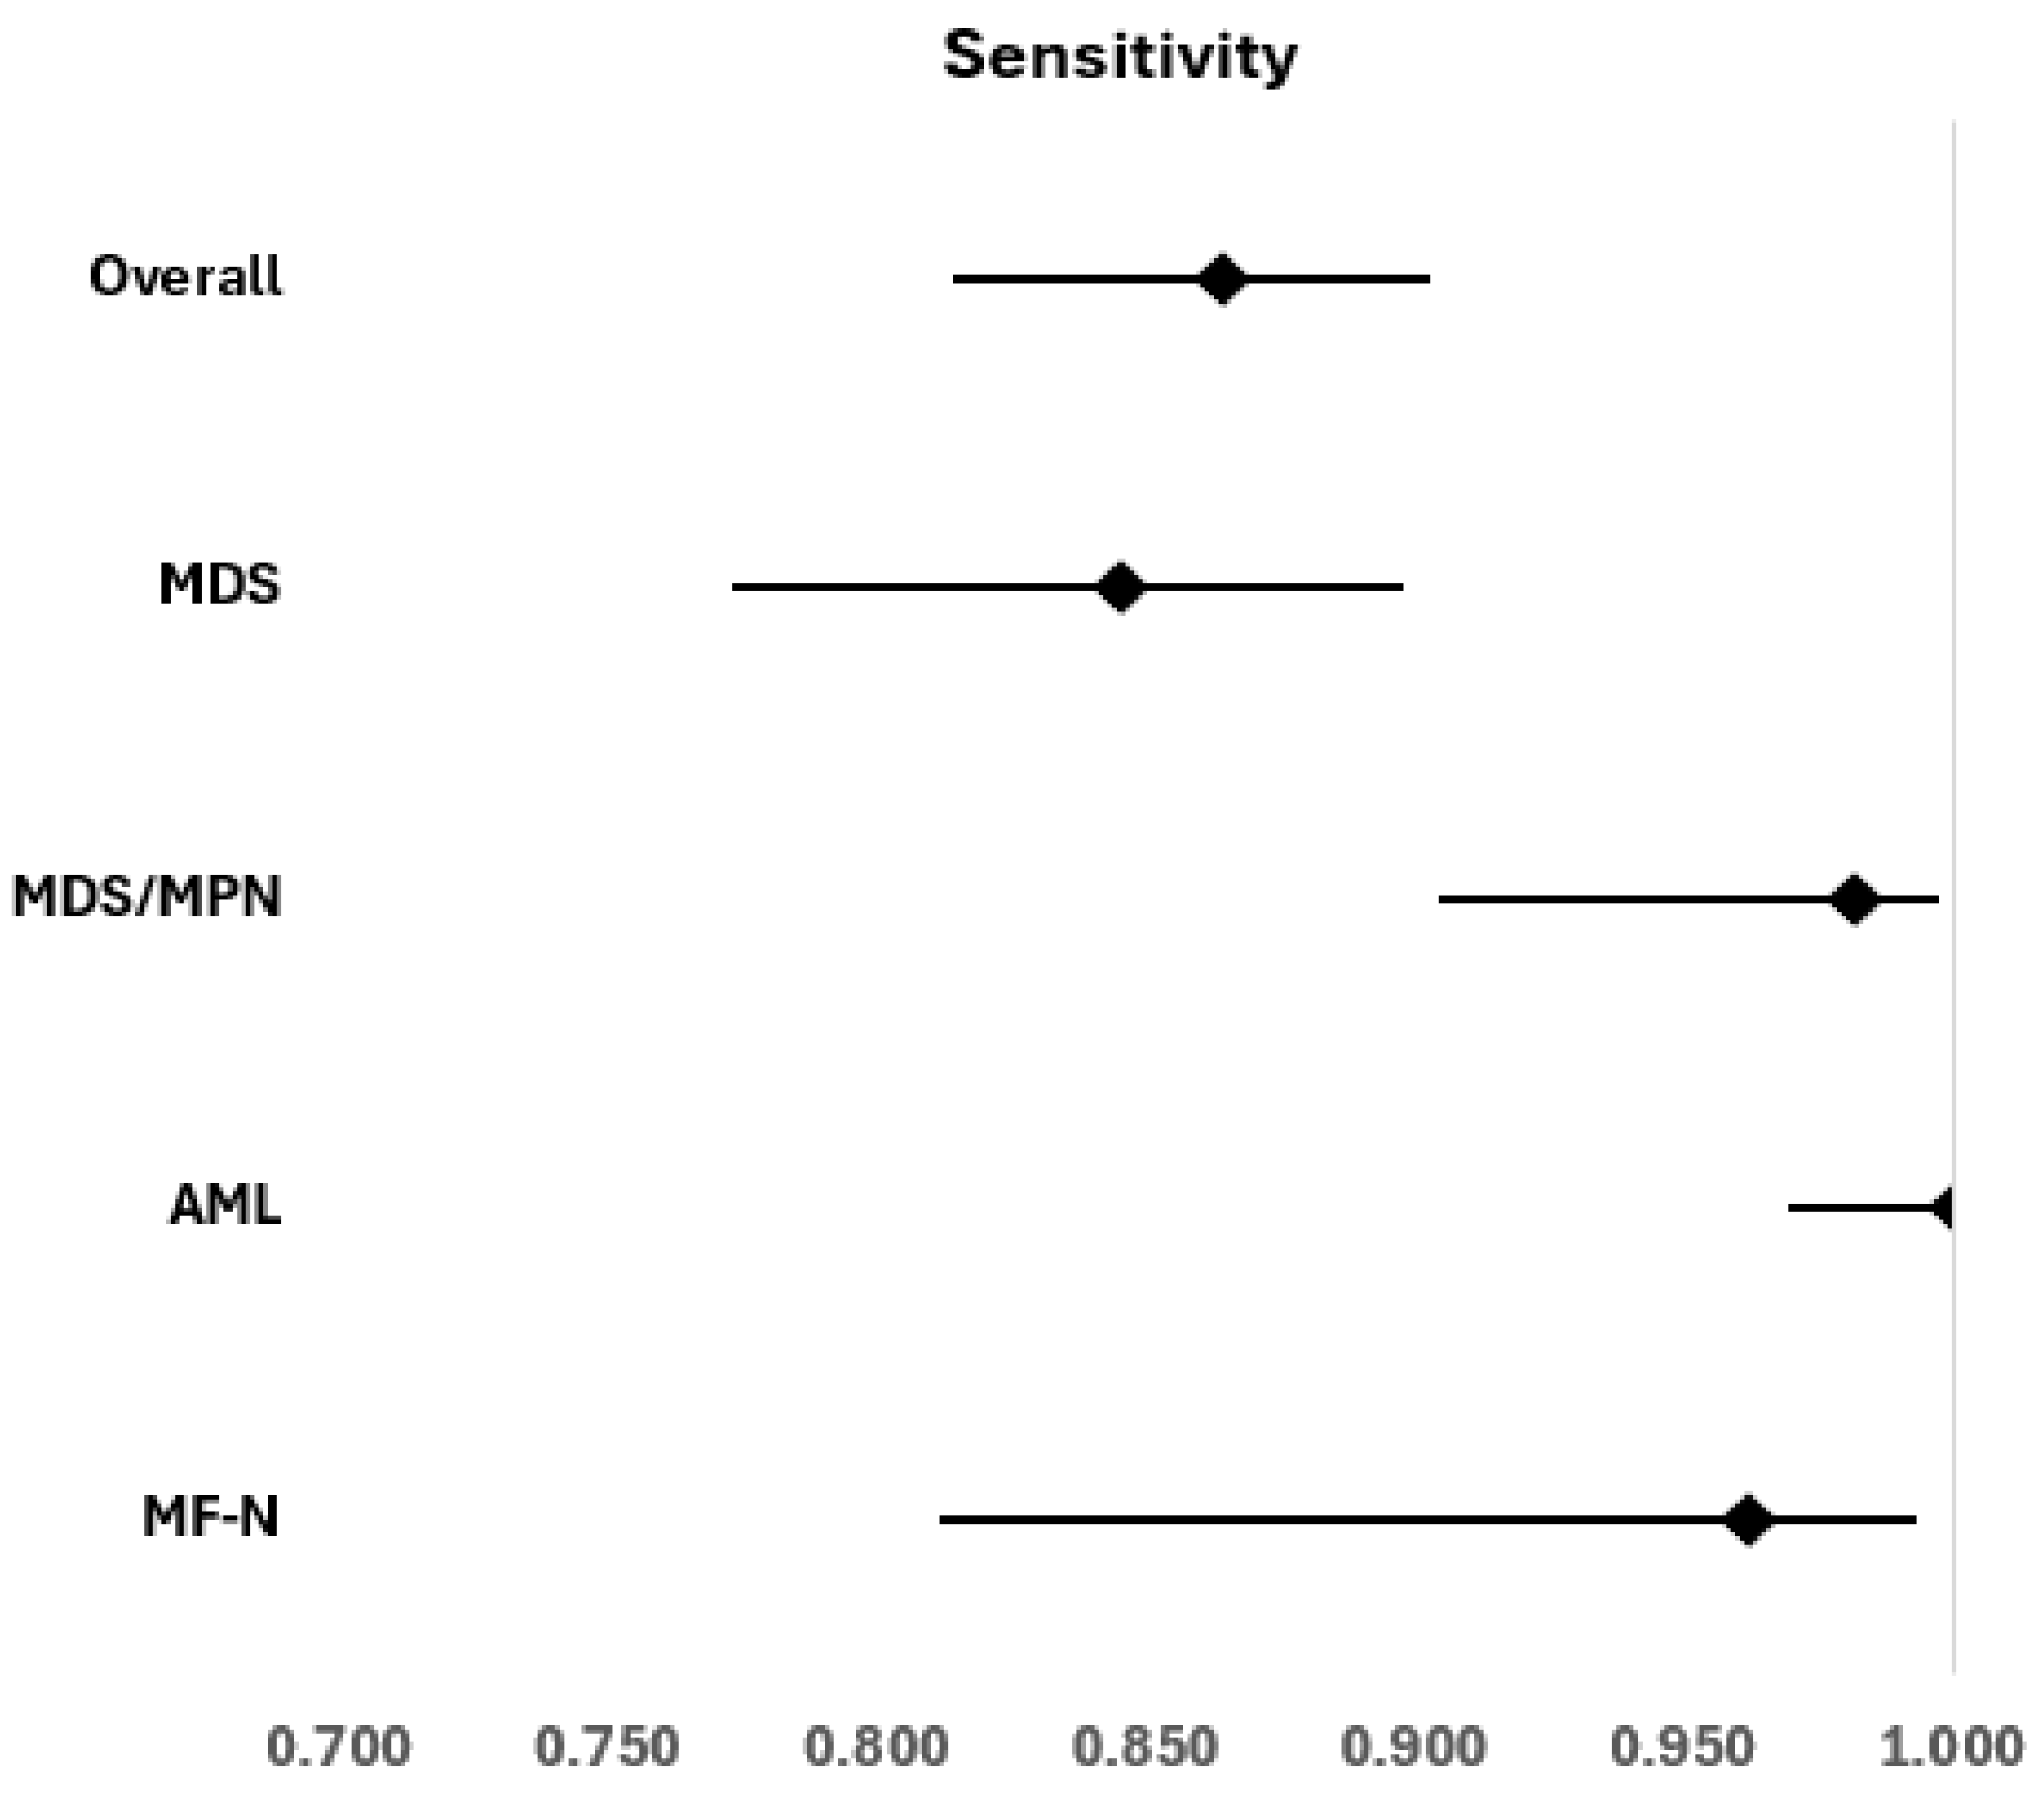
Figure 3.
Forest plot showing the specificity of the initial cellular assessment for the exclusion of cytopenic myeloid neoplasms.
Figure 3.
Forest plot showing the specificity of the initial cellular assessment for the exclusion of cytopenic myeloid neoplasms.
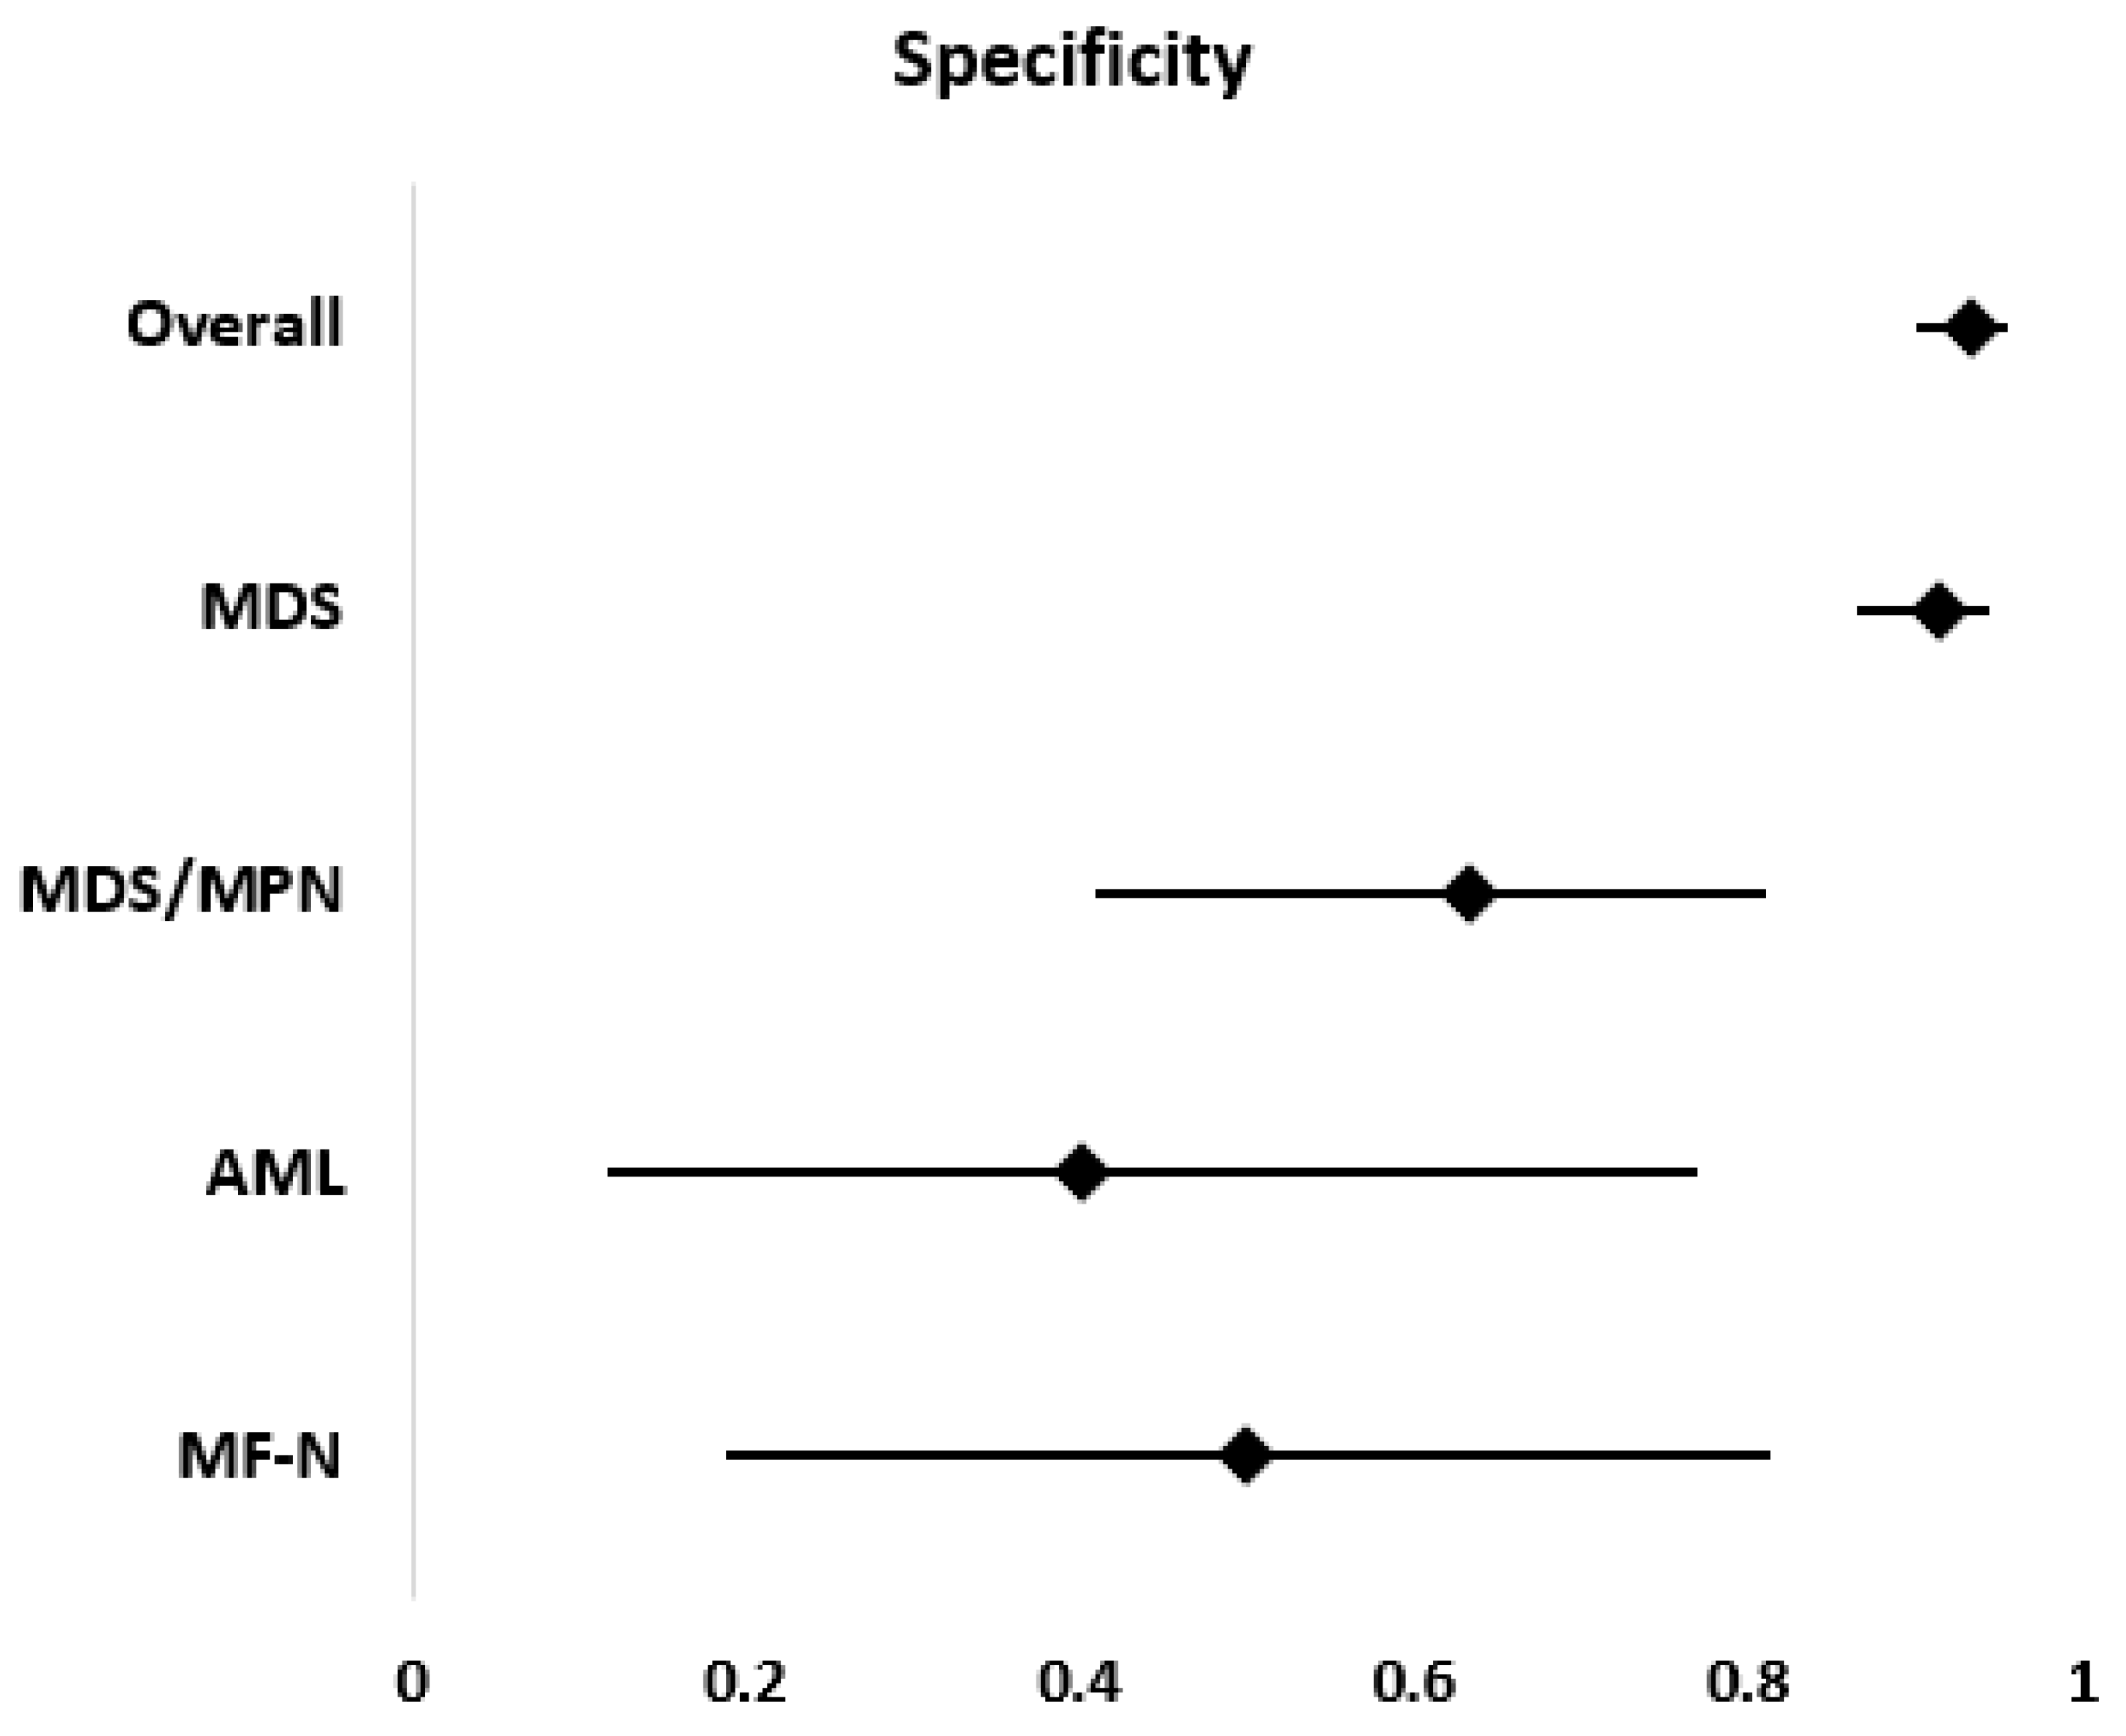

Table 1.
Baseline characteristics of the study cohort. The distribution of final diagnostic categories and cytopenia type in the overall cohort (n = 557) is shown. * Percentages for anaemia, thrombocytopenia and leukopenia refer to the 237 patients with single-lineage cytopenia.
Table 1.
Baseline characteristics of the study cohort. The distribution of final diagnostic categories and cytopenia type in the overall cohort (n = 557) is shown. * Percentages for anaemia, thrombocytopenia and leukopenia refer to the 237 patients with single-lineage cytopenia.
| Study cohort | n (%) / Median (IQR) | Cytopenia type | n (%) |
| Overall | 557 (100) | Pancytopenia | 128 (23.0) |
| Age (years) | 71 (63–79) | Bicytopenia | 192 (34.5) |
| Male sex | 318 (57.1%) | Single-lineage cytopenia | 237 (42.5) |
| Female sex | 239 (42.9%) | • Anaemia | 151 (63.7*) |
| • Thrombocytopenia | 56 (23.6*) | ||
| • Leukopenia | 30 (12.7*) | ||
| Final diagnosis | |||
| Benign cytopenia | 225 (40.4) | ||
| Myelodysplastic neoplasm (MDS) | 129 (23.2) | ||
| Acute myeloid leukaemia (AML) | 122 (21.9) | ||
| MDS/MPN overlap neoplasm | 55 (9.9) | ||
| Myelofibrotic neoplasms (MF-N) | 26 (4.7) |
Table 2.
Sensitivity and specificity of the initial cellular assessment.
| Diagnostic category | Sensitivity | p | Specificity | p |
| Overall | 0.864 | 0.934 | ||
| MDS | 0.845 | 0.639 | 0.913 | 0.391 |
| MDS/MPN | 0.982 | 0.009 | 0.632 | <0.001 |
| AML | 1 | <0.001 | 0.4 | 0.003 |
| MF-N | 0.962 | 0.218 | 0.5 | 0.006 |
Table 3.
Number of false positives (FP) and false negatives (FN) in the diagnosis of cytopenic myeloid neoplasms.
Table 3.
Number of false positives (FP) and false negatives (FN) in the diagnosis of cytopenic myeloid neoplasms.
| Diagnostic category | FP | FN | p |
| Overall | 21 | 31 | 0.26 |
| MDS | 17 | 20 | 0.74 |
| MDS/MPN | 7 | 1 | 0.07 |
| AML | 3 | 0 | 0.25 |
| MF-N | 3 | 1 | 0.63 |
Disclaimer/Publisher’s Note: The statements, opinions and data contained in all publications are solely those of the individual author(s) and contributor(s) and not of MDPI and/or the editor(s). MDPI and/or the editor(s) disclaim responsibility for any injury to people or property resulting from any ideas, methods, instructions or products referred to in the content. |
© 2026 by the authors. Licensee MDPI, Basel, Switzerland. This article is an open access article distributed under the terms and conditions of the Creative Commons Attribution (CC BY) license (http://creativecommons.org/licenses/by/4.0/).
Copyright: This open access article is published under a Creative Commons CC BY 4.0 license, which permit the free download, distribution, and reuse, provided that the author and preprint are cited in any reuse.