
Submitted:
05 August 2026
Posted:
06 August 2026
You are already at the latest version
Abstract
Evaluating Sustainable Urban Built Morphology (SUBM) paĴerns at a metropolitan-wide scale obscures the localized trends in urban morphology across space and time. This research introduces Development Morphology Units (DMUs) as a micro-scale analytical concept for investigating the fine-grained spatio-temporal dynamics within urban morphology regimes. Based on 5,844 development tracts observed between 1990 and 2023 in Mecklenburg County, North Carolina, this study utilizes within-regime Spatio-Temporal Density-Based Spatial Clustering of Applications with Noise (ST-DBSCAN) on five previously identified regimes. These DMUs are further described according to four descriptors of temporal position, temporal span, spatial footprint, and spatial movement. The results detect substantial heterogeneity between DMUs in terms of spatio-temporal growth patterns. Peripheral and conventional suburban regimes account for large proportions of development tracts across the county, nonetheless, they revealed a limited DMUs formation ratio, with most of their tracts left unclustered, while the identified DMUs were predominantly small, localized, and short-lived. On the other hand, the accessibility-oriented regime demonstrated a cohesive DMU structure and contains sustained and spatially stable morphological units. Within the intermediate regimes, most DMUs characterize localized and episodic growth, alongside a small number of large-scale units. Also, the highest-achieving sustainability regime in the county exhibited recent, short-lived, spatially localized, and stationary units. Across all regimes, morphological growth paĴerns predominantly represent limited spatial movement, suggesting that developments sharing similar morphological characteristics tend to remain anchored to previously established areas. These paĴerns align with evolutionary urbanism, indicating that sustainability-oriented urban morphology evolves through localized, cumulative processes rather than spatially random expansion. The identified DUMs demonstrated that localized urban morphology patterns evolve distinctively across space and time. The findings inform urban sustainability practices by tracking the dynamics of sustainability-oriented urban morphology at local levels.
Keywords:
sustainable urban morphology
; spatio-temporal clustering
; development morphology units
; urban heterogeneity
Introduction
Urban morphology provides a significant lens through which the urban landscape pathway towards sustainability can be understood. The characteristics of urban form manifest themselves in various spatial configurations of cities, such as land-use patterns, transportation, and accessibility across urban environments [1,2]. Existing scholarship has broadly indicated that low-density and spatially dispersed patterns, such as typical suburbia in the United States, are associated with arrays of socioeconomic and environmental sustainability challenges [1,3,4,5,6]. Among various approaches introduced to address these concerns, the multidimensional framework of Sustainable Urban Built Morphology (SUBM) has recently been conceptualized to evaluate sustainability outcomes across morphological dimensions, including built-environment, land use, and transportation and accessibility [7]. In this sense, increasing scholarly attention has been directed towards understanding the spatial and temporal organization of sustainability-oriented urban morphology at the local level.
While substantial progress has been made in quantifying urban morphology, most studies focus on broad urban patterns across building, neighborhood, municipal, metropolitan, or regional scales. As a result, comparatively less attention has been devoted to understanding how sustainability-oriented development organizes through localized spatio-temporal processes embedded within broader metropolitan patterns [8,9]. Theoretical perspectives, such as evolutionary urbanism, complexity science, and diffusion–coalescence theory, have progressively viewed cities as complex adaptive systems that continuously evolve through the interaction of multi-scalar mechanisms operating across space and time [10,11,12,13]. These processes are characterized by different spatio-temporal properties and exhibit fundamentally unique trajectories, such as urban growth diffusion and consolidation [12]. Advances in the urban systems literature have increasingly enabled the assessment of urban restructuring and transition processes across space and time. In this regard, primary analytical approaches have examined characterizing land-use change, urban growth and expansion, alongside using clustering and hotspot mapping procedures. However, these approaches offered insufficient evidence on how localized development processes possessing common morphological characteristics organize and progress across space and time. This gap underscores the need for a bridging analytical layer integrating local development projects with metropolitan-wide growth dynamics, reflecting evolutionary urbanism and complexity-based views of urban growth [11,13,14,15].
In this context, understanding how sustainability-oriented urban morphology organizes itself at fine spatial and temporal scales remains limited [2,16]. Existing studies have primarily investigated metropolitan-scale development dynamics, identifying overarching trajectories of urban change such as polycentric development, diffusion–coalescence, and corridor-oriented expansion. However, these approaches provide relatively coarse representations of urban dynamics and offer little to no insight into the heterogeneity of land planning and development processes operating under different local contexts across metropolitan space and over time [11,13]. In this sense, instances of urban land development may be sorted into certain sustainability-oriented morphology regimes, defined as groupings of individual developments sharing similar morphological features across various built form dimensions. Yet, it remains unclear whether developments belonging to the same morphology regime share localized space-time concentrations and whether these concentrations demonstrate distinct spatio-temporal characteristics, such as persistence, drift, retrenchment, or expansion. As a result, nuanced variations may remain concealed when morphology regimes are considered as homogeneous metropolitan-scale entities and a complementary question is whether variability in morphological characteristics corresponds to distinct spatio-temporal characteristics.
Building upon the SUBM framework presented in [7], this study develops a fine-grained analytical framework to identify and characterize local Development Morphology Units (DMUs), defined as collections of land development tracts sharing similar morphological characteristics and space-time adjacency that are distinct from those of other DMUs. This intermediate analytical level extends SUBM framework and delivers planners, practitioners, and researchers with how sustainability-oriented urban development takes shape locally, extending metropolitan-scale analysis. This type of localized spatial insight strengthens context-aware planning and design decisions by recognizing local development trends that would be otherwise overlooked within metropolitan-scale analysis [17]. These DMUs are characterized on four complementary spatio-temporal descriptors. Particularly, the framework compares when DMUs emerge, how long they persist, the expanse of geographical space they occupy, and the degree to which their land development activity shifts across the metropolitan space over time.
On this basis, the study aims at addressing the following research question: To what extent do developments sharing sustainability-oriented urban morphology form into localized units exhibiting distinct spatio-temporal characteristics, and how do these characteristics vary across a study area? Grounded in complexity science and evolutionary urbanism perspectives, it is hypothesized that developments sharing common morphological characteristics are organized into a collection of DMUs, each comparatively exhibiting distinct spatio-temporal characteristics within and across morphology regimes. To examine this hypothesis, the study draws on a land development tract dataset in Mecklenburg County, North Carolina [7], whereby each tract is associated with one of five predefined sustainability-oriented morphology regimes. The spatio-temporal clustering algorithm is then employed to identify the latent regime-specific DMUs. Subsequently, the identified DMUs are compared according to their spatio-temporal characteristics, and the resulting typology is interpreted in terms of the space-time dynamics of urban development systems.
This paper advances the SUBM and urban development strands of literature in several respects. First, conceptually, it redefines metropolitan-scale morphological regimes from internally homogenous entities to collections of localized DMUs exhibiting distinct spatio-temporal characteristics embedded within each regime. Second, methodologically, the study introduces a replicable procedure that synthesizes regime-specific DMUs detected as groupings of tracts close in space and time and characterizes them by four intuitive spatio-temporal descriptors. Third, empirically, the investigation reveals variation in the spatio-temporal characteristics of DMUs both within and across morphology regimes. This makes it possible to unpack the morphology regime analysis that otherwise is solely based on a metropolitan-scale perspective and discover concealed nuanced localized heterogeneity.
This study is structured as follows. The first section reviews SUBM, and the use of spatio-temporal analytics in urban morphology. In the second section, the analytical context of this empirical study pertaining to the SUBM framework is reintroduced, followed by its operationalization to address the core research question and demonstrate the methodological framework. Section three highlights the results on the regime-specific DMUs and their distinct spatio-temporal characteristics. Finally, the last section discusses the findings in relation to the existing domain of knowledge, along with limitations and future work suggestions.
Literature Review
The concept of SUBM has recently been theorized in light of the growing priority to examine the consistency of urban built morphology with sustainability outcomes [8]. The literature has largely confirmed that certain urban morphology characteristics such as dense and compact built-up areas, mixed-use activities, and connected, accessible-oriented street layouts tend to impact sustainability standards [1,18,19,20]. In this sense, considerable scholarly attention has been directed toward operationalizing urban morphology through various measures, such as building floor area ratio, land density, and intersection density, to capture the alignment of urban form with sustainability principles. Collectively, these measures establish a unified analytical foundation for quantifying urban morphology and present an empirical basis upon which SUBM is developed [8].
Urban growth has been understood as a dynamic and non-linear process influenced by interacting spatial, economic, infrastructural, and institutional agents [21,22]. Traditional interpretation of urban growth, presenting it as a monocentric and homogeneous pattern, has been replaced by complex and heterogeneous processes across space and time. In other words, instead of a singular gradient following a core-periphery structure, the recent perspective focuses on viewing the urban development process through spatially heterogeneous pathways over time, such as polycentricity, corridor development, leapfrog pattern, and so on [15,21,23,24]. In this context, theory-driven perspectives in urban planning such as complexity theory and evolutionary urbanism have also supplemented theoretical foundations to redefine urban change as adaptive and path-dependent systems, characterized by multiple spatial and temporal factors [13,21,25]. From this perspective, the transition and restructuring dynamics are driven by cumulative interactions among historical urbanization trajectories, infrastructure investment, land development pressures, transportation systems, and accessibility changes [21,26,27]. Collectively, these perspectives suggest that urban development organizes into localized, path-dependent units rather than randomly across space.
In parallel, substantial empirical evidence has accumulated on the heterogeneity of urban transition and restructuring processes. As one of the most influential dynamic frameworks in urban growth research, the diffusion–coalescence model conceptualizes metropolitan expansion as a dual process of outward fragmented diffusion and inward spatial coalescence. Contributing to this line of research, [28] used several spatial metrics, including mean nearest-neighbor distance, mean patch area, total patch count, and fractal dimension, to evaluate urban growth. These authors highlighted that urban development occurs through alternating phases of diffusion and coalescence rather than a steady process of continuous, uniform expansion. Beyond diffusion–coalescence dynamics, urban change also manifests itself through polycentric patterns as well as other pathways of heterogeneous urban growth. Rather than expanding around singular concentrations such as the central business district, transition and restructuring patterns evolve through multiple interacting hotspots. Empirical evidence indicates that polycentric transition is driven by multiple forces, including infrastructure investment and planning interventions [29,30,31], generating multiple urban opportunity hotspots. As another form of urban change, the corridor-based pattern focuses on the linear expansion along major transportation and accessibility edges, where transportation infrastructure serves as the primary organizing force to connect major urban activity nodes [32,33,34]. Collectively, the empirical evidence indicates that urban transition and restructuring follow diverse and uneven paths across space and time, highlighting distinct spatial configurations, temporal rhythms, and morphological processes under different contexts and circumstances.
Advances in urban systems analytics have equipped scholars to investigate the complexity of urban transition dynamics using robust analytical approaches. [35] applied the emerging hot spot analysis approach to explore the heterogeneous trajectories of urban growth concentrations across urban space. Similarly, [36] used the Exploratory Space-Time Data Analysis (ESTDA) framework to explain the trajectories of urban expansion. Integrating spatial analytics approaches, such as spatial autocorrelation, LISA time-path analysis, and space-time transition analysis, they argued that local developments across metropolitan regions follow diverse mechanisms, characterized by spatio-temporal properties. Also, [37] employed a hybrid framework of remote sensing, spatial indices, and temporal evolution analysis to investigate the evolution of growth in urban environments, revealing substantial variation in the intensity and developmental pathways of urban expansion across urban regions. Even though current analytical approaches have considerably improved the comprehension of urban growth and morphology, they have mainly been employed to delineate metropolitan-scale change trajectories, morphology typologies, or spatial clusters. These approaches shed light on distinct features of urban evolution, nonetheless, they are limited in their ability to characterize fine-scale development patterns situated within broader sustainability-oriented morphology regimes and for investigating these patterns vary in terms of spatial and temporal attributes.
Also, while metropolitan-wide analytical approaches have progressively enhanced the understanding of change in the built environment structure of metropolitan spaces, they primarily focus on aggregate patterns of change. However, contemporary research indicates that urban transformation is driven by multiple local processes of development that follow particular spatial and temporal behaviors and generate distinct pathways across urban environments [21,27,38]. As a result, those localized phases may differ significantly in their timing, persistence, geographic extent, and spatial evolution, despite developing in a similar morphological setting. In this sense, these detailed and granular phases have rarely received systematic investigations, as existing studies primarily focused on characterizing broad transformation patterns across metropolitan areas, including polycentric growth [15,29,30], diffusion-coalescence dynamics [28], and corridor-oriented development [32,33,34]. As a result, the underlying mechanisms through which sustainability-oriented urban morphology takes shape and transforms across urban systems remain poorly understood. Additionally, from an architectural and urban design perspective, such fine-scale spatial understanding also supports site analysis by improving the interpretation of local spatial context and by informing sustainable design decision [17]. Addressing this limitation necessitates a methodological framework suited to recognizing localized development patterns, hence assessing spatial and temporal behaviors embedded within the broader urban transformation process.
Accordingly, an important gap remains in the urban morphology literature and in its intersection with urban sustainability science. While recent research has provided greater insight into metropolitan growth patterns, systematic studies of fine-grained spatio-temporal behaviors in this context remain scarce. In this regard, developments sharing similar sustainability-oriented morphological characteristics may follow different spatio-temporal growth dynamics. To bridge this gap, this paper presents a local-scale spatio-temporal analytical methodology employing urban morphology regimes as a foundation to detect and interpret local DMUs within metropolitan-wide development processes. Rather than assuming uniformity of the regimes across space and time, the proposed framework views them as sets of localized DMUs. By associating land development dynamics to sustainability-oriented morphology, the study enables a detailed insight into how urban form shifts towards sustainability across metropolitan space over time.
Analytical Context and Methodology
This study seeks to find systematic patterns in spatio-temporal properties of DMUs in the morphological regimes identified via the Sustainable Urban Built Morphology (SUBM) framework in Mecklenburg County, North Carolina, between 1990 and 2023. Based on four primary spatio-temporal characteristics, the purpose is to establish a categorization of DMUs, consistent with the urban development theoretical perspectives. In this research, Mecklenburg County, the most populous county in the state of North Carolina, was selected as a case study. The county encompasses the City of Charlotte and several other municipalities and unincorporated areas. It has witnessed sustained population growth and rapid urban expansion over the past three decades [39,40]. This population growth, coupled with factors such as absence of rigorous growth regulations and the county’s mostly flat terrain with limited natural barriers have driven sustained urban expansion and potential long-term sustainability concerns. Also, the county has exhibited diverse forms of development, ranging from New Urbanism Design approaches to conventional low-density patterns of single-family residential development centered on streets, roads, and highways. Recently, evidence revealed progress toward sustainable-oriented development patterns since 2000, characterized by high-density residential and commercial development [41,42]. These conditions, together with combination of diverse forms of development render well suited case study for exploring different local morphological patterns and consistency with sustainability outcomes.
The study relies on several geospatial databases capturing the built environment, transportation network, land use, and accessibility in the county. Property-level data, such as building attributes and construction years, was sourced from the Mecklenburg County Computer-Assisted Mass Appraisal (CAMA) database. Street network metrics were obtained from the county road centerline dataset, and accessibility metrics were derived from Walk Score. Collectively, the assembled datasets were integrated to build the SUBM framework, consisting of ten constituent measures capturing key dimensions of built-up configuration, land use, transportation and accessibility.
Unlike adopting common methods that examine individual morphological measures separately, the SUBM framework was designed to provide a unified sustainability-based depiction of urban morphology. Incorporating morphological dimensions of built-up tissue configuration, land use, transportation, and accessibility, [7] recently proposed the SUBM framework to classify development tracts across the county into five morphology regimes. To this end, formally registered land development applications (also known as development tracts) constitute the primary unit of observation. Overall, the study area contains 5,844 observations from 1990 to 2023. The SUBM framework was designed to enable a multidimensional analysis of urban form through a sustainability lens, and hence, as depicted in Table 1, it combines major dimensions of built-up tissue configuration, land-use composition, transportation structure, and accessibility, quantified through ten constituent measures. Full details of the data preparation workflow, SUBM framework and the empirical validation are described in [7].
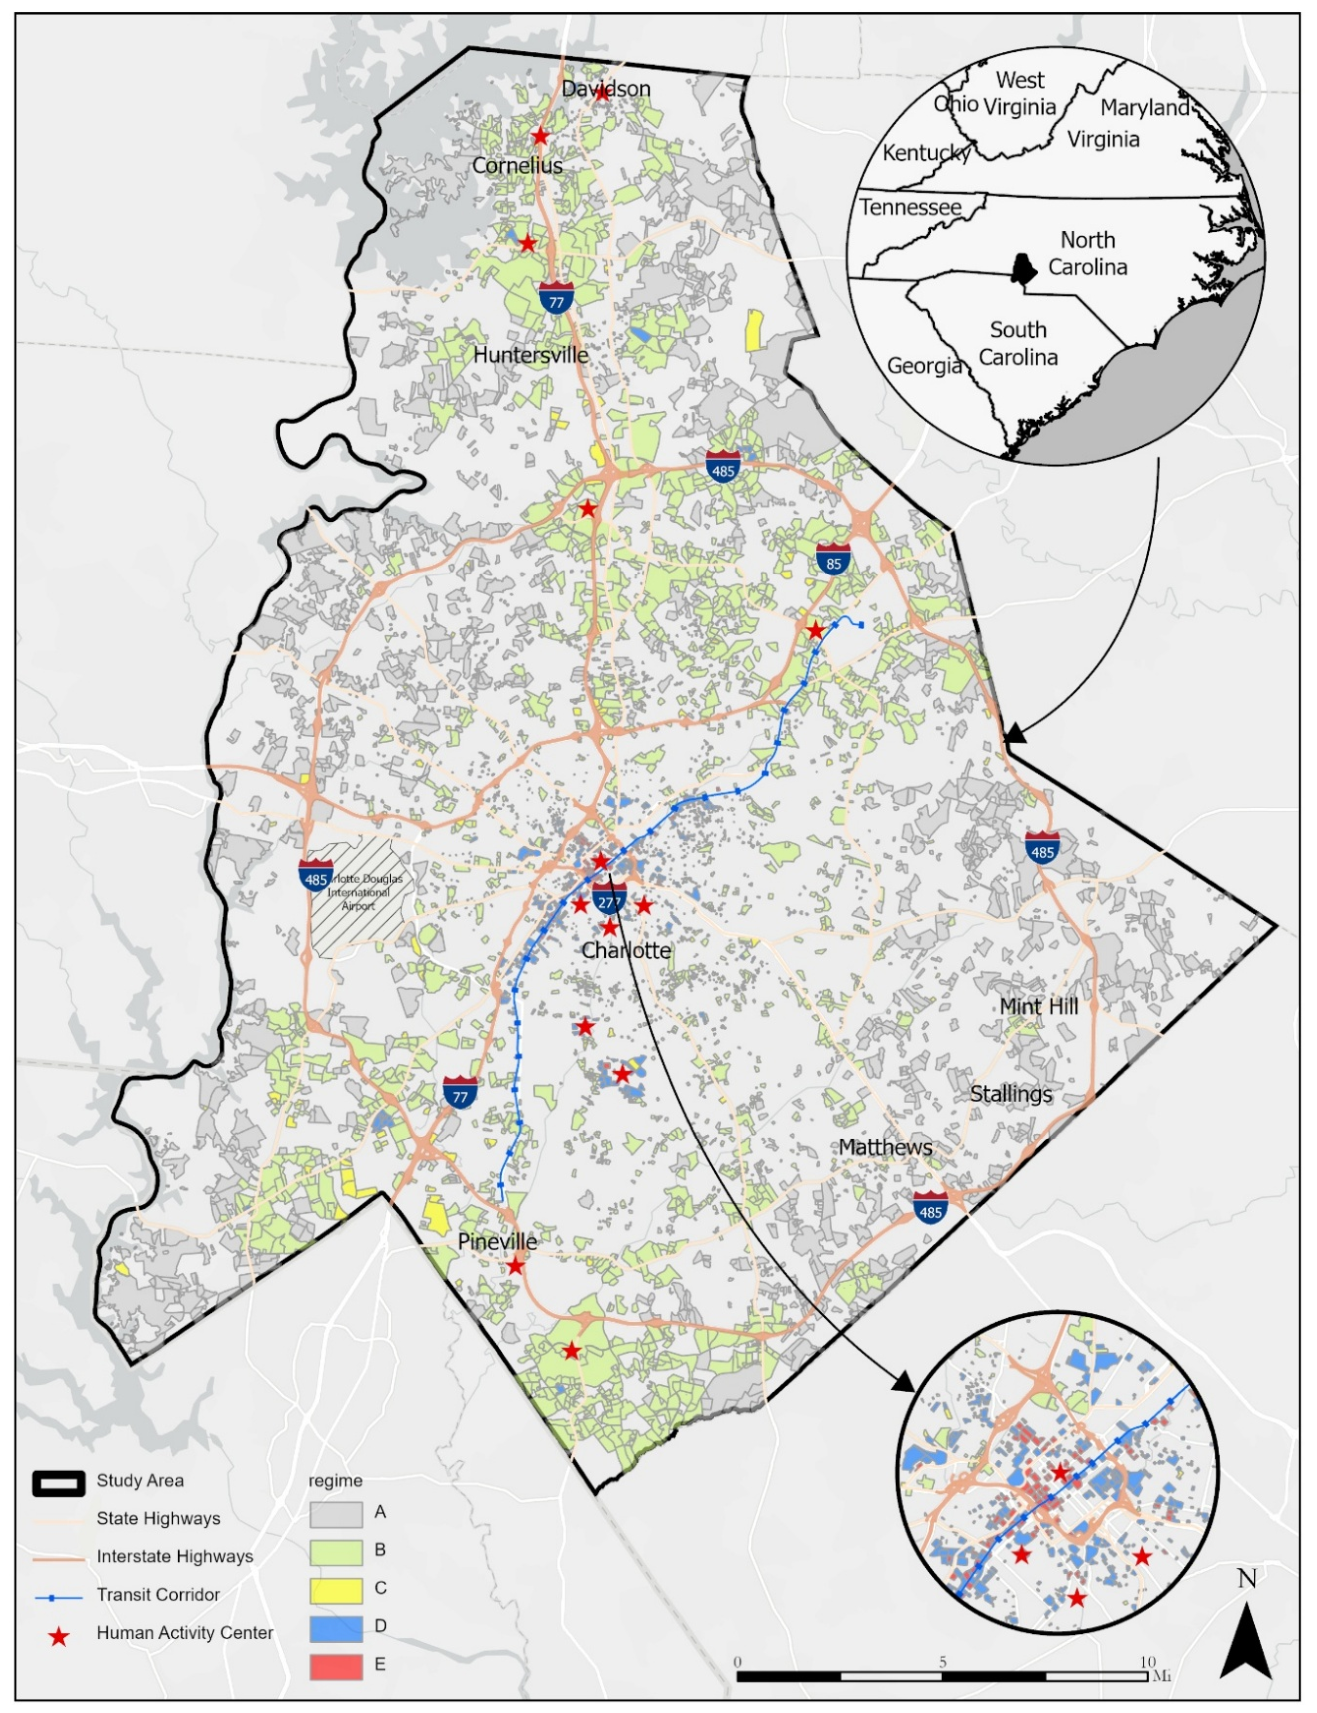
Applying the standardized SUBM constituent measures, tracts were classified using a K-means clustering approach [43] to detect separate regimes of urban morphology. Employing these constituent measures and their spatial configurations across the case study, the SUBM framework grouped tracts into distinct regimes, comprising peripheral low-density developments (Regime A), conventional suburban forms (Regime B), intermediate or transitional morphologies (Regime C), corridor-oriented accessible developments (Regime D), and highly compact urban-core developments (Regime E). Applying this approach revealed heterogenous morphological patterns across the county. The geography of these 5 regimes is illustrated in Figure 1. The resulting regimes serve as the analytical basis for this study, within which fine-grained development dynamics are investigated.
Figure 1.
Morphology regimes and metropolitan spatial structure of Mecklenburg County.
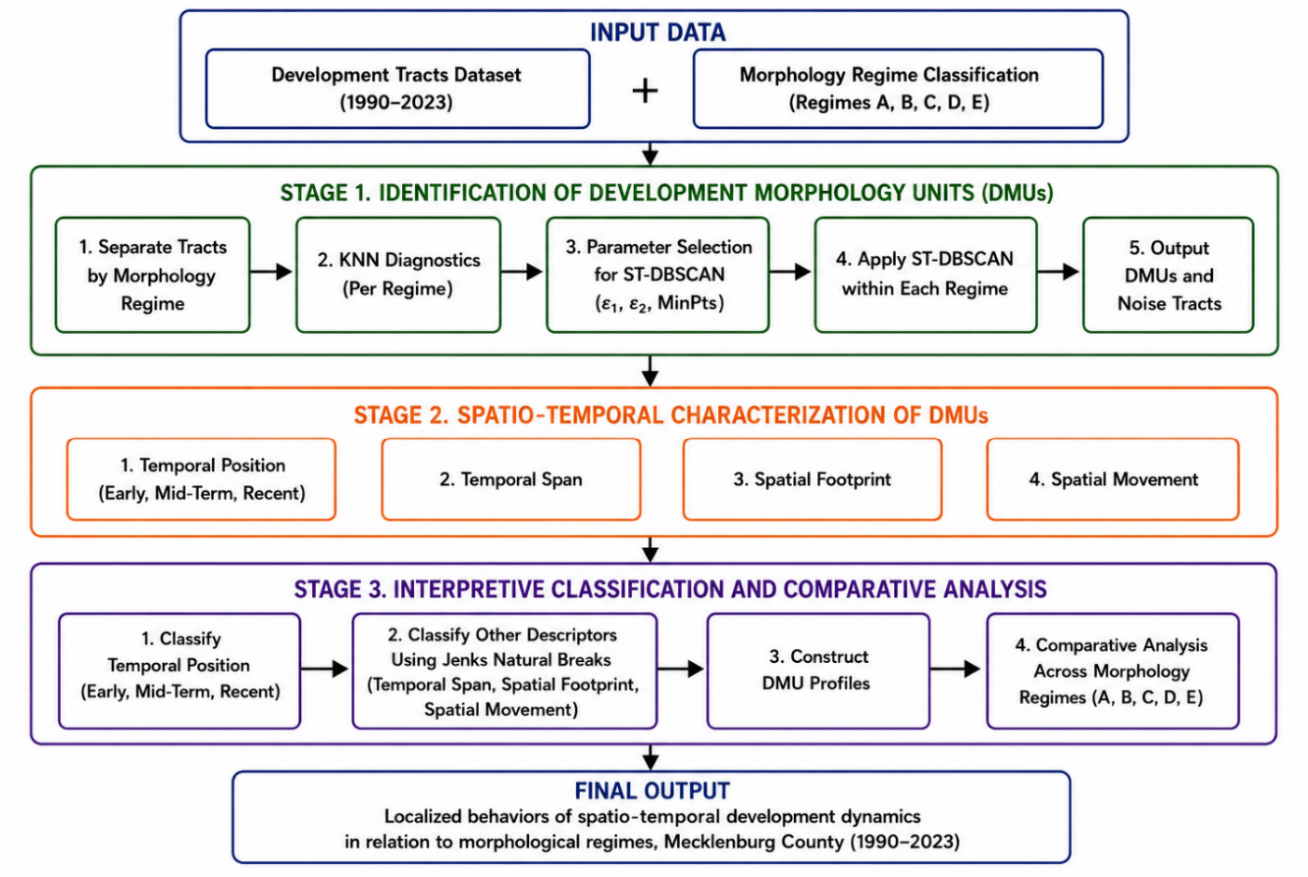
Given these county-wide morphological regimes, this research subsequently delineates localized clusters of tracts within each regime based on their temporal and spatial attributes. Each cluster represents a collection of tracts contiguous in both space and time, while sharing the same morphology regime. The resulting clusters are so-called Development Morphology Units (DMUs), acting as localized analytical units for assessing fine-grained spatio-temporal dynamics of urban development. To evaluate the behaviors of DMUs, the presented workflow is structured into three successive stages. DMUs are initially identified through regime-specific spatio-temporal clustering approaches. Next, a suite of descriptors is defined to explain the dynamics of each DMU across space and time. Finally, a data-driven comparative assessment of DMUs is performed to reveal distinct localized behaviors of spatio-temporal development dynamics in relation to morphological regimes in the study area. The overall analytical framework is summarized in Figure 2.
Figure 2.
Analytical framework for identifying, characterizing, and interpreting DMUs.
Identification of DMUs and Sensitivity Analysis
The analytical workflow initially recognizes DMUs within the morphological regimes. For this purpose, the Spatio-Temporal Density-Based Spatial Clustering of Applications with Noise (ST-DBSCAN) approach is implemented separately on the development tracts of each regime. ST-DBSCAN builds upon the standard DBSCAN clustering algorithm by jointly incorporating spatial and temporal adjacency during the clustering process. This method offers an advantage over commonly used Exploratory Spatial Data Analysis methods, notably spatio-temporal versions of Moran’s I statistics, by delineating clusters of arbitrary geometries while also capturing outlying observations as noise. Also, in contrast to other clustering methods such as k-means, ST-DBSCAN does not require a predefined cluster count, offering greater freedom in exploratory studies of urban morphology [14,44,45,46]. Overall, these factors identified ST-DBSCAN as a suitable approach for extracting DMUs. All ST-DBSCAN analyses are implemented in R using the stdbscan package sourced from [47].
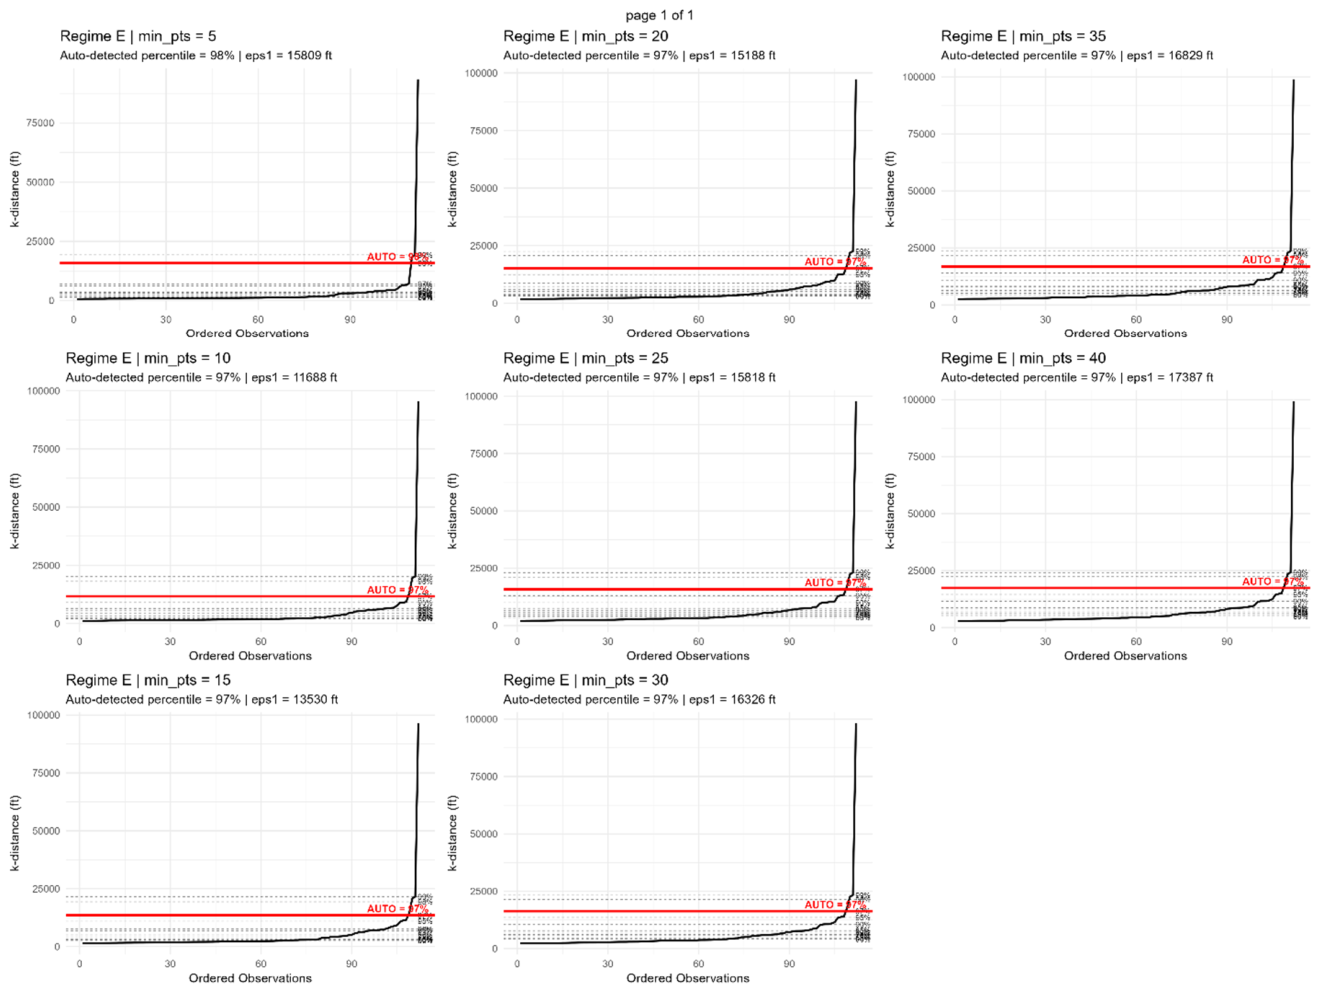
The ST-DBSCAN algorithm detects clusters of tracts using three parameters: spatial adjacency (ε₁), temporal adjacency (ε2), and the minimum required count of neighboring tracts to establish a cluster (minPts) [14]. In particular, spatial adjacency is computed using the Euclidean distance between the tract centroids, while temporal adjacency is computed by the time intervals between the issue years of neighboring tracts. Because the spatial distribution of tracts varies considerably between regimes, the spatial proximity and minPts parameters are optimized separately for each regime. For this purpose, a k-nearest-neighbor (KNN) diagnostic was applied to each regime across a range of minimum-neighbor values (minPts = 5–40). For each examined minPts value, sorted k-distance curves were created, and spatial distance thresholds were determined from predetermined percentile of the k-distance values to distinguish dense from sparse observations. Regime-specific ε₁ values were chosen based on these diagnostic results. Detailed KNN diagnostics are provided in the Appendix A. Temporal adjacency (ε₂) was selected based on sensitivity analysis and set to one year. Since development chronology is documented annually, ε₂ = 1 is the lowest positive threshold that links tracts built in successive years, enabling DMUs spanning multiple years to emerge while preventing immediate links across non-consecutive years. Increased the threshold value bridged these chronological gaps and aggregated relatively independent development phases into overly oversized clusters. As pace of development and temporal granularity may vary across metropolitan contexts, ε₂ should be recalibrated when implementing the framework in other settings. Hence, the chosen parameter set, as presented in Table 2, yielded the suitable trade-off between cluster cohesion, spatial localization, and ease of interpretation while reducing unnecessary fragmentation or aggregation.
DMU Characterization
In the next stage, each DMU is interpreted with a set of temporal and spatial concepts intended to capture the most distinct and interpretable aspects of a DMU in a spatio-temporal context. Conceptually, the framework characterizes DMUs through the two associated dimensions of temporal dynamics and spatial patterns. Temporal dynamics characteristics revolve around the chronological positions and duration, whereas spatial dynamics captures the geographic extent and displacement of development activity. Altogether, four concepts of temporal position, temporal persistence, spatial extent, and spatial mobility were employed and operationalized through corresponding metrics, as presented in Table 3.
The temporal position concept characterizes the timing of DMU activity and is operationalized using Median Development Year, defined as the median year of development of tracts in a DMU and representing the temporal center of development activity. The temporal persistence concept indicates the longevity of a DMU and is operationalized through Temporal Span as the time differences between the first and last active years in the DMU. The spatial extent concept represents the geographic footprint occupied by a DMU. To operationalize this concept, the Spatial Footprint metric is used and defined as the area of the convex hull encompassing all tracts of a DMU, thus representing its overall geographic extent. The spatial mobility concept characterizes the spatial shift of DMUs over time. To measure these mobility patterns, a Spatial Dynamic metric is calculated based on the yearly DMU centroid given by the average geographic position of all constituent tracts active in a given year. Then, the Euclidean distance from the first to the last average yearly centroid is computed, reflecting the spatial shift of a DMU over its lifetime. This metric summarizes the net spatial displacement of a DMU and does not capture nonlinear, cyclical, or intermediate movement. It was selected for its simplicity and consistent comparison across DMUs. Together, these four descriptors capture the fundamental dimensions of localized spatio-temporal development, timing, persistence, spatial extent, and spatial movement, while providing a parsimonious characterization of DMU behavior. Other measures such as socioeconomic, regulatory, and environmental factors are treated as potential drivers of DMU behavior rather than descriptors of the units themselves and are not considered in this study.
Interpretive Classification of DMUs
Following the construction of the DMU dataset, an interpretive classification framework tied to the four-way spatio-temporal characterization is developed to facilitate comparisons of spatio-temporal development dynamics across the study area. As reported in Table 4, Temporal Position is categorized into three equal time periods spanning the 1990–2023 analysis period to identify early, mid-term, and recent periods of development activity in the county. The other descriptors of Temporal Span, Spatial Footprint, and Spatial Mobility are stratified based on the Jenks Natural Breaks classification approach. This approach determines class boundaries that minimize within-group variance while maximizing inter-group variance, yielding comparable classes informed by the underlying statistical distribution of DMU descriptors (Jenks, 1967). The classification is conducted countywide on all pooled DMUs to ensure a unified basis for comparing their growth change patterns. Taken together, this analytical framework furnishes a basis for understanding the fundamental ways DMUs in the same morphology regime may differ based on their spatio-temporal profile and, in turn, for uncovering localized trajectories of SUBM across the county.
Results
Overall Clustering Outcomes
The regime-based execution of the ST-DBSCAN algorithm detected multiple identifiable DMUs across Mecklenburg County. As Table 5 illustrates, considerable variations are evident in the overall pattern of these units across the regimes. Characterized by the lowest overall ranking on sustainable morphology among the five recognized regimes, Regimes A and B account for the largest share of tracts across the county while also showing the overwhelming majority of noise tracts. This distribution indicates that relatively few tracts in these regimes were incorporated into coherent space-time clusters, resulting in comparatively weak clustering cohesion. Regimes A and B are dominated by land development in tracts that are ubiquitous and pervasive across the metropolitan space and the time horizon under study. In contrast, Regime D exhibits a highly cohesive structure, with the vast majority of tracts clustered within two dominant DMUs. Regimes C and E exhibit intermediate levels of clustering cohesion. Regime C encompasses fourteen identified DMUs that capture 60% of its tracts, whereas Regime E is comprised of two DMUs capturing half of all its tracts. As a whole, the identified DMUs suggest substantial variations in space-time coherence among morphology regimes. Regimes A and B exhibit scattered patterns, whereas Regime D includes a spatially cohesive organization. Finally, Regimes C and E display middle range of cohesion.
Regime A: Peripheral DMUs with Dispersed and Episodic Patterns
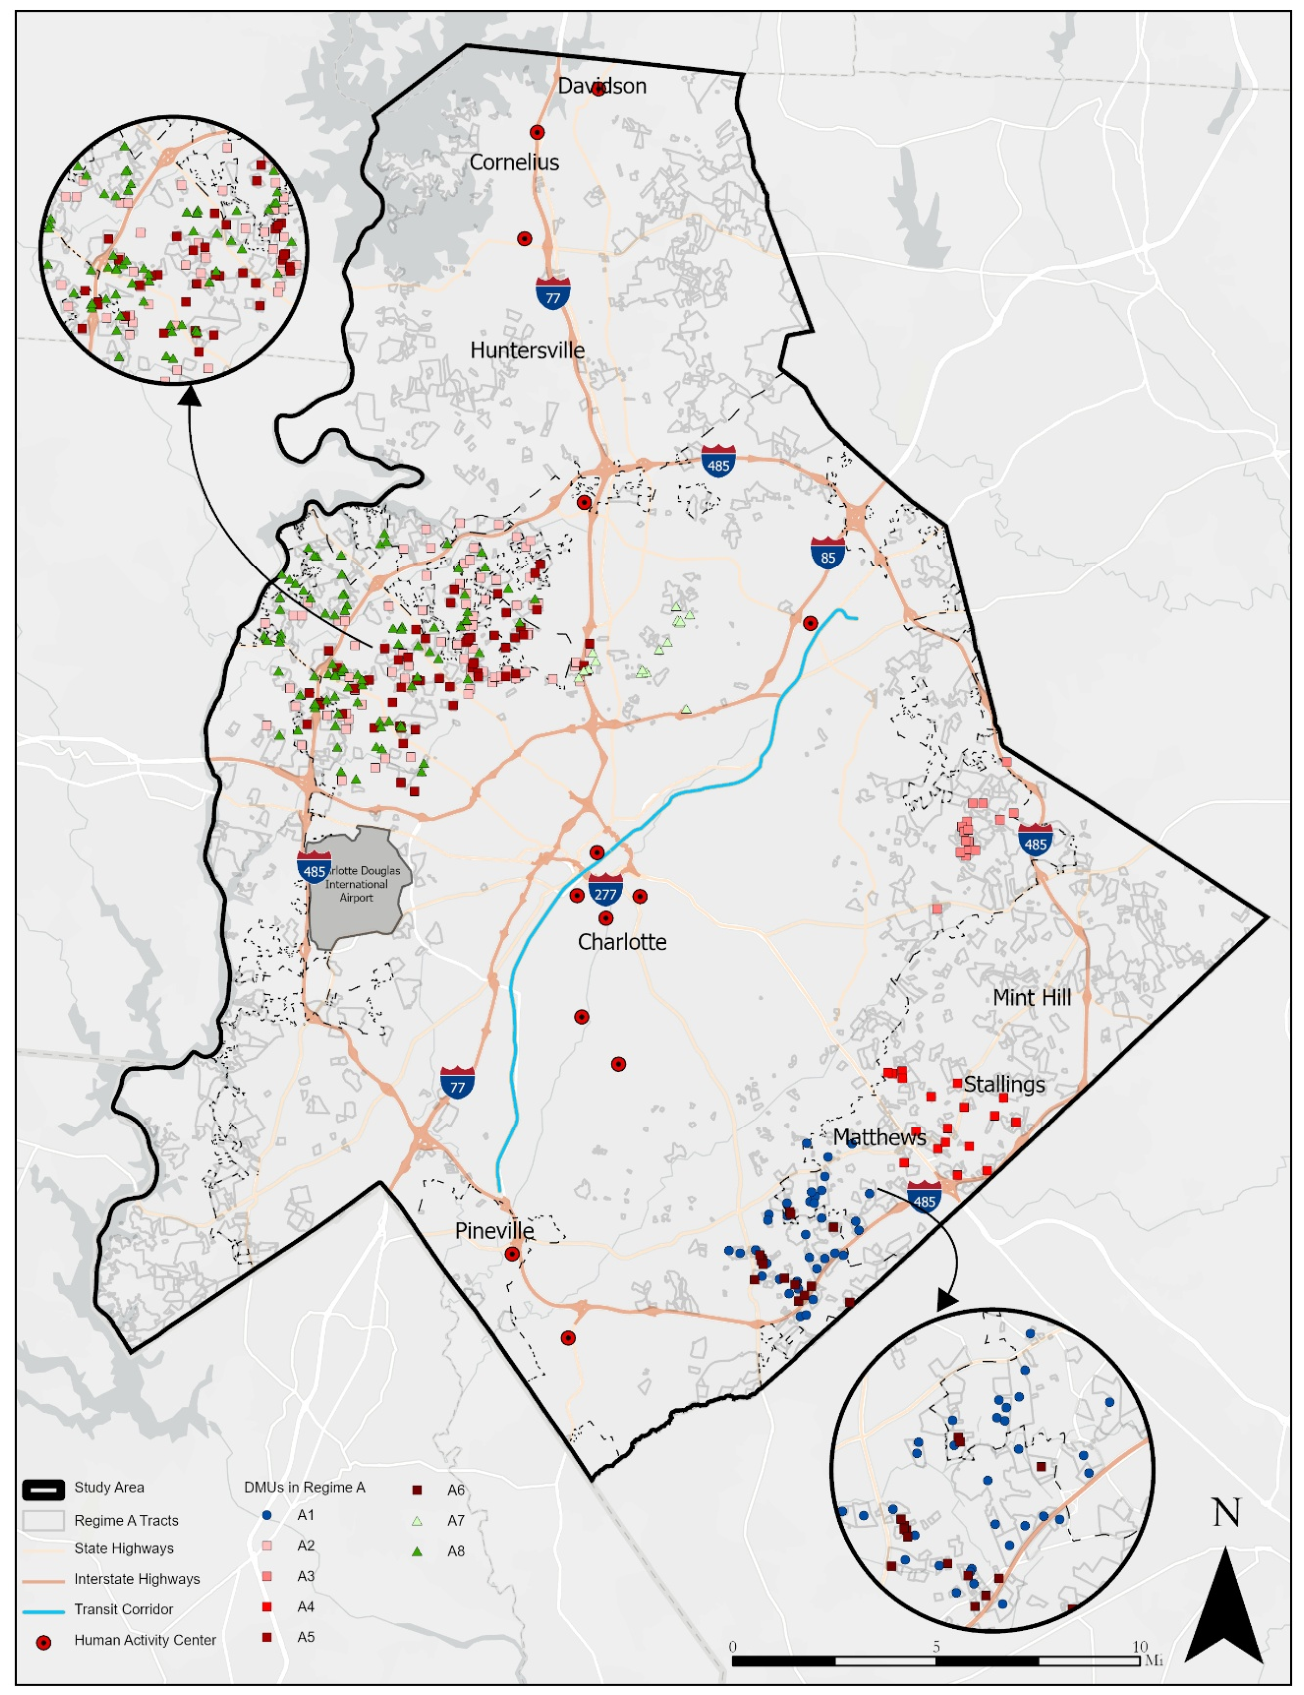
Positioned in the outlying areas of the county, the tracts in Regime A have the lowest sustainability morphology of all five regimes. They are largely situated away from major human activity centers and are identified by low density and compactness, fragmented built form, limited land-use mix, poor accessibility and street network connectivity [7]. The eight DMUs identified in this regime are concentrated within a few peripheral locations. Temporally, six DMUs emerged between 1997 and 2007, whereas the remaining two formed after 2020 (Table 6 and Figure 2). Among the 1,891 tracts assigned to Regime A, only 325 tracts (17%) were incorporated into the eight detected DMUs, representing the lowest clustering ratio among the five regimes. Together, DMU formation in Regime A was confined to selected peripheral locations and concentrated within two distinct development periods.
The majority of DMUs are short-lived and spatially confined, and exhibit small and spatially stable clusters of the tracts. In contrast, the largest DMUs of A2 and A5 are both sustained and intensive, along with representing greater spatial dynamics. A8 also occupied a relatively large spatial footprint, but remained comparatively stable spatially. The most recent units (A7 and A8) formed within existing DMU corridors in the northwest portion of the county and exhibit relatively less pronounced spatial dynamics. Overall, Regime A is characterized primarily by small, short-duration DMUs, with only a few larger units exhibiting greater spatial extent and movement.
Figure 2.
Spatial Distribution of DMUs in Regime A.
Regime B: Localized and Anchored DMU Structure
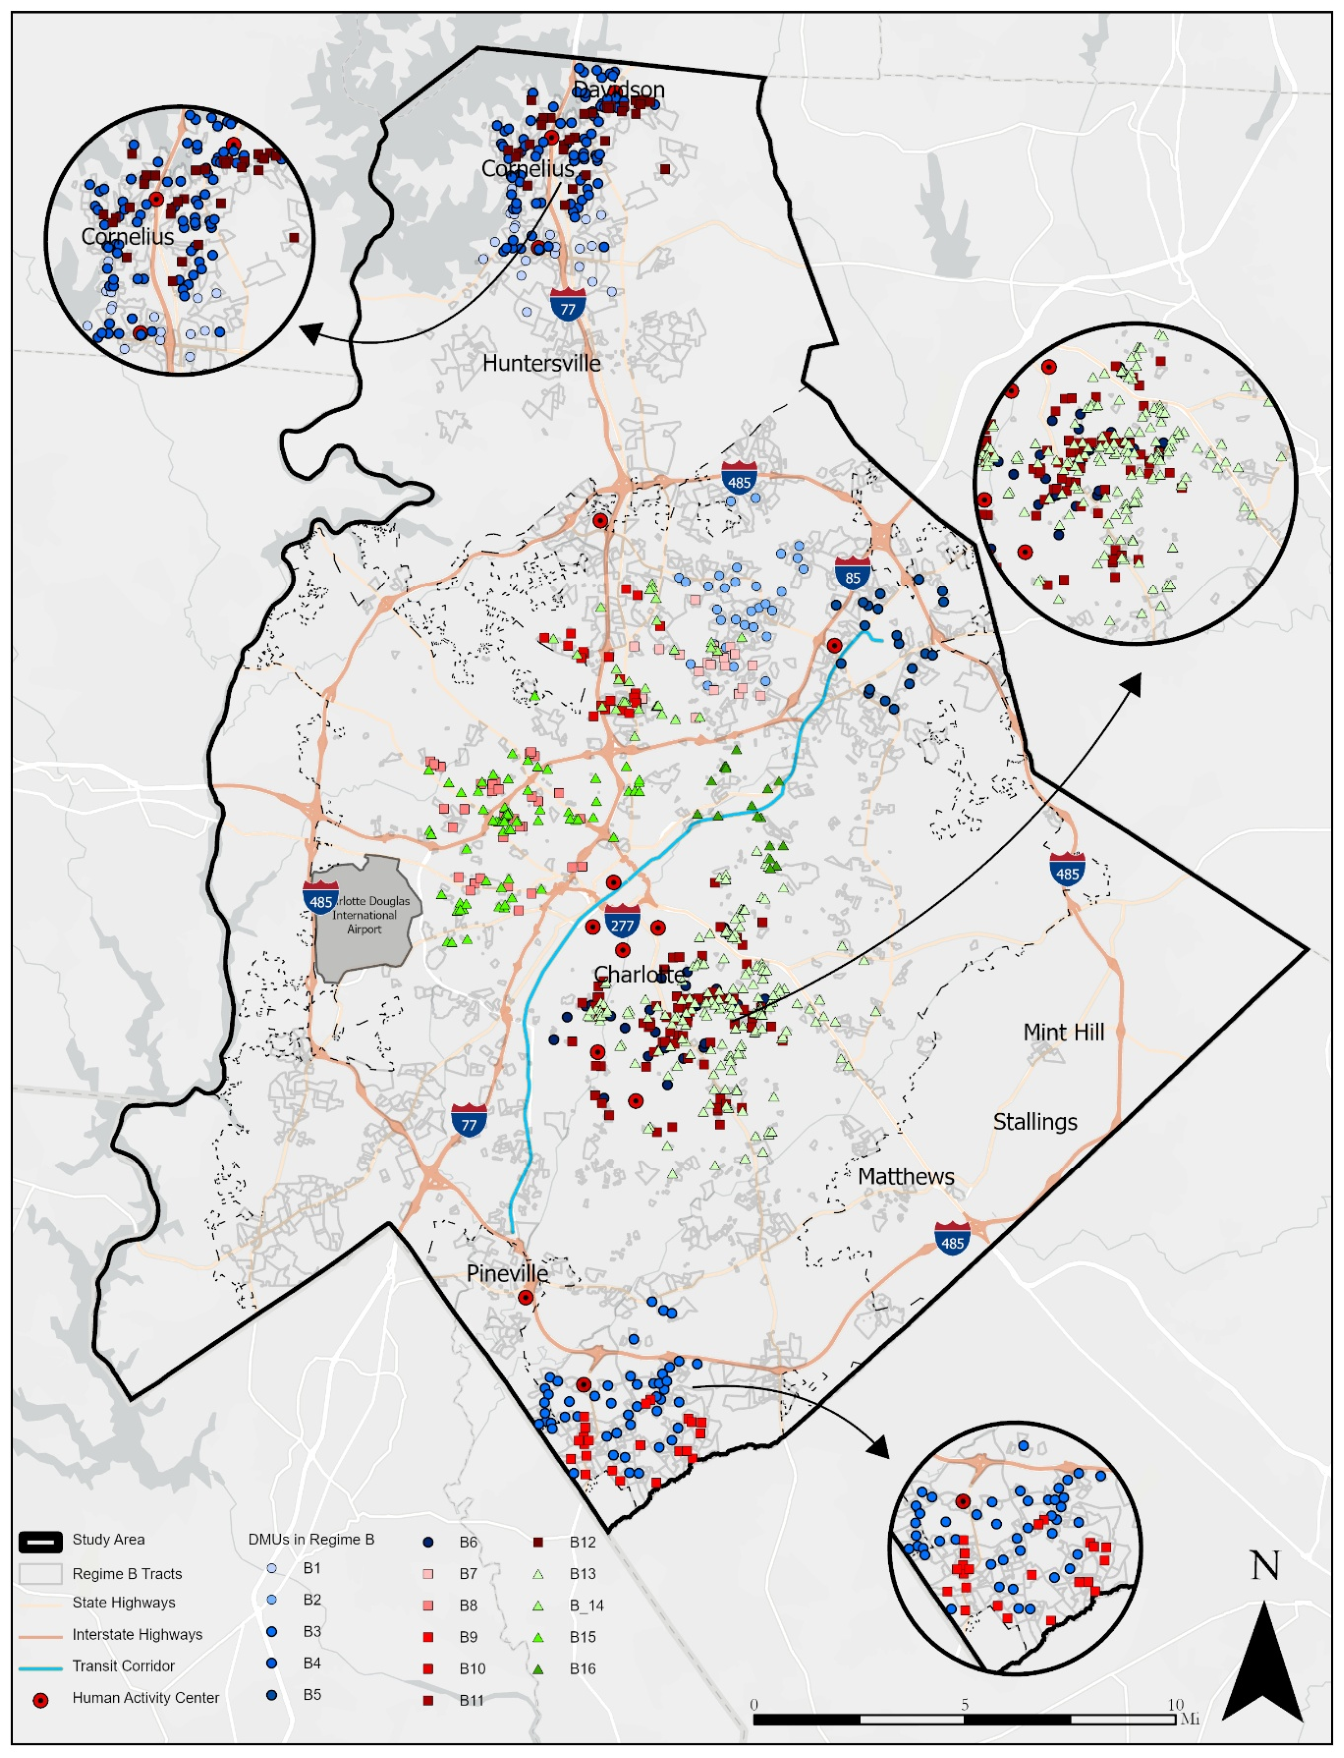
Tracts in Regime B reflect conventional suburban morphology with moderate accessibility and connectivity but relatively low density and land-use diversity [7]. As depicted in Table 7 and Figure 3, ST-DBSCAN identified 16 DMUs, the largest number among the five morphology regimes. Most of these units are episodic, localized, and exhibit limited spatial dynamics. However, B3, B8, and B13 display greater spatial dynamics, indicating greater spatial movement than the remaining DMUs.
Across the county, the identified DMUs in this regime are distributed inside the inner suburban belt encircling the urban core, major activity centers, and parts of the rail transit corridor. Over time, the regime displays a steady increase in DMU size across the study period. Early and mid-term DMUs are generally limited in size, whereas several recent units demonstrate broader spatial footprints. This tendency is mostly evident in B13, the most extensive and enduring DMU within this regime. On the whole, Regime B is characterized by numerous small, localized DMUs and a gradual increase in DMU size during the later years of the study period.
Figure 3.
Spatial Distribution of DMUs in Regime B.
Regime C: Spatially Dynamic and Localized DMUs
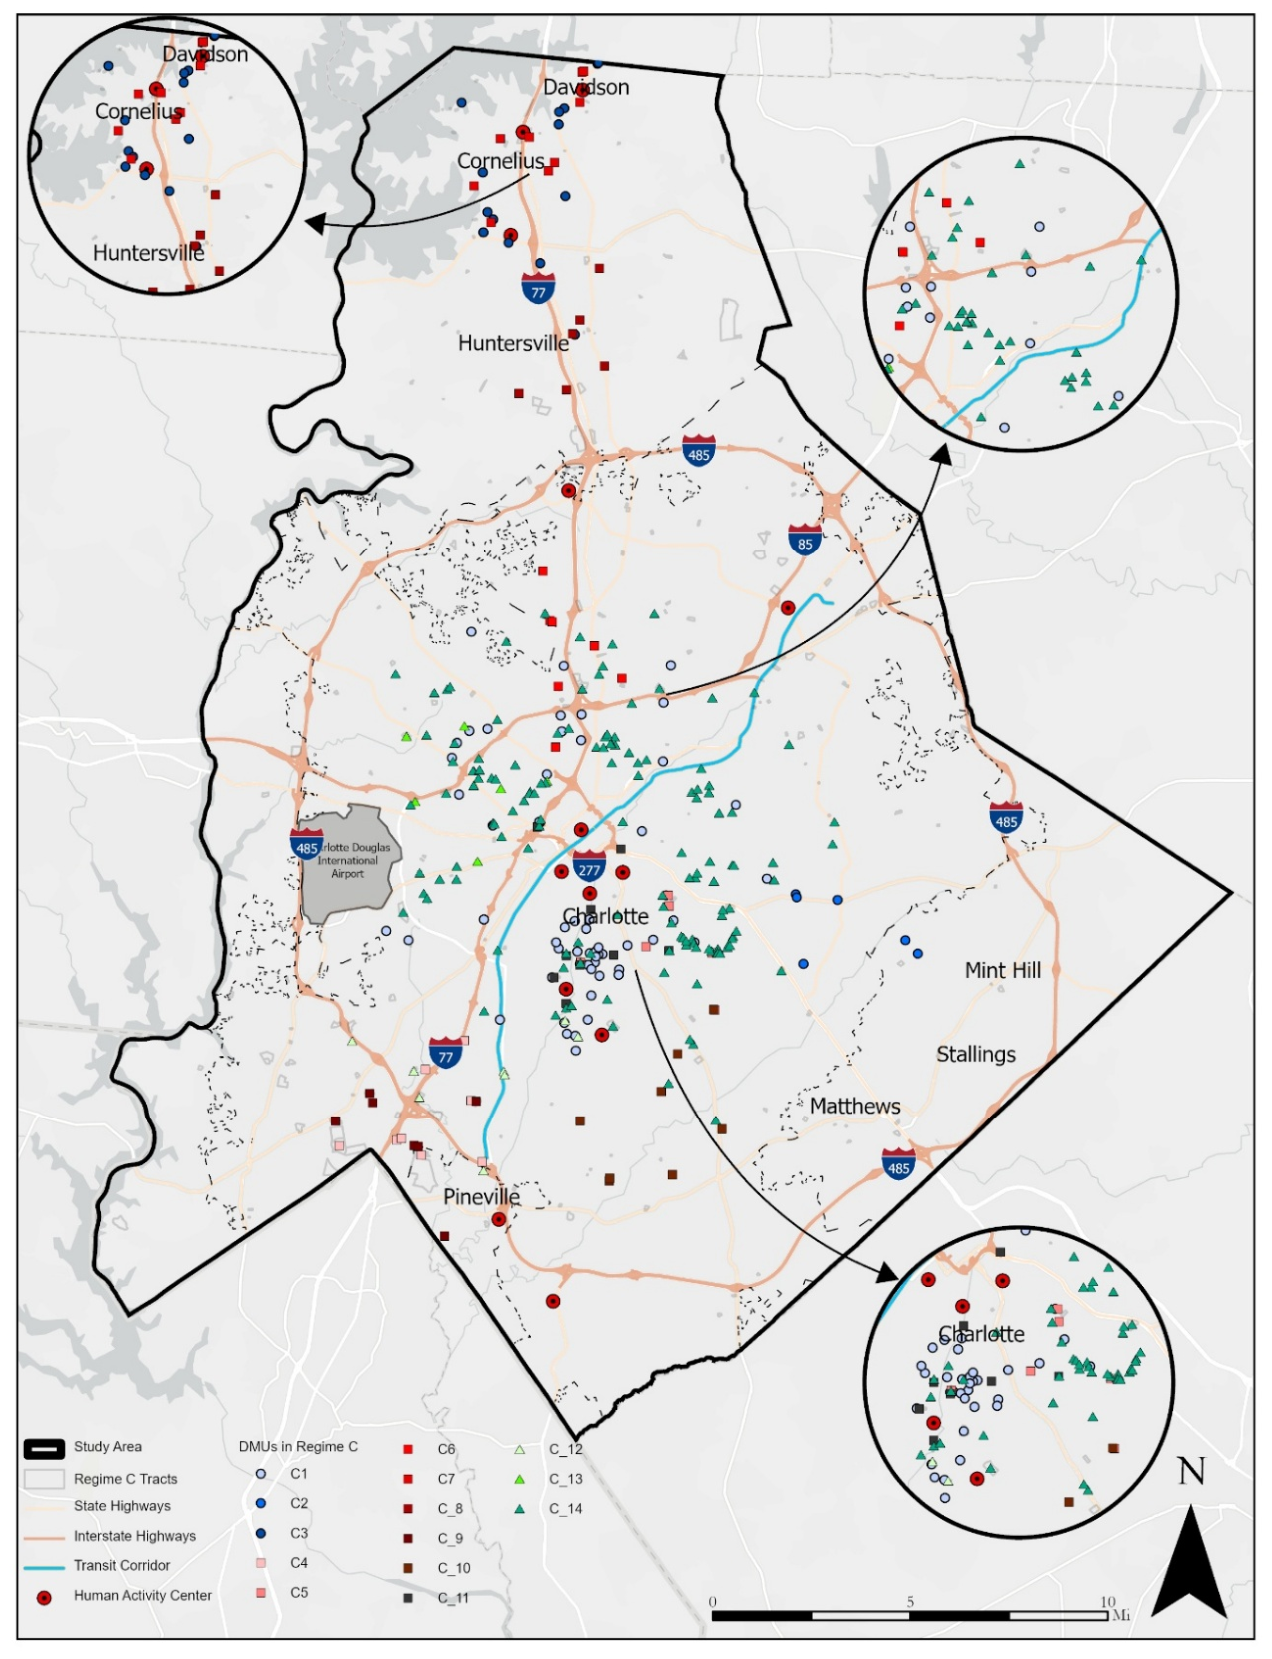
Regime C contains tracts marked by compact and dense urban form, yet has a limited performance in accessibility, connectivity, and land use diversity [7]. As shown in Table 8 and Figure 4, Regime C is dominated by episodic, localized, and stationary DMUs, although several larger and longer-lasting units distinguish its overall pattern. C1 is characterized by an early-forming sustained DMU with a larger geographic footprint and spatial dynamics. C14 emerged as the largest DMU in the regime, demonstrating a long duration, broad spatial footprint, and drifting spatial behavior. Overall, Regime C is marked by a dominant pattern of small, localized DMUs, accompanied by few large-scale, more spatially extensive units.
Figure 4.
Spatial Distribution of DMUs in Regime C.
Regime D: Persistent Corridor-Oriented DMUs
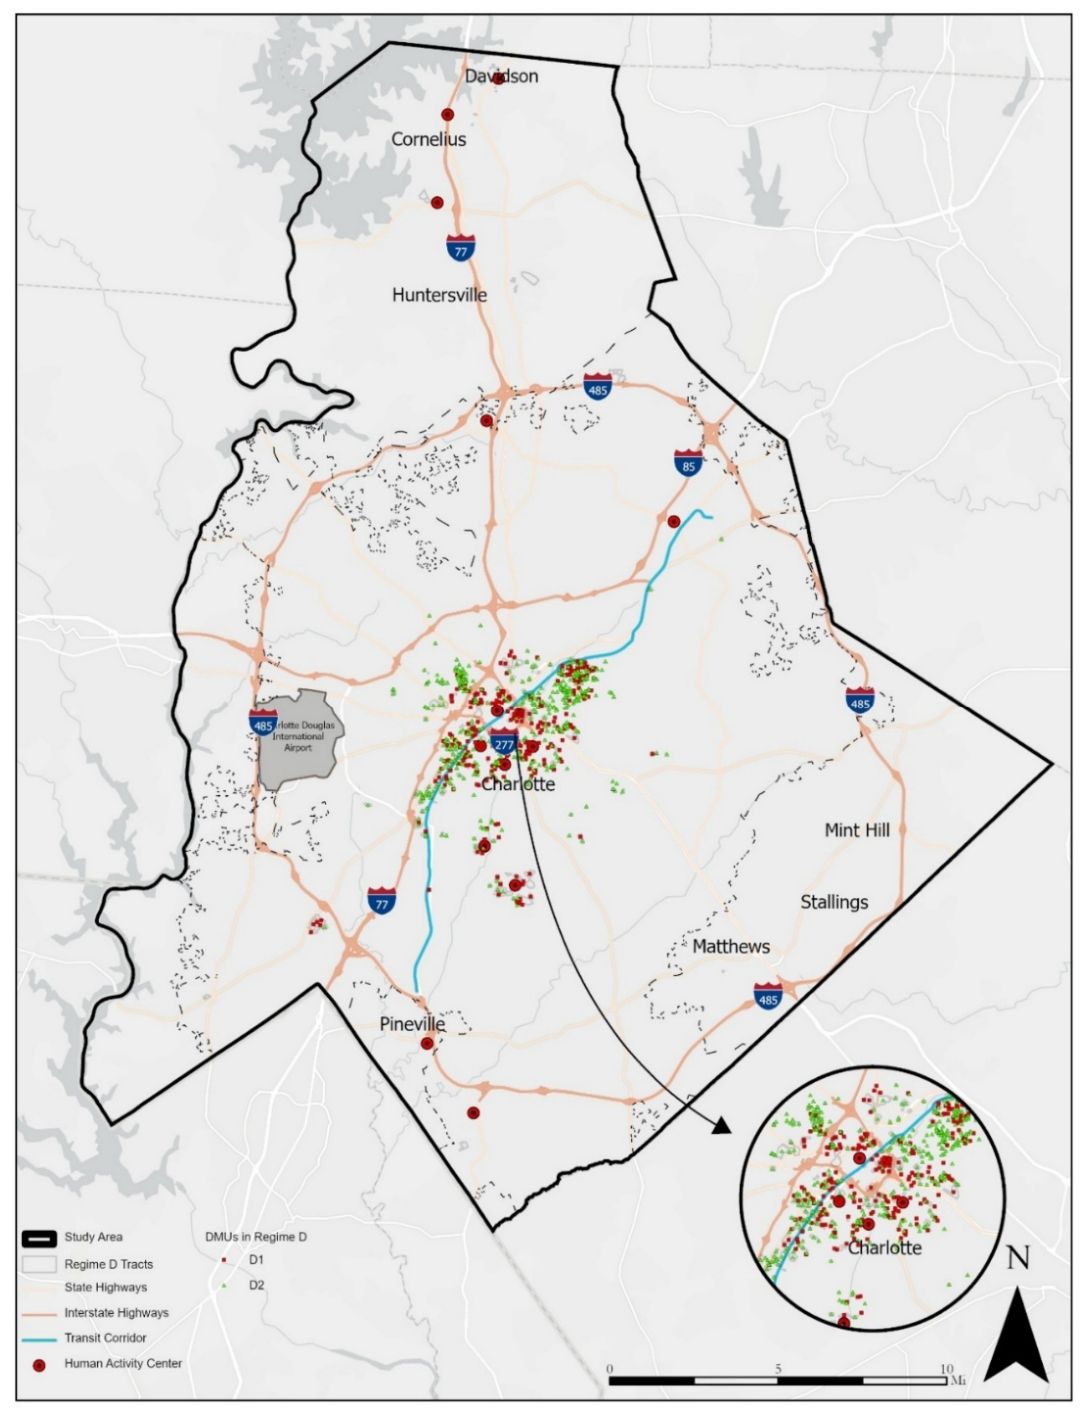
Tracts in Regime D is characterized by well-accessible and strongly connected design, demonstrating corridor-oriented urban form pattern [7]. As depicted in Figure 5 and Table 9, only two DMUs are recognized in Regime D, consistent with the small spatial extent of this regime. Despite their small number, these two DMUs encompass 90% of Regime D tracts, representing the highest clustering ratio among all regimes. Both DMUs exhibit long temporal spans (13 and 14 years, respectively) and minimal spatial dynamics. D1 emerged during the mid-term period as a stationary and intensive unit surrounding the urban core and existing transit corridor. D2 is displayed as a later-period DMU and spanned broader spatial footprints adjacent to the urban core. Overall, Regime D is defined by limited number of large, persistent, and spatially stable DMUs centered around established urban corridors.
Figure 5.
Spatial Distribution of DMUs in Regime D.
Regime E: Spatially Stable Urban-Core DMUs
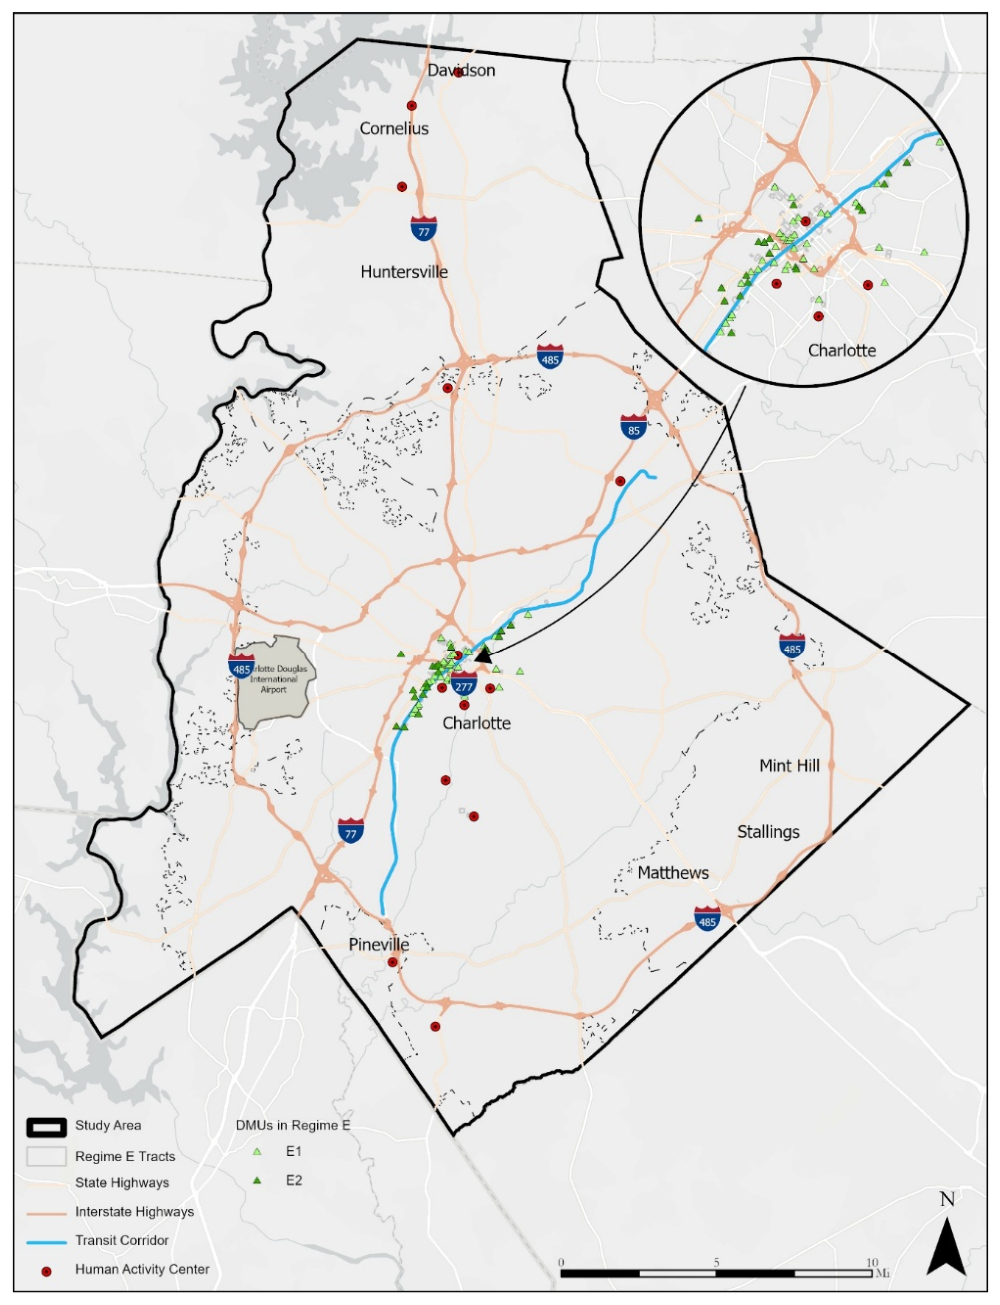
Tracts in Regime E represent the most sustainable morphology across the county. It is defined by dense, compact, mixed-use, accessible, and well-connected urban-core design [7]. Consistently with this spatial setting, the two identified DMUs are concentrated around the urban core and transit corridor and exhibit localized footprints with very limited spatial dynamics (Figure 6 and Table 10). These sites constitute very favorable grounds for sustainable living and practices and attract residents and businesses that are keen on capitalizing on the locational advantages afforded by good spatial accessibility to urban amenities and strong potential for walkability and other modes of non-motorized transport. Both units were fairly recent urban innovations, being at the same time short-lived and spatially stable. Together, the evidence indicates that Regime E is distinguished by recent, small-scale, and geographically stable DMUs located around the existing urban core and transit corridor.
Figure 6.
Spatial Distribution of DMUs in Regime E.
Overall Localized Spatio-Temporal Patterns of Urban Development
The regime-specific implementation of ST-DBSCAN identified meaningful variations in the extent of space-time cluster structure among the five morphology regimes. Regimes A and B demonstrated the lowest clustering coherence, with only 17% and 29% of their tracts classified into DMUs, respectively. Conversely, Regime D revealed the most pronounced cohesion, with 90% of its tracts belonging to only two major DMUs. Regimes C and E exhibited middle levels, with clustered ratios of 60% and 50%, respectively. Thus, the number of identified DMUs did not inherently reflect higher clustering coherence.
The regimes also differed in the temporal persistence of their DMUs. Regimes A, B, C, and E were predominantly characterized by episodic units. Six of the eight DMUs in Regime A, fourteen of the sixteen DMUs in Regime B, twelve of the fourteen DMUs in Regime C, and both DMUs in Regime E were classified as episodic. Although Regimes A, B, and C each contained a small number of sustained units, both DMUs in Regime D persisted for more than a decade. Regime D thus demonstrated the highest persistence over time, by comparison Regime E contained two newly formed and comparatively episodic DMUs notwithstanding constituting the county’s best-performing sustainable morphology.
Clear differences were also evident in the spatial extent and movement of the extracted DMUs. Regimes A and B were mainly characterized by localized and spatially stable units, though each encompassed limited expansive DMUs showing drifting or shifting behavior. Regime C displayed notable underlying variations, made up of multiple localized units with two sustained DMUs, featuring expanded spatial footprints. It also contained a greater concentration of drifting and shifting units than the other regimes. By comparison, both Regime D and Regime E were spatially stable. Yet, the two regimes varied notably in extent and persistence. Regime D contained large and persistent DMUs surrounding the urban core and established corridors, whereas Regime E contained smaller, episodic DMUs concentrated near the urban core and transit corridor.
In summary, the five morphology regimes exhibit considerable differences in clustering cohesion, lifespan, temporal persistence, spatial footprint, and geographic movement. Regimes A and B presented scattered clustering and larges shares of noise patterns, Regime C was characterized by intermediate cohesion with larger spatial variability, and Regime D formed consolidated DMU structure. Regime E displayed a recognizable intermediate-stage pattern in which highly sustainable morphology was spatially concentrated but relatively episodic DMUs. These regime-level variations point to fact that tracts sharing common morphological features may form notably varied spatio-temporal development structures.
Discussion and Conclusions
This study explored whether development tracts characterized by similar sustainability-oriented morphology attributes constitute localized units demonstrating differentiated spatio-temporal characteristics. As the results indicated consistency with the study hypothesis, tracts belonging to common morphology regimes were not observed homogeneously across the urban environment. In contrast, they formed into distinct units that developed variably with regard to their timing, lifespan, spatial footprint, and dynamics. Within each regime, notable differences were observed in these spatio-temporal characteristics, highlighting that morphological similarity across developments does not imply uniformity in their space-time organization. Additionally, notable differences were evident across the regimes as each demonstrated varying balance in allocation of tracts to DMUs and noise. The DMU framework thus highlights a significant layer of within-regime differences captured through spatio-temporal characteristics of growth dynamics.
One notable finding highlights the tendency of development activities to organize into the DMUs. Regimes A and B contain the largest numbers of development tracts but also the highest proportions of noise observations. In ST-DBSCAN, these noises suggest that a large number of tracts did not meet the selected spatial and temporal adjacency requirement to establish localized development units. These large noise ratios reflect that a large share of the development activity linked to these regimes did not occur with the required spatial and temporal adjacency under the clustering threshold defined for each regime. This result reflects a relatively scattered development pattern where common morphological characteristics occur across different areas instead of consistently coalescing into sustained concentrated formations. There noises do not necessarily indicate random processes, but they may result from the spatially scattered or intermittent morphological patterns over time. Therefore, developments with common morphological characteristics may be broadly distributed, while a limited number of them constitutes a coherent pattern across urban areas over time. Conversely, Regime D reflects a reverse pattern as most tracts demonstrated a high level of spatio-temporal organization. This contrasting behavior aligns with diffusion–coalescence perspective, which differentiates scattered stages of urban expansion from the consolidation phases around urban cores [28]. In sum, this evidence suggests that the frequency of a morphology regime and its extent of localized spatio-temporal organization capture two unique properties of growth in urban systems.
The results further reveal the distinction between sustainability-based performance and DMU coherence across the regimes, highlighting another unique property of urban growth. Regime D displays not only high transportation accessibility, but also a coherent localized structure along the urban core and major transportation corridor. This pattern aligns with corridor-oriented growth, in which rail infrastructure shapes transportation and land-use integration progressively [48]. Also, in the context of Mecklenburgh County, it reflects transit-based policies along the major transportation corridor. However, highly sustainable Regime E does not exhibit the same level of organization and contains recent and episodic localized units centered on few established locations in the urban core. This non-linear relationship between sustainability performance and local coherence is not necessarily inconsistent as the SUBM classification evaluates the sustainability-oriented morphological characteristics of individual tracts, while DMU coherence characterizes how spatio-temporally organized tracts evolve. A possible justification for relatively absence of such strong coherence in Regime E is that reproducing such highly sustainable morphological environment involves substantial financial and institutional investment. Promoting coherent localized developments characterized with compact, dense, and diverse land-use, along with highly connective and accessible transportation system in urban areas demands extensive capital investment in buildings, infrastructure, and public spaces [49]. Hence, the degree of localized coherence across morphological patterns in urban areas exhibits a distinctive analytical dimension of sustainable urban morphology that is not fully explained by the sustainability performance of those patterns.
The findings additionally indicate the predominance of low spatial mobility across the DMUs. The majority of DMUs were categorized as stationary, including units found in peripheral, suburban, corridor-oriented, and urban-core environments. This stationarity demonstrates that expansions with common morphological features in the study area largely took place through localized accumulation in proximity to previously developed areas. This pattern is compatible with evolutionary and path-dependence perspectives that view urban areas as adaptive systems in which later-stage growth patterns are shaped by earlier spatial configuration [13,21]. These findings indicate that growth patterns primarily is concentrated around existing urban opportunities, such as accessibility, infrastructure availability, and existing activity centers, instead of producing emerging concentrations of development [50,51]. Nevertheless, sporadic drifting behaviors were observed as well, indicating occasional substantive expansion of localized morphological characteristics, particularly along fringe and intermediate suburban areas.
Conceptually, these findings deepen the explanation of urban growth through representing a multi-layer and multi-scale dynamic. Instead of describing a uniform development trajectory, each morphology regime can be viewed as a series of localized morphological patterns, exhibiting distinct characteristics across space and time. The concurrent occurrences of fragmented peripheral and coherent corridor-based patterns imply heterogenous morphological processes locally, operating simultaneously across metropolitan space. This complexity distinguishes three properties that otherwise be treated as equivalent: sustainability-oriented morphological characteristics, metropolitan prevalence of these unique characteristics, and their degree of localized organization. Consequently, DMUs operationalize the underlying complexity-science perspective of bottom-up urban change by characterizing local morphological patterns.
These findings extend existing urban morphology research in two related ways. First, it uncovers that individual sustainability-oriented morphological regime contains substantial internal spatio-temporal heterogeneity. Tracts may share similar morphological features while differing considerably in forming localized units with distinct spatio-temporal characteristics. Second, the concept of DMU acts as a hierarchical analytics in urban morphology by bridging individual development and broad metropolitan patterns within which developments evolves through nested processes across different scales [52,53]. DMUs identify coherent local patterns that would be obscured in county-wide averages while avoiding the assumption that each development tract represents an independent process. Unlike predefined neighborhoods or administrative districts, DMUs are empirically delineated from the observed spatial and temporal organization of development activity. Thus, from an urban sustainability analytics perspective, DMUs provide a practical tool by decomposing metropolitan-wide morphological sustainability trajectories into localized patterns.
The findings also suggest notable implications for informing sustainable urban planning practices. The high proportions of noise in the widespread regimes suggest that broad occurrence of a morphological design does not necessarily equate to spatially and temporally coordinated development. Instead of merely considering the noises as developments that lie outside the detected DMUs, planners could monitor their frequency and spatial distribution as a signal for the extent of coordination among developments with common morphological features. From a sustainable urban planning perspective, firstly, uncovering such degree of coordination can help highlighting areas where investment, urban policies, and development management strategies should be particularly investigated. For instance, the observed coherence within the corridor-oriented regime suggested the established infrastructure supported coordinating subsequent development. This association should not be viewed as causal, rather, it generates evidence for closer investigations into the role of factors such as transit investment, land-use regulation, infrastructure provision, and development demand within particular regions in urban environments. Secondly, the distinct cross-regime DMU’s chrematistics point to tailored sustainability-oriented interventions. In peripheral Regime A, planning strategies should support aligning infrastructure provision and new developments with existing communities and reducing scattered greenfield growth. Across conventional suburban Regime B, urban policies should promote progressive mixed-use and infill patterns, densification, improved vehicular and pedestrian network connectivity and accessibility. In Regime C with compact and dense patterns, the planning should target adjustment of transit infrastructure, daily services, and a broader land uses mixture with current developments. Coherent Regime D units should be strengthened though further transit-oriented infrastructure and investment. Finally, the highly sustainable but localized and episodic nature of Regime E may call for more project-specific redevelopment interventions involving flexible zoning, infrastructure preparation, public-realm investment, and development financing. The proposed framework in this study can also serve as an applicable decision-support tool. Operationally, DMUs could be routinely updated and embedded into a planning support system that monitors trends in localized morphological patterns. Monitoring these patterns would allow planners to identify emerging development demands, assess whether policy interventions are promoting more organized development trajectory over time, and prioritize resources as needed [54]. Through integrating metropolitan-wide urban form with fine-scale space-time dynamics, the framework enables well-informed planning, monitoring, and evaluation of sustainable urban development.
Several limitations should be acknowledged from this study. First, the findings are based on one metropolitan area, Mecklenburg County, and may be specific to its contextual conditions, such as strong population growth, less constrained urban growth, and local land-use planning policies. These attributes may vary substantially in other metropolitan regions, in turn limiting the immediate generalizability of the findings. For instance, transit corridors tend to foster cohesive coordination of development activity over time. Nonetheless, it remains uncertain whether comparable influence also occurs in other regional contexts. Future research should validate similar DMU patterns in other urban environments with different morphological regimes, historical growth patterns, and planning context to evaluate the transferability of the framework. Second, the representation of DMUs was through four primary spatio-temporal measures. Although these measures offer insight into development activity across space and time, they do not fully reflect a broader set of attributes through which growth dynamics can be manifested. Future research should enhance the framework by including additional characteristics, capturing other aspects of growth behavior. Third, this study emphasized detecting and typologizing DMUs instead of investigating the causal mechanisms responsible for their evolution, which remain unexplored. Hence, future studies should aim at explaining how urban contexts can impact the growth patterns of morphology units.
Author Contributions
Conceptualization, E.K. and J.-C.T.; methodology, E.K. and J.-C.T.; software, E.K.; validation, E.K. and J.-C.T.; formal analysis, E.K.; investigation, E.K.; resources, J.-C.T.; data curation, E.K. and J.-C.T.; writing—original draft preparation, E.K.; writing—review and editing, E.K. and J.-C.T.; visualization, E.K.; supervision, J.-C.T.; project administration, J.-C.T.; funding acquisition, J.-C.T. All authors have read and agreed to the published version of the manuscript.
Funding
This research received no external funding.
Data Availability Statement
Data may be available from the authors.
Conflicts of Interest
The authors declare no conflict of interest.
Appendix A
The KNN distance plots for Regimes A–E provide a visual assessment of local neighborhood structures prior to clustering. Differences in the distribution of nearest-neighbor distances suggest varying degrees of spatial concentration among development tracts, consistent with the diversity of DMU patterns identified across the regimes. These plots served as a diagnostic tool for selecting clustering parameters and evaluating the suitability of the ST-DBSCAN procedure within each regime.
Figure A1.
K-Nearest Neighbor Distance Plot for Regime A.
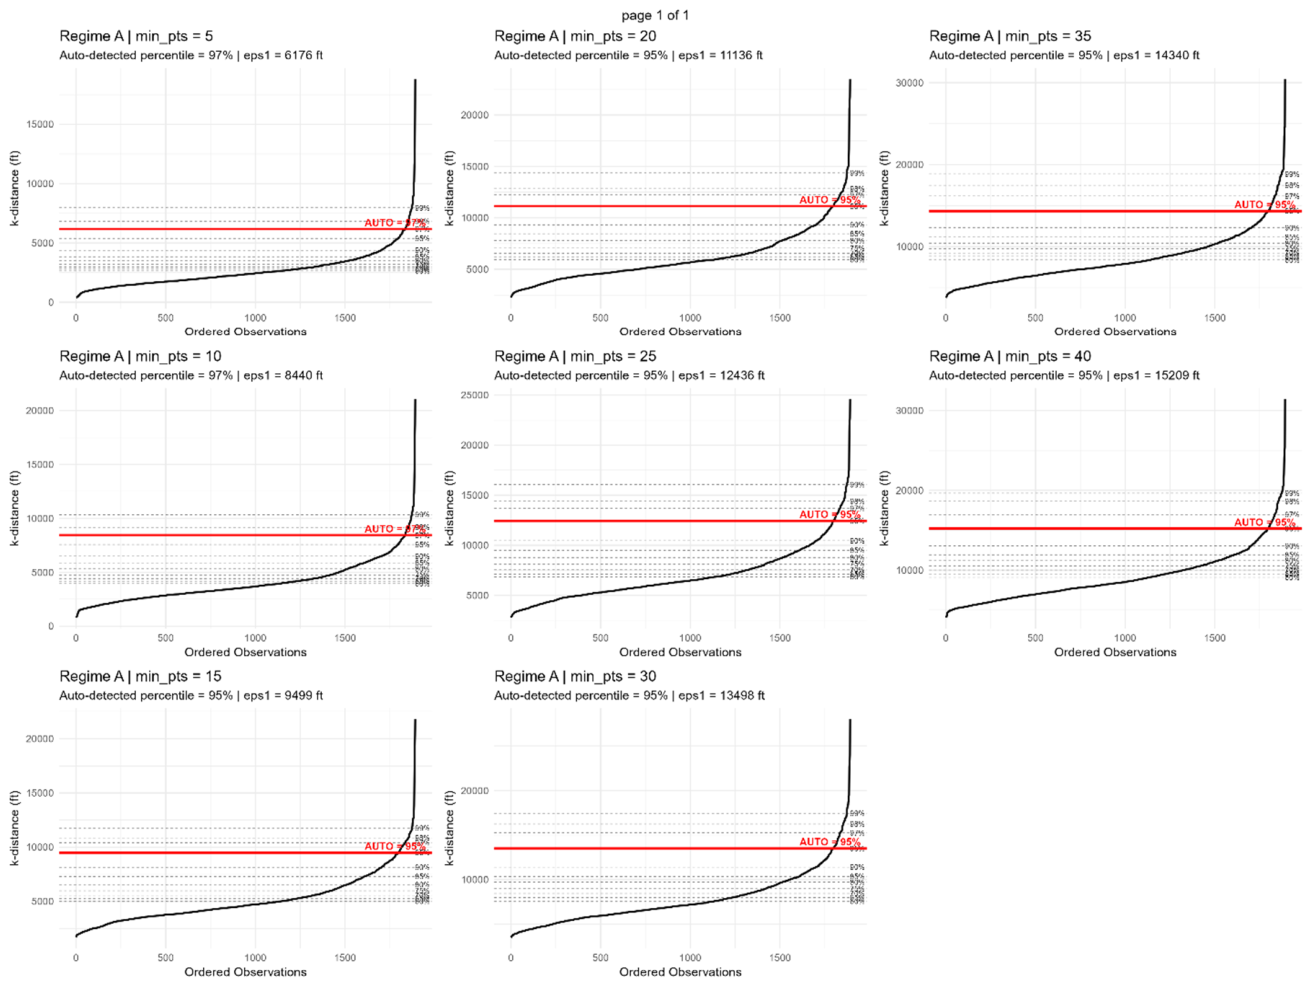
Figure A2.
K-Nearest Neighbor Distance Plot for Regime B.
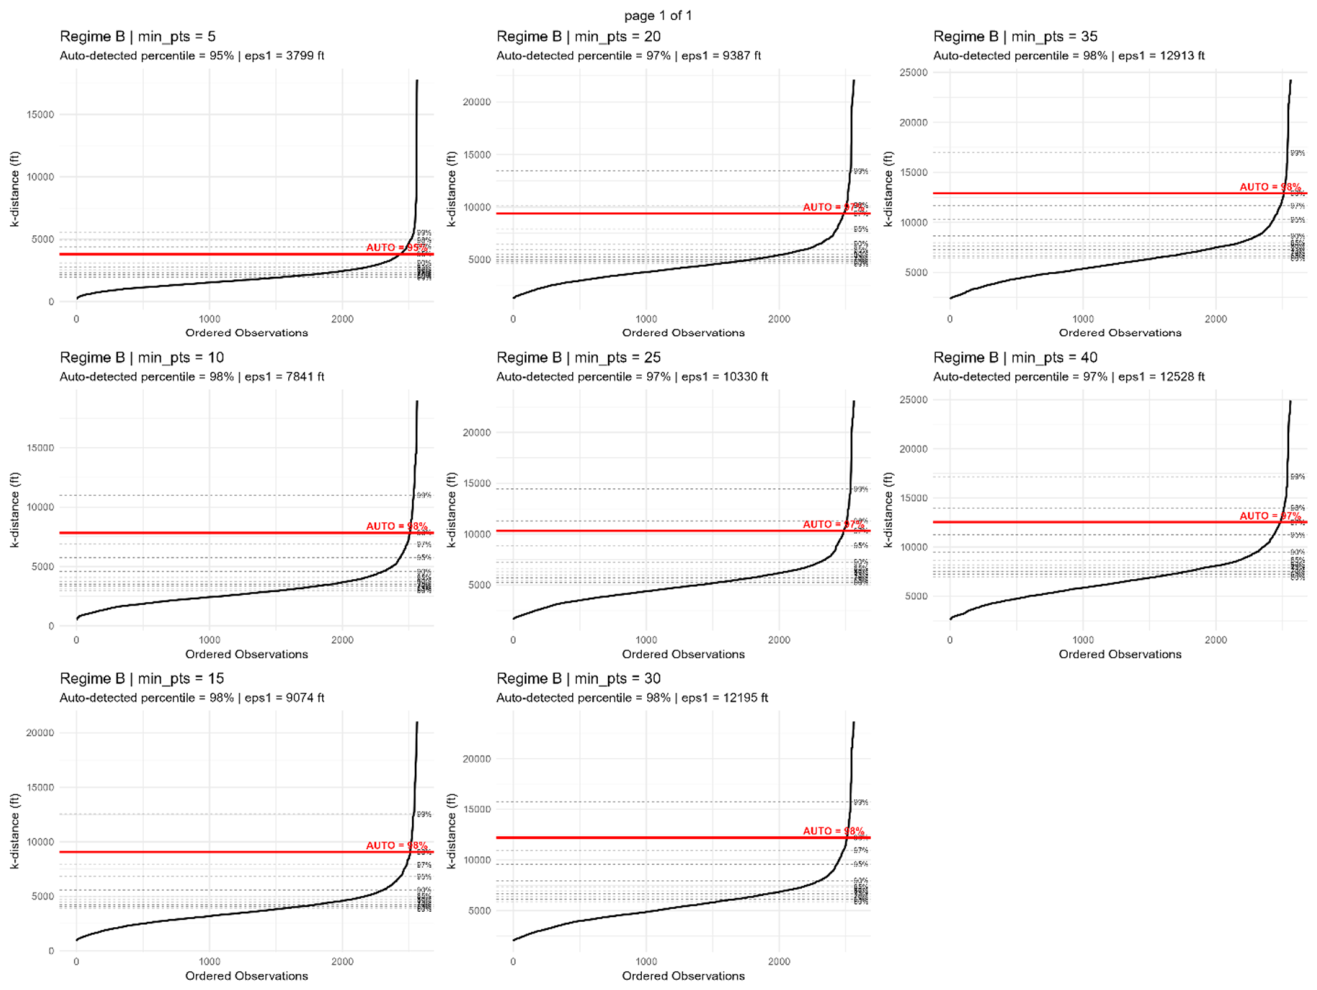
Figure A3.
K-Nearest Neighbor Distance Plot for Regime C.
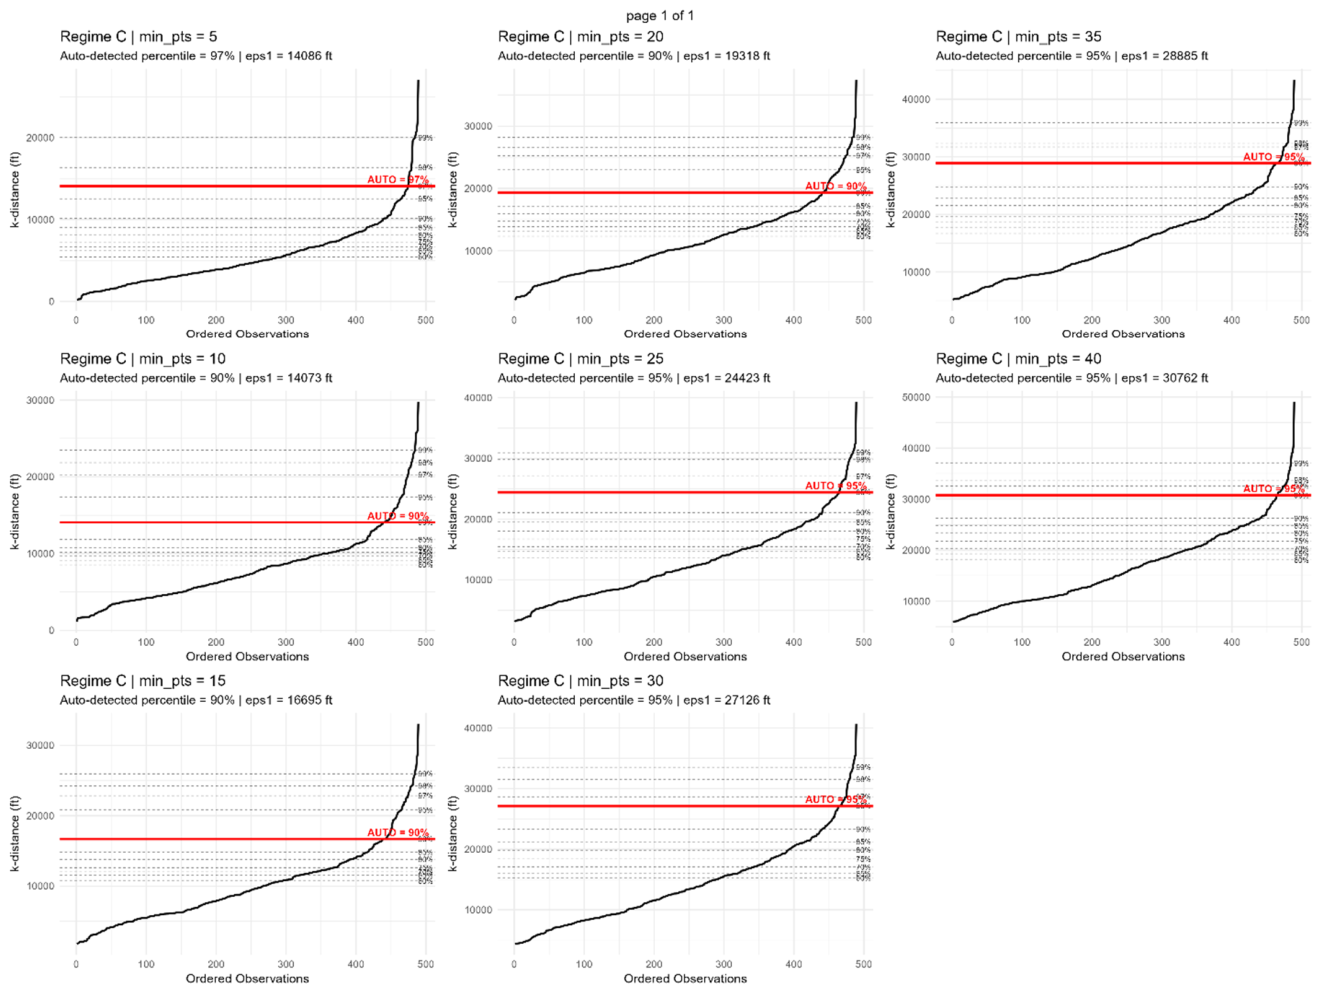
Figure A4.
K-Nearest Neighbor Distance Plot for Regime D.
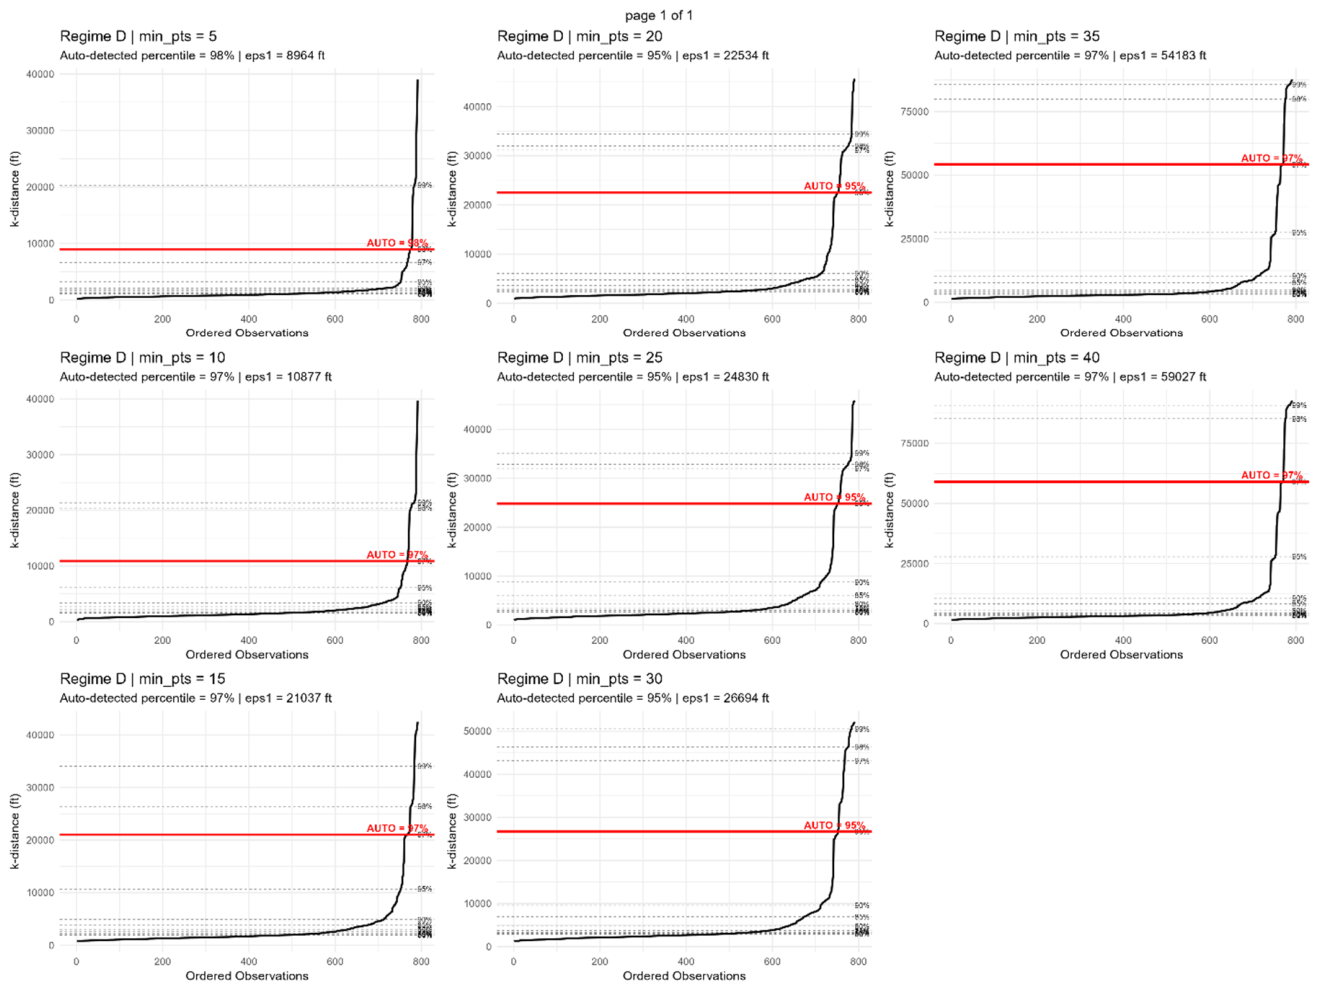
Figure A5.
K-Nearest Neighbor Distance Plot for Regime E.
References
- Ewing, R.; Cervero, R. Travel and the Built Environment: A Meta-Analysis. J. Am. Plan. Assoc. 2010, 76, 265–294. [Google Scholar] [CrossRef]
- Rode, P.; Floater, G.; Thomopoulos, N.; Docherty, J.; Schwinger, P.; Mahendra, A.; Fang, W. Accessibility in Cities: Transport and Urban Form. In Disrupting Mobility; Lecture Notes in Mobility; Meyer, G., Shaheen, S., Eds.; Springer International Publishing: Cham, 2017; pp. 239–273. ISBN 978-3-319-51601-1. [Google Scholar]
- Brueckner, J.K. Urban Sprawl: Diagnosis and Remedies. Int. Reg. Sci. Rev. 2000, 23, 160–171. [Google Scholar] [CrossRef]
- Hamidi, S.; Ewing, R. A Longitudinal Study of Changes in Urban Sprawl between 2000 and 2010 in the United States. Landsc. Urban Plan. 2014, 128, 72–82. [Google Scholar] [CrossRef]
- OECD Rethinking Urban Sprawl: Moving Towards Sustainable Cities. Available online: https://www.oecd.org/en/publications/rethinking-urban-sprawl_9789264189881-en.html (accessed on 27 May 2026).
- Wei, Y.D.; Ewing, R. Urban Expansion, Sprawl and Inequality. Landsc. Urban Plan. 2018, 177, 259–265. [Google Scholar] [CrossRef]
- Author Trends in Sustainable Urban Built Morphology: A US Longitudinal Case Study 2026.
- Zhang, P.; Ghosh, D.; Park, S. Spatial Measures and Methods in Sustainable Urban Morphology: A Systematic Review. Landsc. Urban Plan. 2023, 237, 104776. [Google Scholar] [CrossRef]
- Fleischmann, M.; Feliciotti, A.; Kerr, W. Evolution of Urban Patterns: Urban Morphology as an Open Reproducible Data Science. Geogr. Anal. 2022, 54, 536–558. [Google Scholar] [CrossRef]
- Batty, M. The Creative Destruction of Cities. Env. Plan. B Plan. Des. 2007, 34, 2–5. [Google Scholar] [CrossRef]
- Batty, M. The New Science of Cities; MIT Press: Cambridge, MA, USA, 2013; ISBN 978-0-262-53456-7. [Google Scholar]
- Dietzel, C.; Herold, M.; Hemphill, J.J.; Clarke, K.C. Spatio-temporal Dynamics in California’s Central Valley: Empirical Links to Urban Theory. Int. J. Geogr. Inf. Sci. 2005, 19, 175–195. [Google Scholar] [CrossRef]
- Raimbault, J.; Pumain, D. Spatial Dynamics of Complex Urban Systems within an Evolutionary Theory Frame; 2020. [Google Scholar] [CrossRef]
- Birant, D.; Kut, A. ST-DBSCAN: An Algorithm for Clustering Spatial–Temporal Data. Data Knowl. Eng. 2007, 60, 208–221. [Google Scholar] [CrossRef]
- Hall, P.; Pain, K. The Polycentric Metropolis: Learning from Mega-City Regions in Europe; Routledge: London, 2012; ISBN 978-1-84977-391-1. [Google Scholar]
- Mobaraki, A.; Oktay Vehbi, B. A Conceptual Model for Assessing the Relationship between Urban Morphology and Sustainable Urban Form. Sustainability 2022, 14, 2884. [Google Scholar] [CrossRef]
- Yahia, M.W.; Abdalla, S.B.; Sukkar, A.; Saleem, A.A.; Maksoud, A.M. Towards Better Site Analysis in Architectural and Urban Design: Adapting Experiential Learning Theory in Post-COVID Architectural Teaching Methods. adr 2023, 36, 51–65. [Google Scholar] [CrossRef]
- Kefayat, E.; Thill, J.-C. Urban Street Network Configuration and Property Crime: An Empirical Mul-Tivariate Case Study. Int. J. Geo-Inf. 2025. [Google Scholar] [CrossRef]
- Newman, P.G.; Kenworthy, J.R. CITIES AND AUTOMOBILE DEPENDENCE: AN INTERNATIONAL SOURCEBOOK; 1989; ISBN 978-0-566-07040-2. [Google Scholar]
- OECD Urban Planning and Travel Behaviour: Summary and Conclusions. ITF Roundtable Rep. 2022. [CrossRef]
- Batty, M. Building a Science of Cities. Cities 2012, 29, S9–S16. [Google Scholar] [CrossRef]
- Soja, E.W. Postmetropolis: Critical Studies of Cities and Regions; Wiley-Blackwell: London, 2009; ISBN 978-1-57718-001-2. [Google Scholar]
- Crosato, E.; Prokopenko, M.; Harré, M.S. The Polycentric Dynamics of Melbourne and Sydney: Suburb Attractiveness Divides a City at the Home Ownership Level. Proc. Math. Phys. Eng. Sci. 2021, 477, 20200514. [Google Scholar] [CrossRef] [PubMed]
- Kloosterman, R.C.; Musterd, S. The Polycentric Urban Region: Towards a Research Agenda. Urban Stud. 2001, 38, 623–633. [Google Scholar] [CrossRef]
- Boeing, G. Measuring the Complexity of Urban Form and Design. Urban Des. Int. 2018, 23, 281–292. [Google Scholar] [CrossRef]
- Barthelemy, M. The Structure and Dynamics of Cities: Urban Data Analysis and Theoretical Modeling; Cambridge University Press: Cambridge, 2016; ISBN 978-1-107-10917-9. [Google Scholar]
- Fleischmann, M.; Romice, O.; Porta, S. Measuring Urban Form: Overcoming Terminological Inconsistencies for a Quantitative and Comprehensive Morphologic Analysis of Cities. Environ. Plan. B Urban Anal. City Sci. 2021, 48, 2133–2150. [Google Scholar] [CrossRef]
- Dietzel, C.; Oguz, H.; Hemphill, J.J.; Clarke, K.C.; Gazulis, N. Diffusion and Coalescence of the Houston Metropolitan Area: Evidence Supporting a New Urban Theory. Env. Plan. B Plan. Des. 2005, 32, 231–246. [Google Scholar] [CrossRef]
- Derudder, B.; Meijers, E.; Harrison, J.; Hoyler, M.; Liu, X. Polycentric Urban Regions: Conceptualization, Identification and Implications. Reg. Stud. 2022, 56, 1–6. [Google Scholar] [CrossRef]
- Wang, M. Polycentric Urban Development and Urban Amenities: Evidence from Chinese Cities. Environ. Plan. B Urban Anal. City Sci. 2021, 48, 400–416. [Google Scholar] [CrossRef]
- Zhang, L.; Shu, X.; Luo, J. The Formation of a Polycentric City in Transitional China in a Three-Level Analysis Framework: The Case Study of Hangzhou. Land 2022, 11, 2054. [Google Scholar] [CrossRef]
- Addie, J.-P. On the Road to the In-between City: Excavating Peripheral Urbanisation in Chicago’s “Crosstown Corridor.”. Environ. Plan. A 2015, 48. [Google Scholar] [CrossRef]
- Georg, I.; Blaschke, T.; Taubenböck, H. A Global Inventory of Urban Corridors Based on Perceptions and Night-Time Light Imagery. ISPRS Int. J. Geo-Inf. 2016, 5, 233. [Google Scholar] [CrossRef]
- Whebell, C.F.J. Corridors: A Theory of Urban Systems. Ann. Assoc. Am. Geogr. 1969, 59, 1–26. [Google Scholar] [CrossRef]
- Gui, B.; Bhardwaj, A.; Sam, L. Revealing the Evolution of Spatiotemporal Patterns of Urban Expansion Using Mathematical Modelling and Emerging Hotspot Analysis. J. Env. Manag. 2024, 364, 121477. [Google Scholar] [CrossRef] [PubMed]
- Jing, S.; Yan, Y.; Niu, F.; Song, W. Urban Expansion in China: Spatiotemporal Dynamics and Determinants. Land 2022, 11, 356. [Google Scholar] [CrossRef]
- Su, Y.; Lu, C.; Su, Y.; Wang, Z.; Huang, Y.; Yang, N. Spatio-Temporal Evolution of Urban Expansion Based on a Novel Adjusted Index and GEE: A Case Study of Central Plains Urban Agglomeration, China. Chin. Geogr. Sci. 2023, 33, 736–750. [Google Scholar] [CrossRef]
- Burghardt, K.; Uhl, J.; Lerman, K.; Leyk, S. Road Network Evolution in the Urban and Rural United States Since 1900 2022. [CrossRef] [PubMed]
- NCDHHS NC Vital Statistics 2009. Available online: https://schs.dph.ncdhhs.gov/data/vital/volume1/2009/mecklenburg.html (accessed on 1 April 2025).
- U.S. Census Bureau American Community Survey 5-Year Estimate; U.S. Department of Commerce: Washington, D.C., 2021.
- Delmelle, E.C.; Zhou, Y.; Thill, J.-C. Densification without Growth Management? Evidence from Local Land Development and Housing Trends in Charlotte, North Carolina, USA. Sustainability 2014, 6, 3975–3990. [Google Scholar] [CrossRef]
- Kefayat, E. Tracing Urban Morphology Towards Sustainability Across Space and Time: Evidence From a Rapidly Growing U.S. Metropolitan Region. Ph.D., The University of North Carolina at Charlotte, North Carolina, United States, 2026. [Google Scholar]
- Hartigan, J.A.; Wong, M.A. Algorithm AS 136: A K-Means Clustering Algorithm. J. R. Stat. Soc. Ser. C (Applied Statistics) 1979, 28, 100–108. [Google Scholar] [CrossRef]
- Fang, C.; Zhou, L.; Gu, X.; Liu, X.; Werner, M. A Data Driven Approach to Urban Area Delineation Using Multi Source Geospatial Data. Sci. Rep. 2025, 15, 8708. [Google Scholar] [CrossRef] [PubMed]
- Lv, Y.; Yang, J.; Xu, J.; Guan, X.; Zhang, J. High-Dimensional Urban Dynamic Patterns Perception under the Perspective of Human Activity Semantics and Spatiotemporal Coupling. Sustain. Cities Soc. 2025, 121, 106192. [Google Scholar] [CrossRef]
- Mai, G.; Janowicz, K.; Hu, Y.; Gao, S. ADCN: An Anisotropic Density-Based Clustering Algorithm for Discovering Spatial Point Patterns with Noise. Trans. GIS 2018, 22, 348–369. [Google Scholar] [CrossRef]
- Le Doeuff, A. Stdbscan: Spatio-Temporal DBSCAN Clustering 2026. [CrossRef]
- Chorus, P.; Bertolini, L. Developing Transit-Oriented Corridors: Insights from Tokyo. Int. J. Sustain. Transp. 2016, 10, 86–95. [Google Scholar] [CrossRef]
- Mathur, S.; Gatdula, A. Review of Planning, Land Use, and Zoning Barriers to the Construction of Transit-Oriented Developments in the United States. Case Stud. Transp. Policy 2023, 12, 100988. [Google Scholar] [CrossRef]
- Kasraian, D.; Raghav, S.; Miller, E.J. A Multi-Decade Longitudinal Analysis of Transportation and Land Use Co-Evolution in the Greater Toronto-Hamilton Area. J. Transp. Geogr. 2020, 84. [Google Scholar] [CrossRef]
- Gallagher, R.; Sigler, T.; Liu, Y. How Path Dependent Urban Morphology Restricts the Effectiveness of Rezoning for Urban Consolidation: Lessons from Brisbane, Australia. J. Urban Aff. 2025, 47, 1208–1228. [Google Scholar] [CrossRef]
- Kropf, K. The Handbook of Urban Morphology; John Wiley & Sons, 2018; ISBN 978-1-118-74769-8. [Google Scholar]
- Wu, C.; Wang, J.; Wang, M.; Biljecki, F.; Kraak, M.-J. Formalising the Urban Pattern Language: A Morphological Paradigm towards Understanding the Multi-Scalar Spatial Structure of Cities. Cities 2025, 161, 105854. [Google Scholar] [CrossRef]
- Gao, S.; Morgan, A.; Ryan, B.D. How Plan Monitoring Improves Plan Implementation: A Longitudinal Evaluation of the Neighborhood Planning Process. J. Plan. Educ. Res. 2025, 45, 330–350. [Google Scholar] [CrossRef]

Table 1.
Constituent Measures of the SUBM Framework (After [7]).
Table 1.
Constituent Measures of the SUBM Framework (After [7]).
| Dimension | Measure | Sustainability Interpretation |
| Built-up Tissue Configuration | Tract Compactness (TC) | Spatial compactness and cohesion of built-up structures |
| Contextual Density (CD)` | Density of the surrounding built environment | |
| Tract Density (TD) | Intensity of built-up land within the tract | |
| Building Density (BD) | Vertical development intensity | |
| Land Use | Land-use Diversity (LUD) | Functional diversity of land uses |
| Transportation & Accessibility | Network Density (ND) | Density of street intersections |
| Network Connectivity (NC) | Connectivity of the street network | |
| Spatial Centrality (SC) | Proximity to major activity centers | |
| Access to Public Transit (APT) | Accessibility to transit services | |
| Access to Urban Opportunities (AUO) | Accessibility to essential urban amenities |
Table 2.
Optimal ST-DBSCAN parameters for each regime.
| Regime | Spatial Proximity (ε1) (ft) | Temporal Proximity (ε2) (year) | MinPts |
| A | 9,499 | 1 | 15 |
| B | 9,387 | 1 | 20 |
| C | 14,086 | 1 | 5 |
| D | 26,694 | 1 | 30 |
| E | 15,188 | 1 | 20 |
Table 3.
Spatio-temporal characterization of DMUs.
| Dimension | Sub-Dimension | Variable | Interpretation |
| Temporal Characteristics |
Temporal Position | Median Development Year | Median development year of all tracts within the DMU. Represents the temporal center of development activity. |
| Temporal Persistence | Temporal Span | Duration of tract activity, calculated as the difference between the first and last active year. | |
| Spatial Characteristics |
Spatial Extent | Spatial Footprint | Area of the convex hull encompassing all tracts in the DMU in square miles. |
| Spatial Mobility | Spatial Dynamics | Euclidean distance between the first and last yearly centroids of the yearly DMU in miles. |
Table 4.
Interpretive classification framework for DMU.
| Variable | Class 1 | Class 2 | Class 3 |
| Temporal Position | 1990–2000 (Early) | 2001–2011 (Mid-term) | 2012–2023 (Recent) |
| Temporal Span | 2–6 (Episodic) | 7–11 (Sustained) | 12< (Persistent) |
| Spatial Footprint | 0–24 (Localized) | 24–68 (Intensive) | 68< (Extensive) |
| Spatial Mobility | 0–1.7 (Stationary) | 1.7–3.8 (Drifting) | 3.8< (Shifting) |
Table 5.
Summary of DMUs and Noise Observations by Morphology Regime.
| Regime | DMU Count | Total Tracts | Clustered Tracts | Noise Tracts | Clustered Ratio | Noise Ratio |
| A | 8 | 1891 | 325 | 1566 | 0.17 | 0.83 |
| B | 16 | 2561 | 737 | 1824 | 0.29 | 0.71 |
| C | 14 | 489 | 292 | 197 | 0.60 | 0.40 |
| D | 2 | 791 | 709 | 82 | 0.90 | 0.10 |
| E | 2 | 112 | 56 | 56 | 0.50 | 0.50 |
Table 6.
Spatio-temporal characterization of DMUs in Regime A.
| DMU | Temporal Position | Temporal Span | Spatial Footprint | Spatial Dynamics | Interpretation |
| A1 | 1997 | 6 | 10.0 | 0.8 | Early, Episodic, Localized, and Stationary |
| A2 | 2000 | 7 | 37.4 | 3.8 | Early, Sustained, Intensive, and Drifting |
| A3 | 2002 | 3 | 2.9 | 0.2 | Mid-term, Episodic, Localized, and Stationary |
| A4 | 2003 | 3 | 6.6 | 0.8 | Mid-term, Episodic, Localized, and Stationary |
| A5 | 2005 | 7 | 24.3 | 5.5 | Mid-term, Sustained, Intensive, and Shifting |
| A6 | 2007 | 3 | 4.2 | 1.1 | Mid-term, Episodic, Localized, and Stationary |
| A7 | 2020 | 4 | 4.4 | 1.0 | Recent, Episodic, Localized, and Stationary |
| A8 | 2021 | 6 | 30.3 | 1.7 | Recent, Episodic, Intensive, and Drifting |
Table 7.
Spatio-temporal characterization of DMUs in Regime B.
| DMU | Temporal Position | Temporal Span | Spatial Footprint | Spatial Dynamics | Interpretation |
| B1 | 1994 | 3 | 8.33 | 0.50 | Early, Episodic, Localized, and Stationary |
| B2 | 1996 | 4 | 11.07 | 0.79 | Early, Episodic, Localized, and Stationary |
| B3 | 1997 | 5 | 12.38 | 1.99 | Early, Episodic, Localized, and Drifting |
| B4 | 1999 | 8 | 14.09 | 1.20 | Early, Sustained, Localized, and Stationary |
| B5 | 1999 | 3 | 6.60 | 0.27 | Early, Episodic, Localized, and Stationary |
| B6 | 1999 | 3 | 11.58 | 0.39 | Early, Episodic, Localized, and Stationary |
| B7 | 2000 | 3 | 6.81 | 0.44 | Early, Episodic, Localized, and Stationary |
| B8 | 2003 | 4 | 10.53 | 2.07 | Mid-term, Episodic, Localized, and Drifting |
| B9 | 2003 | 3 | 6.17 | 0.34 | Mid-term, Episodic, Localized, and Stationary |
| B10 | 2004 | 3 | 6.59 | 0.40 | Mid-term, Episodic, Localized, and Stationary |
| B11 | 2007 | 6 | 20.53 | 1.33 | Mid-term, Episodic, Localized, and Stationary |
| B12 | 2007 | 4 | 8.39 | 1.20 | Mid-term, Episodic, Localized, and Stationary |
| B13 | 2018 | 11 | 33.25 | 1.70 | Recent, Sustained, Intensive, and Drifting |
| B14 | 2019 | 3 | 10.33 | 0.73 | Recent, Episodic, Localized, and Stationary |
| B15 | 2021 | 5 | 18.71 | 0.99 | Recent, Episodic, Localized, and Stationary |
| B16 | 2021 | 3 | 3.98 | 0.38 | Recent, Episodic, Localized, and Stationary |
Table 8.
Spatio-temporal characterization of DMUs in Regime C.
| DMU | Temporal Position | Temporal Span | Spatial Footprint | Spatial Dynamics | Interpretation |
| C1 | 1999 | 9 | 67.62 | 5.54 | Early, Sustained, Intensive, and Shifting |
| C2 | 1996 | 3 | 3.74 | 1.96 | Early, Episodic, Localized, and Drifting |
| C3 | 1999 | 5 | 15.40 | 2.30 | Early, Episodic, Localized, and Drifting |
| C4 | 2001 | 4 | 6.68 | 2.03 | Mid-term, Episodic, Localized, and Drifting |
| C5 | 2005 | 3 | 5.13 | 1.42 | Mid-term, Episodic, Localized, and Stationary |
| C6 | 2005 | 3 | 4.41 | 0.78 | Mid-term, Episodic, Localized, and Stationary |
| C7 | 2006 | 4 | 4.47 | 0.87 | Mid-term, Episodic, Localized, and Stationary |
| C8 | 2006 | 4 | 3.52 | 1.21 | Mid-term, Episodic, Localized, and Stationary |
| C9 | 2006 | 3 | 8.10 | 0.36 | Mid-term, Episodic, Localized, and Stationary |
| C10 | 2007 | 3 | 9.24 | 1.37 | Mid-term, Episodic, Localized, and Stationary |
| C11 | 2008 | 4 | 9.60 | 3.30 | Mid-term, Episodic, Localized, and Drifting |
| C12 | 2013 | 4 | 11.50 | 4.14 | Recent, Episodic, Localized, and Shifting |
| C13 | 2012 | 3 | 7.59 | 3.07 | Recent, Episodic, Localized, and Drifting |
| C14 | 2018 | 11 | 103.41 | 2.62 | Recent, Sustained, Extensive, and Drifting |
Table 9.
Spatio-temporal characterization of DMUs in Regime D.
| DMU | Temporal Position | Temporal Span | Spatial Footprint | Spatial Dynamics | Interpretation |
| D1 | 2004 | 14 | 48.49 | 0.20 | Mid-term, Persistent, Intensive, and Stationary |
| D2 | 2017 | 13 | 79.73 | 1.45 | Recent, Persistent, Extensive, and Stationary |
Table 10.
Spatio-temporal characterization of DMUs in Regime E.
| DMU | Temporal Position | Temporal Span | Spatial Footprint | Spatial Dynamics | Interpretation |
| E1 | 2017 | 5 | 7.03 | 0.56 | Recent, Episodic, Localized, and Stationary |
| E2 | 2021 | 3 | 5.19 | 0.77 | Recent, Episodic, Localized, and Stationary |
Disclaimer/Publisher’s Note: The statements, opinions and data contained in all publications are solely those of the individual author(s) and contributor(s) and not of MDPI and/or the editor(s). MDPI and/or the editor(s) disclaim responsibility for any injury to people or property resulting from any ideas, methods, instructions or products referred to in the content. |
© 2026 by the authors. Licensee MDPI, Basel, Switzerland. This article is an open access article distributed under the terms and conditions of the Creative Commons Attribution (CC BY) license.
Copyright: This open access article is published under a Creative Commons CC BY 4.0 license, which permit the free download, distribution, and reuse, provided that the author and preprint are cited in any reuse.