
Submitted:
06 August 2026
Posted:
06 August 2026
You are already at the latest version
Abstract
Punishment serves as a critical governance tool for curbing free-riding in public goods provision, but its efficacy depends on the combined effects of detection probability and punishment severity. Most existing studies have examined these two dimensions in isolation, and few have distinguished between the ex ante deterrent effect and the ex post punitive effect. This study employs a repeated public goods experiment, consisting of a no-punishment baseline and three treatment groups with identical expected punishment but different schemes: low detection probability with high fines, medium detection probability with medium fines, and high detection probability with low fines. We examine how punishment schemes affect individual cooperative behavior. The results show that all three punishment designs significantly increase cooperation. Under fixed expected punishment, heterogeneous governance effects emerge across different probability-severity combinations; the medium-probability and medium-severity scheme generates the strongest cooperative incentives. Moreover, punishment promotes cooperation primarily through ex ante deterrence rather than ex post actual punishment. These findings depart from the predictions of traditional expected value theory and provide experimental evidence for understanding the differentiated governance effects of alternative punishment schemes.
Keywords:
public goods game
; punishment probability
; punishment severity
; deterrence effect
; experimental economics
1. Introduction
Social cooperation dilemmas, typified by free riding in public goods settings, have long a key topic in the fields of economics, management, and social governance(Alsobay et al., 2026; Otten et al., 2024). In the absence of binding institutional arrangements, self-interested individuals tend to reduce their contributions to collective projects, harming overall welfare and ultimately undermining the cooperative order. Such behavior is widespread in practice, including shirking and buck-passing in corporate teams, tax evasion, the overuse of public resources, and failures of social trust(Earnhart & Friesen, 2023). As cooperation declines, organizations increasingly rely on punishment mechanisms to provide institutional support for cooperation(Fu et al., 2022; Yu et al., 2023). By raising the expected cost of violations, punishment induces individuals to follow rules and continue contributing resources, thereby mitigating the inefficiency of spontaneous cooperation(Posten et al., 2025; Zhao et al., 2024).
A large body of research shows that both informal sanctions and formal legal penalties can constrain free riding and sustain collective cooperation(Fehr & Gächter, 2000; Kamei, 2024). Their key enforcement mechanism is to alter individual incentives by increasing the expected cost of noncooperation, thereby making cooperation the more rational and behaviorally advantageous strategy(Xiao et al., 2023). The effectiveness of punishment is not universal, however, and depends strongly on two dimensions: the probability that a violation will be detected, or certainty, and the severity of the resulting punishment(Alam & Rai, 2025; Molenmaker et al., 2023). Their product is the total expected punishment for a violation, which is also the dominant framework used to explain the incentive effect of punishment. Most existing studies nevertheless examine detection probability or punishment severity separately, often reaching inconsistent or even contradictory conclusions and leaving unclear which dimension is more important for behavioral change(Friesen, 2012; Menegatti, 2023).
Although prior studies confirm that punishment can increase willingness to cooperate, research on its two main components, probability and severity, remains fragmented. Some scholars argue that a higher probability of detection has a stronger inhibitory effect(Earnhart & Friesen, 2023; Teodorescu et al., 2021), whereas others find that individuals are more sensitive to punishment severity(Friesen, 2012; Nixon & Barnes, 2019). Several meta-analyses further indicate that the effect of punishment severity on cooperation is unstable(Alm & Malézieux, 2021; Noussair et al., 2024). From the perspective of experimental economics, few studies have systematically compared behavioral responses to different probability-severity combinations while holding total expected punishment constant(Alam & Rai, 2025; Almeida, 2023). The limited experimental work that considers both dimensions has also failed to distinguish clearly between the two channels through which punishment may create incentives: the ex ante warning generated by a potential punishment and the ex post behavioral adjustment following an actual punishment(Earnhart & Friesen, 2023; Krügel & Maaser, 2025; Mungan, 2017).
For example, studies of law enforcement, tax compliance, risk choice, and organizational sanctions often find that the certainty of detection matters(Bun et al., 2020; Earnhart & Friesen, 2023), whereas other studies identify a substantive effect of punishment severity(Alm & Malézieux, 2021; Kasper & Rablen, 2023). These findings are difficult to compare directly because decision environments, types of violation, and subject populations differ(Kasper & Rablen, 2023). Public goods experiments have demonstrated effects on contribution dynamics by comparing conditions with and without punishment, removing punishment, or introducing costly peer punishment. Yet whether probability and severity are interchangeable when expected punishment is fixed remains untested directly. Moreover, the subsequent responses of eligible participants who are actually punished and those who are not punished have not been examined separately(Krügel & Maaser, 2025).
Conceptually, punishment can affect behavior through two channels: the loss incurred after an actual punishment and the deterrence effect of merely facing a threat of punishment(Almeida, 2023; Kasper & Rablen, 2023; Noussair et al., 2024). Most experiments focus on aggregate cooperation and rarely separate these channels under conditions with the same expected punishment. Distinguishing the respective roles of deterrence and actual punishment is essential for designing institutions that maximize compliance while limiting enforcement costs(Duong et al., 2023; Wang et al., 2023). The issue has both theoretical significance and far-reaching practical value. Policymakers, managers, and social planners often face a trade-off under budgetary or legal constraints: should they increase punishment probability or raise the severity of fines? If individuals systematically favor one dimension over the other, the same expected punishment may generate markedly different levels of cooperation, making simple expected value predictions misleading(Friesen, 2012; Menegatti, 2023).
To address these limitations, this study uses a repeated public goods game with a no-punishment baseline and three exogenous punishment mechanisms. Expected punishment is identical across the three treatments, which combine (1) low detection probability paired with high penalty, (2) medium detection probability with medium penalty, and (3) high detection probability with low penalty. By comparing individual investment across these mechanisms, we examine how the probability-severity composition affects team cooperation while expected punishment remains constant. We also examine the deterrence effect and the actual punishment effect separately to identify how each promotes cooperation.
Specifically, the study addresses three questions: (1) Does each punishment mechanism increase contributions relative to the no-punishment baseline? (2) Do the three mechanisms with the same expected punishment generate different contribution levels? (3) Among decisions that meet the punishment criteria, how do the deterrence effect and the actual punishment effect each influence cooperative behavior?
First, by adopting an experimental economics design and holding total expected punishment constant, we systematically compare the effects of different probability-severity combinations on cooperative behavior. This approach circumvents conflicting conclusions arising from divergent trends in the two dimensions and offers clear evidence of differential governance effects across punishment schemes. Second, it separates the deterrent and actual punishment channels, overcoming the tendency of earlier research to conflate the two behavioral motives and revealing how individuals adjust their behavior under the same expected punishment. Third, it identifies preferences for different institutional structures under the same expected cost, corrects a potentially misleading implication of conventional expected utility theory for predicting cooperation, and provides a theoretical basis for policymakers to optimize punishment probability and fine severity under budget constraints.
2. Theoretical Background and Hypothesis Development
2.1. Punishment and Individual Investment
Free riding in public goods games reduces cooperation. Punishment, as either a formal or informal institution, has therefore become a key governance tool for resolving social dilemmas(Fehr & Gächter, 2000; Kamei, 2024; Olcina & Calabuig, 2021). In team settings, individuals may be willing to punish free riders even at a personal cost (Fehr & Gächter, 2000; Hua & Liu, 2023). This tendency toward altruistic punishment demonstrates the presence of social preferences and provides a psychological foundation for cooperative norms. From the perspective of modern social governance, punishment operates through two routes. On the one hand, psychological processes such as internalization and identification create self-restraint. On the other hand, formal institutions backed by state coercive power generate strong deterrence through means such as public condemnation and reporting, thereby sustaining long-term cooperation. After punishment is introduced, voluntary contributions to public goods increase significantly and become more stable (Otten et al., 2024).
From a behavioral economics perspective, punishment influences individual decisions through both the loss effect of actual punishment and the deterrence effect. First, actual punishment activates loss aversion(Kasper & Rablen, 2023). According to prospect theory, individuals are substantially more sensitive to losses than to gains. In a public goods game, being punished is perceived as a salient psychological loss that generates strong negative utility. Participants may therefore increase their investment markedly in the next period to avoid another loss. The more severe the punishment, the stronger the avoidance motive and the greater the increase in investment(Fontes & Shahan, 2021; Noussair et al., 2024).
Second, a punishment institution delivers a deterrent signal that alters the decision weights attached to costs and benefits, as well as beliefs regarding others’ cooperative behavior. Punishment establishes an expected cost of violations and changes individuals’ assessment of the risk associated with a free-riding strategy, so that the strategy is no longer advantageous (Almeida, 2023; Engel & Nagin, 2015; Teodorescu et al., 2021). As an explicit rule, punishment also signals norms by sanctioning violations and strengthens beliefs that others will cooperate. This effect of beliefs facilitates a constructive climate of cooperation(Kamei, 2024; Posten et al., 2025).
Experimental research on punishment and cooperation has generally used 3 designs. The first compares a no-punishment control group with a punishment treatment group (Alsobay et al., 2026; Kirchkamp & Mill, 2020). The second is a punishment-removal design, in which punishment is introduced for a period and then withdrawn to observe subsequent changes in cooperation(Almeida, 2023; Kamei, 2024). The third involves punishment that is costly for the punisher, allowing participants to choose between implementing a punishment arrangement or a no-punishment arrangement (Krügel & Maaser, 2025; Molleman et al., 2019). This study introduces punishment into a public goods game using the first design. Based on the preceding analysis, we propose Hypothesis H1: relative to a no-punishment setting, a punishment setting significantly increases individual investment.
H1a: Relative to the no-punishment setting, a low-probability/high-severity punishment setting significantly increases individual investment.
H1b: Relative to the no-punishment setting, a medium-probability/medium-severity punishment setting significantly increases individual investment.
H1c: Relative to the no-punishment setting, a high-probability/low-severity punishment setting significantly increases individual investment.
2.2. Three Punishment Mechanisms and Individual Investment
Traditional explanations of compliance decisions rely largely on expected utility theory. They assume that whether an individual abandons free riding and follows cooperative norms depends mainly on the relative magnitudes of the expected punishment for a violation and the cost of compliance(Friesen, 2012; Menegatti, 2023). When total expected punishment is constant, different combinations of punishment probability and severity should therefore impose equivalent behavioral constraints . Expected utility theory, however, rests on the strict assumptions of complete rationality, risk neutrality, and objective probability weighting, and thus struggles to explain behavioral heterogeneity under outcomes with identical expected gains or losses. Behavioral economics and prospect theory argue that individuals decide on the basis of subjective psychological value rather than objective expected value. Psychological features such as loss aversion, biased probability weighting, and heterogeneous risk perceptions may produce very different responses to high-probability/small losses and low-probability/large losses. These features provide the principal theoretical explanation for differences in cooperative investment under punishment schemes with the same expected value(Fehr et al., 2011; Menegatti, 2023).
First, individuals generally display pronounced loss aversion. Prospect theory holds that the negative utility of a loss is much greater than the positive utility of an equivalent gain, making individuals more sensitive to losses from punishment than to gains from compliance(Barberis, 2013; Fehr et al., 2011). Under the constant expected punishment framework used here, a low-probability/high-severity combination exposes a violator to a large loss, magnifying the psychological impact of the extreme outcome. A high-probability/low-severity combination, by contrast, produces frequent, small, and stable losses that are perceived less sharply. Although the mathematical expectations are identical, subjective perceptions of loss differ and may produce divergent cooperative investments(Menegatti, 2023; Teodorescu et al., 2021).
Second, individuals exhibit probability-weighting biases, tending to overweight low-probability extreme events and underweight high-probability routine events. With low-probability/high-severity punishment, individuals may overweight the occurrence of an extreme penalty and experience strong ex ante deterrence. With high-probability/low-severity punishment, they may discount the warning conveyed by frequent small penalties and become desensitized or optimistic about avoiding meaningful consequences. Cooperation may therefore differ systematically across punishment schemes(Earnhart & Friesen, 2023; Teodorescu et al., 2021).
Disagreements in the empirical literature are consistent with these psychological mechanisms. Research in criminal psychology finds asymmetric perceptions of punishment probability and severity, with low-probability severe punishment producing a particularly salient subjective deterrence effect(Engel & Nagin, 2015; Teodorescu et al., 2021). Some experiments show that students are more sensitive to severe penalties that are explicit and predictable , whereas offender populations such as incarcerated individuals respond more strongly to increases in detection probability . Other research finds that changing punishment probability alone does not significantly alter individual decisions (Batrancea et al., 2022; Nixon & Barnes, 2019; Teodorescu et al., 2021). These disputes largely reflect heterogeneity across populations in loss aversion and probability weighting. They also indicate that punishment effects are determined not only by total expected punishment but by the specific combination of probability and severity(Hauser et al., 2019; Nockur et al., 2021).
Accordingly, in a public goods game with the same total expected punishment, cooperative investment is fundamentally a risky decision shaped by psychological preferences. Under low-probability/high-severity punishment, probability weighting and loss aversion intensify fear of an extreme penalty. The resulting ex ante deterrence encourages individuals to increase their public goods investment to avoid a major loss. Under high-probability/low-severity punishment, penalties are routine and predictable, but the negative utility of each small loss is attenuated. Frequent minor penalties may generate desensitization, weaken deterrence, and increase the relative appeal of free riding. A medium-probability/medium-severity structure is less affected by either extreme bias, leaving perceived loss and deterrence at intermediate levels. The three combinations thus generate inherently different perceptions, levels of deterrence, and risk constraints, which may ultimately produce significant differences in public goods investment.
Building on the behavioral logic of prospect theory, loss aversion, and probability weighting, and in light of the existing empirical debate, we hold total expected punishment constant and establish three graded mechanisms: low detection probability paired with high penalty, medium detection probability with medium penalty, and high detection probability with low penalty. We compare heterogeneity in cooperative behavior across these probability-severity structures to clarify how differences in psychological perception produce differences in governance outcomes.
We therefore propose Hypothesis H2: when total expected punishment is the same, individual public goods investment differs significantly across the three probability-severity punishment settings.
H2a: Individual investment differs significantly between the low probability with high severity treatment and the medium probability with medium severity treatment.
H2b: Individual investment differs significantly between the low probability with high severity treatment and the high probability with low severity treatment.
H2c: Individual investment differs significantly between the medium probability with medium severity treatment and the high probability with low severity treatment.
3. Experimental Design and Procedure
3.1. Experimental Design
To identify the effects of punishment and its probability-severity combinations on cooperative behavior, and referring to the experimental setup of similar studies (Engel & Nagin, 2015; Fehr & Gächter, 2000; Kirchkamp & Mill, 2020; Nockur et al., 2021),this study used a four-treatment between-subjects design comprising T1, T2, T3, and T4. A total of 64 participants were recruited, with 16 assigned to each treatment. Within each treatment, participants were randomly assigned to 4 fixed groups of 4 and made decisions over 20 consecutive periods. Group composition and participant identification numbers remained unchanged throughout the experiment, and each participant took part in only one treatment.
3.1.1. Public Goods Game and Baseline Treatment (T1)
The baseline treatment, T1, was a public goods game without punishment. A total of 16 participants were randomly assigned to 4 fixed groups of 4 and made repeated decisions over 20 periods, with group assignments and identification numbers held constant. At the beginning of each period, each participant received an endowment of 50 points and could invest any integer amount from 0 to 50 points in the group project. The project’s total return was twice the group’s total investment and was divided equally among the 4 members. Each member therefore received 1/2 of the group’s total investment, while retaining any amount not invested.
A participant’s payoff in each period therefore consisted of the uninvested endowment and the return from the group project. The individual payoff function was .
For an individual seeking to maximize personal income, the optimal strategy was to retain the entire endowment and invest nothing in the group project. For an individual seeking to maximize collective income, the optimal strategy was to invest the entire endowment in the group project. When individual and collective rationality conflict, free riding substantially reduces collective welfare and the level of group cooperation, which may further weaken individual willingness to cooperate.
3.1.2. Experimental Treatments with Different Punishment Probability-Severity Combinations (T2-T4)
Treatment T2, T3, and T4 introduced punishment into the public goods game. Each treatment included 16 participants assigned to fixed groups of 4 for 20 consecutive periods. At the beginning of each period, each participant received an endowment of 50 G$, independently chose an investment in the group project, and estimated the average investment of the other 3 group members. After the investment decision, a participant was punished with the probability and severity specified for the relevant treatment if the participant’s investment was no greater than the average investment of all 4 group members and was below 40 G$. To prevent a participant’s payoff from becoming negative, the actual punishment was capped at the amount required to reduce that period’s payoff to 0.
The three punishment treatments differed only in their combinations of punishment probability and severity, as shown in Table 1.
As shown in Table 1, treatment T2 combined low probability with high severity, treatment T3 combined medium probability with medium severity, and treatment T4 combined high probability with low severity. Expected punishment was 16 G$ in all three treatments. Holding expected punishment constant therefore allowed us to identify how different combinations of punishment probability and severity affected individual cooperative behavior.
The dual punishment criterion, whereby individual investment had to be no greater than the group average and below 40 G$, was adopted for two reasons. First, when all group members maintained low investment levels, punishment could still be triggered even if their investments were similar, preventing collective free riding from escaping institutional constraints. Second, individuals who invested at least 40 G$ were exempt from punishment, which protected the willingness of high contributors to cooperate. The rule therefore constrained both relatively low investment and collectively low cooperation without adversely affecting high cooperators.
According to expected value theory, individual investment should not differ systematically when expected punishment is identical across decision settings. Related studies, however, suggest that sensitivity to punishment probability and severity may differ. Individuals who focus on the probability of punishment may increase their investment as that probability rises, whereas those who focus more on punishment severity may reduce their investment when the penalty becomes less severe . Comparing T2, T3, and T4 separately with the no-punishment treatment T1 therefore tests whether punishment promotes cooperation. Further comparisons among T2-T4 assess the governance effects of alternative probability-severity combinations under the same expected punishment and identify decision patterns under different punishment institutions.
3.2. Experimental Procedure
To examine the effect of punishment probability on individual cooperation and its underlying mechanism, four experimental sessions were conducted in 4 sessions in the laboratory of a university school of management. Participants were recruited through an online platform and screened, with major and gender considered in forming the sample, while all decisions remained anonymous.
3.2.1. Reading and Comprehension of the Experimental Instructions
Participants arrived at the laboratory 5 minutes early, signed in, and drew lots for computer seats. After all participants had arrived, the experiment began. An assistant first distributed the experimental instructions and allowed 5 minutes for reading. The experimenter then explained the instructions to ensure that participants understood all procedures. After the explanation and private answers to questions, participants completed a comprehension test to confirm that they understood the instructions correctly. The experimenter subsequently explained screenshots of the key computer interfaces to facilitate the computerized task. Communication between participants was prohibited throughout the experiment. Participants raised a hand if they had a question, and the experimenter answered them individually.
3.2.2. Economic Decision-Making Stage
This stage is one of the two crucial parts of the computer operation. Participants were first randomly assigned to groups of 4. Group composition remained fixed throughout the experiment, and each participant had a permanent identification number. In each period, every participant received an endowment of 50 G$ for investment, and earnings from one period could not be carried over to the next. Participants then invested in the group project. Total group investment was multiplied by 2 and divided equally among the group members, while funds not invested in the group project were retained by the individual. Each participant’s period payoff was determined by the function. Participants next estimated the mean investment of the other group members. Finally, the interface displayed the participant’s identification number, individual investment, estimate, group mean investment, mean investment of the other group members, period payoff, whether punishment had occurred, the punishment amount, and the investments and payoffs of the other group members. The experiment was repeated for 20 periods.
3.2.3. Questionnaire Stage
This stage was also completed on a computer. The questionnaire collected basic personal information, including gender, place of origin, major, parents’ educational attainment, and household income, as well as risk preference, altruistic preference, and trust. Parents’ education, household income, and trust were measured using Likert-type scales. Risk preference was assessed both with a Likert-type item and with binary lottery pairs framed separately in terms of gains and losses.
3.2.4. Payment and Follow-Up Interview Stage
After the questionnaire, an experimental assistant randomly selected one participant to draw a ball to determine which of the 20 periods would be used for payment. Earnings were converted to cash at a specified rate and paid privately. After payment, 3 or 4 participants were randomly asked to remain for interviews about how they had made decisions and their opinions and suggestions regarding the experiment. These interviews assessed whether participants had made their decisions after fully understanding the instructions and thereby helped establish the validity of the experiment.
4. Results
4.1. Descriptive Statistics
Of the 64 participants, 31 were men (48.44%), 18 were from urban areas (28.13%), and 15 were only children (23.44%). Mean paternal and maternal educational attainment was 2.656 and 2.094, respectively. Mean risk preference measured on a seven-point Likert scale was 3.016. In the binary lottery choices, mean risk preference under the gain and loss frames was 4.547 and 4.078, respectively. Mean altruistic preference was 46.19 on a scale from 0 to 80; mean household income was 2 on a scale from 0 to 4; and mean trust was 3.313 on a scale from 0 to 5.
Table 2 reports descriptive statistics for individual investment in the four treatments. Mean investment in the no-punishment treatment T1 was 20.78 G$ (SD = 17.46). Mean investment in punishment treatments T2, T3, and T4 was 26.42 G$, 27.59 G$, and 24.76 G$, respectively, all higher than in T1. Mean investment was highest in T3 and lowest among the punishment treatments in T4. These descriptive results provide preliminary evidence that punishment increased cooperative investment and participants’ expectations of other members’ cooperation.
Figure 1 compares changes in individual investment over time across the four treatments. Overall, investment in T3 remained relatively high. Investment in T2 fluctuated markedly in several periods but remained within a relatively high range in later periods. The relative positions of T4 and T2 changed several times after the first 5 periods, with no stable ranking. T1 remained comparatively low in most periods. The following analyses use nonparametric tests and regression models to assess differences among the treatments.
4.2. Hypothesis Testing
4.2.1. Tests of Differences
We first tested whether punishment increased individual investment. As reported in Table 3, the Kruskal-Wallis test indicated significant differences in the distributions of investment across T1-T4 (p < 0.001). Wilcoxon rank-sum tests using the no-punishment treatment T1 as the reference showed significant differences between T1 and T2 (z = -3.418, p = 0.001), between T1 and T3 (z = -4.372, p < 0.001), and between T1 and T4 (z = -2.524, p = 0.012). Together with the direction of the means in Table 2, these results show that individual investment was significantly higher in T2, T3, and T4 than in T1. Thus, the low-probability/high-severity, medium-probability/medium-severity, and high-probability/low-severity punishment mechanisms all increased cooperation, supporting H1a, H1b, and H1c.
We next compared the three probability-severity combinations under the same expected punishment. Wilcoxon rank-sum tests showed no significant difference in investment between T2 and T3 (z = -0.686, p = 0.493) or between T2 and T4 (z = 1.551, p = 0.121). The difference between T3 and T4 was significant at the 5% level (z = 2.317, p = 0.021). The descriptive statistics show that mean investment was higher in T3 than in T4, indicating that medium-probability/medium-severity punishment sustained more cooperation than high-probability/low-severity punishment. However, T3 did not differ significantly from the low-probability/high-severity treatment T2.
4.2.2. Regression Analysis
To assess whether the preceding results remained robust after controlling for individual characteristics, individual investment (measured in G$) was used as the dependent variable and a treatment dummy (tre) as the main independent variable. The models sequentially controlled for gender (gen), altruistic preference (altr), period (period), risk preference under the loss frame (lrisk), household income (income), the interaction between paternal and maternal education (father*mother), and only-child status (single).
Table 4 reports three sets of regression results. Models 1-1 and 1-2 compare T1 with T2; the coefficients for T2 were 5.641 and 6.913, respectively, and both were significant at the 1% level. Models 2-1 and 2-2 compare T1 with T3; the coefficients for T3 were 6.813 and 6.869, respectively, and both were significant at the 1% level. Models 3-1 and 3-2 compare T1 with T4; the coefficients for T4 were 3.981 and 5.543, respectively, and both were also significant at the 1% level. After the controls were added, the direction and significance of all three punishment coefficients remained stable, providing further support for H1a, H1b, and H1c and confirming that punishment increased individual investment.
We further examined the combined effects of punishment probability and severity when expected punishment was identical. In Table 5, Models 1-1 and 1-2 compare T2 with T3, coding T2 as 0 and T3 as 1. The coefficients for tre were 1.172 and 1.915, respectively, and neither was statistically significant. H2a was therefore not supported.
Models 2-1 and 2-2 compare T2 with T4, coding T2 as 0 and T4 as 1. The coefficients for tre were -1.659 and 1.292, respectively, and neither was significant. H2b was therefore not supported.
Models 3-1 and 3-2 compare T3 with T4, coding T3 as 0 and T4 as 1. The coefficients for tre were -2.831 and -2.785, respectively, and both were significant at the 5% level. Investment in T4 was therefore significantly lower than in T3 both before and after individual characteristics were controlled, supporting H2c. This result is consistent with the Wilcoxon rank-sum tests: investment was consistently higher in T3 than in T4 but did not differ significantly from T2.
The nonparametric tests and regression analyses support conclusions at two levels. First, relative to the no-punishment treatment T1, T2, T3, and T4 all significantly increased individual investment, and the results remained stable after controlling for individual characteristics. H1a, H1b, and H1c were therefore supported. Second, even when expected punishment was identical, the combination of punishment probability and severity affected cooperation. Mean investment was highest in T3 and was significantly higher than in T4, but it did not differ significantly from T2. Thus, H2c was supported, whereas H2a and H2b were not. These findings show that individual decisions depended on more than expected punishment alone. The medium-probability/medium-severity combination avoided the comparatively low cooperation observed under high-probability/low-severity punishment and provides an empirical basis for explaining T3’s higher cooperation through the separate channels of deterrence and actual punishment.
4.2.3. Effects of Actual Punishment and Deterrence on Cooperative Behavior
Punishment affects subsequent investment decisions mainly through deterrence and actual punishment. Deterrence refers to a participant who violates the rule but is not actually punished strategically increasing investment in the next period out of concern about future punishment. The actual punishment effect refers to a punished participant adjusting investment in the next period to avoid being punished again. Under the experimental rules, an investment of 40 G$ met the compliance threshold for exemption from punishment. A next-period investment of exactly 40 G$ therefore represents the minimum compliant response to the punishment mechanism. Under the operational definition used in this study, participants who invested more than 40 G$ were classified as unconditional cooperators because their investment exceeded the level required merely to avoid punishment.
First, overall, deterrence induced compliant behavior more effectively than actual punishment. As shown in Table 6, under actual punishment, the numbers of observations in which next-period investment was adjusted to exactly 40 G$ were 1, 10, and 11 in T2, T3, and T4, respectively. Under deterrence, the corresponding numbers were 54, 38, and 32, all substantially higher than under actual punishment. Among observations with next-period investment of at least 40 G$, the numbers under actual punishment were 1, 14, and 15 in T2, T3, and T4, with mean investments of 40.00 G$, 42.14 G$, and 42.67 G$, respectively. Under deterrence, the corresponding numbers were 106, 101, and 75, with mean investments of 44.25 G$, 44.69 G$, and 44.03 G$. Thus, the threat of punishment prompted more individuals to increase investment and reach the compliance threshold before an actual penalty occurred.
Second, deterrence produced more unconditional cooperators. Under actual punishment, T2 contained no observation with next-period investment above 40 G$, while T3 and T4 each contained only 4 such observations. Under deterrence, the numbers of unconditional-cooperator observations were 52, 63, and 43 in T2, T3, and T4, respectively, with T3 having the largest number. Mean investment among these observations was 48.66 G$, 47.52 G$, and 47.02 G$ in T2, T3, and T4, all clearly above the compliance threshold. Deterrence therefore not only encouraged individuals to meet the minimum requirement of 40 G$ but also induced some to continue increasing investment beyond the threshold, indicating a stronger willingness to cooperate.
These results reveal two effects of deterrence. On the one hand, the threat of punishment changed the expected cost of violating the rule and prompted individuals to increase investment to 40 G$, producing strategic compliance. On the other hand, a clear and credible punishment mechanism strengthened expectations regarding cooperative norms, leading some participants to invest above the minimum compliance threshold. Actual punishment, by comparison, mainly corrected behavior after a loss had occurred, and both its reach and the number of observations showing investment beyond the compliance threshold were relatively limited.
Third, the relative effects of actual punishment and deterrence varied with the combination of punishment probability and severity. Table 7 shows that, under actual punishment, mean next-period investment was 15.40 G$, 23.39 G$, and 17.18 G$ in T2, T3, and T4, respectively, with the highest mean in T3. Under deterrence, the corresponding means were 23.14 G$, 20.72 G$, and 23.89 G$. Within treatments, mean investment under deterrence exceeded that under actual punishment by 7.74 G$ in T2 and 6.71 G$ in T4, whereas mean investment under actual punishment exceeded that under deterrence by 2.67 G$ in T3. T2 and T4 therefore primarily displayed an advantage of deterrence, while T3 showed a stronger corrective effect of actual punishment.
The Wilcoxon rank-sum tests in Table 8 provide further evidence of these differences. Within treatments, next-period investment under deterrence was significantly higher than under actual punishment in T2 (z = -2.043, p = 0.041) and T4 (z = -3.397, p = 0.001), indicating that deterrence increased cooperation more effectively under these two mechanisms. The difference between actual punishment and deterrence was not significant in T3 (z = 1.063, p = 0.288), indicating that the two channels jointly sustained individual investment in T3. Across treatments, under actual punishment, the difference between T2 and T3 was significant at the 10% level (z = -1.951, p = 0.051), the difference between T3 and T4 was significant at the 5% level (z = 2.154, p = 0.031), and the difference between T2 and T4 was not significant (z =-0.365, p = 0.715). Under deterrence, only the difference between T3 and T4 was significant at the 10% level (z = -1.799, p = 0.072); neither T2 versus T3 nor T2 versus T4 was significant.
Fourth, T3 produced the highest overall level of cooperation through the joint support of actual punishment and deterrence. The aggregate results reported above show mean investments of 26.42 G$, 27.59 G$, and 24.76 G$ in T2, T3, and T4, respectively, with the highest mean in T3. Further analysis identifies two advantages of T3. Under actual punishment, its mean next-period investment was 23.39 G$, higher than in T2 and T4, indicating the strongest corrective effect on violations. Under deterrence, T3 generated 63 unconditional-cooperator observations, more than T2 or T4. At the same time, the effects of actual punishment and deterrence did not differ significantly within T3, indicating that both ex post correction and ex ante deterrence operated in this treatment. The two mechanisms complemented one another and jointly explain the higher and relatively stable cooperation observed in T3.
Overall, punishment did not promote cooperation solely through its actual implementation. A credible threat of punishment itself imposed a strong behavioral constraint and could move some individuals beyond minimum compliance toward higher cooperation. When expected punishment was held constant, T3, which combined medium punishment probability with medium severity, balanced ex ante deterrence and ex post correction and thus produced a more even governance effect. When designing punishment institutions, firms and social organizations should foster lasting deterrence through clear and credible rules, while keeping punishment moderate and enforceable—thus aligning compliance constraints with cooperative incentives.
5. Discussion
First, conventional expected utility theory cannot explain heterogeneous cooperation under equal expected punishment. Based on complete rationality and risk neutrality, the conventional account predicts no difference in the incentive to free ride when expected losses from violations are the same. This experiment nevertheless identified clear differences in the governance effects of the three punishment schemes. From a behavioral economics perspective, subjective valuations depart from objective mathematical expectations. In T2, low probability and high severity magnified the negative utility of an extreme large loss, while probability weighting led participants to overestimate the likelihood of severe punishment and generated strong ex ante deterrence. In T4, high probability and low severity produced only repeated small losses, which could create desensitization over time and weaken constraints. The balanced structure of T3 involved neither the shock of an extreme loss nor desensitization to high-frequency punishment. Deterrence and ex post correction therefore operated together, producing the highest cooperative equilibrium(Abdellaoui & Kemel, 2014; Barberis, 2013).
Second, the governance value of punishment arose mainly from ex ante deterrence rather than ex post implementation. The data show that the expectation of punishment alone induced many individuals to raise investment voluntarily to the compliance threshold or even to cooperate beyond it(Alsobay et al., 2026; Fehr & Gächter, 2000). Actual punishment corrected only a small number of prior violators, with limited coverage and magnitude of behavioral improvement(Chen et al., 2025; Teodorescu et al., 2021). From an institutional cost perspective, frequent punishment is unnecessary when the governance goal is stable long-term cooperation. Establishing clear and credible rules that create stable deterrence is a more efficient governance instrument and could reduce the costs of monitoring and enforcement(Bicchieri & Maras, 2022).
Third, a medium-probability/medium-severity structure has a distinctive dual synergy. T3 differed from the other treatments because its two transmission channels did not produce divergent behavior. Actual punishment generated the strongest loss-based correction, with punished participants investing an average of 23.39 G$ in the next period, significantly more than in T2 and T4. T3 also produced the largest number of unconditional cooperators under deterrence and therefore the largest group of voluntary cooperators. Together, these effects generated the highest overall investment in T3 and offset the weak ex post correction in T2 and weakened deterrence in T4.
Fourth, the findings have implications for institutional design in practice. In settings such as internal corporate incentives, public resource regulation, and tax compliance, a fixed enforcement budget, and thus a fixed total expected punishment cost, should not be allocated exclusively to either mild but frequent punishment or severe but infrequent punishment(Almeida, 2023; Kasper & Alm, 2022; Teodorescu et al., 2021). A balanced arrangement combining a medium punishment probability with moderate punishment can accommodate both deterrence and ex post correction. Governance should also be shifted forward by using explicit public rules to strengthen expected deterrence and reduce the frequency of actual punishment, thereby maximizing collective cooperation while controlling enforcement costs.
6. Conclusions
6.1. Main Findings
Punishment has long been an important means by which government bodies, firms, and social organizations increase cooperation. Holding expected punishment constant, this study varied punishment probability and severity to construct 3 punishment mechanisms, examined the effects of probabilistic punishment on individual cooperation, and further analyzed differences among the 3 mechanisms and the channels through which they operated. The main findings are as follows.
First, introducing punishment significantly increased individual cooperation. Relative to the no-punishment baseline, all 3 probability-severity combinations increased public goods investment, demonstrating the effectiveness of punishment as a tool for governing cooperation.
Second, when expected punishment was the same, the governance effects of the probability-severity combinations differed. The medium-probability/medium-severity combination, T3, produced the highest cooperation and significantly outperformed the high-probability/low-severity combination, T4. Its difference from the low-probability/high-severity combination, T2, was not statistically significant. Individuals’ responses to punishment therefore did not fully conform to expected value theory but reflected a preference for balancing certainty and severity.
Third, punishment promoted cooperation mainly through deterrence rather than through the implementation of actual punishment. Deterrence induced individuals to invest at or above the compliance threshold more effectively than actual punishment. Thus, clear, credible, and well-communicated punishment rules can themselves impose a powerful behavioral constraint.
6.2. Theoretical Contributions
This study makes the following theoretical contributions.
First, it moves beyond the conventional expected value framework by showing that, when expected punishment is identical, the structure rather than the total amount of punishment has a critical effect on behavior. This finding provides behavioral economic evidence on the boundary conditions of punishment effectiveness and deepens understanding of the nonlinear substitutability between certainty and severity.
Second, the study clearly distinguishes the deterrent and actual punishment channels and finds that deterrence is the more important driver. This distinction addresses the tendency of previous research to conflate the two channels and provides a more refined micro behavioral mechanism for understanding how punishment affects cooperation.
Third, the findings are consistent with probability weighting and loss aversion. Individuals assign greater psychological weight to low-probability/high-severity punishment as a salient event but tend to become desensitized to high-probability/low-severity punishment as a routine event. This pattern explains why the medium-probability/medium-severity combination produces a more balanced and stable governance outcome(Almeida, 2023; Kamei, 2024).
6.3. Practical Implications
The findings have important implications for institutional design by firms, governments, and social organizations.
First, institutional design should balance certainty and severity. Under a budget constraint, with expected cost held fixed, excessive reliance on severe punishment with low probability may weaken the credibility of deterrence because implementation is infrequent. Excessive reliance on high-probability but mild punishment may instead create desensitization and optimism about avoiding meaningful consequences because each penalty is small. A medium-probability/medium-severity combination achieves a better balance between governance effectiveness and enforcement cost.
Second, substantial attention should be paid to the signaling and deterrence-building functions of punishment rules. Because deterrence is the primary force promoting cooperation, institutional design should shift its emphasis from ex post punishment to ex ante prevention. Clear publication of the rules and prominent communication of enforcement cases can strengthen the expectation that violations will inevitably be punished and maximize the warning effect, achieving a high level of cooperation at a lower enforcement cost.
Finally, organizational managers should recognize that explicit punishment rules can not only achieve baseline compliance but also encourage some members to cooperate beyond the minimum. Sound rules and effective governance can therefore do more than preserve order; they can help build a positive culture of cooperation.
6.4. Limitations and Future Research
This study has several limitations. First, the participants were students, whose risk and social preferences may differ from those of specific occupational groups, such as corporate employees or incarcerated individuals. The external validity of the findings therefore requires further testing. Second, the study focused on exogenous formal punishment. Future research could introduce richer forms of governance, including endogenous punishment, such as intragroup voting on punishment rules, and peer punishment, and examine their dynamic evolution across contexts. Finally, this study considered mainly short-term cooperation. Future work could extend the number of experimental periods or use longitudinal follow-up to examine how different punishment schemes shape the long-term formation and consolidation of cooperative norms.
Supplementary Materials
The following supporting information can be downloaded at the website of this paper posted on Preprints.org.
Author Contributions
Conceptualization, G.F. and C.L.; methodology, G.F. and C.L.; software, G.F.; validation, G.F.; formal analysis, G.F.; investigation, G.F.; resources, G.F.; data curation, G.F.; writing—original draft preparation, G.F. and C.L.; writing—review and editing, G.F. and C.L.; visualization, G.F. and C.L.; supervision, G.F. and C.L.; project administration, G.F. and C.L.; funding acquisition, G.F. and C.L. All authors have read and agreed to the published version of the manuscript.
Funding
This study was supported by the National Social Science Fund of China (grant no. 21BGL238), the Key Scientific Research Project Plan of Colleges and Universities in Henan Province (grant no. 25A630008),2026 Henan Provincial Graduate Education Reform and Quality Improvement Project (Course Project) (grant no. YJS2026XSKC20).
Institutional Review Board Statement
In accordance with the Measures for Ethical Review of Life Sciences and Medical Research Involving Human Subjects (National Health Commission Order No. 4, 2023), ethical review and approval were waived for this study. Under Article 32(2), exemption applies to research using anonymized data that poses no harm to participants, does not involve sensitive personal information, and has no commercial interests. This survey-based study used fully anonymized data, involved no experimental intervention, collected no sensitive personal data, and served no commercial purpose. Accordingly, formal ethics committee approval was not required.
Informed Consent Statement
Informed consent was obtained from all subjects involved in the study.
Data Availability Statement
The raw data supporting the conclusions of this article will be made available by the authors, without undue reservation. Links to data in this paper: https://pan.baidu.com/s/1qbCWKGdws1HxN5UeeXwrOA 提取码: 5q8u.
Conflicts of Interest
The authors declare no conflict of interest.
References
- Abdellaoui, M.; Kemel, E. Eliciting Prospect Theory When Consequences Are Measured in Time Units: “Time Is Not Money”. Manag. Sci. 2014, 60(7), 1844–1859. [Google Scholar] [CrossRef]
- Alam, R.; Rai, T. S. Profitable third-party punishment destabilizes cooperation. Proc. Natl. Acad. Sci. 2025, 122(34), e2508479122. [Google Scholar] [CrossRef] [PubMed]
- Alm, J.; Malézieux, A. 40 years of tax evasion games: A meta-analysis. Exp. Econ. 2021, 24(3), 699–750. [Google Scholar] [CrossRef]
- Almeida, S. Punishment credibility and cooperation in public good games. J. Behav. Exp. Econ. 2023, 106, 102063. [Google Scholar] [CrossRef]
- Alsobay, M.; Rand, D. G.; Watts, D. J.; Almaatouq, A. Integrative experiments identify how punishment affects welfare in public goods games. Science 2026, 392(6794), eaeb5280. [Google Scholar] [CrossRef] [PubMed]
- Barberis, N. C. Thirty years of prospect theory in economics: A review and assessment. J. Econ. Perspect. 2013, 27(1), 173–196. [Google Scholar] [CrossRef]
- Batrancea, L. M.; Kudła, J.; Błaszczak, B.; Kopyt, M. Differences in tax evasion attitudes between students and entrepreneurs under the slippery slope framework. J. Econ. Behav. Organ. 2022, 200, 464–482. [Google Scholar] [CrossRef]
- Bicchieri, C.; Maras, M. Intentionality matters for third-party punishment but not compensation in trust games. J. Econ. Behav. Organ. 2022, 197, 205–220. [Google Scholar] [CrossRef]
- Bun, M. J. G.; Kelaher, R.; Sarafidis, V.; Weatherburn, D. Crime, deterrence and punishment revisited. Empir. Econ. 2020, 59(5), 2303–2333. [Google Scholar] [CrossRef]
- Chen, J. C.; D’Attoma, J.; Fonseca, M. A.; Malézieux, A. Promoting cooperation in an unequal world: Experimental evidence on the role of transparency and punishment. J. Bus. Ethics 2025, 202(4), 823–842. [Google Scholar] [CrossRef]
- Duong, M. H.; Durbac, C. M.; Han, T. A. Cost optimisation of hybrid institutional incentives for promoting cooperation in finite populations. J. Math. Biol. 2023, 87(5), 77. [Google Scholar] [CrossRef] [PubMed]
- Earnhart, D.; Friesen, L. Certainty of punishment versus severity of punishment. Land Econ. 2023, 99(2), 245–264. [Google Scholar] [CrossRef]
- Engel, C.; Nagin, D. Who is afraid of the stick? Experimentally Testing the Deterrent Effect of Sanction Certainty. Rev. Behav. Econ. 2015, 2(4), 405–434. [Google Scholar] [CrossRef]
- Fehr, E.; Gächter, S. Cooperation and punishment in public goods experiments. Am. Econ. Rev. 2000, 90(4), 980–994. [Google Scholar] [CrossRef]
- Fehr, E.; Hart, O. D.; Zehnder, C. Contracts as reference points—Experimental evidence. Am. Econ. Rev. 2011, 101(2), 493–525. [Google Scholar] [CrossRef]
- Fontes, R. M.; Shahan, T. A. Punishment and its putative fallout: A reappraisal. J. Exp. Anal. Behav. 2021, 115(1), 185–203. [Google Scholar] [CrossRef] [PubMed]
- Friesen, L. Certainty of punishment versus severity of punishment: An experimental investigation. South. Econ. J. 2012, 79(2), 399–421. [Google Scholar] [CrossRef]
- Fu, X.; Li, C.; Fu, J. The experimental research on leaders and cooperative behavior. Front. Psychol. 2022, 13, 944498. [Google Scholar] [CrossRef] [PubMed]
- Hauser, O. P.; Hilbe, C.; Chatterjee, K.; Nowak, M. A. Social dilemmas among unequals. Nature 2019, 572(7770), 524–527. [Google Scholar] [CrossRef] [PubMed]
- Hua, S.; Liu, L. Facilitating the evolution of cooperation through altruistic punishment with adaptive feedback. Chaos Solitons Fractals 2023, 173, 113669. [Google Scholar] [CrossRef]
- Kamei, K. Self-regulatory resources and institutional formation: An experiment. J. Econ. Behav. Organ. 2024, 222, 354–374. [Google Scholar] [CrossRef]
- Kasper, M.; Alm, J. Audits, audit effectiveness, and post-audit tax compliance. J. Econ. Behav. Organ. 2022, 195, 87–102. [Google Scholar] [CrossRef]
- Kasper, M.; Rablen, M. D. Tax compliance after an audit: Higher or lower? J. Econ. Behav. Organ. 2023, 207, 157–171. [Google Scholar] [CrossRef]
- Kirchkamp, O.; Mill, W. Conditional cooperation and the effect of punishment. J. Econ. Behav. Organ. 2020, 174, 150–172. [Google Scholar] [CrossRef]
- Krügel, J. P.; Maaser, N. How do higher-order punishment institutions shape cooperation and norm-enforcement? Rev. Int. Organ. 2025, 21(2), 351–384. [Google Scholar] [CrossRef]
- Menegatti, M. Variability in punishment, risk preferences and crime deterrence. Int. Rev. Law. Econ. 2023, 75, 106140. [Google Scholar] [CrossRef]
- Molenmaker, W. E.; Gross, J.; de Kwaadsteniet, E. W.; van Dijk, E.; de Dreu, C. K. W. Discriminatory punishment undermines the enforcement of group cooperation. Sci. Rep. 2023, 13(1), 6061. [Google Scholar] [CrossRef] [PubMed]
- Molleman, L.; Kölle, F.; Starmer, C.; Gächter, S. People prefer coordinated punishment in cooperative interactions. Nat. Hum. Behav. 2019, 3(11), 1145–1153. [Google Scholar] [CrossRef] [PubMed]
- Mungan, M. C. The certainty versus the severity of punishment, repeat offenders, and stigmatization. Econ. Lett. 2017, 150, 126–129. [Google Scholar] [CrossRef]
- Nixon, T. S.; Barnes, J. C. Calibrating student perceptions of punishment: A specific test of general deterrence. Am. J. Crim. Justice 2019, 44(3), 430–456. [Google Scholar] [CrossRef]
- Nockur, L.; Pfattheicher, S.; Keller, J. Different punishment systems in a public goods game with asymmetric endowments. J. Exp. Soc. Psychol. 2021, 93, 104096. [Google Scholar] [CrossRef]
- Noussair, C. N.; Tucker, S.; Xu, Y.; Breaban, A. The role of emotions in public goods games with and without punishment opportunities. J. Econ. Behav. Organ. 2024, 217, 631–646. [Google Scholar] [CrossRef]
- Olcina, G.; Calabuig, V. Trust and punishment. Eur. J. Political Econ. 2021, 70, 102032. [Google Scholar] [CrossRef]
- Otten, K.; Buskens, V.; Przepiorka, W.; Cherki, B.; Israel, S. Cooperation, punishment, and group change in multilevel public goods experiments. Eur. Econ. Rev. 2024, 164, 104682. [Google Scholar] [CrossRef]
- Posten, A. C.; Uğurlar, P.; Kube, S.; Lammers, J. Maintaining cooperation through vertical communication of trust when removing sanctions. Proc. Natl. Acad. Sci. 2025, 122(12), e2415010122. [Google Scholar] [CrossRef] [PubMed]
- Teodorescu, K.; Plonsky, O.; Ayal, S.; Barkan, R. Frequency of enforcement is more important than the severity of punishment in reducing violation behaviors. Proc. Natl. Acad. Sci. 2021, 118(42), e2108507118. [Google Scholar] [CrossRef] [PubMed]
- Wang, S.; Chen, X.; Xiao, Z.; Szolnoki, A.; Vasconcelos, V. V. Optimization of institutional incentives for cooperation in structured populations. J. R. Soc. Interface 2023, 20(199), 20220653. [Google Scholar] [CrossRef] [PubMed]
- Xiao, J.; Liu, L.; Chen, X.; Szolnoki, A. Evolution of cooperation driven by sampling punishment. Phys. Lett. A 2023, 475, 128879. [Google Scholar] [CrossRef]
- Yu, S.; Yoo, E. J.; Kim, S. The effects of performance evaluation on punishment in organisations. Int. Rev. Adm. Sci. 2023, 89(2), 484–500. [Google Scholar] [CrossRef]
- Zhao, Y.; Li, Z.; Jin, S.; Zhang, X. The impact of cognitive load on cooperation and antisocial punishment: Insights from a public goods game experiment. Behav. Sci. 2024, 14(8), 638. [Google Scholar] [CrossRef] [PubMed]
Figure 1.
Individual investment across periods 1-20 in the four treatments.
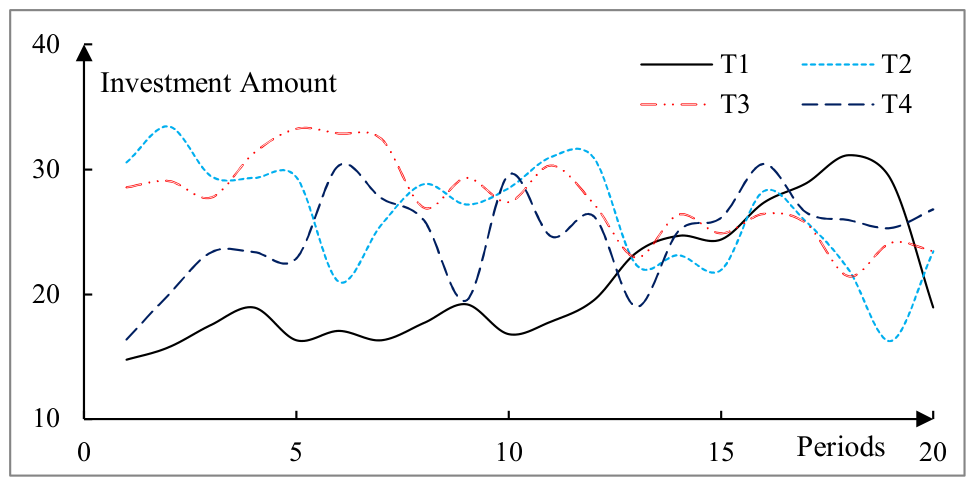

Table 1.
Parameter settings for the three punishment mechanisms.
| Treatment | Punishment probability (p) |
Punishment severity (s) |
Expected punishment |
Punishment criterion |
| T2 | 20% | 80 G$ | 16 G$ | Investment <= group mean investment and investment < 40 G$ |
| T3 | 50% | 32 G$ | 16 G$ | Investment <= group mean investment and investment < 40 G$ |
| T4 | 80% | 20 G$ | 16 G$ | Investment <= group mean investment and investment < 40 G$ |
Note: Expected punishment was 16 G$ in all three treatments, that is, .
Table 2.
Experimental treatments and individual investment.
| Treatment | Punishment severity | Punishment probability | Participants | Observations | investment | ||
| Mean | SD | ||||||
| T1 | -- | -- | 16 | 320 | 20.78 | 17.46 | |
| T2 | 80 | 0.2 | 16 | 320 | 26.42 | 17.49 | |
| T3 | 32 | 0.5 | 16 | 320 | 27.59 | 16.72 | |
| T4 | 20 | 0.8 | 16 | 320 | 24.76 | 16.45 | |
Note: Each experimental session comprised 20 periods and each treatment included 16 participants, yielding 320 participant-period observations per treatment.
Table 3.
Wilcoxon rank-sum tests of individual investment across treatments.
| T1 vs. T2 | T1 vs. T3 | T1 vs. T4 | T2 vs. T3 | T2 vs. T4 | T3 vs. T4 | |
| z value | -3.418 | -4.372 | -2.524 | -0.686 | 1.551 | 2.317 |
| p value | 0.001 | 0.000 | 0.012 | 0.493 | 0.121 | 0.021 |
Table 4.
Regression results for the effect of punishment on individual investment.
| T1 vs. T2 | T1 vs. T3 | T1 vs. T4 | ||||
| Model 1-1 | Model 1-2 | Model 2-1 | Model 2-2 | Model 3-1 | Model 3-2 | |
| tre | 5.641*** (4.08) |
6.913*** (4.87) |
6.813*** (5.04) |
6.869*** (5.01) |
3.981*** (2.97) |
5.543*** (4.08) |
| gen | 2.341 (1.65) |
5.114*** (3.47) |
0.357 (0.26) |
|||
| altr | 0.317*** (5.24) |
0.341*** (6.07) |
0.188*** (3.29) |
|||
| period | 0.110 (0.98) |
0.133 (1.19) |
0.486*** (4.48) |
|||
| lrisk | 1.497*** (5.25) |
1.685*** (5.17) |
1.337*** (4.29) |
|||
| income | -3.557*** (-4.04) |
-2.045*** (-3.24) |
-1.657** (-2.31) |
|||
| father*mother | -0.052 (-0.30) |
-0.431** (-2.25) |
-0.339* (-1.77) |
|||
| single | -3.271 (-1.52) |
7.287*** (3.80) |
-2.349 (-1.04) |
|||
| N | 640 | 640 | 640 | 640 | 640 | 640 |
| R2 | 0.026 | 0.154 | 0.038 | 0.127 | 0.014 | 0.151 |
Note: *, **, and *** indicate significance at the 10%, 5%, and 1% levels, respectively. t values are reported in parentheses, and N denotes the number of observations. tre is a treatment dummy: Models 1-1 and 1-2 code T1 as 0 and T2 as 1; Models 2-1 and 2-2 code T1 as 0 and T3 as 1; and Models 3-1 and 3-2 code T1 as 0 and T4 as 1.
Table 5.
Investment regression by punishment structure.
| T2 vs. T3 | T2 vs. T4 | T3 vs. T4 | ||||
| Model 1-1 | Model 1-2 | Model 2-1 | Model 2-2 | Model 3-1 | Model 3-2 | |
| tre | 1.172 (0.87) |
1.915 (1.38) |
-1.659 (-1.24) |
1.292 (0.96) |
-2.831** (-2.16) |
-2.785** (-2.13) |
| gen | 10.549*** (7.55) |
2.402* (1.80) |
1.891 (1.40) |
|||
| altr | 0.078 (1.35) |
0.116** (2.16) |
0.169*** (3.38) |
|||
| period | -0.446*** (-4.13) |
-0.093 (-0.85) |
-0.070 (-0.64) |
|||
| lrisk | -1.262*** (-3.56) |
-0.755** (-2.09) |
-1.896*** (-4.13) |
|||
| income | -2.979*** (-4.16) |
-2.311*** (-2.67) |
-0.575 (-0.85) |
|||
| father*mother | -0.517*** (-2.57) |
-0.721*** (-4.03) |
-1.076*** (-5.06) |
|||
| single | 3.916** (2.11) |
-5.964*** (-2.96) |
-2.397 (-1.28) |
|||
| N | 640 | 640 | 640 | 640 | 640 | 640 |
| R2 | 0.001 | 0.163 | 0.002 | 0.122 | 0.007 | 0.101 |
Note: tre is a treatment dummy. Models 1-1 and 1-2 code T2 as 0 and T3 as 1; Models 2-1 and 2-2 code T2 as 0 and T4 as 1; and Models 3-1 and 3-2 code T3 as 0 and T4 as 1.
Table 6.
Next-period investment ≥40 g$ under different punishment schemes.
| Treatment | Actual punishment (next-period investment >= 40) | Deterrence (next-period investment >= 40) | |||||||
| Minimum | Maximum | Observations | Mean | Minimum | Maximum | Observations | Mean | ||
| T2 | 40 | 40 | 1 | 40 | 40 | 50 | 106 | 44.25 | |
| T3 | 40 | 50 | 14 | 42.14 | 40 | 50 | 101 | 44.69 | |
| T4 | 40 | 50 | 15 | 42.67 | 40 | 50 | 75 | 44.03 | |
| Treatment | Actual punishment (next-period investment > 40) | Deterrence (next-period investment > 40) | |||||||
| Minimum | Maximum | Observations | Mean | Minimum | Maximum | Observations | Mean | ||
| T2 | -- | -- | 0 | -- | 41 | 50 | 52 | 48.66 | |
| T3 | 45 | 50 | 4 | 47.5 | 42 | 50 | 63 | 47.52 | |
| T4 | 50 | 50 | 4 | 50 | 42 | 50 | 43 | 47.02 | |
Note: The number of observations with next-period investment >= 40 G$ minus the number with investment > 40 G$ equals the number with investment exactly equal to 40 G$. Under actual punishment, these numbers were 1, 10, and 11 for T2, T3, and T4, respectively; under deterrence, they were 54, 38, and 32.
Table 7.
Next-period investment under actual vs. deterrent punishment.
| Treatment | Actual punishment | Deterrence | ||||||
| Minimum | Maximum | Mean | SD | Minimum | Maximum | Mean | SD | |
| T2 | 0 | 40 | 15.4 | 15.83 | 0 | 50 | 23.14 | 16.42 |
| T3 | 0 | 50 | 23.39 | 16.12 | 0 | 50 | 20.72 | 13.82 |
| T4 | 0 | 50 | 17.18 | 15.69 | 0 | 50 | 23.89 | 12.79 |
Table 8.
Comparison test of next-period investment amounts under different punishments.
| Treatment | Actual punishment | Deterrence | Actual punishment vs. deterrence | ||||||
| T2 vs. T3 | T2 vs. T4 | T3 vs. T4 | T2 vs. T3 | T2 vs. T4 | T3 vs. T4 | T2 vs. T2 | T3 vs. T3 | T4 vs. T4 | |
| z value | -1.951 | -0.365 | 2.154 | 1.640 | 0.128 | -1.799 | -2.043 | 1.063 | -3.397 |
| p value | 0.051 | 0.715 | 0.031 | 0.101 | 0.898 | 0.072 | 0.041 | 0.288 | 0.001 |
Disclaimer/Publisher’s Note: The statements, opinions and data contained in all publications are solely those of the individual author(s) and contributor(s) and not of MDPI and/or the editor(s). MDPI and/or the editor(s) disclaim responsibility for any injury to people or property resulting from any ideas, methods, instructions or products referred to in the content. |
© 2026 by the authors. Licensee MDPI, Basel, Switzerland. This article is an open access article distributed under the terms and conditions of the Creative Commons Attribution (CC BY) license (http://creativecommons.org/licenses/by/4.0/).
Copyright: This open access article is published under a Creative Commons CC BY 4.0 license, which permit the free download, distribution, and reuse, provided that the author and preprint are cited in any reuse.