
Submitted:
05 August 2026
Posted:
06 August 2026
You are already at the latest version
Abstract
This article discusses a study on the intelligent analysis of multisensory biogas data obtained from an experimental dataset generated by a Lab-on-Chip platform. The relevance of this work stems from the need for real-time monitoring of biogas quality and biomass condition under anaerobic digestion conditions, where changes in the concentrations of methane, carbon dioxide, hydrogen sulfide, oxygen, and temperature directly affect the stability of the technological process and the energy efficiency of the plant. This study utilizes a multisensor Lab-on-Chip/biosensor platform designed for rapid analysis of small samples of biogas, biomass, and biomix. The platform integrates gas, liquid, and optical sensor channels, as well as a module for transmitting data to the cloud. The experimental data obtained are processed using intelligent data analysis methods, including statistical analysis, correlation analysis, anomaly detection, and assessment of the relationships between monitored parameters. The scientific significance of this work lies in the application of an integrated approach to the analysis of multichannel experimental data obtained from the Lab-on-Chip platform, which enables a more accurate and timely assessment of the state of the biogas process. The practical significance lies in the ability to use the proposed approach for remote monitoring, early detection of anomalies, and improving the efficiency of biogas plant management.
Keywords:
biogas
; Lab-on-Chip
; biosensor
; IoT
; machine learning
1. Introduction
Anaerobic digestion is one of the methods for obtaining organic waste and renewable energy in the form of biogas. Due to the specific microbiological interactions within the process, fluctuations occur that affect methane production and lead to a deterioration in bioreactor stability. Controlling the process is becoming increasingly important to achieve process stability and ensure high biogas production. Advances in modern methods for real-time monitoring of the anaerobic digestion process at various levels have been highlighted [1,2].
Traditional laboratory monitoring of anaerobic digestion parameters, especially in small and medium-sized biogas plants, does not ensure the rapid detection of process changes. In the article, continuous monitoring systems based on Internet of Things (IoT) technologies, intelligent sensing platforms, and cloud data processing are being actively developed, enabling remote monitoring of process parameters in real time [3]. Multi-parameter biosensor platforms that allow for the simultaneous analysis of gas, liquid, and optical data from small biogas and biomass samples. In this work, this approach increases the informational content of monitoring and lays the foundation for a comprehensive assessment of the quality of the anaerobic digestion process [4]. Devices aimed at upgrading the bioreactor into an IoT device via ESP32 microcontrollers are being widely developed. The work is based on remote data collection and online monitoring of various parameters to evaluate anaerobic digestion performance [5]. In [6,7], artificial intelligence and machine learning methods such as Random Forest, XGBoost, artificial neural networks, and LSTM are widely used to predict biogas production, methane concentration, and to detect early signs of process disturbances. [8] compared DNN, CNN, and LSTM architectures for predicting reactor temperature from a time series of biogas monitoring and reported the best performance of the CNN model, demonstrating the potential of deep learning for biogas monitoring and prediction. Using an open experimental dataset further enhances the study’s reliability and allows for the assessment of the reproducibility of the obtained results [9].
Studies indicate that the stable control of anaerobic digestion is impossible without a comprehensive analysis of gas and liquid phase parameters [10,11]. Microfluidic platforms and biosensor technologies, which enable the rapid analysis of small sample volumes, are of particular interest. [12] demonstrated that using hybrid biosensor systems significantly accelerates volatile fatty acid detection and improves bioreactor control accuracy. Arduino and ESP32 controllers, cloud visualization and classification based on machine learning [12]. Similarly, ESP32-based IoT systems provide efficient remote process monitoring; however, many existing solutions are limited to recording individual parameters and do not provide complex intelligent processing of data from multiple sensors [13]. A multi-sensor IoT architecture for water quality monitoring, incorporating pH, temperature, conductivity, turbidity, and ORP sensors with Arduino and ESP32 controllers, cloud visualization, and machine learning-based classification, has been described [14]. [15] Such models can estimate difficult-to-measure parameters, including volatile fatty acid concentration, using indirect measurements from multiple sensors. Systematic reviews confirm the high efficiency of artificial intelligence methods for predicting biogas production, methane concentration, and detecting unstable operating conditions in bioreactors [16,17]. A hybrid structure combining thermodynamic, biochemical, hydrodynamic, and mass balance models with neural networks and gradient boosting was proposed to predict and optimize the performance of biogas plants [18]. The use of open datasets allows for the comparison of experimental results obtained from different studies and the verification of the reproducibility of developed models [19,20]. In this work, Lab-on-Chip (LoC) technology integrates various analyses on a single chip, such as biochemical operations, chemical synthesis, and DNA sequencing, which would otherwise be performed in a laboratory and take considerable time [21].
Despite significant advances in IoT monitoring, microfluidic technologies, biosensor platforms, and machine learning methods, many existing studies investigate these components separately. The integration of multisensor analysis, lab-on-a-chip technologies, cloud data processing, and intelligent algorithms into a unified decision-making support system remains largely unexplored. Furthermore, existing platforms rarely offer the possibility of subsequent expansion into full-fledged biosensing systems by integrating biological recognition elements.
The aim of this study is to develop an intelligent multi-sensor “lab-on-a-chip” platform for monitoring biogas parameters and analyzing experimental data using machine learning methods. The proposed architecture integrates gas, liquid, and optical sensors, a microcontroller-based IoT platform, cloud data processing, and an intelligent analysis algorithm. The article compares experimental results with open datasets, examines the relationships between the monitored parameters, and assesses the suitability of using modern machine learning models for predicting biogas quality.
2. Materials and Methods
2.1. Platform Architecture
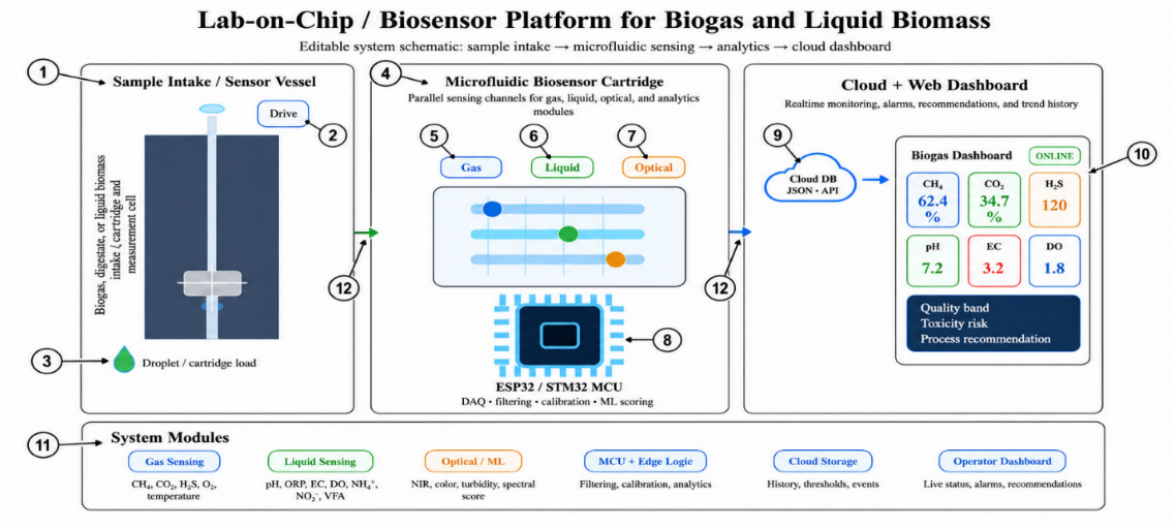
In this study, an experimental dataset obtained using a multi-sensor Lab-on-Chip/biosensor platform for rapid analysis was used as the primary focus for the analysis of small samples of biogas, biomass, and bio-mixtures. The research methodology is focused on the collection, pre-processing, intelligent analysis, and comparative evaluation of multi-sensor data, utilizing in-house experimental measurements and open data sources related to anaerobic digestion and biogas processes. The experimental platform is based on a multi-sensor approach, where the analyzed biogas or bio-digestate sample passes through a microfluidic sensor cartridge.
Figure 1.
Architecture of the multisensor Lab-on-Chip platform.
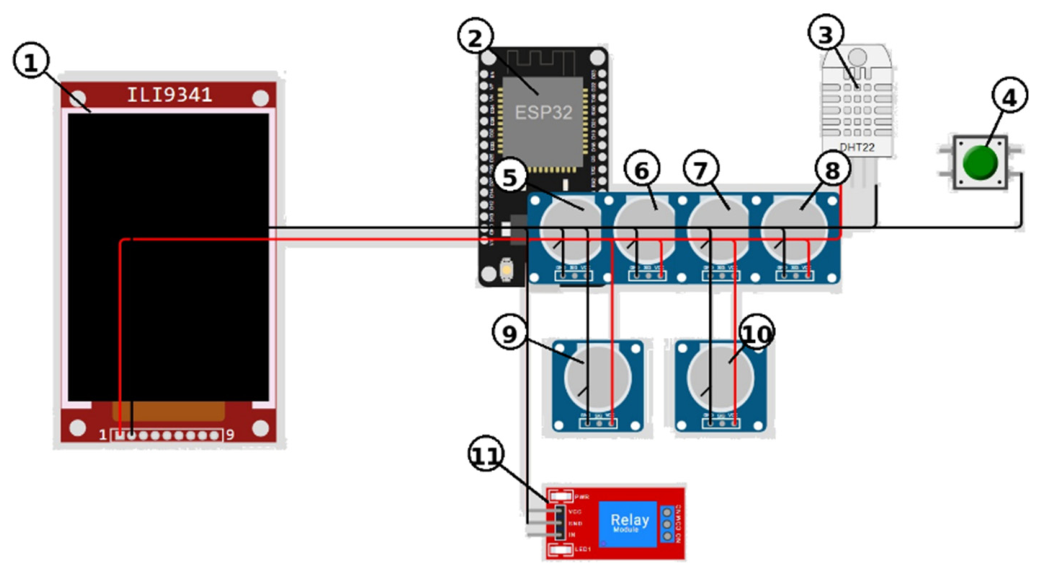
The hardware prototype is based on the ESP32 microcontroller, chosen for its integrated Wi-Fi connectivity, low power consumption, low cost, and compatibility with both analog and digital sensors [22]. The controller received the sensor’s output signals, performed initial range checks and filtering, temporarily stored measurements in a local buffer, and sent the verified records to the cloud database. An ILI9341 TFT display was used for local visualization, a DHT22 sensor recorded ambient temperature and relative humidity, a manually operated button provided local control, and a relay module enabled switching of an external load.
Four gas analysis channels were assigned to CH4, CO2, H2S, and O2. During hardware integration, two analog liquid channels were used to emulate typical liquid sensor output signals such as pH, EC, or ORP. In the final experimental configuration, these emulators must be replaced with the real, calibrated sensor modules used to generate the provided dataset.
Figure 2.
Hardware diagram of the ESP32 experimental platform: (1) ILI9341 TFT display; (2) ESP32 controller; (3) DHT22 temperature/humidity sensor; (4) control button; (5–8) gas sensor channels; (9–10) analog liquid sensor channels; and (11) relay module.
Figure 2.
Hardware diagram of the ESP32 experimental platform: (1) ILI9341 TFT display; (2) ESP32 controller; (3) DHT22 temperature/humidity sensor; (4) control button; (5–8) gas sensor channels; (9–10) analog liquid sensor channels; and (11) relay module.
The technical specifications of the required sensors to ensure repeatability of the results should be provided in Table 1.
2.2. Data Collection and Cloud Uploading
Data collection was conducted in a periodic monitoring mode. Each measurement cycle included records of the gas, liquid, and auxiliary parameters. For each time point, a measurement vector was created:
where is the parameter vector at a given time, is the temperature, is the pressure, is the dissolved oxygen, is the volatile fatty acids, and is the volatile oil. The acquired data were stored in the microcontroller’s local buffer and subsequently sent to a cloud database for storage, visualization, and analysis.
To increase the reliability of the analysis, temporal data aggregation was used. Depending on the parameter, the data were grouped into 6-hour, 12-hour, and 1-day intervals. The average daily value of the parameter was calculated using the following formula:
where is the daily average of the parameter, is the number of daily measurements, and is the value of the parameter at a specific time .
Before data mining, the dataset underwent preprocessing. This included removing invalid timestamps, converting string values to numeric format, checking for missing data, filtering outliers, and normalizing parameters. Min-max normalization was used to compare parameters with different units of measurement and ranges of values:
where is the normalized value, is the original value of the parameter, and are the minimum and maximum values of the corresponding parameter in the sample.
The z-score method was used to detect outliers:
where is the standardized value, is the mean value of the parameter, is the standard deviation, and are the values considered as potential deviations and further analyzed from a process engineering perspective.
An open dataset published in the Mendeley Data repository and other open sources was used for comparison with the obtained experimental data. This dataset includes information on biogas production, gas phase composition, temperature, pressure, pH, weather conditions, substrate characteristics, and anaerobic digestion parameters. The use of this dataset allowed us to compare the experimental results of the Lab-on-Chip platform with previously published measurements and to assess the reproducibility of the identified patterns [23,24].
A comparative analysis was conducted using common parameters available in the experimental and open datasets. Specifically, the concentrations of CH4, CO2, O2, H2S, pH, and temperature were compared. Mean values, standard deviations, and coefficients of variation were used to assess the differences between the datasets:
where is the coefficient of variation, is the standard deviation, is the mean value of the parameter, and is the parameter’s standard deviation. This metric allowed us to assess the stability of the measured parameters and to compare the degree of variation in our experimental dataset with that in the open data.
Correlation analysis was used to determine the relationship between the biogas quality parameters. The Pearson correlation coefficient was calculated using the following formula:
where , and are the correlation coefficients between the parameters, and , and are the mean values of the corresponding parameters. Special attention was paid to the correlations between CH4 and CO2, H2S and pH, O2 and CH4, as well as between temperature and biogas production. Such correlations allow for the detection of signs of imbalance in the anaerobic process and the identification of the parameters that have the most significant impact on biogas quality.
Machine learning and time series analysis methods were used for the intelligent analysis of the multi-sensor dataset. Random Forest, Gradient Boosting, XGBoost, Support Vector Regression, artificial neural networks, and LSTM models were considered as the main models. These methods are widely used in modern anaerobic digestion studies for predicting biogas yield, methane concentration, and detecting unstable process conditions [2,3].
For the methane concentration prediction task, the following model was used:
where is the predicted value of methane concentration at the next time step, and is a machine learning function based on experimental and comparative data.
The quality of the models was evaluated using MAE, RMSE, and the coefficient of determination metrics:
where is the actual value, is the predicted value, and is the mean of the actual observations.
Anomaly detection methods were used to detect process instability at an early stage. Deviations were identified based on specified thresholds and statistical criteria. For each time interval, an integrated process imbalance risk indicator was calculated:
where is the overall imbalance risk, are the specific risks for individual parameters,, and w are weighting factors. The R value was used to classify process conditions as normal, warning, and critical.
A comprehensive quality indicator was introduced to provide a thorough assessment of the biogas condition:
where is the biogas quality index, are the normalized values of the corresponding parameters,, and are the weighting factors. A higher index value corresponds to more stable and energy-rich biogas. A high CH4 concentration positively affects the index, while high concentrations of H2S, O2, and CO2 decrease the final score.
Data processing was carried out using the Python programming language and the pandas, NumPy, scikit-learn, and matplotlib libraries. To visualize the time series, graphs of the average daily pH, CH4, CO2, H2S, and O2 values were created. Statistical tables, correlation matrices, and trend plots were used to comparatively analyze the experimental dataset with open data.
The software logic on the ESP32 microcontroller included reading sensor data, noise filtering, sending information via Wi-Fi, and transmitting data to a cloud database. This architecture aligns with modern approaches for monitoring biogas reactors using IoT and can be scaled to laboratory, pilot, and industrial facilities [6,10].
The proposed methodology involves collecting experimental data using lab-on-a-chip technology, It integrates data transmission via the Internet of Things (IoT), cloud storage, preprocessing, comparative analysis with open datasets, and machine learning methods. This approach enables a comprehensive assessment of biogas quality, identifies process deviations, and serves as a foundation for the further development of an intelligent decision support system.
development of a multisensory “lab-on-a-chip” platform. The proposed architecture provides a technological foundation for the subsequent introduction of bioreceptor modules and the development of a fully functional next-generation biosensing system.
Figure 3 shows the current multisensor lab-on-a-chip platform, where the gas, liquid, and optical sensor modules send data to the ESP32/STM32 processor. The biosensor layer is shown separately; which can be integrated into a future version of the platform to transition from a multisensor analytical system to a full-fledged biosensor system. The cartridge has functional areas for gas, liquid, and optical analysis. The gas module is for measuring CH4, CO2, H2S, and O2 concentrations, as well as temperature and pressure. The liquid module is used to record pH, ORP, conductivity, dissolved oxygen, NH4+, NO3−, and volatile fatty acids. The optical module allows for the acquisition of additional parameters such as turbidity, color index, optical density, and near-infrared properties. This multiplexed approach is in line with current trends in the development of biosensors and lab-on-a-chip systems used for the analysis of biotechnological and fermentation processes [23,24,25,26].
3. Results
As a result of the study, a multisensor “lab-on-a-chip” platform for the comprehensive monitoring of biogas and liquid biomass parameters during anaerobic digestion was developed and experimentally tested. The developed system continuously collected and recorded data on methane (CH4), carbon dioxide (CO2), hydrogen sulfide (H2S), and oxygen (O2) concentrations, as well as pH, temperature, and other process parameters. The obtained experimental data were processed, systematized, and compared with published results and open datasets, which allowed for a comparative analysis of the characteristics of the anaerobic digestion process.
A preliminary analysis of the time series showed that during stable operation periods of the bioreactor, the methane concentration tended to increase, while the rise in oxygen and hydrogen sulfide levels was accompanied by a deterioration in biogas quality. Furthermore, pH changes significantly affected the rate of methanogenesis, confirming the close relationship between the physicochemical parameters of the anaerobic process and the efficiency of biogas production.
To assess the reliability of the experimental results, the obtained data were compared with published studies and open databases on the performance of biogas plants. A comparative analysis showed that the concentrations of CH4, CO2, and pH corresponded to ranges typical of steady-state anaerobic digestion. However, the differences in H2S and O2 concentrations may be due to differences in the composition of the initial biomass, the operating mode of the bioreactor, temperature conditions, the characteristics of the sensors used, as well as differences in measurement methods and equipment calibration.
A comparative statistical analysis of the main indicators of biogas quality was conducted to objectively assess the degree of correspondence between experimental results and data presented in open sources. The comparison criteria included the mean values of the parameters studied, their ranges of variation, and deviations from the typical values reported in the scientific literature. This approach allowed us to assess the correspondence between experimental data and published results and to identify the parameters most sensitive to changes in anaerobic digestion conditions, initial substrate composition, and bioreactor operating mode. It should be noted that this comparative analysis is not an independent metrological validation procedure for the measurement system, but rather serves as an additional tool for assessing the repeatability and comparability of the experimental data obtained. The results of the comparative analysis are presented in Table 2.
Table 2 shows that the experimental data generally agree with the open-source data, confirming the reliability of the measurements taken by the developed system and its suitability for monitoring biogas production processes. However, to gain a deeper understanding of the bioreactor’s behavior, it is insufficient to consider only the average values of individual parameters. It is important to identify the relationships between the monitored parameters, as changes in one parameter can directly or indirectly affect other biogas quality characteristics. Therefore, in the next step, a correlation analysis was conducted to determine the degree of interdependence among the concentrations of CH4, CO2, H2S, O2, pH, and temperature. The results of this analysis are presented in Table 3.
The most important conclusion from the experimental data is the very strong dependence of CH4 concentration on temperature – r = 0.951, so the temperature regime is the main factor in the experimental dataset studied. The obtained modeling results show that machine learning methods can effectively predict changes in methane concentration and estimate the probability of process deviation. However, to interpret the bioreactor’s performance, it is important to consider not only the predicted CH4 value but also the combined dynamics of all key biogas quality parameters. pH, CH4, The comprehensive visualization of biogas quality parameters allows for a visual assessment of the anaerobic process stability, identification of potential imbalance periods, and determination of which parameters change synchronously or, conversely, exhibit opposing trends. Therefore, to visualize the overall performance of the Lab-on-a-Chip platform, a combined time-history graph of the main biogas quality parameters was created, as shown in Figure 4.
The most important conclusion from the experimental data is the very strong dependence of CH4 concentration on temperature – r = 0.951, so the temperature regime is the main factor in the experimental dataset studied. The obtained modeling results show that machine learning methods can effectively predict changes in methane concentration and estimate the probability of process deviation. However, to interpret the bioreactor’s performance, it is important to consider not only the predicted CH4 value but also the combined dynamics of all key biogas quality parameters. pH, CH4, The comprehensive visualization of biogas quality parameters allows for a visual assessment of the anaerobic process stability, identification of potential imbalance periods, and determination of which parameters change synchronously or, conversely, exhibit opposing trends. Therefore, to visualize the overall performance of the Lab-on-a-Chip platform, a combined time-history graph of the main biogas quality parameters was created, as shown in Figure 4.
Figure 4 shows the comprehensive time-series dynamics of the key biogas quality parameters recorded during bioreactor monitoring using the Lab-on-a-Chip platform. The graph combines the changes in pH, methane (CH4), carbon dioxide (CO2), hydrogen sulfide (H2S), and oxygen (O2) concentrations, allowing for a comprehensive assessment of the stability of the anaerobic process and the identification of correlations between the monitored parameters. The analysis of pH dynamics allows for the assessment of the stability of the acid-base balance and the identification of potential imbalance periods during methanogenesis. Changes in methane concentration indicate the efficiency of energy-rich biogas production and allow for the identification of stable stages of biomethane production, while the dynamics of CO2 describe the intensity of the anaerobic stages of organic substrate degradation and the formation characteristics of the gas mixture. The H2S concentration is considered an indicator of the biogas’s toxicity and potential corrosive properties, while monitoring the O2 content allows for the maintenance of anaerobic conditions inside the reactor. A combined analysis of all parameters reveals the nature of the changes in biogas quality over time, identifies critical intervals for process regime deviations, and provides a basis for intelligent analysis of the bioreactor’s condition and subsequent prediction of process efficiency. Furthermore, to validate the reliability of the experimental data obtained, it is important to compare the results of the Lab-on-a-Chip platform with open-source and published datasets. This comparison allows us to assess the extent to which the experimental methane concentration dynamics correspond to typical models of biogas formation processes, as well as to identify specifics related to the platform’s design, biomass composition, and experimental conditions. The results of the comparison between the experimental and open data sets for methane concentration are shown in Figure 5.
Figure 5 shows the comparison of data from the Lab-on-a-Chip platform and the open dataset, which allows us to assess the degree of consistency and reproducibility of the results. This comparison confirms that the experimental methane concentration values can be used for further intelligent analysis and comparison with global data on biogas formation processes. However, to gain a deeper understanding of the internal structure of the experimental dataset, it is necessary to identify not only the correspondence with external sources but also the relationships among the observed parameters themselves. Therefore, in the next step, CH4, A correlation matrix showing the degree of association between CH4, Figure 6. Correlation matrix of biogas quality parameters. CO2, H2S, O2, pH, and temperature was constructed. This analysis makes it possible to identify the parameters that have the most significant impact on biogas quality and the stability of the anaerobic process.
Figure 6 shows the relationships among the main process parameters, including CH4, CO2, H2S, O2, pH, and temperature. The resulting correlations allow for the identification of the most significant factors affecting methane production and the stability of anaerobic digestion. However, the correlation matrix only shows the statistical relationships between the parameters and does not provide the ability to predict the future state of the process. Therefore, in the next step, machine learning methods were applied to the multi-sensor data to predict methane concentration based on the combined effects of pH and temperature. CO2, H2S, O2, Machine learning methods were applied to the multi-sensor data to predict methane concentration based on the combined effects of pH and temperature. The results of the methane concentration prediction are shown in Figure 7.
Figure 7 shows a comparison of the actual and predicted methane values obtained using different artificial intelligence models. This result confirms the suitability of using machine learning to analyze data from multiple sensors and predict the main energy component of biogas. However, for practical bioreactor control, it is important to assess methane concentration not only as a single indicator but also to evaluate the overall state of the entire process. Therefore, in the next step, CH4, An integrated quality index for biogas was calculated, taking into account the combined effects of CH4, CO2, H2S, O2, and pH, as well as the risk level of anaerobic process imbalance. This allows for a shift from single-parameter point prediction to a comprehensive assessment of the bioreactor’s operational stability.
Figure 8 shows the variation of the integral index of biogas quality and the degree of process instability risk at different monitoring stages.
confirms the suitability of using the developed lab-on-a-chip platform for the intelligent analysis of multi-sensor biogas data and demonstrates its application for monitoring, forecasting, and comparative assessment of technological processes based on open data. One of the advantages of the proposed lab-on-a-chip architecture is its potential compatibility with biosensing technologies. Future developments may include the integration of enzymatic biosensors for monitoring volatile fatty acids, microbial biosensors for assessing process activity, and aptamer-based sensing elements for the selective detection of biochemical markers. Such extensions will further expand the platform’s analytical capabilities and increase its relevance for biosensing monitoring systems.
4. Conclusions
As a result, the analysis of the experimental data showed that the developed multisensor system makes it possible to detect changes in the process conditions and track the relationships between process parameters. According to the results of a comparative analysis of statistical characteristics, the pH and temperature values fell within the ranges typical of steady-state anaerobic digestion, whereas variations in the concentrations of and reflected the dynamics of the biochemical stages of organic substrate decomposition and the operational characteristics of the bioreactor. A comparison of the results with open-access data sources confirmed the feasibility of using the experimental dataset for a comparative assessment of biogas process efficiency and the subsequent scaling up of the proposed approach.
The results of the correlation analysis revealed the existence of relationships between biogas quality parameters. The most pronounced positive correlation was found between temperature and methane concentration, confirming the importance of maintaining a stable temperature regime for efficient methanogenesis. At the same time, analysis of oxygen and hydrogen sulfide concentrations demonstrated the potential to use these parameters as indicators of deviations from the operating regime and potential imbalances in the anaerobic process.
The use of machine learning methods enabled the prediction of methane concentration and an assessment of the potential for intelligent interpretation of multidimensional sensor data. The results showed that artificial intelligence models are capable of describing nonlinear relationships between controlled parameters and providing high prediction accuracy, which lays the foundation for the transition from monitoring to intelligent control of biogas plants.
The scientific novelty of this research lies in the integration of a multisensor Lab-on-Chip platform, Internet of Things (IoT) technologies, an experimental dataset, open-source data, and intelligent analysis methods into a unified system for assessing biogas quality. Unlike existing solutions, which focus primarily on individual parameters or local monitoring, the proposed approach provides comprehensive processing of the process’s gas, liquid, and technological characteristics, with the capability for remote monitoring and subsequent intelligent data interpretation.
Author Contributions
Conceptualization, A. Kozbakova, O. Auelbekov; methodology, O. Auyelbekov, A. Kozbakova, K.Yessentayev; writing—original draft preparation A. Kozbakova, O. Auelbekov, K.Yessentayev and K.Igibayev; writing—review and editing A. Kozbakova, O. Auelbekov, K.Yessentayev and K.Igibayev; software K.Yessentayev and K.Igibayev; formal analysis, O. Auyelbekov, K.Igibayev; Data curation A. Kozbakova, K. Igibayev; visualization, K. Yessentayev, and K. Igibayev; supervision, A. Kozbakova and O. Auyelbekov. All authors have read and agreed to the published version of the manuscript.
Funding
The work was supported by a grant and funding from the Ministry of Science and Higher Education of the Republic of Kazakhstan within the framework of the Project №AP23490744, Institute Information and Computational Technologies CS MSHE RK.
Data Availability Statement
Not applicable.
Conflicts of Interest
Not applicable.
Acknowledgments
The work was supported by grant funding from the Science Committee of the Ministry of Science and Higher Education of the Republic of Kazakhstan (AP23490744).
References
- Cruz, I.A.; Andrade, L.R.S.; Bharagava, R.N.; Nadda, A.K.; Bilal, M.; Figueiredo, R.T.; Ferreira, L.F.R. An overview of process monitoring for anaerobic digestion. Biosyst. Eng. 2021, 207, 106–119. [Google Scholar] [CrossRef]
- Cruz, I.A.; Chuenchart, W.; Long, F.; Surendra, K.C.; Andrade, L.R.S.; Bilal, M.; Liu, H.; Figueiredo, R.T.; Khanal, S.K.; Ferreira, L.F.R. Application of machine learning in anaerobic digestion: Perspectives and challenges. Bioresour. Technol. 2022, 345, 126433. [Google Scholar] [CrossRef] [PubMed]
- Issahaku, M.; Derkyi, N.S.A.; Kemausuor, F. An assessment of a solar PV-powered IoT monitoring system for small-scale biogas digesters. Discov. Internet Things 2025, 5, 122. [Google Scholar] [CrossRef]
- Röhlen, D.L.; Pilas, J.; Dahmen, M.; Keusgen, M.; Selmer, T.; Schöning, M.J. Toward a Hybrid Biosensor System for Analysis of Organic and Volatile Fatty Acids in Fermentation Processes. Front Chem. 2018, 6, 284. [Google Scholar] [CrossRef] [PubMed] [PubMed Central]
- Kalamaras, S.D.; Tsitsimpikou, M.-A.; Tzenos, C.A.; Lithourgidis, A.A.; Pitsikoglou, D.S.; Kotsopoulos, T.A. A Low-Cost IoT System Based on the ESP32 Microcontroller for Efficient Monitoring of a Pilot Anaerobic Biogas Reactor. Appl. Sci. 2025, 15, 34. [Google Scholar] [CrossRef]
- Yildirim, O.; Ozkaya, B. Prediction of biogas production of industrial scale anaerobic digestion plant by machine learning algorithms. Chemosphere 2023, 335, 138976. [Google Scholar] [CrossRef] [PubMed]
- Rutland, H.; You, J.; Liu, H.; Bull, L.; Reynolds, D. A Systematic Review of Machine-Learning Solutions in Anaerobic Digestion. Bioengineering 2023, 10, 1410. [Google Scholar] [CrossRef] [PubMed]
- Rudakov, V.; Merembayev, T.; Amirgaliyev, Y.; Omarova, P. Time Series Analysis of Biogas Monitoring with Deep Learning Approaches. In Proceedings of the 2023 5th International Conference on Problems of Cybernetics and Informatics (PCI), Baku, Azerbaijan, 28–30 August 2023; pp. 1–4. [Google Scholar] [CrossRef]
- Mulat, Daniel. “Process monitoring and weather datasets on farm-scale biogas digesters”. Mendeley Data 2025, V1. [Google Scholar] [CrossRef]
- Li, C.; He, P.; Peng, W.; Lü, F.; Du, R.; Zhang, H. Exploring available input variables for machine learning models to predict biogas production in industrial-scale biogas plants treating food waste. J. Clean. Prod. 2022, Volume 380. [Google Scholar] [CrossRef]
- Marycz, M.; Turowska, I.; Glazik, S.; Jasiński, P. Artificial Intelligence in Anaerobic Digestion: A Review of Sensors, Modeling Approaches, and Optimization Strategies. Sensors 2025, 25, 6961. [Google Scholar] [CrossRef] [PubMed]
- Wijayanti, S.D.; Tsvik, L.; Haltrich, D. Recent Advances in Electrochemical Enzyme-Based Biosensors for Food and Beverage Analysis. Foods 2023, 12, 3355. [Google Scholar] [CrossRef] [PubMed]
- Wu, Di; Liu, Huiliang; Xing, Tao; Xiao, Fan; Liu, Yuan; Zhen, Feng; Sun, Yongming. An integrated evaluation strategy for anaerobic digestion monitoring based on acid-base balance and thermodynamics of volatile fatty acid degradation. Chem. Eng. J. 2024, Volume 486. [Google Scholar] [CrossRef]
- Amirgaliyev, B.; Kozbakova, A.; Omarova, P.; Merembayev, T.; Amirzhan, K. Development and Experimental Study of an Intelligent Water Quality Monitoring System Based on the Internet of Things. Bull. Electr. Eng. Inform. 2025, 14, 761–773. [Google Scholar] [CrossRef]
- Kazemi, P.; Steyer, J.-P.; Bengoa, C.; Font, J.; Giralt, J. Robust Data-Driven Soft Sensors for Online Monitoring of Volatile Fatty Acids in Anaerobic Digestion Processes. Processes 2020, 8, 67. [Google Scholar] [CrossRef]
- Ganeshan, Prabakaran; Bose, Archishman; Lee, Jintae; Barathi, Selvaraj; Rajendran, Karthik. Machine learning for high solid anaerobic digestion: Performance prediction and optimization. Bioresour. Technol. 2024, Volume 400. [Google Scholar] [CrossRef] [PubMed]
- Onu; Mbohwa, C.; Pradhan, A. An analysis of the application of machine learning techniques in anaerobic digestion. 2023 International Conference on Control, Automation and Diagnosis (ICCAD), Rome, Italy, 2023; pp. 1–6. [Google Scholar] [CrossRef]
- Auyelbekov, O.; Kozbakova, A.; Yessentayev, K.; Merembayev, T.; Igibayev, K. Integration of Mathematical Modeling and Artificial Intelligence to Predict Thermal Conditions and Optimize the Operation of Biogas Plants. Eng. Sci. 2025, 36, 1603. [Google Scholar] [CrossRef]
- Mzobotshe, M.; Mukumba, P.; Tangwe, S.; Lethole, N.; Obileke, K. Performance Monitoring of Greenhouse Biogas Digester. ChemEngineering 2024, 8, 109. [Google Scholar] [CrossRef]
- Mockaitis, Gustavo. “Acidic and thermal pretreatments for anaerobic digestion inoculum to improve hydrogen and volatile fatty acids production using xylose as the substrate”. Mendeley Data 2025, V5. [Google Scholar] [CrossRef]
- Rubab Ali Lab-on-chip: principle, design, technology and diagnostic targets. J. Contemp. Pharm. 2020, 3(2), 49–64. [CrossRef]
- Ward, Alastair James; Bruni, Emiliano; Lykkegaard, Morten K.; Feilberg, Anders; Adamsen, Anders P.S.; Jensen, Anders P.; Poulsen, Allan K. Real time monitoring of a biogas digester with gas chromatography, near-infrared spectroscopy, and membrane-inlet mass spectrometry. Bioresour. Technol. 2011, Volume 102, Pages 4098–4103. [Google Scholar] [CrossRef] [PubMed]
- Zhang, P.; Zhang, T.; Zhang, J.; et al. A machine learning assisted prediction of potential biochar and its applications in anaerobic digestion for valuable chemicals and energy recovery from organic waste. Carb Neutrality 2024, 3, 2. [Google Scholar] [CrossRef]
- Ling, J.Y.X.; Chan, Y.J.; Chen, J.W.; et al. Machine learning methods for the modelling and optimisation of biogas production from anaerobic digestion: a review. Env. Sci. Pollut. Res. 2024, 31, 19085–19104. [Google Scholar] [CrossRef] [PubMed]
- Nemoto, S.; Tohno, T.; Nakakubo, M.; Yoshikawa, R.G. Measurement of Volatile Fatty Acids in Silage through Odors with Nanomechanical Sensors. Biosensors 2023, 13, 152. [Google Scholar] [CrossRef] [PubMed]
- Naveed, T.; Saad Khan, M.; Yasir, M.; Nanimina, A. M.; Mubashir, M. Experimental analysis and machine learning prediction of biomethane potential from organic food waste: lab-scale and semi pilot-scale approaches. Int. J. Sustain. Eng. 2025, 18(1). [Google Scholar] [CrossRef]
Figure 3.
Hybrid architecture of the multisensor lab-on-a-chip platform with separate data streams and a prospective bioreceptor module.
Figure 3.
Hybrid architecture of the multisensor lab-on-a-chip platform with separate data streams and a prospective bioreceptor module.
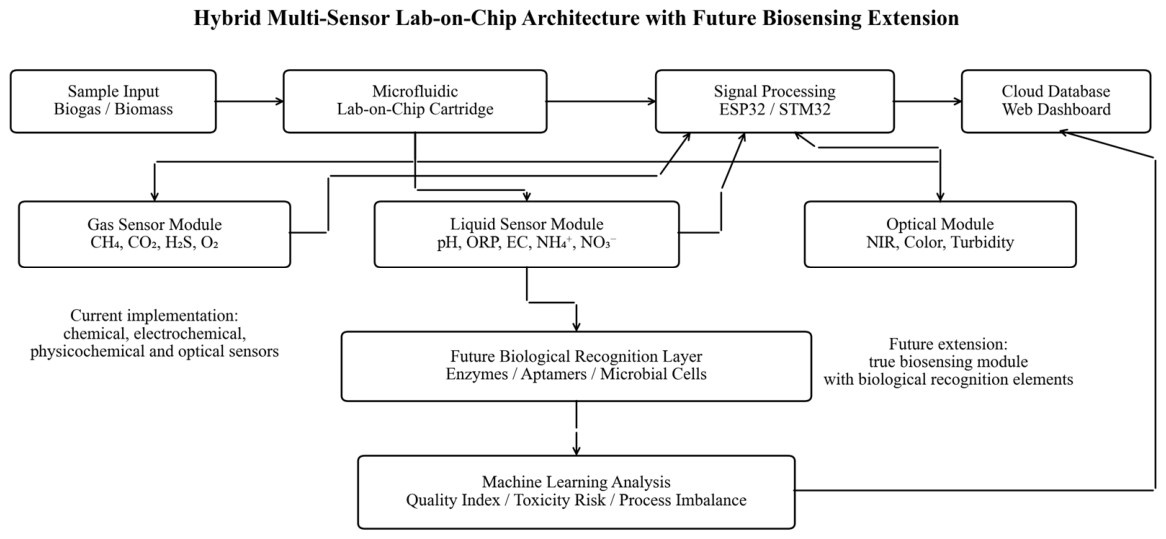
Figure 4.
Comprehensive dynamics of biogas quality parameters (pH, CH4, CO2, H2S, and O2) in the experimental dataset of the Lab-on-a-Chip platform during bioreactor monitoring.
Figure 4.
Comprehensive dynamics of biogas quality parameters (pH, CH4, CO2, H2S, and O2) in the experimental dataset of the Lab-on-a-Chip platform during bioreactor monitoring.
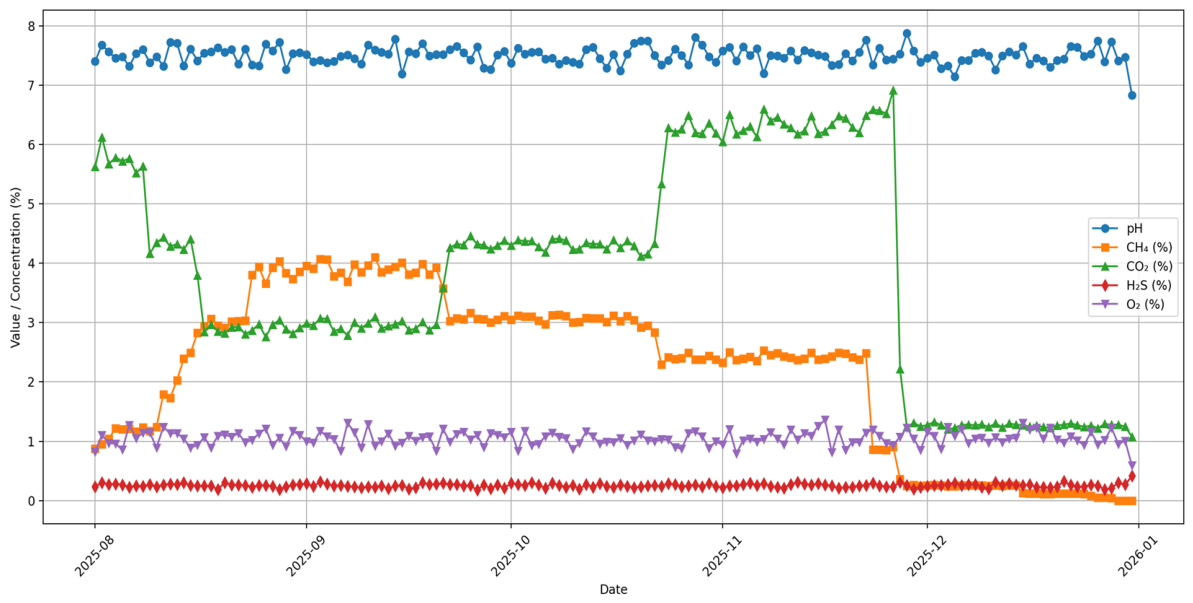
Figure 5.
Comparison of experimental and open data on methane concentration.
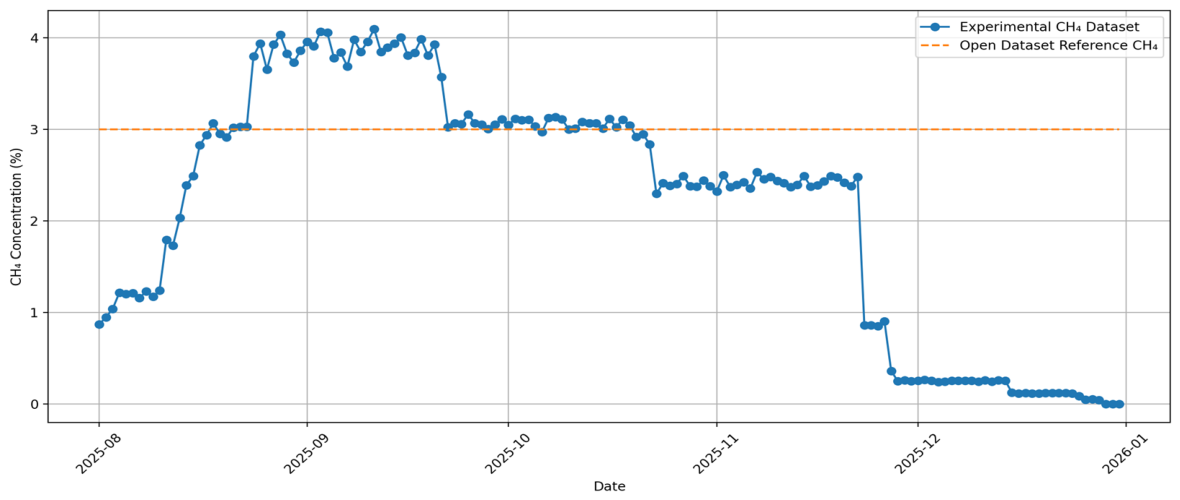
Figure 6.
Correlation matrix of biogas quality parameters.
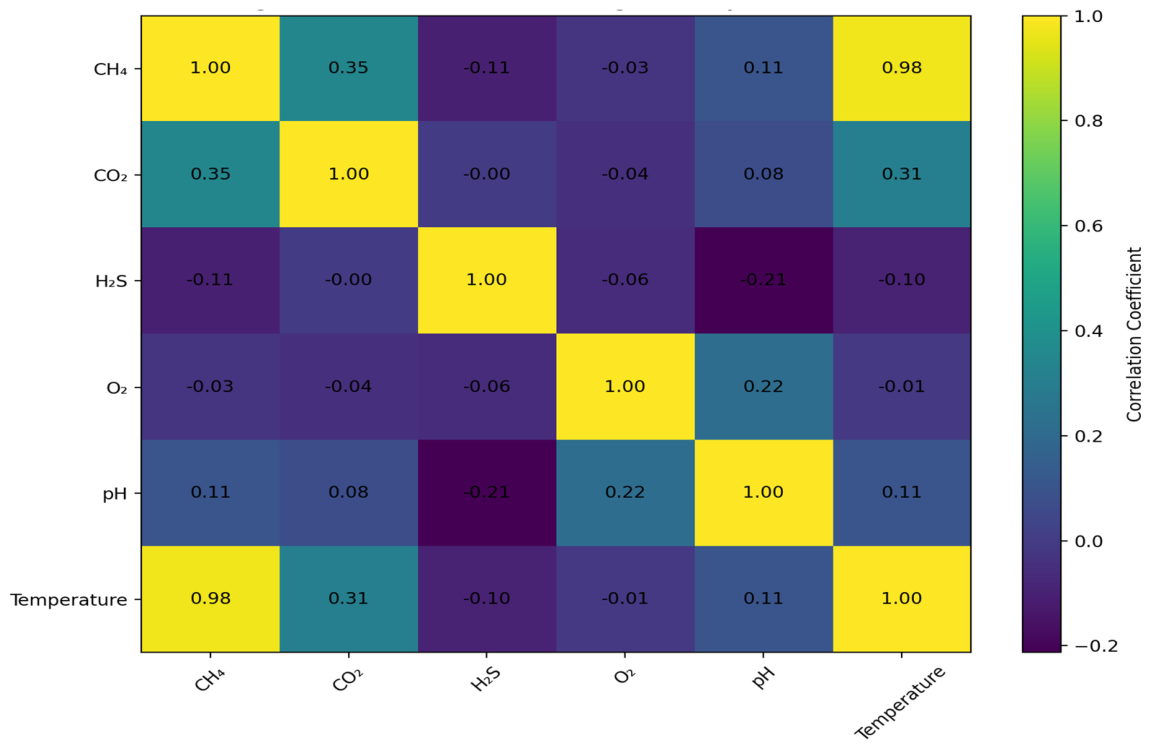
Figure 7.
Methane concentration prediction results using machine learning methods.
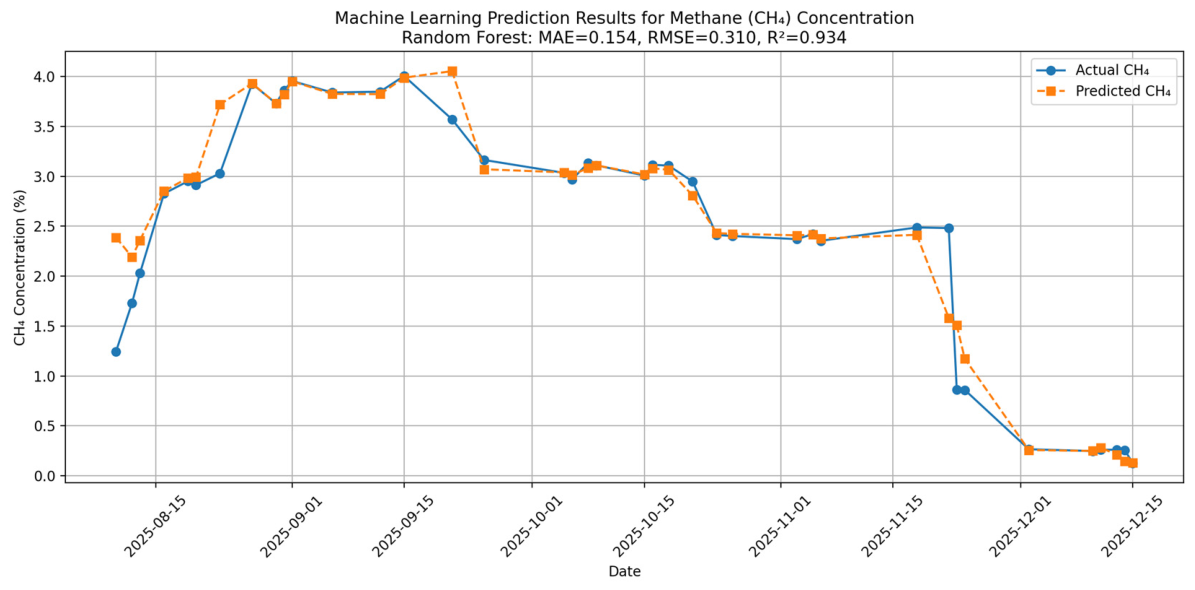
Figure 8.
The integral index of biogas quality and the risk level of process imbalance.
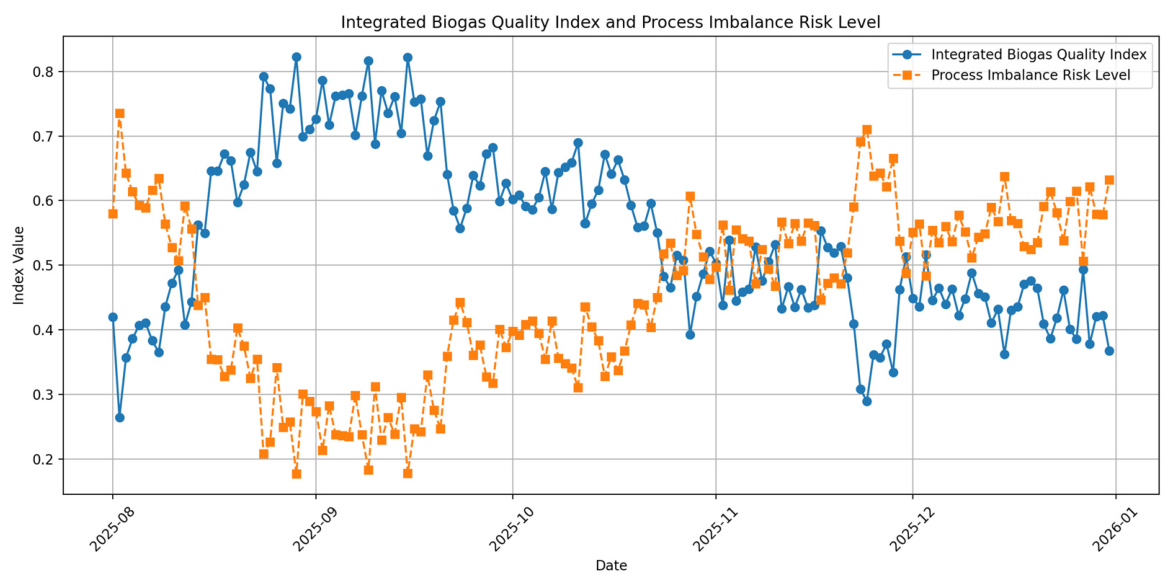

Table 1.
Sensor Technical Specifications.
| Variable | Sensor/Model | Manufacturer | Distance | Accuracy | Calibration |
| CH4 | Methane Sensor MQ-4 | Vincent Electronics, Zhengzhou, China | 300–10 000 ppm CH4 | ±5% FS | Before a series of experiments, calibration is performed using a CH4 standard gas mixture (1000 ppm). |
| CO2 | MH-Z19B NDIR CO2 Sensor | Vincent Electronics, Zhengzhou, China | 0–5000 ppm | ±(50 (ppm + 5% of reading)) | Automatic calibration and verification of the ABC system using the CO2 reference gas mixture |
| H2S | ZE03-H2S Electrochemical Sensor | Vincent Electronics, Zhengzhou, China | 0–100 ppm | ±3% FS | Measurements must be calibrated using a standard H2S mixture before use. |
| O2 | Electrochemical ME2-O2 Sensor | Vincent Electronics, Zhengzhou, China | 0–25% vol. | ±0.5% vol. | Two-point calibration (atmospheric air and zero point) |
| pH | Gravimetric Analog pH Sensor V2 | DFRobot, Shanghai, China | pH 0–14 | ±0.1 pH | Before each experiment, buffer solutions with pH values of 4.00, 7.00, and 10.00 were used. |
| ORP / EK / DO | V2 gravity ORP sensor; Gravity conductivity K=1.0; Gravity dissolved oxygen sensor | DFRobot, Shanghai, China | ORP: ±2000 mV; EC: 1–20 mS/cm; DO: 0–20 mg/L | ORP: ±10 mV; EC: ±5%; DO: ±0.2 mg/L | Before experiments, calibration is performed using standard solutions of ORP, conductivity, and oxygen-saturated water. |
| Temperature / Relative Humidity | DHT22 (AM2302) | Aosong Electronics, Guangzhou, China | -40…80 °C; 0–100% relative humidity | ±0.5 °C; ±2% relative humidity | Before starting the experiments, the readings must be checked with a standard thermohygrograph. |
Table 2.
Comparative analysis of the statistical characteristics of the experimental and open datasets.
Table 2.
Comparative analysis of the statistical characteristics of the experimental and open datasets.
| Parameter | Mean data on the chip obtained from the experimental laboratory. |
Open/ literature range |
Explanation |
| CH4 (%) | 2.217 | 50–70 | A value below the normal range indicates that the sensor needs to be calibrated or recalibrated. |
| CO2 (%) | 3.843 | 30–45 | If the value is below the normal range, the data may be presented on a generally accepted scale. |
| H2S (%) | 0.254 | 0.01–0.5 | The value is within the appropriate experimental range. |
| O2 (%) | 1.048 | < 2.0 | Consistent with anaerobic conditions. |
| pH | 7.498 | 6.8–7.8 | Conditions are very favorable for methanogenesis. |
| °C | 33.312 | 30–40 | Consistent with mesophilic conditions |
Table 3.
Correlation analysis of biogas quality parameters.
| Parameters | Correlation coefficient | Interpretation of the relationship |
| CH4 – CO2 | 0.361 | Moderately positive correlation |
| CH4 – O2 | -0.007 | In practice, there is no connection. |
| CH4 – H2S | -0.017 | Very weak feedback |
| CH4 – pH | 0.009 | There is practically no correlation. |
| CH4 – Temperature | 0.951 | Very strong positive correlation |
| CO2 – Temperature | 0.286 | Weak positive correlation |
| H2S – pH | -0.010 | Very weak negative correlation |
| O2 – Temperature | -0.011 | In practice, there is no correlation. |
Disclaimer/Publisher’s Note: The statements, opinions and data contained in all publications are solely those of the individual author(s) and contributor(s) and not of MDPI and/or the editor(s). MDPI and/or the editor(s) disclaim responsibility for any injury to people or property resulting from any ideas, methods, instructions or products referred to in the content. |
© 2026 by the authors. Licensee MDPI, Basel, Switzerland. This article is an open access article distributed under the terms and conditions of the Creative Commons Attribution (CC BY) license.
Copyright: This open access article is published under a Creative Commons CC BY 4.0 license, which permit the free download, distribution, and reuse, provided that the author and preprint are cited in any reuse.


