
Submitted:
04 August 2026
Posted:
06 August 2026
You are already at the latest version
Abstract
Background: How spontaneously breathing individuals modulate inspiratory pressure and peak inspiratory flow (PIF) during incremental positive end-expiratory pressure (PEEP) loading, and whether this differs across respiratory phenotypes, are incompletely characterised. Methods: In a secondary analysis of a public dataset, 78 volunteers (Normal, Asthmatic, Smoker, Vaper) underwent PEEP titration from 4.0 to 12.0 cmH₂O in 0.5 cmH₂O steps. Per-breath mask inspiratory pressure swing (MIPS), PIF, and an exploratory flow-effort ratio (FER = PIF/MIPS) were analysed with PEEP-random-slope mixed-effects models; three electrical impedance tomography (EIT) metrics (pendelluft, Center of Ventilation, Global Inhomogeneity) provided a mechanistic assessment. Results: PIF increased with PEEP across all cohorts (β= +0.068 L·s⁻¹·cmH₂O⁻¹, 95% CI 0.064–0.072, p < 0.001; +68% over the range) and persisted after adjustment for respiratory rate and duty cycle (Ti/Ttot), whereas MIPS increased modestly (β= +0.026, p= 0.004). Asthmatic and Vaper subjects showed significantly steeper PIF responses than Normal subjects (interaction p=0.005 and 0.002, respectively). FER rose uniformly (β= +0.023, p < 0.001), and all EIT metrics were phenotype-independent (no cohort × PEEP interaction, p ≥ 0.35). Conclusions: Progressive PEEP loading raises PIF disproportionately to mask pressure swing, with phenotype-independent regional ventilation, supporting a global mechanism, though regional contributions cannot be excluded.
Keywords:
positive end-expiratory pressure
; peak inspiratory flow
; inspiratory effort
; flow-effort ratio
; respiratory phenotype
; mixed-effects model
; airway mechanics
; electrical impedance tomography
; pendelluft
; ventilation distribution
1. Introduction
Positive end-expiratory pressure (PEEP) is a fundamental tool in respiratory medicine, used to maintain end-expiratory lung volume (EELV) and improve oxygenation [1,2]. In mechanically ventilated patients, the pulmonary mechanical and haemodynamic consequences of PEEP have been extensively studied [2,3]. In contrast, the breath-by-breath pressure-flow dynamics of spontaneously breathing subjects wearing a threshold PEEP valve — a flow-independent threshold resistor that maintains a set positive end-expiratory pressure during spontaneous breathing, used in pulmonary rehabilitation, weaning, and physiological research — remain less well characterised.
When applied PEEP is increased, several mechanical events occur simultaneously: EELV rises, the inspiratory muscles begin from a higher lung volume, and the threshold opening pressure of the PEEP valve increases in proportion to the applied load. According to the classic length-tension relationship of skeletal muscle, operation at higher lung volumes shortens the diaphragm and accessory inspiratory muscles, placing them on a less favourable segment of their length-tension curve [4].
Conversely, higher lung volumes also dilate intrathoracic airways through radial traction, potentially reducing inspiratory resistance [5]. The net effect on inspiratory flow and pressure generation remains uncertain in heterogeneous populations, and it is further unclear whether any observed PIF changes simply reflect PEEP-induced redistribution of breathing pattern (e.g., slower rate, longer inspiratory time) rather than a true mechanical gain.
Peak inspiratory flow (PIF) is a clinically relevant parameter whose determinants include respiratory drive, airway calibre, and respiratory muscle strength [6]. In spontaneously breathing subjects, instantaneous inspiratory flow is predominantly governed by the balance between driving pressure and airway resistance, the resistive term of the equation of motion [7]. If PEEP raises end-expiratory lung volume and thereby dilates intrathoracic airways, inspiratory resistance could decrease; combined with approximately maintained driving pressure, this would yield higher PIF and a higher ratio of PIF to mask inspiratory pressure swing (MIPS), here termed the flow-effort ratio (FER). However, the measured signal (mask pressure) also includes contributions from the PEEP valve threshold, upper-airway mechanics, and elastic driving pressure, so any observed increase in the flow-effort ratio cannot be attributed exclusively to lower-airway resistance reduction. A second important alternative to a global airway-mechanics explanation is regional ventilation redistribution: PEEP could improve flow per unit effort by recruiting previously hypoventilated lung regions, by relieving pendelluft (gas oscillating between regions with different time constants [8]), or by shifting the Center of Ventilation. Electrical impedance tomography (EIT) provides non-invasive regional measures — pendelluft fraction (FRIC), Center of Ventilation (CoV), and the Global Inhomogeneity (GI) index [9,10] — that allow these regional hypotheses to be tested in the same subjects. The direction and magnitude of the net pressure-flow effect across different respiratory phenotypes — including asthmatic and smoking-exposed individuals whose airways are structurally and functionally different from healthy controls — have not been systematically quantified.
The present study used a previously published open-access dataset comprising 80 spontaneously breathing adults from four exposure groups (Normal, Asthmatic, Smoker, Vaper) who underwent incremental PEEP titration in 0.5 cmH₂O steps (4.0–12.0 cmH₂O) [11]. We extracted per-breath MIPS (a proxy for inspiratory muscle effort), the inspiratory time-pressure product (TPP), PIF, and the flow-effort ratio (FER) from airway pressure and flow waveforms, and complementary EIT-derived FRIC, CoV, and GI from the simultaneously recorded pixel impedance signals.
We tested the following hypotheses:
Primary
- PIF increases with incremental PEEP.
- The PIF increase is disproportionate to any change in MIPS (i.e., not driven by proportionate augmentation of inspiratory pressure effort).
Secondary
- 3.
- The magnitude of the PEEP–PIF relationship differs among respiratory exposure groups.
Exploratory
- 4.
- FER increases with PEEP. This objective was pre-specified as exploratory; results should be interpreted as hypothesis-generating.
To constrain the mechanistic interpretation of these hypotheses, a pre-specified complementary analysis tested whether any observed flow-pressure decoupling could be attributed to PEEP-induced regional ventilation redistribution, by examining cohort and PEEP effects on EIT-derived FRIC, CoV, and GI in the same subjects.
2. Materials and Methods
2.1. Dataset and Participants
This is a secondary analysis of the "Respiratory Dataset from PEEP Study with Expiratory Occlusion" (version 1.0.0), publicly available from PhysioNet [11,12]. The original study enrolled 80 ambulatory volunteers without mechanical ventilation, stratified into four exposure groups: Normal (n=20), Asthmatic (n=20), Smoker (n=20), and Vaper (n=20). Asthmatic subjects were included on the basis of a clinical diagnosis; no spirometric severity data are available in the public dataset. The original study was approved by the relevant ethics committee and all participants provided informed consent (see original publication for details [11]).
Participants wore a Venturi-type threshold PEEP valve and breathed continuously at 17 PEEP levels from 4.0 to 12.0 cmH₂O in 0.5 cmH₂O increments. Each PEEP level was maintained for 30 seconds, except PEEP 6.0 cmH₂O (20 seconds per the original protocol). The upright posture was maintained throughout. Simultaneous signals included: airway pressure (cmH₂O, 100 Hz), flow (L/s, 100 Hz), tidal volume (L, 100 Hz), thoraco-abdominal belt signals (100 Hz), and EIT pixel impedance (Dräger PulmoVista 500, 32×32 pixels, 50 Hz). Pre-computed per-breath onset indices were provided in the Processed_Dataset files supplied by the dataset authors.
Two subjects (S63, Smoker; S65, Vaper) had no valid breath cycles in any window and were excluded from the pressure-flow analysis. After excluding all subject-PEEP windows with fewer than two complete breath cycles, 1260 of the 1360 theoretical windows (80 subjects × 17 PEEP steps; 92.6%) from n=78 subjects were retained for the primary pressure-flow analysis. The complementary EIT analysis used a distinct set of the same size (n=78, with partially overlapping membership; Normal 20, Asthmatic 18, Smoker 20, Vaper 20; 1326 subject-PEEP observations), because S63 and S65 had usable EIT recordings whereas S68 and S69 (both Asthmatic) did not. Full per-subject and per-window exclusion accounting is provided in the Supplementary Material.
Body mass index (BMI) was computed from height and weight provided in the subject-info file [11].
2.2. Per-Breath Metric Derivation
Breath onsets were identified using the `Inspiratory Indicies` [sic — original dataset column name] column of each subject's Processed_Dataset CSV, which contains the pre-computed sample indices (100 Hz) of each inspiration onset as determined by the dataset authors' own algorithm [11]. For each PEEP window (defined by the analysis time boundaries in the original protocol), onsets falling within the window were extracted.
For each consecutive onset pair (i₀, i₁) within the window, the inspiratory phase was defined as the interval from i₀ to the first sample at which flow ≤ 0 L/s after i₀ (end of inspiration). Four metrics were computed:
- MIPS (cmH₂O): the mask inspiratory pressure swing, defined as
where the Pend-exp is the mean airway pressure over the 5 samples before i₀ (end-expiration) and min P(t) is the minimum airway pressure during the inspiratory phase. A positive MIPS indicates the subject generated sub-atmospheric (relative to PEEP) pressure to inspire, the net inspiratory effort against PEEP and elastic load. MIPS is derived from mask pressure and therefore integrates both resistive and elastic components; it is a surrogate rather than a direct measure of respiratory muscle effort.
MIPS = Pend-exp − min P(t)
- TPP (cmH₂O·s): the inspiratory time-pressure product, defined as
integrated over the inspiratory phase. TPP summarises total time-pressure effort during inspiration.
TPP = ∫ (Pend-exp − P(t)) dt
- PIF (L/s): maximum flow rate achieved during the inspiratory phase.
- FER (L·s⁻¹·cmH₂O⁻¹): flow-effort ratio, defined per breath as
then averaged within each PEEP window. This ratio approximates apparent inspiratory conductance under the simplifying assumption that peak flow and pressure swing scale proportionally with resistance changes; it is not a true instantaneous conductance, which would require simultaneous measurement of flow and driving pressure at the same time point. FER was only computed for windows with MIPS ≥ 0.3 cmH₂O to avoid division near zero, and observations with FER exceeding the 95th sample percentile (1.311 L·s⁻¹·cmH₂O⁻¹) were excluded from the FER LME to prevent singular matrices arising from extreme outliers. Only breaths with MIPS > 0 and PIF > 0 were retained. Window-level means were computed from all valid breaths within each PEEP window.
FER = PIF / MIPS
2.3. EIT-Derived Regional Ventilation Metrics (Complementary Analysis)
To test whether the observed PEEP–PIF relationship could be attributed to regional ventilation redistribution, three EIT-derived metrics were extracted from the simultaneous pixel impedance recordings (Dräger PulmoVista 500, 32×32 pixels, 50 Hz; .bin files in the EIT_rawData folder of the public release). Raw frames were loaded and breath-segmented with the `eitprocessing` Python library (version 1.7.0) [13]; for each PEEP window (same 17 time intervals as the pressure-flow analysis), all breaths whose start and end times fell within the window were retained.
For each breath, the inspiratory tidal impedance change (ΔZ) was computed pixel-wise between breath start (end-expiration) and breath middle (end-inspiration). A standard Functional Lung Segment (FLS) mask was applied at each breath: pixels whose peak-to-peak amplitude over the full breath cycle was ≥15% of the maximum pixel amplitude were retained as "functional" [10]. Three per-breath metrics were then computed and averaged within each PEEP window:
- FRIC (regional inversion, %): the percentage of FLS pixels whose ΔZ was negative during the population inspiratory phase, indicating reverse impedance change (pendelluft), such that a value of 1% denotes 1% of the functional lung moving paradoxically per breath.
- CoV (Center of Ventilation, %): the row-weighted centroid of positive ΔZ pixels along the ventro-dorsal axis, expressed as percent of the dorsal direction; 50% corresponds to uniform ventro-dorsal distribution, >50% to dorsal predominance, <50% to ventral predominance.
- GI (Global Inhomogeneity index): the standard Zhao 2009 [9] definition,
computed over the FLS-masked pixels of each breath. Lower GI indicates more homogeneous regional ventilation.
GI = Σ|ΔZFLS − median(ΔZFLS)| / Σ|ΔZFLS|
These three EIT metrics were entered into the same LME framework as the pressure-flow metrics, to test the null hypothesis that regional ventilation distribution is independent of cohort and PEEP. End-expiratory lung impedance (EELI) was also examined but is reported in Supplementary Material only, because absolute EELI in upright spontaneous breathing is dominated by between-subject differences in chest geometry, body composition, and electrode positioning, and is not interpretable as a phenotype-specific physiological marker without dedicated calibration.
2.4. Statistical Analysis
Data are presented as mean ± SD for pressure-flow metrics and as median (25th–75th percentile) for EIT-derived metrics, given their skewed distributions. At the lowest applied PEEP step (4.0 cmH₂O), between-cohort differences were tested using the Kruskal-Wallis (KW) test; effect size was quantified as
where k is the number of groups and N the total sample [14].
η² = (H − k + 1) / (N − k)
Pairwise post-hoc comparisons used the Mann-Whitney U test with Benjamini-Hochberg false discovery rate (BH-FDR) correction for multiple comparisons.
The primary analysis employed a linear mixed-effects model (LME) fitted using `statsmodels 0.14.6` [15]:
where PEEP_c = PEEP − 8.0 cmH₂O (the midpoint of the 4.0–12.0 cmH₂O PEEP range) and BMI_c = BMI − 24.64 kg/m² (sample mean). Given the repeated PEEP series per subject, we compared a random-intercepts-only model with a random-slopes model (random intercept + random slope for PEEPc per subject, adding two parameters: slope variance and intercept–slope covariance) using maximum-likelihood estimation and AIC/BIC. The random-slopes model was strongly preferred for both PIF (ΔAIC = 167, ΔBIC = 157; LRT: χ²(2) = 171.4, p < 0.0001) and MIPS (ΔAIC = 97, ΔBIC = 87; LRT: χ²(2) = 101.0, p < 0.0001) and was therefore adopted as the primary model for these outcomes; final coefficient estimates were derived by REML. Fixed-effect p-values were computed using Wald z-tests. Full model comparison statistics are reported in Table S1. Intraclass correlation (ICC) was estimated from the random-intercept simple LME [16]. The same LME framework was applied to the EIT-derived FRIC, CoV, and GI metrics for the complementary mechanistic assessment. For FER, the random-slopes model did not improve fit over the random-intercept model and a random-intercept-only specification was therefore retained.
metric ~ PEEP_c + C(Cohort, Normal reference) + PEEP_c × C(Cohort) + BMI_c + (1 + PEEP_c | Subject)
Non-linearity was assessed by adding a quadratic PEEP term (PEEP_c²) to the simple LME for each metric, compared by AIC/BIC. No metric showed a significant quadratic term (all p > 0.13) and no AIC improvement was observed (Table S2); the linear model was therefore retained as adequate.
To test whether the PEEP-PIF relationship is explained by PEEP-induced changes in breathing pattern, a secondary adjusted LME added respiratory rate (RR_c, centred at the sample mean of 4.88 breaths/window ≈ 9.8 breaths/min for 30-second windows) and inspiratory duty cycle (Ti/Ttot_c, centred at 0.443) as fixed-effect covariates, alongside the Cohort × PEEP interactions and BMI_c. RR and Ti/Ttot were derived by an independent breath-detection algorithm applied to the thoraco-abdominal belt signals [11] (band-pass filtering of the abdominal excursion channel followed by trough detection); this belt-based segmentation is therefore methodologically distinct from the `Inspiratory Indicies` used for the pressure-flow metrics.
Simple LME models (`metric ~ PEEP_c + (1|Subject)`) were also fitted to report the overall marginal PEEP effect for each outcome.
The hierarchy of hypotheses is detailed in Section 1. Analysis of the FER (hypothesis 4) was added as a secondary exploratory objective during revision of the primary analysis and should be interpreted accordingly. The complementary EIT regional analyses (FRIC, CoV, GI) were pre-specified as mechanistic assessment of the PEEP–PIF interpretation.
A sensitivity analysis re-ran all simple LMEs restricting to observations with n_breaths ≥ 3 within the analysis window (1102 of 1260 observations; 158 additional exclusions).
All analyses used Python 3.13 with NumPy 2.4.3, SciPy 1.15.2, pandas 2.3.3, and `eitprocessing` 1.7.0 [13]. Statistical significance was set at α = 0.05 (two-tailed).
3. Results
3.1. Participant Characteristics
Seventy-eight participants contributed valid pressure-flow data (Normal n = 20, Asthmatic n = 20, Smoker n = 19, Vaper n = 19). Baseline demographic characteristics were comparable across cohorts (Table 1). A total of 5959 individual breaths were analysed across 1260 subject–PEEP windows, with a mean of 3.3 breaths per window (PEEP 6.0 cmH₂O, 20-second window) to 5.3 breaths per window (PEEP 4.0 cmH₂O). The complementary EIT analysis was performed on a distinct but equally sized set of n = 78 subjects (Normal 20, Asthmatic 18, Smoker 20, Vaper 20), with partially overlapping membership due to differential data availability (full exclusion accounting in Supplementary Material).
3.2. Cohort Differences at Baseline PEEP (4.0 cmH₂O)
At PEEP 4.0 cmH₂O (the lowest applied PEEP), no statistically significant between-cohort difference was present for any primary metric, and no pairwise comparison survived BH-FDR correction (Table 2).
3.3. PIF Response to Incremental PEEP
In the simple LME, the marginal population-level PEEP effect on PIF was β = +0.068 L·s⁻¹·cmH₂O⁻¹ (95% CI: 0.064–0.072, p < 0.001, ICC = 0.601). Over the full 8 cmH₂O range, this corresponds to a PIF increase of approximately 0.54 L/s (+68%), consistent with the observed means (PEEP 4.0: ~0.788 L/s; PEEP 12.0: ~1.295 L/s; Figure 1A; Tables S4 and S5) and with the rightward shift of the per-cohort PIF distributions (Figure 2). The random-slopes model, strongly favoured by AIC and BIC (Methods 2.4; Table S1), yielded a virtually identical fixed-effect structure with a Normal-reference slope of β = +0.048 (95% CI: 0.034–0.063, p < 0.001).
In the breathing-pattern-adjusted random-slopes LME (n = 1257 observations; Table 3), PEEP remained a highly significant predictor of PIF (Normal reference: β = +0.048 L·s⁻¹·cmH₂O⁻¹, 95% CI: 0.034–0.063, p < 0.001). Neither respiratory rate (β = −0.009, p = 0.154) nor inspiratory duty cycle (Ti/Ttot) (β = +0.176, p = 0.064) reached significance, and BMI was not an independent predictor (p = 0.122). These findings suggest that the PEEP effect on PIF is not primarily explained by PEEP-induced changes in breathing pattern.
Cohort × PEEP interactions revealed significantly steeper PIF responses in Asthmatic (interaction β = +0.029 L·s⁻¹·cmH₂O⁻¹, p = 0.005; net slope +0.077) and Vaper subjects (interaction β = +0.034 L·s⁻¹·cmH₂O⁻¹, p = 0.002; net slope +0.082) relative to Normal; the Smoker interaction was in the same direction but did not reach significance (β = +0.017 L·s⁻¹·cmH₂O⁻¹, p = 0.109). Full interaction estimates are reported in Table 3; the complete fixed-effects estimates for PIF, MIPS, and TPP are provided in Table S6.
To visualise the between-subject heterogeneity in PEEP responsiveness, within-subject PIF slopes were computed for each participant by simple linear regression (PIF ~ PEEP). The distribution of individual slopes differed significantly across cohorts (Kruskal-Wallis H = 10.26, p = 0.016, η² = 0.099; Figure 3): Normal subjects had the smallest mean slope (0.048 ± 0.030 L·s⁻¹·cmH₂O⁻¹), while Vaper (0.082 ± 0.027 L·s⁻¹·cmH₂O⁻¹) and Asthmatic (0.076 ± 0.033 L·s⁻¹·cmH₂O⁻¹) showed the largest PEEP-dependent PIF increase confirming that the heterogeneity is not merely a group-average artefact. Across all subjects regardless of cohort, baseline PIF did not predict individual PIF slope (Pearson r = −0.11, p = 0.34), suggesting that a single resting flow value is insufficient to explain individual PEEP responsiveness.
3.4. MIPS Across PEEP
In the simple LME, PEEP was a statistically significant but modest positive predictor of MIPS (β = +0.026, 95% CI: 0.008–0.044, p = 0.004, ICC = 0.678; Table 3). Mean MIPS remained within a narrow ~1.8–2.0 cmH₂O band across PEEP steps (Figure 1B), in contrast to the ~68% rise in PIF over the same range, indicating that inspiratory effort was approximately preserved at the population level while inspiratory flow increased markedly.
The full random-slopes LME revealed heterogeneous cohort responses (Table 3). In Normal subjects, MIPS showed a non-significant declining trend (β = −0.044, 95% CI: −0.109 to +0.021, p = 0.185), suggesting that healthy individuals may reduce inspiratory pressure swing as PEEP increases, a pattern consistent with the flow-pressure decoupling observed for PIF. In contrast, Asthmatic and Vaper subjects showed significantly steeper MIPS trajectories than Normal subjects (interaction β = +0.121, p = 0.010 and β = +0.105, p = 0.029, respectively; net slopes +0.077 and +0.061), whereas the Smoker × PEEP interaction did not reach significance (β = +0.062, p = 0.192). BMI did not independently predict MIPS (p = 0.540).
3.5. Flow-Effort Ratio
FER, a secondary exploratory metric, was computed as PIF/MIPS per window. The simple LME showed a significant positive PEEP effect (β = +0.023 L·s⁻¹·cmH₂O⁻², 95% CI: 0.020–0.027, p < 0.001, ICC = 0.520; Figure 1D, Table 3). Given a grand-mean FER of 0.58 L·s⁻¹·cmH₂O⁻¹ (filtered analysis set, n = 1077), this corresponds to an increase of approximately 4.0% of the mean value per cmH₂O of PEEP, a pattern compatible with progressive improvement in flow generation per unit of pressure effort, though the specific mechanism cannot be determined from mask-pressure data alone.
In the full FER LME (random intercept; restricted to MIPS ≥ 0.3 cmH₂O and FER ≤ 95th percentile; n = 1077; Table 3), the PEEP effect was confirmed (β = +0.025, p < 0.001). No Cohort × PEEP interaction reached significance, indicating that the PEEP-mediated increase in FER is phenotype-independent. The Asthmatic main effect was borderline (β = +0.092, p = 0.057). BMI was not significant (p = 0.253).
At the subject level, wide inter-individual FER variation was apparent, particularly in the Asthmatic cohort (baseline SD = 0.631; Figure S1). The raw per-PEEP FER table shows an anomalously high mean and SD at PEEP 9.5 cmH₂O (mean = 1.47, SD = 4.73), driven primarily by a single subject (S16, Normal cohort) who recorded MIPS = 0.016 cmH₂O at that step, a near-zero value consistent with a transient measurement artefact or breath-hold event. This observation was excluded by the MIPS ≥ 0.3 cmH₂O filter applied to the FER LME, and S16's remaining 16 PEEP windows were unaffected. The spaghetti plot (Figure S1) illustrates that while the mean trajectory rises with PEEP in all cohorts, individual subjects in the Asthmatic group show the greatest overall variability.
3.6. Sensitivity Analysis
Restricting to windows with n_breaths ≥ 3 (1102 of 1260 observations), simple LMEs yielded β = +0.070 (95% CI: 0.066–0.074, p < 0.001) for PIF and β = +0.032 (95% CI: 0.015–0.050, p < 0.001) for MIPS. Both estimates fall within the confidence intervals of the primary analysis, confirming robustness to the minimum breath-count threshold (Table S7).
3.7. MIPS–PIF Correlation and TPP
At PEEP 8.0 cmH₂O (the centred reference PEEP), MIPS and PIF were strongly correlated across subjects (Pearson r = 0.848, p < 0.001, n = 75; Figure 4). This cross-sectional analysis uses one value per subject at the 8.0 cmH₂O step; three of the 78 analysed subjects lacked a usable pressure–flow recording at that specific step and were therefore not included. The correlation indicates that subjects generating greater inspiratory pressure swing also achieve higher peak inspiratory flow; however, this cross-sectional association may partly reflect between-subject differences in overall respiratory drive and body habitus rather than a purely mechanical coupling. The relationship held across all cohorts and was robust to the single high-MIPS Asthmatic observation (MIPS ≈ 10.8 cmH₂O): excluding it yielded r = 0.870 (n = 74), and a rank-based estimate gave a comparable result (Spearman ρ = 0.844, p < 0.001).
In the simple LME, PEEP did not significantly predict TPP at the population level (β = +0.006 cmH₂O·s per cmH₂O, 95% CI: −0.030 to +0.042, p = 0.740, ICC = 0.636; Figure 1C, Table 3). This null pooled effect is consistent with the opposing cohort-specific MIPS trajectories (Section 3.4), which cancel at the population level.
BMI independently predicted TPP (β = +0.172 cmH₂O·s per kg/m², 95% CI: 0.078–0.267, p < 0.001; Table 3); no other metric was significantly associated with BMI (all p > 0.12).
3.8. EIT-Derived Regional Ventilation
To test whether the PEEP–PIF relationship reflects regional ventilation redistribution rather than global airway mechanics, FRIC, CoV, and GI were analysed in the same LME framework (n = 78 subjects, 1326 subject-PEEP observations; Table 4, Figure 5; cohort medians and pooled Kruskal-Wallis tests in Table S8, and per-subject PEEP-slope comparisons in Table S9).
Pendelluft (FRIC). Median FRIC values were uniformly low across cohorts (Normal 0.08%, Asthmatic 0.12%, Smoker 0.11%, Vaper 0.00%), well below the values reported in mechanically ventilated patients with injurious spontaneous effort. The Kruskal-Wallis test pooled across all PEEP steps was non-significant (H = 2.25, p = 0.52), and no pairwise difference survived BH-FDR correction at any individual PEEP step (all padj = 0.99). The random-slopes LME confirmed the null for all Cohort × PEEP interactions (Table 4). The simple LME showed a statistically significant but biologically negligible population-level PEEP effect (~0.15% of FLS pixels per cmH₂O; Table 4).
Center of Ventilation (CoV). CoV remained near the 50% iso-ventilation reference in all cohorts (medians: Normal 51.2%, Asthmatic 50.4%, Smoker 50.7%, Vaper 50.3%). The pooled KW test was borderline significant (H = 9.27, p = 0.026), but the random-slopes LME showed no significant cohort term (all p ≥ 0.40) and no Cohort × PEEP interaction (all p ≥ 0.35; Table 4), confirming that the small univariate differences do not persist after between-subject variance is accounted for. Per-subject CoV slopes versus PEEP did not differ between cohorts (KW p = 0.64).
Global Inhomogeneity index (GI). GI showed a significant cohort effect in the pooled univariate KW analysis (H = 25.34, p < 0.0001), with Normal vs Asthmatic and Normal vs Vaper the largest pairwise differences (both p < 0.0001). However, in the random-slopes LME no cohort term or Cohort × PEEP interaction survived (all p ≥ 0.22; Table 4). The discrepancy reflects the substantial between-subject variance (ICC = 0.610; ~61% of total GI variance) that the multilevel model correctly partitions away from the cohort-level signal.
4. Discussion
4.1. PIF Increases with PEEP: A Flow-Dominant Adaptive Strategy Independent of Breathing Pattern
The primary finding of this study is that PIF increases consistently and substantially with applied PEEP across all four respiratory exposure groups (β = +0.068 L·s⁻¹·cmH₂O⁻¹, ICC = 0.601 from simple LME; β = +0.048 L·s⁻¹·cmH₂O⁻¹ for Normal reference in random-slopes model). This represents a 68% increase from the lowest to the highest PEEP level — a large, reproducible effect with an ICC indicating that approximately 60% of the total variance in PIF is stable at the subject level.
Critically, this PEEP-PIF relationship persisted after controlling for respiratory rate and inspiratory duty cycle (Ti/Ttot) [17], both of which did not reach statistical significance (RR: p = 0.154; Ti/Ttot: p = 0.064). The near-significant Ti/Ttot coefficient (β = +0.176) suggests a possible weak association between longer inspiratory duty cycle and higher PIF, but this does not account for the PEEP effect, which remained highly significant in the adjusted model (p < 0.001). These findings suggest that the PEEP–PIF relationship is not primarily explained by PEEP-induced changes in breathing pattern, and that the PEEP effect on PIF reflects a genuine mechanical gain.
The mechanistic basis cannot be fully resolved from mask-pressure and flow data alone. PEEP raises end-expiratory lung volume, which dilates intrathoracic airways through radial traction and reduces inspiratory resistance [5]. The observed PIF increase is compatible with reduced resistive load, but could also partly reflect altered valve opening dynamics or chest wall mechanical advantage at higher lung volumes. Because mask pressure conflates valve, airway, and elastic components (see Limitations), these cannot be separated here.
The complementary EIT analyses provide a mechanistic boundary for this interpretation. None of the three regional ventilation metrics — FRIC, CoV, or GI — showed a significant Cohort × PEEP interaction in the random-slopes LME (all p ≥ 0.35; Table 4), and no metric exhibited a clinically meaningful PEEP main effect. The observed flow-pressure decoupling is therefore not accompanied by regional ventilation redistribution or pendelluft at the spatial resolution of surface EIT [8,18], and is most consistent with a global airway-mechanics interpretation. However, the data cannot prove this mechanism definitively, as EIT cannot resolve sub-segmental airway calibre and oesophageal manometry was not available to partition elastic and resistive pressure components.
In Normal subjects, the non-significant declining MIPS trend may reflect chest wall mechanical advantage at higher lung volumes, where outward recoil partially unloads inspiratory muscles. This is a plausible physiological explanation but would require invasive pressure measurement to confirm.
4.2. Asthmatic Subjects: Exaggerated PEEP Response
Asthmatic subjects displayed the steepest PEEP-dependent PIF increase of all cohorts (net β ≈ +0.077 L·s⁻¹·cmH₂O⁻¹ in the adjusted model) despite having the lowest baseline PIF at PEEP 4.0 cmH₂O (0.742 ± 0.206 L·s⁻¹). The within-subject slope analysis confirmed this at the individual level (Figure 3; KW p = 0.016). This differential PEEP responsiveness is consistent with the hypothesis that subjects with airway compromise have a greater flow reserve that can be unlocked by increasing lung volume. However, this interpretation remains speculative in the absence of concurrent spirometry, bronchodilator data, or imaging; the asthmatic group lacks severity grading, and between-subject heterogeneity in PEEP response was high (SD of slopes = 0.033). Baseline PIF did not predict individual slope within cohorts (r = −0.11, p = 0.34), confirming that a single resting flow value is insufficient to characterise individual PEEP responsiveness.
The MIPS data show that Asthmatic subjects had substantially greater PEEP-dependent MIPS increases (net β ≈ +0.077) compared with a non-significant declining trend in Normal subjects (β = −0.044, p = 0.185 in random-slopes model). That PIF increases substantially despite a concurrent rise in MIPS suggests that the improvement in flow exceeds the additional pressure effort, but without partitioning of elastic and resistive pressure components the magnitude of any resistance reduction cannot be quantified. Notably, the absence of any phenotype-specific signal in FRIC, CoV, or GI indicates that the enhanced PIF response in asthmatics is not explained by greater PEEP-induced recruitment of previously hypoventilated regions, nor by relief of pendelluft, but is most consistent with a global change in airway mechanics whose magnitude differs between phenotypes.
4.3. Flow-Effort Ratio: A PEEP-Mediated, Phenotype-Uniform Increase
FER increased with PEEP in all cohorts (β = +0.023 L·s⁻¹·cmH₂O⁻², p < 0.001) with a uniformly non-significant Cohort × PEEP interaction (all p > 0.35; Table 3). Because FER is a ratio of non-co-located peak flow and composite mask pressure swing, it cannot be equated with airway conductance (see Limitations); a uniform increase is compatible with a shared PEEP-related improvement in flow efficiency, but the specific mechanism remains unresolved. The uniformity of the FER response mirrors that of the EIT regional null findings, a population-wide phenomenon, not a phenotype-specific effect. This metric was pre-specified as exploratory and is hypothesis-generating rather than confirmatory.
The absolute FER at baseline was elevated, with high inter-individual variability, in both the Asthmatic and Vaper cohorts (Asthmatic 0.708 ± 0.631, Vaper 0.731 ± 0.934 L·s⁻¹·cmH₂O⁻¹, vs 0.398 ± 0.107 for Normal), driven by disproportionately low MIPS in a subset of these subjects. The large SDs reflect individual outliers rather than a uniform group characteristic; across the full titration the Asthmatic cohort showed the greatest between-subject variability in FER (Figure S1), cautioning against group-mean interpretation of this ratio metric.
4.4 Smokers and Vapers
Vapers showed a significantly steeper PEEP-dependent PIF increase than Normal subjects (interaction β = +0.034 L·s⁻¹·cmH₂O⁻¹ , p = 0.002), while the Smoker interaction was in the same direction but did not reach statistical significance in the random-slopes model (β = +0.017 L·s⁻¹·cmH₂O⁻¹, p = 0.109). The directional consistency — Smokers showing an intermediate slope between Normal and Asthmatic/Vaper — is biologically plausible: chronic cigarette smoke exposure causes airway inflammation and structural lung changes [19], whereas e-cigarette aerosol has been associated with oxidative stress and early airway dysfunction [20], potentially creating a PEEP-responsive airway reserve. The Smoker × PEEP interaction should therefore be regarded as inconclusive. Although the effect is directionally consistent with the biological hypothesis, it falls below the significance threshold, and the study was not powered to detect small interactions in a subgroup of only 19 subjects.
At PEEP 4.0 cmH₂O, Smokers had PIF comparable to Normal subjects (0.815 vs 0.832 L·s⁻¹), consistent with the uniformly non-significant baseline comparisons; the phenotype differences instead emerge with PEEP loading, captured by the LME interaction terms.
4.5. BMI and Inspiratory Time-Pressure Product
BMI was an independent positive predictor of TPP (β = +0.172 cmH₂O·s·kg⁻¹·m², p < 0.001), consistent with the established effect of increased chest wall loading on inspiratory muscle effort in subjects with higher body mass [21,22]. BMI was not a significant predictor of PIF (p = 0.122), MIPS (p = 0.540), or FER (p = 0.253), indicating that the BMI effect is specific to cumulative time-pressure effort rather than peak flow or pressure swing.
4.6. Clinical Implications
In the intensive care setting, PIF monitoring during spontaneous breathing has been proposed as a tool for assessing respiratory effort and readiness for weaning [3,6]. Because progressive PEEP increases PIF independently of breathing pattern, PEEP level must be accounted for when interpreting PIF as an effort marker, otherwise clinicians may overestimate respiratory drive in patients on higher PEEP. These inferences should be confirmed in patient populations before clinical application, as our dataset comprised ambulatory volunteers rather than critically ill patients.
Beyond the intensive care setting, these findings have direct relevance to the clinical use of threshold PEEP valves in spontaneously breathing patients. In pulmonary rehabilitation, PEEP valves are used to reduce dynamic hyperinflation and dyspnoea in obstructive lung disease [23,24]. The present data indicate that increasing PEEP preferentially increases PIF relative to mask pressure swing in ambulatory volunteers. If confirmed in patient populations, this pattern could contribute to symptom relief in obstructive disease through mechanisms beyond EELV optimisation alone, though the present study cannot identify the specific mechanism.
Notably, the uniform FER response across cohorts, together with the phenotype-independent EIT findings (Table 4), suggests that this improvement in flow generation per unit of pressure effort is a population-wide phenomenon consistent with global airway mechanics rather than PEEP-induced regional recruitment.
4.7. Limitations
Several limitations should be acknowledged. First, this is a secondary analysis of data collected for different primary purposes. MIPS was derived from mask airway pressure rather than oesophageal pressure, the gold standard for inspiratory effort. Mask pressure integrates resistive, elastic, and valve-threshold components that cannot be separated without invasive monitoring. FER therefore reflects a composite of valve, upper-airway, and lower-airway mechanics, not peripheral airway conductance alone, and any mechanistic inference derived from it must be regarded as indirect and hypothesis-generating.
Second, the PEEP analysis windows are 30 seconds each (20 seconds for PEEP 6.0 cmH₂O), yielding 3–11 breaths per window (mean ~4.4), which limits within-window precision and renders ratio metrics such as FER susceptible to near-zero denominators.
Third, the public dataset does not include spirometric data, bronchodilator use, smoking pack-years, vaping history severity, or symptom scores; consequently, the cohort labels (Asthmatic, Smoker, Vaper) describe exposure and diagnostic categories rather than characterised physiological phenotypes, and subgroup interpretations should be considered exploratory.
Fourth, BMI is a crude measure of body composition [25]; the 11 subjects with BMI ≥ 30 kg/m² were distributed across all four cohorts and were not analysed separately.
Fifth, sex was not included as a covariate in the LME models; the balanced distribution across cohorts (38M/40F) limits confounding at the group level, but sex-specific effects on respiratory mechanics cannot be excluded and warrant dedicated investigation.
Sixth, the spontaneous breathing model at rest may not generalise to exercise or disease-loaded breathing conditions.
Seventh, EIT measures regional ventilation at the resolution of the thoracic cross-section but cannot resolve individual airway calibre at the sub-segmental level. The null regional findings therefore do not exclude phenotype-specific differences in small-airway mechanics that fall below the spatial resolution of surface EIT.
Eighth, the PEEP titration began at 4.0 cmH₂O rather than at 0 cmH₂O (unloaded breathing); consequently, the true unloaded baseline is unknown and any non-linearity below 4.0 cmH₂O cannot be characterised from these data. In addition, PEEP was applied in a fixed ascending 0.5 cmH₂O step sequence without randomisation or decremental arms, which cannot exclude time-dependent confounders such as progressive respiratory muscle fatigue, behavioural adaptation to the mask, or drift in respiratory drive over the ~8-minute protocol. The stability of mean MIPS across PEEP steps argues against gross progressive fatigue, but a counterbalanced PEEP order would be needed to definitively exclude order effects.
5. Conclusions
In spontaneously breathing ambulatory volunteers wearing a threshold PEEP valve, progressive PEEP loading from 4 to 12 cmH₂O produces a large, consistent, and subject-reproducible increase in peak inspiratory flow (β = +0.068 L·s⁻¹·cmH₂O⁻¹, ICC = 0.601) that is proportionally much greater than the change in mask inspiratory pressure swing. This effect is independent of PEEP-induced changes in breathing pattern (respiratory rate and duty cycle), confirming that the PEEP-PIF relationship reflects a genuine mechanical gain rather than a breathing-pattern artefact. The simultaneous PEEP-dependent increase in the flow-effort ratio (FER; β = +0.023 L·s⁻¹·cmH₂O⁻², uniform across phenotypes) is compatible with improved flow generation at a given mask pressure swing. Complementary EIT-derived regional ventilation metrics (FRIC, CoV, GI) were uniformly phenotype-independent across PEEP titration, indicating that, at the spatial resolution of surface EIT, the observed flow-pressure decoupling is not accompanied by regional ventilation redistribution or pendelluft phenomena and is therefore most consistent with a global airway-mechanics interpretation. The present data cannot localise the precise mechanism or separately quantify valve, upper-airway, and lower-airway contributions. Asthmatic and Vaper subjects exhibit the steepest PEEP-dependent PIF increases, a pattern consistent with — but not proof of — greater flow reserve in partially obstructed airways. BMI independently predicts inspiratory time-pressure product, confirming the added respiratory burden of higher body mass across PEEP levels.
Supplementary Materials
The following supporting information can be downloaded at the website of this paper posted on Preprints.org: Table S1: random-intercept vs random-slopes model comparison; Table S2: non-linearity (quadratic PEEP) test; Table S3: pairwise post-hoc comparisons at PEEP 4.0 cmH₂O; Table S4: per-PEEP mean ± SEM for all primary outcomes; Table S5: per-PEEP PIF by cohort; Table S6: full LME fixed-effects results for PIF, MIPS, and TPP; Table S7: sensitivity analysis restricted to n_breaths ≥ 3; Table S8: EIT regional metrics—cohort medians and Kruskal-Wallis tests; Table S9: EIT per-subject slope comparison; Figure S1: subject-level flow-effort ratio (spaghetti plot).
Author Contributions
Conceptualization, G.G., M.Ca. and G.T.; methodology, G.G. and M.Ca.; software, G.G., M.Ca. and E.R.; validation, E.R. and M.Co.; formal analysis, G.G., M.Ca. and E.R.; data curation, M.Co., S.O. and V.C.; writing—original draft preparation, G.G. and M.Ca.; writing—review and editing, G.G., M.Ca., G.T., E.R., M.Co., V.C. and S.O.; visualization, S.O., M.Co. and V.C.; supervision, M.Co. and G.T.; project administration, G.G. and G.T. G.G. and M.Ca. contributed equally and are joint first authors. All authors have read and agreed to the published version of the manuscript. (Author initials: G.G. = Gaetano Gazzè; M.Ca. = Martina Caronna; E.R. = Emanuele Rollo; M.Co. = Marco Covotta; V.C. = Valentina Ceccarelli; S.O. = Sara Orlando; G.T. = Giulia Torregiani.).
Funding
This research received no external funding.
Institutional Review Board Statement
Ethical review and approval were waived for this study because it constitutes a secondary analysis of a publicly available, fully de-identified dataset. The original data collection was conducted in accordance with the Declaration of Helsinki and approved by the relevant institutional ethics committee, as described in the original publication [11].
Informed Consent Statement
Informed consent was obtained from all subjects involved in the original study, as reported in the source publication [11]. No new data involving human participants were collected for the present secondary analysis.
Data Availability Statement
The data presented in this study are derived from a resource available in the public domain: the "Respiratory Dataset from PEEP Study with Expiratory Occlusion" (version 1.0.0), openly available at PhysioNet, doi:10.13026/d767-e709 [11,12]. The analysis code supporting the reported results is available from the corresponding author upon reasonable request.
Acknowledgments
The authors thank Dr E.F.S. Guy and colleagues for making the PEEP dataset publicly available via PhysioNet.
Conflicts of Interest
The authors declare no conflicts of interest.
References
- Suter, P. M.; Fairley, H. B.; Isenberg, M. D. Optimum end-expiratory airway pressure in patients with acute pulmonary failure. N. Engl. J. Med. 1975, 292, 284–289. [Google Scholar] [CrossRef] [PubMed]
- Sahetya, S. K.; Goligher, E. C.; Brower, R. G. Fifty years of research in ARDS. Setting positive end-expiratory pressure in acute respiratory distress syndrome. Am. J. Respir. Crit. Care Med. 2017, 195, 1429–1438. [Google Scholar] [CrossRef] [PubMed]
- Munshi, L.; Mancebo, J.; Brochard, L. J. Noninvasive respiratory support for adults with acute respiratory failure. N. Engl. J. Med. 2022, 387, 1688–1698. [Google Scholar] [CrossRef] [PubMed]
- Decramer, M. Hyperinflation and respiratory muscle interaction. Eur. Respir. J. 1997, 10, 934–941. [Google Scholar] [CrossRef]
- Mead, J.; Turner, J. M.; Macklem, P. T.; Little, J. B. Significance of the relationship between lung recoil and maximum expiratory flow. J. Appl. Physiol. 1967, 22, 95–108. [Google Scholar] [CrossRef] [PubMed]
- Jubran, A.; Tobin, M. J. Pathophysiologic basis of acute respiratory distress in patients who fail a trial of weaning from mechanical ventilation. Am. J. Respir. Crit. Care Med. 1997, 155, 906–915. [Google Scholar] [CrossRef] [PubMed]
- Otis, A. B.; Fenn, W. O.; Rahn, H. Mechanics of breathing in man. J. Appl. Physiol. 1950, 2, 592–607. [Google Scholar] [CrossRef] [PubMed]
- Yoshida, T.; Torsani, V.; Gomes, S.; et al. Spontaneous effort causes occult pendelluft during mechanical ventilation. Am. J. Respir. Crit. Care Med. 2013, 188, 1420–1427. [Google Scholar] [CrossRef] [PubMed]
- Zhao, Z.; Möller, K.; Steinmann, D.; Frerichs, I.; Guttmann, J. Evaluation of an electrical impedance tomography-based global inhomogeneity index for pulmonary ventilation distribution. Intensive Care Med. 2009, 35, 1900–1906. [Google Scholar] [CrossRef] [PubMed]
- Frerichs, I.; Amato, M. B. P.; van Kaam, A. H.; et al. Chest electrical impedance tomography examination, data analysis, terminology, clinical use and recommendations: consensus statement of the TRanslational EIT developmeNt stuDy group. Thorax 2017, 72, 83–93. [Google Scholar] [PubMed]
- Guy, E. F. S.; Clifton, J. A.; Caljé-van der Klei, T.; Chen, R.; Knopp, J.; Moeller, K.; Chase, J. G. Respiratory dataset from PEEP study with expiratory occlusion (version 1.0.0). PhysioNet 2023. [Google Scholar] [CrossRef]
- Pollard, T.; Moody, B. E.; Lehman, L.; Gow, B.; Fernandes, C.; Xie, C.; Johnson, A.; Mark, R. G.; Heldt, T. PhysioNet as a global platform for biomedical research. Nat. Health 2026. [Google Scholar] [CrossRef]
- Somhorst, P.; Bodor, D. L.; Francovich, J.; Wisse, J. J.; Baccinelli, W.; Jonkman, A. H. eitprocessing: a Python package for analysis of electrical impedance tomography data. J. Open Source Softw. 2026. [Google Scholar] [CrossRef]
- Tomczak, M.; Tomczak, E. The need to report effect size estimates revisited. An overview of some recommended measures of effect size. Trends Sport Sci. 2014, 21, 19–25. [Google Scholar]
- Seabold, S.; Perktold, J. Statsmodels: Econometric and statistical modeling with Python. Proc. 9th Python in Science Conf., 2010; pp. 57–61. [Google Scholar]
- Nakagawa, S.; Schielzeth, H. A general and simple method for obtaining R² from generalized linear mixed-effects models. Methods Ecol. Evol. 2013, 4, 133–142. [Google Scholar] [CrossRef]
- Tobin, M. J.; Chadha, T. S.; Jenouri, G.; et al. Breathing patterns. 1. Normal subjects. Chest 1983, 84, 202–205. [Google Scholar] [CrossRef] [PubMed]
- Morais, C. C. A.; Koyama, S.; Yoshida, T.; et al. High positive end-expiratory pressure renders spontaneous effort noninjurious. Am. J. Respir. Crit. Care Med. 2018, 197, 1285–1296. [Google Scholar] [CrossRef] [PubMed]
- Kumar, A.; Cherian, S. V.; Vassallo, R.; Yi, E. S.; Ryu, J. H. Current concepts in pathogenesis, diagnosis, and management of smoking-related interstitial lung diseases. Chest 2018, 154, 394–408. [Google Scholar] [CrossRef] [PubMed]
- Bhatta, D. N.; Glantz, S. A. Association of e-cigarette use with respiratory disease among adults: a longitudinal analysis. Am. J. Prev. Med. 2020, 58, 182–190. [Google Scholar] [CrossRef] [PubMed]
- Steier, J.; Lunt, A.; Hart, N.; Polkey, M. I.; Moxham, J. Observational study of the effect of obesity on lung volumes. Thorax 2014, 69, 752–759. [Google Scholar] [CrossRef] [PubMed]
- Brazzale, D. J.; Pretto, J. J.; Schachter, L. M. Optimizing respiratory function assessments to elucidate the impact of obesity on respiratory health. Respirology 2015, 20, 715–721. [Google Scholar] [CrossRef] [PubMed]
- O'Donnell, D. E.; Parker, C. M. COPD exacerbations. 3: pathophysiology. Thorax 2006, 61, 354–361. [Google Scholar] [CrossRef] [PubMed]
- Miro, A. M.; Pinsky, M. R.; Rogers, P. L. Effects of the components of positive airway pressure on work of breathing during bronchospasm. Crit. Care 2004, 8, R72–R81. [Google Scholar] [CrossRef] [PubMed]
- Littleton, S. W. Impact of obesity on respiratory function. Respirology 2012, 17, 43–49. [Google Scholar] [CrossRef] [PubMed]
Figure 1.
Respiratory mechanics across incremental PEEP loading, by exposure phenotype. Line plots show cohort-mean ± SEM across the 17 PEEP levels. (A) Peak inspiratory flow (PIF) rises progressively in all cohorts (β = +0.068 L·s⁻¹·cmH₂O⁻¹, p < 0.001). (B) Mask inspiratory pressure swing (MIPS) remains approximately stable at the population level (β = +0.026, p = 0.004), with steeper PEEP-dependent increases in Asthmatic and Vaper subjects. (C) Inspiratory time-pressure product (TPP) shows no significant PEEP effect (β = +0.006, p = 0.740). (D) Flow-effort ratio (FER = PIF/MIPS) increases with PEEP uniformly across cohorts (β = +0.023, p < 0.001). Full numerical estimates are reported in Table 3. Abbreviations: PEEP, positive end-expiratory pressure; SEM, standard error of the mean.
Figure 1.
Respiratory mechanics across incremental PEEP loading, by exposure phenotype. Line plots show cohort-mean ± SEM across the 17 PEEP levels. (A) Peak inspiratory flow (PIF) rises progressively in all cohorts (β = +0.068 L·s⁻¹·cmH₂O⁻¹, p < 0.001). (B) Mask inspiratory pressure swing (MIPS) remains approximately stable at the population level (β = +0.026, p = 0.004), with steeper PEEP-dependent increases in Asthmatic and Vaper subjects. (C) Inspiratory time-pressure product (TPP) shows no significant PEEP effect (β = +0.006, p = 0.740). (D) Flow-effort ratio (FER = PIF/MIPS) increases with PEEP uniformly across cohorts (β = +0.023, p < 0.001). Full numerical estimates are reported in Table 3. Abbreviations: PEEP, positive end-expiratory pressure; SEM, standard error of the mean.
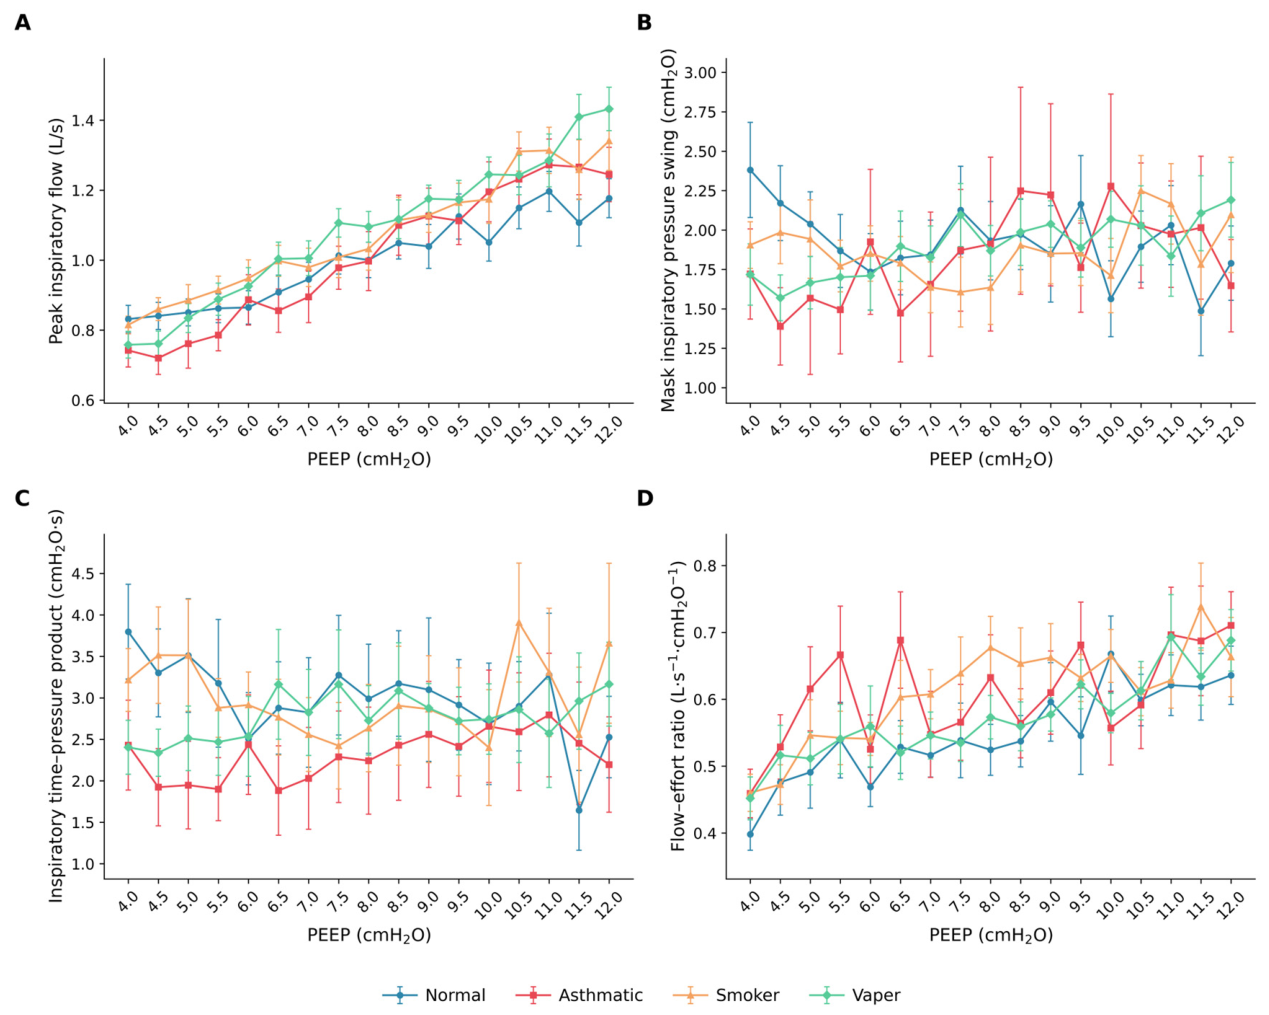
Figure 2.
PEEP-dependent shift in peak inspiratory flow distribution. Violin plots of PIF at PEEP 4.0 cmH₂O (left) and 12.0 cmH₂O (right) by cohort, with individual subject-PEEP observations overlaid. A consistent rightward shift in PIF from low to high PEEP is evident across all four cohorts. Abbreviations: PIF, peak inspiratory flow; PEEP, positive end-expiratory pressure.
Figure 2.
PEEP-dependent shift in peak inspiratory flow distribution. Violin plots of PIF at PEEP 4.0 cmH₂O (left) and 12.0 cmH₂O (right) by cohort, with individual subject-PEEP observations overlaid. A consistent rightward shift in PIF from low to high PEEP is evident across all four cohorts. Abbreviations: PIF, peak inspiratory flow; PEEP, positive end-expiratory pressure.
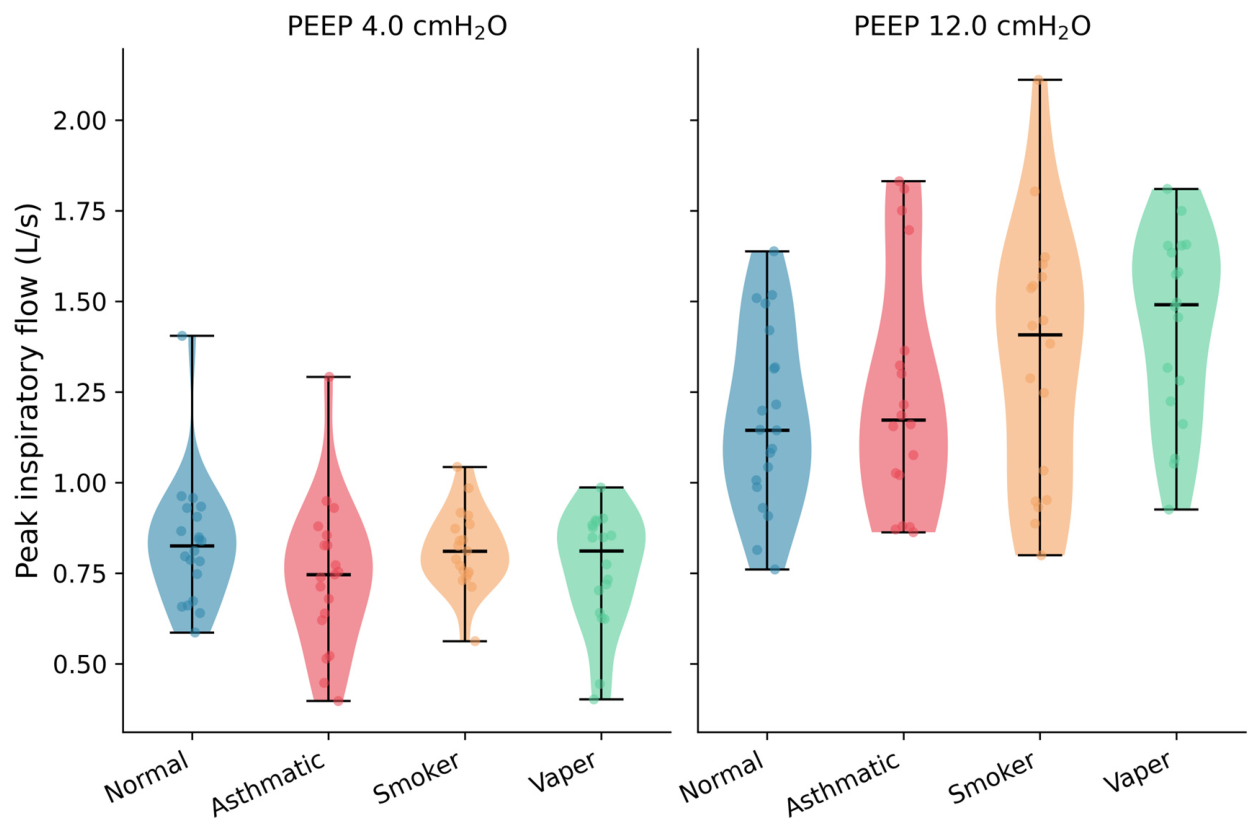
Figure 3.
Between-subject heterogeneity in PEEP responsiveness. Distribution of within-subject PIF slopes by cohort. Each point represents one subject's linear regression slope from a regression of PIF on PEEP across all 17 steps (4.0–12.0 cmH₂O). Crosses (×) indicate cohort mean slopes, also printed numerically below each violin. The Kruskal-Wallis test showed significant between-cohort differences (H = 10.26, p = 0.016, η² = 0.099), with Normal subjects showing the smallest and Vaper subjects the largest PEEP-dependent PIF increase. Abbreviations: PIF, peak inspiratory flow; PEEP, positive end-expiratory pressure; η², epsilon-squared effect size.
Figure 3.
Between-subject heterogeneity in PEEP responsiveness. Distribution of within-subject PIF slopes by cohort. Each point represents one subject's linear regression slope from a regression of PIF on PEEP across all 17 steps (4.0–12.0 cmH₂O). Crosses (×) indicate cohort mean slopes, also printed numerically below each violin. The Kruskal-Wallis test showed significant between-cohort differences (H = 10.26, p = 0.016, η² = 0.099), with Normal subjects showing the smallest and Vaper subjects the largest PEEP-dependent PIF increase. Abbreviations: PIF, peak inspiratory flow; PEEP, positive end-expiratory pressure; η², epsilon-squared effect size.
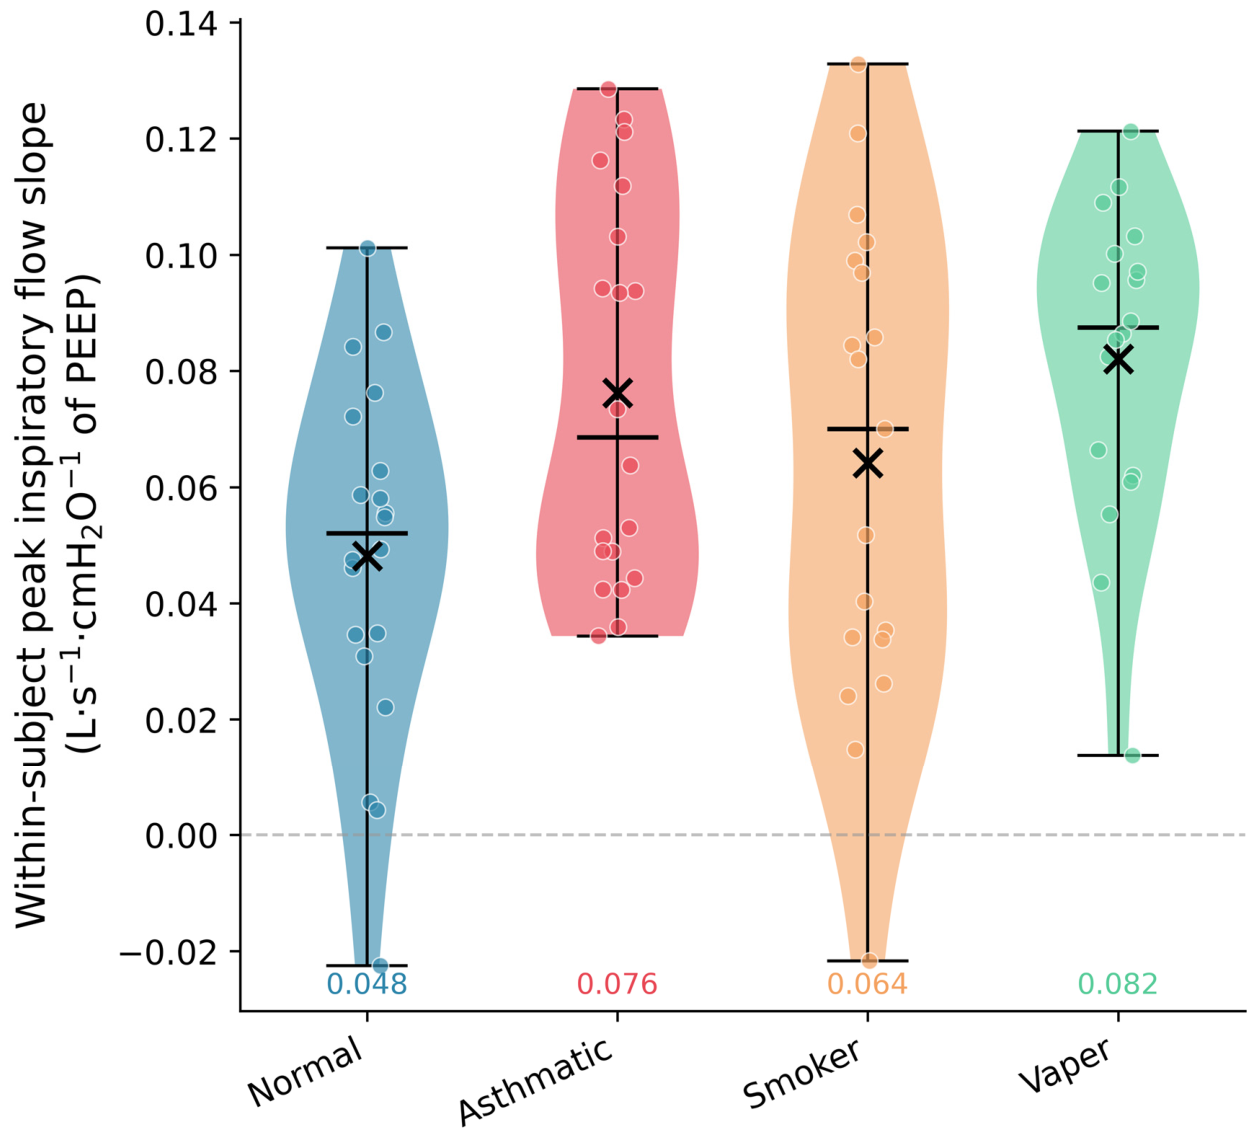
Figure 4.
Cross-sectional relationship between inspiratory effort and peak flow at reference PEEP. Scatter plot of MIPS versus PIF at PEEP 8.0 cmH₂O by cohort (n = 75). Pearson r = 0.848 (p < 0.001); the dashed line is the ordinary least-squares regression. One Asthmatic outlier (MIPS ≈ 10.8 cmH₂O) is visible at the right of the plot; all 75 observations are included in the correlation. Abbreviations: MIPS, mask inspiratory pressure swing; PIF, peak inspiratory flow; PEEP, positive end-expiratory pressure.
Figure 4.
Cross-sectional relationship between inspiratory effort and peak flow at reference PEEP. Scatter plot of MIPS versus PIF at PEEP 8.0 cmH₂O by cohort (n = 75). Pearson r = 0.848 (p < 0.001); the dashed line is the ordinary least-squares regression. One Asthmatic outlier (MIPS ≈ 10.8 cmH₂O) is visible at the right of the plot; all 75 observations are included in the correlation. Abbreviations: MIPS, mask inspiratory pressure swing; PIF, peak inspiratory flow; PEEP, positive end-expiratory pressure.
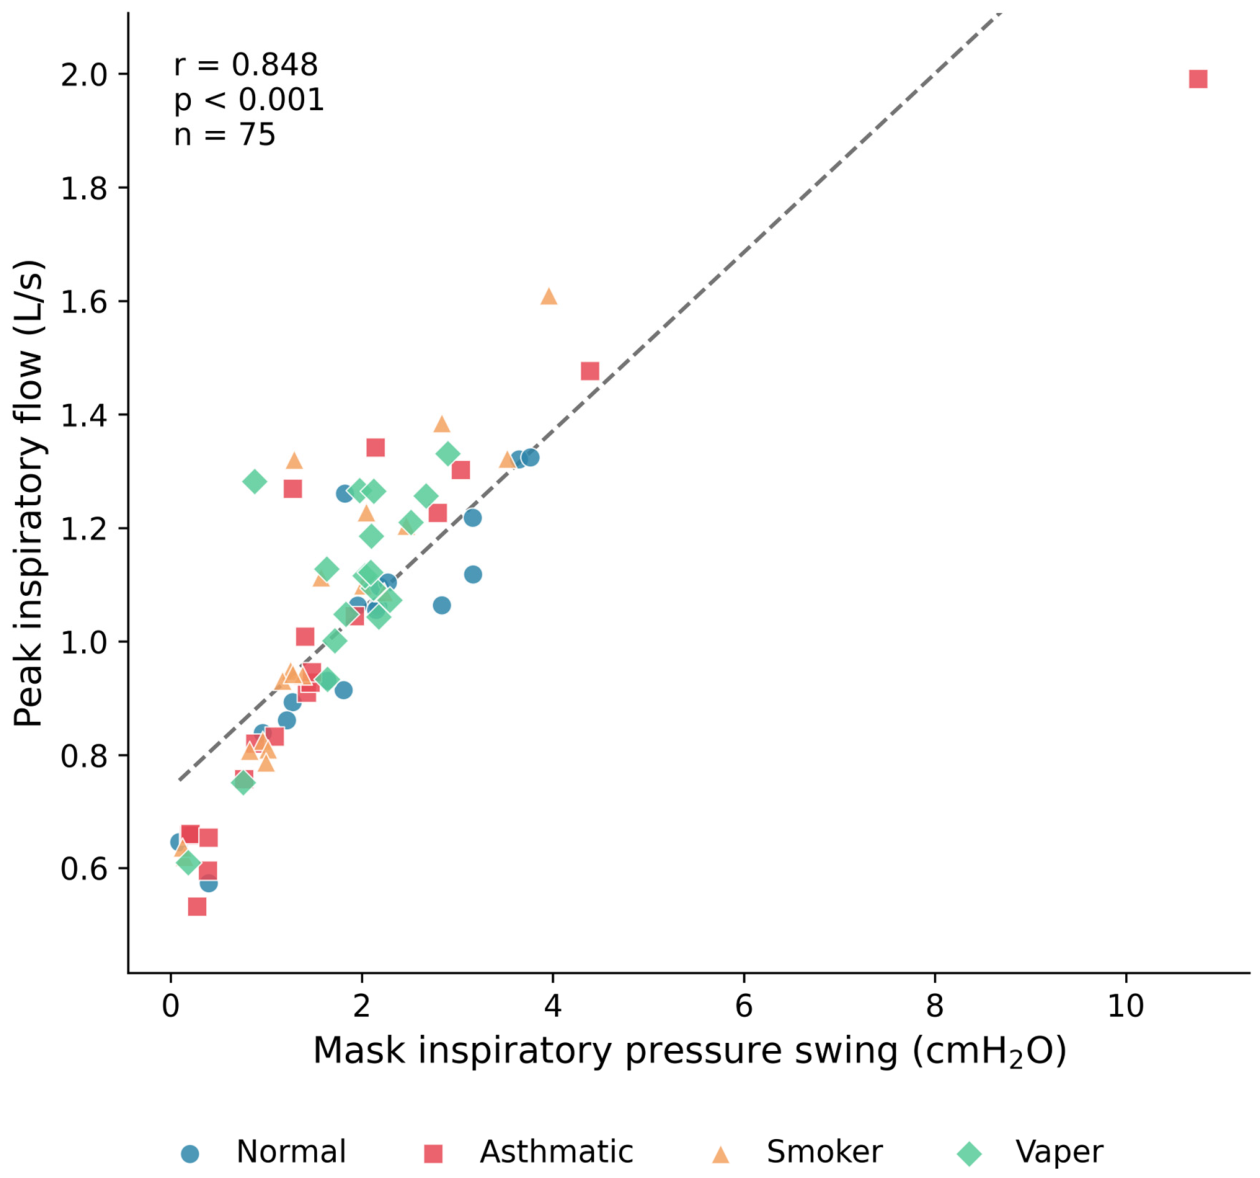
Figure 5.
EIT-derived regional ventilation metrics across incremental PEEP loading, by exposure phenotype. Cohort-median trajectories (lines) with 25th–75th percentile range (shaded bands) across the 17 PEEP levels for (A) pendelluft fraction (FRIC), (B) Center of Ventilation (CoV), and (C) Global Inhomogeneity index (GI). No metric shows a significant cohort × PEEP interaction in the random-slopes LME (all p ≥ 0.35; Table 4). FRIC remains below 1% across all cohorts and PEEP levels, and CoV remains near the 50% iso-ventilation reference, indicating negligible pendelluft and uniform ventro-dorsal distribution throughout the titration. Abbreviations: EIT, electrical impedance tomography; PEEP, positive end-expiratory pressure; FRIC, pendelluft fraction; CoV, Center of Ventilation; GI, Global Inhomogeneity index; LME, linear mixed-effects model.
Figure 5.
EIT-derived regional ventilation metrics across incremental PEEP loading, by exposure phenotype. Cohort-median trajectories (lines) with 25th–75th percentile range (shaded bands) across the 17 PEEP levels for (A) pendelluft fraction (FRIC), (B) Center of Ventilation (CoV), and (C) Global Inhomogeneity index (GI). No metric shows a significant cohort × PEEP interaction in the random-slopes LME (all p ≥ 0.35; Table 4). FRIC remains below 1% across all cohorts and PEEP levels, and CoV remains near the 50% iso-ventilation reference, indicating negligible pendelluft and uniform ventro-dorsal distribution throughout the titration. Abbreviations: EIT, electrical impedance tomography; PEEP, positive end-expiratory pressure; FRIC, pendelluft fraction; CoV, Center of Ventilation; GI, Global Inhomogeneity index; LME, linear mixed-effects model.
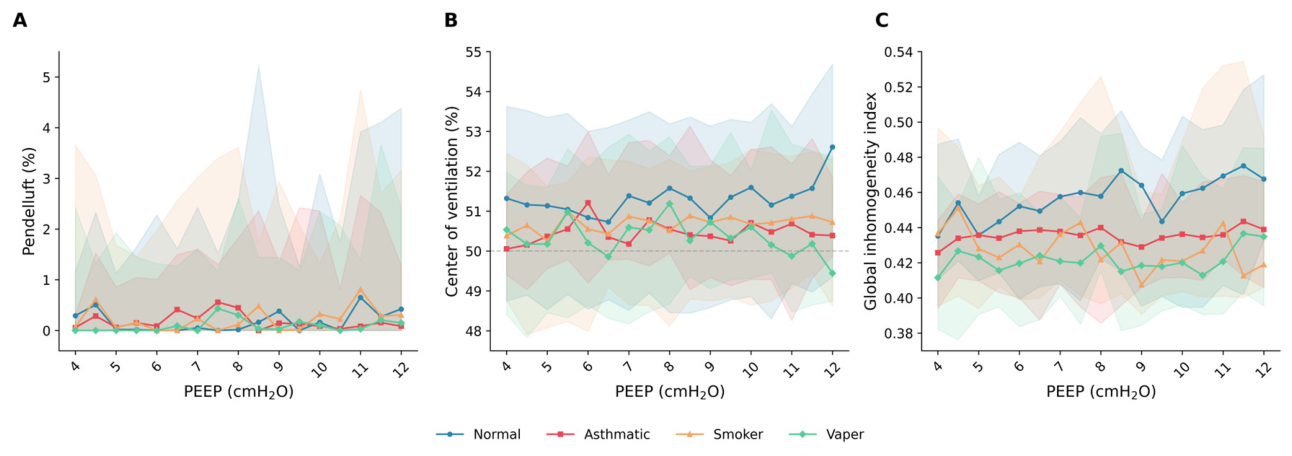

Table 1.
Participant characteristics.
| Cohort | n | Sex (M/F) | Age (years) | Height (cm) | Weight (kg) | BMI (kg/m²) |
| Normal | 20 | 10/10 | 24.2±4.1 | 174.0±6.9 | 75.1±15.6 | 24.7±4.3 |
| Asthmatic | 20 | 10/10 | 25.4±8.1 | 171.9±11.3 | 73.7±14.4 | 25.0±4.9 |
| Smoker | 19 | 9/10 | 24.1±2.9 | 174.8±11.0 | 76.6±24.0 | 24.8±6.2 |
| Vaper | 19 | 9/10 | 22.2±0.9 | 176.6±11.8 | 75.7±13.8 | 24.2±3.3 |
| All | 78 | 38/40 | 24.0±4.9 | 174.3±10.4 | 75.3±17.1 | 24.7±4.7 |
Data are mean ± SD. Demographic data refer to the 78 subjects included in the pressure-flow analysis. Two subjects, S63 (Smoker) and S65 (Vaper), were excluded from the pressure-flow analysis due to absence of valid breath cycles in any analysis window. The EIT analysis instead retained S63 and S65 (valid EIT recordings present) and excluded S68 and S69 (both Asthmatic; non-standard acquisition code and missing EIT file, respectively), giving a distinct but equally sized set of n = 78 for the EIT-based analyses.
Table 2.
Between-cohort comparisons at PEEP 4.0 cmH₂O.
| Metric | H (KW) | p | η² | Normal | Asthmatic | Smoker | Vaper |
| PIF (L/s) | 3.32 | 0.345 | 0.004 | 0.832±0.175 | 0.742±0.206 | 0.815±0.109 | 0.758±0.162 |
| MIPS (cmH₂O) | 4.36 | 0.225 | 0.019 | 2.381±1.351 | 1.721±1.245 | 1.905±0.645 | 1.718±0.825 |
| TPP (cmH₂O·s) | 5.56 | 0.135 | 0.036 | 3.798±2.554 | 2.430±2.357 | 3.215±1.650 | 2.404±1.380 |
| FER (L·s⁻¹·cmH₂O⁻¹) | 4.68 | 0.196 | 0.023 | 0.398±0.107 | 0.708±0.631 | 0.460±0.122 | 0.731±0.934 |
Data are mean ± SD. No between-cohort difference was significant for any metric, and no pairwise comparison survived BH-FDR correction (all padj > 0.05; closest: TPP Asthmatic vs Smoker padj = 0.225; Table S3). The wide standard deviations of FER in the Asthmatic and Vaper groups reflect a small number of subjects with high FER values at low MIPS, which increases within-group dispersion and reduces the sensitivity of the non-parametric test to detect between-cohort differences. Abbreviations: PIF, peak inspiratory flow; MIPS, mask inspiratory pressure swing; TPP, inspiratory time-pressure product; FER, flow-effort ratio (PIF/MIPS); H (KW), Kruskal-Wallis test; η², epsilon-squared effect size; BH-FDR, Benjamini-Hochberg false discovery rate.
Table 3.
Linear mixed-effects model estimates for inspiratory pressure-flow metrics across incremental PEEP loading.
Table 3.
Linear mixed-effects model estimates for inspiratory pressure-flow metrics across incremental PEEP loading.
| Outcome | Model | Term | β (unit) | 95% CI | p | ICC |
| PIF | Simple | PEEP_c | +0.068 (L·s⁻¹·cmH₂O⁻¹) | +0.064 to +0.072 | <0.001 | 0.601 |
| PIF | Adjusted RS† | PEEP_c (Normal ref) | +0.048 (L·s⁻¹·cmH₂O⁻¹) | +0.034 to +0.063 | <0.001 | 0.601‡ |
| PIF | Adjusted RS† | Asthmatic × PEEP | +0.029 (L·s⁻¹·cmH₂O⁻¹) | +0.009 to +0.050 | 0.005 | — |
| PIF | Adjusted RS† | Smoker × PEEP | +0.017 (L·s⁻¹·cmH₂O⁻¹) | −0.004 to +0.038 | 0.109 | — |
| PIF | Adjusted RS† | Vaper × PEEP | +0.034 (L·s⁻¹·cmH₂O⁻¹) | +0.012 to +0.055 | 0.002 | — |
| PIF | Adjusted RS† | RR_c | −0.009 (L·s⁻¹·(breath/window)⁻¹) | −0.022 to +0.004 | 0.154 | — |
| PIF | Adjusted RS† | Ti/Ttot_c | +0.176 (L·s⁻¹) | −0.011 to +0.362 | 0.064 | — |
| MIPS | Simple | PEEP_c | +0.026 (—) | +0.008 to +0.044 | 0.004 | 0.678 |
| MIPS | Full RS†† | PEEP_c (Normal ref) | −0.044 (—) | −0.109 to +0.021 | 0.185 | 0.678‡ |
| MIPS | Full RS†† | Asthmatic × PEEP | +0.121 (—) | +0.029 to +0.214 | 0.010 | — |
| MIPS | Full RS†† | Smoker × PEEP | +0.062 (—) | −0.031 to +0.155 | 0.192 | — |
| MIPS | Full RS†† | Vaper × PEEP | +0.105 (—) | +0.011 to +0.200 | 0.029 | — |
| TPP | Simple | PEEP_c | +0.006 (s) | −0.030 to +0.042 | 0.740 | 0.636 |
| TPP | Full RI | BMI_c | +0.172 (cmH₂O·s·kg⁻¹·m²) | +0.078 to +0.267 | <0.001 | 0.608 |
| FER | Simple | PEEP_c | +0.023 (L·s⁻¹·cmH₂O⁻²) | +0.020 to +0.027 | <0.001 | 0.520 |
| FER | Full RI§ | PEEP_c | +0.025 (L·s⁻¹·cmH₂O⁻²) | +0.018 to +0.032 | <0.001 | 0.516 |
| FER | Full RI§ | Asthmatic × PEEP | −0.005 (L·s⁻¹·cmH₂O⁻²) | −0.015 to +0.005 | 0.357 | — |
| FER | Full RI§ | Smoker × PEEP | +0.000 (L·s⁻¹·cmH₂O⁻²) | −0.009 to +0.010 | 0.961 | — |
| FER | Full RI§ | Vaper × PEEP | −0.002 (L·s⁻¹·cmH₂O⁻²) | −0.011 to +0.008 | 0.758 | — |
PEEPc and Cohort × PEEP coefficients: β expresses the change in the outcome per 1 cmH₂O increase in centred PEEP (PEEPc = PEEP − 8.0 cmH₂O). The net PEEP slope for a given cohort is obtained by adding the reference slope and the corresponding interaction term (e.g., Asthmatic PIF net slope = 0.048 + 0.029 = +0.077 L·s⁻¹ per cmH₂O). Covariate coefficients: BMIc, β per 1 kg/m² above sample mean (24.64 kg/m²); RRc, β per 1 additional breath/window above sample mean (4.88); Ti/Ttotc, β per unit increase above sample mean (0.443). Simple: pooled model metric ~ PEEP_c (random intercept only), fitted separately for each metric. † PIF adjusted RS: random slopes per subject (REML; ΔAIC = 167 vs random intercept); includes RRc, Ti/Ttotc, Cohort × PEEP, and BMIc; n = 1257. †† MIPS full RS: random slopes per subject (REML; ΔAIC = 97 vs random intercept); includes Cohort × PEEP and BMIc; n = 1260. ‡ ICC from simple random-intercept model (metric ~ PEEP_c). § FER full RI: random intercept only; restricted to MIPS ≥ 0.3 cmH₂O and FER ≤ 95th percentile (1.311 L·s⁻¹·cmH₂O⁻¹); n = 1077. Abbreviations: PIF, peak inspiratory flow; MIPS, mask inspiratory pressure swing; TPP, inspiratory time-pressure product; FER, flow-effort ratio; RS, random slopes; RI, random intercept; REML, restricted maximum likelihood; ICC, intraclass correlation coefficient.
Table 4.
Linear mixed-effects model estimates for EIT-derived regional ventilation metrics across incremental PEEP loading.
Table 4.
Linear mixed-effects model estimates for EIT-derived regional ventilation metrics across incremental PEEP loading.
| Outcome | Model | Term | β (units) | 95% CI | p | ICC |
| FRIC | Full RS† | PEEP_c (Normal ref) | +0.18 (%·cmH₂O⁻¹) | −0.07 to +0.43 | 0.161 | 0.363‡ |
| FRIC | Full RS† | Asthmatic × PEEP | −0.03 (%·cmH₂O⁻¹) | −0.40 to +0.34 | 0.867 | — |
| FRIC | Full RS† | Smoker × PEEP | −0.13 (%·cmH₂O⁻¹) | −0.48 to +0.23 | 0.477 | — |
| FRIC | Full RS† | Vaper × PEEP | +0.04 (%·cmH₂O⁻¹) | −0.32 to +0.39 | 0.835 | — |
| FRIC | Simple | PEEP_c | +0.15 (%·cmH₂O⁻¹) | +0.07 to +0.22 | <0.001 | 0.363 |
| CoV | Full RS† | PEEP_c (Normal ref) | +0.061 (%·cmH₂O⁻¹) | +0.001 to +0.121 | 0.045 | 0.925‡ |
| CoV | Full RS† | Asthmatic × PEEP | −0.042 (%·cmH₂O⁻¹) | −0.130 to +0.046 | 0.352 | — |
| CoV | Full RS† | Smoker × PEEP | −0.010 (%·cmH₂O⁻¹) | −0.095 to +0.075 | 0.816 | — |
| CoV | Full RS† | Vaper × PEEP | −0.005 (%·cmH₂O⁻¹) | −0.089 to +0.080 | 0.912 | — |
| CoV | Simple | PEEP_c | +0.048 (%·cmH₂O⁻¹) | +0.031 to +0.066 | <0.001 | 0.925 |
| GI | Full RS† | PEEP_c (Normal ref) | +0.003 (cmH₂O⁻¹) | −0.000 to +0.007 | 0.079 | 0.610‡ |
| GI | Full RS† | Asthmatic × PEEP | −0.002 (cmH₂O⁻¹) | −0.007 to +0.004 | 0.522 | — |
| GI | Full RS† | Smoker × PEEP | −0.002 (cmH₂O⁻¹) | −0.008 to +0.003 | 0.386 | — |
| GI | Full RS† | Vaper × PEEP | −0.001 (cmH₂O⁻¹) | −0.006 to +0.004 | 0.770 | — |
| GI | Full RS† | BMI_c | −0.001 (kg⁻¹·m²) | −0.004 to +0.002 | 0.410 | — |
| GI | Simple | PEEP_c | +0.002 (cmH₂O⁻¹) | +0.001 to +0.003 | <0.001 | 0.610 |
PEEP_c and Cohort × PEEP coefficients: β expresses the change in the outcome per 1 cmH₂O increase in centred PEEP (PEEP_c = PEEP − 8.0 cmH₂O). The net PEEP slope for a given cohort is obtained by adding the reference slope and the corresponding interaction term. Covariate coefficients: BMI_c, β per 1 kg/m² above sample mean (24.64 kg/m²), included in all three Full RS models but reported only for GI, the metric for which it was retained in the final specification. n = 78 subjects; 1326 subject-PEEP observations. Simple: pooled model metric ~ PEEPc (random intercept only), fitted separately for each metric. † Full RS: random-slopes model (random intercept + random PEEP_c slope per subject; REML); includes C(Cohort), Cohort × PEEP, and BMI_c. ‡ ICC from simple random-intercept model (metric ~ PEEP_c), reported on the PEEP main-effect row for each metric. Abbreviations: FRIC, pendelluft fraction; CoV, Center of Ventilation; GI, Global Inhomogeneity index; EIT, electrical impedance tomography; RS, random slopes; REML, restricted maximum likelihood; ICC, intraclass correlation coefficient.
Disclaimer/Publisher’s Note: The statements, opinions and data contained in all publications are solely those of the individual author(s) and contributor(s) and not of MDPI and/or the editor(s). MDPI and/or the editor(s) disclaim responsibility for any injury to people or property resulting from any ideas, methods, instructions or products referred to in the content. |
© 2026 by the authors. Licensee MDPI, Basel, Switzerland. This article is an open access article distributed under the terms and conditions of the Creative Commons Attribution (CC BY) license (http://creativecommons.org/licenses/by/4.0/).
Copyright: This open access article is published under a Creative Commons CC BY 4.0 license, which permit the free download, distribution, and reuse, provided that the author and preprint are cited in any reuse.


