
Submitted:
04 August 2026
Posted:
05 August 2026
You are already at the latest version
Abstract
Alzheimer's disease is a disorder of large-scale brain networks, in which pathology propagates along the connectome and degrades it through synaptic and axonal loss. Cognition depends on distributed regions synchronizing their activity, and that synchronization carries a physical cost, set by how many white-matter connections must be engaged, and how strongly, before a network settles into coordinated activity. That cost measures what a damaged network can still coordinate, and not only which connections it has lost. How that cost changes across the disease continuum remains unquantified. Here, we apply QUIET, an edge-centric network-control framework, to the Alzheimer's Disease Neuroimaging Initiative cohort spanning cognitively unimpaired, prodromal, and dementia stages. QUIET integrates the structural controllability of individual white-matter connections with the mutual information between functional timeseries to quantify the control energy required to synchronize a brain network. We found that the QUIET-derived control energy followed an inverted-U along the amyloid--tau axis, rising under early genetic and amyloid risk, peaking at the amyloid-positive, pre-tau stage, and falling as tau accumulated. APOE-\(\epsilon\)4 carriage raised control energy before any detectable pathology, an elevation carried almost entirely by assigned female at birth (AFAB) individuals. Entorhinal tau marked the descending phase, and a large, network-specific hemispheric asymmetry persisted from cognitively normal to Alzheimer's brains. QUIET-derived control energy correlates with the established markers of Alzheimer's disease (cortical amyloid, entorhinal tau, and APOE-\(\epsilon\)4 carriage) in a stage- and sex-dependent manner.
Keywords:
edge controllability
; control energy
; alzheimers
1. Introduction
Neurodegenerative diseases are increasingly recognized as disorders of distributed brain networks rather than as independent, progressive failure of individual regions [1,2]. Alzheimer’s disease is the paradigmatic example, long described as a disconnection syndrome [3]. Amyloid- deposition concentrates in densely interconnected association hubs that form the structural core of the cortex [4]. Neurofibrillary tau pathology propagates trans-synaptically along white-matter pathways, such that the topology of the healthy connectome predicts where atrophy and hypometabolism later emerge [5,6,7,8,9,10,11]. Hence, the connectome serves a dual role: the very pathways that support the brain’s coordinated functional dynamics are those along which the disease travels [12].
Functional imaging directly tracks the coordinated activity those pathways support. Default-mode connectivity is already degraded in mild Alzheimer’s disease [13], and the same resting-state systems change in individuals who carry risk while remaining cognitively intact [14]. Graph analyses of fMRI, EEG, and MEG converge on a loss of the efficient small-world organization of the healthy brain, with the densely connected hubs of association cortex the most disrupted [15,16,17,18,19]. The disruption is not uniform: connectivity rises before it falls, frontal and salience systems strengthening while posterior systems weaken [18,20], a bi-phasic course already visible in cohorts staged by amyloid and tau rather than by symptoms alone [21]. Computational models also support a biphasic disease trajectory, in which early hyper-activity accelerates the degeneration of the very hubs that carry it and oscillatory slowing follows [22,23,24,25]. The resulting disorganization depends jointly on disease stage and on network topology [26]. A network perspective on Alzheimer’s disease calls for measures that reach beyond the location of lost connections to quantify how efficiently the surviving architecture can still organize the synchronized activity on which cognition depends.
Network control theory provides such a measure, one that already tracks clinical variation across brain disorders. The framework treats the connectome as a dynamical system whose trajectory through state space can be steered by external input delivered at selected brain regions, and the associated control energy quantifies how much input a desired state transition demands [27,28,29]. The regional controllability metrics derived from the structural network capture how white-matter connections shape the energy landscape of accessible dynamics [30]. In schizophrenia, bipolar disorder, and major depression, regional controllability and control energy track symptoms and genetic risk [31,32,33,34]. In the neurodegenerative setting, control energy correlates with cognitive impairment in multiple sclerosis [35], and controllability separates cognitively normal, mildly impaired, and Alzheimer’s brains [36].
Two limitations constrain how network control theory has been applied to Alzheimer’s disease whose core deficit lies in the communication between regions rather than in the regions themselves [3,17,26]. The control in these node-centric models is injected into whole regions, so the framework cannot specify which individual white-matter connections should carry the signal that synchronizes a circuit. Moreover, regional controllability is treated as a fixed structural property, even though the capacity to control neural dynamics changes throughout development and plausibly across a disorder that progressively degrades connections [37]. An edge-centric approach would address all two by assigning control energy to specific pathways, allowing that energy to vary as pathology advances, and spanning the course from genetic risk to overt disease [38,39,40].
The pathophysiology of Alzheimer’s disease unfolds as a staged process that begins years before the first symptoms appear [41,42]. Amyloid- deposition arises first and plateaus early, tau pathology follows and tracks neurodegeneration, and ultimately synaptic and neuronal loss drives cognitive decline [43]. Neurofibrillary tangles typically appear first in the entorhinal cortex and spread in a predictable manner into limbic and eventually neocortical regions [44]. The NIA-AA research framework formalizes this progression as a biological A/T(N) classification (amyloid, tau, and neurodegeneration scored independently) that stages individuals by pathology rather than by clinical label [45,46]. Genetic risk shifts the entire trajectory earlier: the 4 allele of APOE raises lifetime risk in an allele-dose-dependent manner and lowers the mean age of onset by several years per copy, acting through impaired amyloid clearance and aggregation, as well as an accelerated connectivity-mediated spread of tau [47,48,49]. Sex shapes the disease beyond differences in longevity: assigned female at birth (AFAB) individuals carry a higher lifetime risk than assigned male at birth (AMAB) individuals, show greater tau deposition at a given amyloid level, and are more vulnerable to APOE-4 [50,51,52,53]. However, no existing framework links edge-level control energy across this whole arc: from inherited risk, through biologically defined pathological stage, to the sex-related genetic differences that condition both.
Here, we apply QUIET, an edge-centric framework that quantifies the control energy required to synchronize a functional brain network, to the Alzheimer’s Disease Neuroimaging Initiative (ADNI) [40,54,55] (Figure 1). We estimate QUIET-derived control energy for five of the seven functional networks in each participant: limbic, dorsal attention, salience, frontoparietal, and default mode [56,57]. Sensorimotor and visual networks were excluded due to ceiling and floor effects in baseline synchronization, respectively [40]. We relate it to clinical diagnosis, sex assigned at birth, hemisphere, entorhinal tau, cortical amyloid, APOE-4 genotype, and the amyloid/tau (A/T) staging axis. We found that the control energy traced an inverted-U along that axis, peaking at the amyloid-positive, pre-tau stage and declining once tau accumulated, with entorhinal tau marking the descending phase. APOE-4 carriers required more control energy than non-carriers in every network at the pre-pathology stage, and that the 4 effect was carried almost entirely by AFAB participants. The two hemispheres differed markedly in the energy required to synchronize the same network, a network-specific asymmetry that persisted into Alzheimer’s disease. Together, these results place the energetic cost of network synchronization on a single axis that tracks genetic risk, pathological stage, and biological sex.
2. Results
2.1. QUIET-Derived Control Energy is Reduced in Alzheimer’s Disease and Shaped by Biological Sex and Hemisphere
QUIET quantifies the control energy required to synchronize a functional brain network by integrating the structural controllability of individual white-matter connections with the mutual information they carry [40]. We computed network-resolved control energy for every cognitively normal (CN, ) and Alzheimer’s disease (AD, ) scan, and quantified its dependence on diagnosis, sex assigned at birth, and hemisphere across the five networks (Figure 2).
Alzheimer’s disease disrupts large-scale functional networks, and the two connectomes (functional and structural) degrade on different schedules. Default-mode functional connectivity is already reduced at the earliest amyloid stages, before any detectable atrophy or hypometabolism [58,59], whereas macroscopic neurodegeneration arrives late, more than a decade after amyloid positivity [42,43]; structural network topology is altered between the two, already in preclinical cohorts [60]. Both substrates are compromised by the overt-AD stage [1,2,3]. QUIET sets each network’s synchronization target to the ceiling that its own connectome can achieve, so a disconnected network is held to a lower target and reaches it with fewer edges and weaker coupling [40]. The ceiling and the energy needed to reach it fall together, so a lower value marks reduced capacity and not cheaper control. We expected control energy at the overt-AD stage to fall below cognitively normal levels in every network. The QUIET-derived control energy was lower in AD than CN in all five networks, yet no single network reached significance: limbic (Cliff’s , 95% CI , ), dorsal attention (, , ), salience (, , ), frontoparietal (, , ), and default mode (, , ) (Figure 2A). Every confidence interval crossed zero, so we interpret this pattern as a consistent downward direction rather than a network-specific deficit. The cognitively normal group spans several biological stages, and the amyloid-positive individuals within it sit near the ascending phase, which widens the CN distribution and weakens a comparison drawn on clinical labels alone.
Sex chromosomal differences shape the organization of structural and functional brain networks [61,62], with the most pronounced differences in higher-order association networks [63]. AFAB people show greater local efficiency than AMAB people [64], an organization that predicts a lower cost of synchronization [65]. In healthy young adults, QUIET recovered this pattern directly: AFAB participants required less control energy than AMAB participants in the frontoparietal and salience networks [40]. We expected AFAB participants here to require less control energy as well. Across the cohort (AFAB , AMAB ), the direction held, but the effect was confined to the limbic network, where control energy was lower in AFAB than AMAB participants (Cliff’s , 95% CI , ); the remaining networks did not differ by sex assigned at birth (dorsal attention , ; salience , ; frontoparietal , ; default mode , ) (Figure 2B). QUIET recovered these sex differences from connectome inputs alone, with no demographic variables in the model.
Large-scale brain networks are functionally lateralized, with attentional and executive-control systems biased toward the right hemisphere and default-mode, language-associated regions toward the left [66,67]. We examined whether QUIET-derived control energy inherits this lateralization and whether it survives the disconnection of Alzheimer’s disease, which alters neuroanatomical asymmetry [68]. We measured hemispheric asymmetry as the median of the paired left-minus-right difference in control energy, with negative values denoting higher right-hemisphere control energy (Wilcoxon signed-rank test). Attention and control networks carried higher control energy in the right hemisphere in the CN group (dorsal attention , ; salience , ; frontoparietal , ), whereas the default mode was left-dominant (, ) and the limbic network showed only a small left-dominant bias (, ) (Figure 2C). In the AD group, these asymmetries persisted with the same sign and comparable magnitude (dorsal attention , ; salience , ; frontoparietal , ; default mode , ). Only the limbic asymmetry lost significance (, ), and it was by far the smallest in cognitively normal brains, measured in the smallest and noisiest of the five networks. Limbic and anterior temporal cortex carry neurofibrillary pathology and neuronal loss from the earliest stages of the disease [44,68,69]. The magnitude of these effects and their persistence into AD identify hemispheric asymmetry as an intrinsic, network-specific property of control energy rather than a consequence of disease [66].
2.2. QUIET-Derived Control Energy Tracks Alzheimer’s Disease Pathology
Neurofibrillary tau pathology typically originates in the transentorhinal and entorhinal cortex and propagates trans-synaptically along axonal projections into anatomically connected cortical regions [7,9,44]. Tau-PET quantifies neurofibrillary burden region by region as a standardized uptake value ratio (SUVR), and we take the entorhinal SUVR as the marker of this earliest stage in living participants [70]. The limbic network occupies the paralimbic cortex that tau reaches earliest after the entorhinal region [44], making it the first functional subnetwork in our parcellation in which a pathology-linked change in control energy should appear. Tau accumulation coincides with synaptic loss and network hypoactivity [71,72], which lower that ceiling. We expected limbic control energy to fall as entorhinal tau rises. Limbic control energy declined with entorhinal tau across subjects (Spearman , , ; earliest scan per subject; Figure 3A).
Tau does not remain confined to its site of origin; connectivity- and function-based models predict its extension into the default mode network, a hub-rich association system anatomically remote from the entorhinal cortex [4,8,10]. Entorhinal tau serves as the predictor in both panels because it rises from the earliest stage, whereas default mode tau moves only once the disease is advanced; a seed remote from the target network also tests spread rather than local co-occurrence. Default mode control energy likewise decreased with entorhinal tau (, , ; Figure 3B).
Fibrillar amyloid- deposits early in default mode and association cortices [4], and we quantified its burden on the Centiloid scale from amyloid PET [73]. Amyloid tracked the hemispheric balance of dorsal attention control: the energy-asymmetry index declined with Centiloid burden (, , ; Figure 3C). The magnitude of control energy showed no monotonic relationship to amyloid in any network, unlike tau. A rank correlation detects only monotonic trends, and the staged analysis in the next section revisits amyloid without that restriction.
2.3. Genetic Risk, Pathological Stage, and Biological Sex Shape QUIET-Derived Control Energy
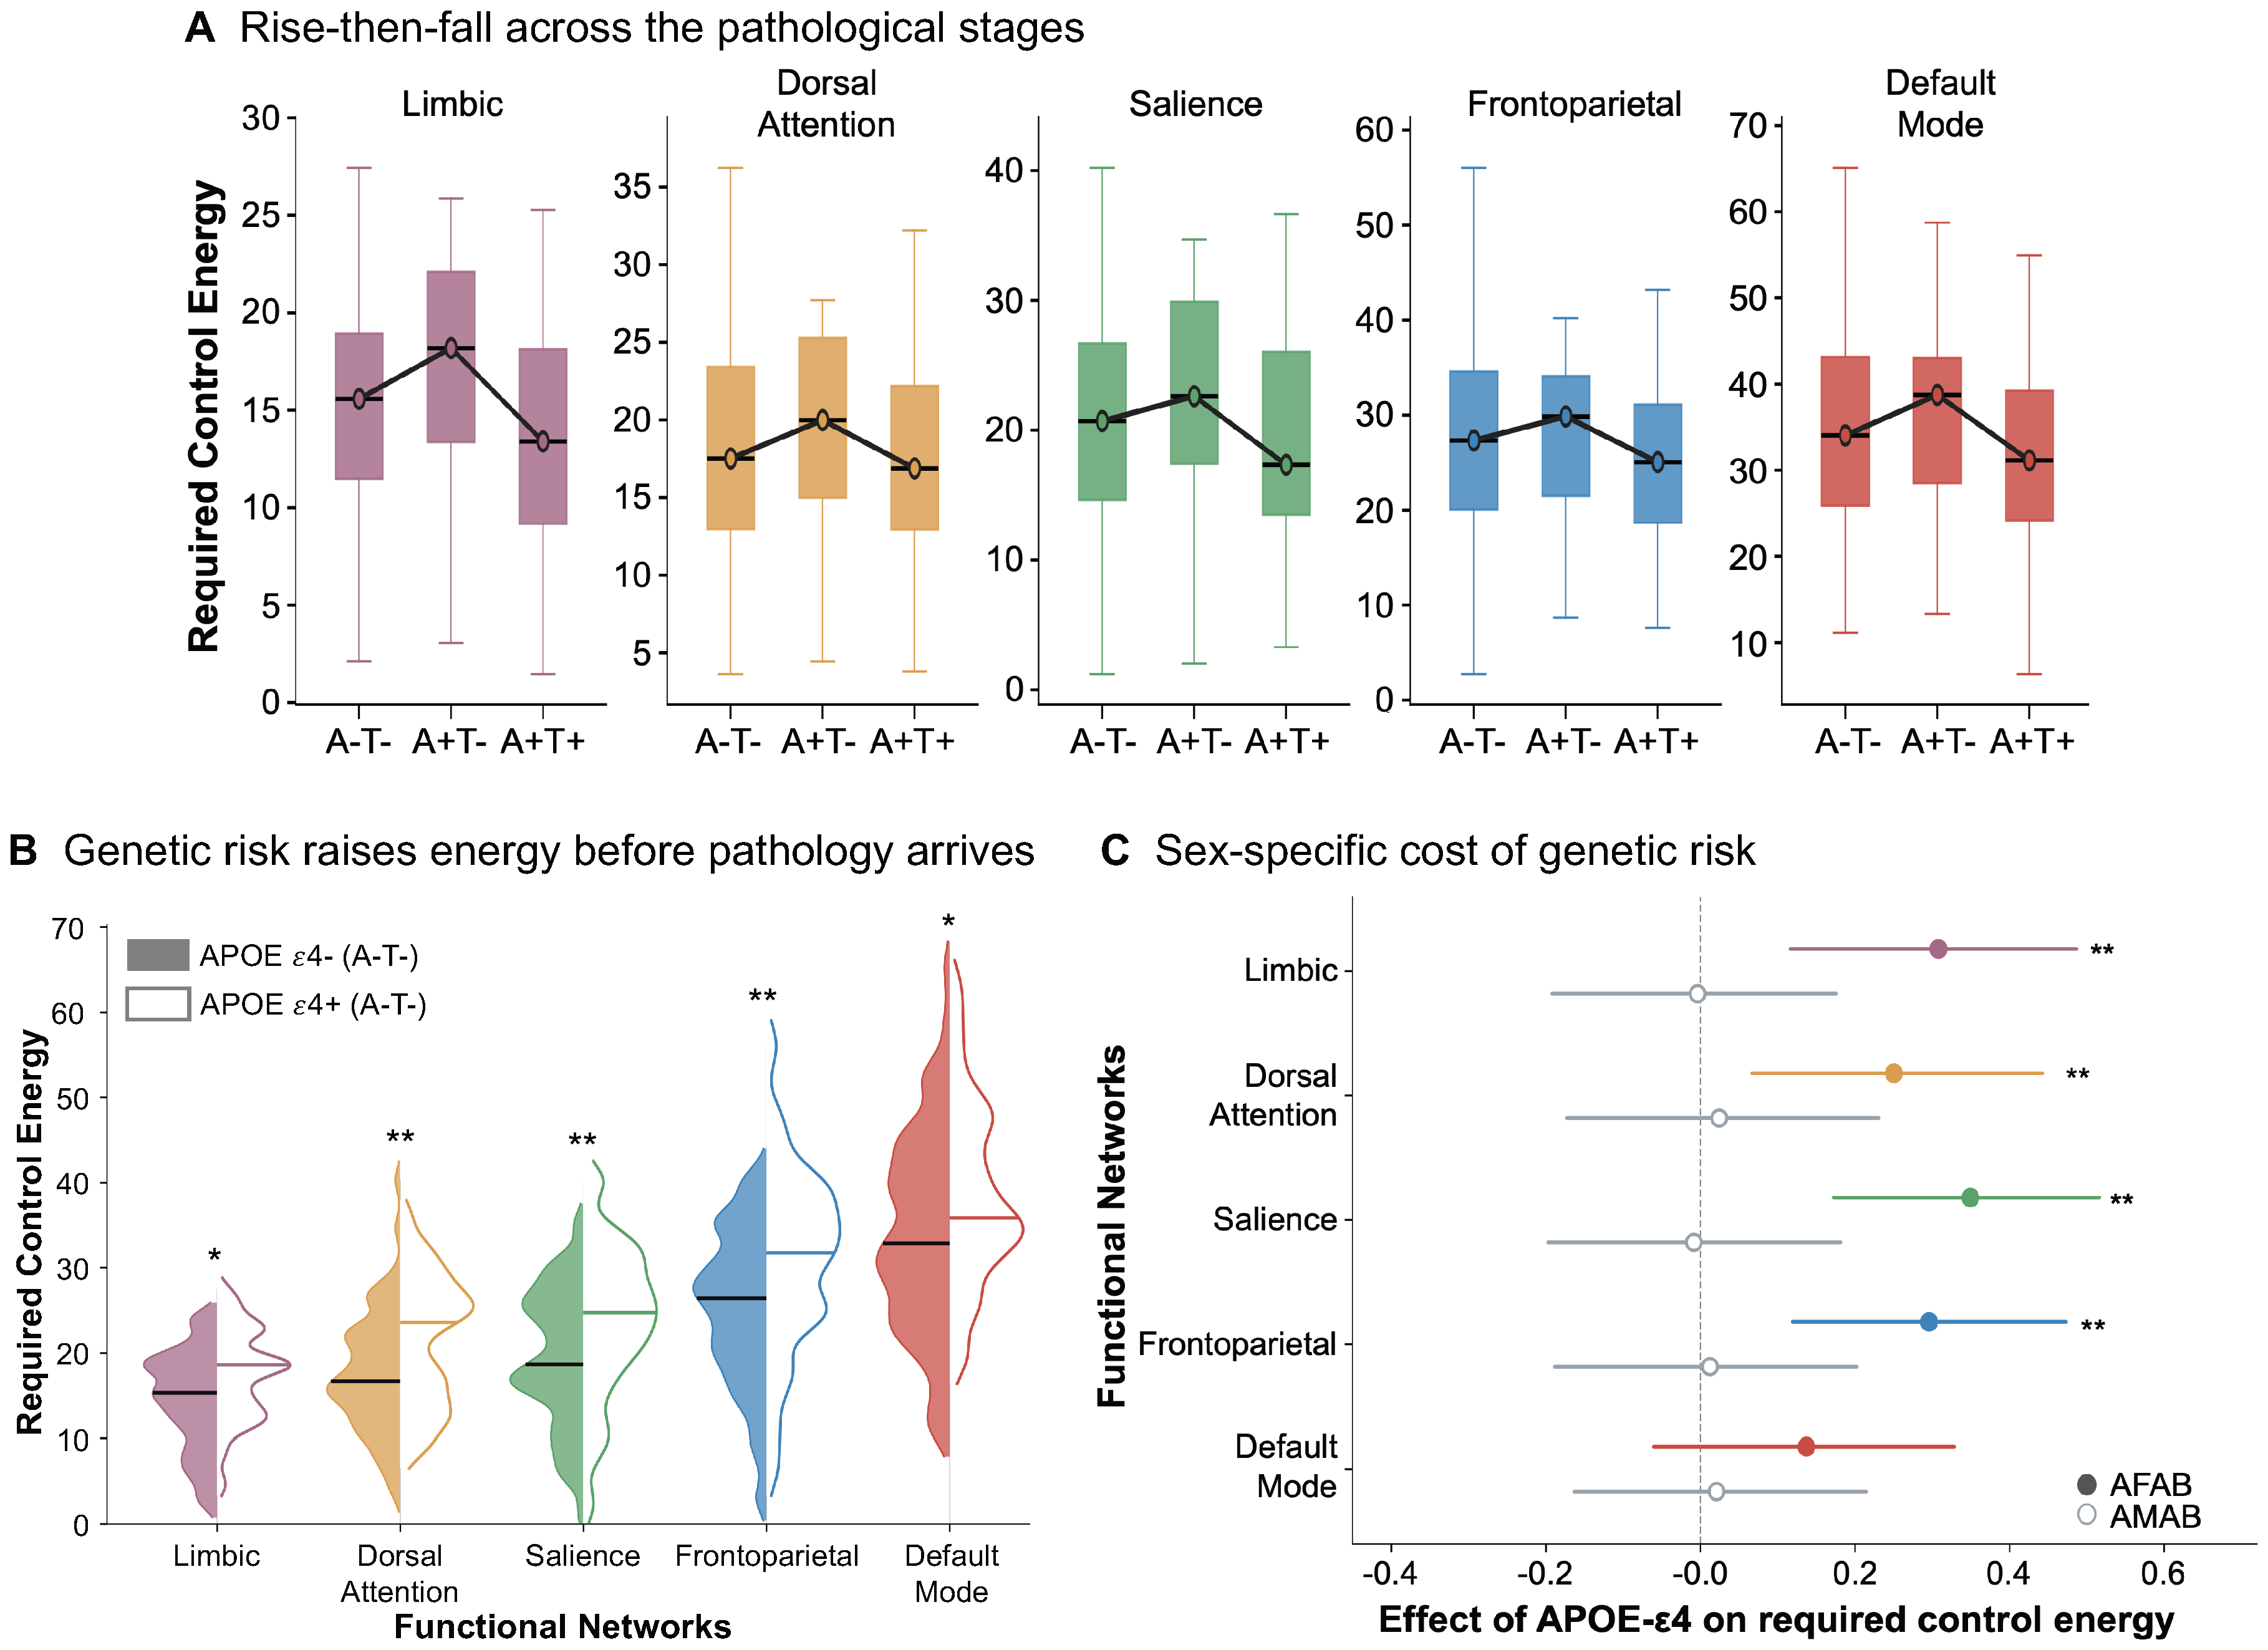
The amyloid/tau (A/T) research framework defines Alzheimer’s disease by biomarker status rather than by clinical syndrome, and applies across the continuum from cognitively unimpaired individuals to dementia [45]. We stratified participants along this axis into pre-pathology (A−T−, ), amyloid-positive but pre-tau (A+T−, ), and amyloid- and tau-positive (A+T+, ) groups, and quantified how QUIET-derived control energy [40] tracks this progression. Neural activity follows a non-monotonic course across the continuum: amyloid deposition co-occurs with neuronal and network hyper-excitability while cognition is still intact [1,74,75,76], whereas the subsequent spread of tau coincides with synaptic loss and network hypo-activity [9,71,72]. Functional connectivity follows the same two-phase course, rising in amyloid-positive individuals with low tau and falling once tau accumulates [20]. Resting EEG connectivity traces an inverted-U against amyloid burden in preclinical cohorts, read there as compensation that is overwhelmed at the highest amyloid loads [77]. Hyper-excitability raises that ceiling, so an amyloid-positive network is driven further and at greater total cost. We expected control energy to rise from A−T− to A+T− and then fall as tau burden mounts, tracing an inverted-U. The median control energy rose and fell as predicted in all five networks, peaking at the A+T− stage and declining thereafter: limbic (15.6 – 18.2 – 13.5), dorsal attention (17.7 – 20.0 – 17.4), salience (21.2 – 23.8 – 17.4), frontoparietal (27.3 – 29.9 – 25.0), and default mode (34.1 – 38.7 – 32.0; Figure 4A). The quadratic contrast that tests for a mid-stage peak was significant in limbic () and salience (), and did not reach significance in dorsal attention, frontoparietal, or default mode. Within limbic and salience the fall from the peak was significant ( and ), as was the rise into it in salience (); the rise in limbic did not reach significance (). In all five networks the fall from the peak carried a smaller p-value than the rise into it, matching the tau-linked decline. The trajectory is consistent with a stage-dependent shift from compensatory engagement toward pathology-driven disengagement [78], and recovers in control-energetic terms the hyper-connectivity-then-hypo-connectivity sequence reported for the salience and default mode networks across these same amyloid and tau stages [20].
The allele of APOE is the strongest common genetic risk factor for late-onset Alzheimer’s disease [48], and cognitively normal carriers show heightened task-evoked activation and resting hyper-connectivity years before symptom onset [79,80], alongside the regional metabolic changes that mark the preclinical phase in carriers [81]. If QUIET-derived control energy captures this early hyper-engagement, carriers should require more energy than non-carriers at the pre-pathology stage, where the genotype effect is best isolated from downstream amyloid and tau. Within the A−T− group ( non-carriers, carriers), carriers required significantly more control energy across all five networks (Cliff’s ): limbic (, ), dorsal attention (, ), salience (, ), frontoparietal (, ), and default mode (, ; Fig. 4B). The largest shift occurred in the dorsal attention subnetwork, where the median energy rose from 16.7 to 23.6 (). This carrier penalty was confined to the earliest stage and was no longer detectable by A+T+, consistent with an -driven elevation that is later subsumed by the tau-associated decline.
The APOE effect on Alzheimer’s disease risk, tau accumulation, and clinical progression is stronger in AFAB than AMAB individuals [51,52,82]. We stratified the carrier-minus-non-carrier difference by sex within the pre-pathology stage. The elevation was carried almost entirely by AFAB participants (Cliff’s [95% CI]): limbic ( [0.115, 0.469], ), dorsal attention ( [0.035, 0.411], ), salience ( [0.134, 0.490], ), frontoparietal ( [0.102, 0.456], ), and default mode ( [, 0.349], ; Figure 4C). All AFAB confidence intervals except that for the default mode network excluded zero, with the salience network showing the largest and most significant carrier effect. AMAB carriers showed no elevation in any network, with every effect near zero and every confidence interval containing zero (all ). The female-specific vulnerability to Alzheimer’s disease is driven in part by [50,83], and that contribution carries a defined network signature here: the largest carrier effects in AFAB participants fall in the limbic and salience networks, the same two in which the staged decline was resolved.
3. Discussion
Alzheimer’s pathology spreads through the brain along white-matter connections, and the synaptic and axonal loss that follows degrades those same connections [3]. Cognition depends on them to coordinate activity across distributed regions [12]. Existing methods record which connections are lost, and how functional connectivity rises and then falls across the disease course [19,20], but they leave unanswered what it costs the surviving network to hold itself in a coordinated state. Whether that cost declines steadily as connections are lost, or instead follows the two-phase course of the pathology, was an open question, as was the degree to which inherited risk and sex shape it. QUIET answers these questions by treating brain network control as an edge-centric problem, integrating the structural controllability of individual white-matter connections with the mutual information between pairwise functional timeseries to yield the control energy required to synchronize a target network along its most energy-efficient pathways [40]. We applied it to the ADNI cohort and traced how that energy reorganizes across the biological progression of Alzheimer’s disease. The control energy did not vary monotonically with disease stage. Instead it traced an inverted-U, rising above cognitively unimpaired levels under early genetic and amyloid risk, the same non-monotonic shape that resting EEG metrics show against amyloid burden in preclinical cohorts [77]. The curve peaked near the amyloid-positive, pre-tau stage, then declined as entorhinal tau accumulated and overt dementia emerged.
This trajectory correlates with the emergence of amyloid and tau that defines the disease timeline [43]. The energetic cost of coordinated dynamics is itself a stage-dependent property of the diseased connectome. Early network hyper-function and late network disconnection are two phases of one trajectory rather than separate phenomena: both change how far a network can be driven toward synchrony, upward while amyloid accumulates and downward once tau spreads, and the control energy required follows that ceiling up and back down [3,20,74,78,84].
The rising phase of this curve appears before tau pathology. APOE-4 carriers increased the energy required to bring networks into synchrony well before any measurable pathology, and that energy reached its peak at the amyloid-positive, pre-tau stage. The elevated control cost at this stage matches the early hyper-connectivity and neuronal hyper-excitability reported in at-risk but cognitively intact populations [76]. Young APOE-4 carriers show heightened default-mode activation long before any symptoms [80], and task-evoked hyper-activation is a hallmark of the prodromal stage [85]. Amyloid accumulation co-occurs with excess excitatory network activity [1], and pharmacologically dampening that hyper-activity can transiently improve memory [86,87,88]. The APOE-4 effect on control energy was carried almost entirely by AFAB participants. APOE-4 confers disproportionate AD risk in AFAB individuals, and chromosomal sex modifies the coupling among amyloid, tau, and downstream network change [50,51,52,53]. The energetic signature of early pathology is itself sex-dependent.
The descending phase emerged as entorhinal tau accumulated and participants progressed to overt Alzheimer’s disease, with control energy declining across networks. This decline is the energetic counterpart of the disconnection long proposed as a core mechanism of the disease [3,44]. The progressive loss of long-range white-matter integrity and functional coupling degrades the substrate over which coordinated dynamics are built [13]. That structure normally shapes and constrains function [12]. Tau pathology spreads trans-neuronally along connected pathways and is well described by network-diffusion and epidemic-spreading models of atrophy [7,8,9,11,72]. The highly connected cortical hubs that organize large-scale communication are preferentially burdened by this pathology [2,4]. The outcome is a progressive failure of network function across the disease spectrum [78]. A connectome that is being dismantled offers fewer viable control pathways and less residual coupling to exploit [19,27], so its ceiling and the energy needed to reach it fall together. That fall tracks a diminished capacity for coordinated dynamics. The convergence of the rising and falling phases at a single peak locates the maximal control burden at the amyloid-positive, pre-tau transition. This is where the disease pivots from hyper-function toward failure.
The control energy also varied along an axis unrelated to the disease. The two hemispheres differed markedly in the energy required to synchronize the same network. The asymmetry in brain structure and connectivity is well documented [89,90]. To our knowledge, its expression in the cost of controlling network dynamics has not been described. The difference implies that the hemispheres are not merely anatomically lateralized. They occupy systematically different positions in control space. Synchronizing a given network is intrinsically cheaper on one side than on the other. The asymmetry was network-specific, differing in magnitude and in some systems in direction across the limbic, dorsal attention, salience, frontoparietal, and default mode networks. This pattern reflects the detailed wiring of each network rather than a global hemispheric bias. Control energy carries two separable signals: a stable lateralized component set by network wiring, and a second that moves with pathology.
The current set of analyses has several constraints. The staging comparisons are cross-sectional, so the inverted-U is drawn from differences between groups rather than from within-subject change, and the estimates inherit the modeling and reliability assumptions of the underlying framework [40,65,91,92]. Following the same individuals over time is the clearest next step, both to test the within-subject trajectory and to anchor it to established biomarker timelines [93]. The extension of edge-level control energy to the developing brain, using functional parcellations of neonatal and infant connectomes, would test whether the same principles govern circuit maturation [94]. Integration with models of targeted stimulation could turn edge-level control costs into candidate intervention targets [95]. Neuronal activity also regulates the pathology itself. Synaptic activity drives interstitial amyloid- [96,97] and stimulates the release and trans-synaptic spread of tau [98,99], amyloid-associated hyper-connectivity accelerates that spread in patients [72], and models in which activity drives degeneration reproduce the same coupling [22,100]. Edge-level control that redistributes activity would then reach the pathology itself, and not only its functional consequences [86]. By assigning the energetic cost of synchronization to individual white-matter connections, QUIET-derived control energy captures the reorganization of brain networks across the Alzheimer’s continuum along a single, stage- and sex-dependent axis. That axis tracks how the disease unfolds, and points to where its course might be redirected.
4. Methods
4.1. The QUIET Framework
QUIET is an edge-centric network-control framework that quantifies the control energy required to drive a functional brain network toward a synchronized state [40]. The framework departs from conventional node-centric controllability by treating each white-matter tract as the elementary unit of control, integrating the structural controllability of individual edges with an information-theoretic measure of the functional coupling those edges support [40]. Each edge thereby receives a control-energy contribution, and we aggregate these contributions within anatomically and functionally defined subnetworks to obtain a network-level control-energy value. The synchronization target is set separately for each participant and network, at 95% of the highest synchronization that the connectome can reach, and the control energy is the number of perturbed edges multiplied by their coupling strength [40]. A detailed description of the full QUIET framework can be found in Mohapatra et al. (2026) [40]. We analyzed the five networks retained by the QUIET methods paper: limbic, dorsal attention, salience, frontoparietal, and default mode [40]. The sensorimotor and visual networks were set aside because their synchronization gain, the phase-locking value reached under optimization minus the baseline value, is near zero in both: sensorimotor cortex starts at the highest baseline of the seven, and visual cortex barely rises above its own [40]. Both also sit at the sensory end of the cortical hierarchy, where structure-function coupling is strongest [40] and Alzheimer’s pathology arrives last [44]. For every participant, we computed control energy separately for each of the five functional networks under study and, within each network, separately for the left and right hemispheres; these hemisphere-resolved values support the asymmetry analyses described below. The resulting per-network control energy is the single readout carried through every subsequent analysis, related to clinical group, sex, hemisphere, molecular pathology, and genotype (Figure 1).
4.2. Image Acquisition and Preprocessing
The imaging came from ADNI-3, acquired on Philips, Siemens, and GE 3T scanners [54,101]. For each participant, the DICOM series were screened for a non-multiband resting-state BOLD run (TR 2900–3100 ms), a single-shell axial diffusion scan ( s/mm2), and a T1-weighted MPRAGE or IR-FSPGR volume. Only participants whose T1, BOLD, and diffusion scans were acquired at the same visit, matched on acquisition date, were retained. The retained series were converted to BIDS with dcm2bids (v3.2.0) and dcm2niix, with Philips diffusion sidecars patched for missing phase-encoding metadata.
Quality control before preprocessing removed short BOLD runs (under 5 min), low-direction diffusion acquisitions (fewer than 16 directions), and corrupt or incomplete series. FreeSurfer recon-all outputs fed both preprocessing pipelines: fMRIPrep (24.1.1) for the functional data, resampled to MNI152NLin6Asym at 2 mm, and QSIPrep (1.1.1) with QSIRecon (1.2.0) for diffusion preprocessing and tractography with the Schaefer 400 cortical atlas [57]. A second quality-control pass, after fMRIPrep, removed scans with mean framewise displacement (FD) above 0.5 mm, more than 20% scrubbed volumes (FD above 0.5 mm), fewer than 100 volumes survived motion correction, or tractography failure, yielding the final sample of 215 CN, 113 EMCI, 44 LMCI, and 81 AD scans (453 total). The resulting timeseries and structural matrices were trimmed to include only the 400 cortical regions.
The diagnosis, sex assigned at birth, and hemisphere contrasts (Figure 2) are scan-level, treating each imaging session as an independent observation, and comparing cognitively normal with Alzheimer’s disease scans alone (CN , AD ). The pathology, staging, and genotype analyses (Figure 3 and Figure 4) are subject-level, averaging sessions within each participant, and span the full continuum including both mild cognitive impairment groups (301 subjects: 172 CN, 51 EMCI, 25 LMCI, 53 AD), with the analyzed n set by biomarker availability and reported alongside each result.
4.3. Amyloid and Tau Biomarkers
Amyloid burden was quantified from amyloid PET as a cortical standardized uptake value ratio (SUVR) and expressed on the Centiloid scale to harmonize across radiotracers and sites [73,102]. Tau burden was quantified from flortaucipir PET; the regional analyses used the entorhinal SUVR as the earliest cortical marker of neurofibrillary pathology [70], and A/T staging used a temporal-lobe meta-region of interest sensitive to early tau [103].
4.4. APOE Genotyping and A/T Staging
APOE genotype was determined for each participant through the ADNI genetics core, and we classified individuals as carriers (at least one allele) or non-carriers [104,105]. Amyloid (A) and tau (T) positivity were each defined by thresholding the corresponding PET measure at previously established cut points [45,46,106]. We combined these two binary markers into three ordered biological stages that span the early Alzheimer’s disease course: amyloid-negative, tau-negative (A−T−); amyloid-positive, tau-negative (A+T−); and amyloid-positive, tau-positive (A+T+) [45]. The amyloid-negative, tau-positive combination, which lies off the canonical amyloid-initiated sequence and is uncommon, was not treated as a separate stage [45]. This ordering reflects the model in which amyloid accumulation precedes and precipitates the spread of tau, and it defines the axis along which we test the predicted inverted-U in control energy [9,45]. We stratified analyses of genetic and amyloid risk by sex assigned at birth (AMAB; AFAB) to test the predicted sex-specificity of these effects.
4.5. Statistical Analysis
All analyses were nonparametric, matching the bounded, non-Gaussian distribution of control energy and the modest, unequal group sizes. The group differences were quantified with Cliff’s , with 95% confidence intervals from bias-corrected and accelerated bootstrap resampling and magnitudes read against the conventional effect-size bands [107,108,109]. Associations with the continuous amyloid and tau biomarkers were tested with Spearman’s rank correlation (). Hemispheric asymmetry was tested within each network by the Wilcoxon signed-rank test on paired left- and right-hemisphere energy, and compared between groups by the Wilcoxon rank-sum test [110]. The predicted inverted-U was tested by orthogonal polynomial contrasts across the three ordered A/T stages, the quadratic component distinguishing a mid-stage peak from a monotonic trend, with significance assessed by permutation. We controlled the false discovery rate across the five networks with the Benjamini-Hochberg procedure [111], report two-sided tests, and treat as significant.
Citation Diversity Statement
Recent work in several fields of science has identified a bias in citation practices such that papers from women and other minority scholars are under-cited relative to the number of such papers in the field [112,113,114,115,116,117,118,119,120]. Here we sought to proactively consider choosing references that reflect the diversity of the field in thought, form of contribution, gender, race, ethnicity, and other factors. First, we obtained the predicted gender of the first and last author of each reference by using databases that store the probability of a first name being carried by a woman [116,121]. By this measure (and excluding self-citations to the first and last authors of our current paper), our references contain 9.0% woman(first)/woman(last), 12.0% man/woman, 20.0% woman/man, and 59.0% man/man. This method is limited in that a) names, pronouns, and social media profiles used to construct the databases may not, in every case, be indicative of gender identity and b) it cannot account for intersex, non-binary, or transgender people. Second, we obtained the predicted racial/ethnic category of the first and last author of each reference by databases that store the probability of a first and last name being carried by an author of color [122,123]. By this measure (and excluding self-citations), our references contain 9.94% author of color (first)/author of color(last), 9.32% white author/author of color, 25.54% author of color/white author, and 55.20% white author/white author. This method is limited in that a) names and Florida Voter Data to make the predictions may not be indicative of racial/ethnic identity, and b) it cannot account for Indigenous and mixed-race authors, or those who may face differential biases due to the ambiguous racialization or ethnicization of their names. We look forward to future work that could help us to better understand how to support equitable practices in science.
Author Contributions
Conceptualization: S.M., D.S.B. Methodology: S.M., I.L.A., C.G.A., D.S.B. Data Analyses, Writing—Original Draft: S.M., I.L.A., C.G.A. Writing—Review & Editing: S.M., I.L.A., C.G.A., J.D., D.S.B. Supervision: D.S.B.
Funding
Data collection and sharing for the Alzheimer’s Disease Neuroimaging Initiative (ADNI) is funded by the National Institute on Aging (National Institutes of Health Grant U19AG024904). The grantee organization is the Northern California Institute for Research and Education. In the past, ADNI has also received funding from the National Institute of Biomedical Imaging and Bioengineering, the Canadian Institutes of Health Research, and private sector contributions through the Foundation for the National Institutes of Health (FNIH), including generous contributions from the following: AbbVie, Alzheimer’s Association; Alzheimer’s Drug Discovery Foundation; Araclon Biotech; BioClinica, Inc.; Biogen; Bristol- Myers Squibb Company; CereSpir, Inc.; Cogstate; Eisai Inc.; Elan Pharmaceuticals, Inc.; Eli Lilly and Company; EuroImmun; F. Hoffmann-La Roche Ltd and its affiliated company Genentech, Inc.; Fujirebio; GE Healthcare; IXICO Ltd.; Janssen Alzheimer Immunotherapy Research & Development, LLC.; Johnson & Johnson Pharmaceutical Research & Development LLC.; Lumosity; Lundbeck; Merck & Co., Inc.; Meso Scale Diagnostics, LLC.; NeuroRx Research; Neurotrack Technologies; Novartis Pharmaceuticals Corporation; Pfizer Inc.; Piramal Imaging; Servier; Takeda Pharmaceutical Company; and Transition Therapeutics. The authors of this article acknowledge support from the Army Research Office MURI program [W911NF2410228]. The content is solely the responsibility of the authors and does not necessarily represent the official views of any of the funding agencies.
Conflicts of Interest
The authors declare no competing interests.
Acknowledgments
Data used in the preparation of this article were obtained from the Alzheimer’s Disease Neuroimaging Initiative (ADNI) database (http://adni.loni.usc.edu). As such, the investigators within the ADNI contributed to the design and implementation of ADNI and/or provided data but did not participate in analysis or writing of this report. A complete listing of ADNI investigators can be found at: http://adni.loni.usc.edu/wp-content/uploads/how_to_apply/ADNI_Acknowledgement_List.pdf.
References
- Palop, J.J.; Chin, J.; Mucke, L. A network dysfunction perspective on neurodegenerative diseases. Nature 2006, 443, 768–773. [Google Scholar] [CrossRef] [PubMed]
- Seeley, W.W.; Crawford, R.K.; Zhou, J.; Miller, B.L.; Greicius, M.D. Neurodegenerative diseases target large-scale human brain networks. Neuron 2009, 62, 42–52. [Google Scholar] [CrossRef] [PubMed]
- Delbeuck, X.; Van der Linden, M.; Collette, F. Alzheimer’s disease as a disconnection syndrome? Neuropsychol. Rev. 2003, 13, 79–92. [Google Scholar] [CrossRef] [PubMed]
- Buckner, R.L.; Sepulcre, J.; Talukdar, T.; Krienen, F.M.; Liu, H.; Hedden, T.; Andrews-Hanna, J.R.; Sperling, R.A.; Johnson, K.A. Cortical hubs revealed by intrinsic functional connectivity: mapping, assessment of stability, and relation to Alzheimer’s disease. J. Neurosci. 2009, 29, 1860–1873. [Google Scholar] [CrossRef] [PubMed]
- Liu, L.; Drouet, V.; Wu, J.W.; Witter, M.P.; Small, S.A.; Clelland, C.; Duff, K. Trans-Synaptic Spread of Tau Pathology In Vivo. PLoS ONE 2012, 7, e31302. [Google Scholar] [CrossRef] [PubMed]
- Ahmed, Z.; Cooper, J.; Murray, T.K.; Garn, K.; McNaughton, E.; Clarke, H.; Parhizkar, S.; Ward, M.A.; Cavallini, A.; Jackson, S.; et al. A novel in vivo model of tau propagation with rapid and progressive neurofibrillary tangle pathology: the pattern of spread is determined by connectivity, not proximity. Acta Neuropathol. 2014, 127, 667–683. [Google Scholar] [CrossRef] [PubMed]
- Raj, A.; Kuceyeski, A.; Weiner, M. A network diffusion model of disease progression in dementia. Neuron 2012, 73, 1204–1215. [Google Scholar] [CrossRef] [PubMed]
- Zhou, J.; Gennatas, E.D.; Kramer, J.H.; Miller, B.L.; Seeley, W.W. Predicting regional neurodegeneration from the healthy brain functional connectome. Neuron 2012, 73, 1216–1227. [Google Scholar] [CrossRef] [PubMed]
- Vogel, J.W.; Iturria-Medina, Y.; Strandberg, O.T.; Smith, R.; Levitis, E.; Evans, A.C.; Hansson, O.; et al. Spread of pathological tau proteins through communicating neurons in human Alzheimer’s disease. Nat. Commun. 2020, 11, 2612. [Google Scholar] [CrossRef] [PubMed]
- Franzmeier, N.; Neitzel, J.; Rubinski, A.; Smith, R.; Strandberg, O.; Ossenkoppele, R.; Hansson, O.; Ewers, M. Alzheimer’s Disease Neuroimaging Initiative (ADNI). Functional brain architecture is associated with the rate of tau accumulation in Alzheimer’s disease. Nat. Commun. 2020, 11, 347. [Google Scholar] [CrossRef] [PubMed]
- Vogel, J.W.; Corriveau-Lecavalier, N.; Franzmeier, N.; Pereira, J.B.; Brown, J.A.; Maass, A.; Botha, H.; Seeley, W.W.; Bassett, D.S.; Jones, D.T.; et al. Connectome-based modelling of neurodegenerative diseases: towards precision medicine and mechanistic insight. Nat. Rev. Neurosci. 2023, 24, 620–639. [Google Scholar] [CrossRef] [PubMed]
- Honey, C.J.; Sporns, O.; Cammoun, L.; Gigandet, X.; Thiran, J.P.; Meuli, R.; Hagmann, P. Predicting human resting-state functional connectivity from structural connectivity. Proc. Natl. Acad. Sci. 2009, 106, 2035–2040. [Google Scholar] [CrossRef] [PubMed]
- Greicius, M.D.; Srivastava, G.; Reiss, A.L.; Menon, V. Default-mode network activity distinguishes Alzheimer’s disease from healthy aging: Evidence from functional MRI. Proc. Natl. Acad. Sci. 2004, 101, 4637–4642. [Google Scholar] [CrossRef] [PubMed]
- Sorg, C.; Riedl, V.; Mühlau, M.; Calhoun, V.D.; Eichele, T.; Läer, L.; Drzezga, A.; Förstl, H.; Kurz, A.; Zimmer, C.; et al. Selective changes of resting-state networks in individuals at risk for Alzheimer’s disease. Proc. Natl. Acad. Sci. 2007, 104, 18760–18765. [Google Scholar] [CrossRef] [PubMed]
- Supekar, K.; Menon, V.; Rubin, D.; Musen, M.; Greicius, M.D. Network Analysis of Intrinsic Functional Brain Connectivity in Alzheimer’s Disease. PLoS Comput. Biol. 2008, 4, e1000100. [Google Scholar] [CrossRef] [PubMed]
- Stam, C.; Jones, B.; Nolte, G.; Breakspear, M.; Scheltens, P. Small-World Networks and Functional Connectivity in Alzheimer’s Disease. Cereb. Cortex 2007, 17, 92–99. [Google Scholar] [CrossRef] [PubMed]
- Stam, C.J.; de Haan, W.; Daffertshofer, A.; Jones, B.F.; Manshanden, I.; van Cappellen van Walsum, A.M.; Montez, T.; Verbunt, J.P.A.; de Munck, J.C.; van Dijk, B.W.; et al. Graph theoretical analysis of magnetoencephalographic functional connectivity in Alzheimer’s disease. Brain 2009, 132, 213–224. [Google Scholar] [CrossRef] [PubMed]
- Sanz-Arigita, E.J.; Schoonheim, M.M.; Damoiseaux, J.S.; Rombouts, S.A.R.B.; Maris, E.; Barkhof, F.; Scheltens, P.; Stam, C.J. Loss of `Small-World’ Networks in Alzheimer’s Disease: Graph Analysis of fMRI Resting-State Functional Connectivity. PLoS ONE 2010, 5, e13788. [Google Scholar] [CrossRef] [PubMed]
- Tijms, B.M.; Wink, A.M.; de Haan, W.; van der Flier, W.M.; Stam, C.J.; Scheltens, P.; Barkhof, F. Alzheimer’s disease: connecting findings from graph theoretical studies of brain networks. Neurobiol. Aging 2013, 34, 2023–2036. [Google Scholar] [CrossRef] [PubMed]
- Schultz, A.P.; Chhatwal, J.P.; Hedden, T.; Mormino, E.C.; Hanseeuw, B.J.; Sepulcre, J.; Huijbers, W.; LaPoint, M.; Buckley, R.F.; Johnson, K.A.; et al. Phases of hyperconnectivity and hypoconnectivity in the default mode and salience networks track with amyloid and tau in clinically normal individuals. J. Neurosci. 2017, 37, 4323–4331. [Google Scholar] [CrossRef] [PubMed]
- Brier, M.R.; Thomas, J.B.; Fagan, A.M.; Hassenstab, J.; Holtzman, D.M.; Benzinger, T.L.; Morris, J.C.; Ances, B.M. Functional connectivity and graph theory in preclinical Alzheimer’s disease. Neurobiol. Aging 2014, 35, 757–768. [Google Scholar] [CrossRef] [PubMed]
- de Haan, W.; Mott, K.; van Straaten, E.C.W.; Scheltens, P.; Stam, C.J. Activity Dependent Degeneration Explains Hub Vulnerability in Alzheimer’s Disease. PLoS Comput. Biol. 2012, 8, e1002582. [Google Scholar] [CrossRef] [PubMed]
- Alexandersen, C.G.; de Haan, W.; Bick, C.; Goriely, A. A multi-scale model explains oscillatory slowing and neuronal hyperactivity in Alzheimer’s disease. J. R. Soc. Interface 2023, 20, 20220607. [Google Scholar] [CrossRef] [PubMed]
- Cabrera-Álvarez, J.; Stefanovski, L.; Martin, L.; Susi, G.; Maestú, F.; Ritter, P. A Multiscale Closed-Loop Neurotoxicity Model of Alzheimer’s Disease Progression Explains Functional Connectivity Alterations. eNeuro 2024, 11, ENEURO.0345–23. [Google Scholar] [CrossRef] [PubMed]
- Alexandersen, C.G.; Bassett, D.S.; Goriely, A.; Chaggar, P. Alzheimer’s Disease Neuroimaging Initiative. Neuronal activity and amyloid-β promote tau seeding in the entorhinal cortex in Alzheimer’s disease. Brain 2026, 149, 1915–1928. [Google Scholar] [CrossRef] [PubMed]
- Pievani, M.; de Haan, W.; Wu, T.; Seeley, W.W.; Frisoni, G.B. Functional network disruption in the degenerative dementias. Lancet Neurol. 2011, 10, 829–843. [Google Scholar] [CrossRef] [PubMed]
- Gu, S.; Pasqualetti, F.; Cieslak, M.; Telesford, Q.K.; Yu, A.B.; Kahn, A.E.; Medaglia, J.D.; Vettel, J.M.; Miller, M.B.; Grafton, S.T.; et al. Controllability of structural brain networks. Nat. Commun. 2015, 6, 8414. [Google Scholar] [CrossRef] [PubMed]
- Pasqualetti, F.; Zampieri, S.; Bullo, F. Controllability Metrics, Limitations and Algorithms for Complex Networks. IEEE Trans. Control Netw. Syst. 2014, 1, 40–52. [Google Scholar] [CrossRef]
- Tang, E.; Bassett, D.S. Colloquium: Control of dynamics in brain networks. Rev. Mod. Phys. 2018, 90, 031003. [Google Scholar] [CrossRef]
- Gu, S.; Cieslak, M.; Baird, B.; Muldoon, S.F.; Grafton, S.T.; Pasqualetti, F.; Bassett, D.S. The Energy Landscape of Neurophysiological Activity Implicit in Brain Network Structure. Sci. Rep. 2018, 8, 2507. [Google Scholar] [CrossRef] [PubMed]
- Braun, U.; Harneit, A.; Pergola, G.; Menara, T.; Schäfer, A.; Betzel, R.F.; Zang, Z.; Schweiger, J.I.; Zhang, X.; Schwarz, K.; et al. Brain network dynamics during working memory are modulated by dopamine and diminished in schizophrenia. Nat. Commun. 2021, 12, 3478. [Google Scholar] [CrossRef] [PubMed]
- Wang, B.; Zhang, S.; Yu, X.; Niu, Y.; Niu, J.; Li, D.; Zhang, S.; Xiang, J.; Yan, T.; Yang, J.; et al. Alterations in white matter network dynamics in patients with schizophrenia and bipolar disorder. Hum. Brain Mapp. 2022, 43, 3909–3922. [Google Scholar] [CrossRef] [PubMed]
- Tang, B.; Zhang, W.; Liu, J.; Deng, S.; Hu, N.; Li, S.; Zhao, Y.; Liu, N.; Zeng, J.; Cao, H.; et al. Altered controllability of white matter networks and related brain function changes in first-episode drug-naive schizophrenia. Cereb. Cortex 2023, 33, 1527–1535. [Google Scholar] [CrossRef] [PubMed]
- Hahn, T.; Winter, N.R.; Ernsting, J.; Gruber, M.; Mauritz, M.J.; Fisch, L.; Leenings, R.; Sarink, K.; Blanke, J.; Holstein, V.; et al. Genetic, individual, and familial risk correlates of brain network controllability in major depressive disorder. Mol. Psychiatry 2023, 28, 1057–1063. [Google Scholar] [CrossRef] [PubMed]
- Broeders, T.A.A.; van Dam, M.; Pontillo, G.; Rauh, V.; Douw, L.; van der Werf, Y.D.; Killestein, J.; Barkhof, F.; Vinkers, C.H.; Schoonheim, M.M. Energy Associated With Dynamic Network Changes in Patients With Multiple Sclerosis and Cognitive Impairment. Neurology 2024, 103, e209952. [Google Scholar] [CrossRef] [PubMed]
- Moradi Amani, A.; Tahmassebi, A.; Stadlbauer, A.; Meyer-Baese, U.; Noblet, V.; Blanc, F.; Malberg, H.; Meyer-Baese, A. Controllability of Functional and Structural Brain Networks. Complexity 2024, 2024, 7402894. [Google Scholar] [CrossRef]
- Tang, E.; Giusti, C.; Baum, G.L.; Gu, S.; Pollock, E.; Kahn, A.E.; Roalf, D.R.; Moore, T.M.; Ruparel, K.; Gur, R.C.; et al. Developmental increases in white matter network controllability support a growing diversity of brain dynamics. Nat. Commun. 2017, 8, 1252. [Google Scholar] [CrossRef] [PubMed]
- Faskowitz, J.; Zamani Esfahlani, F.; Jo, Y.; Sporns, O.; Betzel, R.F. Edge-centric functional network representations of human cerebral cortex reveal overlapping system-level architecture. Nat. Neurosci. 2020, 23, 1644–1654. [Google Scholar] [CrossRef] [PubMed]
- Sun, H.; Rosenblatt, M.; Dadashkarimi, J.; Rodriguez, R.; Tejavibulya, L.; Scheinost, D. Edge-centric network control on the human brain structural network. Imaging Neurosci. 2024, 2, imag–2–00191. [Google Scholar] [CrossRef] [PubMed]
- Mohapatra, S.; Alexandersen, C.G.; Fotiadis, P.; Kelz, M.B.; Detre, J.A.; Pasqualetti, F.; Bassett, D.S. QUIET: Quantifying Underutilized Influential Edges for Targeted Synchronization. arXiv 2026, arXiv:2606.11091. [Google Scholar] [CrossRef]
- Sperling, R.A.; Aisen, P.S.; Beckett, L.A.; Bennett, D.A.; Craft, S.; Fagan, A.M.; Iwatsubo, T.; Jack, Jr.; Kaye, C.R.; Montine, J.; et al. Toward defining the preclinical stages of Alzheimer’s disease: Recommendations from the National Institute on Aging-Alzheimer’s Association workgroups on diagnostic guidelines for Alzheimer’s disease. Alzheimer’s Dement. 2011, 7, 280–292. [Google Scholar] [CrossRef] [PubMed]
- Raket, L.L.; Pichet Binette, A.; Mattsson-Carlgren, N.; Janelidze, S.; Zetterberg, H.; Ashton, N.J.; Blennow, K.; Stomrud, E.; Palmqvist, S.; Hansson, O. Estimating the time course of biomarker changes in Alzheimer’s disease. Brain 2026, 149, 1929–1943. [Google Scholar] [CrossRef] [PubMed]
- Jack, Jr.; Knopman, C.R.; Jagust, D.S.; Shaw, W.J.; Aisen, L.M.; Weiner, P.S.; Petersen, M.W.; Trojanowski, R.C. Hypothetical model of dynamic biomarkers of the Alzheimer’s pathological cascade. Lancet Neurol. 2010, 9, 119–128. [Google Scholar] [CrossRef] [PubMed]
- Braak, H.; Braak, E. Neuropathological stageing of Alzheimer-related changes. Acta Neuropathol. 1991, 82, 239–259. [Google Scholar] [CrossRef] [PubMed]
- Jack, Jr.; Bennett, C.R.; Blennow, D.A.; Carrillo, K.; Dunn, M.C.; Haeberlein, B.; Holtzman, S.B.; Jagust, D.M.; Jessen, W.; Karlawish, F.; et al. NIA-AA Research Framework: Toward a biological definition of Alzheimer’s disease. Alzheimer’s Dement. 2018, 14, 535–562. [Google Scholar] [CrossRef] [PubMed]
- Jack, Jr.; Andrews, C.R.; Beach, J.S.; Buracchio, T.G.; Dunn, T.; Graf, B.; Hansson, A.; et al. Revised criteria for diagnosis and staging of Alzheimer’s disease: Alzheimer’s Association Workgroup. Alzheimer’s Dement. 2024, 20, 5143–5169. [Google Scholar] [CrossRef] [PubMed]
- Corder, E.H.; Saunders, A.M.; Strittmatter, W.J.; Schmechel, D.E.; Gaskell, P.C.; Small, G.W.; Roses, A.D.; Haines, J.L.; Pericak-Vance, M.A. Gene Dose of Apolipoprotein E Type 4 Allele and the Risk of Alzheimer’s Disease in Late Onset Families. Science 1993, 261, 921–923. [Google Scholar] [CrossRef] [PubMed]
- Liu, C.C.; Kanekiyo, T.; Xu, H.; Bu, G. Apolipoprotein E and Alzheimer disease: risk, mechanisms and therapy. Nat. Rev. Neurol. 2013, 9, 106–118. [Google Scholar] [CrossRef] [PubMed]
- Steward, A.; Biel, D.; Dewenter, A.; Roemer, S.; Wagner, F.; Dehsarvi, A.; Rathore, S.; Otero Svaldi, D.; Higgins, I.; Brendel, M.; et al. ApoE4 and connectivity-mediated spreading of tau pathology at lower amyloid levels. JAMA Neurol. 2023, 80, 1295–1306. [Google Scholar] [CrossRef] [PubMed]
- Ferretti, M.T.; Iulita, M.F.; Cavedo, E.; Chiesa, P.A.; Schumacher Dimech, A.; Santuccione Chadha, A.; Baracchi, F.; Girouard, H.; Misoch, S.; Giacobini, E.; et al. Sex differences in Alzheimer disease — the gateway to precision medicine. Nat. Rev. Neurol. 2018, 14, 457–469. [Google Scholar] [CrossRef] [PubMed]
- Buckley, R.F.; Mormino, E.C.; Rabin, J.S.; Hohman, T.J.; Landau, S.; Hanseeuw, B.J.; Jacobs, H.I.L.; Papp, K.V.; Amariglio, R.E.; Properzi, M.J.; et al. Sex Differences in the Association of Global Amyloid and Regional Tau Deposition Measured by Positron Emission Tomography in Clinically Normal Older Adults. JAMA Neurol. 2019, 76, 542–551. [Google Scholar] [CrossRef] [PubMed]
- Altmann, A.; Tian, L.; Henderson, V.W.; Greicius, M.D. Alzheimer’s Disease Neuroimaging Initiative Investigators. Sex modifies the APOE-related risk of developing Alzheimer disease. Ann. Neurol. 2014, 75, 563–573. [Google Scholar] [CrossRef] [PubMed]
- Lopez-Lee, C.; Torres, E.R.S.; Carling, G.; Gan, L. Mechanisms of sex differences in Alzheimer’s disease. Neuron 2024, 112, 1208–1221. [Google Scholar] [CrossRef] [PubMed]
- Petersen, R.C.; Aisen, P.S.; Beckett, L.A.; Donohue, M.C.; Gamst, A.C.; Harvey, D.J.; Jack, Jr.; Jagust, C.R.; Shaw, W.J.; Toga, L.M.; et al. Alzheimer’s Disease Neuroimaging Initiative (ADNI): Clinical characterization. Neurology 2010, 74, 201–209. [Google Scholar] [CrossRef] [PubMed]
- Weiner, M.W.; Veitch, D.P.; Aisen, P.S.; Beckett, L.A.; Cairns, N.J.; Green, R.C.; Harvey, D.; Jack, Jr.; Jagust, C.R.; Morris, W.; et al. The Alzheimer’s Disease Neuroimaging Initiative 3: Continued innovation for clinical trial improvement. Alzheimer’s Dement. 2017, 13, 561–571. [Google Scholar] [CrossRef] [PubMed]
- Yeo, B.T.T.; Krienen, F.M.; Sepulcre, J.; Sabuncu, M.R.; Lashkari, D.; Hollinshead, M.; Roffman, J.L.; Smoller, J.W.; Zöllei, L.; Polimeni, J.R.; et al. The organization of the human cerebral cortex estimated by intrinsic functional connectivity. J. Neurophysiol. 2011, 106, 1125–1165. [Google Scholar] [CrossRef] [PubMed]
- Schaefer, A.; Kong, R.; Gordon, E.M.; Laumann, T.O.; Zuo, X.N.; Holmes, A.J.; Eickhoff, S.B.; Yeo, B.T.T. Local-Global Parcellation of the Human Cerebral Cortex from Intrinsic Functional Connectivity MRI. Cereb. Cortex 2018, 28, 3095–3114. [Google Scholar] [CrossRef] [PubMed]
- Palmqvist, S.; Schöll, M.; Strandberg, O.; Mattsson, N.; Stomrud, E.; Zetterberg, H.; Blennow, K.; Landau, S.; Jagust, W.; Hansson, O. Earliest accumulation of β-amyloid occurs within the default-mode network and concurrently affects brain connectivity. Nat. Commun. 2017, 8, 1214. [Google Scholar] [CrossRef] [PubMed]
- Yu, M.; Sporns, O.; Saykin, A.J. The human connectome in Alzheimer disease — relationship to biomarkers and genetics. Nat. Rev. Neurol. 2021, 17, 545–563. [Google Scholar] [CrossRef] [PubMed]
- Liu, W.; Zuo, C.; Chen, L.; Lan, H.; Luo, C.; Li, X.; Kemp, G.J.; Lui, S.; Suo, X.; Gong, Q. The whole-brain structural and functional connectome in Alzheimer’s disease spectrum: A multimodal Bayesian meta-analysis of graph theoretical characteristics. Neurosci. Biobehav. Rev. 2025, 174, 106174. [Google Scholar] [CrossRef] [PubMed]
- Ingalhalikar, M.; Smith, A.; Parker, D.; Satterthwaite, T.D.; Elliott, M.A.; Ruparel, K.; Hakonarson, H.; Gur, R.E.; Gur, R.C.; Verma, R. Sex differences in the structural connectome of the human brain. Proc. Natl. Acad. Sci. 2014, 111, 823–828. [Google Scholar] [CrossRef] [PubMed]
- Ruigrok, A.N.V.; Salimi-Khorshidi, G.; Lai, M.C.; Baron-Cohen, S.; Lombardo, M.V.; Tait, R.J.; Suckling, J. A meta-analysis of sex differences in human brain structure. Neurosci. Biobehav. Rev. 2014, 39, 34–50. [Google Scholar] [CrossRef] [PubMed]
- Shanmugan, S.; Seidlitz, J.; Cui, Z.; Adebimpe, A.; Bassett, D.S.; Bertolero, M.A.; Davatzikos, C.; Fair, D.A.; Gur, R.E.; Gur, R.C.; et al. Sex differences in the functional topography of association networks in youth. Proc. Natl. Acad. Sci. 2022, 119, e2110416119. [Google Scholar] [CrossRef] [PubMed]
- Yan, C.; Gong, G.; Wang, J.; Wang, D.; Liu, D.; Zhu, C.; Chen, Z.J.; Evans, A.; Zang, Y.; He, Y. Sex- and brain size-related small-world structural cortical networks in young adults: a DTI tractography study. Cereb. Cortex 2011, 21, 449–458. [Google Scholar] [CrossRef] [PubMed]
- Cabral, J.; Hugues, E.; Sporns, O.; Deco, G. Role of local network oscillations in resting-state functional connectivity. NeuroImage 2011, 57, 130–139. [Google Scholar] [CrossRef] [PubMed]
- Gotts, S.J.; Jo, H.J.; Wallace, G.L.; Saad, Z.S.; Cox, R.W.; Martin, A. Two distinct forms of functional lateralization in the human brain. Proc. Natl. Acad. Sci. 2013, 110, E3435–E3444. [Google Scholar] [CrossRef] [PubMed]
- Corbetta, M.; Shulman, G.L. Control of goal-directed and stimulus-driven attention in the brain. Nat. Rev. Neurosci. 2002, 3, 201–215. [Google Scholar] [CrossRef] [PubMed]
- Wachinger, C.; Salat, D.H.; Weiner, M.; Reuter, M. Alzheimer’s Disease Neuroimaging Initiative. Whole-brain analysis reveals increased neuroanatomical asymmetries in dementia for hippocampus and amygdala. Brain 2016, 139, 3253–3266. [Google Scholar] [CrossRef] [PubMed]
- Gómez-Isla, T.; Price, J.L.; McKeel, Jr.; Morris, D.W.; Growdon, J.C.; Hyman, J.H. Profound Loss of Layer II Entorhinal Cortex Neurons Occurs in Very Mild Alzheimer’s Disease. J. Neurosci. 1996, 16, 4491–4500. [Google Scholar] [CrossRef] [PubMed]
- Johnson, K.A.; Schultz, A.; Betensky, R.A.; Becker, J.A.; Sepulcre, J.; Rentz, D.; Mormino, E.; Chhatwal, J.; Amariglio, R.; Papp, K.; et al. Tau positron emission tomographic imaging in aging and early Alzheimer disease. Ann. Neurol. 2016, 79, 110–119. [Google Scholar] [CrossRef] [PubMed]
- Busche, M.A.; Hyman, B.T. Synergy between amyloid-β and tau in Alzheimer’s disease. Nat. Neurosci. 2020, 23, 1183–1193. [Google Scholar] [CrossRef] [PubMed]
- Roemer-Cassiano, S.N.; Wagner, F.; Evangelista, L.; Rauchmann, B.S.; Dehsarvi, A.; Steward, A.; Dewenter, A.; Biel, D.; Zhu, Z.; Pescoller, J.; et al. Amyloid-associated hyperconnectivity drives tau spread across connected brain regions in Alzheimer’s disease. Sci. Transl. Med. 2025, 17, eadp2564. [Google Scholar] [CrossRef] [PubMed]
- Klunk, W.E.; Koeppe, R.A.; Price, J.C.; Benzinger, T.L.; Devous, Sr.; Jagust, M.D.; Johnson, W.J.; Mathis, K.A.; Minhas, C.A.; Pontecorvo, D.; et al. The Centiloid Project: Standardizing quantitative amyloid plaque estimation by PET. Alzheimer’s Dement. 2015, 11, 1–15.e1–4. [Google Scholar] [CrossRef] [PubMed]
- Palop, J.J.; Mucke, L. Network abnormalities and interneuron dysfunction in Alzheimer disease. Nat. Rev. Neurosci. 2016, 17, 777–792. [Google Scholar] [CrossRef] [PubMed]
- Busche, M.A.; Eichhoff, G.; Adelsberger, H.; Abramowski, D.; Wiederhold, K.H.; Haass, C.; Staufenbiel, M.; Konnerth, A.; Garaschuk, O. Clusters of hyperactive neurons near amyloid plaques in a mouse model of Alzheimer’s disease. Science 2008, 321, 1686–1689. [Google Scholar] [CrossRef] [PubMed]
- Targa Dias Anastacio, H.; Matosin, N.; Ooi, L. Neuronal hyperexcitability in Alzheimer’s disease: what are the drivers behind this aberrant phenotype? Transl. Psychiatry 2022, 12, 257. [Google Scholar] [CrossRef] [PubMed]
- Gaubert, S.; Raimondo, F.; Houot, M.; Corsi, M.C.; Naccache, L.; Diego Sitt, J.; Hermann, B.; Oudiette, D.; Gagliardi, G.; Habert, M.O.; et al. EEG evidence of compensatory mechanisms in preclinical Alzheimer’s disease. Brain 2019, 142, 2096–2112. [Google Scholar] [CrossRef] [PubMed]
- Jones, D.T.; Knopman, D.S.; Gunter, J.L.; Graff-Radford, J.; Vemuri, P.; Boeve, B.F.; Petersen, R.C.; Weiner, M.W.; Jack, Jr. Cascading network failure across the Alzheimer’s disease spectrum. Brain 2016, 139, 547–562. [Google Scholar] [CrossRef] [PubMed]
- Bookheimer, S.Y.; Strojwas, M.H.; Cohen, M.S.; Saunders, A.M.; Pericak-Vance, M.A.; Mazziotta, J.C.; Small, G.W. Patterns of brain activation in people at risk for Alzheimer’s disease. N. Engl. J. Med. 2000, 343, 450–456. [Google Scholar] [CrossRef] [PubMed]
- Filippini, N.; MacIntosh, B.J.; Hough, M.G.; Goodwin, G.M.; Frisoni, G.B.; Smith, S.M.; Matthews, P.M.; Beckmann, C.F.; Mackay, C.E. Distinct patterns of brain activity in young carriers of the APOE-ε4 allele. Proc. Natl. Acad. Sci. 2009, 106, 7209–7214. [Google Scholar] [CrossRef] [PubMed]
- Reiman, E.M.; Caselli, R.J.; Yun, L.S.; Chen, K.; Bandy, D.; Minoshima, S.; Thibodeau, S.N.; Osborne, D. Preclinical evidence of Alzheimer’s disease in persons homozygous for the ϵ4 allele for apolipoprotein E. N. Engl. J. Med. 1996, 334, 752–758. [Google Scholar] [CrossRef] [PubMed]
- Neu, S.C.; Pa, J.; Kukull, W.; Beekly, D.; Kuzma, A.; Gangadharan, P.; Wang, L.S.; Romero, K.; Arneric, S.P.; Redolfi, A.; et al. Apolipoprotein E genotype and sex risk factors for Alzheimer disease: A meta-analysis. JAMA Neurol. 2017, 74, 1178–1189. [Google Scholar] [CrossRef] [PubMed]
- Damoiseaux, J.S.; Seeley, W.W.; Zhou, J.; Shirer, W.R.; Coppola, G.; Karydas, A.; Rosen, H.J.; Miller, B.L.; Kramer, J.H.; Greicius, M.D.; et al. Gender modulates the APOE ε4 effect in healthy older adults: convergent evidence from functional brain connectivity and spinal fluid tau levels. J. Neurosci. 2012, 32, 8254–8262. [Google Scholar] [CrossRef] [PubMed]
- Busche, M.A.; Konnerth, A. Impairments of neural circuit function in Alzheimer’s disease. Philos. Trans. R. Soc. B Biol. Sci. 2016, 371, 20150429. [Google Scholar] [CrossRef] [PubMed]
- Dickerson, B.C.; Salat, D.H.; Greve, D.N.; Chua, E.F.; Rand-Giovannetti, E.; Rentz, D.M.; Bertram, L.; Mullin, K.; Tanzi, R.E.; Blacker, D.; et al. Increased hippocampal activation in mild cognitive impairment compared to normal aging and AD. Neurology 2005, 65, 404–411. [Google Scholar] [CrossRef] [PubMed]
- Bakker, A.; Krauss, G.L.; Albert, M.S.; Speck, C.L.; Jones, L.R.; Stark, C.E.; Yassa, M.A.; Bassett, S.S.; Shelton, A.L.; Gallagher, M. Reduction of hippocampal hyperactivity improves cognition in amnestic mild cognitive impairment. Neuron 2012, 74, 467–474. [Google Scholar] [CrossRef] [PubMed]
- Sperling, R.A.; LaViolette, P.S.; O’Keefe, K.; O’Brien, J.; Rentz, D.M.; Pihlajamaki, M.; Marshall, G.; Hyman, B.T.; Selkoe, D.J.; Hedden, T.; et al. Amyloid deposition is associated with impaired default network function in older persons without dementia. Neuron 2009, 63, 178–188. [Google Scholar] [CrossRef] [PubMed]
- Elman, J.A.; Oh, H.; Madison, C.M.; Baker, S.L.; Vogel, J.W.; Marks, S.M.; Crowley, S.; O’Neil, J.P.; Jagust, W.J. Neural compensation in older people with brain amyloid-β deposition. Nat. Neurosci. 2014, 17, 1316–1318. [Google Scholar] [CrossRef] [PubMed]
- Toga, A.W.; Thompson, P.M. Mapping brain asymmetry. Nat. Rev. Neurosci. 2003, 4, 37–48. [Google Scholar] [CrossRef] [PubMed]
- Iturria-Medina, Y.; Pérez Fernández, A.; Morris, D.M.; Canales-Rodríguez, E.J.; Haroon, H.A.; García Pentón, L.; Augath, M.; Galán García, L.; Logothetis, N.; Parker, G.J.M.; et al. Brain hemispheric structural efficiency and interconnectivity rightward asymmetry in human and nonhuman primates. Cereb. Cortex 2011, 21, 56–67. [Google Scholar] [CrossRef] [PubMed]
- Maier-Hein, K.H.; Neher, P.F.; Houde, J.C.; Côté, M.A.; Garyfallidis, E.; Zhong, J.; Chamberland, M.; Yeh, F.C.; Lin, Y.C.; Ji, Q.; et al. The challenge of mapping the human connectome based on diffusion tractography. Nat. Commun. 2017, 8, 1349. [Google Scholar] [CrossRef] [PubMed]
- Noble, S.; Scheinost, D.; Constable, R.T. A decade of test-retest reliability of functional connectivity: A systematic review and meta-analysis. NeuroImage 2019, 203, 116157. [Google Scholar] [CrossRef] [PubMed]
- Jack, Jr.; Knopman, C.R.; Jagust, D.S.; Petersen, W.J.; Weiner, R.C.; Aisen, M.W.; Shaw, P.S.; Vemuri, L.M.; Wiste, P.; Weigand, H.J.; et al. Tracking pathophysiological processes in Alzheimer’s disease: an updated hypothetical model of dynamic biomarkers. Lancet Neurol. 2013, 12, 207–216. [Google Scholar] [CrossRef] [PubMed]
- Mohapatra, S.; Ouyang, M.; Tan, S.; Guo, J.; Sun, L.; He, Y.; Huang, H. TReND: Transformer derived features and Regularized NMF for neonatal functional network Delineation. In Proceedings of the Medical Image Computing and Computer Assisted Intervention – MICCAI 2025; Springer Nature Switzerland; Lecture Notes in Computer Science; 2025; Vol. 15971, pp. 660–669. [Google Scholar] [CrossRef]
- Muldoon, S.F.; Pasqualetti, F.; Gu, S.; Cieslak, M.; Grafton, S.T.; Vettel, J.M.; Bassett, D.S. Stimulation-Based Control of Dynamic Brain Networks. PLoS Comput. Biol. 2016, 12, e1005076. [Google Scholar] [CrossRef] [PubMed]
- Cirrito, J.R.; Yamada, K.A.; Finn, M.B.; Sloviter, R.S.; Bales, K.R.; May, P.C.; Schoepp, D.D.; Paul, S.M.; Mennerick, S.; Holtzman, D.M. Synaptic Activity Regulates Interstitial Fluid Amyloid-β Levels In Vivo. Neuron 2005, 48, 913–922. [Google Scholar] [CrossRef] [PubMed]
- Bero, A.W.; Yan, P.; Roh, J.H.; Cirrito, J.R.; Stewart, F.R.; Raichle, M.E.; Lee, J.M.; Holtzman, D.M. Neuronal activity regulates the regional vulnerability to amyloid-β deposition. Nat. Neurosci. 2011, 14, 750–756. [Google Scholar] [CrossRef] [PubMed]
- Yamada, K.; Holth, J.K.; Liao, F.; Stewart, F.R.; Mahan, T.E.; Jiang, H.; Cirrito, J.R.; Patel, T.K.; Hochgräfe, K.; Mandelkow, E.M.; et al. Neuronal activity regulates extracellular tau in vivo. J. Exp. Med. 2014, 211, 387–393. [Google Scholar] [CrossRef] [PubMed]
- Wu, J.W.; Hussaini, S.A.; Bastille, I.M.; Rodriguez, G.A.; Mrejeru, A.; Rilett, K.; Sanders, D.W.; Cook, C.; Fu, H.; Boonen, R.A.C.M.; et al. Neuronal activity enhances tau propagation and tau pathology in vivo. Nat. Neurosci. 2016, 19, 1085–1092. [Google Scholar] [CrossRef] [PubMed]
- Alexandersen, C.G.; Goriely, A.; Bick, C. Neuronal activity induces symmetry breaking in neurodegenerative disease spreading. J. Math. Biol. 2024, 89, 3. [Google Scholar] [CrossRef] [PubMed]
- Jack, Jr.; Bernstein, C.R.; Fox, M.A.; Thompson, N.C.; Alexander, P.; Harvey, G.; Borowski, D.; Britson, B.; Whitwell, P.J.; Ward, J.L.; et al. The Alzheimer’s Disease Neuroimaging Initiative (ADNI): MRI methods. J. Magn. Reson. Imaging 2008, 27, 685–691. [Google Scholar] [CrossRef] [PubMed]
- Landau, S.M.; Mintun, M.A.; Joshi, A.D.; Koeppe, R.A.; Petersen, R.C.; Aisen, P.S.; Weiner, M.W.; Jagust, W.J. Alzheimer’s Disease Neuroimaging Initiative. Amyloid deposition, hypometabolism, and longitudinal cognitive decline. Ann. Neurol. 2012, 72, 578–586. [Google Scholar] [CrossRef] [PubMed]
- Maass, A.; Landau, S.; Baker, S.L.; Horng, A.; Lockhart, S.N.; La Joie, R.; Rabinovici, G.D.; Jagust, W.J. Comparison of multiple tau-PET measures as biomarkers in aging and Alzheimer’s disease. NeuroImage 2017, 157, 448–463. [Google Scholar] [CrossRef] [PubMed]
- Saykin, A.J.; Shen, L.; Foroud, T.M.; Potkin, S.G.; Swaminathan, S.; Kim, S.; Risacher, S.L.; Nho, K.; Huentelman, M.J.; Craig, D.W.; et al. Alzheimer’s Disease Neuroimaging Initiative biomarkers as quantitative phenotypes: Genetics core aims, progress, and plans. Alzheimer’s Dement. 2010, 6, 265–273. [Google Scholar] [CrossRef] [PubMed]
- Hixson, J.E.; Vernier, D.T. Restriction isotyping of human apolipoprotein E by gene amplification and cleavage with HhaI. J. Lipid Res. 1990, 31, 545–548. [Google Scholar] [CrossRef]
- Jack, Jr.; Wiste, C.R.; Weigand, H.J.; Therneau, S.D.; Lowe, T.M.; Knopman, V.J.; Gunter, D.S.; Senjem, J.L.; Jones, M.L.; Kantarci, D.T.; et al. Defining imaging biomarker cut points for brain aging and Alzheimer’s disease. Alzheimer’s Dement. 2017, 13, 205–216. [Google Scholar] [CrossRef] [PubMed]
- Cliff, N. Dominance statistics: Ordinal analyses to answer ordinal questions. Psychol. Bull. 1993, 114, 494–509. [Google Scholar] [CrossRef]
- Efron, B.; Tibshirani, R.J. An Introduction to the Bootstrap . In Monographs on Statistics and Applied Probability; Chapman & Hall: New York, 1993; Vol. 57. [Google Scholar] [CrossRef]
- Romano, J.; Kromrey, J.D.; Coraggio, J.; Skowronek, J. Appropriate statistics for ordinal level data: Should we really be using t-test and Cohen’s d for evaluating group differences on the NSSE and other surveys? In Proceedings of the Annual Meeting of the Florida Association of Institutional Research, Cocoa Beach, Florida, 2006; pp. 1–33. [Google Scholar]
- Wilcoxon, F. Individual comparisons by ranking methods. Biom. Bull. 1945, 1, 80–83. [Google Scholar] [CrossRef]
- Benjamini, Y.; Hochberg, Y. Controlling the false discovery rate: A practical and powerful approach to multiple testing. J. R. Stat. Soc. Ser. B (Methodological) 1995, 57, 289–300. [Google Scholar] [CrossRef]
- Mitchell, S.M.; Lange, S.; Brus, H. Gendered citation patterns in international relations journals. Int. Stud. Perspect. 2013, 14, 485–492. [Google Scholar] [CrossRef]
- Dion, M.L.; Sumner, J.L.; Mitchell, S.M. Gendered citation patterns across political science and social science methodology fields. Political Anal. 2018, 26, 312–327. [Google Scholar] [CrossRef]
- Caplar, N.; Tacchella, S.; Birrer, S. Quantitative evaluation of gender bias in astronomical publications from citation counts. Nat. Astron. 2017, 1, 0141. [Google Scholar] [CrossRef]
- Maliniak, D.; Powers, R.; Walter, B.F. The gender citation gap in international relations. Int. Organ. 2013, 67, 889–922. [Google Scholar] [CrossRef]
- Dworkin, J.D.; Linn, K.A.; Teich, E.G.; Zurn, P.; Shinohara, R.T.; Bassett, D.S. The extent and drivers of gender imbalance in neuroscience reference lists. Nat. Neurosci. 2020, 23, 918–926. [Google Scholar] [CrossRef] [PubMed]
- Bertolero, M.A.; Dworkin, J.D.; David, S.U.; López Lloreda, C.; Srivastava, P.; Stiso, J.; Zhou, D.; Dzirasa, K.; Fair, D.A.; Kaczkurkin, A.N.; et al. Racial and ethnic imbalance in neuroscience reference lists and intersections with gender. bioRxiv 2020. [Google Scholar] [CrossRef]
- Wang, X.; Dworkin, J.D.; Zhou, D.; Stiso, J.; Falk, E.B.; Bassett, D.S.; Zurn, P.; Lydon-Staley, D.M. Gendered citation practices in the field of communication. Ann. Int. Commun. Assoc. 2021, 45, 134–153. [Google Scholar] [CrossRef] [PubMed]
- Chatterjee, P.; Werner, R.M. Gender Disparity in Citations in High-Impact Journal Articles. JAMA Netw. Open 2021, 4, e2114509. [Google Scholar] [CrossRef] [PubMed]
- Fulvio, J.M.; Akinnola, I.; Postle, B.R. Gender (Im)balance in Citation Practices in Cognitive Neuroscience. J. Cogn. Neurosci. 2021, 33, 3–7. [Google Scholar] [CrossRef] [PubMed]
- Zhou, D.; Cornblath, E.J.; Stiso, J.; Teich, E.G.; Dworkin, J.D.; Blevins, A.S.; Bassett, D.S. Gender Diversity Statement and Code Notebook v1.0. Zenodo;Software 2020, v1.0. [Google Scholar] [CrossRef]
- Ambekar, A.; Ward, C.; Mohammed, J.; Male, S.; Skiena, S. Name-ethnicity classification from open sources. In Proceedings of the Proceedings of the 15th ACM SIGKDD International Conference on Knowledge Discovery and Data Mining, 2009; Association for Computing Machinery; pp. 49–58. [Google Scholar] [CrossRef]
- Sood, G.; Laohaprapanon, S. Predicting race and ethnicity from the sequence of characters in a name. arXiv 2018, arXiv:1805.02109, 1805.02109. [Google Scholar] [CrossRef]
Figure 1.
Study design and QUIET-based control-energy estimation in the ADNI cohort. An ADNI cohort spanning the Alzheimer’s disease continuum contributes diffusion and resting-state functional MRI. Diffusion MRI yields a Schaefer structural connectome, and resting-state fMRI yields the regional BOLD timeseries of the canonical Yeo networks. QUIET combines the structural controllability of each white-matter connection with its pairwise functional mutual information to compute the control energy required to synchronize a target network. A. Clinical group comparison. Per-network control energy compared between cognitively normal and Alzheimer’s disease brains. B. Control energy and genotype. Control energy related to molecular pathology (tau and amyloid) and to APOE-4 genotype with its modification by sex, anticipating a stronger effect in assigned female at birth (AFAB) than assigned male at birth (AMAB) carriers. CN, cognitively normal; EMCI and LMCI, early and late mild cognitive impairment; AD, Alzheimer’s disease.
Figure 1.
Study design and QUIET-based control-energy estimation in the ADNI cohort. An ADNI cohort spanning the Alzheimer’s disease continuum contributes diffusion and resting-state functional MRI. Diffusion MRI yields a Schaefer structural connectome, and resting-state fMRI yields the regional BOLD timeseries of the canonical Yeo networks. QUIET combines the structural controllability of each white-matter connection with its pairwise functional mutual information to compute the control energy required to synchronize a target network. A. Clinical group comparison. Per-network control energy compared between cognitively normal and Alzheimer’s disease brains. B. Control energy and genotype. Control energy related to molecular pathology (tau and amyloid) and to APOE-4 genotype with its modification by sex, anticipating a stronger effect in assigned female at birth (AFAB) than assigned male at birth (AMAB) carriers. CN, cognitively normal; EMCI and LMCI, early and late mild cognitive impairment; AD, Alzheimer’s disease.
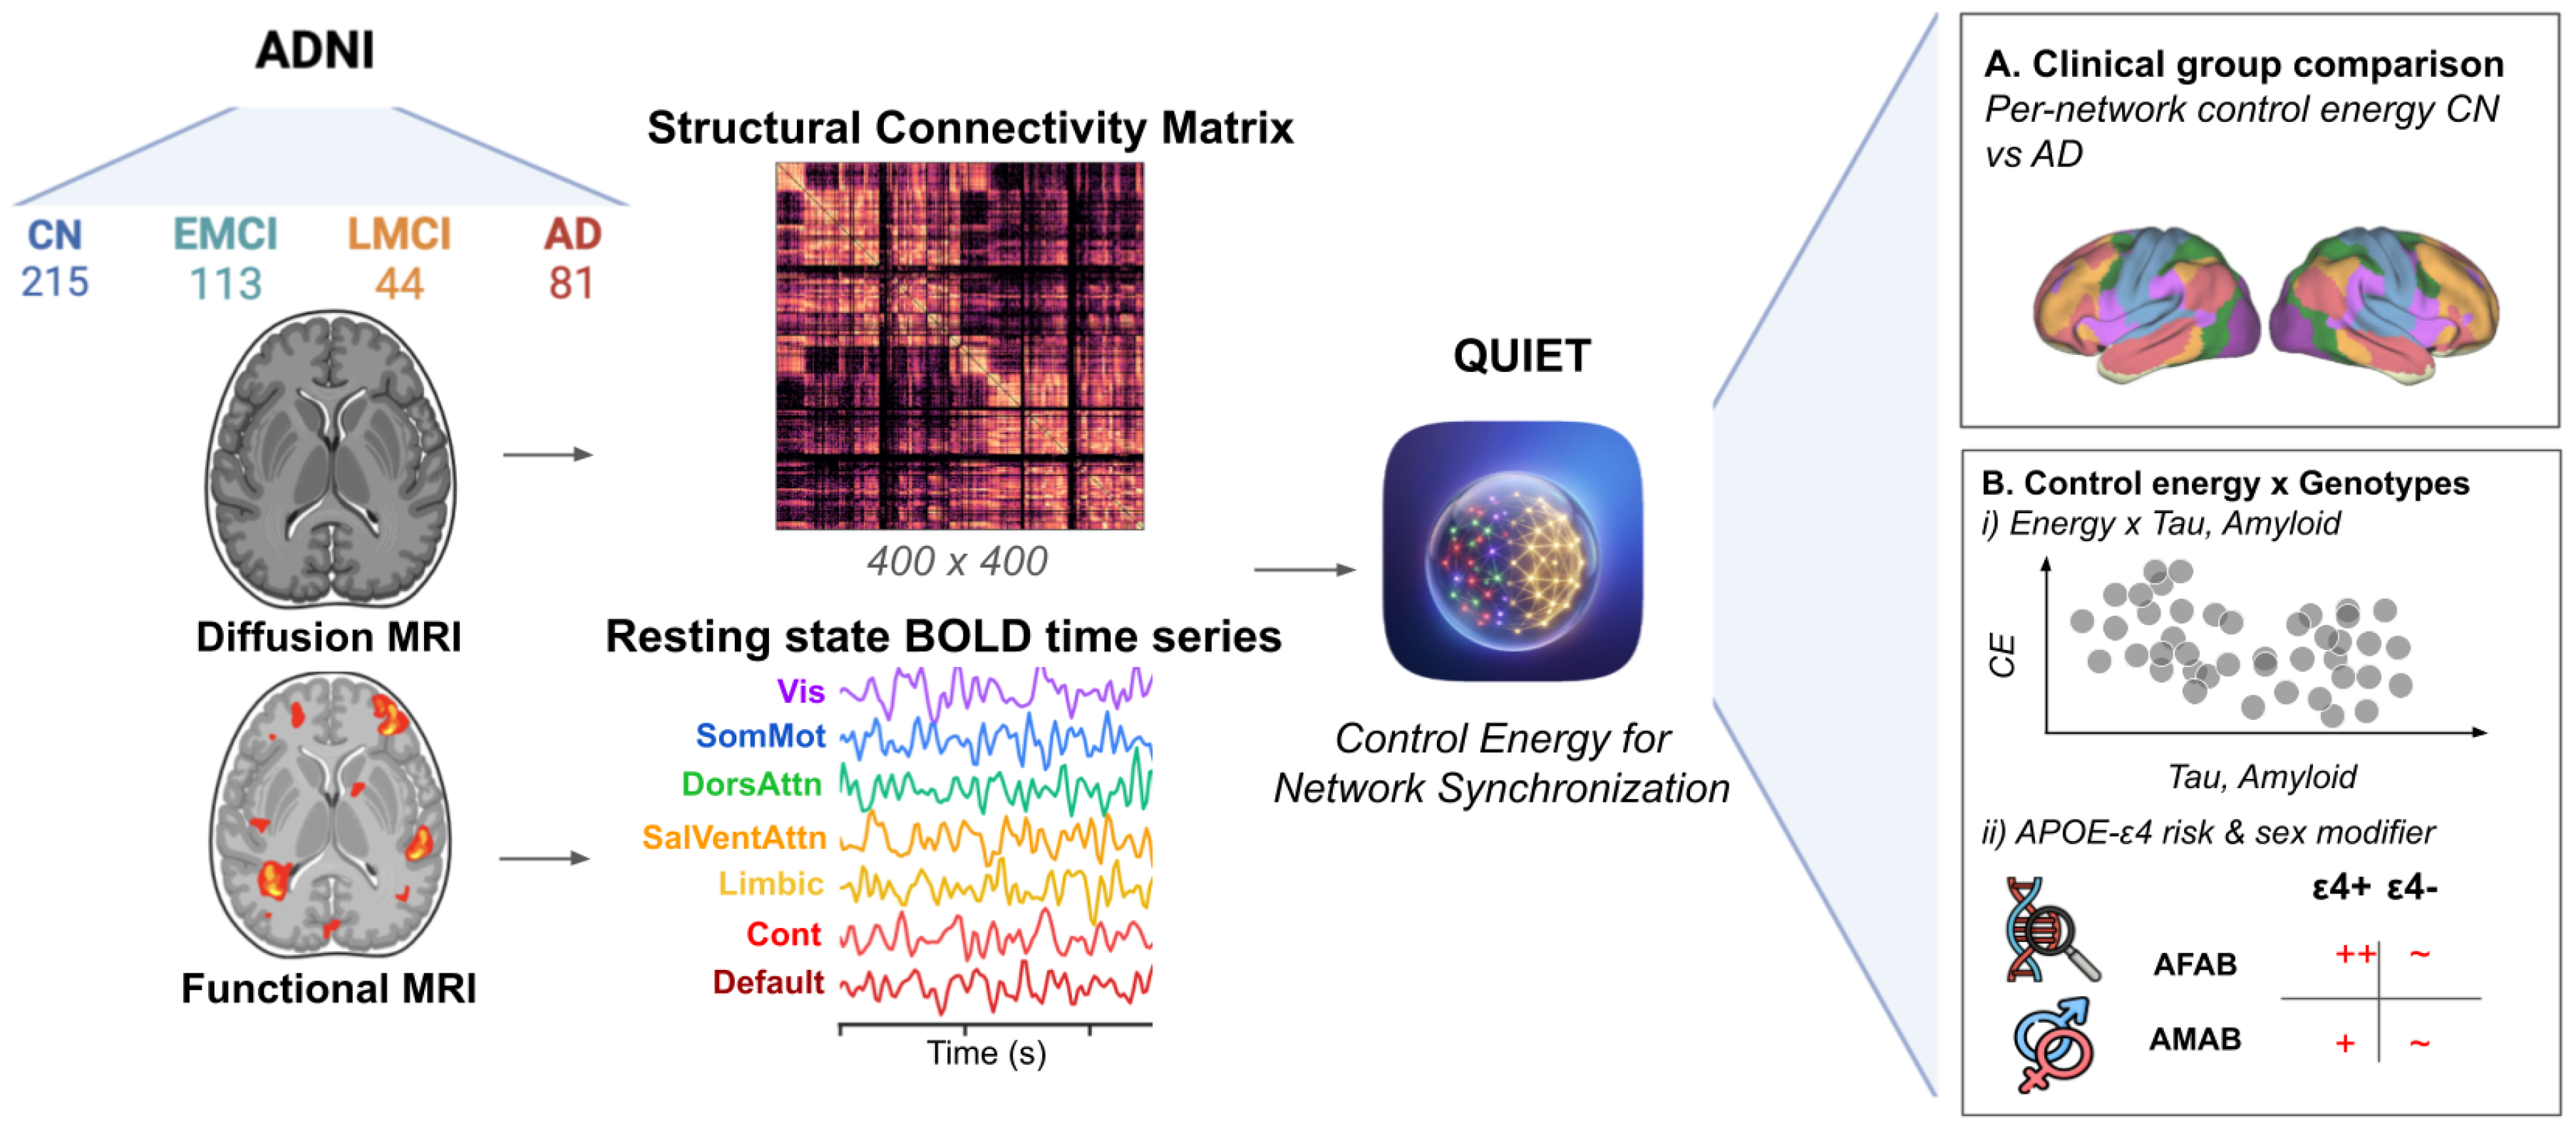
Figure 2.
Control energy is reduced in Alzheimer’s disease and shaped by biological sex and hemisphere. QUIET-derived control energy compared across diagnosis, sex, and hemisphere in each functional network. A. AD lowers control energy in every network. Scan-level control energy in cognitively normal and Alzheimer’s disease brains, with the group effect size below; the reduction is consistent in direction but not significant in any single network. B. Sex differences in required control energy. Sex-stratified control energy for AMAB and AFAB participants, differing only in the limbic network (asterisks). C. Hemispheric asymmetry is network-specific. Left- and right-hemisphere control energy per network in both groups, annotated with the median difference and Wilcoxon test; the asymmetry is large and preserved in disease. CN, filled; AD, open; AMAB, blue; AFAB, pink. In panel (A), crossbars mark the median and interquartile range; in panel (B), diamonds mark the median; in panel (C), boxes show the median and interquartile range.
Figure 2.
Control energy is reduced in Alzheimer’s disease and shaped by biological sex and hemisphere. QUIET-derived control energy compared across diagnosis, sex, and hemisphere in each functional network. A. AD lowers control energy in every network. Scan-level control energy in cognitively normal and Alzheimer’s disease brains, with the group effect size below; the reduction is consistent in direction but not significant in any single network. B. Sex differences in required control energy. Sex-stratified control energy for AMAB and AFAB participants, differing only in the limbic network (asterisks). C. Hemispheric asymmetry is network-specific. Left- and right-hemisphere control energy per network in both groups, annotated with the median difference and Wilcoxon test; the asymmetry is large and preserved in disease. CN, filled; AD, open; AMAB, blue; AFAB, pink. In panel (A), crossbars mark the median and interquartile range; in panel (B), diamonds mark the median; in panel (C), boxes show the median and interquartile range.
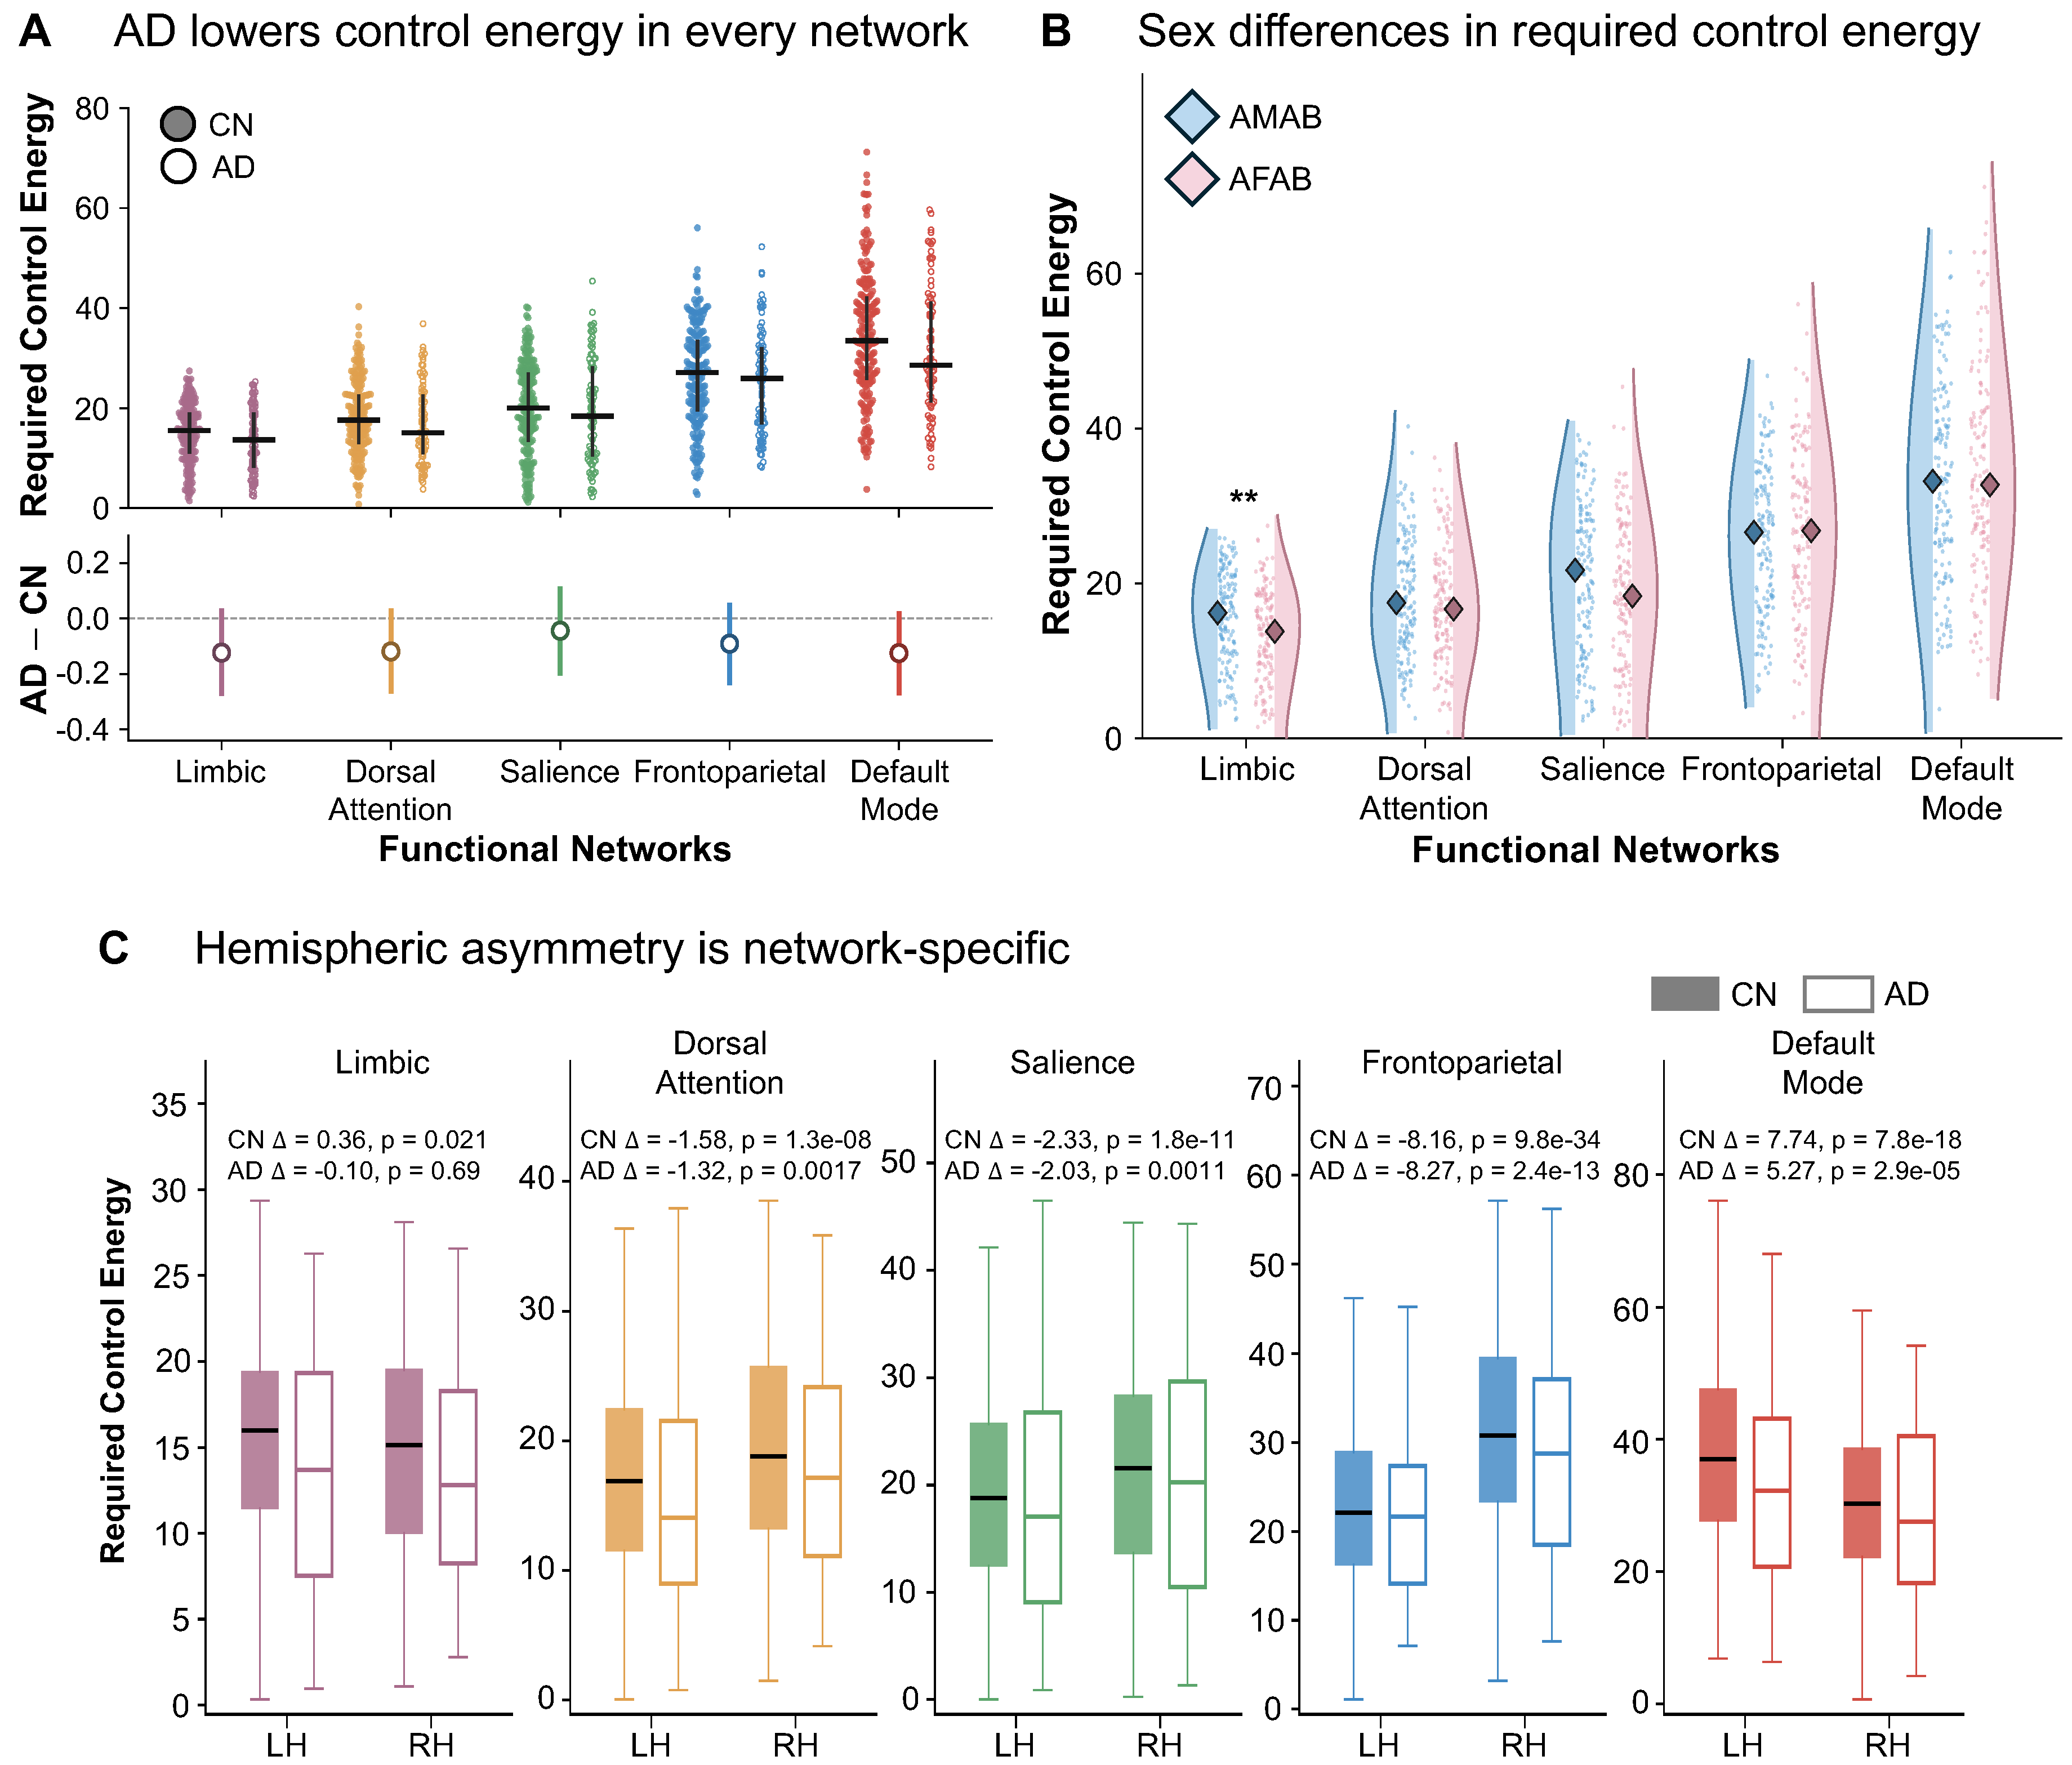
Figure 3.
Control energy tracks Alzheimer’s disease pathology. QUIET-derived control energy related to regional tau and cortical amyloid burden across subjects. A. Limbic control energy declines with entorhinal tau. Limbic control energy falls as entorhinal tau-PET burden rises. B. Default mode control energy declines with entorhinal tau. The association is present in association cortex remote from the entorhinal region. C. Lateralized amyloid signature in dorsal attention. The dorsal attention energy asymmetry shifts with cortical amyloid burden, whereas the magnitude of control energy does not. Dashed line, ordinary least-squares fit shown for visualization; shaded band, bootstrap confidence interval.
Figure 3.
Control energy tracks Alzheimer’s disease pathology. QUIET-derived control energy related to regional tau and cortical amyloid burden across subjects. A. Limbic control energy declines with entorhinal tau. Limbic control energy falls as entorhinal tau-PET burden rises. B. Default mode control energy declines with entorhinal tau. The association is present in association cortex remote from the entorhinal region. C. Lateralized amyloid signature in dorsal attention. The dorsal attention energy asymmetry shifts with cortical amyloid burden, whereas the magnitude of control energy does not. Dashed line, ordinary least-squares fit shown for visualization; shaded band, bootstrap confidence interval.
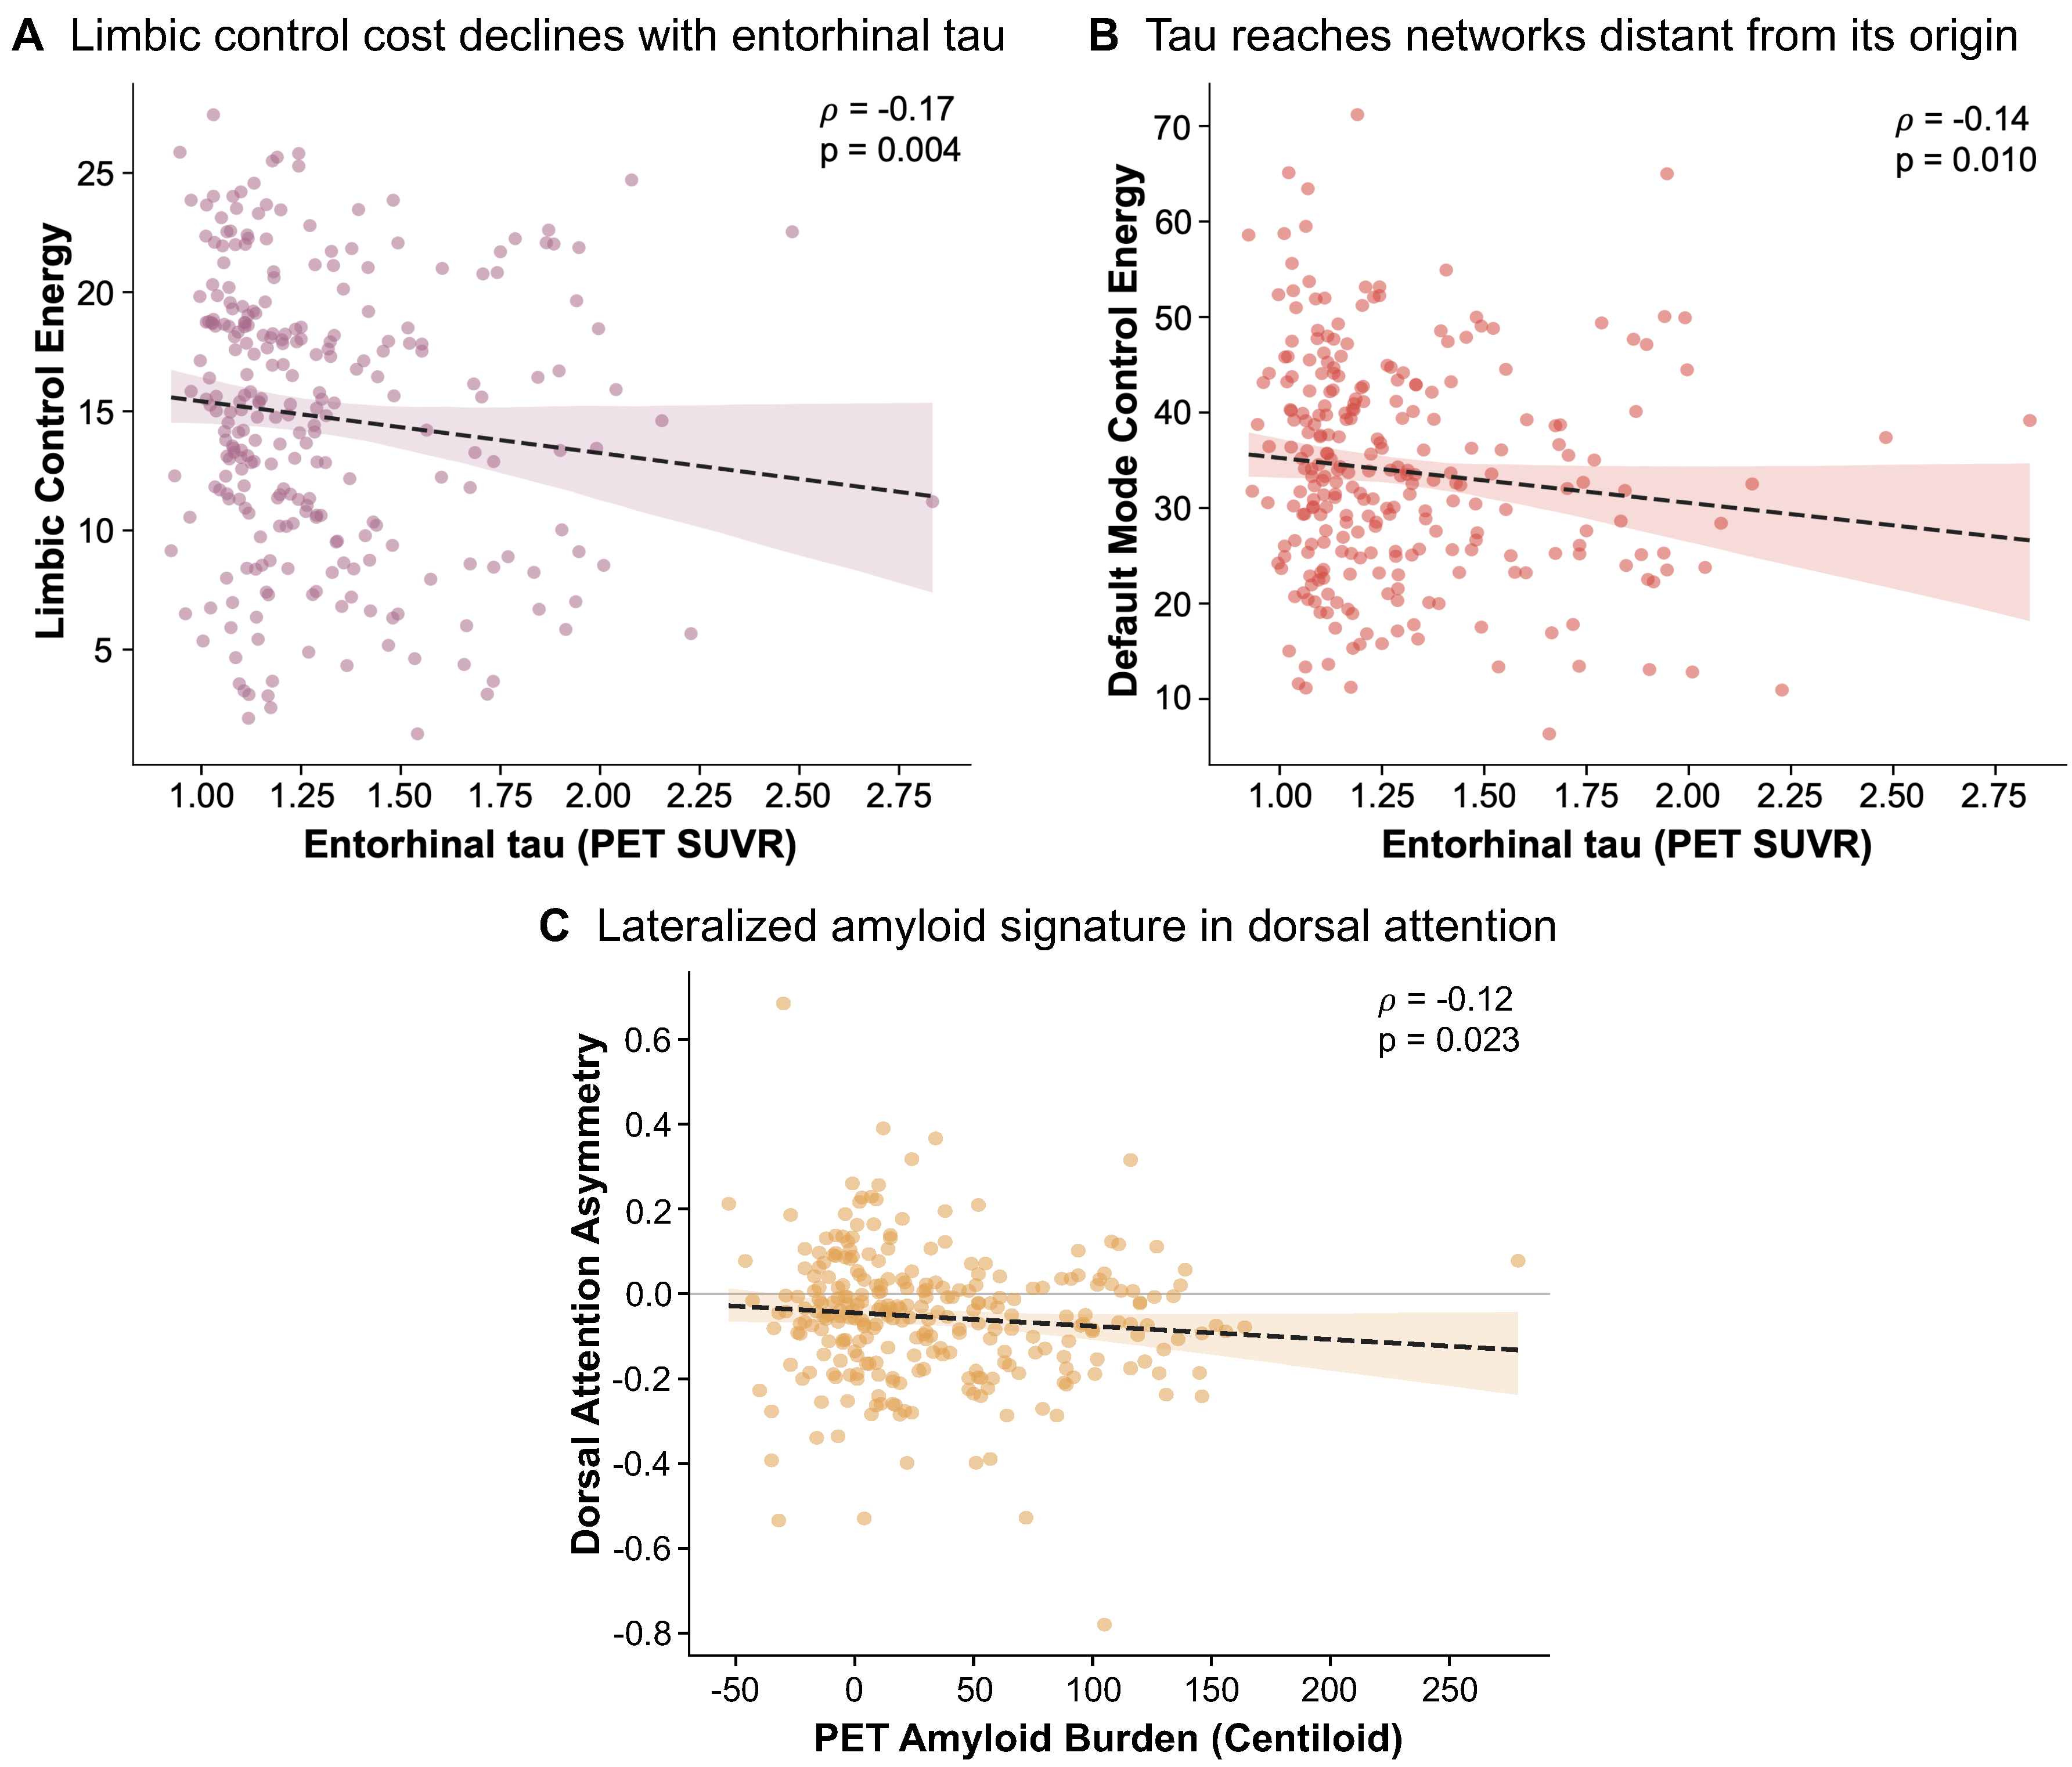
Figure 4.
Genetic risk, pathological stage, and sex shape control energy. QUIET-derived control energy across the amyloid/tau staging axis and by APOE-4 genotype. A. Rise-then-fall across the pathological stages. Control energy rises into the amyloid-positive, pre-tau stage and falls thereafter, with the median trajectory overlaid; the quadratic contrast that tests for a mid-stage peak is significant in the limbic and salience networks. B. Genetic risk raises energy before pathology arrives. Within the pre-pathology stage, APOE-4 carriers require more control energy than non-carriers in every network. C. Sex-specific cost of genetic risk. The APOE-4 effect, split by biological sex assigned at birth, is carried almost entirely by AFAB individuals (asterisks). Staging axis: A−T−, amyloid- and tau-negative; A+T−, amyloid-positive, pre-tau; A+T+, amyloid- and tau-positive. In panel (B), filled curves denote APOE-4 non-carriers and open curves denote carriers; in panel (C), AFAB individuals are indicated by filled markers and AMAB individuals by open markers, with bootstrap confidence intervals.
Figure 4.
Genetic risk, pathological stage, and sex shape control energy. QUIET-derived control energy across the amyloid/tau staging axis and by APOE-4 genotype. A. Rise-then-fall across the pathological stages. Control energy rises into the amyloid-positive, pre-tau stage and falls thereafter, with the median trajectory overlaid; the quadratic contrast that tests for a mid-stage peak is significant in the limbic and salience networks. B. Genetic risk raises energy before pathology arrives. Within the pre-pathology stage, APOE-4 carriers require more control energy than non-carriers in every network. C. Sex-specific cost of genetic risk. The APOE-4 effect, split by biological sex assigned at birth, is carried almost entirely by AFAB individuals (asterisks). Staging axis: A−T−, amyloid- and tau-negative; A+T−, amyloid-positive, pre-tau; A+T+, amyloid- and tau-positive. In panel (B), filled curves denote APOE-4 non-carriers and open curves denote carriers; in panel (C), AFAB individuals are indicated by filled markers and AMAB individuals by open markers, with bootstrap confidence intervals.
Disclaimer/Publisher’s Note: The statements, opinions and data contained in all publications are solely those of the individual author(s) and contributor(s) and not of MDPI and/or the editor(s). MDPI and/or the editor(s) disclaim responsibility for any injury to people or property resulting from any ideas, methods, instructions or products referred to in the content. |
© 2026 by the authors. Licensee MDPI, Basel, Switzerland. This article is an open access article distributed under the terms and conditions of the Creative Commons Attribution (CC BY) license (http://creativecommons.org/licenses/by/4.0/).
Copyright: This open access article is published under a Creative Commons CC BY 4.0 license, which permit the free download, distribution, and reuse, provided that the author and preprint are cited in any reuse.