
Submitted:
04 August 2026
Posted:
05 August 2026
You are already at the latest version
Abstract
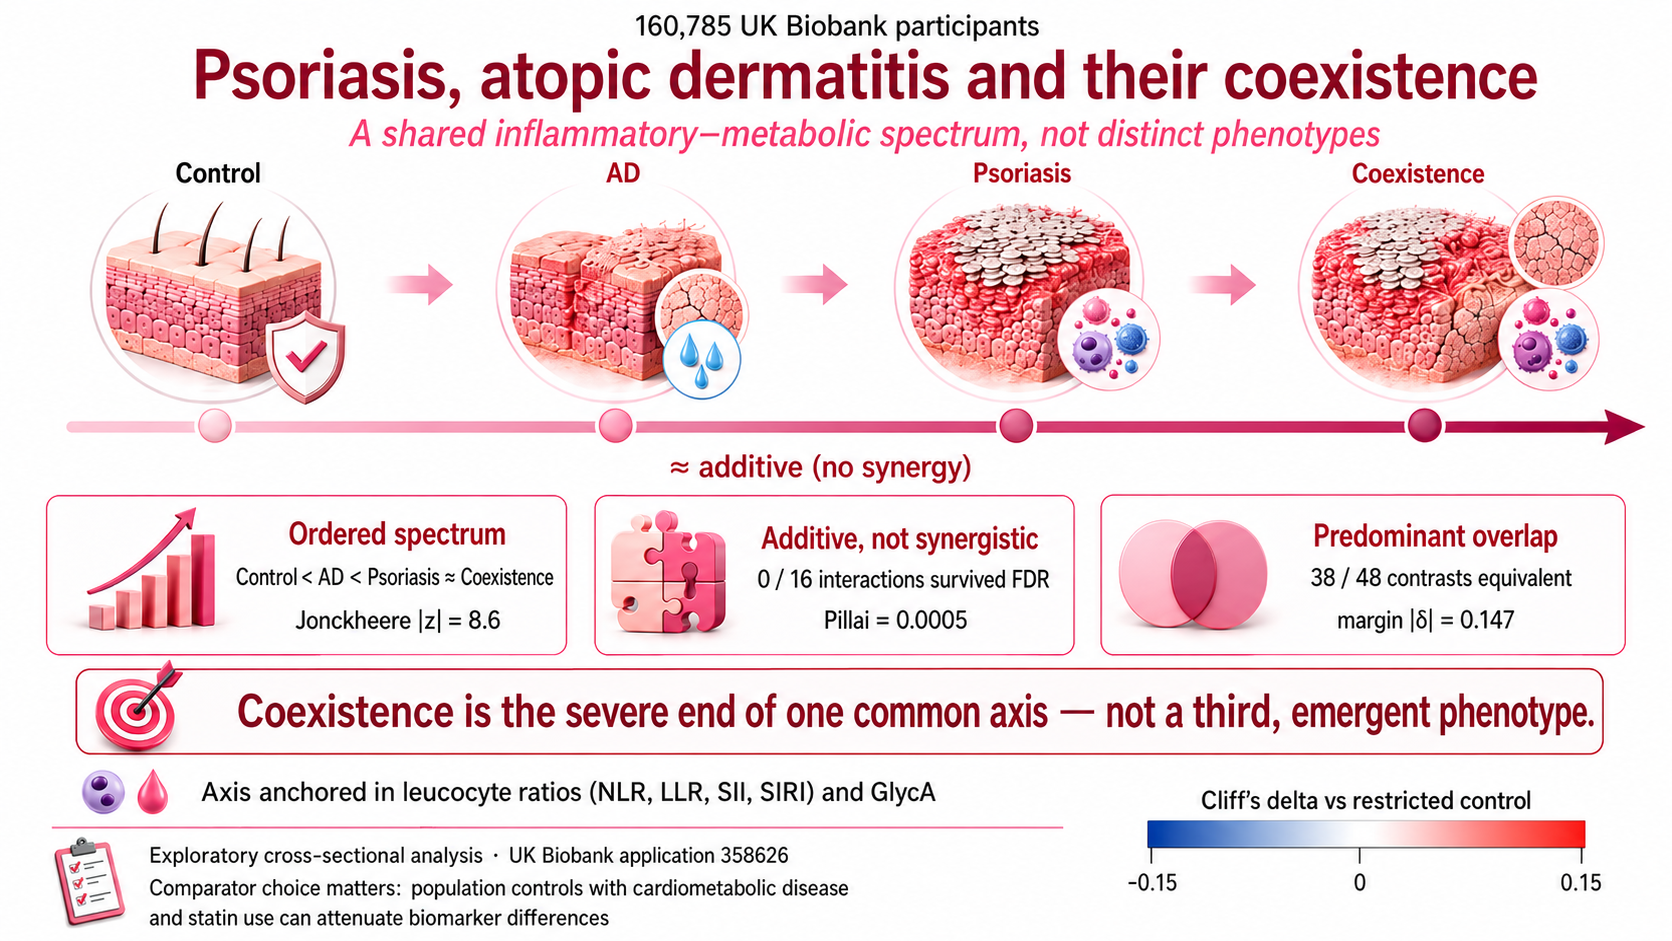
Background/Objectives: Psoriasis and atopic dermatitis have historically been conceived as opposite immunological poles (Th17 versus Th2), yet molecular overlap and increasing clinical coexistence challenge this dichotomy. We aimed to adjudicate, using a multivariate approach, among three nosological architectures: a shared inflammatory–metabolic spectrum with additive coexistence (H1), distinct phenotypes with synergy (H2) and predominant overlap (H0). Methods: Cross-sectional analysis of a selected UK Biobank subsample (160,785 participants), classified by L20/L40 codes as control, isolated atopic dermatitis (n = 12,859), isolated psoriasis (n = 15,146) and coexistence (n = 1,068). Haemato-inflammatory indices, a biochemical–metabolomic panel (including GlycA) and Olink inflammatory proteins were evaluated using Cliff's delta, quantile regression with an interaction term, MANOVA/PERMANOVA, supervised classifiers, Gaussian mixture modelling, dominant-factor ordination with the Jonckheere–Terpstra test and equivalence testing (TOST; margin |δ| = 0.147). Restricted and broad control definitions were adopted. Results: Effect sizes were largely negligible (46/48 contrasts with |δ| < 0.147 under the restricted control; 38/48 formally equivalent). No psoriasis × atopic dermatitis interaction survived false-discovery-rate control (0/16), and the global multivariate interaction, although significant, was trivial (Pillai's trace = 0.0005). The dominant inflammatory factor was monotonically ordered (control < atopic dermatitis < psoriasis ≈ coexistence; Jonckheere |z| = 8.6; p < 0.001). Multivariate separation was detectable yet negligible (PERMANOVA R² = 0.6%; multiclass AUC 0.53), and latent classes did not coincide with clinical labels (adjusted Rand index = 0.004). Conclusions: The evidence favours a shared inflammatory–metabolic spectrum with approximately additive coexistence, superimposed on predominant between-group indistinguishability. Coexistence lies at the severe extreme of a common axis rather than constituting a third, emergent phenotype.
Keywords:
psoriasis
; atopic dermatitis
; multimorbidity
; immunometabolism
; systemic inflammation
; GlycA
; haemato-inflammatory indices
; UK biobank
1. Introduction
Chronic inflammatory skin diseases are no longer understood as processes confined to the integument, but as systemic conditions in which cutaneous inflammation is accompanied by metabolic, haematological and cardiovascular repercussions measurable in the circulation [1,2]. Psoriasis is the most established paradigm of this shift: the IL-23/IL-17 axis that sustains the psoriatic plaque also participates in endothelial dysfunction, insulin resistance and adipose-tissue inflammation, articulating the concept of the psoriatic march, which links the skin to accelerated atherosclerosis [1,2]. Consistently, psoriasis is associated with higher odds of metabolic syndrome in syntheses of observational studies [3]. Atopic dermatitis, classically anchored in type 2 immunity, exhibits its own systemic inflammatory signatures, with Th2 and Th17 co-activation detectable in peripheral blood [4,5].
Historically, psoriasis and atopic dermatitis were regarded as opposite immunological poles. This dichotomy has been progressively qualified as molecular studies reveal overlapping mediators and a shared inflammatory core [6]. The parallel with asthma is instructive: what was assumed to be a single entity proved to be a set of phenotypes and endotypes, now discriminated through supervised classification and unsupervised clustering of biomarkers [7]. The same question of nosological architecture remains open for the psoriasis–atopic dermatitis pair, particularly when both coexist in the same individual [8].
Coexistence, once considered rare under the hypothesis of mutual Th17/Th2 exclusion, is increasingly recognised and constitutes a natural experiment of singular value [8]. If the two diseases represent genuinely distinct phenotypes, an individual harbouring both should display a signature that additively combines the deviations of each. If they represent positions along a single spectrum, coexistence should behave as a graded intensification of a common axis. Distinguishing these architectures has direct consequences for cardiometabolic risk stratification, elevated both in severe atopic dermatitis [9] and across the psoriatic spectrum [10], and for the selection of therapeutic targets.
Population cohorts with deep molecular phenotyping, such as the UK Biobank [11], allow this question to be addressed by integrating lipid and hepatic profiles, circulating inflammatory proteins quantified by proximity extension assays [12], metabolomic markers of systemic inflammation obtained by nuclear magnetic resonance, such as GlycA [13], and inflammatory indices derived from the complete blood count. GlycA, in particular, is a stable marker of low-grade inflammation and a predictor of cardiometabolic risk from early ages, and is informative for comparing inflammatory burden between groups [14]. The aim of this exploratory analysis is to adjudicate, using a multivariate approach, among three mutually discriminating hypotheses: H1, a shared spectrum with additive coexistence; H2, distinct phenotypes with a synergistic component; and H0, predominant overlap.
2. Materials and Methods
2.1. Design, Nature of the Analysis and Reporting
Unlike the pre-specified statistical plan underpinning the project, the present analysis was conducted with direct access to the outcomes and should be interpreted as exploratory and hypothesis-generating, not confirmatory. The results reported here do not replace the formal, pre-registered execution within the governed UK Biobank environment, which they are intended to inform. Reporting follows, where applicable, the STROBE recommendations for cross-sectional observational studies [15]; the completed checklist is provided as Supplementary Material.
The UK Biobank holds ethical approval from the North West Multi-centre Research Ethics Committee (REC reference 11/NW/0382), and all participants provided informed electronic consent. This research was conducted under UK Biobank application number 358626.
2.2. Population and Group Definition
The analytical base is a selected UK Biobank subsample [11] comprising 160,785 participants, drawn from 501,979 participants by the presence of GLP-1 receptor assay data and/or records of six index conditions (L40, L20, E66, I21, I48, I64). Psoriasis was defined by the L40 code family and atopic dermatitis by the L20 family, from the source-of-report field. Four mutually exclusive groups were constituted: control (absence of L40 and L20), isolated atopic dermatitis, isolated psoriasis and coexistence (records of both). The derivation of the analytic sample and the group sizes are summarised in Figure S1.
Because the subsample is enriched for cardiometabolic disease, a control defined solely by the absence of L40/L20 remains contaminated by obesity, myocardial infarction, atrial fibrillation and stroke. A restricted control (additional absence of E66, I21, I48 and I64; n = 31,260) was therefore adopted as the primary comparator, and a broad control (all without L40/L20; n = 131,712) as a sensitivity analysis. The comparison between the two definitions is itself informative regarding the role of cardiometabolic confounding.
2.3. Variables and Biomarker Panels
Three layers with distinct coverage were analysed. The haemato-inflammatory panel, comprising neutrophil-to-lymphocyte ratio (NLR), platelet-to-lymphocyte ratio (PLR), monocyte-to-lymphocyte ratio (MLR), leucocyte-to-lymphocyte ratio (LLR), monocyte-to-HDL ratio (MHR), systemic immune-inflammation index (SII) and systemic inflammation response index (SIRI), had coverage close to 95%; such ratios have been studied as correlates of systemic inflammation and subclinical atherosclerotic cardiovascular disease in psoriasis [16]. The biochemical and metabolomic panel (total cholesterol, LDL, VLDL, HDL, triglycerides, ALT, AST, HbA1c and GlycA) ranged from 55% to 94% coverage. Olink inflammatory proteins (IL-6, IL-17A/C/F, IL-18, IL-12, IL-4, IL-13, IL-31, FCER1A and FCER2), expressed as relative NPX values on a log scale [12], were available in approximately 29% of samples, with a small number in the coexistence group (n ≈ 163), which limits proteomic inference in that subgroup.
2.4. Covariates and Deviations from the Plan
The effectively available adjustment set comprised age, sex, body mass index, smoking (a derived binary indicator), ethnicity (white versus other) and statin use (identified through text analysis of medication codes). Three covariates specified in the plan could not be honoured in this extraction: the Townsend deprivation index and income were absent or empty; fasting time and assessment centre were not present in the file; and the age field corresponded to attained age rather than age at recruitment. These deviations are recorded transparently, reduce the degree of adjustment for socioeconomic position and should be incorporated into the definitive execution.
Statin use was more frequent in controls (26.7% in the broad control) than in psoriasis (18.7%) or atopic dermatitis (15.4%), reflecting the greater cardiometabolic burden and screening of the group without skin disease. This pattern is capable of masking or reversing lipid deviations and was explicitly considered in the interpretation.
2.5. Pre-Processing
Each biomarker was standardised to a z-score using the median and interquartile range of the restricted control group as reference, so that deviations were expressed in comparable, summable units, a condition necessary for the additivity test. Scores were winsorised at ±5 standard deviations. Multivariate analyses were conducted on complete cases with the effective number reported; the multiple imputation specified in the plan is recommended for the definitive analysis.
2.6. Executed Analysis Plan
Magnitude and uncertainty, rather than significance in isolation, guided interpretation. Effect sizes were estimated by Cliff’s delta [17], with confidence intervals and established thresholds (negligible when |δ| < 0.147) [18]. Additivity was tested by median quantile regression with psoriasis and atopic dermatitis indicators and their interaction term, adjusted for the available covariates, and by MANOVA of the interaction. Separation was assessed by PERMANOVA with Euclidean distance [19] and by classifiers (penalised logistic regression and random forest), with cross-validation and null validation by permutation. Latent structure was investigated by principal component analysis and Gaussian mixture modelling, with agreement measured by the adjusted Rand index and normalised mutual information. Ordination was tested by extracting the dominant factor and applying the Jonckheere–Terpstra trend test. Overlap was tested affirmatively by equivalence (TOST) against the margin |δ| = 0.147 [20]. False-discovery-rate control followed the Benjamini–Hochberg procedure by family [21].
2.7. Additional Sensitivity Analyses
The equivalence margin was re-evaluated at three values (|δ| = 0.11, 0.147 and 0.20), and the empirical distribution of |δ| was examined as a reference for the smallest effect of interest. Homogeneity of multivariate dispersions across groups was tested by PERMDISP. Additivity was re-examined at the 0.75 and 0.90 quantiles, in addition to the median. Redundancy among the leucocyte ratios was quantified by Spearman correlation. The role of immunomodulatory and biologic therapies was assessed by a sensitivity analysis excluding participants using these agents, identified through text analysis of medication codes. Finally, the smallest detectable interaction effect was estimated given the size of the coexistence group.
2.8. Use of Generative Artificial Intelligence
Generative artificial intelligence tools were used to improve the language, readability and formatting of author-written text. Claude Opus 4.8 was used to translate the manuscript into academic English, to correct grammatical errors in the text and tables, and to format the manuscript in accordance with the journal’s author guidelines; Grammarly Pro was used for additional grammar checking. The prompts used were: “Translate the manuscript into academic English.”; “Rigorously correct grammatical errors in the text and tables.”; and “Format the manuscript in accordance with the Healthcare (MDPI) author guidelines.” Generative artificial intelligence was not used for study design, data collection, statistical analysis or interpretation of the data. All outputs were reviewed and edited by the authors, who take full responsibility for the final content.
3. Results
3.1. Baseline Characterisation
The four groups differed consistently with the severity-gradient hypothesis. From the restricted control to coexistence, a progressive increase was observed in body mass index (26.2 to 27.9 kg/m2), statin use (11.6% to 20.4%), SIRI (0.92 to 1.06) and NLR (2.12 to 2.29), with a concomitant reduction in HDL (1.43 to 1.34 mmol/L). The prevalence of obesity, myocardial infarction and atrial fibrillation rose from 0%, by definition, in the restricted control to 19.2%, 6.7% and 9.7% in coexistence (Table 1).
3.2. Univariate Effect Sizes
Against the restricted control, Cliff’s deltas of the robust panel ranged from −0.12 to 0.16, with 46 of 48 contrasts classified as negligible (|δ| < 0.147). Hierarchical clustering (Figure 1) revealed an inflammatory–metabolic block with graded elevation, more marked in psoriasis and coexistence, encompassing SIRI, monocyte-to-HDL ratio, GlycA, ALT, HbA1c and leucocyte ratios, and a lipid block with reductions in HDL, LDL and total cholesterol. Isolated atopic dermatitis showed systematically smaller deviations. The largest absolute values occurred for monocyte-to-HDL ratio and SIRI in coexistence (δ = 0.15 and 0.16) and in psoriasis (δ = 0.14); only the two coexistence values exceeded the negligibility threshold (Table 2).
3.3. Circulating Inflammatory Proteins (Olink)
In the proteomic subset, isolated psoriasis showed the largest deviations in IL-6 (δ = 0.20; 95% CI 0.17–0.23) and IL-17A (δ = 0.16; 95% CI 0.13–0.19), both above the negligibility threshold, with IL-17C, IL-17F, IL-18 and IL-12 elevated to a lesser degree. Type 2 pathway markers (IL-4, IL-13 and IL-31) remained close to zero. This pattern is compatible with a shared IL-17/inflammatory core, more strongly expressed in psoriasis, rather than a discriminating Th2 signature [4,5,6].
3.4. Additivity Versus Synergy
After adjustment, none of the sixteen psoriasis × atopic dermatitis interaction terms reached statistical significance under false-discovery-rate control (0/16; smallest q = 0.51 for HbA1c). The global multivariate interaction test was statistically significant but of trivial magnitude (Pillai’s trace = 0.0005; p = 0.003), corresponding to less than 0.1% of the multivariate variance explained by the interaction. Taken together, the coexistence profile is obtained by summing the deviations of the isolated diseases, supporting an additive rather than synergistic model.
3.5. Multivariate Separation and Discrimination
PERMANOVA detected global separation among the four groups (pseudo-F = 3.38; p = 0.003), but the clinical label explained only 0.6% of the multivariate dispersion. Classifiers achieved a multiclass area under the curve of 0.54 (logistic regression) and 0.53 (random forest), against 0.50 under the permutation null (p = 0.04), indicating discriminative ability statistically above chance but without practical value. The principal-component projection (Figure 2) showed extensive overlap among the groups. Multivariate dispersion, however, was not homogeneous across groups (PERMDISP F = 98.1; p < 0.001): the median distance to the centroid increased from the restricted control (3.24) to atopic dermatitis (3.37), psoriasis (3.61) and coexistence (3.63). Part of the global separation detected by PERMANOVA is therefore attributable to heterogeneity of dispersion rather than to displacement of the group centroids, which further weakens any reading of discrete phenotypes.
3.6. Unsupervised Structure
Gaussian mixture modelling selected four latent classes on the basis of the Bayesian information criterion. Agreement between these classes and clinical diagnoses was essentially nil (adjusted Rand index = 0.004; normalised mutual information = 0.007). That is, although the data possess internal structure, this structure does not correspond to the separation among control, atopic dermatitis, psoriasis and coexistence, favouring the interpretation of a continuum rather than discrete phenotypes coinciding with the clinical label.
3.7. Ordination and Severity Spectrum
The dominant inflammatory–metabolic factor explained 30.7% of the variance and was anchored chiefly in leucocyte ratios (LLR, SIRI, NLR and SII), with a smaller contribution from lipid markers. The medians of this factor followed a monotonically increasing order from control (−0.56) to atopic dermatitis (−0.39), psoriasis (−0.16) and coexistence (−0.15), with a strongly significant Jonckheere–Terpstra trend (|z| = 8.6; p < 0.001). Coexistence occupied the extreme of the axis without, however, standing apart from psoriasis, reinforcing the reading of a graded intensification (Figure 3).
3.8. Confirmation of Overlap by Equivalence
Under the pre-specified margin |δ| = 0.147, 38 of 48 contrasts of the robust panel were statistically equivalent to the restricted control, a proportion rising to 47 of 48 under the broad control. Non-equivalence concentrated in monocyte-to-HDL ratio and SIRI in psoriasis and coexistence and in a few metabolic markers in coexistence, precisely those that define the extreme of the common axis (Figure 4). The conclusion of predominant overlap proved dependent on the chosen margin: the equivalent proportion was 26/48 under a strict criterion (0.11), 38/48 under the small-effect margin (0.147) and 48/48 under 0.20. The empirical distribution of |δ| (median 0.081; 90th percentile 0.126; maximum 0.158) places the adopted margin just above the 90th percentile of the observed effects.
3.9. Decision Synthesis
The decision matrix (Table 3) summarises this convergence towards a shared inflammatory–metabolic spectrum with additive coexistence (H1), overlapping with indistinguishability (H0); distinct phenotypes with synergy (H2) found no support.
3.10. Sensitivity Analyses
Excluding participants using immunomodulatory or biologic therapies, more frequent in psoriasis (5.0%) and coexistence (3.3%) than in atopic dermatitis (0.8%) or controls (1.0%), did not materially alter the results. Effect sizes remained stable (for example, SIRI in psoriasis δ = 0.13 and GlycA δ = 0.12), and the monotonic ordination of the dominant factor persisted (medians −0.53, −0.35, −0.16 and −0.12 from control to coexistence; Jonckheere–Terpstra z = 15.4; p < 0.001). The inflammatory–metabolic gradient is therefore not explained by treatment.
The absence of synergy extended beyond the median: none of the sixteen interaction terms was significant at the median (smallest p = 0.094), and the interaction remained non-significant at the 0.75 and 0.90 quantiles for GlycA and SIRI, with a single isolated nominal signal for HbA1c at the 0.90 quantile (p = 0.013) that did not withstand multiplicity correction. Given the size of the coexistence group (n = 1,068), the smallest detectable interaction effect at 80% power was approximately 0.09 standard deviations, quantitatively bounding the magnitude of any undetected synergy.
Finally, the leucocyte ratios anchoring the dominant factor were strongly correlated with one another (for example, NLR–LLR ρ = 0.98; NLR–SII ρ = 0.86; LLR–SII ρ = 0.84), so that part of the weight of this axis reflects structural redundancy among ratios derived from the same blood counts. Interpretation of the dominant factor should account for this collinearity; a reduced set of representative indices is recommended for the definitive execution.
4. Discussion
The question of nosological architecture is not resolved marker by marker, but through the joint geometry of the biomarkers. Under this lens, the data converge on a clear reading: at the level of the systemic biomarkers considered, psoriasis, atopic dermatitis and their coexistence behave less like distinct territories and more like points along a single severity gradient. Leucocyte ratios and GlycA define the principal axis of variation, along which the groups order gradually, with coexistence at the extreme, without exceeding it synergistically.
Three results coherently support this interpretation. First, the absence of a psoriasis × atopic dermatitis interaction after adjustment indicates that coexistence is approximately the sum of the parts, not an emergent phenotype. Second, the discordance between latent classes and clinical labels indicates that the internal structure of the data is not organised by diagnosis, contrary to the expectation of discrete phenotypes. Third, the monotonic ordination of the dominant factor materialises the severity spectrum predicted by H1.
The contrast between the two control definitions is instructive and reinforces methodological caution. Under the broad control, almost all contrasts become equivalent and some lipid deviations reverse, consistent with the greater statin use and cardiometabolic burden of the group without skin disease. The choice of comparator is therefore not neutral, and comparing patients with a contaminated population control may spuriously attenuate differences.
One methodological caveat remains: the leucocyte ratios defining the dominant axis are highly collinear, so the prominence of the haematological ratios should be interpreted with caution due to structural redundancy.
Immunologically, the predominance of a systemic IL-17/inflammatory core, with IL-6 and IL-17A as the most expressive proteomic deviations in psoriasis and type 2 markers close to zero in peripheral blood, is compatible with a shared Th17–metabolic axis, in dialogue with the literature linking psoriasis to metabolic syndrome through the IL-17 axis [2,3] and with evidence of systemic inflammation in atopic dermatitis as well [4,5]. Clinically, the implication is that coexistence might be managed as the severe extreme of a single inflammatory–metabolic process, with heightened attention to cardiometabolic risk [9,10], rather than necessarily as a distinct therapeutic entity.
Limitations
Several limitations condition the strength of the conclusions. The analysis is exploratory and cross-sectional, permitting neither causal nor temporal inference, and was performed with access to the outcomes, distinguishing it from the pre-registered confirmatory test it is intended to inform. The sample is a subselection of the UK Biobank enriched for cardiometabolic disease, so the control, even when restricted, does not represent the general population and the results are not directly generalisable. Olink proteins cover approximately 29% of the sample and are scarce in coexistence, rendering the proteomic arm of that group of limited value. Case definition relied on a single source of report, without requiring agreement across sources, and misclassification tends to attenuate real differences. Finally, complete cases were used rather than multiple imputation, and the small number of participants with coexistence limits the ability to detect subtle synergy.
5. Conclusions
In this exploratory analysis of 160,785 UK Biobank participants, psoriasis, atopic dermatitis and their coexistence did not behave as discrete immunometabolic phenotypes, but as positions along a shared inflammatory–metabolic spectrum anchored in leucocyte ratios and GlycA, along which the groups were monotonically ordered from control to coexistence. Coexistence occupied the severe extreme of this common axis in an approximately additive manner, with no evidence of synergy and with most contrasts formally equivalent to the control. These findings, obtained with access to the outcomes and in a subsample enriched for cardiometabolic disease, require confirmation in the pre-registered execution within the governed UK Biobank environment.
Supplementary Materials
The following supporting information can be downloaded at the website of this paper posted on Preprints.org. Figure S1: participant flow diagram (derivation of the analytic subsample and group assignment); File S1: completed STROBE checklist for cross-sectional studies.
Author Contributions
Conceptualization, F.W.R. and E.L.J.; methodology, F.W.R.; formal analysis, E.L.J.; investigation, F.W.R.; data curation, F.W.R.; writing—original draft preparation, F.W.R.; writing—review and editing, F.W.R. and E.L.J.; supervision, E.L.J. All authors have read and agreed to the published version of the manuscript.
Funding
This research was supported by Amazon Web Services (AWS) through a research scholarship grant.
Institutional Review Board Statement
The study was conducted in accordance with the Declaration of Helsinki. The UK Biobank received ethical approval from the North West Multi-centre Research Ethics Committee as a research tissue bank (REC reference 11/NW/0382, approved on 17 June 2011). The present analysis was conducted under UK Biobank application number 358626 and required no additional ethical approval.
Informed Consent Statement
Informed electronic consent was obtained from all subjects involved in the study by the UK Biobank at recruitment.
Data Availability Statement
The data that support the findings of this study are available from the UK Biobank (https://www.ukbiobank.ac.uk/) upon approved application. The authors do not have permission to redistribute the individual-level data. Analysis code is available from the corresponding author upon reasonable request.
Acknowledgments
This research was conducted using the UK Biobank Resource under application number 358626. The authors thank the UK Biobank participants and the UK Biobank team for access to the data. During the preparation of this manuscript, the authors used Claude Opus 4.8 (Anthropic) and Grammarly Pro for the purposes of translation into academic English, language editing and formatting of author-written text. The authors have reviewed and edited the output and take full responsibility for the content of this publication.
Conflicts of Interest
The authors declare no conflicts of interest. The funder had no role in the design of the study; in the collection, analyses or interpretation of data; in the writing of the manuscript; or in the decision to publish the results.
Abbreviations
The following abbreviations are used in this manuscript:
| AD | Atopic dermatitis |
| ALT | Alanine aminotransferase |
| ARI | Adjusted Rand index |
| AST | Aspartate aminotransferase |
| AUC | Area under the curve |
| BMI | Body mass index |
| CI | Confidence interval |
| FDR | False discovery rate |
| GlycA | Glycoprotein acetyls |
| GMM | Gaussian mixture model |
| HbA1c | Glycated haemoglobin |
| HDL | High-density lipoprotein |
| IQR | Interquartile range |
| LDL | Low-density lipoprotein |
| LLR | Leucocyte-to-lymphocyte ratio |
| MANOVA | Multivariate analysis of variance |
| MHR | Monocyte-to-HDL ratio |
| MLR | Monocyte-to-lymphocyte ratio |
| NLR | Neutrophil-to-lymphocyte ratio |
| NMI | Normalised mutual information |
| NPX | Normalised protein expression |
| PC | Principal component |
| PERMANOVA | Permutational multivariate analysis of variance |
| PERMDISP | Permutational analysis of multivariate dispersions |
| PLR | Platelet-to-lymphocyte ratio |
| SII | Systemic immune-inflammation index |
| SIRI | Systemic inflammation response index |
| STROBE | Strengthening the Reporting of Observational Studies in Epidemiology |
| TOST | Two one-sided tests |
| VLDL | Very-low-density lipoprotein |
References
- Boehncke, W.-H.; Boehncke, S.; Tobin, A.-M.; Kirby, B. The ‘psoriatic march’: a concept of how severe psoriasis may drive cardiovascular comorbidity. Exp. Dermatol. 2011, 20, 303–307. [Google Scholar] [CrossRef] [PubMed]
- Gisondi, P.; Fratton, Z.; Vighi da Rosa, R.; Bellini, V.; Carugno, A. Unveiling the IL-17 axis: an immunometabolic bridge between psoriasis and metabolic syndrome. J. Dermatol. Treat. 2026, 37, 2673285. [Google Scholar] [CrossRef] [PubMed]
- Singh, S.; Young, P.; Armstrong, A.W. An update on psoriasis and metabolic syndrome: a meta-analysis of observational studies. PLoS ONE 2017, 12, e0181039. [Google Scholar] [CrossRef] [PubMed]
- Brunner, P.M.; He, H.; Pavel, A.B.; Czarnowicki, T.; Lefferdink, R.; Erickson, T.; Canter, T.; Puar, N.; Rangel, S.M.; Malik, K.; et al. The blood proteomic signature of early-onset pediatric atopic dermatitis shows systemic inflammation and is distinct from adult long-standing disease. J. Am. Acad. Dermatol. 2019, 81, 510–519. [Google Scholar] [CrossRef] [PubMed]
- Czarnowicki, T.; Esaki, H.; Gonzalez, J.; Malajian, D.; Shemer, A.; Noda, S.; Talasila, S.; Berry, A.; Gray, J.; Becker, L.; et al. Early pediatric atopic dermatitis shows only a cutaneous lymphocyte antigen (CLA)+ TH2/TH1 cell imbalance, whereas adults acquire CLA+ TH22/TC22 cell subsets. J. Allergy Clin. Immunol. 2015, 136, 941–951.e3. [Google Scholar] [CrossRef] [PubMed]
- Werfel, T.; Allam, J.-P.; Biedermann, T.; Eyerich, K.; Gilles, S.; Guttman-Yassky, E.; Hoetzenecker, W.; Knol, E.; Simon, H.-U.; Wollenberg, A.; et al. Cellular and molecular immunologic mechanisms in patients with atopic dermatitis. J. Allergy Clin. Immunol. 2016, 138, 336–349. [Google Scholar] [CrossRef] [PubMed]
- Grunwell, J.R.; Fitzpatrick, A.M. Asthma phenotypes and biomarkers. Respir. Care 2025, 70, 649–674. [Google Scholar] [CrossRef] [PubMed]
- Kaszycki, M.A.; Pixley, J.N.; Feldman, S.R. Concurrent atopic dermatitis and psoriasis successfully treated with dual biologic therapy. Cutis 2023, 112, E13–E16. [Google Scholar] [CrossRef] [PubMed]
- Silverwood, R.J.; Forbes, H.J.; Abuabara, K.; Ascott, A.; Schmidt, M.; Schmidt, S.A.J.; Smeeth, L.; Langan, S.M. Severe and predominantly active atopic eczema in adulthood and long term risk of cardiovascular disease: population based cohort study. BMJ 2018, 361, k1786. [Google Scholar] [CrossRef] [PubMed]
- Scriffignano, S.; Lories, R.; Nzeusseu Toukap, A.; Lubrano, E.; Ciccia, F.; Steinfeld, S.; Perrotta, F.M.; Pantano, I.; Van den Bosch, F.; de Vlam, K. Cardiovascular comorbidities in psoriatic arthritis: epidemiology and risk factors in two different European populations. Clin. Exp. Rheumatol. 2023, 41, 1815–1822. [Google Scholar] [CrossRef] [PubMed]
- Sudlow, C.; Gallacher, J.; Allen, N.; Beral, V.; Burton, P.; Danesh, J.; Downey, P.; Elliott, P.; Green, J.; Landray, M.; et al. UK Biobank: an open access resource for identifying the causes of a wide range of complex diseases of middle and old age. PLoS Med. 2015, 12, e1001779. [Google Scholar] [CrossRef] [PubMed]
- Sun, B.B.; Chiou, J.; Traylor, M.; Benner, C.; Hsu, Y.-H.; Richardson, T.G.; Surendran, P.; Mahajan, A.; Robins, C.; Vasquez-Grinnell, S.G.; et al. Plasma proteomic associations with genetics and health in the UK Biobank. Nature 2023, 622, 329–338. [Google Scholar] [CrossRef] [PubMed]
- Julkunen, H.; Cichońska, A.; Slagboom, P.E.; Würtz, P. Metabolic biomarker profiling for identification of susceptibility to severe pneumonia and COVID-19 in the general population. eLife 2021, 10, e63033. [Google Scholar] [CrossRef] [PubMed]
- Chiesa, S.T.; Charakida, M.; Georgiopoulos, G.; Roberts, J.D.; Stafford, S.J.; Park, C.; Mykkänen, J.; Kähönen, M.; Lehtimäki, T.; Ala-Korpela, M.; et al. Glycoprotein acetyls: a novel inflammatory biomarker of early cardiovascular risk in the young. J. Am. Heart Assoc. 2022, 11, e024380. [Google Scholar] [CrossRef] [PubMed]
- Vandenbroucke, J.P.; von Elm, E.; Altman, D.G.; Gøtzsche, P.C.; Mulrow, C.D.; Pocock, S.J.; Poole, C.; Schlesselman, J.J.; Egger, M.; STROBE Initiative. Strengthening the Reporting of Observational Studies in Epidemiology (STROBE): explanation and elaboration. PLoS Med. 2007, 4, e297. [Google Scholar] [CrossRef] [PubMed]
- Kvist-Hansen, A.; Kaiser, H.; Krakauer, M.; Gørtz, P.M.; Wang, X.; Becker, C.; Zachariae, C.; Hansen, P.R.; Skov, L. Neutrophil-to-lymphocyte ratio and the systemic immune-inflammation index as potential biomarkers of effective treatment and subclinical atherosclerotic cardiovascular disease in patients with psoriasis. J. Eur. Acad. Dermatol. Venereol. 2023, 37, e586–e589. [Google Scholar] [CrossRef] [PubMed]
- Cliff, N. Dominance statistics: ordinal analyses to answer ordinal questions. Psychol. Bull. 1993, 114, 494–509. [Google Scholar] [CrossRef]
- Romano, J.; Kromrey, J.D.; Coraggio, J.; Skowronek, J. Appropriate statistics for ordinal level data: should we really be using t-test and Cohen’s d for evaluating group differences on the NSSE and other surveys? In Proceedings of the Annual Meeting of the Florida Association of Institutional Research, Cocoa Beach, FL, USA, 1–3 February 2006. [Google Scholar]
- Anderson, M.J. A new method for non-parametric multivariate analysis of variance. Austral Ecol. 2001, 26, 32–46. [Google Scholar] [CrossRef]
- Lakens, D.; Scheel, A.M.; Isager, P.M. Equivalence testing for psychological research: a tutorial. Adv. Methods Pract. Psychol. Sci. 2018, 1, 259–269. [Google Scholar] [CrossRef]
- Benjamini, Y.; Hochberg, Y. Controlling the false discovery rate: a practical and powerful approach to multiple testing. J. R. Stat. Soc. Ser. B Stat. Methodol. 1995, 57, 289–300. [Google Scholar] [CrossRef]
Figure 1.
Effect sizes (Cliff’s delta versus restricted control) and hierarchical clustering of biomarkers. Warm tones indicate elevation; cool tones, reduction. The dendrogram was redrawn for publication and preserves the topology of the original hierarchical clustering. AD, atopic dermatitis.
Figure 1.
Effect sizes (Cliff’s delta versus restricted control) and hierarchical clustering of biomarkers. Warm tones indicate elevation; cool tones, reduction. The dendrogram was redrawn for publication and preserves the topology of the original hierarchical clustering. AD, atopic dermatitis.
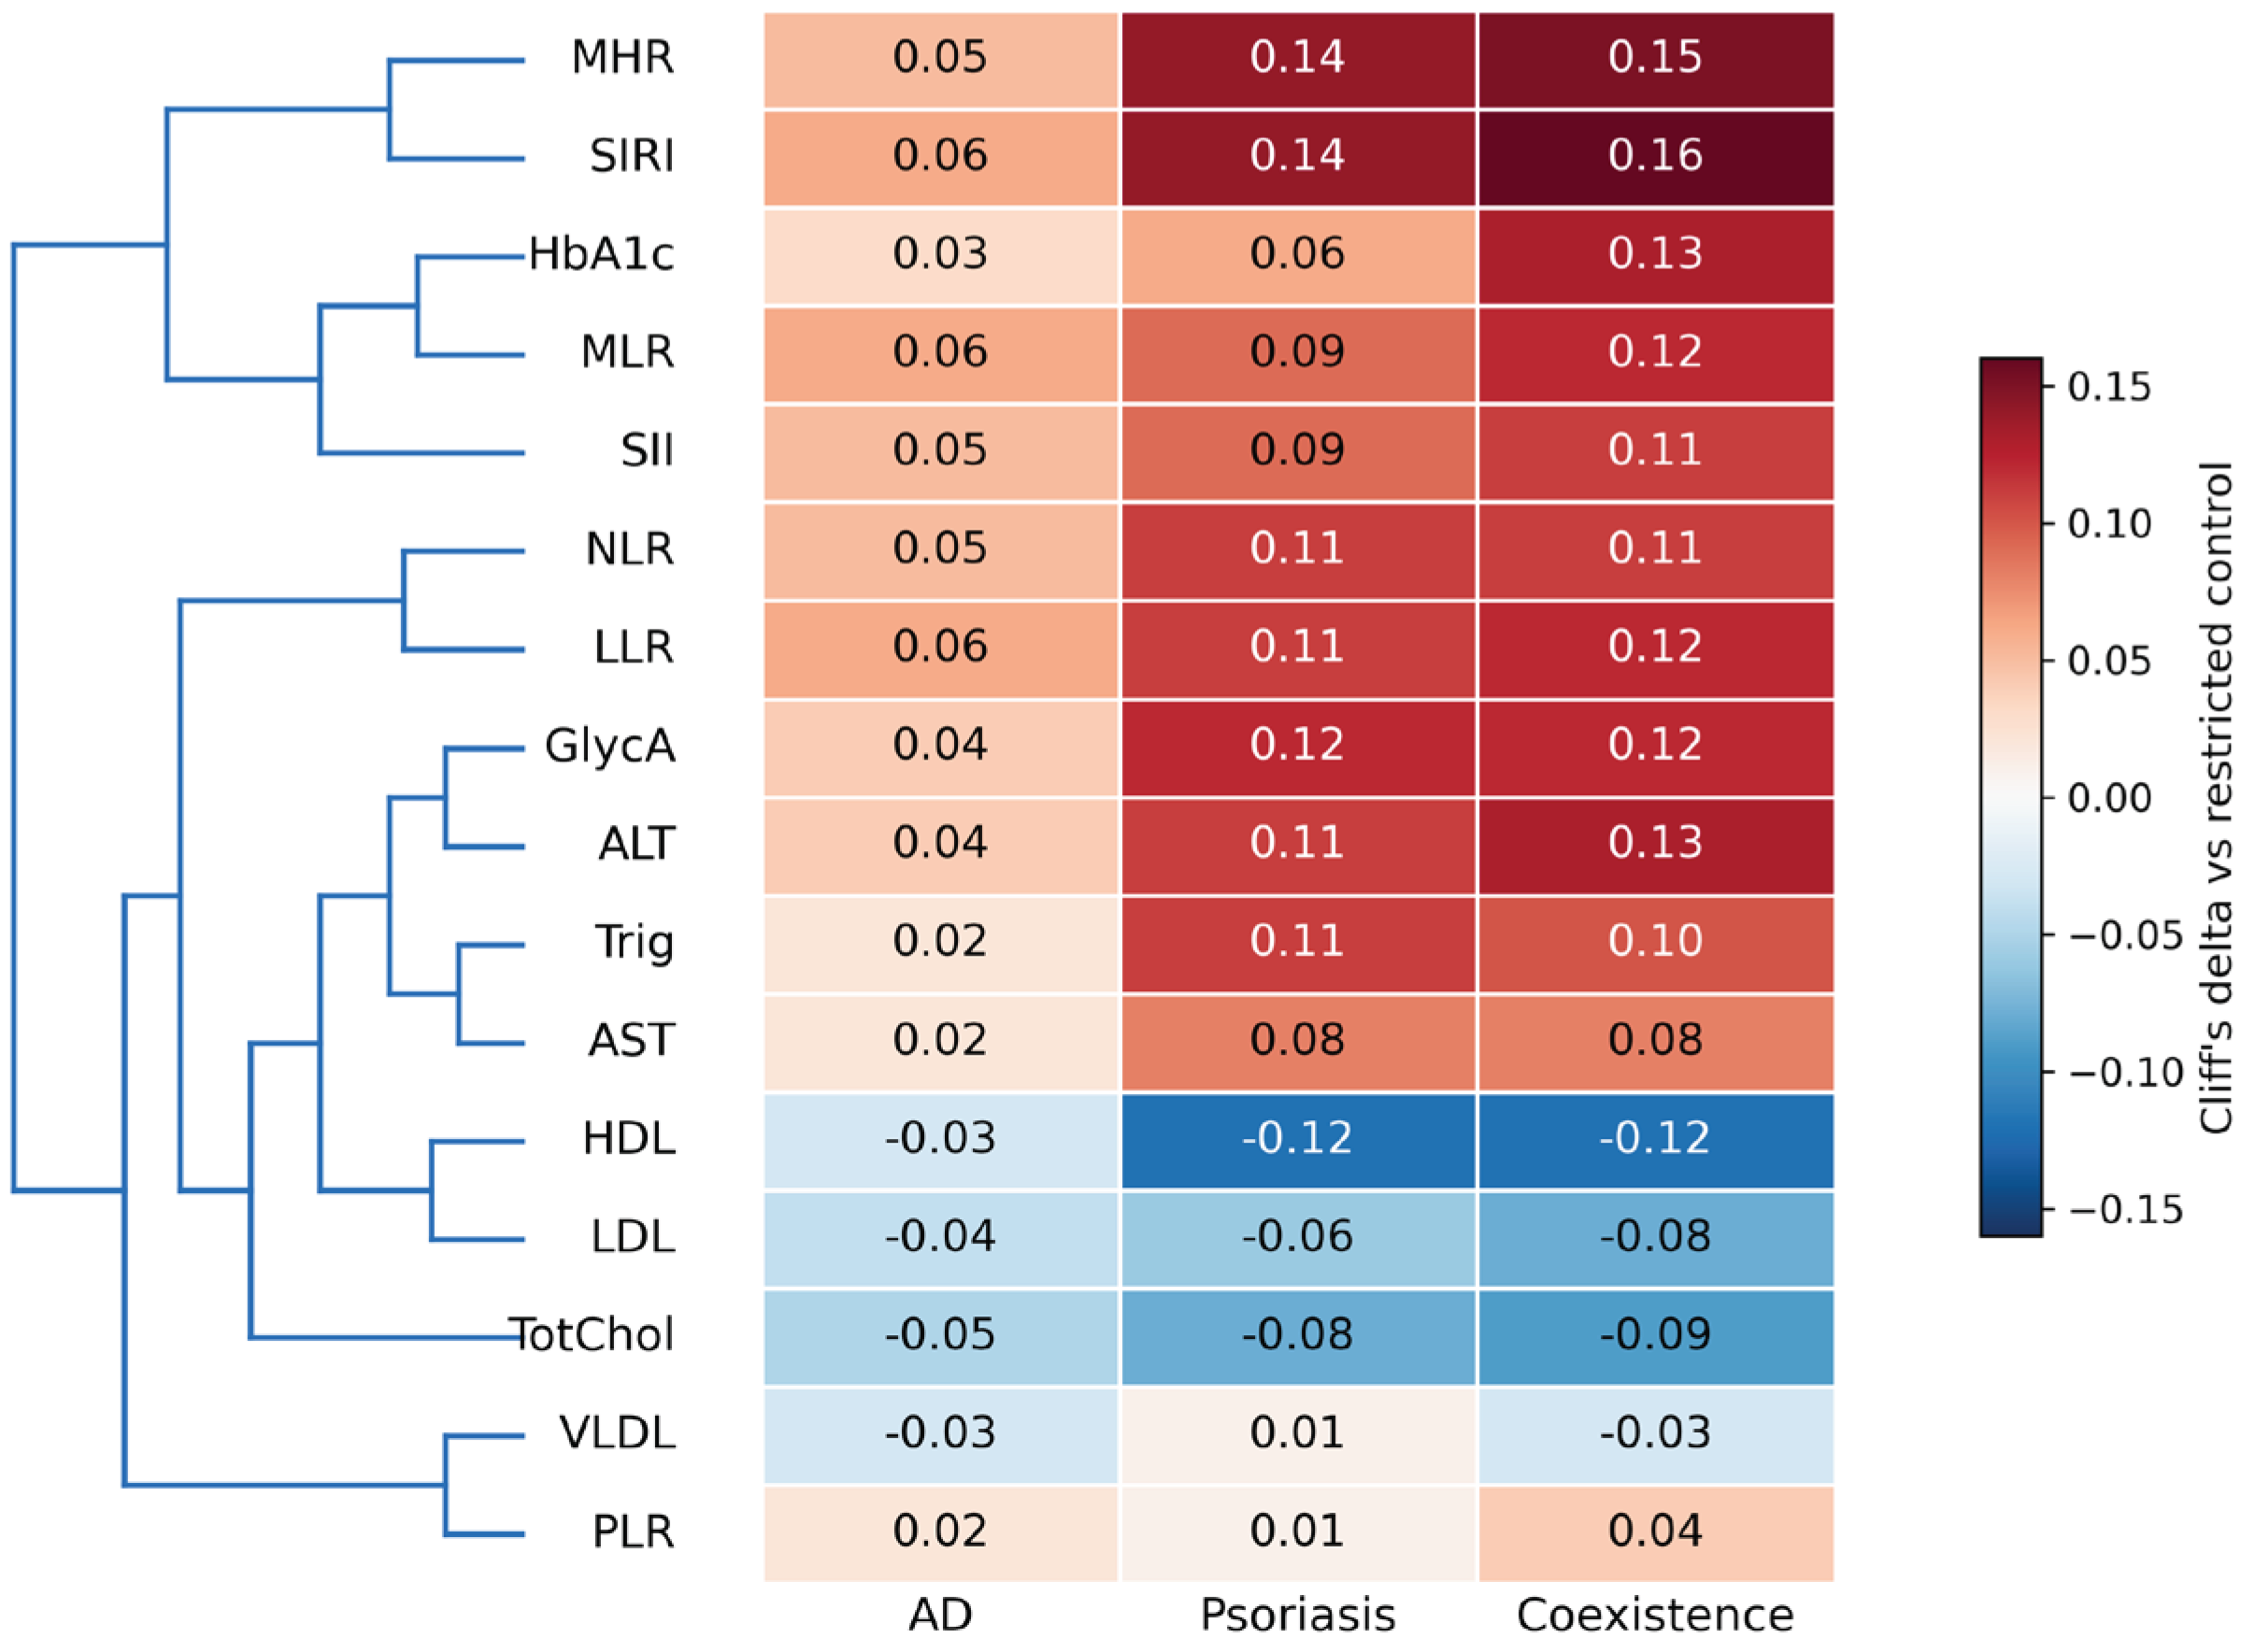
Figure 2.
Projection of standardised biomarkers onto the first two principal components (sampled by group). PC1 explains 30.7% and PC2 18.8% of the variance. AD, atopic dermatitis; Coexist., coexistence.
Figure 2.
Projection of standardised biomarkers onto the first two principal components (sampled by group). PC1 explains 30.7% and PC2 18.8% of the variance. AD, atopic dermatitis; Coexist., coexistence.
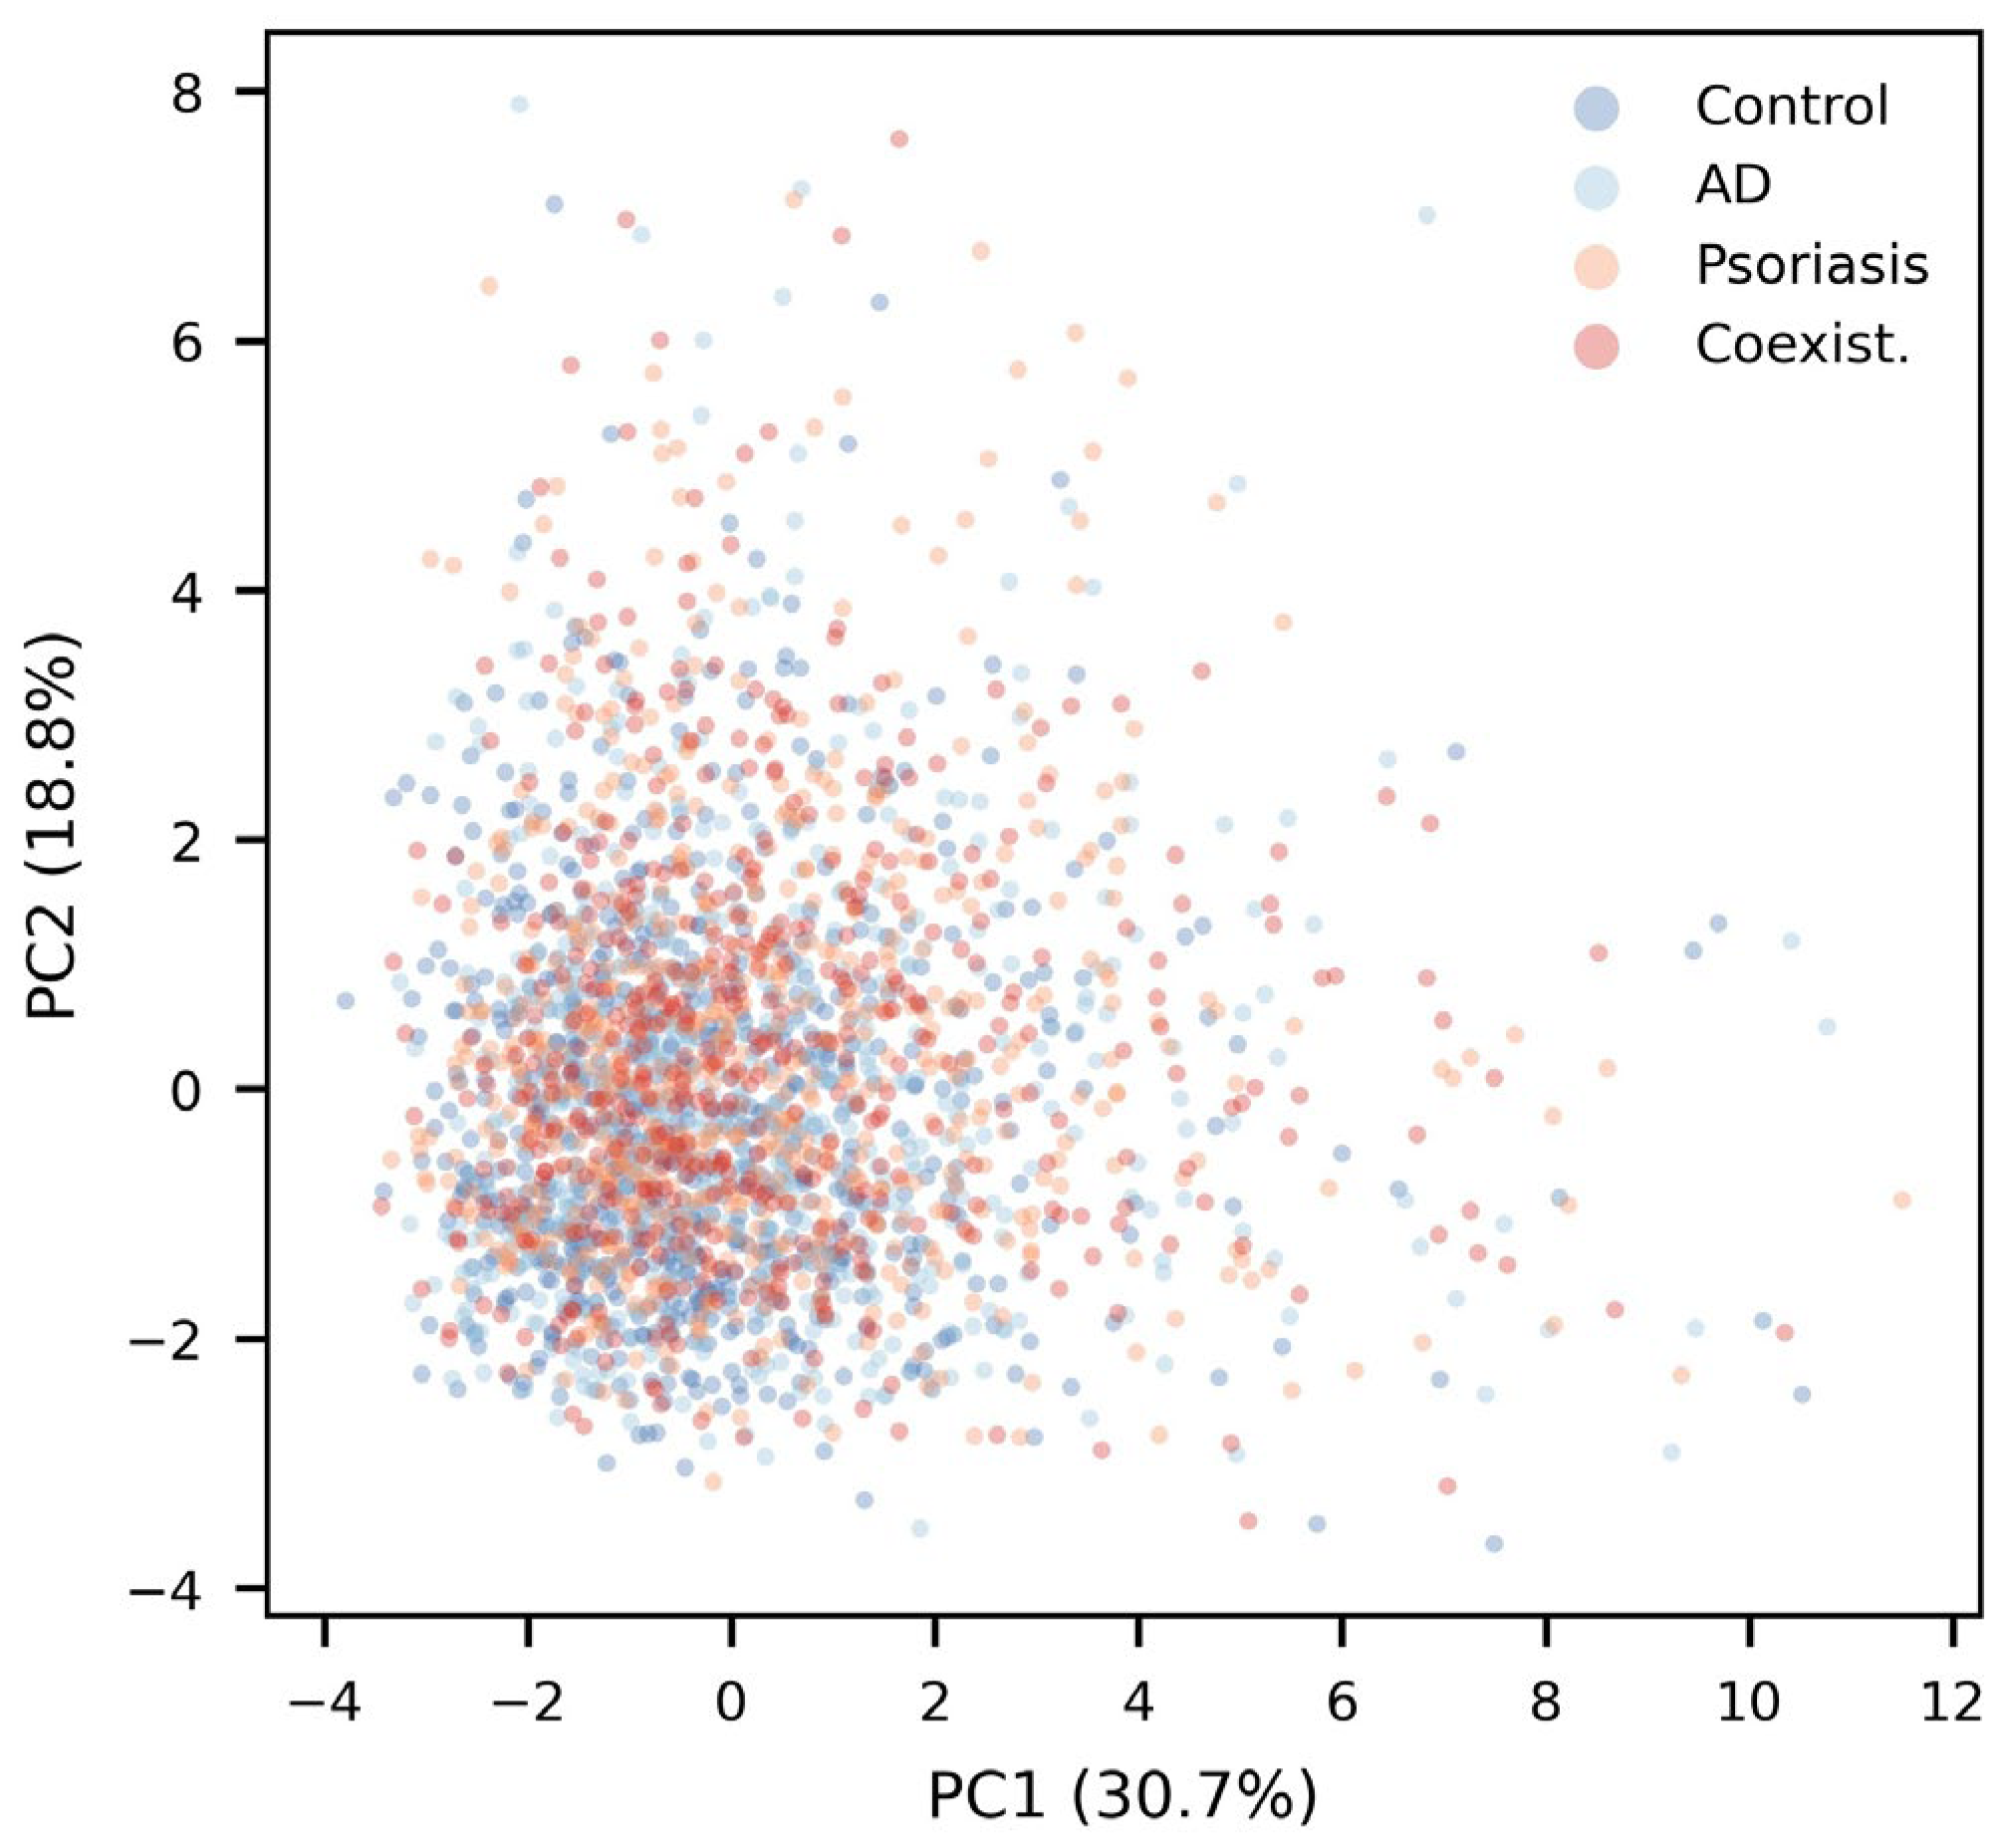
Figure 3.
Distribution of the dominant inflammatory–metabolic factor by group. Black dots denote medians, joined by a dashed line to evidence the order of severity. AD, atopic dermatitis; Coexist., coexistence.
Figure 3.
Distribution of the dominant inflammatory–metabolic factor by group. Black dots denote medians, joined by a dashed line to evidence the order of severity. AD, atopic dermatitis; Coexist., coexistence.
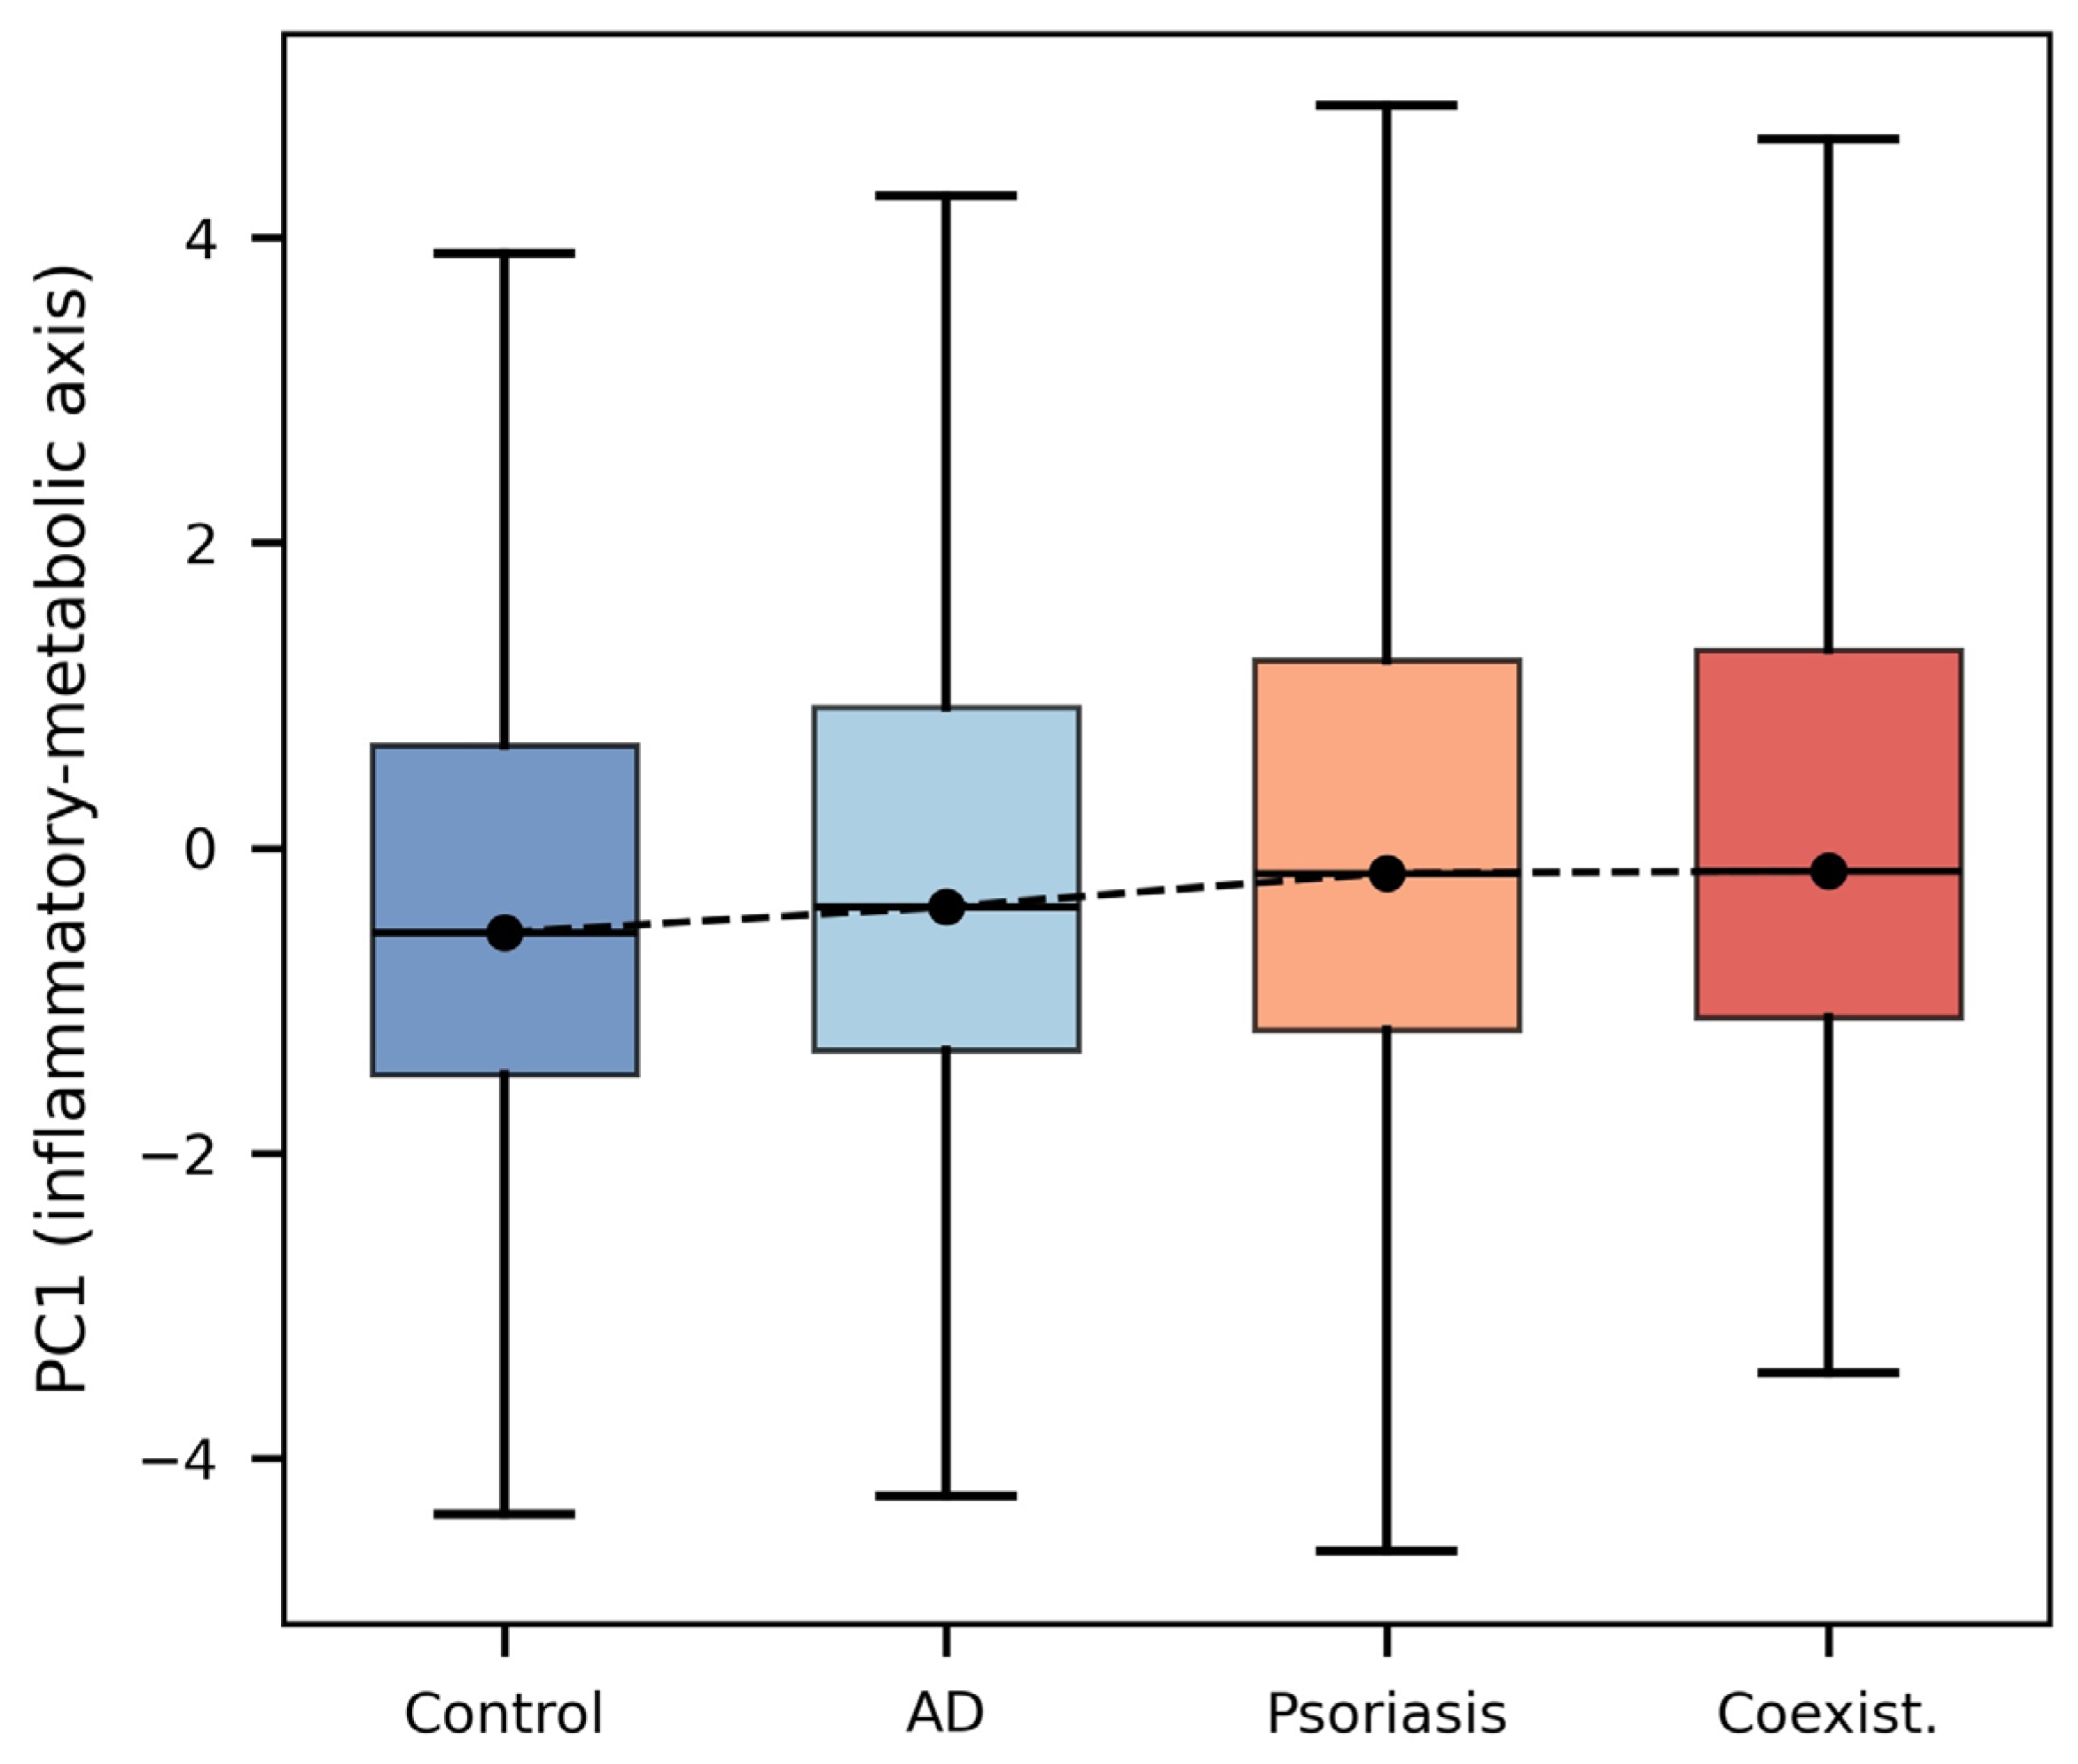
Figure 4.
Cliff’s delta (coexistence versus restricted control) with 95% confidence intervals and the ±0.147 equivalence band (shaded). ALT, alanine aminotransferase; AST, aspartate aminotransferase; GlycA, glycoprotein acetyls; HbA1c, glycated haemoglobin; HDL, high-density lipoprotein; LDL, low-density lipoprotein; LLR, leucocyte-to-lymphocyte ratio; MHR, monocyte-to-HDL ratio; MLR, monocyte-to-lymphocyte ratio; NLR, neutrophil-to-lymphocyte ratio; PLR, platelet-to-lymphocyte ratio; SII, systemic immune-inflammation index; SIRI, systemic inflammation response index; TotChol, total cholesterol; Trig, triglycerides; VLDL, very-low-density lipoprotein.
Figure 4.
Cliff’s delta (coexistence versus restricted control) with 95% confidence intervals and the ±0.147 equivalence band (shaded). ALT, alanine aminotransferase; AST, aspartate aminotransferase; GlycA, glycoprotein acetyls; HbA1c, glycated haemoglobin; HDL, high-density lipoprotein; LDL, low-density lipoprotein; LLR, leucocyte-to-lymphocyte ratio; MHR, monocyte-to-HDL ratio; MLR, monocyte-to-lymphocyte ratio; NLR, neutrophil-to-lymphocyte ratio; PLR, platelet-to-lymphocyte ratio; SII, systemic immune-inflammation index; SIRI, systemic inflammation response index; TotChol, total cholesterol; Trig, triglycerides; VLDL, very-low-density lipoprotein.
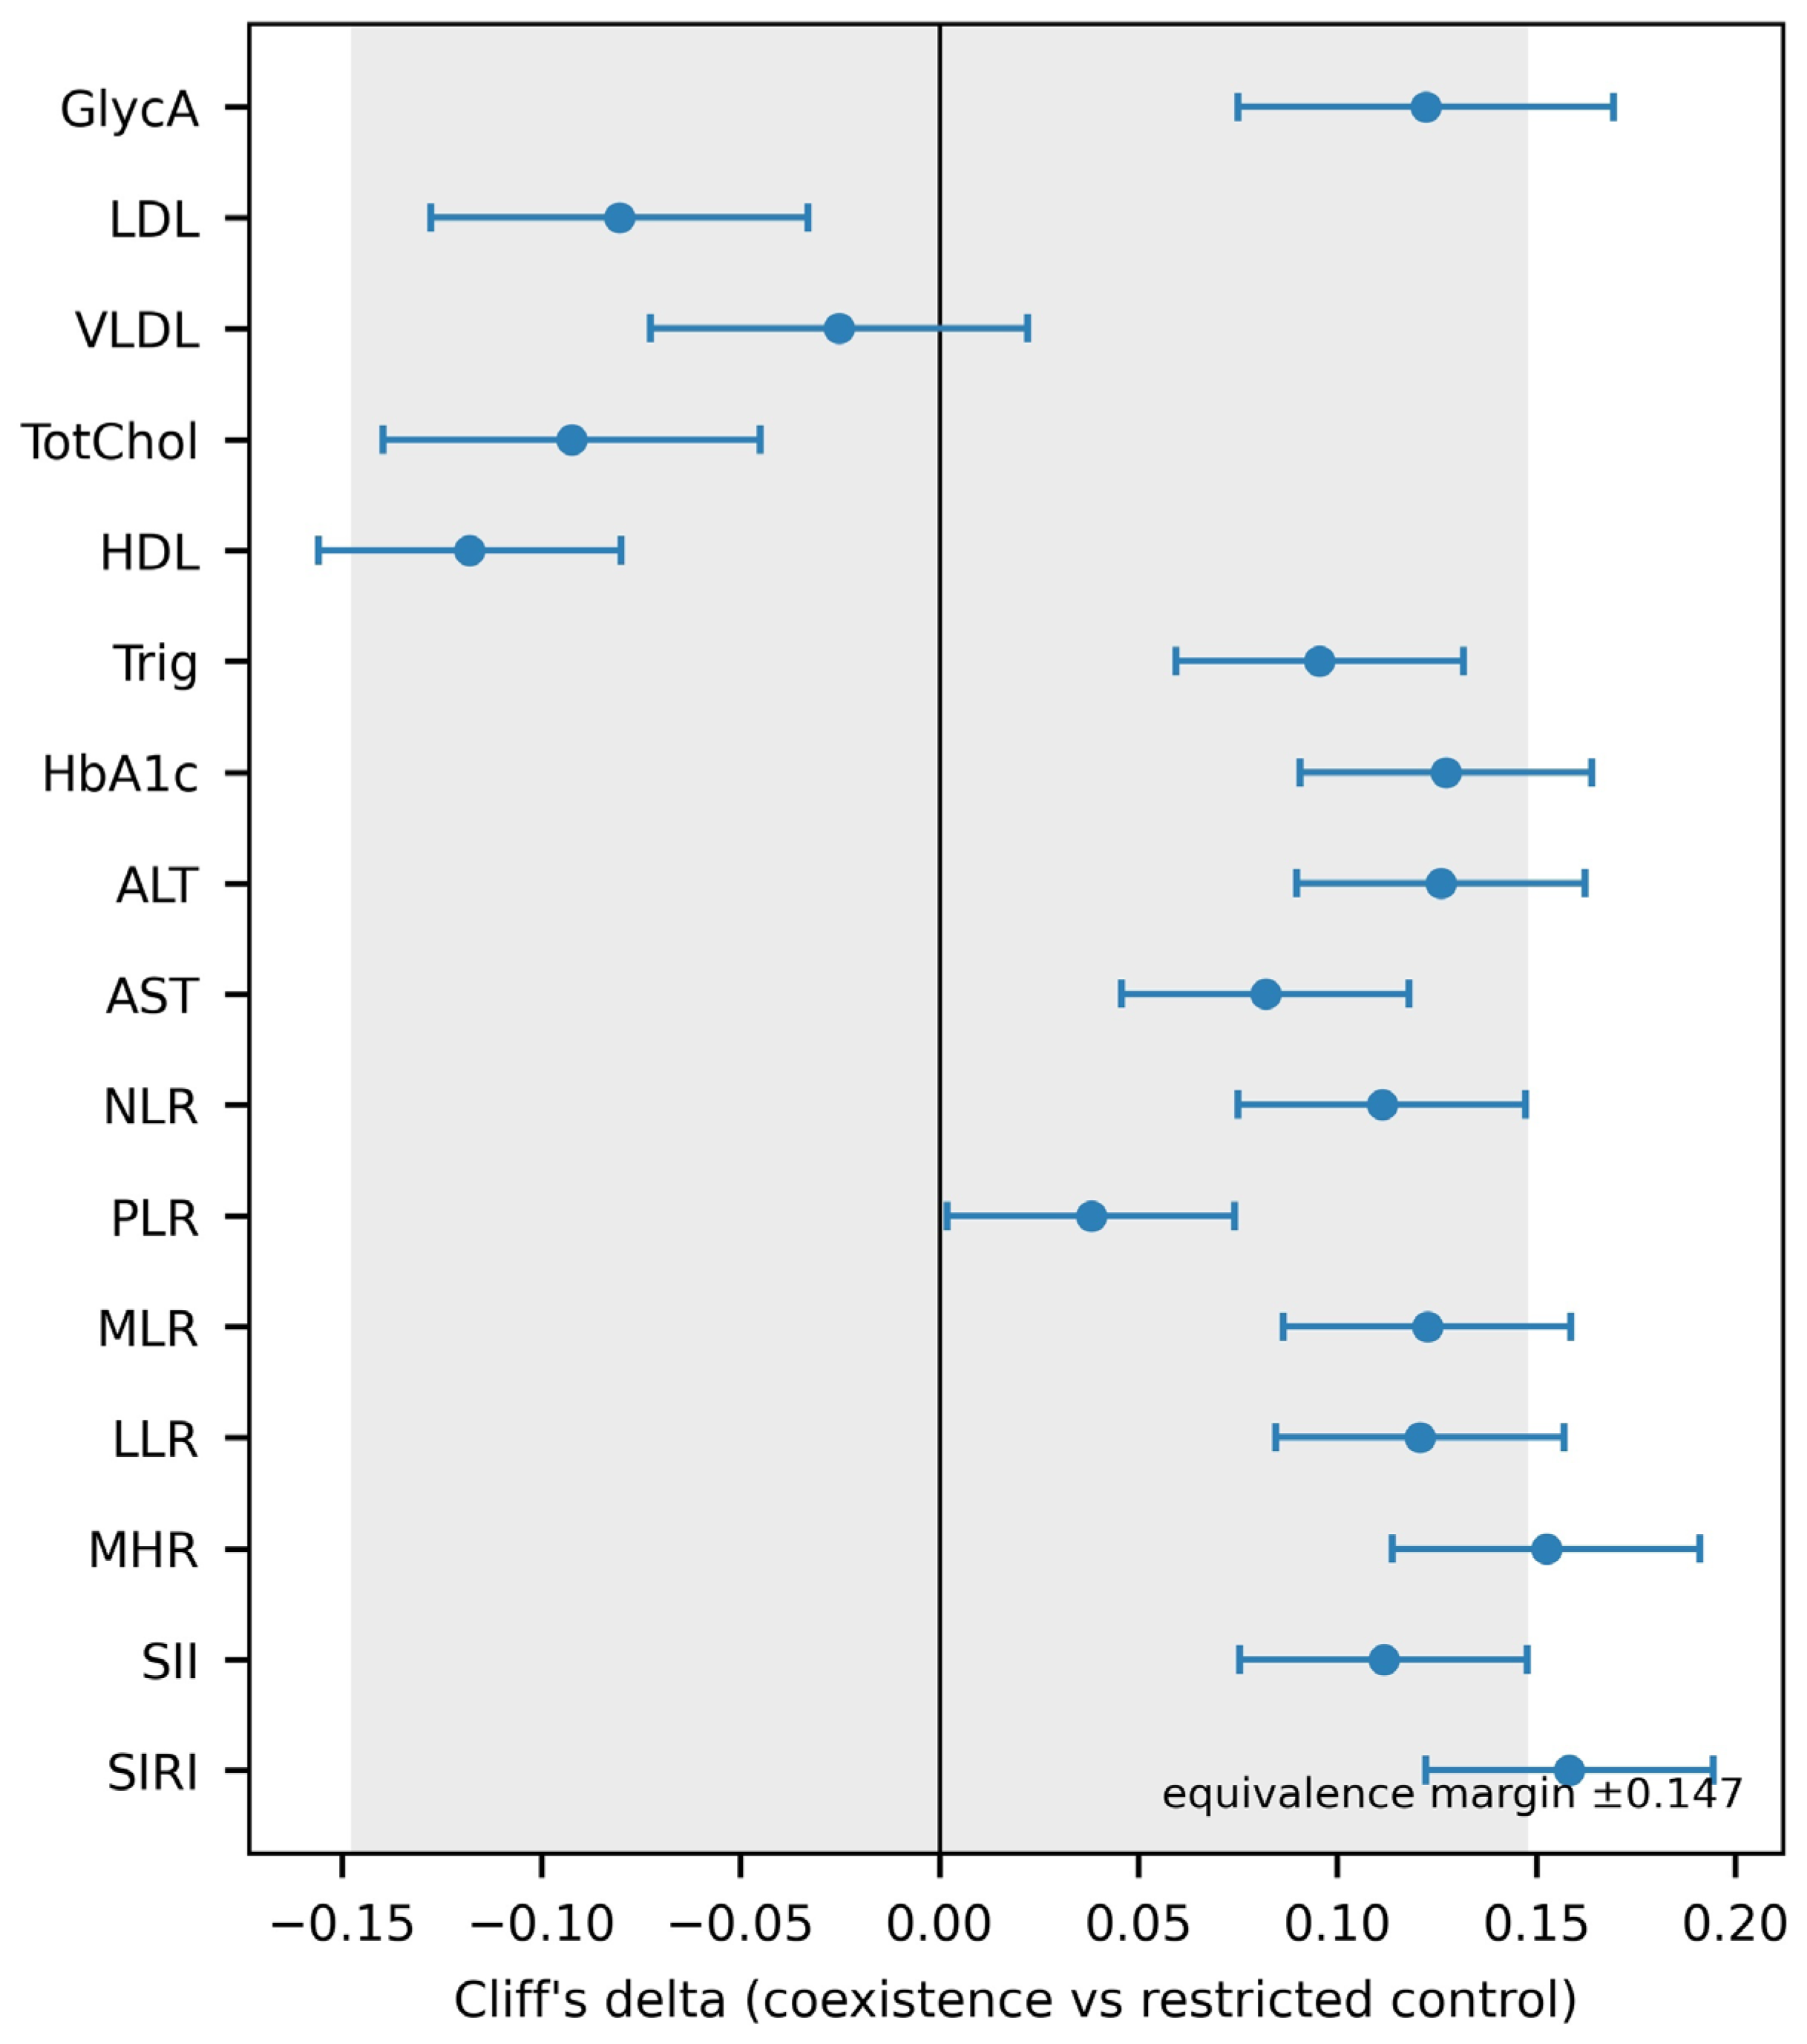

Table 1.
Baseline characterisation by group, with the restricted control as reference.
| Characteristic | Restricted Control | Isolated AD | Isolated Psoriasis | Coexistence |
|---|---|---|---|---|
| n | 31,260 | 12,859 | 15,146 | 1,068 |
| Age, median (IQR), years | 73 (66–79) | 74 (66–79) | 74 (67–79) | 75 (68–80) |
| Female sex | 56.8% | 58.1% | 49.8% | 54.1% |
| BMI, median (kg/m2) | 26.2 | 26.7 | 27.5 | 27.9 |
| Smoking | 10.2% | 10.1% | 14.9% | 14.7% |
| Statin use | 11.6% | 15.4% | 18.7% | 20.4% |
| Obesity (E66) | 0% * | 13.7% | 16.0% | 19.2% |
| Myocardial infarction (I21) | 0% * | 5.1% | 7.1% | 6.7% |
| Atrial fibrillation (I48) | 0% * | 8.8% | 11.3% | 9.7% |
| GlycA, median | 0.80 | 0.81 | 0.82 | 0.83 |
| HDL, median (mmol/L) | 1.43 | 1.41 | 1.35 | 1.34 |
| NLR, median | 2.12 | 2.18 | 2.27 | 2.29 |
| SIRI, median | 0.92 | 0.98 | 1.05 | 1.06 |
* Zero by definition of the restricted control. AD, atopic dermatitis; BMI, body mass index; GlycA, glycoprotein acetyls; HDL, high-density lipoprotein; IQR, interquartile range; NLR, neutrophil-to-lymphocyte ratio; SIRI, systemic inflammation response index.
Table 2.
Cliff’s delta (95% confidence interval) for selected markers, each clinical group versus the restricted control.
Table 2.
Cliff’s delta (95% confidence interval) for selected markers, each clinical group versus the restricted control.
| Biomarker | AD vs. Control δ (95% CI) | Psoriasis vs. Control δ (95% CI) | Coexistence vs. Control δ (95% CI) |
|---|---|---|---|
| GlycA | 0.04 (0.03–0.06) | 0.12 (0.11–0.14) | 0.12 (0.08–0.17) |
| HDL | −0.03 (−0.04 to −0.01) | −0.12 (−0.14 to −0.11) | −0.12 (−0.16 to −0.08) |
| LDL | −0.04 (−0.06 to −0.03) | −0.06 (−0.07 to −0.04) | −0.08 (−0.13 to −0.03) |
| HbA1c | 0.03 (0.02–0.04) | 0.06 (0.05–0.07) | 0.13 (0.09–0.16) |
| ALT | 0.04 (0.03–0.05) | 0.11 (0.09–0.12) | 0.13 (0.09–0.16) |
| NLR | 0.05 (0.04–0.06) | 0.11 (0.09–0.12) | 0.11 (0.08–0.15) |
| MHR (monocyte/HDL) | 0.05 (0.04–0.06) | 0.14 (0.13–0.15) | 0.15 (0.11–0.19) |
| SIRI | 0.06 (0.05–0.08) | 0.14 (0.13–0.15) | 0.16 (0.12–0.19) |
| IL-6 (Olink) † | — | 0.20 (0.17–0.23) | — (low n) |
| IL-17A (Olink) † | — | 0.16 (0.13–0.19) | — (low n) |
† Olink proteins available in a subset of participants (low n in the coexistence group). AD, atopic dermatitis; ALT, alanine aminotransferase; CI, confidence interval; GlycA, glycoprotein acetyls; HbA1c, glycated haemoglobin; HDL, high-density lipoprotein; LDL, low-density lipoprotein; MHR, monocyte-to-HDL ratio; NLR, neutrophil-to-lymphocyte ratio; SIRI, systemic inflammation response index.
Table 3.
Decision matrix populated with the exploratory results.
| Target | Observed Result | Interpretation | Favours |
|---|---|---|---|
| Between-group separation | PERMANOVA R2 = 0.6% (p = 0.003); multiclass AUC 0.53 vs. null 0.50 (p = 0.04) | Statistical separation of negligible magnitude | H0 / H1 |
| Additivity vs. synergy | 0/16 psoriasis × AD interactions with q < 0.05; MANOVA Pillai = 0.0005 (p = 0.003) | No relevant synergy; coexistence ≈ additive | H1 (additive) |
| Monotonic ordination | Factor medians: −0.56 < −0.39 < −0.16 ≈ −0.15; Jonckheere |z| = 8.6 (p < 0.001) | Severity gradient control → AD → psoriasis ≈ coexistence | H1 (spectrum) |
| Discrete vs. continuous structure | GMM k = 4 (BIC); ARI = 0.004; NMI = 0.007 | Latent classes do not coincide with clinical labels | H1 (continuum) |
| Overlap (equivalence) | 38/48 equivalent (restricted control); 47/48 (broad control); margin |δ| = 0.147 | Distributions virtually indistinguishable for most markers | H0 |
AD, atopic dermatitis; ARI, adjusted Rand index; AUC, area under the curve; BIC, Bayesian information criterion; GMM, Gaussian mixture model; NMI, normalised mutual information; PERMANOVA, permutational multivariate analysis of variance.
Disclaimer/Publisher’s Note: The statements, opinions and data contained in all publications are solely those of the individual author(s) and contributor(s) and not of MDPI and/or the editor(s). MDPI and/or the editor(s) disclaim responsibility for any injury to people or property resulting from any ideas, methods, instructions or products referred to in the content. |
© 2026 by the authors. Licensee MDPI, Basel, Switzerland. This article is an open access article distributed under the terms and conditions of the Creative Commons Attribution (CC BY) license (http://creativecommons.org/licenses/by/4.0/).
Copyright: This open access article is published under a Creative Commons CC BY 4.0 license, which permit the free download, distribution, and reuse, provided that the author and preprint are cited in any reuse.


