
Submitted:
04 August 2026
Posted:
05 August 2026
You are already at the latest version
Abstract
This study presents the development and comprehensive characterisation of a sustainable 3D-printable cementitious composition in which up to 40 wt.% of Portland cement was replaced by a ternary binder containing oil shale ash (OSA) and metakaolin (MK). Following laboratory optimisation, the developed formulations were successfully transferred to industrial production as pre-blended dry mixes at Sakret Latvia Ltd., demonstrating the feasibility of large-scale manufacturing of printable cementitious materials. Attention was devoted to the characterisation of the raw materials and dry mixtures using particle size distribution (PSD), scanning electron microscopy with energy-dispersive spectroscopy (SEM/EDS), and X-ray diffraction (XRD). Two compositions—a reference mixture (REF) and the ternary OSA mixture—were evaluated in terms of printability, mechanical performance, durability, and the anisotropic behaviour of 3D-printed elements. The ternary composition (due to the pozzolanic activity of MK and OSA) exhibited strength development resulting in compressive strength exceeding that of the reference mixture after 90 days of curing. The anisotropy study revealed a difference in the mechanical properties of printed samples compared with conventionally cast samples. Durability assessment, including capillary water absorption and surface freeze–thaw scaling tests performed using two standardised methods, demonstrated satisfactory frost resistance and confirmed the suitability of both mixtures for outdoor applications. The results further indicate that the layered manufacturing process governs moisture transport and mechanical anisotropy through interlayer interfaces. The developed pre-blended OSA–MK composite represents a promising low-carbon material for industrial 3D concrete printing, combining reduced cement consumption with reliable printability, mechanical performance, and durability.
Keywords:
3D printing
; oil shale ash
; pozzolanic activity
; sustainability
; printability
; buildability
; freeze-thaw cycles
1. Introduction
The construction industry is increasingly adopting digital technologies to improve productivity and minimise consumption of material resources. Among these technologies, three-dimensional concrete printing (3DCP) has emerged as a promising additive manufacturing method that enables automated, formwork-free construction directly from digital models. Compared with conventional construction techniques, 3DCP makes it possible to reduce waste, accelerate project delivery, and increase architectural flexibility while supporting the broader digitalisation of the construction sector. [1,2,3].
Despite these advantages, the sustainability of 3DCP remains strongly dependent on the composition and quality of printable cementitious materials [4,5]. Most printable mixtures contain high amounts of Portland cement to ensure adequate pumpability, extrudability, buildability, and early-age strength. However, Portland cement production is responsible for significant energy consumption and CO₂ emissions, motivating the search for alternative binder systems with lower environmental impacts [4,5].
The use of supplementary cementitious materials (SCMs) is considered one of the most effective approaches for reducing cement consumption in concrete. One such alternative material is oil shale ash. This raw material is particularly attractive due to its availability as an industrial by-product and its potential hydraulic and pozzolanic activity. Oil shale ash (OSA) is a large-volume industrial by-product generated during oil shale combustion and pyrolysis processes. Due to its high calcium content and the presence of reactive silicate and aluminate phases, OSA has attracted considerable attention as a supplementary cementitious material and alternative binder in construction applications. Recent studies have demonstrated that the chemical composition of OSA is typically dominated by CaO, SiO₂, Al₂O₃, Fe₂O₃, and MgO, while the proportions of these oxides depend strongly on combustion technology and ash collection location [6]. The authors reported CaO contents ranging from approximately 28–38%, combined with significant amounts of reactive silica and alumina, indicating the potential hydraulic and pozzolanic activity of the material [6].
The hydration and hardening mechanisms of OSA differ from those of conventional Portland cement. The hardening process involves hydration of free lime, formation of portlandite, carbonation reactions, hydration of calcium silicates, and precipitation of secondary hydration products such as calcium silicate hydrates (C–S–H), (C-A-H) and (C6AS3H32) ettringite [7] . These reactions contribute to the development of material skeleton. Previous investigations have shown that OSA-based concretes can achieve compressive strengths more than 25 MPa after 28 days of curing, demonstrating the feasibility of using OSA as a binder component in structural and backfilling applications [7].
A partial replacement of Portland cement with OSA has been investigated by some researchers. Researchers Kalpokaite-Dickuviene et al. reported that the incorporation of oil shale ash significantly affects hydration kinetics, pore structure development, and durability characteristics of cementitious composites [8]. Although the replacement of cement by OSA may slightly reduce early-age strength, the material promotes long-term hydration and can improve sustainability by reducing clinker consumption.
The binding properties of OSA are closely related to its origination technology and mineralogical composition. Pulverised-firing (PF) ashes generally exhibit hydraulic behaviour due to the presence of calcium silicates and aluminates, whereas circulating fluidised bed (CFB) ashes display predominantly pozzolanic characteristics and higher water demand. Modern combustion technologies have altered the composition of OSA by increasing the content of undecomposed carbonates and reducing the proportion of reactive clinker-like minerals, which may decrease the intrinsic binding capacity of the ash [6].
The latest literature confirms the strong potential of OSA as a regional supplementary binder or filler for 3D-printed concrete composites, particularly in combination with Portland cement, limestone powder, metakaolin, slag or other reactive mineral additions. Materials containing reactive mineral additions are often used to tailor these properties and improve structural stability during printing. Nevertheless, compared with fly ash and slag, direct research on OSA-based 3D printing remains limited. The comparison of samples extracted from 3D-printed elements and conventionally cast samples revealed noticeable differences in mechanical performance. In general, cast samples tend to exhibit higher and more uniform compressive and flexural strengths due to their homogeneous structure and the absence of interfaces formed during layer-by-layer deposition. In contrast, 3D-printed samples contain interlayer boundaries that may act as planes of weakness and promote anisotropic mechanical behaviour [1,10].
Beyond applications in cement compositions, OSA has also been investigated as a precursor for alkali-activated materials and geopolymers (GP) [9]. The authors discovered the potential of producing GP mortar with OSA and compressive strength of up to 20 MPa. It was found that dry curing at 60 °C for 24 hours provides the best mechanical and durability properties. Research on geopolymer and alkali-activated materials for 3D printing further supports the potential use of OSA in additive manufacturing. Authors Panda et al. [11] demonstrated that geopolymer-based printable materials can achieve adequate buildability and interlayer bond strength and control the fresh-state rheology. Since OSA exhibits chemical characteristics similar to those of high-calcium fly ash, it may be considered a promising component in future 3D-printable binder systems. However, further research is required to evaluate the influence of OSA on 3D printing open time, structural buildability, interlayer adhesion, and long-term durability of printed elements.
Use of OSA in 3D-printed concrete composites is increasingly considered a promising route for reducing cement consumption and implementation of circularity in additive construction. Recent research confirms that OSA can be incorporated into printable cement-based composites, with cement replacement of up to 20%. This dosage does not cause a significant reduction in mechanical performance, provided that the mixture is properly proportioned to extrusion and buildability [12]. The feasibility of OSA in 3D printing is mainly related to its high CaO content, alkaline nature, and presence of silicate, aluminate and sulphate-bearing phases. These components may contribute to early structural build-up, which is essential for shape retention of printed layers. However, the variability of OSA composition, especially free lime, sulphate content, particle size distribution and loss on ignition, requires careful control because these parameters can affect water demand, setting time, interlayer bonding, and durability of hardened material. A recent OSA-based 3D-printing study specifically aimed to formulate a pre-blended dry product containing oil shale ash for extrusion printing, indicating growing interest in this material for full-scale additive manufacturing applications [12].
Other ash-based supplementary cementitious materials have already been more widely studied in 3D concrete printing. Fly ash, ground granulated blast-furnace slag, silica fume, waste glass powder, rice husk ash, biomass ash and municipal solid waste incineration ash have been investigated as partial cement replacements or functional fillers. These materials can improve sustainability and, depending on their fineness and reactivity, can modify rheological properties and mechanical performance. For example, fly ash and ground waste glass have been shown to produce 3D-printable cement pastes with mechanical performance comparable to conventional cement mixtures [13].
When mineral additions such as fly ash, metakaolin, slag, or oil shale ash are incorporated into printable mixtures, their influence on rheology and hydration kinetics further affects interlayer adhesion and mechanical performance. Reactive supplementary cementitious materials can enhance microstructural densification and long-term strength development, although excessive replacement levels may reduce early-age strength and interlayer bond quality [7,14].
Recent reviews emphasise that sustainable 3D concrete printing depends not only on reducing cement content, but also on achieving a balance between extrudability, buildability, open time, interlayer adhesion and hardened-state durability. Research authors report 3D printable low-carbon one-part geopolymers, their compositions, and the effect of different precursor compositions, activator content, and different admixtures on the fresh and hardened properties of the mixtures [15]. The authors analysed the compressive strength of one-part geopolymers with cast samples in different directions of printing. The maximum result (61.2 MPa) was reached for mould-cast samples.
The next reviewed study investigated incineration bottom ash (IBA) for the enhancement of sustainability of 3D printed concrete. [16] The impacts of using IBA to substitute aggregate (0%, 20%, 40%, and 60% by volume) on the fresh properties, hydration kinetics, and hardened properties of 3DPECC were investigated. The results show that the addition of IBA enhanced the degree of hydration, as a result, 3D printed samples with 20% IBA substitution exhibited improved tensile strength (6.19 MPa), compressive strength (50.47 MPa), and flexural strength (22.60 MPa) compared to those of printed samples without IBA.[16]
The reduction in strength observed in printed samples is commonly attributed to imperfect interlayer bonding, moisture loss between deposited layers, and the presence of entrapped air voids generated during the extrusion process. These factors may reduce the continuity of hydration products across adjacent layers and increase porosity, particularly in the interfacial transition zones [1]. Previous studies have shown that the mechanical properties of printed concrete are strongly dependent on printing parameters, including layer height, nozzle travel speed, extrusion rate, and time interval between successive layers [11,17].
Moreover, 3D-printed cementitious materials often exhibit anisotropic behaviour, with lower strength measured in the direction perpendicular to the printing layers compared with the direction parallel to them. Panda et al. reported that the tensile and bond strengths between layers are particularly sensitive to the rheological evolution of the fresh mixture and the degree of surface drying before deposition of the subsequent layer [11]. Similar observations have been reported by [10], who demonstrated that the fresh-state properties required for buildability may simultaneously reduce the ability of successive layers to form a monolithic structure.
Large-scale interlaboratory comparative tests to study the mechanical properties of 3D printed concrete were conducted within the framework of a technical committee within international organization RILEM. More than 25 university laboratories participated in the experiments, and the results were summarised in reports [18,19,20]. The results of cast and 3D printed samples were compared and tested in different directions. As a result, statistically reliable results were obtained showing the influence of the force application direction on the main mechanical properties of the material [7,14]. Therefore, differences between cast and 3D-printed samples are primarily associated with the layered manufacturing process rather than the properties of the binder itself. While cast samples generally provide a reference for the maximum achievable material strength, the performance of printed samples is governed by both material composition and process-related factors, particularly interlayer bonding, porosity, and structural anisotropy.
This study investigates pre-blended dry compositions for 3D-printed concrete in which Portland cement is partially replaced by oil shale ash and metakaolin. The aim is to characterise a ternary binder composition with up to 40% cement replacement and evaluate fresh-state properties, printability, mechanical performance, and durability.
The practical goal of this study is to confirm the hypothesis of industrial transfer of developed low-cement compositions for 3D printing. The work was conducted within the TRANSITION project in collaboration with industrial partner Sakret Latvia Ltd., with a focus on ready-to-use pre-blended dry mixes utilising local raw materials and industrial by-products.
2. Materials and Methods
2.1. Raw Materials
The basic components of the dry mix are Portland cement, OSA, high reactivity pozzolanic admixture metakaolin (MK), and additives that regulate the setting time of the 3D printed solution and ensure its stability. Two binder compositions were studied: the reference composition (REF) based on Portland cement, and the ternary mix combined on Portland cement, OSA and metakaolin (OSA). The main characteristics of used binding materials are summarised in Table 1, the chemical composition is presented in Table 2. The particle microstructure of the samples was analysed by JEOL IT500 LV (Tokyo, Japan) Scanning Electron Microscope (SEM). The low vacuum mode was employed for analysis, with an accelerating voltage of 20 kV and working distance 10-13 mm. The morphology of mineral components of experimental dry mixes used in this study is shown in Figure 1.
In this research, Portland-Composite Cement CEM II 42.5 A/LL R (CEM II) was used as a main binding compound. CEM II (EN 197-1) is produced by Schwenk Ltd. (Broceni, Latvia). In accordance with the standard, in this type of cement up to 20% clinker is replaced with limestone filler, this makes cement more environmentally friendly by significantly reducing the amount of clinker and, consequently, carbon dioxide emissions. In accordance with producer’s EPD declaration, this cement released 659 kg CO2 (GWP total), compared to 706 kg of CO2 for CEM I 42.5 R. Limestone powder was also used as an inert filler. This component does not participate in the chemical reactions of cement hydration and can be considered as a mineral additive that improves the particle granulometry in micro-level and control the rheological properties of the 3D printable mixture. [21]
As industrial waste, OSA was used as the main cement replacing material. OSA was collected from Eesti Elektrijaam (Vaivara, Estonia) and extracted from the flue gas stream using a novel integrated desulphurizer (NID). According to the obtained micro images and analysis results reported in Hanžić et al. [22], this ash is characterised by high CaO and SiO2 contents. OSA particles density is 2.6 g/cm3, which is less than that of Portland cement but corresponds to the density of inert filler and limestone (Tab. 1). Regarding morphology investigation (Figure 1), it is observed that particles of cement, limestone, and metakaolin are mostly angular-shaped, while OSA contains some highly spherical microparticles, which is not observed in the case of cement.
Highly reactive metakaolin was used as an active pozzolanic additive, ensuring the binding of free lime to form additional C-S-H and C-A-H hydration products. In this study metakaolin Astra MK-40 (Astra Polska Ltd., Sękocin Stary, Poland) was used as a commercial material for concrete production. Metakaolin is commonly used as a supplementary cementitious material (SCM), replacing about 5–20% of Portland cement by mass, depending on performance requirements [23]. MK was produced by the dehydration of a kaolin clay mineral (Al2(OH)4Si2O5) into amorphous dehydrated state after thermal treatment at 700–800 °C.
Limestone powder LS (produced by Satini-LM Ltd.) is a finely ground inert micro-filler which, together with sand, provides the required granulometric distribution with a controlled volume of fine particles which are necessary for the fresh mix stability and extrudability. Normally, limestone powder as a part of the cement paste, shows minor influence on hydration processes [24]. Medium-sized sand 0/2 mm was used as an inert filler. The sand is supplied by Sakret Ltd. (Rumbula, Latvia). Most of the sand consists of quartz particles and has a wide range of particles from 0.1 to 2 mm.
The particle density was highest for CEM II (3.13 g/cm³), while the values for OSA, MK, and LS were relatively similar, ranging from 2.63 to 2.73 g/cm³. MK had the smallest median particle size μm) and the highest BET specific surface area (15.61 m² g⁻¹) among the investigated constituents. The comparatively high value of MK (50.2 μm), despite its low median particle size, may indicate the presence of some coarser agglomerates that were not fully dispersed under the selected laser-diffraction measurement conditions. CEM II, OSA, and LS exhibited substantially lower specific surface areas. LS was the coarsest powder, with μm and μm, indicating a broad particle-size distribution and lower overall fineness despite its moderate specific surface area of 2.44 m² g⁻¹.
The complex admixtures and micro-fibres were already incorporated into dry mix composition to control the characteristics of 3D-printed concrete during different stages of the printing process. The admixtures include superplasticizer (SP), air-entraining agent (AEA), viscosity modifying additive (VMA), and polypropylene micro-fibre (PP) in the amount of 0.05 wt% with a diameter of 22 μm and length of 6 mm.
SP was added to decrease internal friction in concrete mix by dispersing the binder particles [25,26]. AEA is normally added to a concrete mix to improve frost resistance. Air-entraining additive creates microscopic air bubbles that absorb the expansion of pore water during freezing and thus prevent the destruction of the material structure [27]. In the case of 3D printing, it becomes possible to use the additional function of an air-entraining admixture, that provides a stabilising effect and prevents mix bleeding and separation of the cement paste on the surface [28].
A viscosity modifying additive (VMA) in the case of 3D printing, increases the structural bond between particles, ensuring stability. Its mechanism of action lies in the water-holding capacity of micro-cellulose and the creation of a system resistant to separation due to the increase in internal cohesion of the mixture.
The chemical composition of the individual components of the binder is shown in Table 2. According to the obtained data, the chemical composition of Portland cement CEM II is characterised by a high CaO content (58.6%) and moderate amounts of SiO₂ (21.8%) and Al₂O₃ (5.8%). Metakaolin is composed of 50.2% SiO₂ and 42.7% Al₂O₃, it mostly composes of amorphous phase- which gives the highly reactive property.
Particular attention should be paid to the oil shale ash (OSA), which contains significant amounts of CaO (33.6%), SiO₂ (28.6%), and Al₂O₃ (10.5%), indicating the content of both alkaline and acidic oxides. In addition, OSA exhibits a relatively high SO₃ content (7.5%), substantially higher than that of the other constituents. The increased sulphate content is associated with the industrial combustion process, during which sulphur compounds present in the oil shale are oxidised and subsequently incorporated into the ash as sulphate-bearing phases. The presence of SO₃ may influence the hydration process, setting behaviour, and formation of sulphate-containing hydration products. Furthermore, OSA contains moderate amounts of MgO (4.6%) and alkali oxides (Na₂O and K₂O), which may also affect the reactivity of the blended binder.
Limestone powder (LS) is mainly a calcareous filler, characterised by high CaO content (49.8%) and a high loss on ignition (42.1%), reflecting its predominantly carbonate nature. The combination of calcium-rich cement and limestone powder with reactive metakaolin and sulphate-containing oil shale ash provides a chemically diverse system capable of promoting both hydraulic and pozzolanic reactions, potentially enhancing the microstructure and long-term performance of the blended cementitious material.
To obtain a more in-depth understanding of the chemical and mineralogical composition, a detailed quantitative analysis was performed on prepared samples of mineral components. The objective of the quantitative analysis was to establish the proportion of the amorphous phase, which represent the pozzolanic phase. The representative portion of each material subsample (defined by quartering procedure) was ground in an agate mortar to a particle size of <63 µm. The test portion was placed into a 27 mm diameter sample holder.
The phase composition analysis was performed by X-ray Powder Diffraction (XRD), using the Panalytical Malvern Empyrean (Netherlands) diffractometer with Cu–Kα radiation. The measurements were carried out at 45 kV voltage and 40 mA current. Data was collected over the 2θ range from 5 ° to 70 °. The increment measurement time was 150 s. The samples were prepared for X-ray diffraction (XRD) analysis using 27 mm diameter sample holders and the back-filling method.
The results were analysed with Panalytical Highscore 4.8 diffraction software using the ICDD Powder Diffraction File PDF-4+ database as a source of references for the crystalline phases. The quantitative XRD analysis (QXRD) was performed by using external standard procedure and Rietveld refinement approach.
The results of the qualitative XRD analysis showed that CEM II is composed of common clinker phases, namely alite, belite, brownmillerite, and tricalcium aluminate. Typical sulphate phases of cement, gypsum and anhydrite, were also identified. The presence of calcite confirms that the investigated CEM II is a composite cement containing limestone, which is added according to the producer’s specification.
The LS micro-filler is composed predominantly of calcite, with dolomite identified as a minor phase and quartz as a trace phase.
Figure 2.
XRD qualitative analysis of mineral components of experimental dry mixes (CEM II, OSA, MK, and LS).
Figure 2.
XRD qualitative analysis of mineral components of experimental dry mixes (CEM II, OSA, MK, and LS).
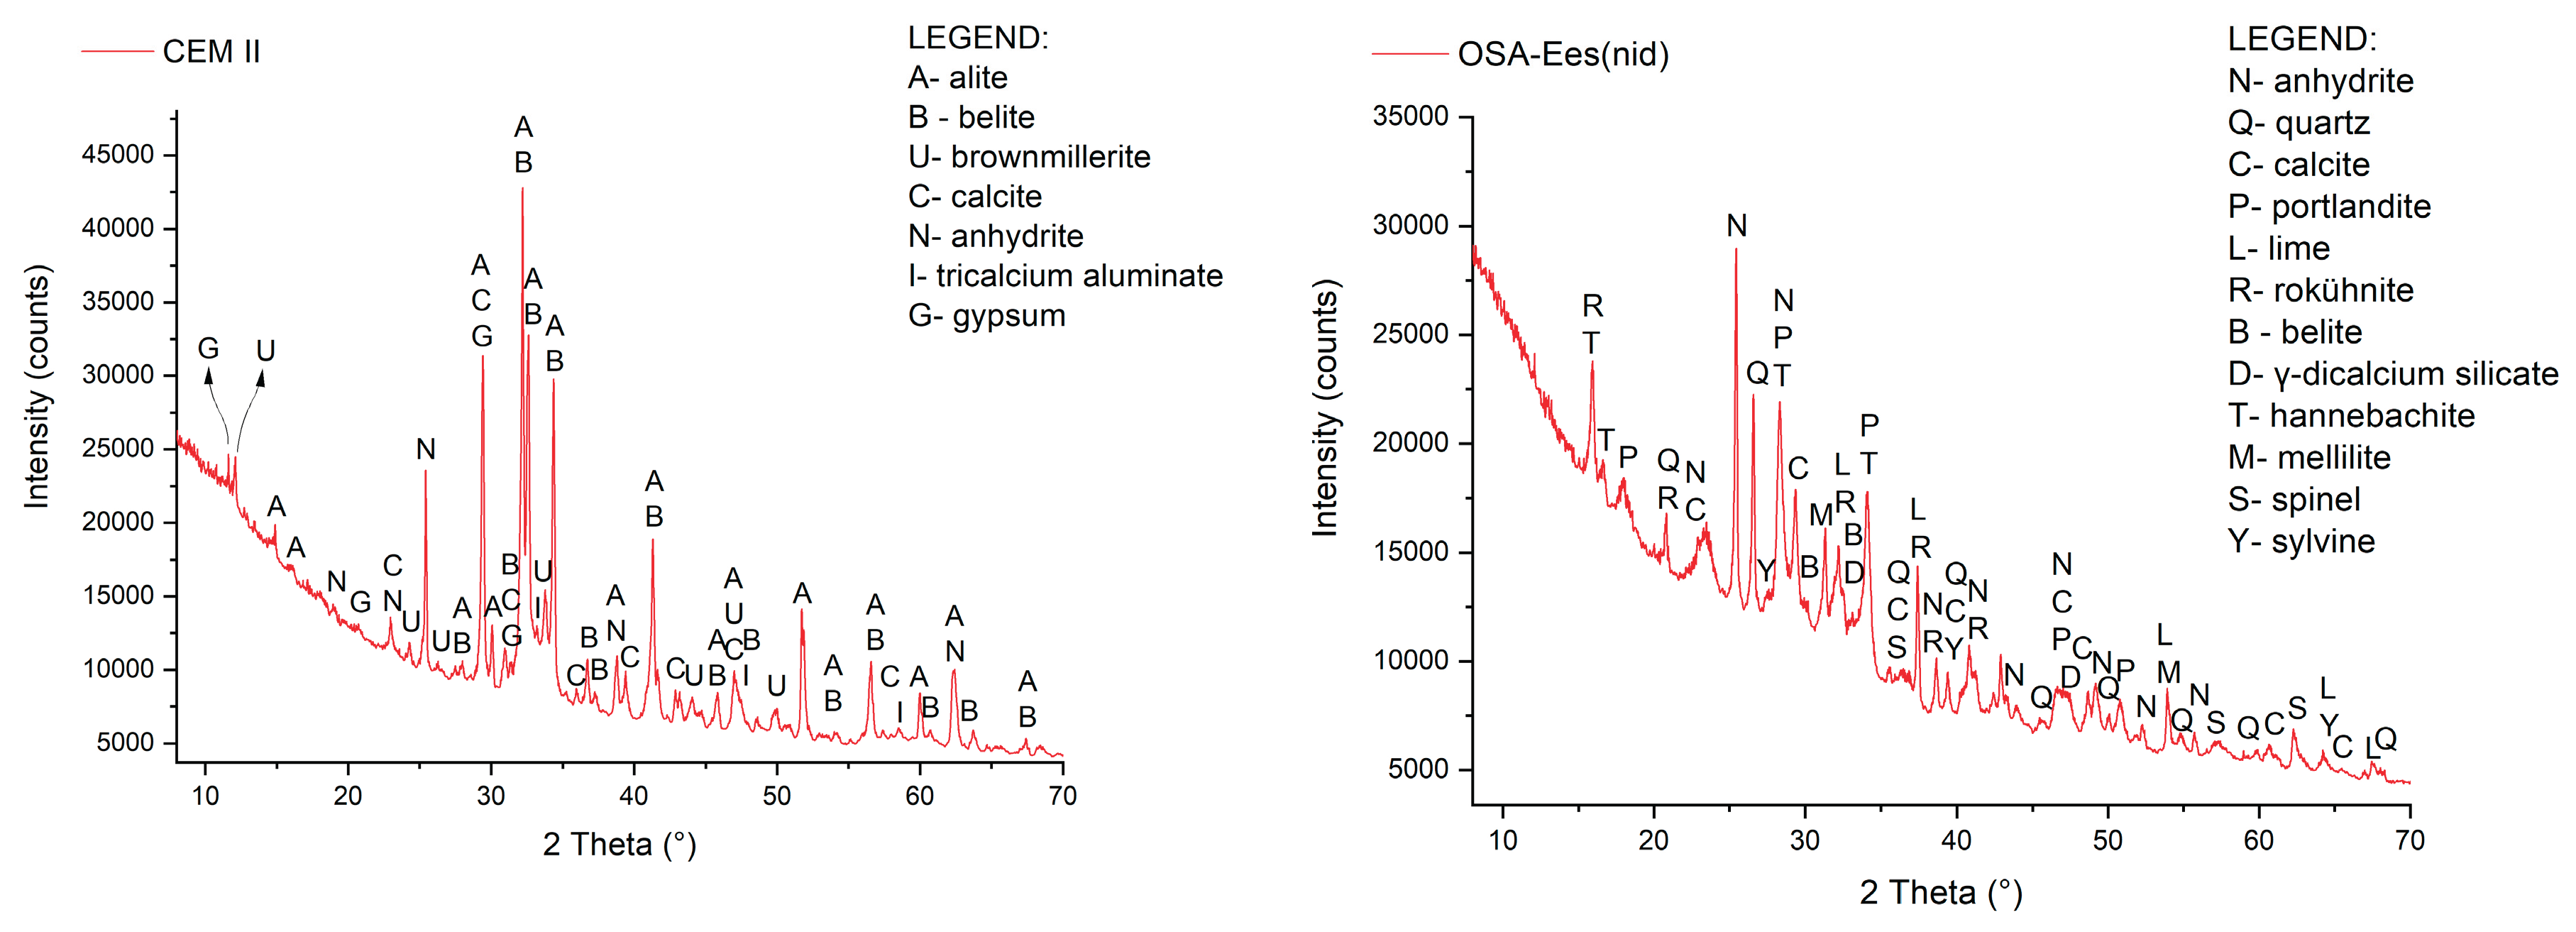
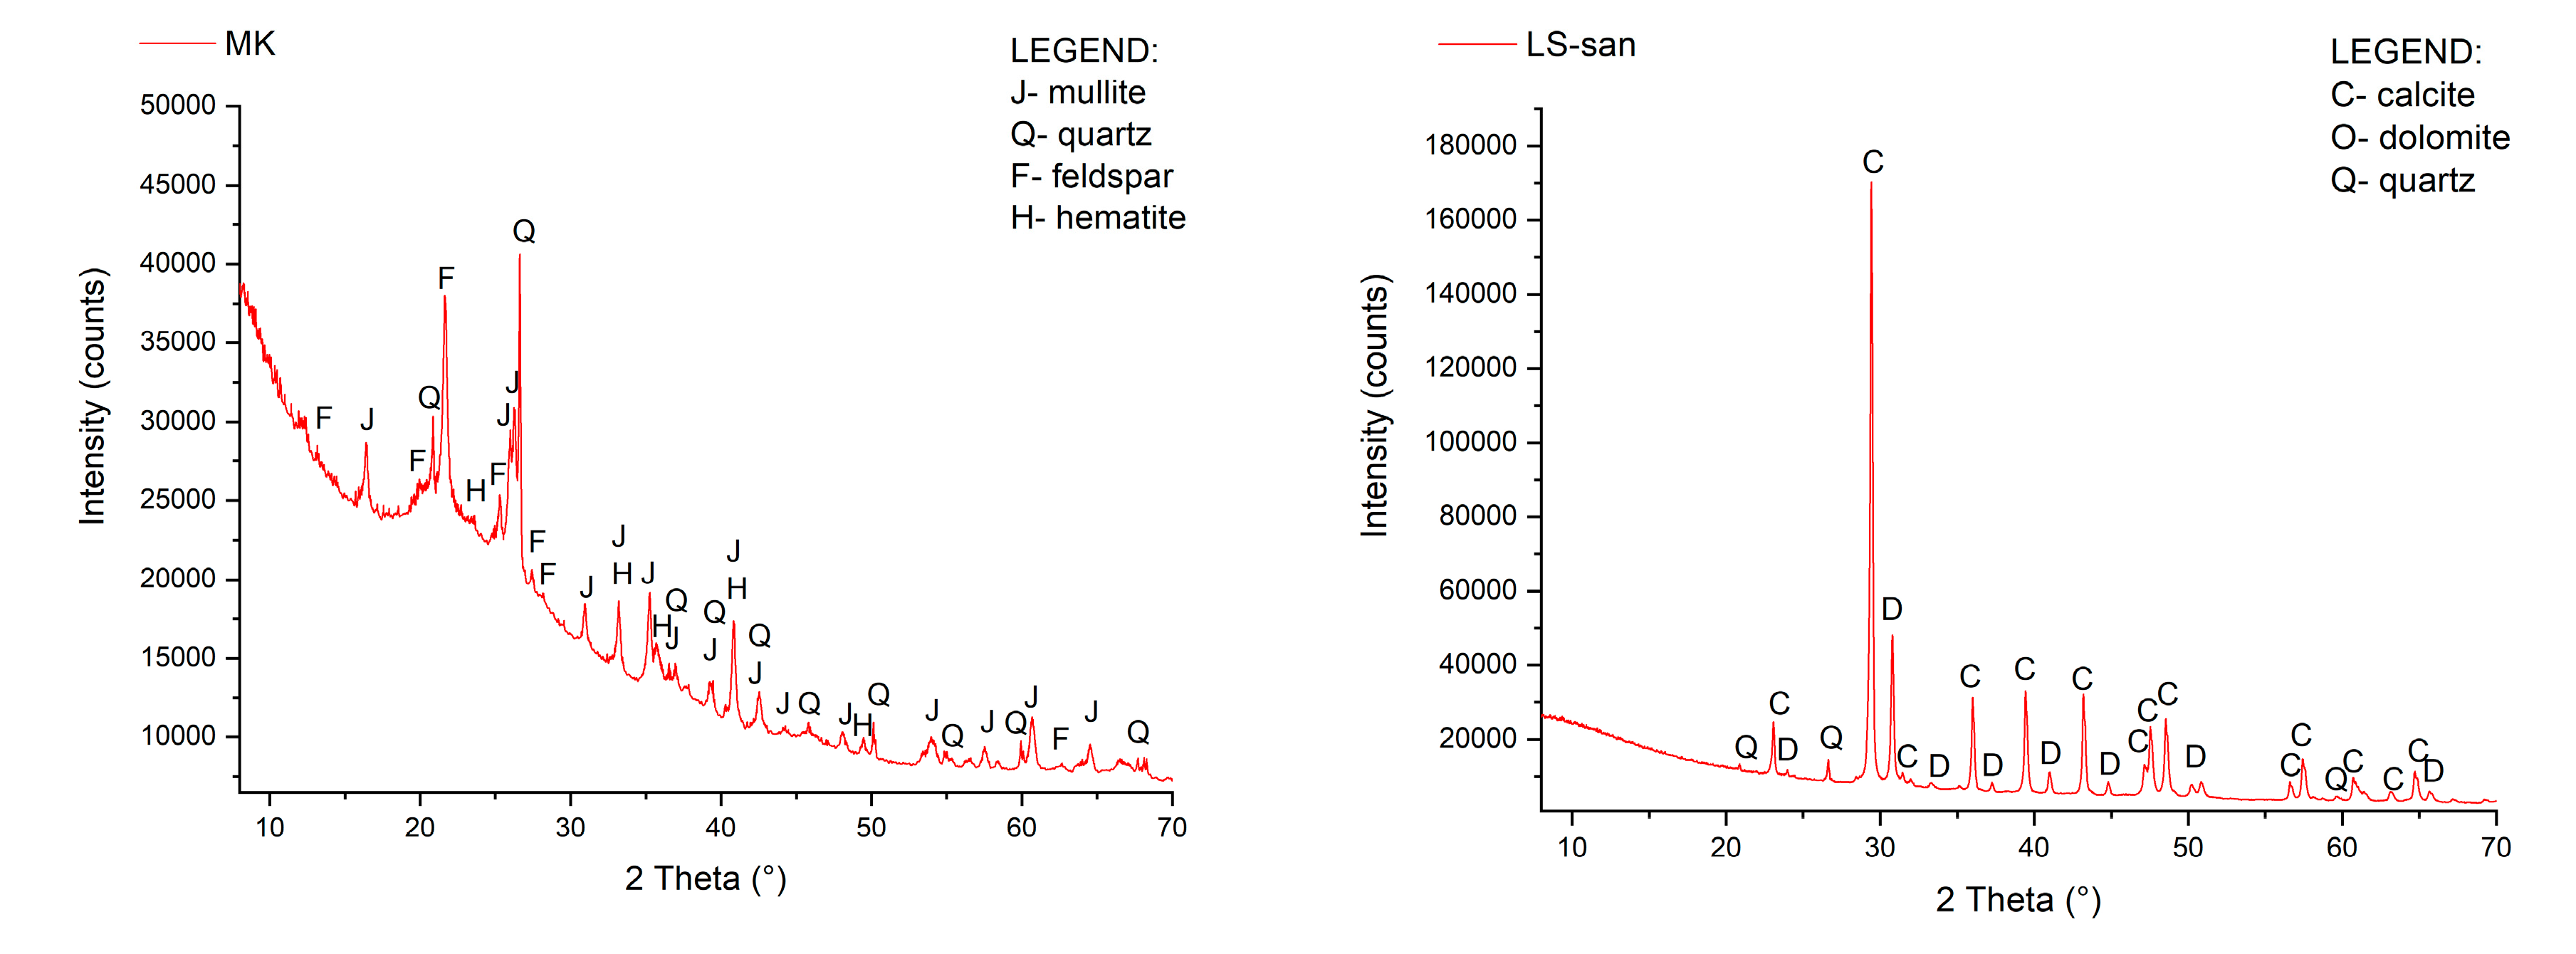
The diffractogram of the metakaolin sample exhibits a typical broad amorphous hump in the range of 18–28° 2θ, indicating a high proportion of amorphous fraction. The identified crystalline phases, including mullite, quartz, feldspar, and hematite, are present only as minor constituents. QXRD of OSA (sample OSA-Ees(nid)) showed that amorphous fraction accounts for 60.2%. The most abundant crystalline phases present account for calcareous phases, calcite (6.4%) and portlandite (6.33%) followed by anhydrite. Sulphate bearing phases present account for 10.72% (anhydrite 6.19% and hannebachite 4.53%). Quartz accounts for 4.8%. Following are dicalcium silicates - the well-known larnite - clinker composite phase in quantity of 3.13% and its non-hydraulic form - gamma dicalcium silicate polymorph in 4.25%. Following are the calcium oxide - lime (2.59%) and phases in traces or present in the quantities below 1% - chloride bearing phases (rokuhnite and sylvine) and spinel mineral phases
2.2. Mix Compositions
Two basic compositions were developed through previous iterations, taking into account the physical and mechanical properties and the possibility of 3D printing [29]. The proportions of the mixture were selected based on the granulometric composition and also ensuring the necessary paste content by introducing limestone micro-filler, as well as stabilising, plasticising, air-entraining admixtures and microfibres for structuring the fresh mix. The developed composition was expanded to a production scale as a result of cooperation with the company Sakret Latvia (“Ritvari”, Rumbula). Two types of dry pre-mixed compositions were adopted for production in industrial conditions.
The component proportions of these two basic compositions are summarised in Table 3. The reference binder in REF composition is Portland cement, and in OSA composition, a ternary mix of Portland cement, oil shale ash and metakaolin.
The amount of water in the mixture was selected to ensure the necessary extrudability and buildability for 3D printing. For both mixtures, the amount of water added was 15% of the mass of all dry components. In reference mix water-binder ratio is determined as relation W/CEM II, but in ternary composition – as a relation W/(CEM II + OSA + MK). The water-binder ratio was provided as 0.45 in both compositions.
2.3. Mixing, Fresh Properties Testing, and 3D Printing
The mixtures were prepared for the experiment during 3D printing, production of samples for further testing on mechanical properties and durability. A laboratory pan-type forced-action mixer (Filamos, M50, useful volume 37 dm3) was used to prepare the 3D printed composition. Each batch was prepared following the same procedure. The dry mixture was dosed into the mixer, and water was gradually added while mixing at a speed of 60 min-1 for 180 s, then allowing the mixture to rest for 10 min, and then remixing for an additional 60 s with a mixing speed of 60 min-1. The prepared mix was then manually loaded into the hopper of 3D printer.
Fresh-state mix properties were determined using standard and non-standard methods [30]. Workability was evaluated using the cone flow method according to EN 1015-3 [31]. Based on preliminary printing trials, an optimal flow diameter in the range of 160–180 mm after 15 jolts was identified as suitable for extrusion-based 3D printing.
Experimental 3D printing was adopted using custom-made a gantry-type printer developed at the 3D Concrete Printing Laboratory, Faculty of Civil and Mechanical Engineering, Riga Technical University (Figure 3) [32]. The printer is controlled by a computer and has three degrees of freedom, the allowed printing area is 1000 × 1000 × 1500 mm. Printing was performed using a batch-fed, auger-driven extrusion system, and a circular nozzle with a diameter of 36 mm, while the nozzle standoff distance was maintained at approximately 10 mm. The extrusion rate varied between 1.5 and 5 L/min, whereas the nozzle travel speed ranged from 10 to 60 mm/s. The deposited filaments exhibited a width of approximately 40–50 mm, depending on the fresh-state behaviour and mix buildability.
3D printed elements and cast samples were covered with plastic film after producing. During the 3D printing process, the basic fresh-state properties were evaluated, including the fresh mix density, yield stress, cone spread, and buildability.
The plastic yield stress of the fresh mixture was determined using the slug test method [33] .The yield stress (τc) was calculated based on the mass of the extruded material according to equation:
where S = πR2 is the nozzle cross-sectional area, R is the nozzle radius, g is gravitational acceleration, is the slug mass, is the slug length, and is the fresh density of the extruded mixture. The yield stress reported later is the arithmetic mean of three measurements on the test sample.
Buildability was evaluated using a buckling test to determine the maximum number of layers that could be successfully printed before the structural instability or structural collapse of the freshly printed element. Buildability test is as a practical indicator of both extrusion stability and structural integrity during printing.
2.4. Sample Preparation and Testing
In this study, small-sized prism samples 40x40x160 mm were used for testing mechanical properties. Two types of samples were prepared from each composition: the samples that were directly cast into the mould after mixing, as well as samples that were cut from a 3D printed element. For these purposes, a 3D printed element with dimensions of 650 x 330 x 400 mm was specially created, a round nozzle with a diameter of 36 mm was used to achieve the desired filament width. Three days before testing the samples were cut out from the printed element using a diamond disk saw: prismatic samples 40 x 40 x 160 mm for mechanical test, cubes 40 x 40 x 40 mm for water absorption test and plates 100 x 100 x 50 mm for the frost resistance test. Sampling scheme is explained in Figure 4.
Both cast and 3D printed samples after producing were covered with plastic sheets to prevent moisture loss. Cast samples were demoulded after 24–48 h and cured at 21 ± 1 °C until the age of testing. 3D printed elements were also stored in similar humid climate conditions.
Flexural and compressive strength. The placement of samples and the direction of load application during testing in relation to the 3D printing direction are shown in Figure 5. Before testing, the samples were weighed and measured to determine density. Compressive and flexural strength was determined using a universal testing machine Zwick Z100 (ZwickRoell GmbH & Co., Ulm, Germany) in accordance with EN 196-1 [33]. Loading was applied at a rate corresponding to 0.5–1.0 mm/min. Strength was calculated and measured in MPa.
Water absorption and frost resistance testing were carried out in accordance with RILEM TC ADC Assessment of Additively Manufactured Concrete Materials and Structures [34]. In cold and humid climates, the durability of cementitious compositions is associated with the effect of alternating exposure to moisture and freeze-thaw cycles.
At the age of 28 days, 3 samples per test series (printed series and mould-cast series) are dried in an oven at 40°C until constant mass. Afterwards, 4 of the 6 element sides are coated with two layers of epoxy to ensure unidirectional water ingress. In case of mould-cast samples, one of the casting sides will act as exposure surface (this left uncoated together with the opposite surface). In case of printed samples, the vertical side of 3D printed elements will act as exposure surface (submerged in water). Inner and outer printed surface of the printed object remain uncoated.
Before water exposure, the nominal dimensions and the initial dry mass are determined to measure the weight of the epoxy coating. Thereafter, samples are placed on two line supports (intended diameter or side length of the supports equals 2 mm) in sealed conditions to avoid evaporation during the absorption tests. The line supports are placed transverse to the print direction. Due to the curvature of the printed surface and to ensure a similar water level, the submersion level equals for all test series 5 ± 2 mm above the top of the line supports as shown in Figure 6.
The water uptake into the cementitious materials needs to be determined by weighing the samples at predefined time intervals (1, 3, 7, 15, 30, 60 minutes and every hour up to 6 hours after water contact). After this first period, samples were weighed again after 24 and 144 h. Before every measurement, samples are taken out of the container and wiped carefully with a wet cloth to remove the surplus water. Thereafter, they return immediately to the supports in the container. The results are depicted as absorption curves (kg/m2) in function of the square root of time.
Freeze–thaw resistance was evaluated according to LVS CEN/TS 12390-9 (Slab test method). Adaptations include the use of prismatic plate samples with dimensions of 100×100×50 mm instead of standard scaling samples 150x150x50 mm, and the use of plastic containers rather than standard steel containers. The test surface (facade side of 3DP element) was exposed to freeze-thaw cycles, while the side surfaces were sealed to prevent penetration of the test liquid, and remaining surfaces were thermally insulated. A 3 mm layer of 3% NaCl solution was placed on the exposed surface and covered with a polyethylene sheet to avoid evaporation. The samples were subjected to repeated freeze–thaw cycles between positive and negative temperatures in the range -20/+20 °C. Two methods of cyclic freezing were used: the standard method, which performs one cycle per day, and the accelerated method, which performs two cycles per day (Figure 7). Surface scaling was evaluated after 14, 28 and 56 cycles, by expressing the cumulative scaled mass relative to the exposed surface area, in kg/m².
3. Results and Discussion
3.1. The Properties of Pre-Blended Dry Product
Taking into account the mix proportions developed in laboratory, industrial pre-blended dry mixes for 3D printing were produced in Saket Latvija Ltd. The materials were packed in standard 25 kg bags and delivered to the laboratory for testing and 3D printing experiments. Two types of mixes were prepared: REF and OSA.
To assess the actual granulometric composition, the samples of both mixtures were tested using laser diffraction method. PSD test was carried out in compliance with standard ISO 13320 using the Microtrac SYNC 5001 instrument. The charts of the granulometric composition graphically are presented in Figure 8. The results indicate that for both mixes the particle size distribution curve is a balanced line, including a wide range of particles from 1 μm to 2 mm. The lower limit of 1 μm corresponds to the binder micro particles, with that, the upper limit of 2 mm corresponds to the maximum size of sand used as an inert filler. Comparing the granulometric composition of both mixes, the percentage difference does not exceed 6%. The particle size distribution of OSA demonstrates a slightly finer mix compared to the REF composition. This can be explained by the fact that 40% of the cement is replaced with combination of OSA and MK, which is characterised by finer micro-particles (in accordance with Table 1).
To characterise the particle size distribution and quality of particle packing in a multi-component mix, various models of optimal packing of multi-fractional aggregate are practically used. The most convenient approach is the ideal granulometric curves, which can be described by a simple mathematical equation. For example, in this case, a modified Fuller-Thompson model [35] in accordance with the formula:
where Pi is the percentage passing, xi is the particle size (mm), D is the maximal particle size in the aggregate (mm), Do is the initial point of an “ideal” curve (minimal particle size), n is the degree of the mathematical equation.
Pi = 100 (xi/(D-Do))n
The critical indicator is the maximum aggregate size D, which depends on the nozzle diameter, and the degree of the equation n, which determines the ratio between fine and coarse fractions. In this case, using the previous practical experience in RTU 3D laboratory [36] and the experience of other researchers summarised in scientific publications, the following parameters of the Fuller-Thompson curve were used: n=0.30, D=2.0 and D0 = 0.001. mm. The corresponding ideal curve is indicated by the green line in Figure 8.
The mineralogical composition of dry pre-blended mixes (REF and OSA) is summarised in Figure 9.
The results of the XRD analysis show that the most abundant phases are quartz, feldspar, and carbonate (dolomite), representing the phases from the coarse aggregate fraction. This is followed by calcite from LS-sand and cement, and further by the cement phases alite and belite, together with minor sulphate phases (anhydrite and gypsum) originating from the cement and OSA raw materials.
3.2. Fresh Mix Characterisation and 3D Printing Properties
Full-scale 3D printing experiments were conducted using RTU concrete 3D printer for both developed compositions REF and OSA. Open print time was provided for at least 40 minutes for both compositions. To ensure statistical reliability of the results, each composition was tested at least 4 times with provided mixing on different days. Each single-mix experiment included a cone flow test (at 10-15 and 40-45 minutes), determination of the fresh mix density, 3 attempts at slug tests and 1 buildability test. The last-mentioned test was performed only once due to the duration of the experiment and the risk of changing the properties of the mixture. Based on the results of slug test, the Yield stress was determined using Formula (1), depending on the number and mass of slugs and the nozzle diameter. The results of fresh mix properties are summarised in Table 4. Air content is the most sensitive parameter for control, in all batches it was maintained in the range from 9.8 to 12.5%. In general, both compositions REF and OSA have minor differences both visually and in technical characteristics. The line width in both cases is maintained close to 44 mm, which indicates similar rheological properties during extrusion.
The most distinctive feature of the two compositions is the time-depending change in cone spread (flow diameter). In the case of the reference composition, after 45 minutes there is a significant reduction in cone spread from 175 to 160 mm - 15 mm. In the case of the OSA composition, this change is from 161 to 157 mm – 4 mm. Longer retention of workability of the OSA composition can be explained by the low content of active hydraulic binder clinker Portland cement. Other researchers also note an increase in setting time and a slowdown in hydration processes when replacing cement with oil shale ash [37].
The results for Yield stress (by slug test) and buildability test are summarised in Figure 10. The results show that both compositions exhibited comparable 3D printing performance. The REF mixture had a slightly higher average yield stress (3008 Pa) than the OSA mixture (2866 Pa), indicating a marginally greater resistance to deformation. However, the buildability results were almost identical, with both mixtures supporting approximately 33 printed layers before buckling (33.1 for REF and 32.9 for OSA). These results indicate that replacing part of the cement with oil shale ash had only a minor effect on the fresh-state mechanical properties and did not significantly reduce the buildability of the printed elements. In both cases, the dispersion of the results overlaps, so it can be assumed that both compositions have statistically identical values of yield stress and buildability.
Figure 11 and Figure 12 illustrate the typical failure mode of the printed cylinders for both REF and OSA compositions. In all tests, failure occurred progressively rather than suddenly. As the number of deposited layers increased, the lower layers experienced gradual compression and lateral deformation, leading to buckling of the cylinder wall and the eventual collapse of the sample. No noticeable differences in the failure mechanism were observed between the two compositions, indicating that the incorporation of oil shale ash did not alter the structural stability of the printed elements. The OSA samples exhibited a failure pattern and deformation behaviour comparable to the reference mixture, confirming similar buildability characteristics.
The measured yield stress values (2866–3008 Pa) and the buildability of approximately 33 printed layers are consistent with values reported for printable cementitious materials in the literature [38] . Previous studies have demonstrated that successful extrusion-based 3D printing requires sufficient green yield stress to resist the increasing self-weight of the deposited layers while maintaining adequate extrudability. Plastic collapse and buckling of the lower layers are recognised as the dominant failure mechanisms governing buildability, which agrees well with the failure mode observed in the present study. The similar yield stress and buildability results obtained for the REF and OSA mixtures therefore indicate that the partial replacement of Portland cement with oil shale ash does not adversely affect the fresh-state mechanical stability of the printed elements.
3.3. Density and Water Absorption
The results of determining the hardened material density in wet condition of both compositions are shown in Figure 13. As expected, no significant differences were observed in the 3D printed and cast sample results. However, for cast samples the average density is 2070 and for 3D printed ones 2058 kg/m3. The minimal difference of 12 kg/m3 can be explained by additional macroporosity that can be associated with entrapted air in the interlayer area in 3D printed block. It should also be noted that the average density of the fresh mixture is slightly less than the density of hardened concrete. This can be explained by the loss of entrained air during the 3D printing and sample production process. There are scientific studies that indicate changes in the pore system during extrusion based 3D printing [39]. It can be argued that the results differ very slightly since the intervals of the standard deviations for all compositions overlap. The density of the fresh mixture has large variations in results, which can be explained by differences in the content of entrained air, the volume of which is difficult to control. According to the results of testing the fresh mixture, the volume of entrained air was initially between 9.5 and 12.5%.
The results of capillary water absorption and sorptivity index are summarised in Figure 14 and Figure 15. Obtained results indicate that the 3D-printed samples exhibit approximately 20% higher water uptake than the cast samples, which is consistent with their slightly lower density. Also, 3D printed compositions have approximately 20% higher sorptivity index. This behaviour is attributed to the presence of interlayer interfaces and additional macro- and microporosity generated during the layer-by-layer deposition process, providing preferential pathways for moisture ingress. Similar results were observed in a previous study where the higher porosity of 3D printed samples was explained by a more irregular 3D printed surface and porosity in the interlayer region facilitating greater water penetration [29]. Sorptivity index results range from 0.10 to 0.13 kg/m²/min0.5. This is within the range of large-scale interlaboratory tests conducted within the RILEM ADC interlaboratory study [40]. Some studies report that 3D printing process influences concrete density and water absorption through its extrusion process and layer-by-layer deposition [41]. The extruded concrete could be denser than traditionally cast concrete, but the vulnerable interfaces between printed layers introduce higher localised porosity, accelerating water penetration. In reviewed research [42] the authors applied 3D printed and cast concrete analysis by re-structuring X-CT images. Nevertheless, despite the increased capillary absorption, the ternary OSA–MK composition demonstrated water absorption behaviour comparable to the reference mixture, indicating that the incorporation of oil shale ash and metakaolin did not adversely affect the overall pore structure.
3.4. Mechanical Strength
Mechanical tests were performed on cast and 3D printed samples in direction related to printing in accordance with Figure 4. Flexural and compressive test results are summarised in Figure 16 and Figure 17 correspondingly.
The test results obtained for 3D printed samples tested in the v.u. flexural direction is consistent with the findings of the RILEM interlaboratory study [19], which identified this orientation as one of the most favourable loading configurations for 3D-printed concrete. In the v.u. direction, the principal tensile stresses develop predominantly parallel to the printed layers, so failure is governed by the strength of the cementitious matrix rather than by the weaker interlayer bond. Consequently, 3D printing itself does not reduce flexural strength in this orientation and may even provide a slight improvement through enhanced compaction during extrusion.
The incorporation of oil shale ash (OSA) had a much more pronounced effect than the manufacturing method. At 28 days, OSA increased the flexural strength from 3.2 to 5.3 MPa in the printed samples (approximately 66% increase) and from 3.9 to 4.9 MPa in the cast samples (approximately 26% increase). At 90 days, the OSA mixtures reached 7.0 MPa for the printed samples and 6.7 MPa for the cast samples. Compared with the corresponding reference mixtures, this represents a modest increase of about 4% for the printed samples, while the cast samples showed a slight decrease (about 9%), although the values remain within the experimental scatter indicated by the error bars.
The results also show that there are no significant differences in strength between the cast and 3D printed samples. Thus, the printing process had only a limited influence on flexural performance in the v.u. direction (within the experimental scatter), which agrees well with the RILEM observations that this loading orientation is relatively insensitive to interlayer weakness.
The compressive strength experimental results (Figure 17) show that the cast samples consistently achieved higher compressive strengths than the 3D-printed samples. At 28 days, the reference mixtures reached 37.6 MPa (3D printed) and 45.2 MPa (cast), while at 90 days the strengths increased to 42.9 MPa and 55.3 MPa, respectively. The replacement of PC with oil shale ash and metakaolin had positive influence on the cast samples, achieving maximal strength of 60.6 MPa at 90 days.
The compressive strength results obtained in the w direction agree with the findings of the RILEM interlaboratory study, which reported that samples loaded perpendicular to the printing plane generally exhibit slightly lower compressive strength than cast samples [20].
3.5. Frost Resistance
The slab method in accordance with the LVS CEN/TS 12390-9 standard was used as a basis for frost resistance testing. Samples were prepared and four test series were evaluated: REF cast and 3D printed, and OSA cast and 3D printed. Two types of tests were used: a standard slab test with one freeze-thaw cycle per day (test performed in KTU) and an accelerated test with two freeze-thaw cycles per day (test performed in RTU). In all cases, 56 freeze-thaw cycles were performed using a 3% sodium chloride solution as a freezing medium. Prepared cast and 3D printed samples for frost resistance test are shown in Figure 18.
The results of surface scaling are summarised in Figure 19 and Figure 20. Comparison of numerical value of mass loss per unit area of concrete surface shows that the results differ significantly, especially for the two-cycle-per-day test (Figure 20). The results of a standard test (Figure 19 and Figure 1 cycle per day) show a mass loss value not exceeding 250 g/m2, and the differences between the series do not exceed the values of standard deviations.
The freeze–thaw test results confirmed satisfactory durability of both the reference and OSA-based mixtures, with no evidence of critical surface deterioration after cyclic freezing. Although the 3D printed samples showed slightly higher water absorption, this did not result in a significant reduction in frost resistance, suggesting that the pore system remained sufficiently stable to accommodate freezing-induced stresses. Moreover, the indicated mass losses are considered insignificant and accordance with [43] correspond to the highest quality assessment of concrete for frost resistance.
Analysis of the frost-resistance results obtained using two freeze–thaw cycles per day (Figure 20) showed lower surface mass loss than in the standard test, although greater variability was observed, particularly for the cast OSA specimens. The accelerated test was performed on specimens aged for 28 and 90 days. The 90-day specimens exhibited the lowest surface scaling, which may be attributed to further hydration and long-term pozzolanic reactions that progressively densified the concrete microstructure [44].
The freeze–thaw results indicate that 3D printing did not adversely affect the frost resistance of the investigated concrete mixtures. In both test methods, the 3D-printed reference samples exhibited equal or lower surface scaling than the corresponding cast samples, indicating comparable or slightly improved resistance to freeze–thaw damage. In the LT test (1 cycle/day), the surface scaling decreased from 243 to 201 g/m² for the reference mixture after 3D printing, while in the RTU test (2 cycles/day) it decreased from 107 to 60 g/m². The incorporation of oil shale ash (OSA) did not show a detrimental effect on frost resistance in the printed samples. In the LT test, the OSA mixture exhibited nearly identical surface scaling for cast and printed samples (215 and 244 g/m², respectively), while in the RTU test the 3D-printed OSA samples (71 g/m²) showed substantially lower scaling than the cast OSA samples (272 g/m²).
There are diverse results of frost resistance tests for 3D concrete in scientific literature. Most studies report a decrease in strength and frost resistance due to increased porosity and defects in the interlayer space. However, some studies show equivalent frost resistance for 3D concrete and cast concrete. Despite these microstructural differences, the overall freeze–thaw performance of the investigated material remained comparable to cast concrete, indicating that well-printed concrete with limited interlayer defects can maintain satisfactory frost resistance. The relationship between pore structure and frost resistance is further supported by P. Sikora et al. (2022) [45]. Although freeze–thaw durability was not the primary focus of the study, the authors compared cast and printed concrete and found that three-layer printed samples possessed lower density and higher capillary porosity than cast samples.
The combined action of metakaolin-induced pozzolanic reactions and the air-entraining system likely contributed to refining the microstructure and improving resistance to freeze–thaw damage. The durability results demonstrate that replacing 40% of Portland cement with oil shale ash and metakaolin can produce a 3D-printable cementitious composite suitable for outdoor exposure. At the same time, the higher capillary absorption of printed elements indirectly highlights the influence of interlayer interfaces on moisture transport, emphasizing that optimisation of the printing process remains important for maximising long-term durability.
4. Conclusions
A sustainable low-cement 3D-printable cementitious composite was developed by replacing 40 wt.% of Portland cement with a ternary binder containing oil shale ash (OSA) and metakaolin (MK). The developed formulations were successfully transferred from laboratory scale to industrially manufactured pre-blended dry mixes by Sakret Latvia, demonstrating the feasibility of producing ready-to-use materials for additive manufacturing. PSD characterisation, fresh-state testing, and full-scale 3D-printing trials confirmed stable extrusion, good buildability, and reproducible printing performance.
Comprehensive characterisation of the raw materials confirmed the suitability of OSA as a supplementary cementitious material. The mineralogical characterisation confirmed that the selected raw materials provide a complementary ternary binder system suitable for low-cement 3D-printable composites. Chemical analysis showed that OSA contains 33.6% CaO, 28.6% SiO₂, and 10.5% Al₂O₃, while XRD identified an amorphous phase content of about 60%, indicating significant hydraulic and pozzolanic activity. Together with the high fineness of metakaolin (d₅₀ = 6.5 μm), these characteristics promoted long-term hydration and matrix densification. XRD analysis of the industrially produced REF and OSA pre-blended dry mixes verified that the designed phase composition was successfully transferred to production scale, demonstrating the feasibility of manufacturing stable, ready-to-use dry products for extrusion-based 3D concrete printing.
Ternary binder shows no strength reduction at 28 days, and its compressive strength continued to increase and exceeded the reference mixture after 90 days. Mechanical testing confirmed the anisotropic behaviour of 3D-printed elements due to interlayer interfaces, while durability tests demonstrated satisfactory water absorption and freeze–thaw resistance. Surface scaling after 56 freeze–thaw cycles remained below approximately 250 g/m², indicating suitability for outdoor exposure. The results demonstrate that neither 3D printing nor OSA incorporation had have a severe negative effect on the freeze–thaw performance of the designed concrete mix, nevertheless the cast OSA mixture exhibited the highest surface scaling.
The developed OSA–MK binder provides an environmentally friendly alternative for 3D concrete printing by significantly reducing cement consumption while maintaining good printability, mechanical performance, and durability. The successful industrial production of pre-blended dry mixes and their validation through laboratory and full-scale 3D-printing tests represent an important step toward the practical implementation of sustainable additive manufacturing in construction.
The comparison of cast and 3D printed sample results indicate that the loading orientation (v.u.) effectively minimised the detrimental influence of layer interfaces, allowing the intrinsic material properties to dominate the flexural response. Under these conditions, the addition of oil shale ash was the primary factor controlling the improvement in flexural strength, particularly at early ages, while the difference between cast and 3D-printed samples remained comparatively small. 3D printing resulted in a moderate reduction in compressive strength in w direction, whereas oil shale ash contributed to improved long-term compressive strength, with the most pronounced effect observed in the cast samples. This behaviour is consistent with the general conclusion of the RILEM TC 304-ADC study that flexural strength reductions are mainly observed only when tensile stresses act perpendicular to the printed layers, whereas the v.u. orientation largely preserves the mechanical performance of printed concrete.
Author Contributions
Conceptualization, G.S. and M.S.; methodology, M.S., E.SE., G.S. and A.S.; validation, E.S., V.Z. and A.S.; formal analysis, L.K.; investigation, A.S., E.SE., E.S.; resources, M.S.; data curation, A.S. and E.S.; writing—original draft preparation, G.S.; writing—review and editing, M.S., V.Z., L.K. and G.S.; visualization, G.S. and A.S..; supervision, M.S., L.H.; project administration, M.S. and L.K.; funding acquisition, L.H. and M.S. All authors have read and agreed to the published version of the manuscript.
Funding
This research was funded through the transnational M-ERA.NET Joint Call 2022, project title “Transforming waste into high-performance 3D printable cementitious composite,” acronym: Transition, funding period 2023–2026, https://www.m-era.net/home (accessed on 29 December 2024). The authors acknowledge the Slovenian Research and Innovation Agency: research core funding No. P2-0273 and Infrastructure programmeme No. I0-0032
Data Availability Statement
The original contributions presented in this study are included in the article. Further inquiries can be directed to the corresponding authors.
Acknowledgments
During the preparation of this study, the authors used Gemini 3.1. Pro for the purposes of text revision. The authors have reviewed and edited the output and take full responsibility for the content of this publication.
Conflicts of Interest
The authors declare no conflicts of interest
Abbreviations
The following abbreviations are used in this manuscript:
| OSA | Oil Shale Ash |
| 3DCP | 3D concrete printing |
| SCM | Supplementary cementitious material |
| XRD | X-ray diffraction |
| MK | Metakaolin |
| SEM | Scanning Electron Microscope |
| PSD | Particle Size Distribution |
| SP | Superplasticizer |
| AEA | Air-entraining agent |
| VMA | Viscosity modifying additive |
| PP | Polypropylene micro-fibre |
References
- Buswell, R.A.; Leal de Silva, W.R.; Jones, S.Z.; Dirrenberger, J. 3D Printing Using Concrete Extrusion: A Roadmap for Research. Cem. Concr. Res. 2018, 112, 37–49. [Google Scholar] [CrossRef]
- Tay, Y.W.D.; Panda, B.; Paul, S.C.; Noor Mohamed, N.A.; Tan, M.J.; Leong, K.F. 3D Printing Trends in Building and Construction Industry: A Review. Virtual Phys. Prototyp. 2017, 12, 261–276. [Google Scholar] [CrossRef]
- Wangler, T.; Lloret, E.; Reiter, L.; Hack, N.; Gramazio, F.; Kohler, M.; Bernhard, M.; Dillenburger, B.; Buchli, J.; Roussel, N.; et al. Digital Concrete: Opportunities and Challenges. RILEM Tech. Lett. 2016, 1, 67–75. [Google Scholar] [CrossRef]
- Panda, B.; Tay, Y.W.D.; Paul, S.C.; Tan, M.J. Current Challenges and Future Potential of 3D Concrete Printing. Materwiss. Werksttech. 2018, 49, 666–673. [Google Scholar] [CrossRef]
- Panda, B.; Mohamed, N.A.N.; Paul, S.C.; Singh, G.V.P.B.; Tan, M.J.; Šavija, B. The Effect of Material Fresh Properties and Process Parameters on Buildability and Interlayer Adhesion of 3D Printed Concrete. Materials 2019, 12. [Google Scholar] [CrossRef] [PubMed]
- Uibu, M.; Tamm, K.; Viires, R.; Reinik, J.; Somelar, P.; Raado, L.; Hain, T.; Kuusik, R.; Trikkel, A. The Composition and Properties of Ash in the Context of the Modernisation of Oil Shale Industry. Oil Shale 2021, 38, 155–176. [Google Scholar] [CrossRef]
- Uibu, M.; Somelar, P.; Raado, L.M.; Irha, N.; Hain, T.; Koroljova, A.; Kuusik, R. Oil Shale Ash Based Backfilling Concrete - Strength Development, Mineral Transformations and Leachability. Constr. Build. Mater. 2016, 102, 620–630. [Google Scholar] [CrossRef]
- Kalpokaitė-Dičkuvienė, R.; Pitak, I.; Baltušnikas, A.; Čėsnienė, J.; Kriūkienė, R.; Lukošiūtė, S.I. Functional and Microstructural Alterations in Hydrated and Freeze–Thawed Cement-Oil Shale Ash Composites. Case Stud. Constr. Mater. 2023, 19. [Google Scholar] [CrossRef]
- Haddad, R.H.; Ashteyat, A.M.; Lababneh, Z.K. Producing Geopolymer Composites Using Oil Shale Ash. Struct. Concr. 2019, 20, 225–235. [Google Scholar] [CrossRef]
- Le, T.T.; Austin, S.A.; Lim, S.; Buswell, R.A.; Gibb, A.G.F.; Thorpe, T. Mix Design and Fresh Properties for High-Performance Printing Concrete. Mater. Struct. Et. Constr. 2012, 45, 1221–1232. [Google Scholar] [CrossRef]
- Panda, B.; Paul, S.C.; Mohamed, N.A.N.; Tay, Y.W.D.; Tan, M.J. Measurement of Tensile Bond Strength of 3D Printed Geopolymer Mortar. Measurement (Lond) 2018, 113, 108–116. [Google Scholar] [CrossRef]
- Sapata, A. Development of 3D Printable Cement-Based Composite Containing Oil Shale Ash. In Proceedings of the Digital Concrete 2024 - Supplementary Proceedings, Braunschweig, 2024); 2024; p. S.M.; S.G.; B.D.; M.B.; H.L.; Š.M. [Google Scholar]
- Samrani, P.; Cao, Y.; Fimbres-Weihs, G.; Sanjaya, E.; Abbas, A. Effect of Fly Ash and Ground Waste Glass as Cement Replacement in Concrete 3D-Printing for Sustainable Construction. Front. Built Environ. 2024, 10. [Google Scholar] [CrossRef]
- Kalpokaitė-Dičkuvienė, R.; Pitak, I.; Baltušnikas, A.; Čėsnienė, J.; Kriūkienė, R.; Lukošiūtė, S.I. Functional and Microstructural Alterations in Hydrated and Freeze–Thawed Cement-Oil Shale Ash Composites. Case Stud. Constr. Mater. 2023, 19. [Google Scholar] [CrossRef]
- Al-Noaimat, Y.A.; Ghaffar, S.H.; Chougan, M.; Al-Kheetan, M.J. A Review of 3D Printing Low-Carbon Concrete with One-Part Geopolymer: Engineering, Environmental and Economic Feasibility. Case Stud. Constr. Mater. 2023, 18. [Google Scholar] [CrossRef]
- Ye, J.; Teng, F.; Yu, J.; Yu, S.; Du, H.; Zhang, D.; Ruan, S.; Weng, Y. Development of 3D Printable Engineered Cementitious Composites with Incineration Bottom Ash (IBA) for Sustainable and Digital Construction. J. Clean. Prod. 2023, 422. [Google Scholar] [CrossRef]
- Li, Z.; Hojati, M.; Wu, Z.; Piasente, J.; Ashrafi, N.; Duarte, J.P.; Nazarian, S.; Bilén, S.G.; Memari, A.M.; Radlińska, A. Fresh and Hardened Properties of Extrusion-Based 3D-Printed Cementitious Materials: A Review. Sustainability 2020, 12. [Google Scholar] [CrossRef]
- Bos, F.; Menna, C.; Robens-Radermacher, A.; Wolfs, R.; Roussel, N.; Lombois-Burger, H.; Baz, B.; Weger, D.; Nematollahi, B.; Santhanam, M.; et al. Mechanical Properties of 3D Printed Concrete: A RILEM TC 304-ADC Interlaboratory Study — Approach and Main Results. Mater. Struct. Et. Constr. 2025, 58. [Google Scholar] [CrossRef]
- Wolfs, R.; Versteege, J.; Santhanam, M.; Bhattacherjee, S.; Bos, F.; Robens-Radermacher, A.; Muthukrishnan, S.; Menna, C.; Ozturk, O.; Ozyurt, N.; et al. Mechanical Properties of 3D Printed Concrete: A RILEM TC 304-ADC Interlaboratory Study — Flexural and Tensile Strength. Mater. Struct. Et. Constr. 2025, 58. [Google Scholar] [CrossRef]
- Mechtcherine, V.; Muthukrishnan, S.; Robens-Radermacher, A.; Wolfs, R.; Versteege, J.; Menna, C.; Ozturk, O.; Ozyurt, N.; Roupec, J.; Richter, C.; et al. Mechanical Properties of 3D Printed Concrete: A RILEM 304-ADC Interlaboratory Study – Compressive Strength and Modulus of Elasticity. Mater. Struct. Et. Constr. 2025, 58. [Google Scholar] [CrossRef]
- Žvironaite, J.; Kligys, M.; Pundiene, I.; Pranckevičiene, J. Effect of Limestone Particles on Rheological Properties and Hardening Process of Plasticized Cement Pastes. Medziagotyra 2015, 21, 143–148. [Google Scholar] [CrossRef]
- Hanžič, L.; Štefančič, M.; Šter, K.; Zalar Serjun, V.; Šinka, M.; Sapata, A.; Šahmenko, G.; Šerelis, E.; Migliniece, B.; Korat Bensa, L. Collision Milling of Oil Shale Ash as Constituent Pretreatment in Concrete 3D Printing. Infrastructures 2025, 10, 1–24. [Google Scholar] [CrossRef]
- Srivastava, V.; Kumar, R.; Agarwal, V.C. Metakaolin Inclusion : Effect on Mechanical Properties of Concrete. J. Acad. Indus. Res. 2012, 1(5), 251–253. [Google Scholar]
- Guemmadi, Z.; Resheidat, M.; Chabil, H.; Toumi, B. Modeling the Influence of Limestone Filler on Concrete: A Novel Approach for Strength and Cost. Jordan J. Civ. Eng. 2009, 3, 158–171. [Google Scholar]
- Hou, S.; Duan, Z.; Xiao, J.; Ye, J. A Review of 3D Printed Concrete: Performance Requirements, Testing Measurements and Mix Design. Constr. Build. Mater. 2021, 273, 121745. [Google Scholar] [CrossRef]
- Akhlaghi, O.; Aytas, T.; Tatli, B.; Sezer, D.; Hodaei, A.; Favier, A.; Scrivener, K.; Menceloglu, Y.Z.; Akbulut, O. Modified Poly(Carboxylate Ether)-Based Superplasticizer for Enhanced Flowability of Calcined Clay-Limestone-Gypsum Blended Portland Cement. Cem. Concr. Res. 2017, 101, 114–122. [Google Scholar] [CrossRef]
- Spurina, E.; Sinka, M.; Ziemelis, K.; Bajare, D. The effects of 3D printing on frost resistance of concrete. J. Phys. Conf. Ser. 2023, 2423, 012037. [Google Scholar] [CrossRef]
- Łaźniewska-Piekarczyk, B. THE INFLUENCE OF THE TYPE OF LOW-EMISSION CEMENT AND AIR-ENTRAINING ADMIXTURES ON THE QUALITY OF AIR ENTRAINMENT OF CONCRETE – UNEXPECTED IMPACT OF GRANULATED BLAST FURNACE SLAG. Struct. Environ. 2024, 16, 222–232. [Google Scholar] [CrossRef]
- Sapata, A.; Šinka, M.; Šahmenko, G.; Korat Bensa, L.; Hanžič, L.; Šter, K.; Ručevskis, S.; Bajāre, D.; Bos, F.P. Establishing Benchmark Properties for 3D-Printed Concrete: A Study of Printability, Strength, and Durability. J. Compos. Sci. 2025, 9. [Google Scholar] [CrossRef]
- Methods of Testing Cement—Part 3: Determination of Setting Times and Soundness. EN 196-3; European Committee for Standardization (CEN).
- EN 1015-3; Methods of Test for Mortar for Masonry - Part 3: Determination of Consistence of Fresh Mortar (by Flow Table).
- Puzule, L.; Spurina, E.; Frolovs, G.; Dragons, D.; Dias, A.C.; Sinka, M. 3D Printing of Bio-Based Building Materials-Mix Design, Properties and Carbon Footprint Assessment. [CrossRef]
- Ducoulombier, N.; Mesnil, R.; Carneau, P.; Demont, L.; Bessaies-Bey, H.; Caron, J.F.; Roussel, N. The “Slugs-Test” for Extrusion-Based Additive Manufacturing: Protocol, Analysis and Practical Limits. Cem. Concr. Compos. 2021, 121. [Google Scholar] [CrossRef]
- Van Tittelboom, K.; Van Der Putten, J.; De Schutter, G.; Wangler, T.; Markin, S.; Mechtcherine, V.; Combrinck, R.; Hanžič, L.; Baz, B.; Kraenkel, T.; et al. RILEM TC ADC ILS-DURASHRINK Specim. Prep. Test. Instr. Durab. Meas. [CrossRef] [PubMed]
- Weng, Y.; Li, M.; Tan, M.J.; Qian, S. Design 3D Printing Cementitious Materials via Fuller Thompson Theory and Marson-Percy Model. Constr. Build. Mater. 2018, 163, 600–610. [Google Scholar] [CrossRef]
- Sahmenko, G.; Rucevskis, S.; Lusis, V.; Spure, L.; Korjakins, A.; Annamaneni, K.K.; Bajare, D. Elaboration Mix Design Methodology for Obtaining Defined Properties of Cement Composite with Fly Ash, Silica Fume and Colloidal Silica. Mech. Compos. Mater. 2024, 60, 919–938. [Google Scholar] [CrossRef]
- Oymael, S. Suitabil. OIL SHALE ASH AS A Const. Cem. 2007, Vol. 24.
- Jayathilakage, R.; Rajeev, P.; Sanjayan, J. Yield Stress Criteria to Assess the Buildability of 3D Concrete Printing. Constr. Build. Mater. 2020, 240. [Google Scholar] [CrossRef]
- Das, A.; Song, Y.; Mantellato, S.; Wangler, T.; Lange, D.A.; Flatt, R.J. Effect of Processing on the Air Void System of 3D Printed Concrete. Cem. Concr. Res. 2022, 156. [Google Scholar] [CrossRef]
- Zhang, Y.; de Lima, L.N.; Böhler, D.; Arunothayan, A.; Babafemi, A.J.; Baz, B.; Caneda-Martinez, L.; De Schutter, G.; Du, H.; Freund, N.; et al. Durability Assessment of 3D Printed Cement-Based Materials: A RILEM TC 304-ADC Interlaboratory Study. Mater. Struct. Et. Constr. 2025, 58. [Google Scholar] [CrossRef]
- van den Heever, M.; du Plessis, A.; Kruger, J.; van Zijl, G. Evaluating the Effects of Porosity on the Mechanical Properties of Extrusion-Based 3D Printed Concrete. Cem. Concr. Res. 2022, 153. [Google Scholar] [CrossRef]
- Zhang, Y.; Zhang, Y.; Yang, L.; Liu, G.; Du, H. Influence of the Pore Feature on the Water Uptake in 3D Printed Concrete. Mater. Lett. 2023, 333. [Google Scholar] [CrossRef]
- Piotrowski, T.; Jackiewicz-Rek, W.; Prochon, P.; Jeanpierre, A. Special Requirements for Freeze-Thaw Resistance of Concrete in PWR Nuclear Civil Works. [CrossRef]
- Setina, J.; Gabrene, A.; Juhnevica, I. Effect of Pozzolanic Additives on Structure and Chemical Durability of Concrete. Procedia Eng. 2013, 57, 1005–1012. [Google Scholar] [CrossRef]
- Sikora, P.; Techman, M.; Federowicz, K.; El-Khayatt, A.M.; Saudi, H.A.; Abd Elrahman, M.; Hoffmann, M.; Stephan, D.; Chung, S.Y. Insight into the Microstructural and Durability Characteristics of 3D Printed Concrete: Cast versus Printed Specimens. Case Stud. Constr. Mater. 2022, 17. [Google Scholar] [CrossRef]
- Setzer, M.J.; Fagerlund, G.; Janssen, D.J. CDF Test – Test Method for the Freeze-Thaw Resistance of concrete - Tests with Sodium Chloride Solution (CDF); 1996. [Google Scholar]
- Valenza, J.J.; Scherer, G.W. A Review of Salt Scaling: II. Mech. Cem. Concr. Res. 2007, 37, 1022–1034. [Google Scholar] [CrossRef]
- Yuan, J.; Lu, H.; Yang, Q.; Ling, J. Mechanisms on the Salt–Frost Scaling of Concrete. J. Mater. Civ. Eng. 2017, 29. [Google Scholar] [CrossRef]
Figure 1.
Particle morphology (CEM II, OSA, MK, and LS).
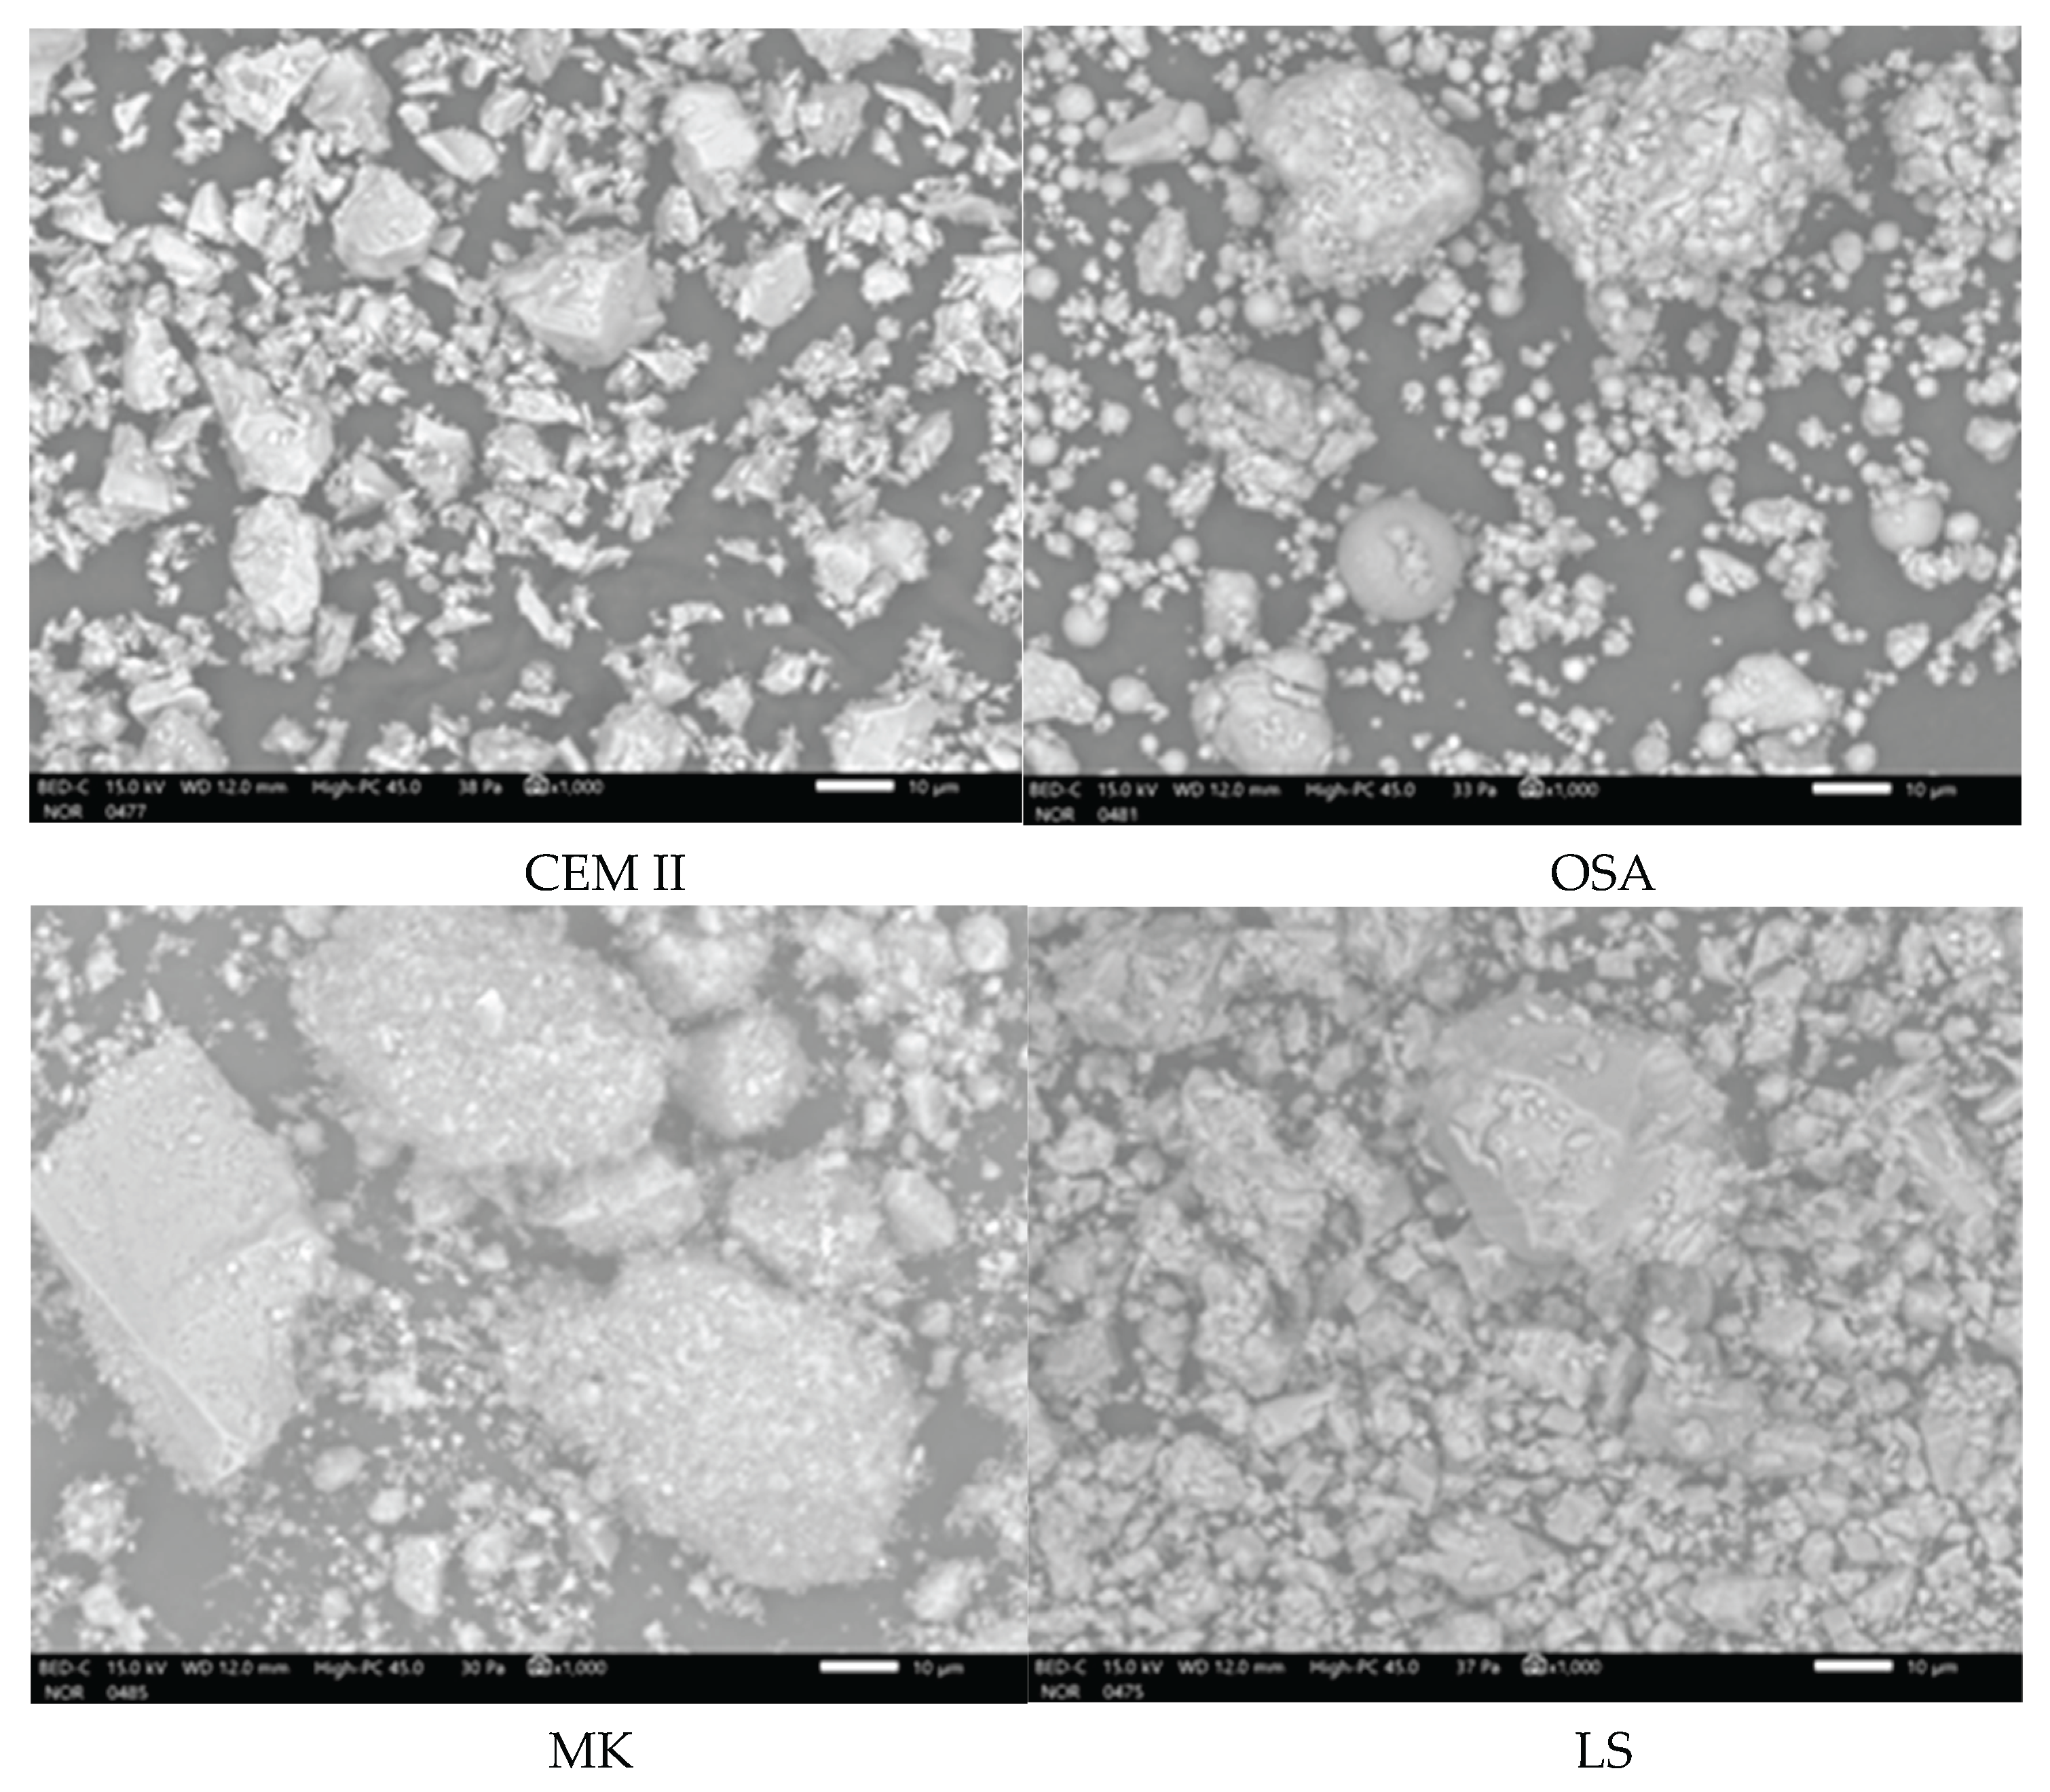
Figure 3.
Custom-made laboratory concrete printer at RTU: (a) printer setup with the aluminium frame and print area; (b) gantry system closeup: (1) motor; (2) hopper; (3) inlet; (4) pipe; (5) nozzle.
Figure 3.
Custom-made laboratory concrete printer at RTU: (a) printer setup with the aluminium frame and print area; (b) gantry system closeup: (1) motor; (2) hopper; (3) inlet; (4) pipe; (5) nozzle.
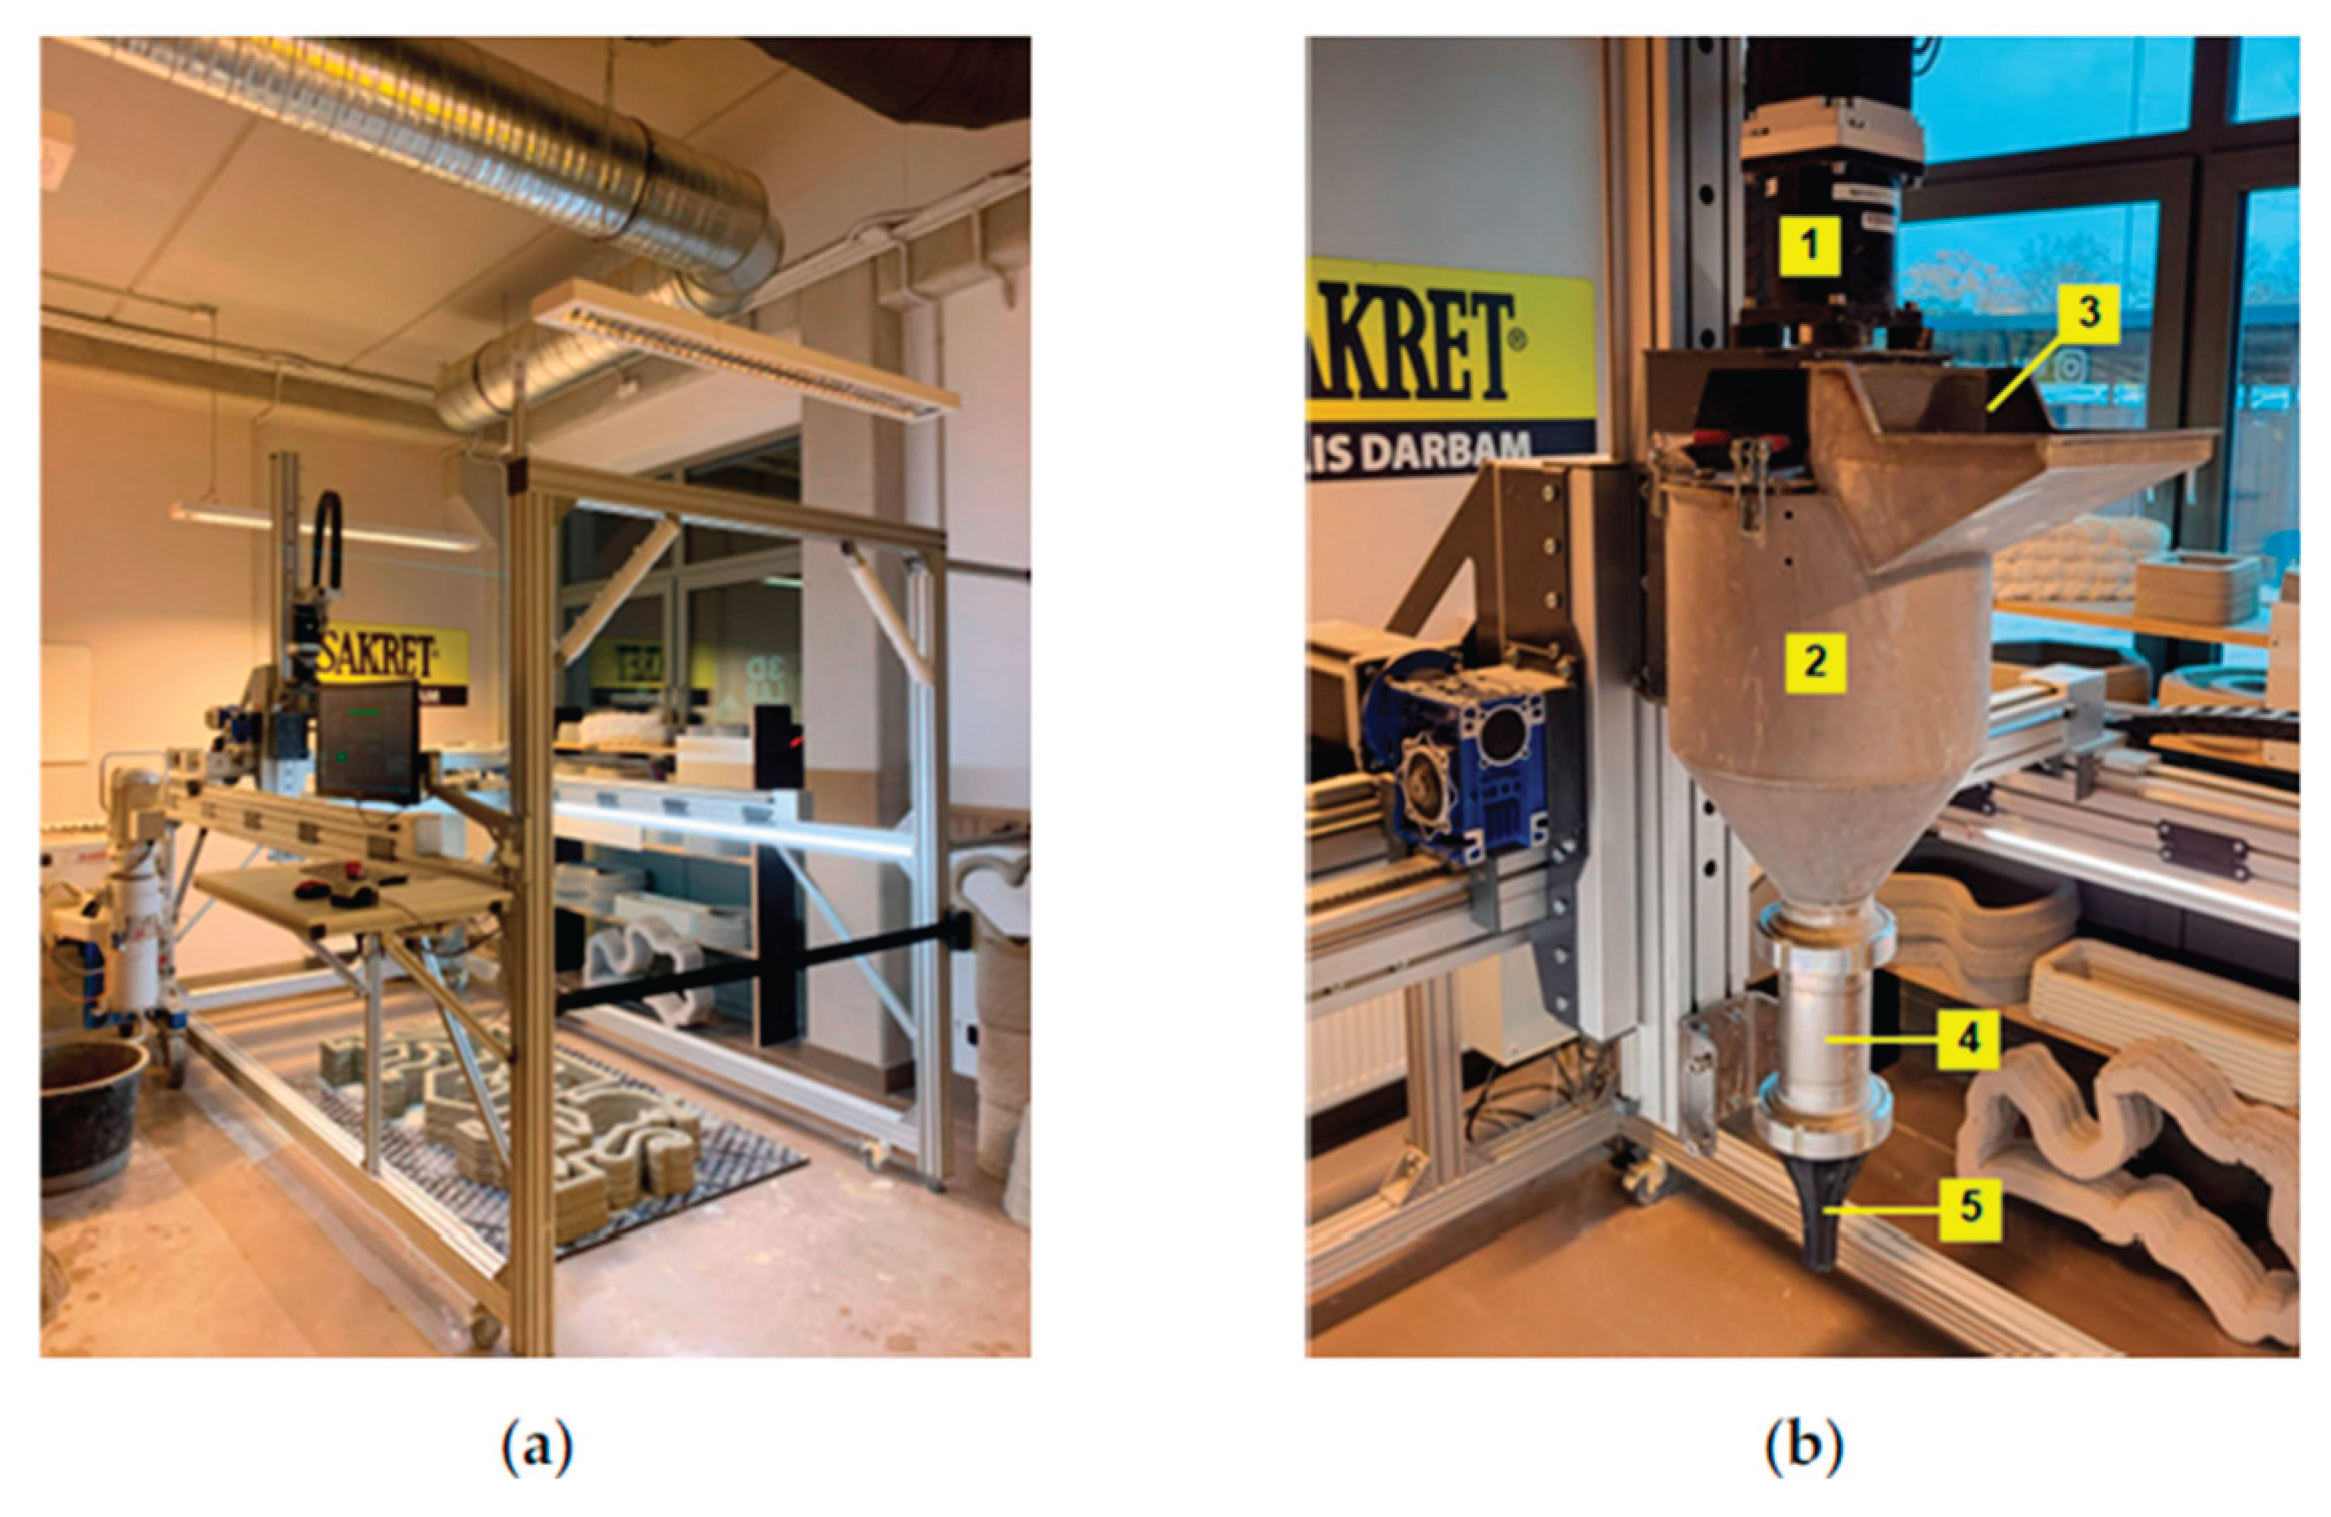
Figure 4.
Sampling scheme from 3D printed element: red – prisms for mechanical test, light blue – cubes for water absorption test, blue – plates for frost resistance test.
Figure 4.
Sampling scheme from 3D printed element: red – prisms for mechanical test, light blue – cubes for water absorption test, blue – plates for frost resistance test.
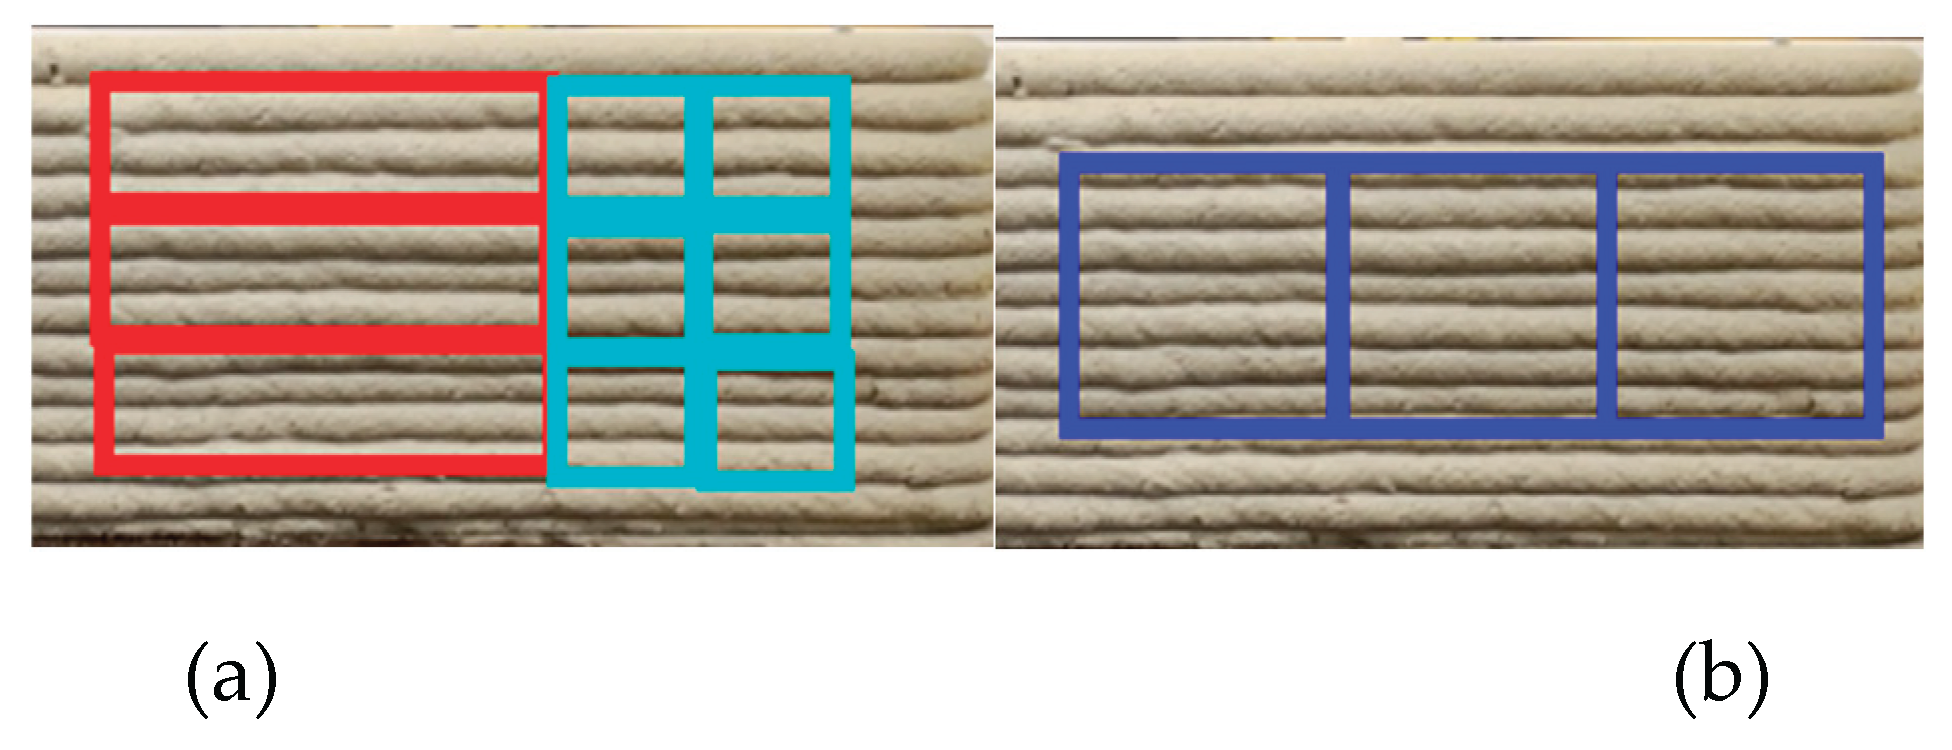
Figure 5.
Mechanical testing scheme related to casting direction: (a) flexural test; (b) compression test.
Figure 5.
Mechanical testing scheme related to casting direction: (a) flexural test; (b) compression test.
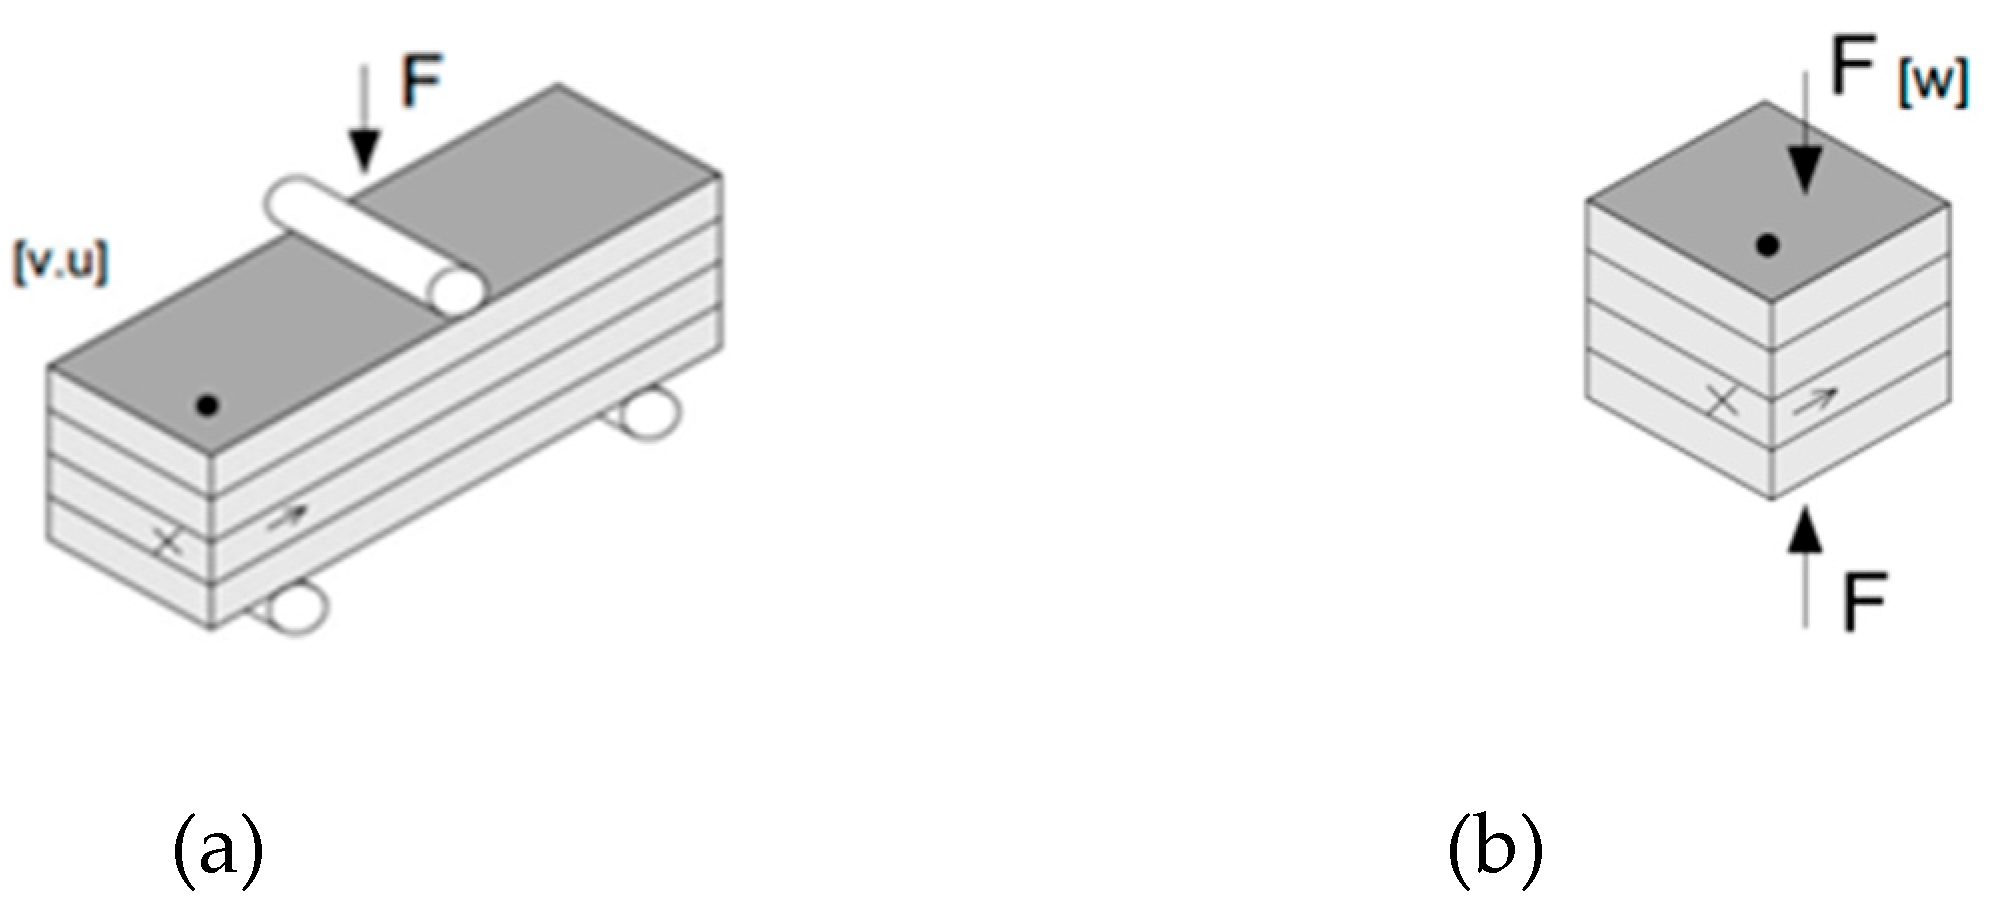
Figure 6.
Capillary water absorption test in accordance with RILEM TC [34].
Figure 6.
Capillary water absorption test in accordance with RILEM TC [34].
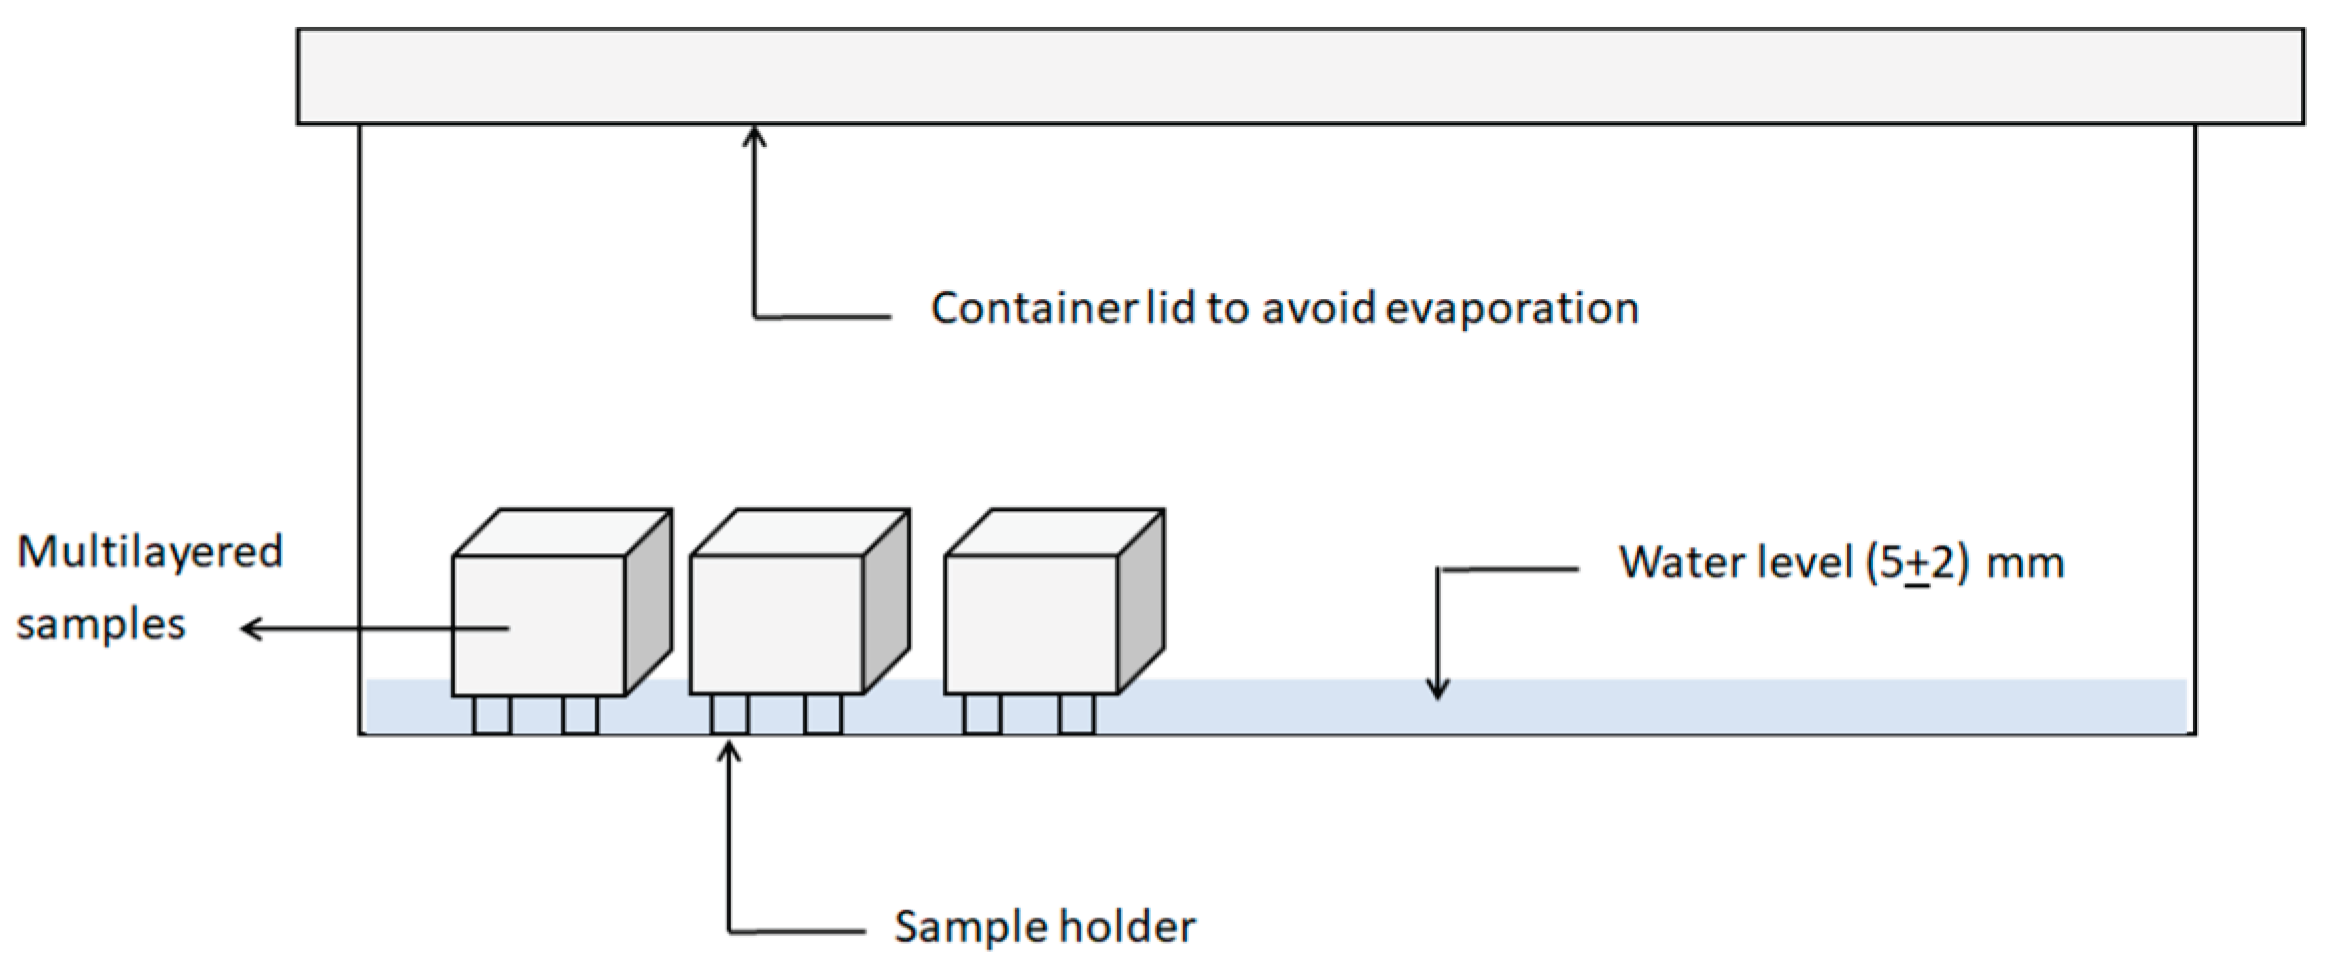
Figure 7.
Freeze–thaw resistance temperature chart.
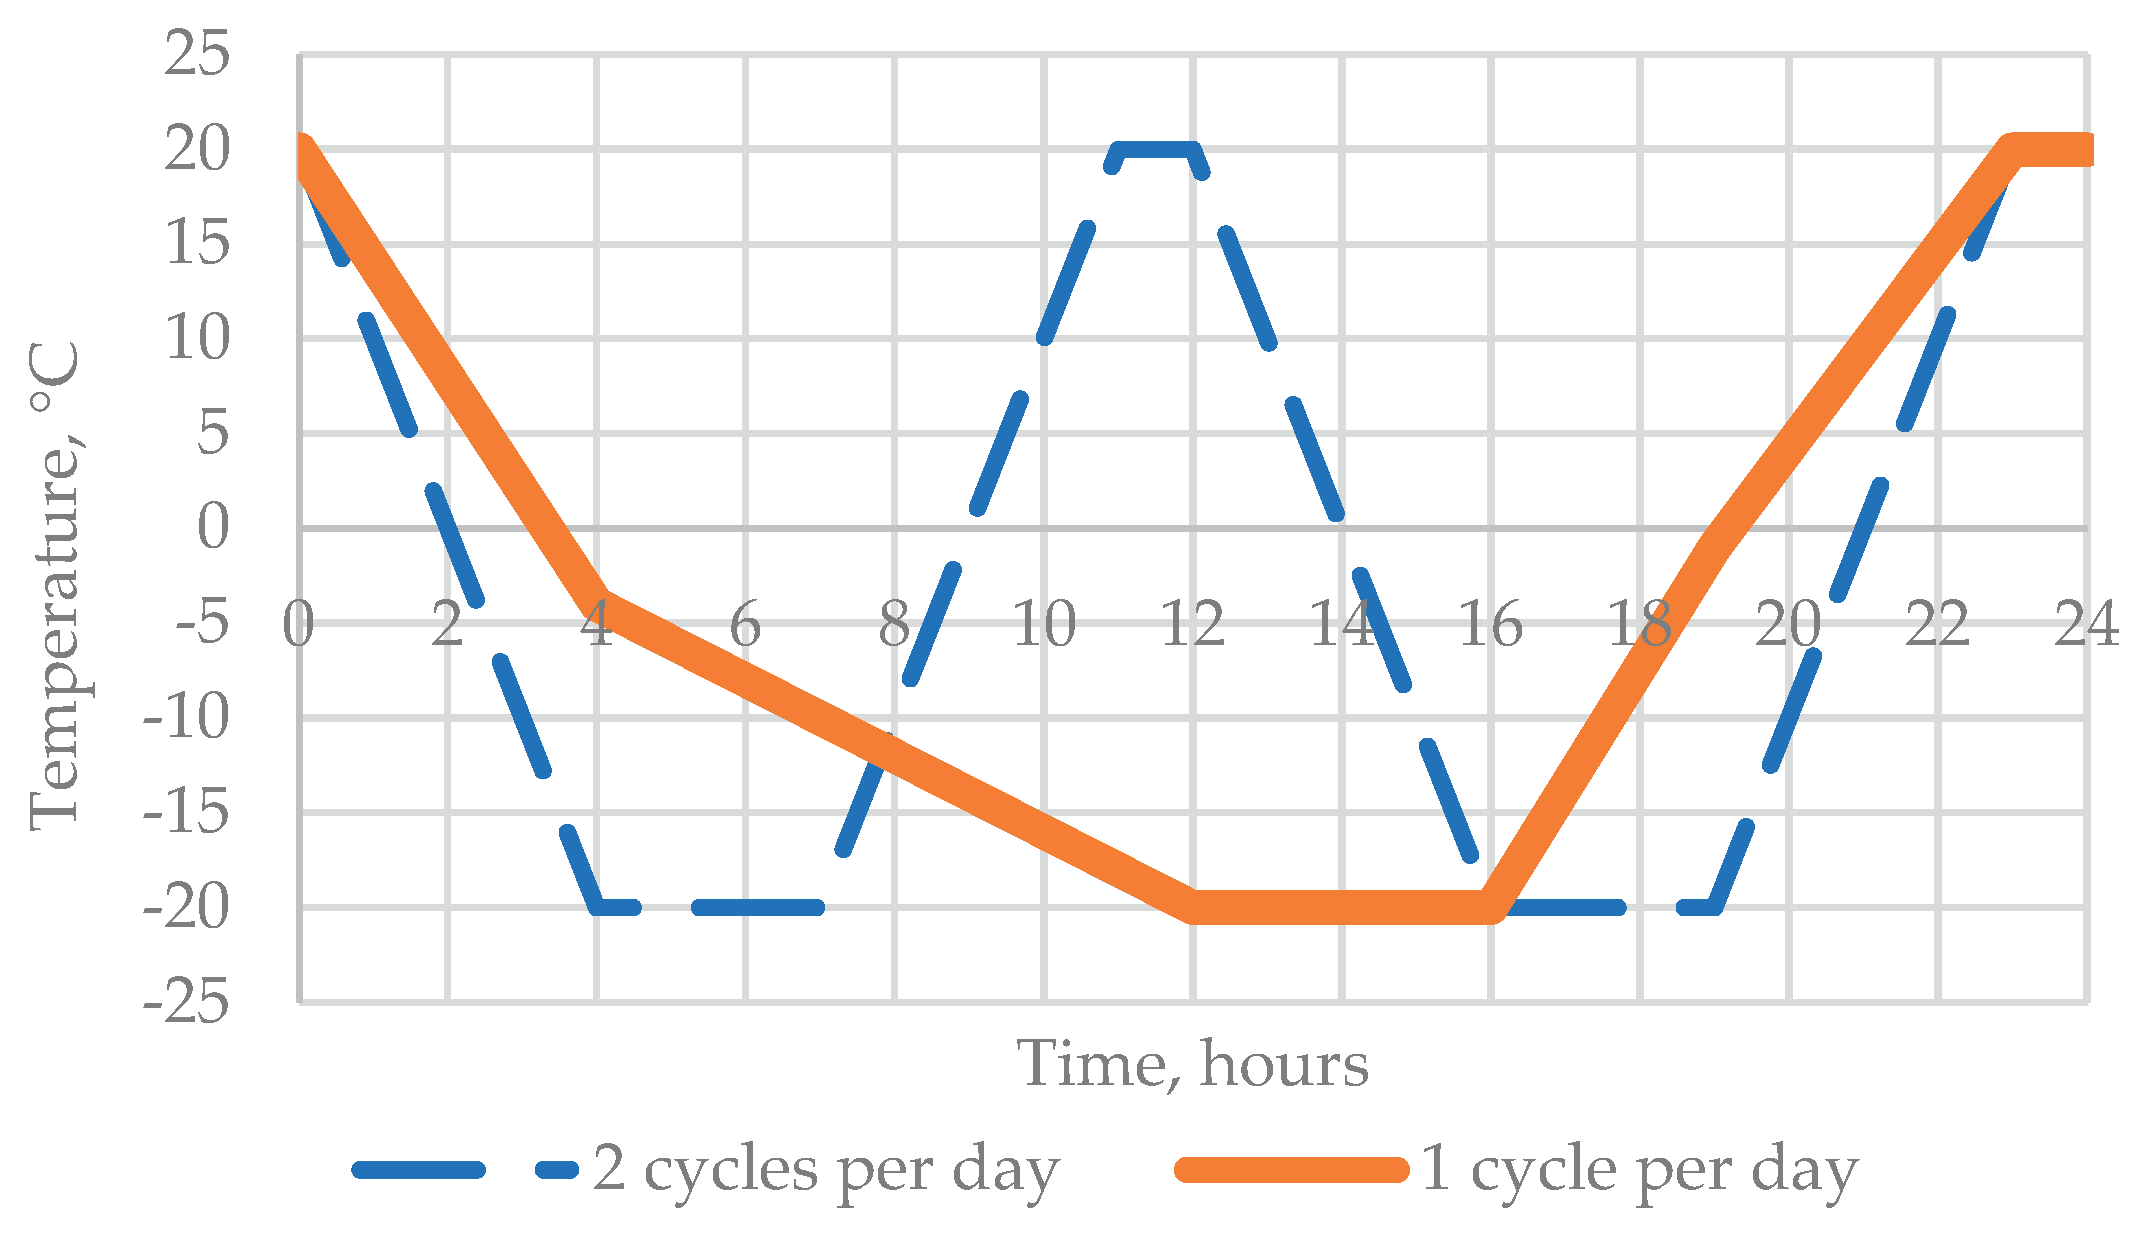
Figure 8.
Pre-blended product particle size distribution.
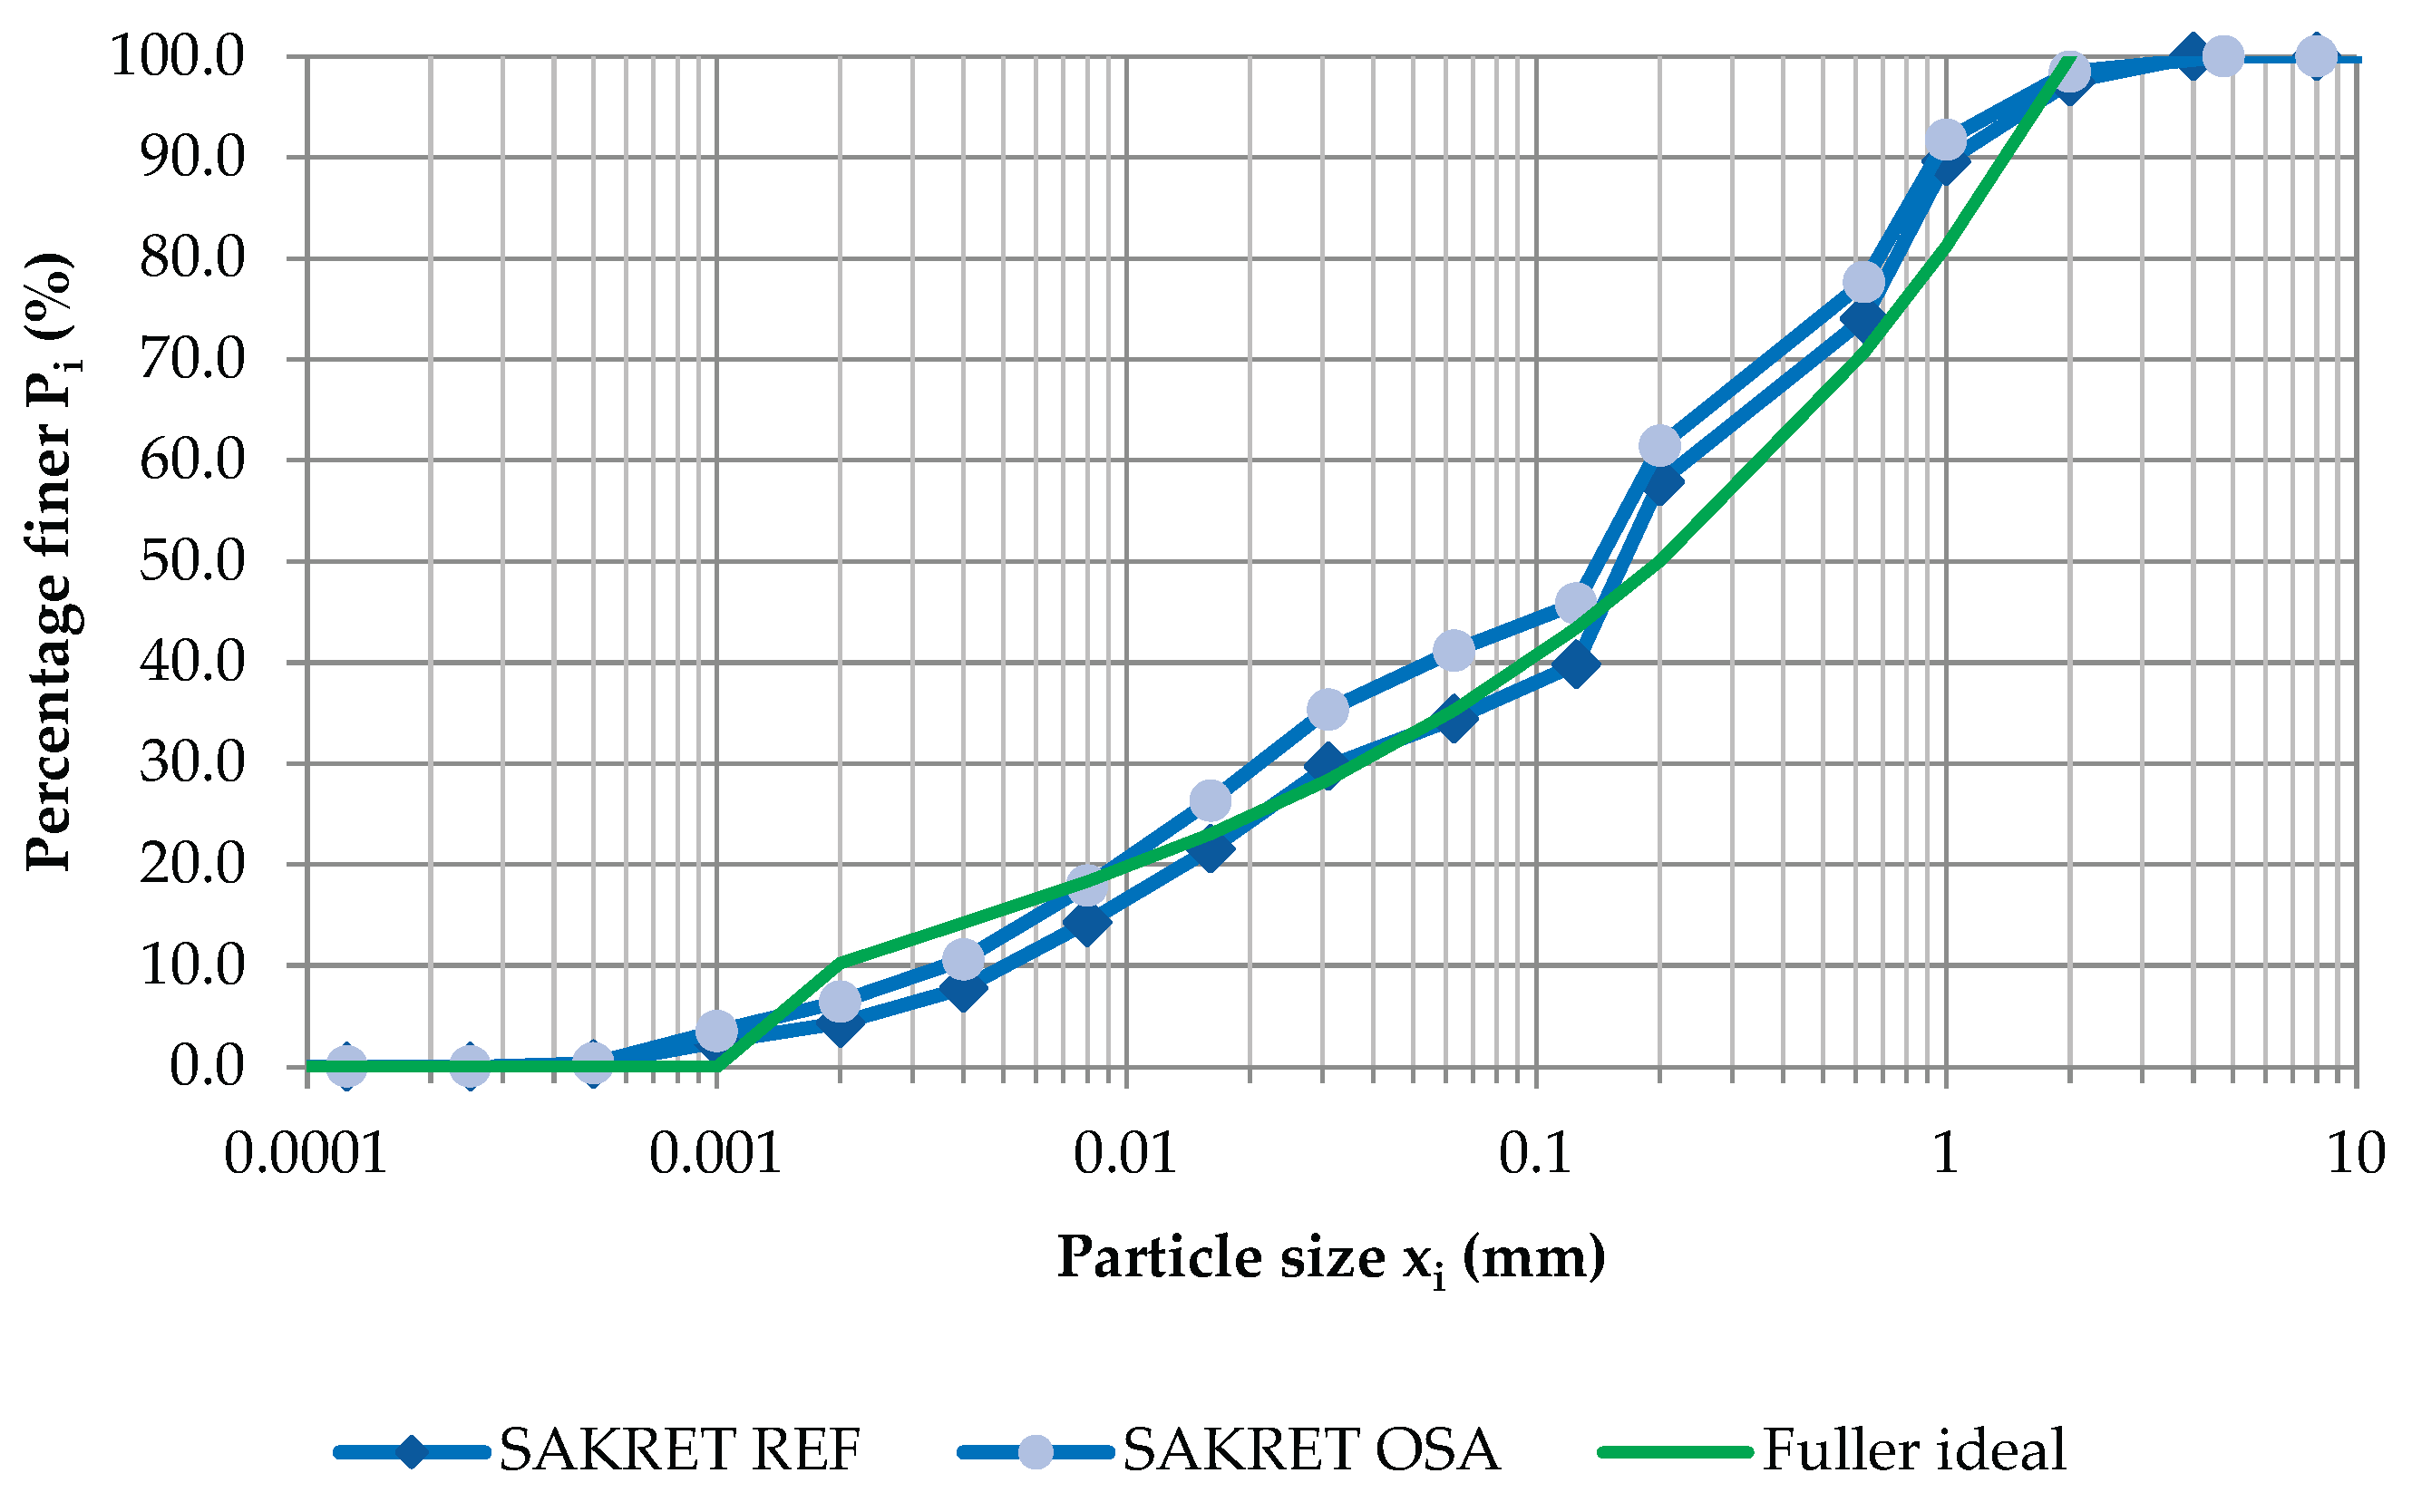
Figure 9.
Pre-blended product XRD chart.
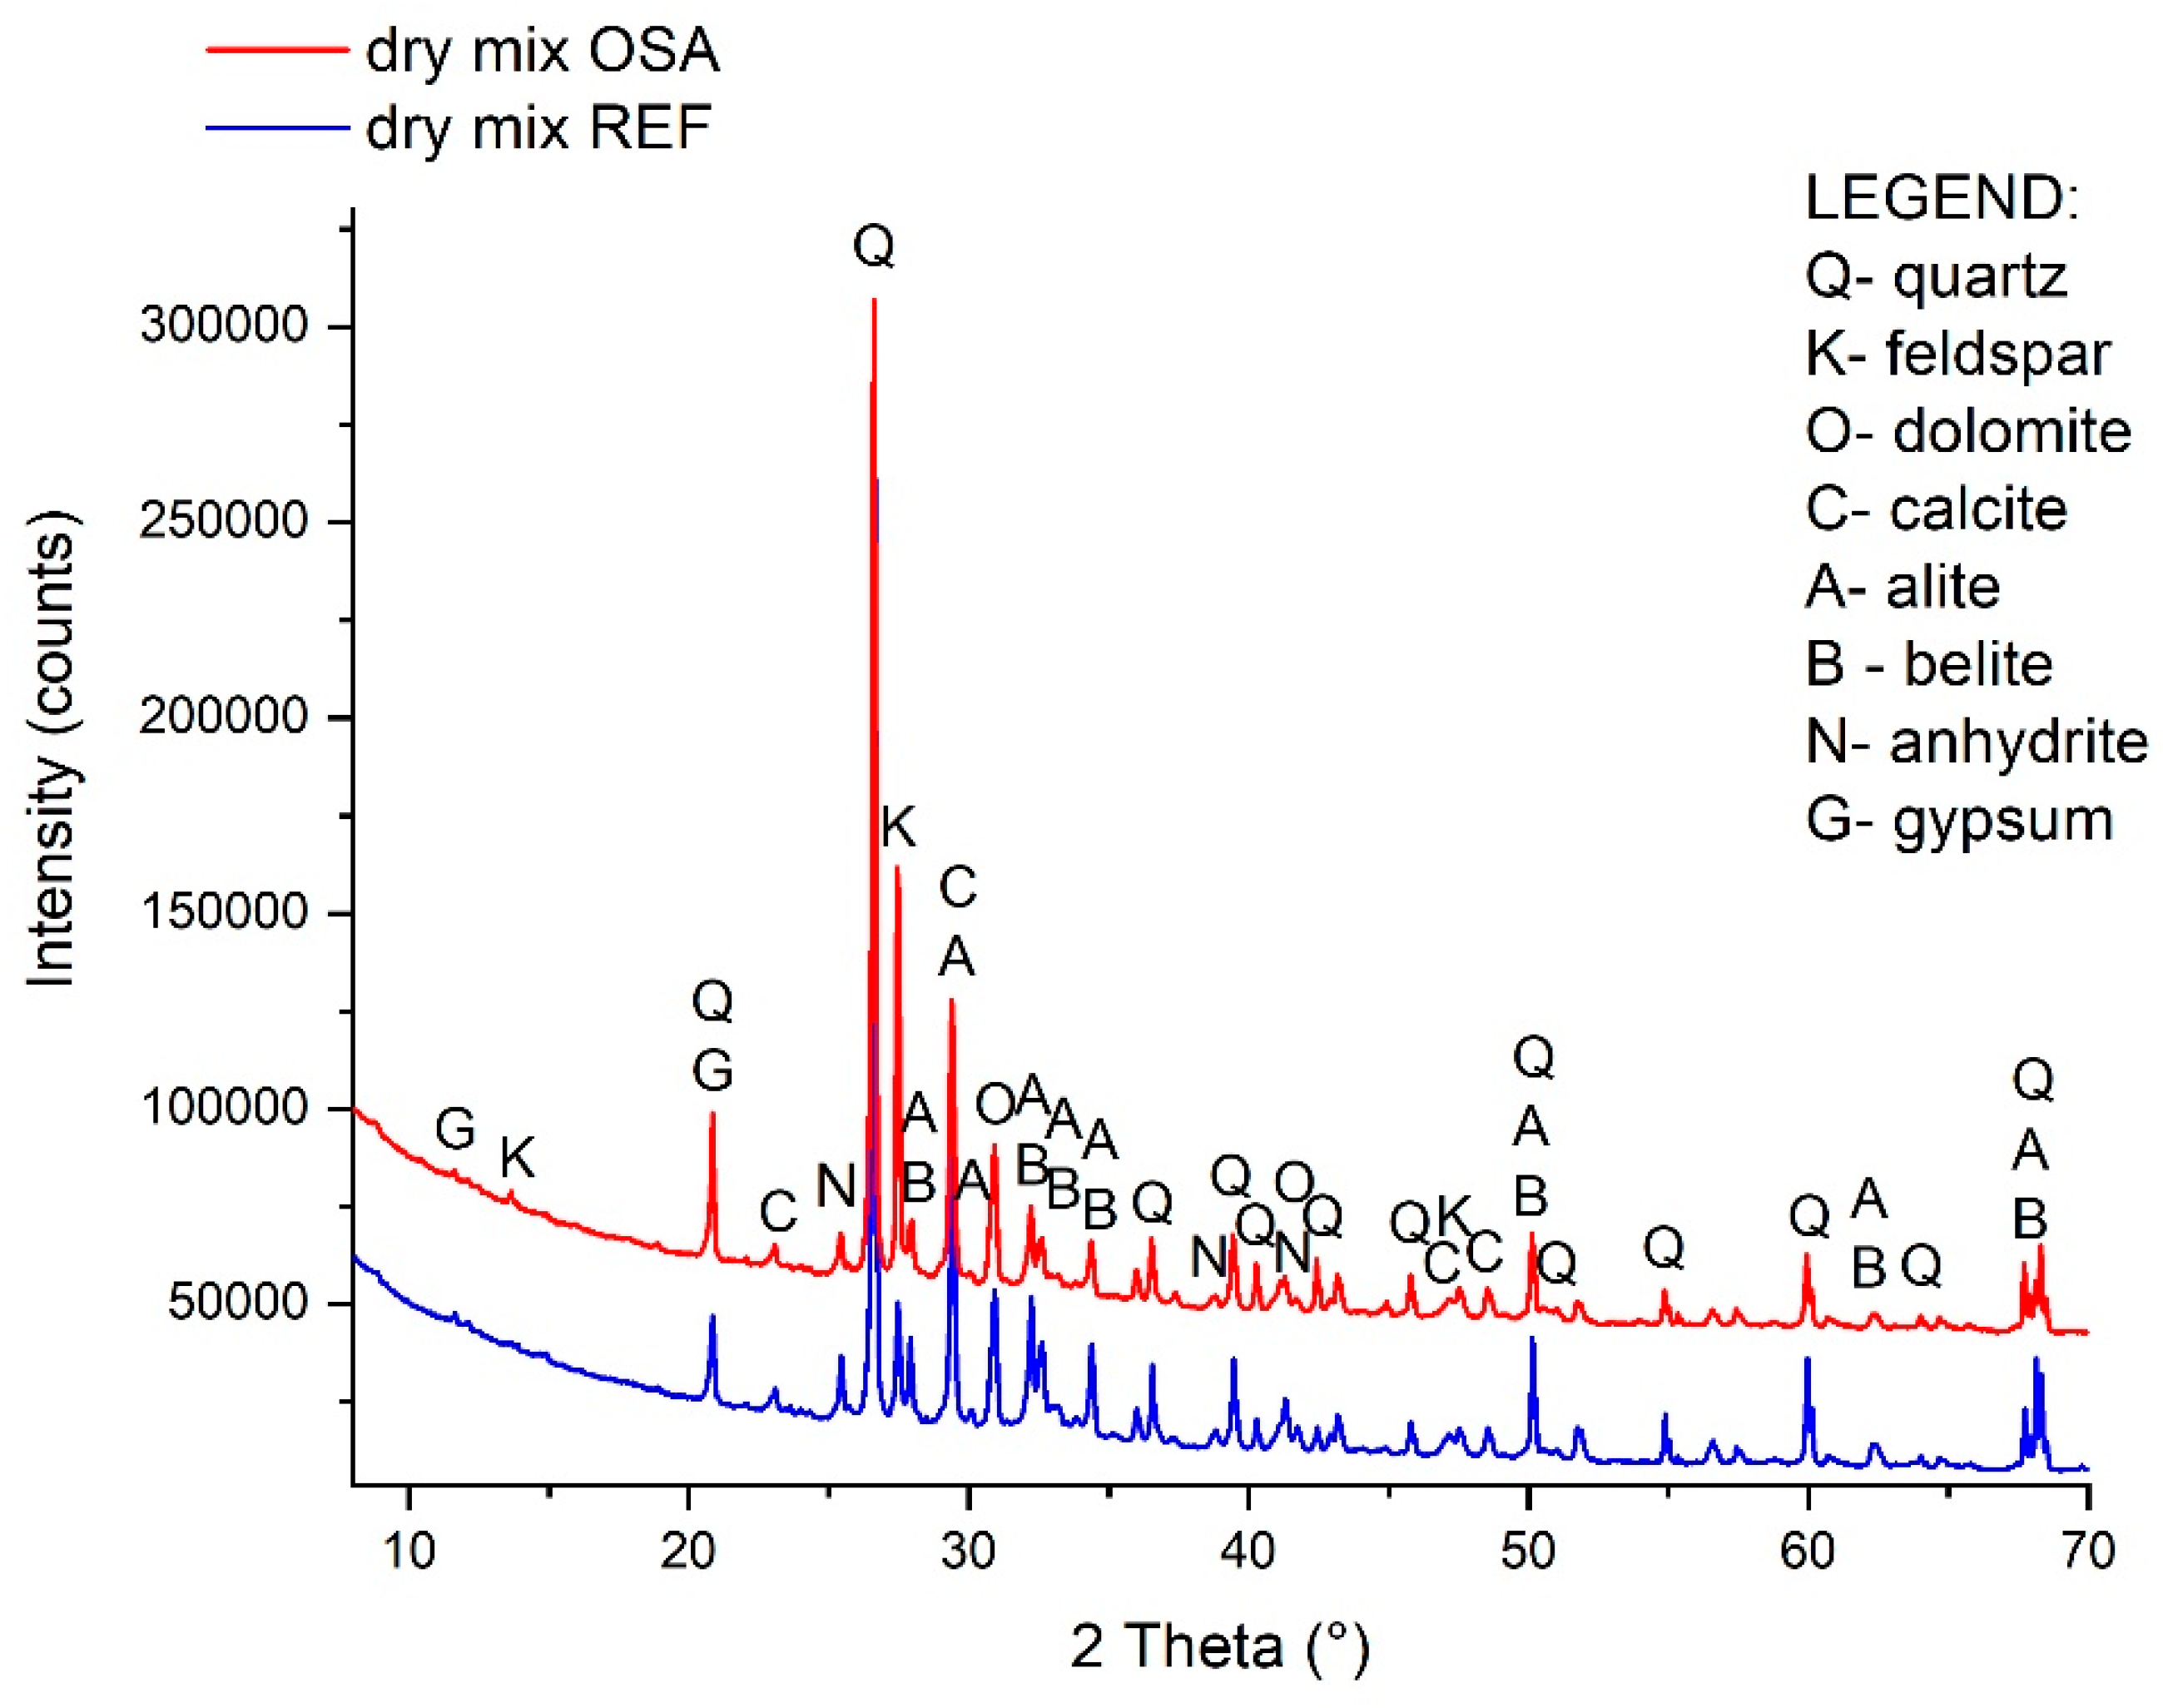
Figure 10.
Yield stress by slug test (above) and buckling (buildability) test results for OSA and REF compositions.
Figure 10.
Yield stress by slug test (above) and buckling (buildability) test results for OSA and REF compositions.
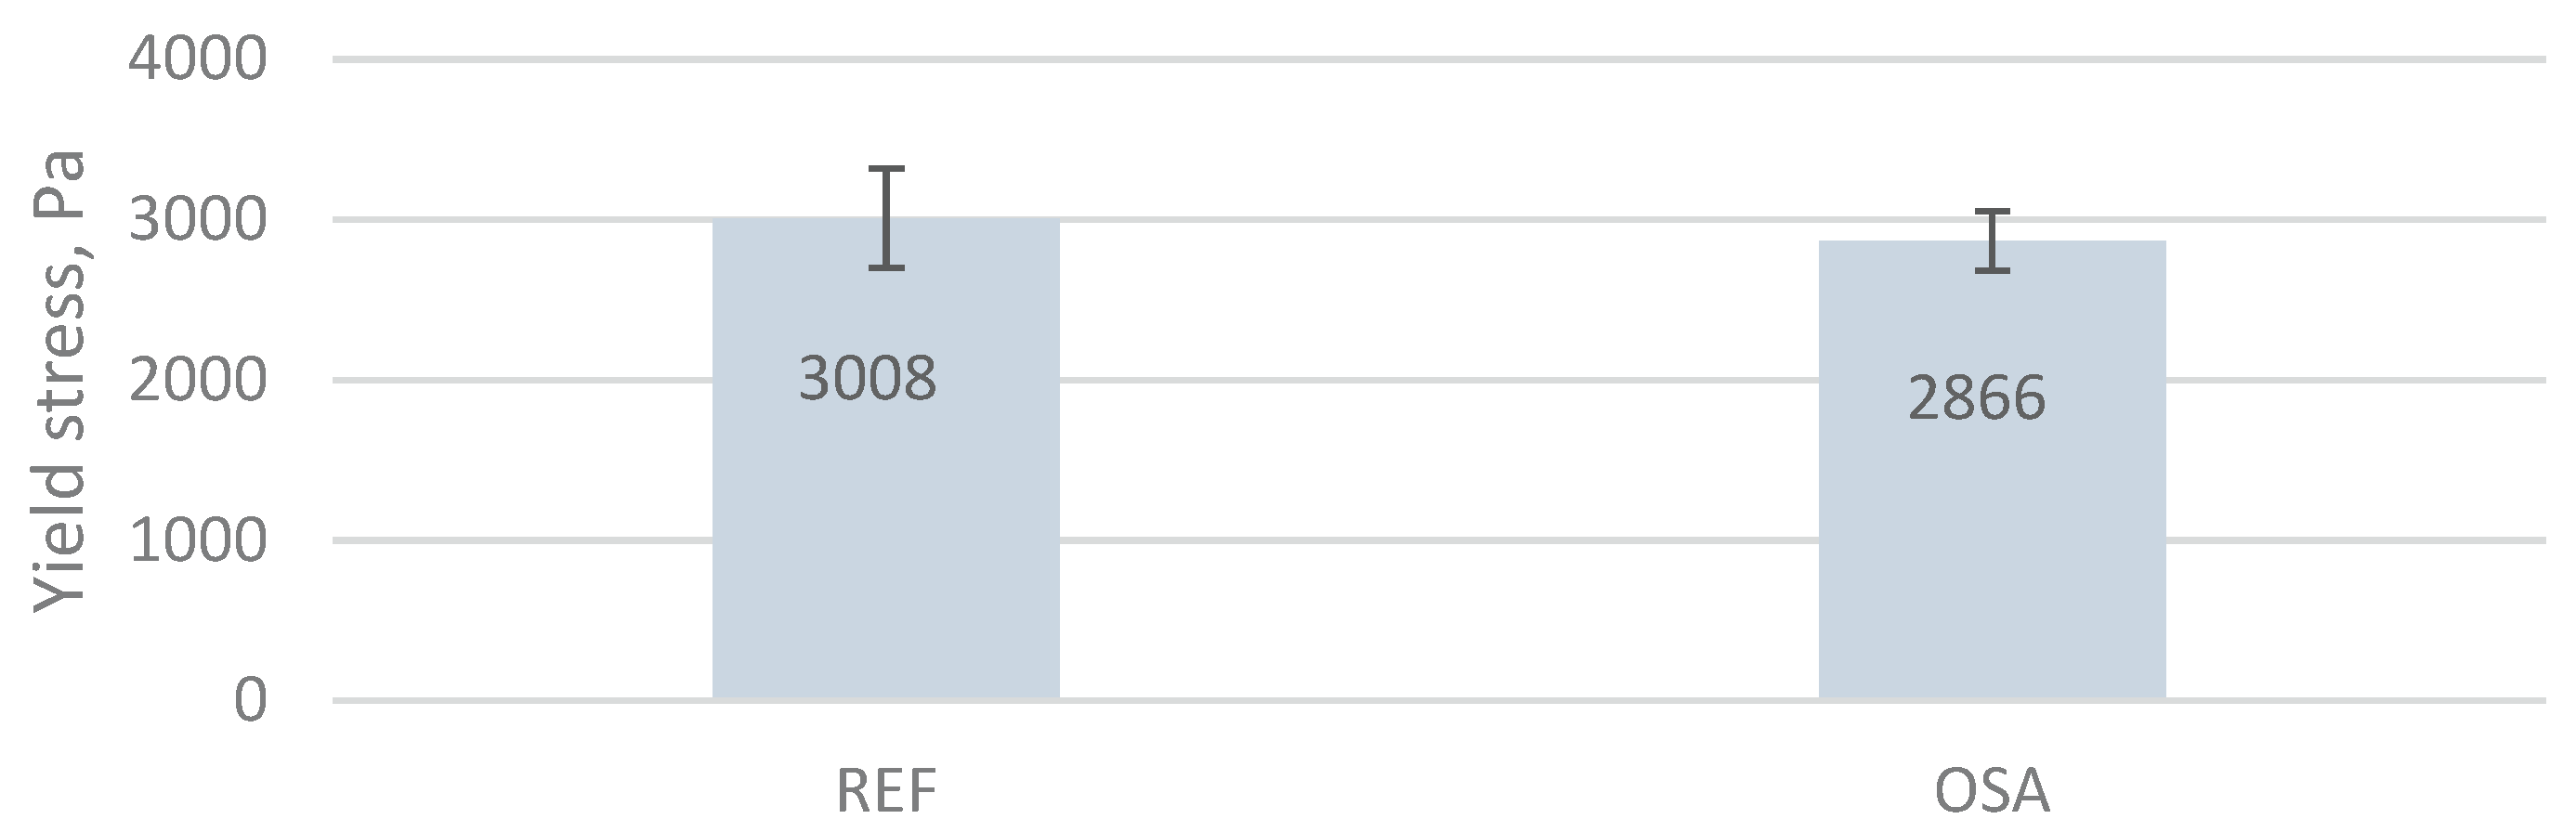
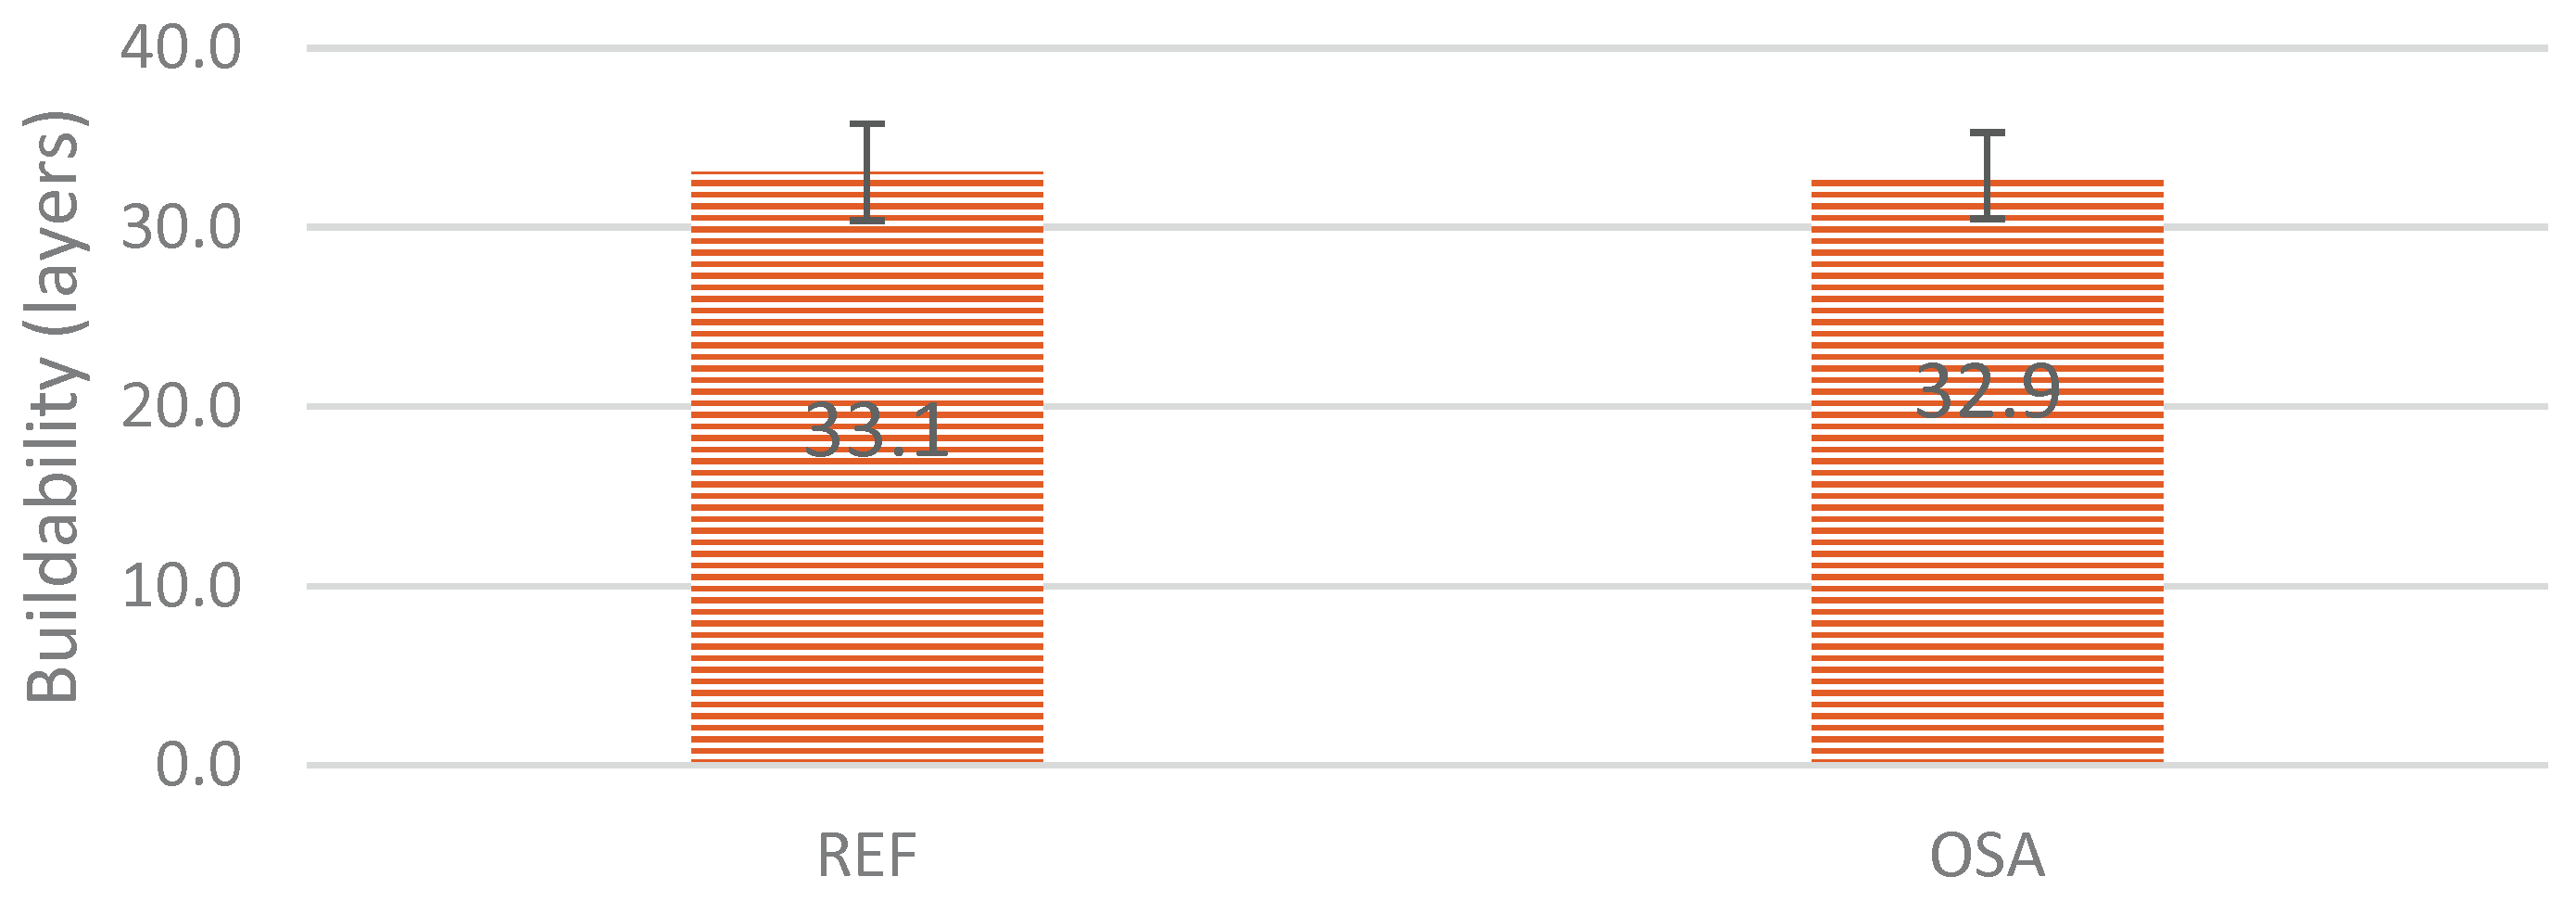
Figure 11.
Buildability test for REF composition, samples 1 and 2.
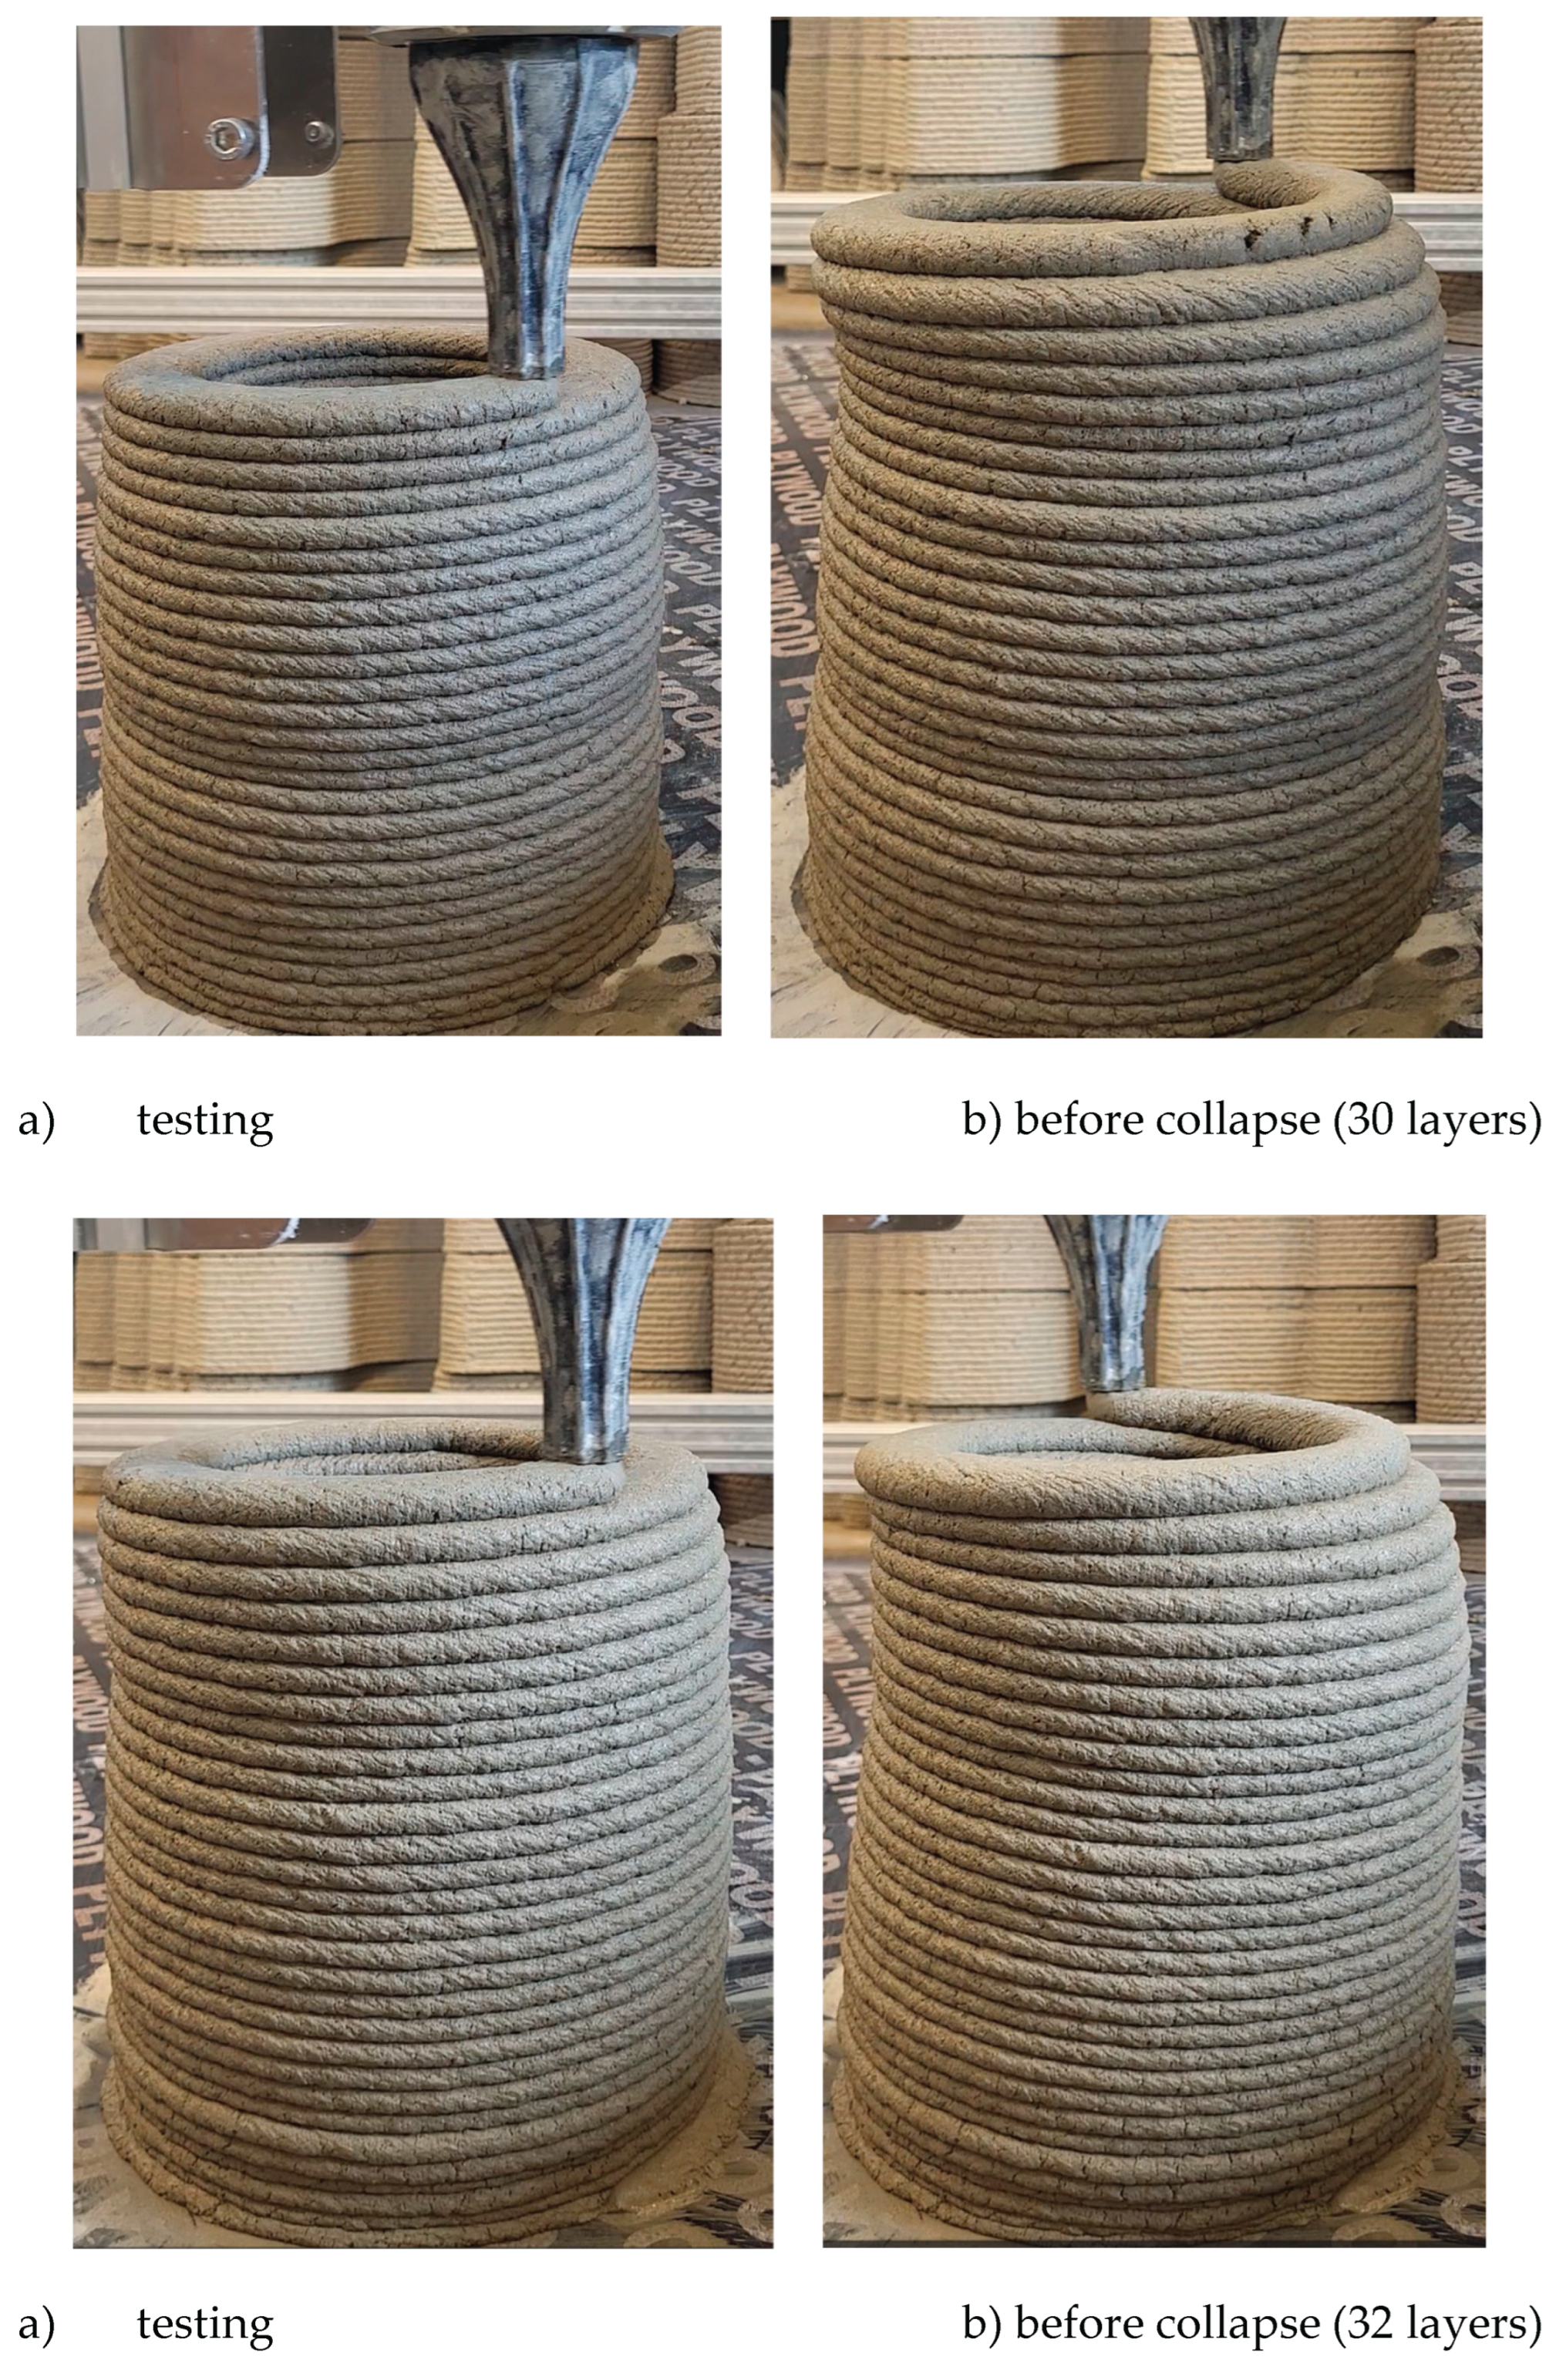
Figure 12.
Buildability test for OSA composition, samples 1 and 2.
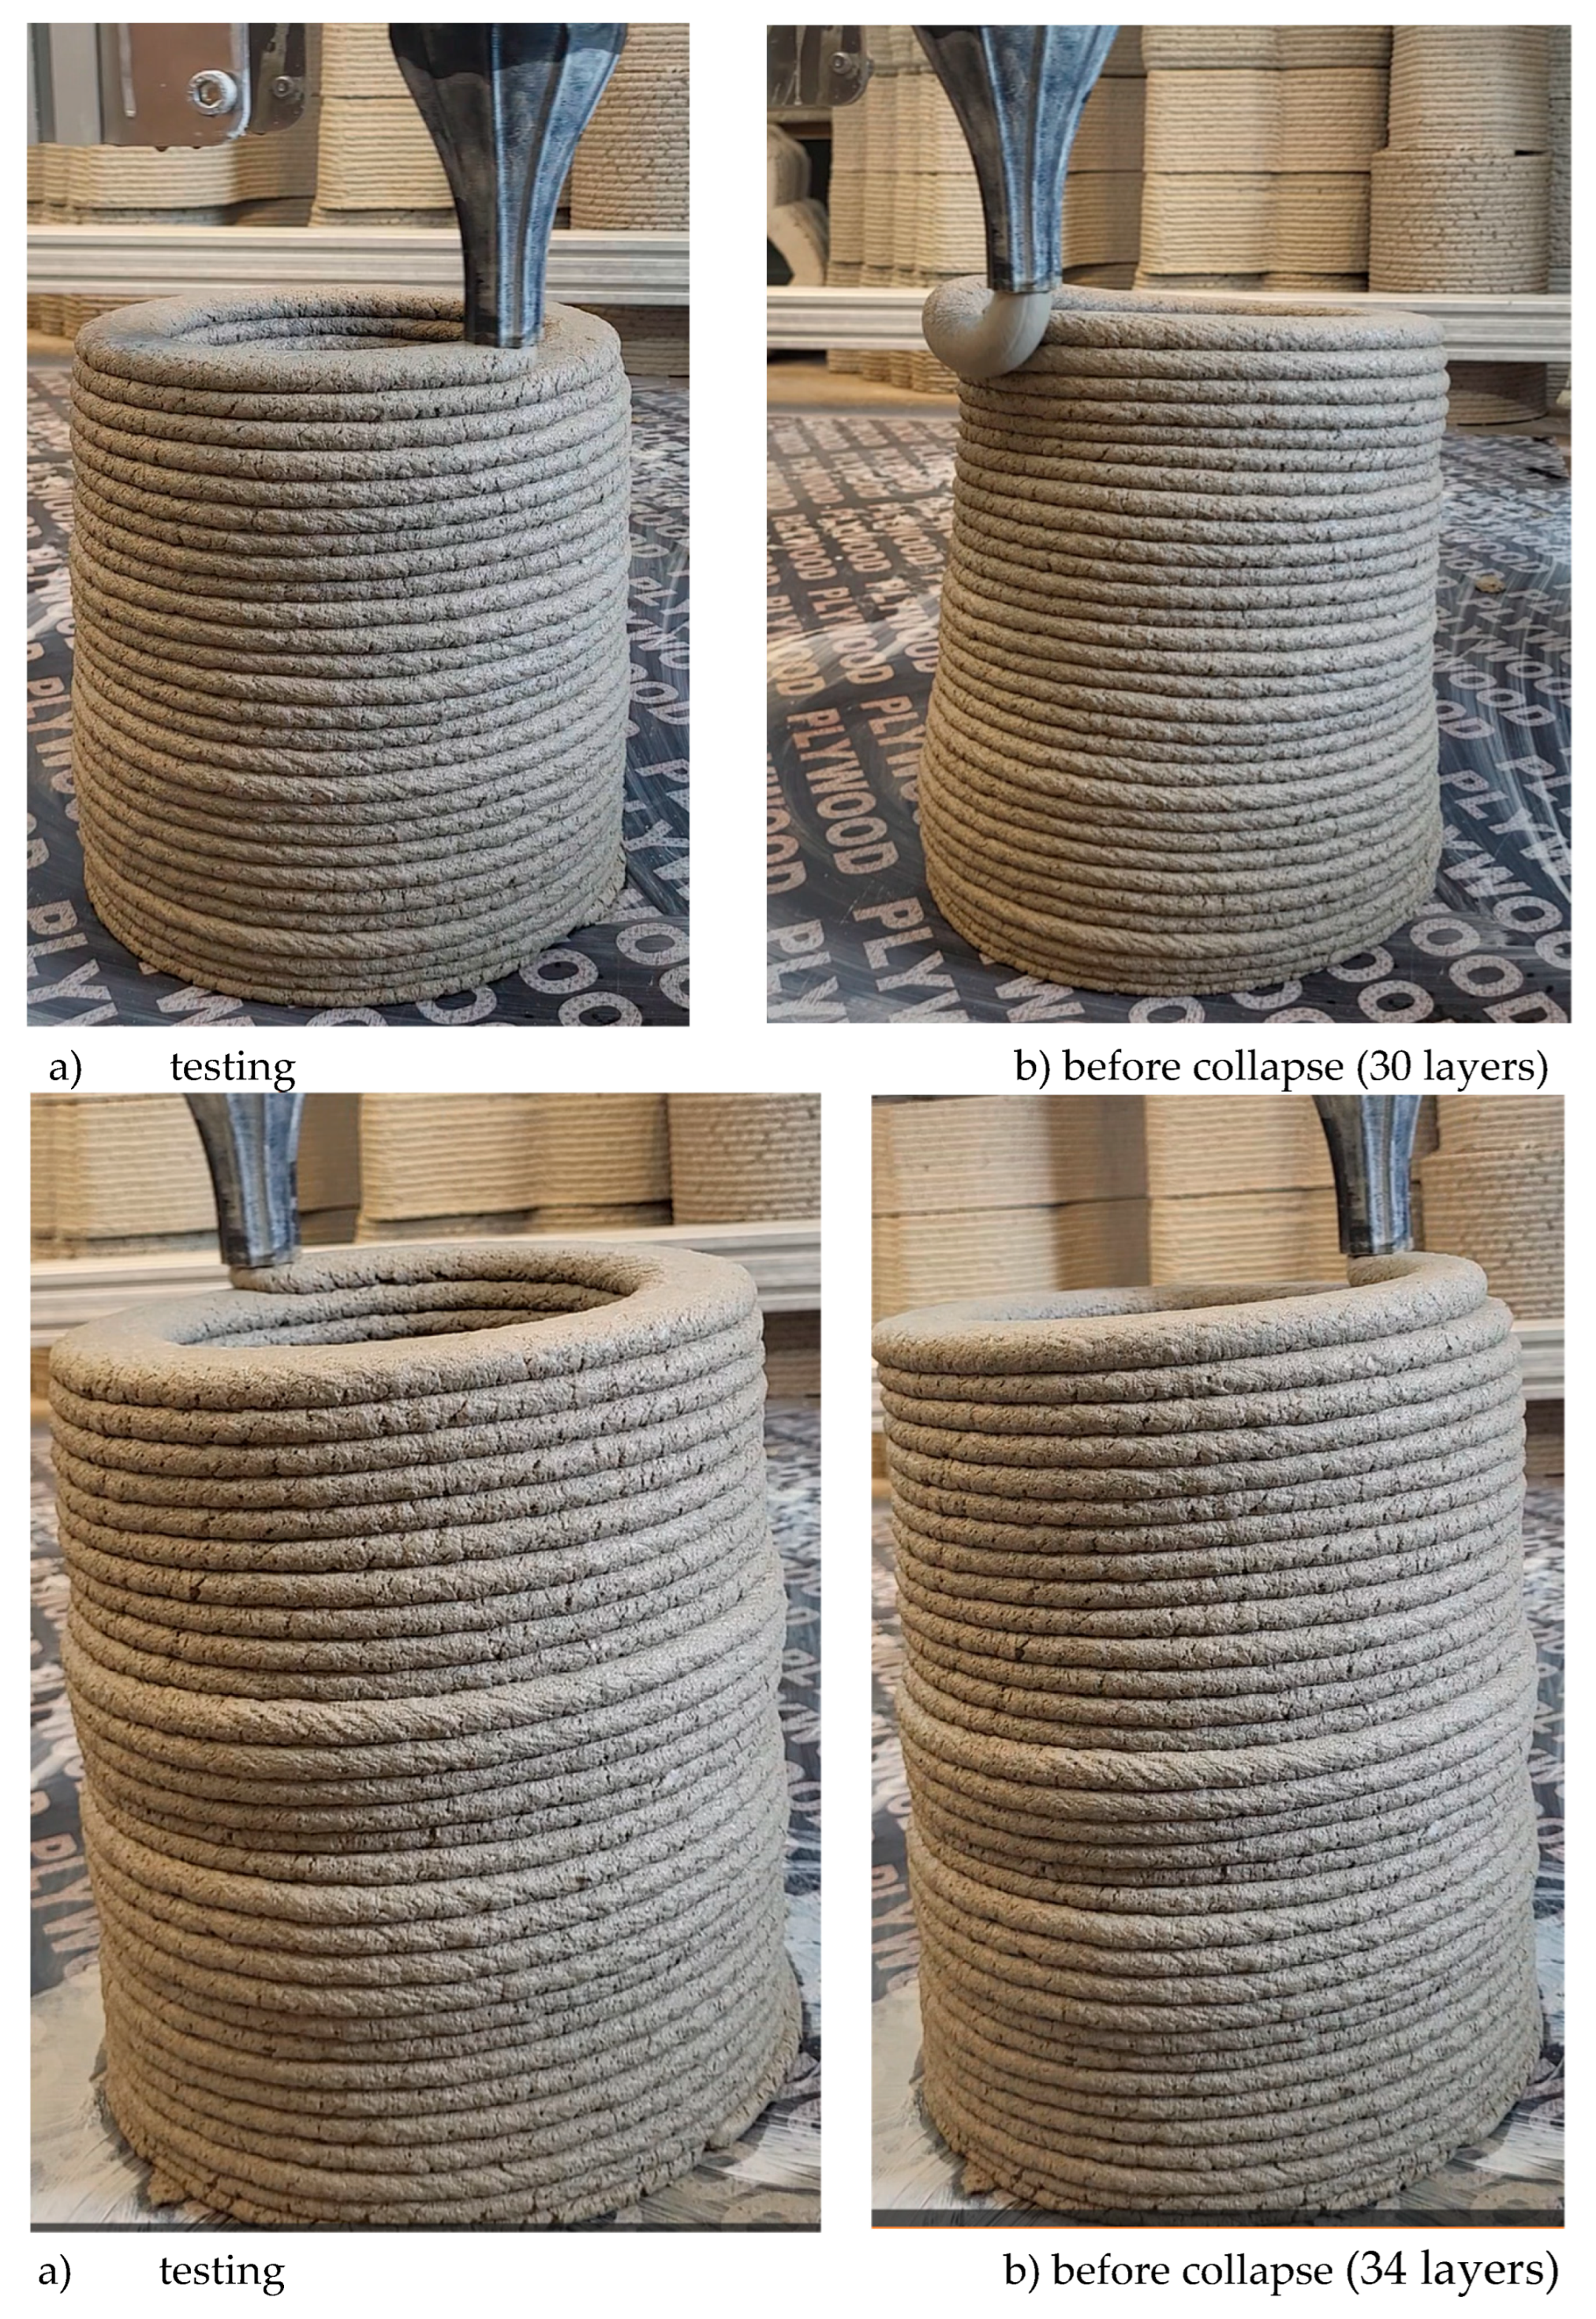
Figure 13.
The results of material density.
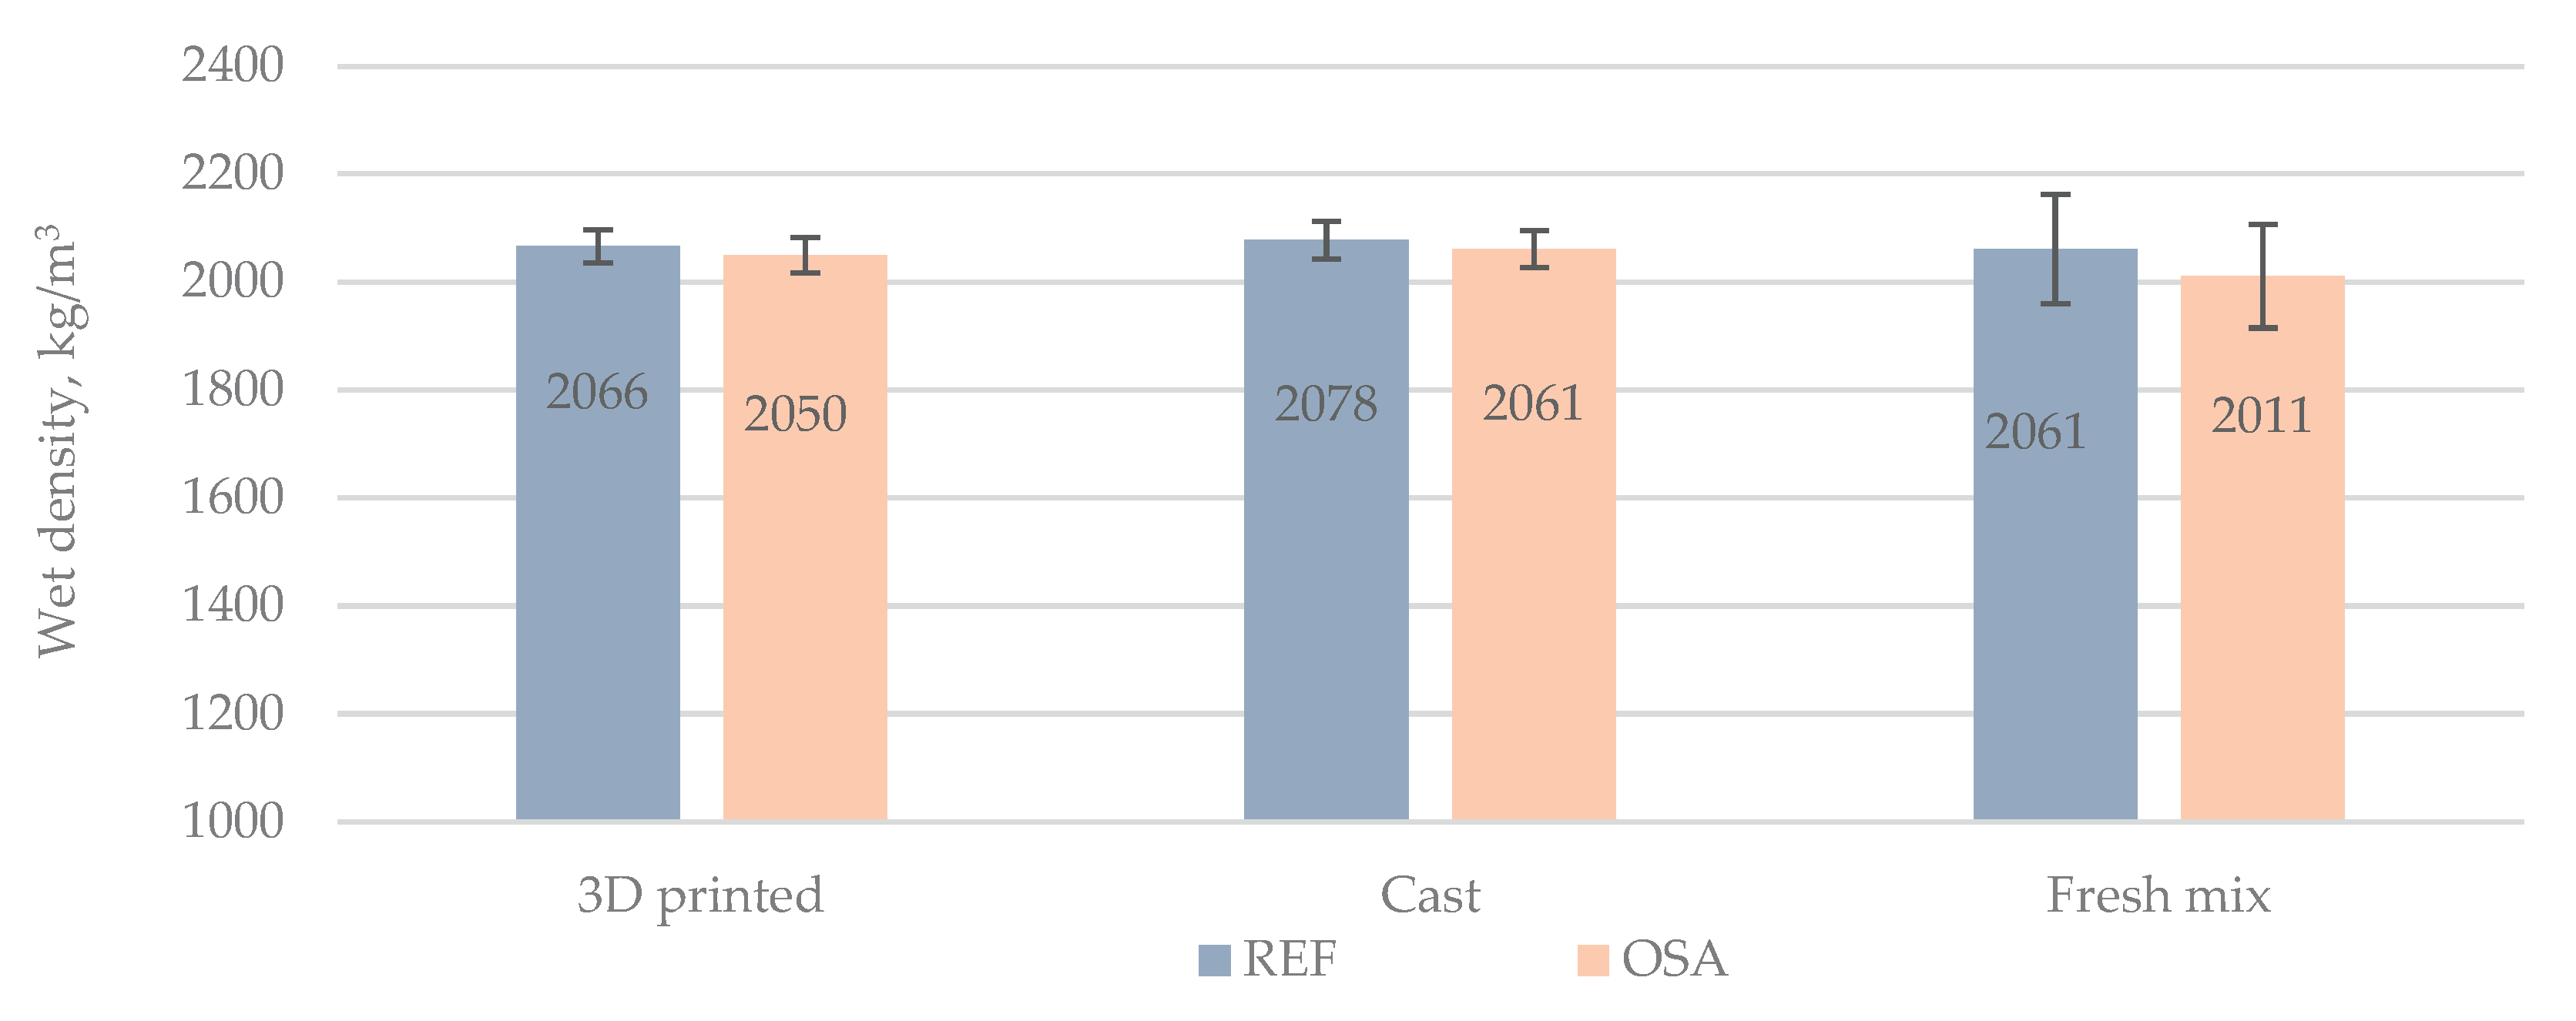
Figure 14.
Surface capillary water absorption charts.
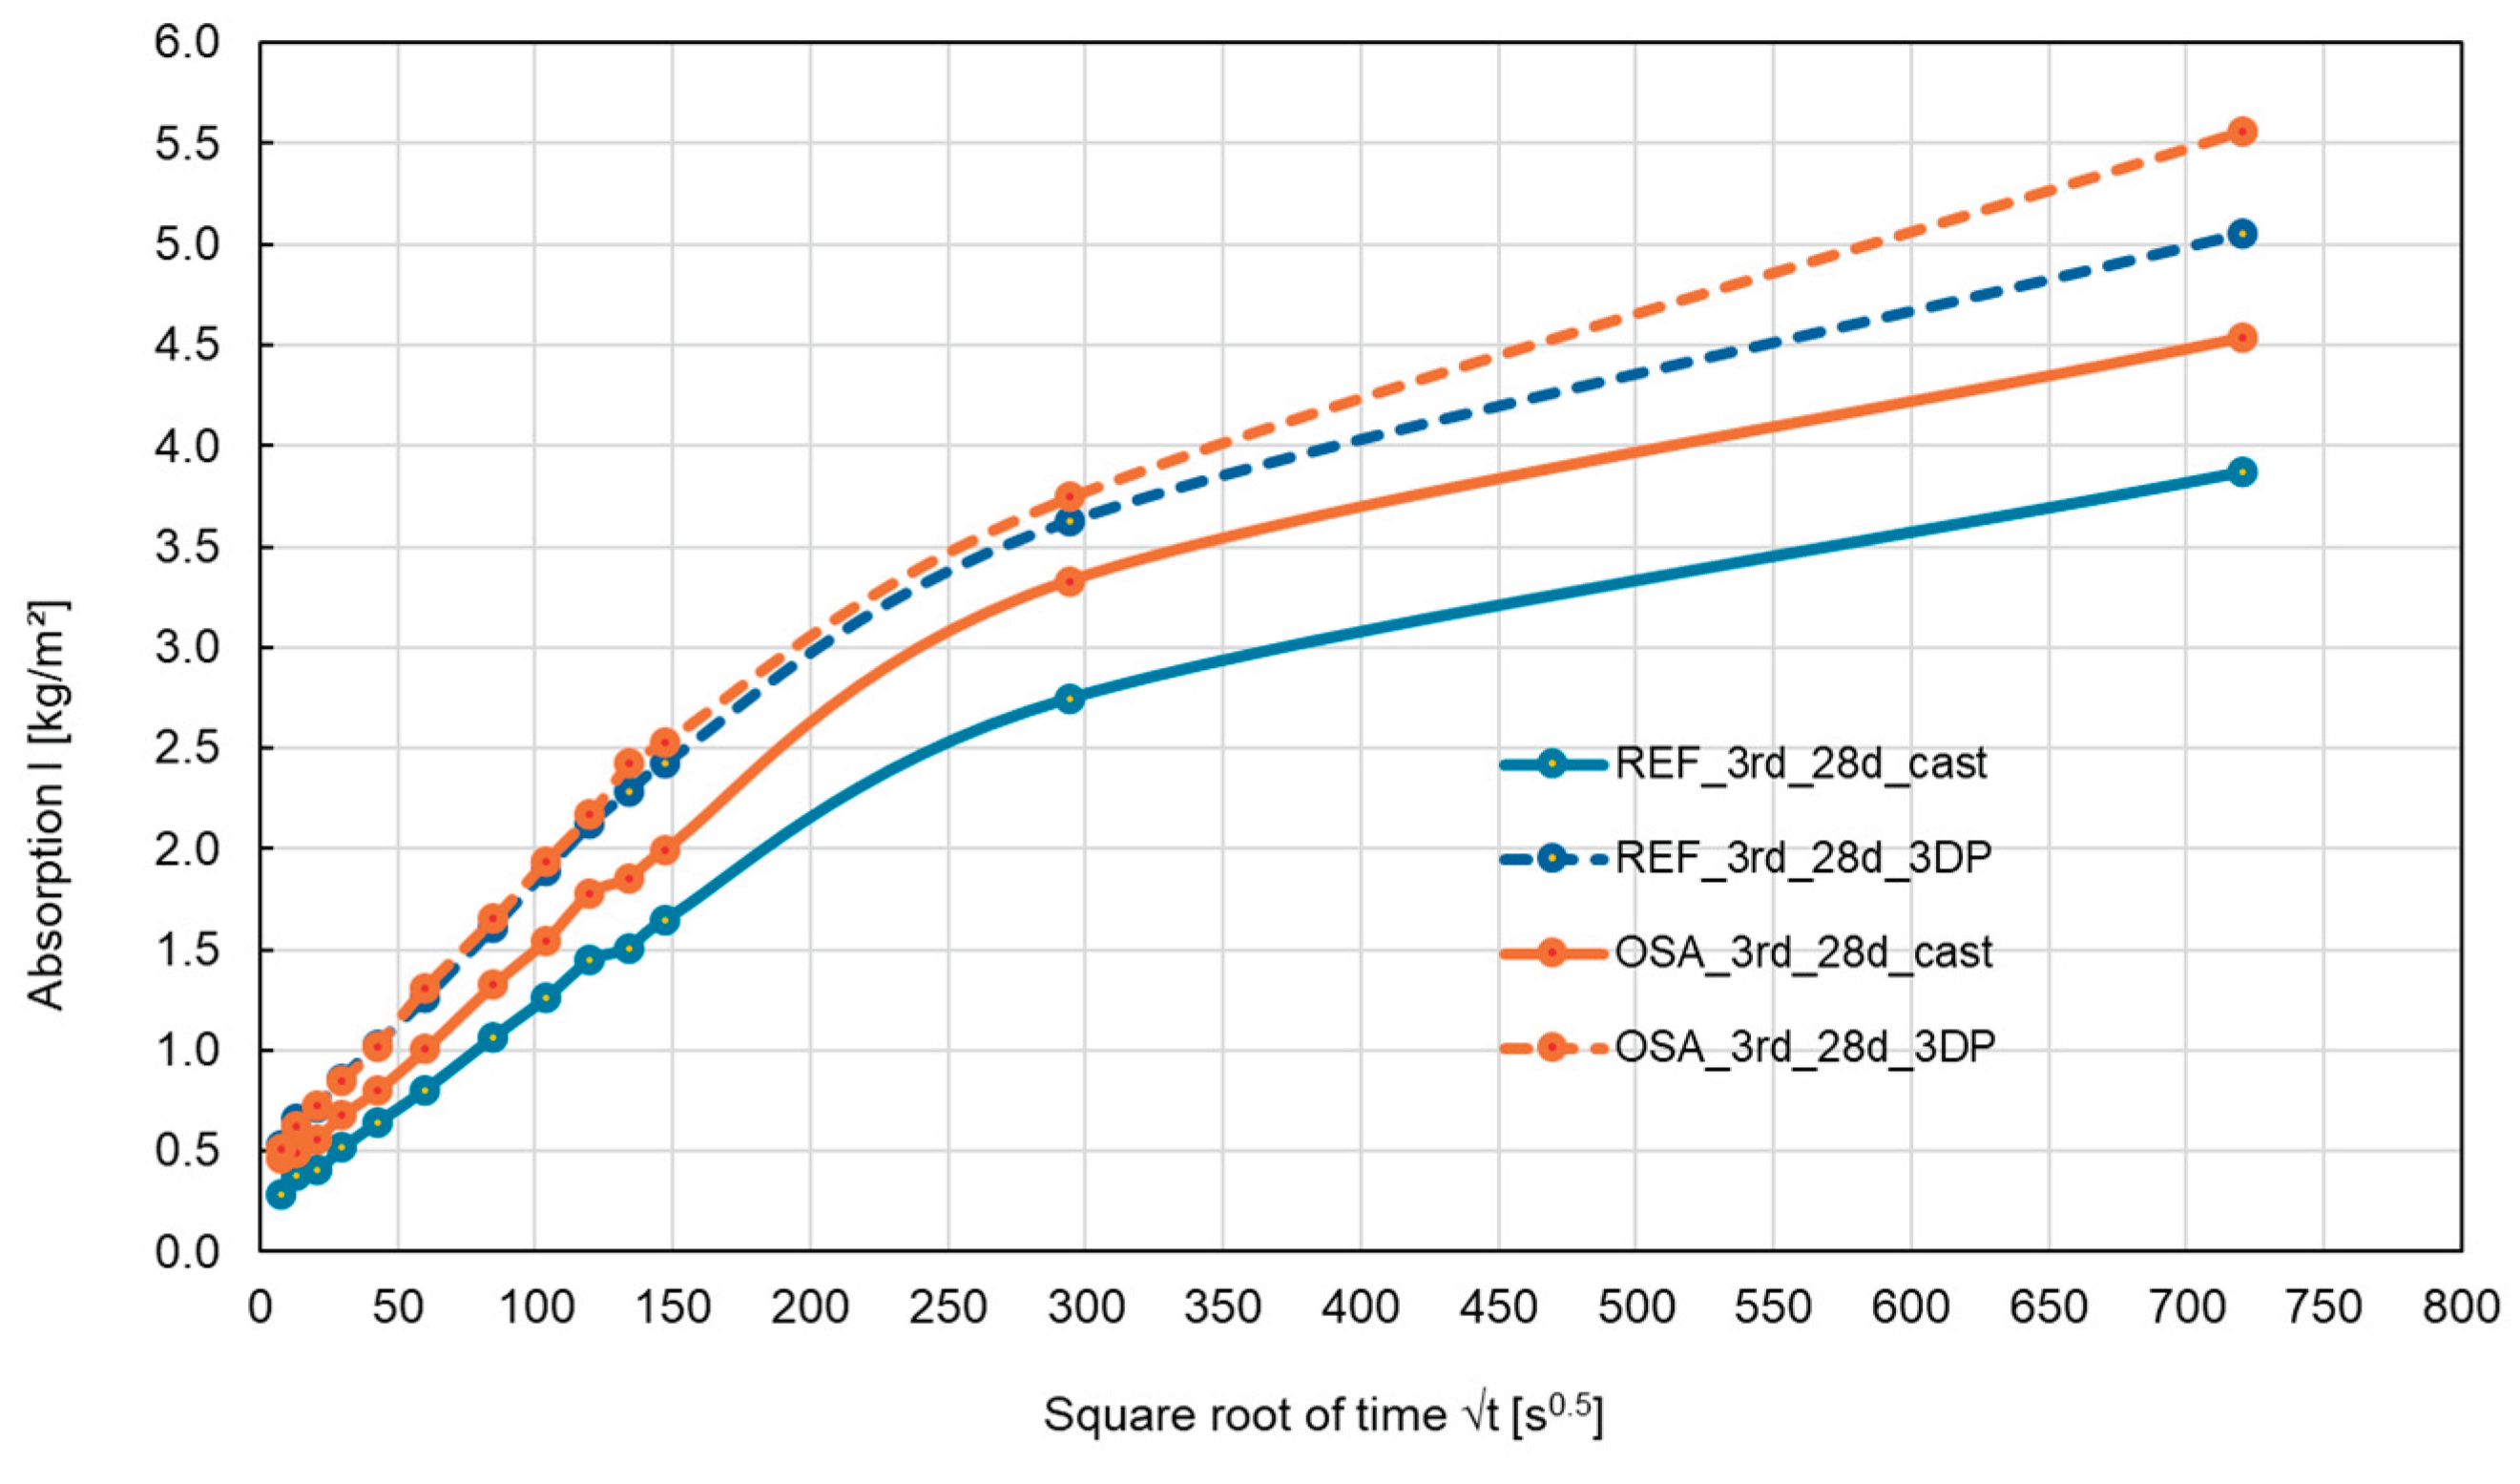
Figure 15.
The values of sorptivity index.
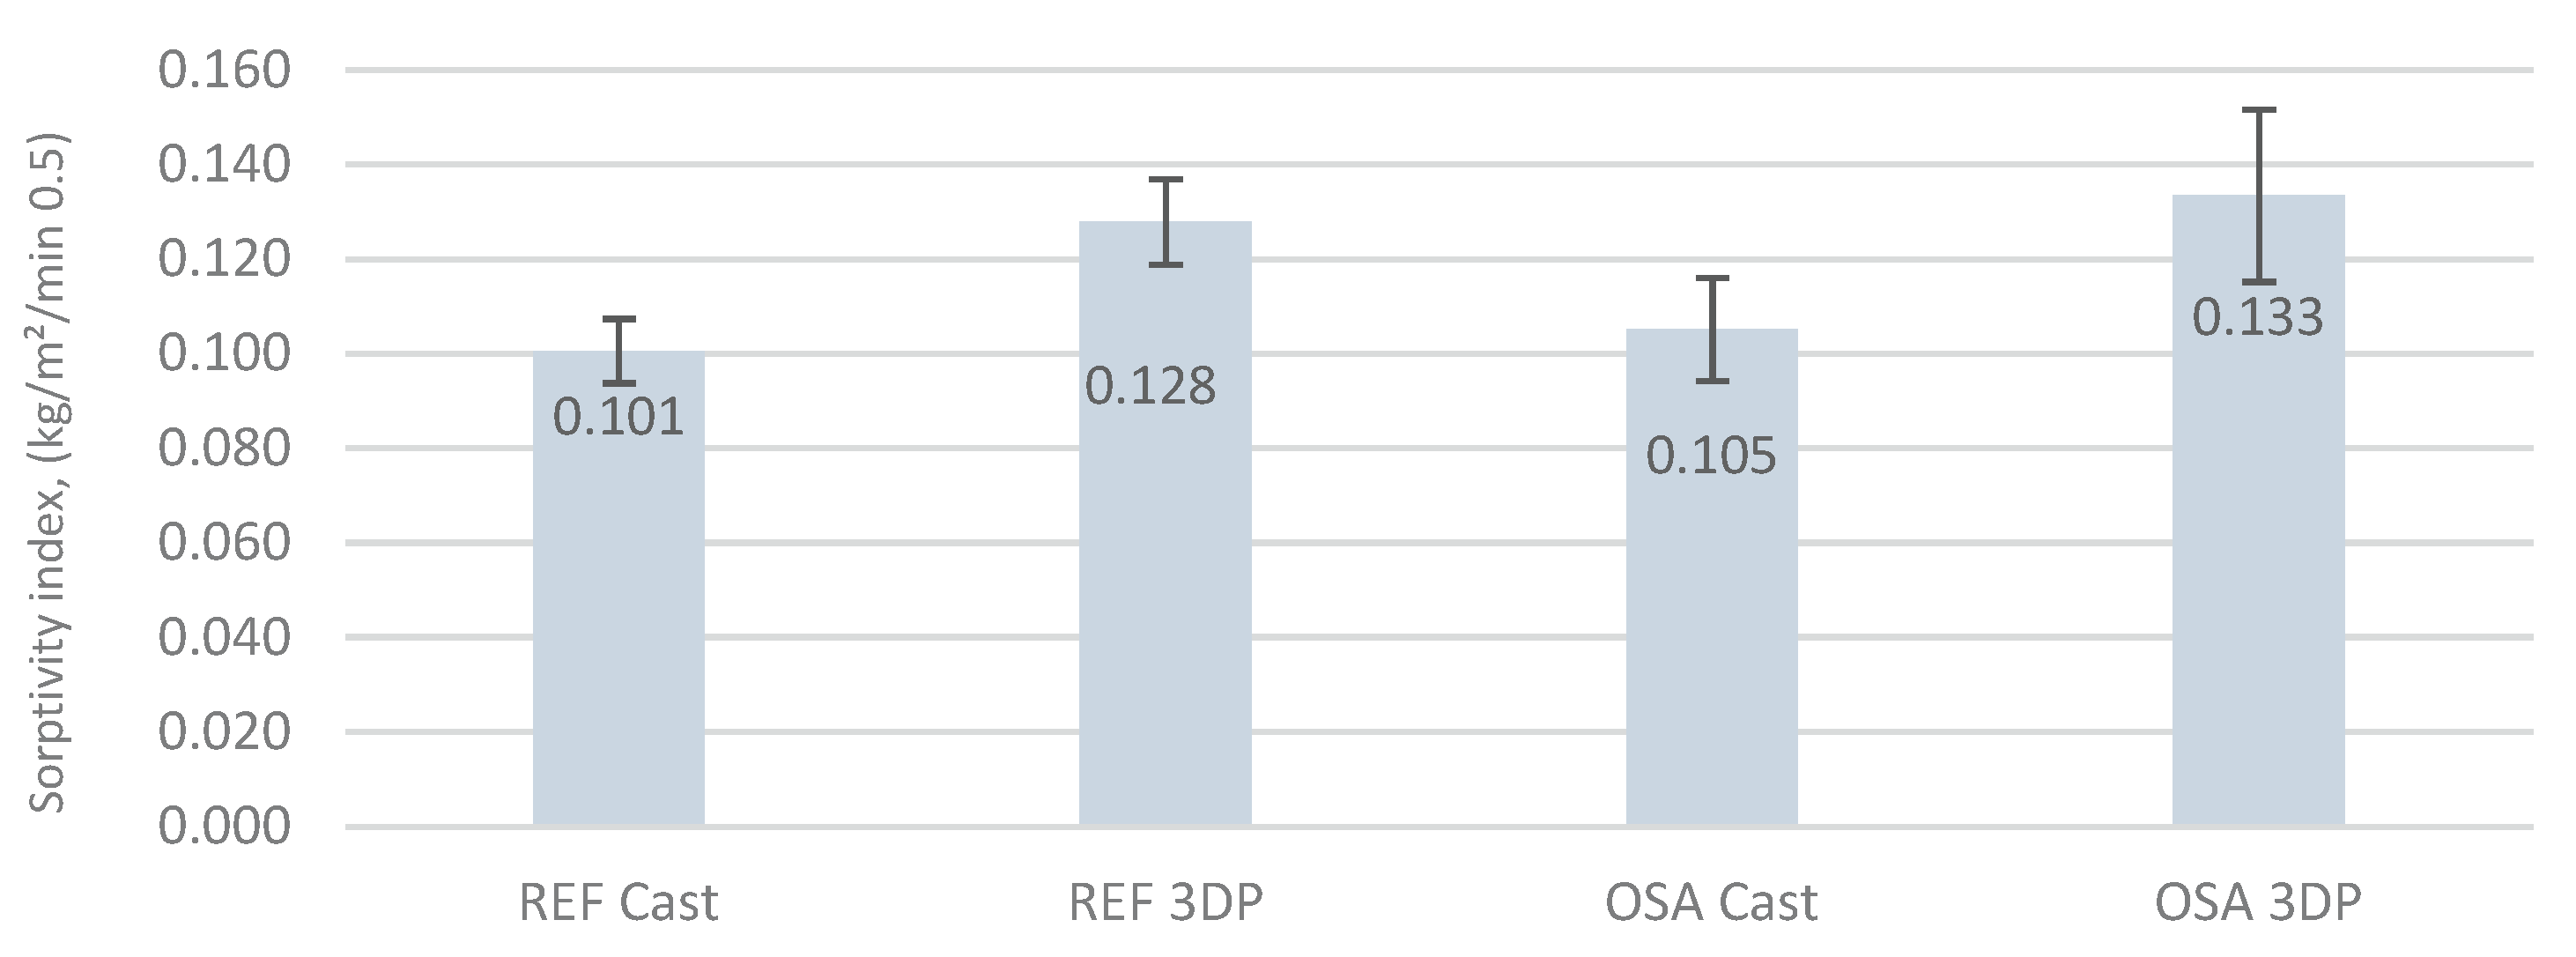
Figure 16.
Flexural strength results in v.u direction of 3D printed and cast samples.
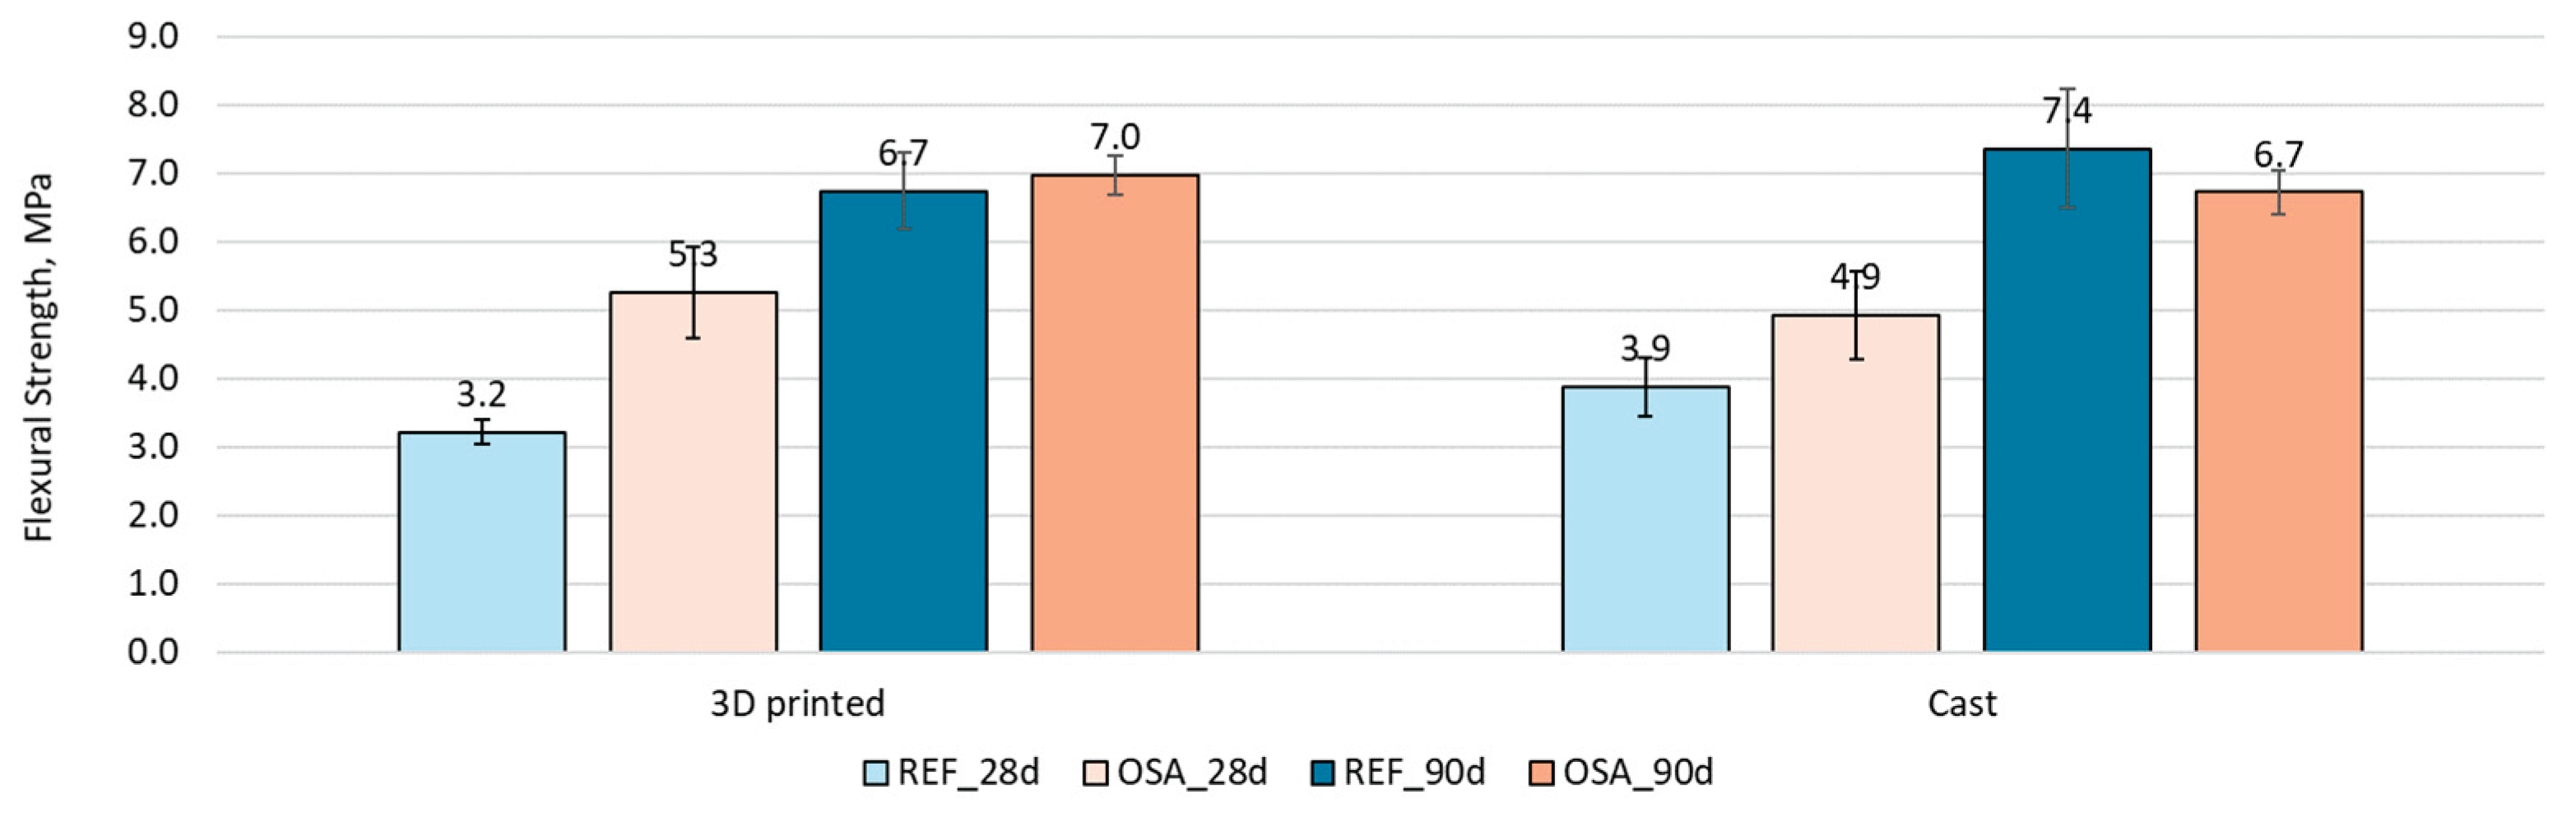
Figure 17.
Compressive strength results in w direction of 3D printed and cast samples.
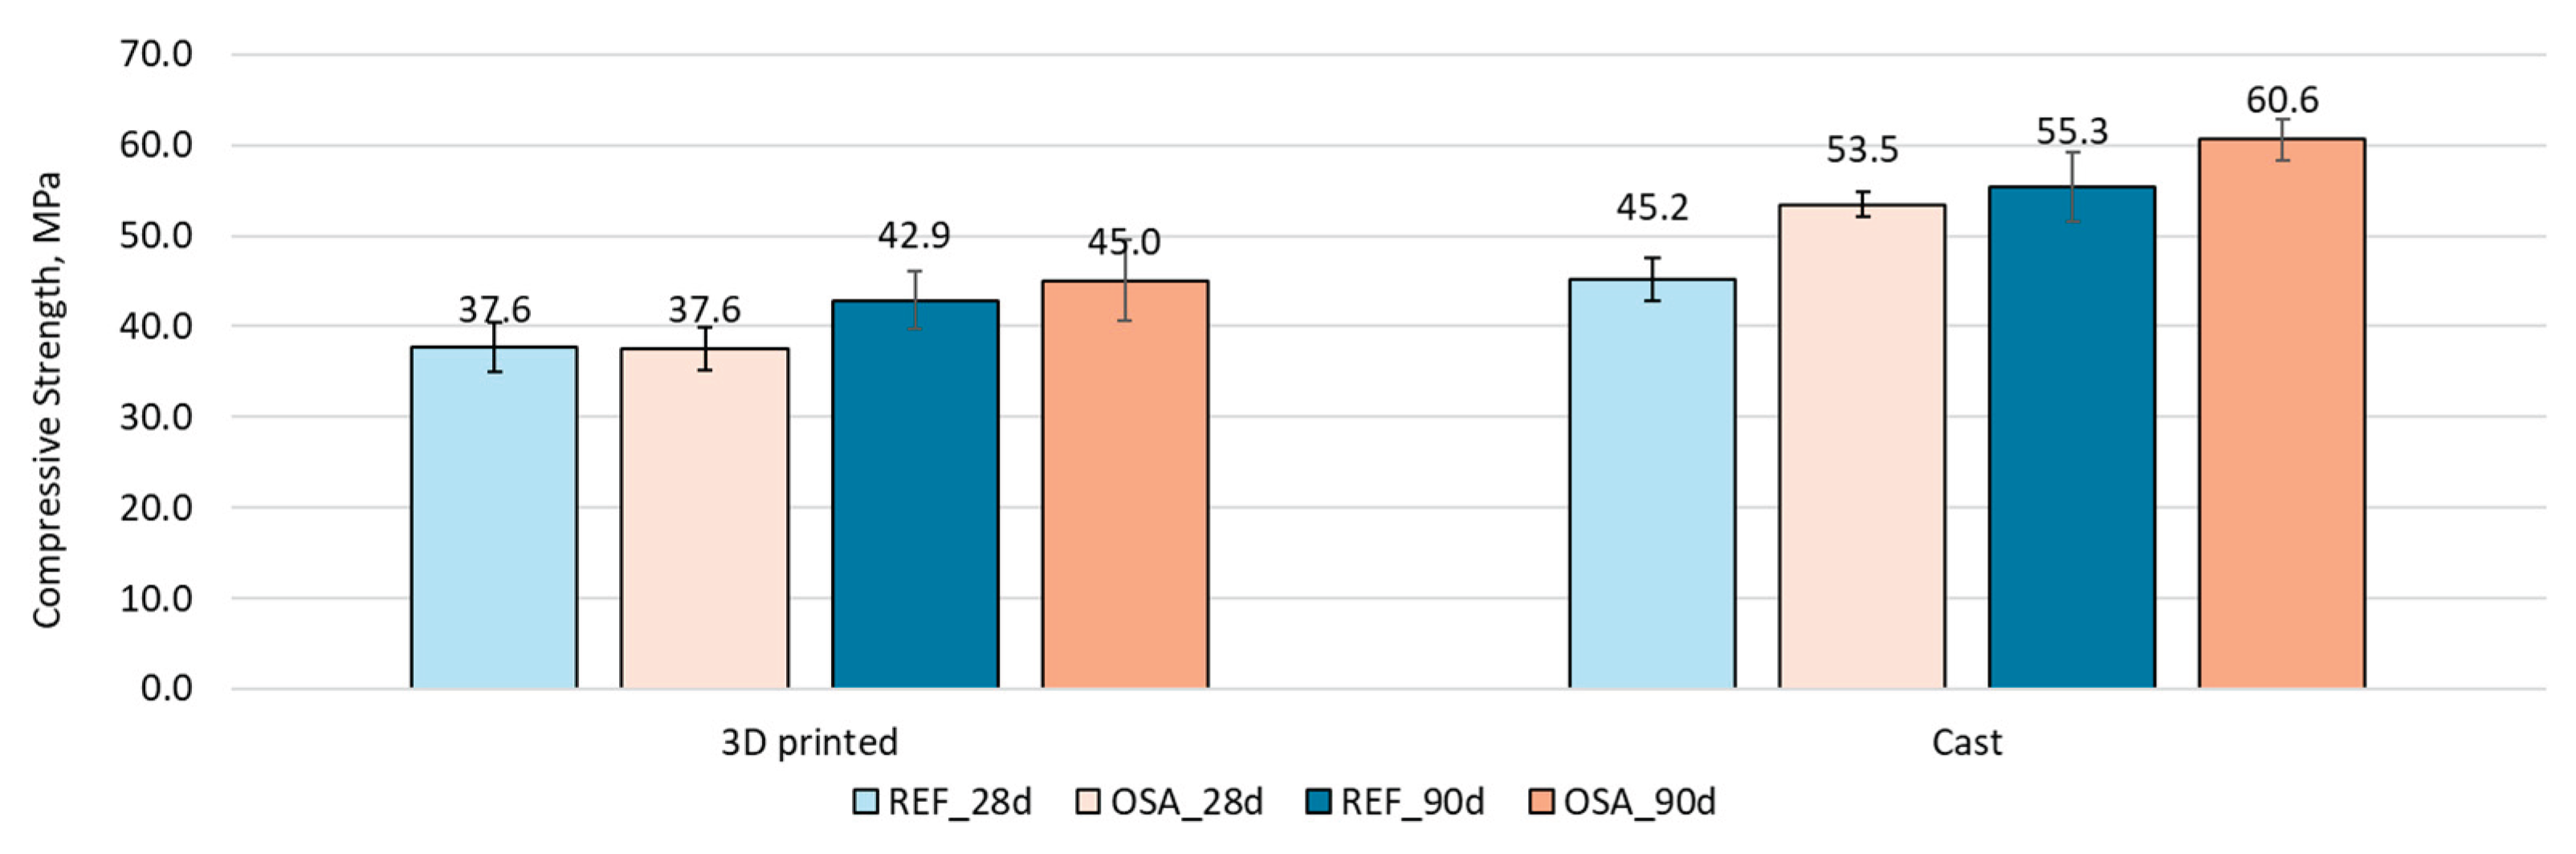
Figure 18.
Cast and 3d printed samples for frost resistance test.
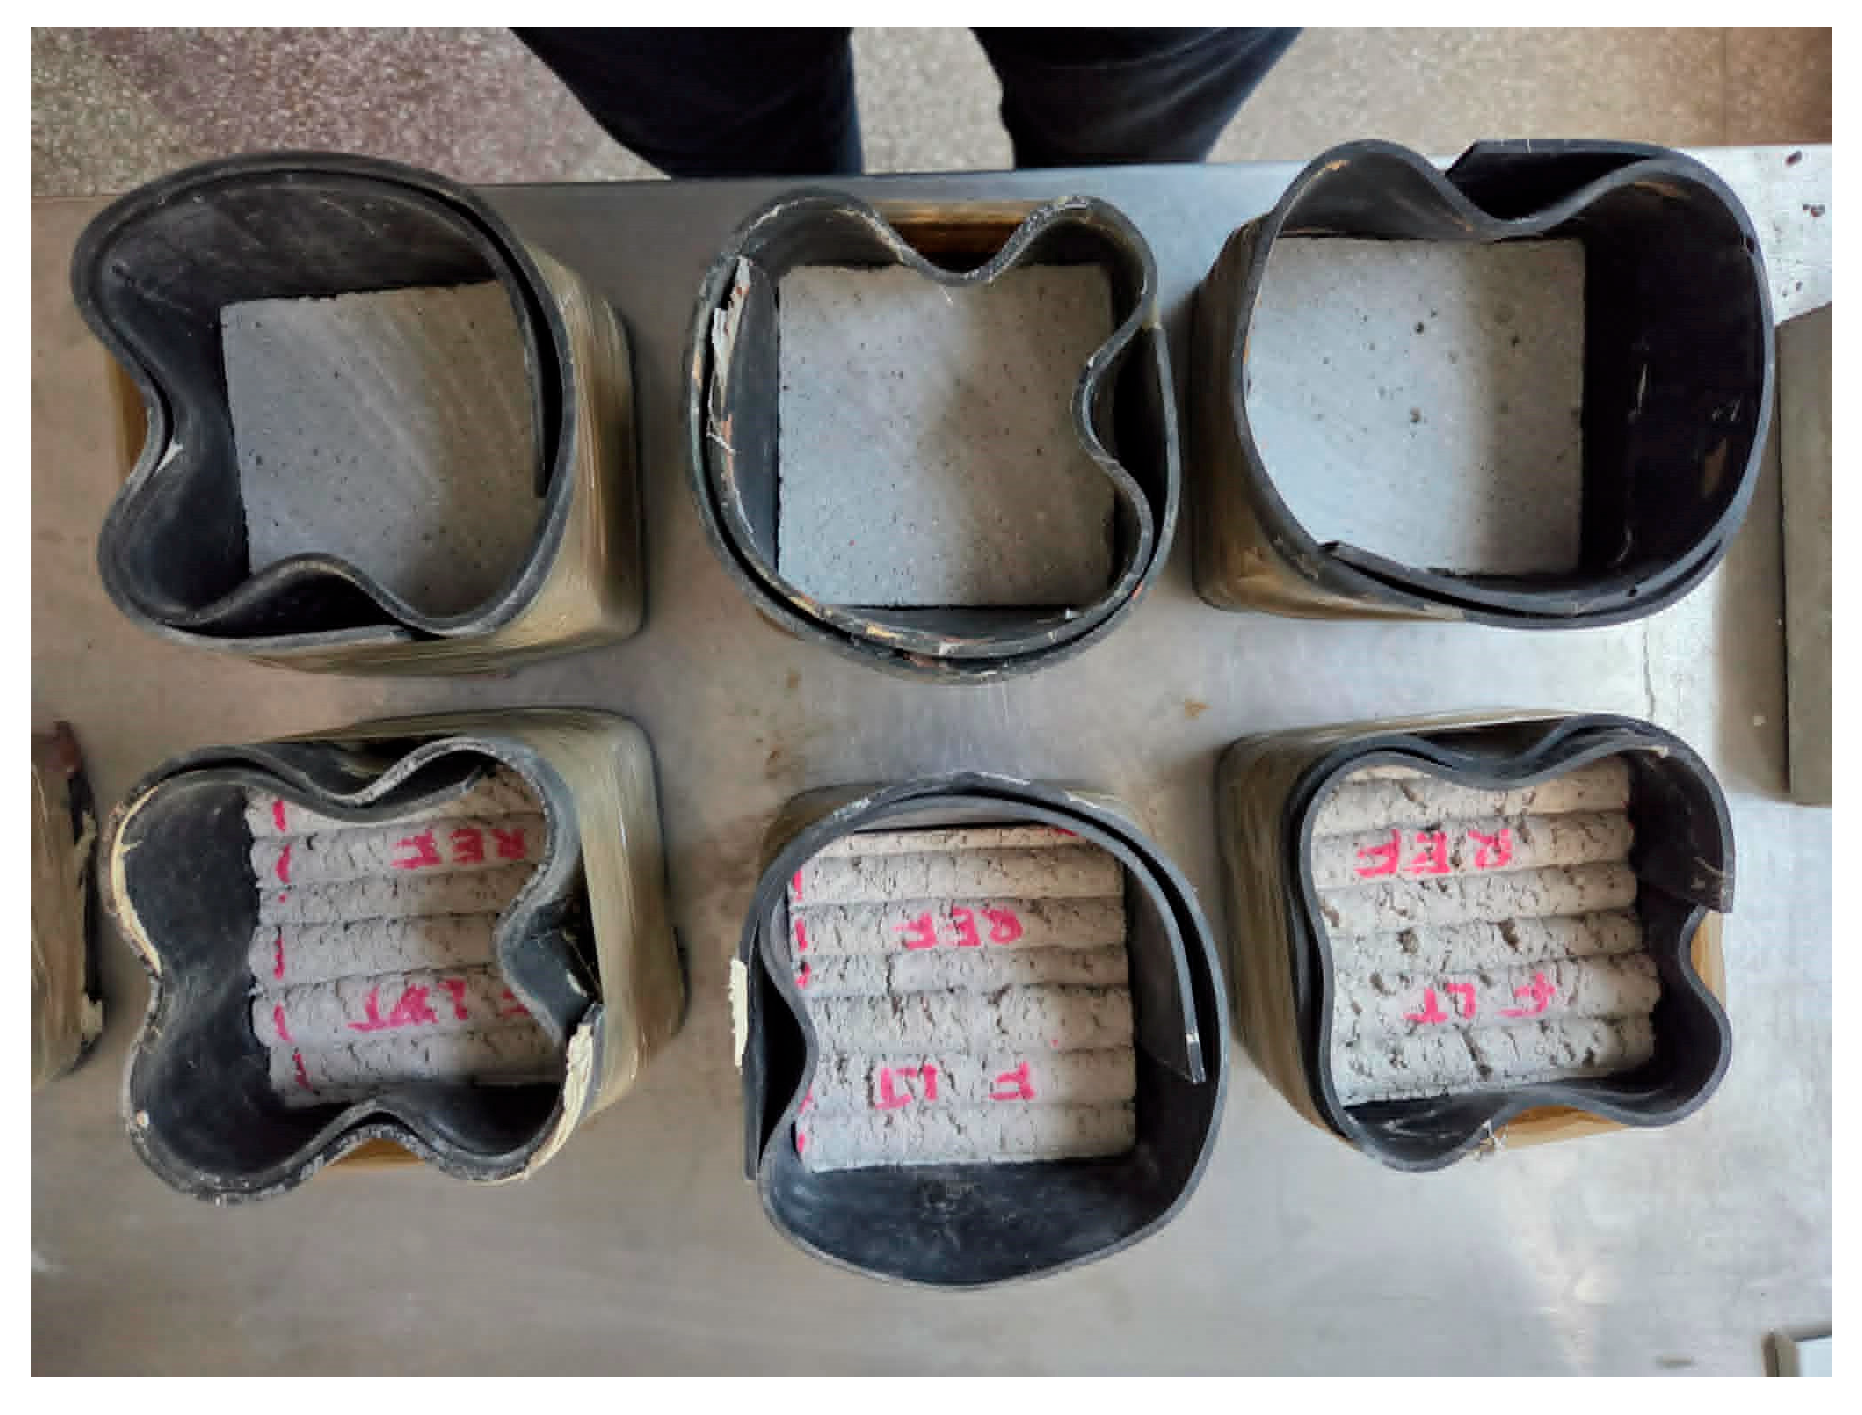
Figure 19.
Frost resistance test results: Slab test for 28 days old samples, test performed in KTU, 1 cycle per day.
Figure 19.
Frost resistance test results: Slab test for 28 days old samples, test performed in KTU, 1 cycle per day.
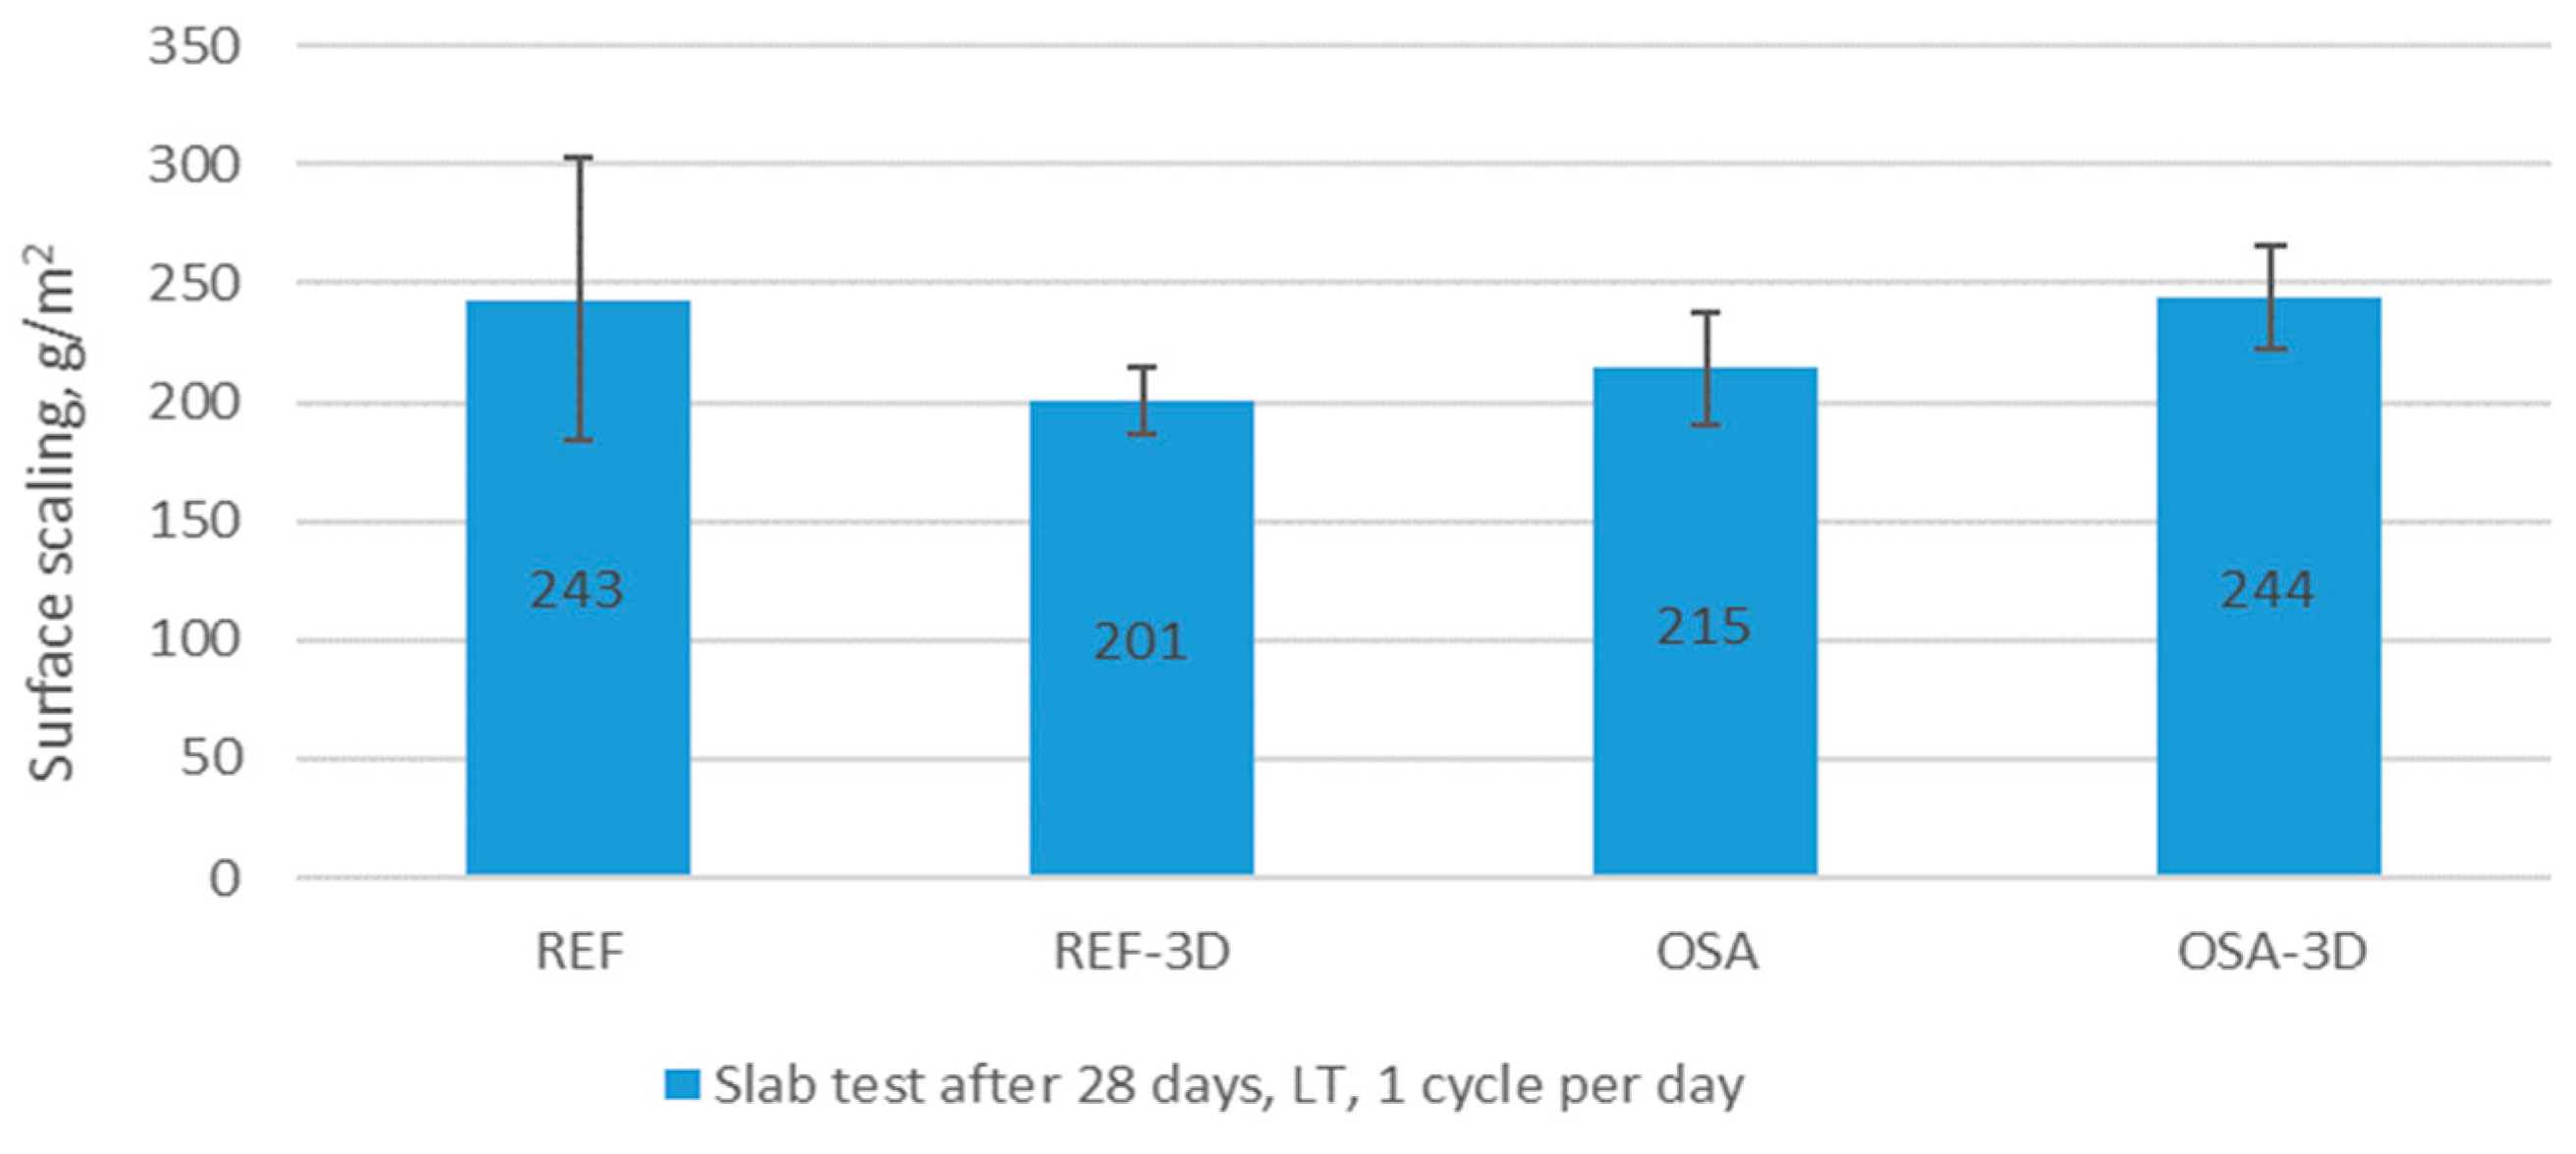
Figure 20.
Frost resistance test results: Slab test for 28 and 90 days old samples, test performed in RTU, 2 cycles per day.
Figure 20.
Frost resistance test results: Slab test for 28 and 90 days old samples, test performed in RTU, 2 cycles per day.
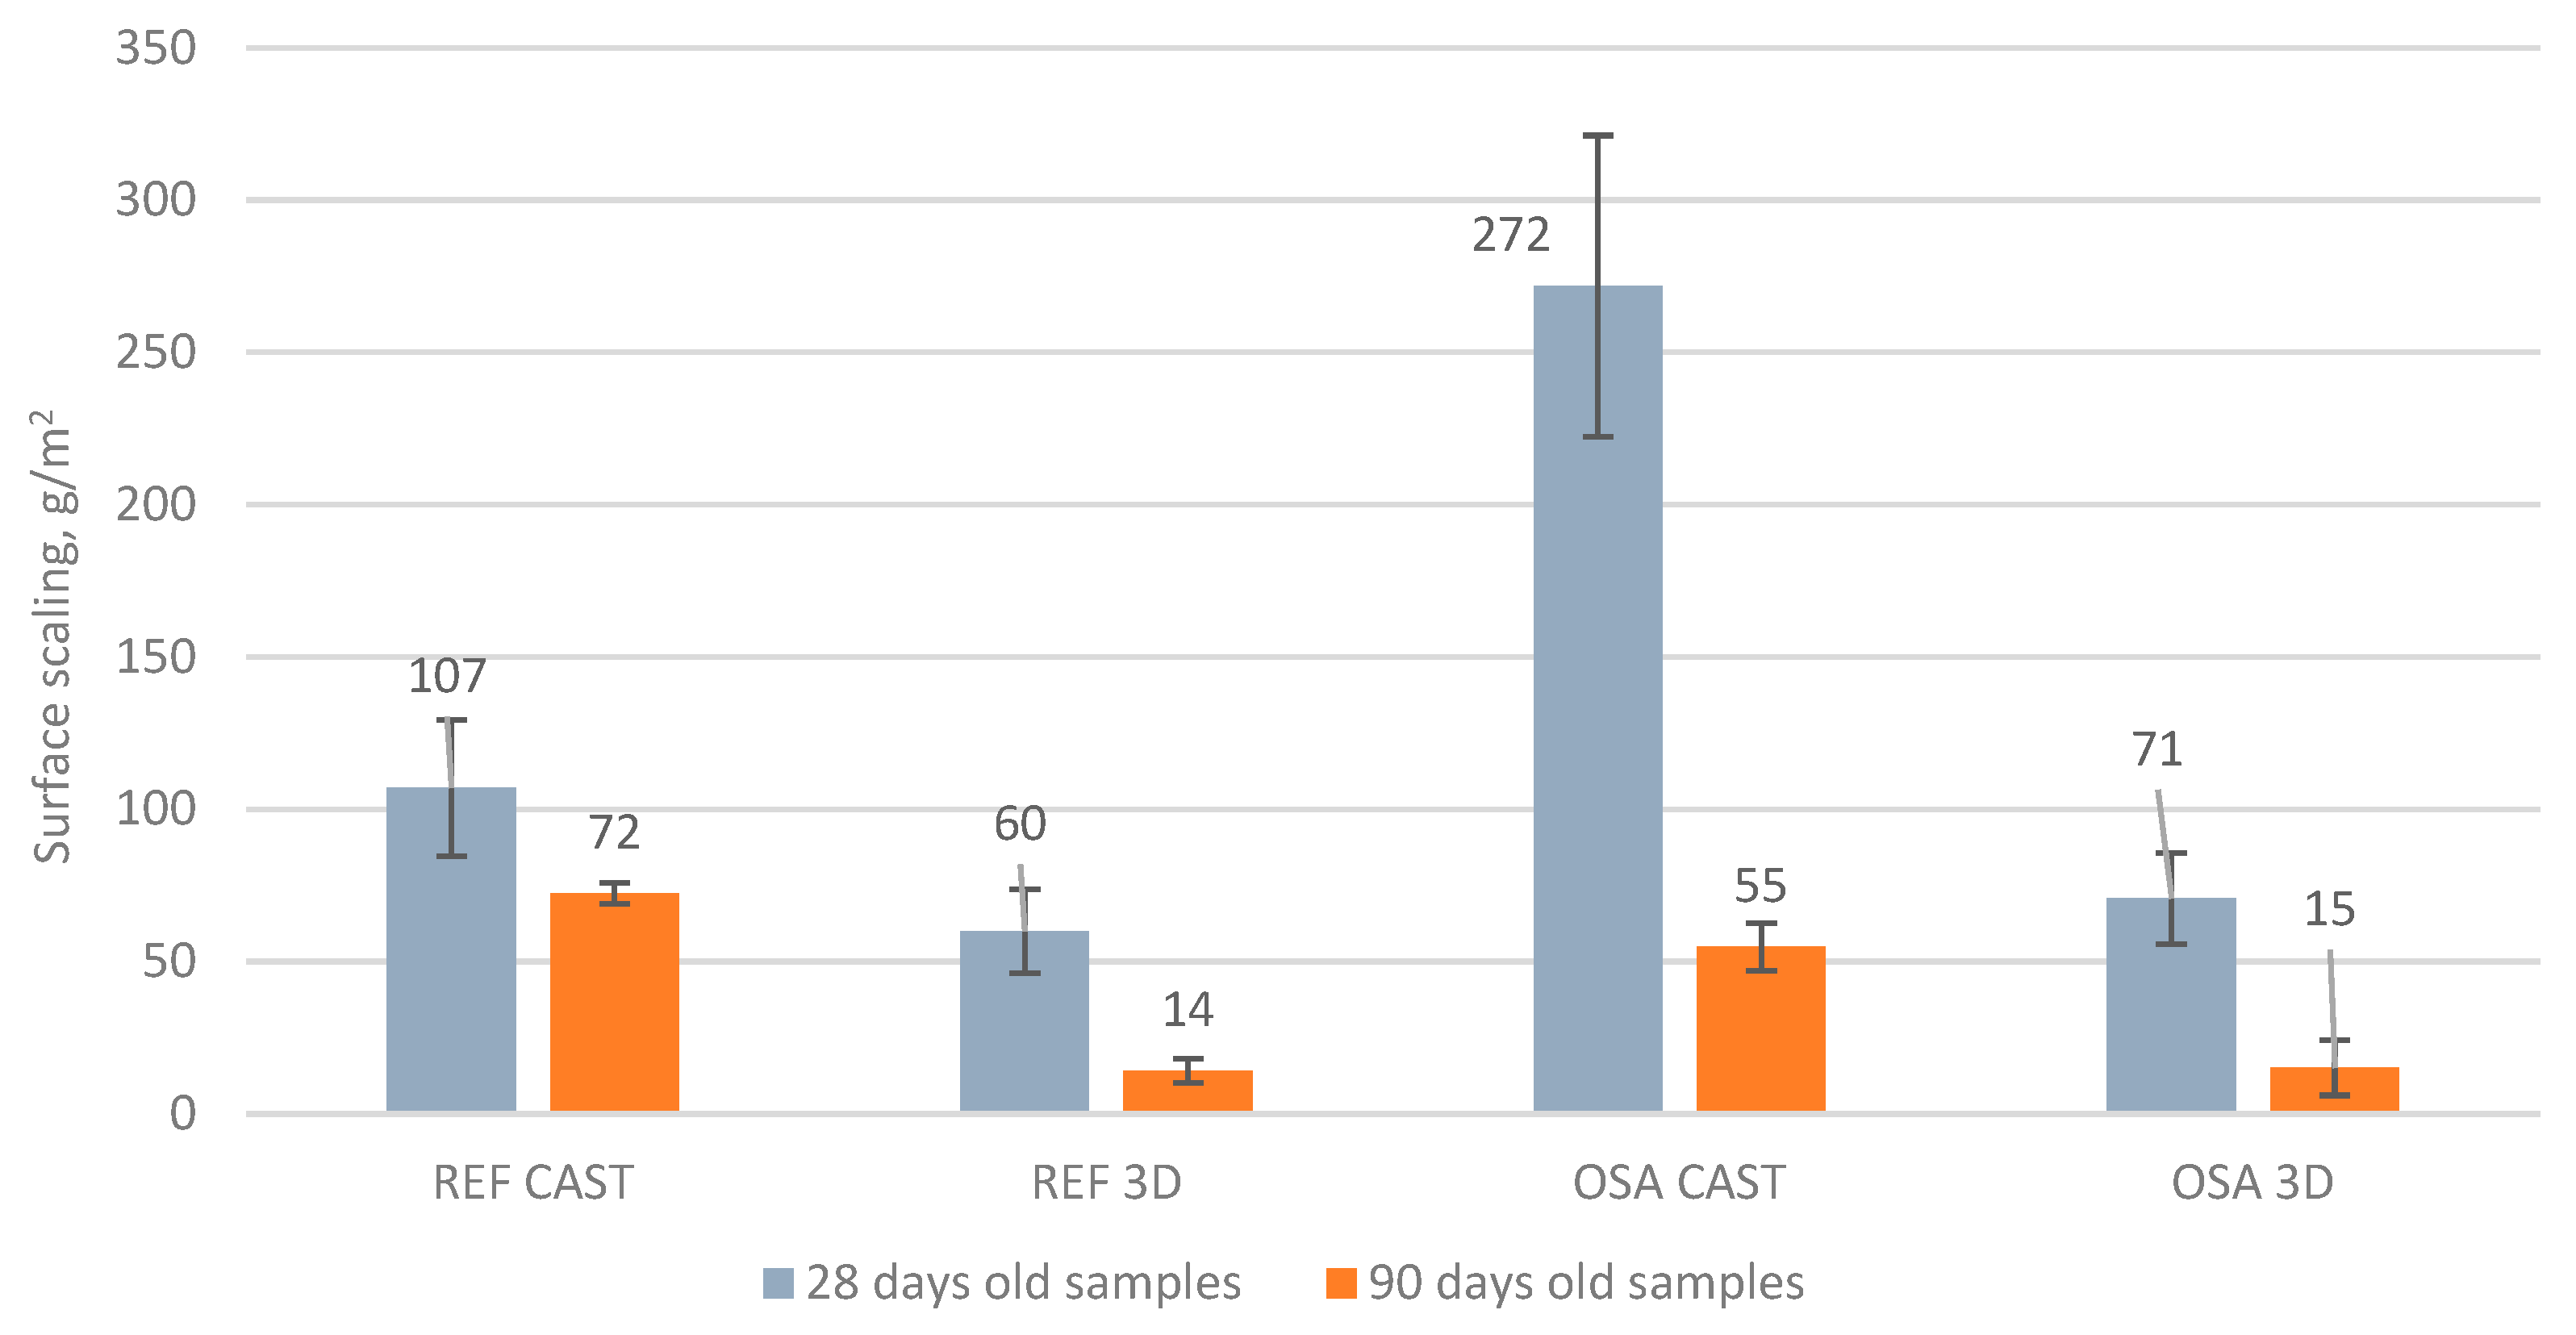

Table 1.
Basic mineral components of experimental dry mixes.
| CEM II | OSA | MK | LS | |
| Particle density, g/cm3 | 3.13 | 2.63 | 2.67 | 2.73 |
| Moisture content (wt%) | 0.3 | 0.7 | 0.0 | 0.0 |
| PSD: d10 (μm) | 1.9 | 2.1 | 0.7 | 2.3 |
| d50 (μm) | 9.7 | 9.7 | 6.5 | 18.5 |
| d90 (μm) | 28 | 39 | 50.2 | 176 |
| Specific surface area (m2 g-1) | 1.3324 | 1.3105 | 15.6109 | 2.4446 |
Table 2.
Binding material chemical composition [22].
Table 2.
Binding material chemical composition [22].
| SiO2 | Al2O3 | Fe2O3 | CaO | MgO | SO3 | Na2O | K2O | TiO2 | P2O5 | LOI | |
| CEM II | 21.8 | 5.8 | 3.6 | 58.6 | 3.1 | 2.0 | 0.30 | 0.8 | 0.2 | 0.1 | 3.40 |
| MK | 50.2 | 42.7 | 1.5 | 0.4 | 0.5 | 0.13 | - | 0.3 | 1.4 | 0.1 | 2.70 |
| OSA | 28.6 | 10.5 | 3.4 | 33.6 | 4.6 | 7.5 | 0.4 | 3.5 | 0.4 | 0.1 | 6.8 |
| LS | 2.6 | 2.2 | 0.4 | 49.8 | 1.8 | 0.1 | 0.4 | 0.3 | - | - | 42.1 |
Table 3.
Basic mix compositions.
| Mix name | CEM II | OSA | MK | LS | AEA | SP | VMA | Sand | Fibre | Sum, g |
| Dry composition, g per 1 kg of dry mix | ||||||||||
| REF | 333 | - | - | 83.1 | 0.05 | 1.66 | 0.03 | 582 | 0.50 | 1000 |
| OSA | 200 | 83.1 | 49.9 | 83.1 | 0.05 | 1.66 | 0.03 | 582 | 0.50 | 1000 |
| Dry composition, parts related to cement | ||||||||||
| REF | 1.00 | - | - | 0.25 | 0.0001 | 0.0050 | 0.0001 | 1.75 | 0.0015 | 3.00 |
| OSA | 0.60 | 0.25 | 0.15 | 0.25 | 0.0001 | 0.0050 | 0.0001 | 1.75 | 0.0015 | 3.00 |
Table 4.
Fresh mix properties and buildability characteristics.
| REF | OSA | |
| Nozzle diameter, mm | 25 | 25 |
| Slug mass. g/1 piece | 190 – 287 | 208 – 265 |
| Line width, mm | 44.5 ± 10 | 43.8 ± 10 |
| Flow diameter at 10-15 min, mm | 175 ± 19.8 | 161 ± 11.1 |
| Flow diameter at 45 min, mm | 160 ± 12.9 | 157 ± 7.5 |
| Air content, % | 9.8 – 12.5 | 10.0 – 12.0 |
Disclaimer/Publisher’s Note: The statements, opinions and data contained in all publications are solely those of the individual author(s) and contributor(s) and not of MDPI and/or the editor(s). MDPI and/or the editor(s) disclaim responsibility for any injury to people or property resulting from any ideas, methods, instructions or products referred to in the content. |
© 2026 by the authors. Licensee MDPI, Basel, Switzerland. This article is an open access article distributed under the terms and conditions of the Creative Commons Attribution (CC BY) license (http://creativecommons.org/licenses/by/4.0/).
Copyright: This open access article is published under a Creative Commons CC BY 4.0 license, which permit the free download, distribution, and reuse, provided that the author and preprint are cited in any reuse.


