
Submitted:
04 August 2026
Posted:
05 August 2026
You are already at the latest version
Abstract
Deep saline aquifers serve as primary locations for storing large amounts of CO₂ but their injectivity faces a major threat due to salt accumulation in the reservoir pores. The research team conducts experiments to study how Brine chemistry affects salt precipitation, and they test different methods for removing these salts through laboratory experiments. The research team performed core-flooding tests on Bentheimer and Salt Wash North sandstone cores which they treated with mono- and divalent saturated (20 wt%) Brines (NaCl, KCl, CaCl₂, MgCl₂) before they injected supercritical CO₂ to create salt deposits and then tested low‑salinity Brine (0.5 wt%) and seawater (3.5 wt%) for their ability to remove these deposits. The research shows that salt deposits lead to lower porosity and permeability which causes restricted water movement and results in complete loss of injection ability. The process of salt buildup in divalent Brines generates more severe pore blocking than monovalent Brines which leads to faster CO₂ breakthrough. The research shows that low‑salinity Brine outperforms seawater for total permeability recovery because it produces recovery rates between 40.6 and 68.4 percent while seawater produces recovery rates between 7.4 and 17.2 percent under the same experimental conditions. The research establishes a direct connection between Brine chemical composition and salt formation which leads to decreased water flow through injection systems. The research methods followed identical patterns which demonstrated steady experimental results through multiple tests. The research findings received support from stable pressure values and flooding test repetition and SEM–EDX analysis which showed salt deposits forming in pores and disappearing during the treatment process. The research results demonstrate that salt buildup stands as the main factor which leads to reduced injection capacity. The study shows that low-salinity water serves as an effective treatment to restore permeability when compared to seawater.
Keywords:
carbon capture and storage
; salt precipitation
; deep saline aquifers
; injectivity impairment
; low-salinity remediation
1. Introduction
Carbon capture and storage (CCS) have become an essential strategy for reducing atmospheric CO₂ emissions, with deep saline aquifers widely recognized as one of the most promising storage options due to their large capacity and favorable geological distribution [3]. These formations are typically located at depths between 800 and 2000 m, where pressure and temperature conditions keep CO₂ in a dense supercritical state [16]. Once injected, CO₂ interacts with the in-situ Brine and the surrounding rock matrix, leading to a range of physical and chemical processes that control its movement, trapping behaviour, and long-term stability within the reservoir [6,15,19].
A key part of how CO₂ behaves in the subsurface comes down to the interfacial tension (IFT) between CO₂ and Brine. This interaction influences the capillary forces that determine how easily CO₂ can enter the pore space, move through the formation, and become trapped within the rock matrix. These effects are further shaped by reservoir characteristics such as permeability, heterogeneity, and fluid composition, which together make CO₂ flow behaviour in saline aquifers highly complex [7].
One of the most persistent challenges during CO₂ injection is salt precipitation. As CO₂ moves through the formation, water from the Brine can evaporate into the CO₂ phase, causing dissolved salts to become supersaturated and eventually crystallize within the pore space. This process alters pore geometry and reduces permeability, which can significantly impair injectivity near the wellbore [8,12]. Previous studies have shown that salt precipitation can reduce permeability by as much as 13–83% and porosity by 2–15%, highlighting the severity of this issue [4,12]. Field observations have also confirmed that even small amounts of salt accumulation can lead to pressure buildup and reduced flow capacity [24].
The extent of salt precipitation is influenced by several factors, including Brine composition, salinity, temperature, and injection conditions. Differences between monovalent and divalent ions can significantly affect how salts behave during CO₂ exposure. While these mechanisms are generally understood, there remains a need to better understand how different Brine chemistries influence both salt formation and flow behaviour under realistic reservoir conditions.
To address injectivity impairment, several remediation strategies have been proposed, including low-salinity brine flushing, seawater injection, and chemical treatments designed to dissolve or prevent salt formation. Previous studies suggest that such approaches can help restore permeability, especially when applied at the early stages of salt precipitation [10]. However, much of the existing work relies on modelling or focuses on single-fluid systems, making it difficult to directly compare the effectiveness of different remediation approaches under consistent experimental conditions.
There is limited experimental evidence that directly compares how different brine chemistries influence both the extent of salt precipitation and the effectiveness of remediation fluids within real porous media. This creates a gap in understanding how injectivity impairment develops and how it can be managed in practical CO₂ storage operations.
This study addresses this gap through controlled core-flooding experiments designed to investigate both salt precipitation and remediation behaviour. Experiments were carried out on Bentheimer and Salt Wash North sandstone cores saturated with brines containing NaCl, KCl, CaCl₂, and MgCl₂ at formation-representative concentrations. By examining both monovalent and divalent brine systems under identical conditions, this work provides a direct comparison of how brine chemistry influences injectivity loss and recovery.
Two remediation fluids, low-salinity brine and seawater, were then introduced after the onset of salt precipitation to evaluate their ability to restore permeability and reopen blocked pore pathways. This allows for a systematic assessment of remediation effectiveness based on measurable changes in differential pressure, porosity, permeability, and CO₂ flow behaviour.
The specific objectives of this study are to:(1) examine how different brine compositions influence salt precipitation during CO₂ injection,(2) quantify the resulting changes in porosity, permeability, and differential pressure, and(3) evaluate the effectiveness of low-salinity brine and seawater in restoring injectivity after salt blockage.
2. Materials and Methods
2.1. Materials Used
Two types of Sandstone—Bentheimer and Salt Wash North—were selected as representative porous media for the experimental programme. Each cylindrical core had a nominal diameter of approximately 1 inch and a length close to 3 inches. Their baseline porosity and permeability ranges, as provided by the supplier in Table 1, reflected the relatively homogeneous nature of these formations and their suitability for controlled flow experiments.
Bentheimer sandstone is a well-characterized, highly homogeneous quartz-rich rock with high permeability and relatively large pore throats, making it suitable for controlled flow experiments. In contrast, Salt Wash North sandstone exhibits lower permeability and greater mineralogical heterogeneity, with higher clay and feldspar content. These differences in pore structure and mineral composition can influence fluid flow behaviour, salt precipitation patterns, and permeability reduction during CO₂ injection.
The values presented are representative ranges obtained from manufacturer specifications and are provided to give context for the expected behaviour of the core materials used in this study. High-purity CO₂ (99 percent), nitrogen, and helium were used throughout the work. Helium served as the working gas for porosity determination via helium porosimetry, while nitrogen provided back-pressure control in the core flooding system. To replicate the ionic composition found in natural formation brines, analytical-grade NaCl, KCl, CaCl₂, and MgCl₂ salts were dissolved to prepare brine solutions at the desired concentrations. All salts were sourced from reputable laboratory suppliers to ensure consistency in chemical behaviour.
2.2. Apparatus and Procedure
2.2.1. Brine Preparation and Core Sample Saturation
Brines were formulated at a mass concentration of 20 wt% to encourage substantial salt precipitation during CO₂ flooding [12,13]. Each solution was created by dissolving the required quantity of salt in deionized water under continuous stirring until complete dissolution was achieved. Before saturation, core samples underwent standard cleaning using Soxhlet extraction, followed by oven-drying to remove residual solvents and moisture. Porosity measurements were taken on dried samples using helium porosimetry. External saturation of the cores was conducted in a vacuum chamber to promote full brine infiltration [11]. Samples were submerged in the brine solution under vacuum conditions for 24 hours, allowing trapped air to escape and ensuring near-complete pore saturation. After removal, samples were wrapped to prevent premature CO₂ contact with the Viton sleeve during equipment assembly.
2.2.2. Core Flooding Setup
All experiments were carried out using a laboratory core-flooding system designed to maintain precise temperature, pressure, and flow-rate control. After placement of the saturated core in the core holder, the sample was enclosed in a Viton sleeve and housed within an externally heated jacket. The system temperature was set to 45°C to maintain CO₂ in the supercritical region throughout the experiment. Overburden pressure was applied hydraulically at 2500 psig to prevent mechanical failure of the core and to ensure appropriate confining stress. The pore-pressure boundary at the outlet was controlled using a back-pressure regulator set to 1500 psig. A syringe or Eldex-type pump delivered CO₂ from a high-pressure cylinder at a steady rate of 3mL/min. The effluent system included a gas-liquid separation arrangement: displaced brine was collected in an airtight receiver, while CO₂ gas was routed into a calibrated gas meter for volume measurement. Differential and upstream pressures were continuously recorded using pressure transducers integrated into the data logging system.
2.2.3. Injection and Induction of Salt Precipitation
Following system stabilization, supercritical CO₂ was introduced to the saturated core. The advancing CO₂ front displaced brine through the pore space, driving water evaporation into the CO₂ phase and increasing the salt concentration within the residual brine. When the brine reached supersaturation, crystallization occurred, leading to pore constriction and an observable rise in differential pressure. CO₂ injection continued until a clear precipitation-induced restriction developed, signaled by sustained elevated pressure gradients and reduced effluent flow. This marked the transition point for initiation of the remediation stage.
2.2.4. Remediation Fluid Injection
Once a clear decline in permeability was observed, CO₂ injection was stopped and the remediation fluid was introduced through a separate accumulator. Two fluids were tested: a low-salinity brine (0.5 wt%) and seawater (3.5 wt%). In each case, a volume equivalent to 10% of the core’s pore space was injected.
This choice was guided by previous studies, which have shown that relatively small injection volumes, typically in the range of 5–20% pore volume, can be sufficient to dissolve precipitated salts and restore flow [17,21]. In this study, 10% was selected as a practical midpoint. It provides enough contact with the deposited salts while avoiding unnecessarily large volumes that could disturb the overall flow behaviour.
Although a formal sensitivity analysis was not carried out, the results suggest that this volume was effective under the conditions tested. The reduction in differential pressure and the corresponding recovery in permeability both point to successful salt removal. For example, low-salinity brine restored permeability by approximately 40.6–68.4%, indicating that the injected volume was sufficient to reopen blocked pathways.
At the same time, it is unlikely that a single slug size will be optimal across all conditions. The required volume is expected to vary depending on factors such as brine composition, the extent of salt accumulation, and the characteristics of the rock. In systems with more severe blockage or uneven flow distribution, larger or repeated injections may be necessary. For this reason, while 10% pore volume provides a practical and well-supported starting point, further work is needed to understand how remediation performance responds to changes in slug size, particularly when scaling up to field conditions.
2.2.5. Post-Flood Measurements and Sample Reconditioning
At the end of each flooding cycle, the experimental system was depressurized in a controlled manner. The core was removed, dried, and re-measured for porosity and permeability to evaluate changes relative to the initial state. These measurements provided quantitative evidence of pore-scale alteration caused by salt precipitation and its partial reversal following remediation. Before reuse in subsequent tests, cores underwent extended Soxhlet extraction at mild temperatures to ensure complete salt removal and to restore pore structure as closely as possible to baseline conditions.
Figure 1.
Schematic representation of the core-flooding system outlining the remediation experiment.
Figure 1.
Schematic representation of the core-flooding system outlining the remediation experiment.
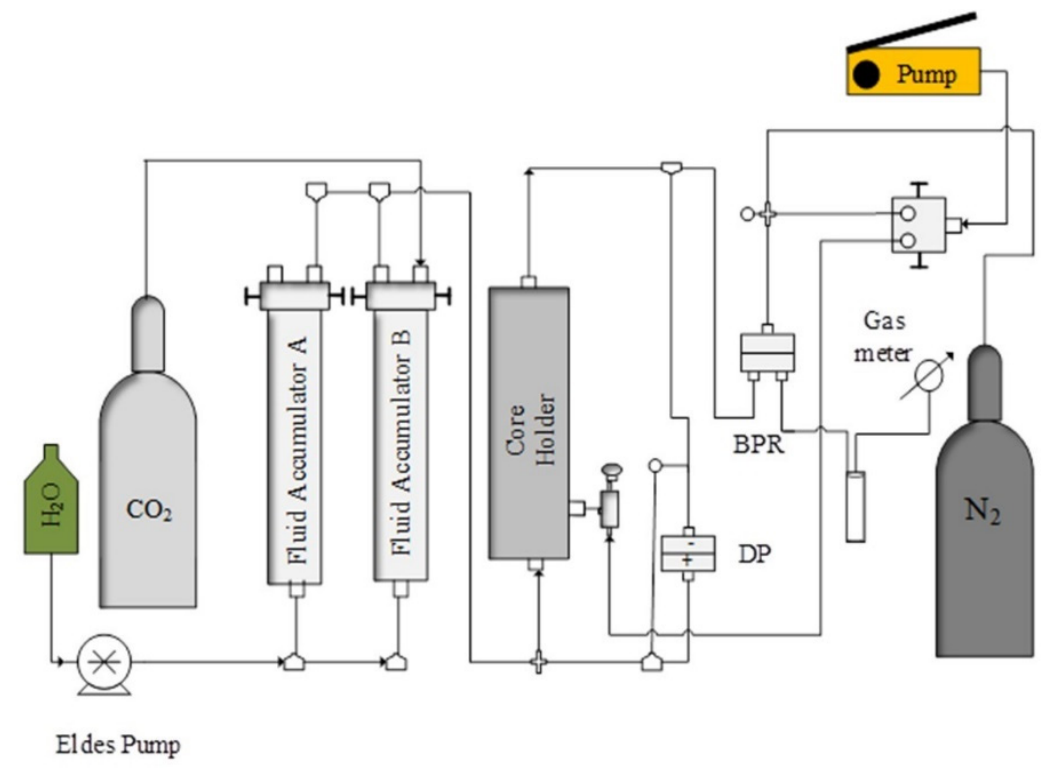
In general, a remediation slug size of 10 percent pore volume was selected based on previous research, which showed that small preflush volumes (typically 5 to 20 percent PV) were sufficient to dissolve precipitated salts [14,17,21]. The selection is also supported by the results of preliminary tests carried out within the framework of the current study, which showed that a 10 percent PV size is sufficient to remove salt without the diminishing returns associated with larger slug volumes. The selected temperature, pressure, and flow rate were chosen to represent typical near-wellbore conditions in deep-saline aquifers while maintaining controlled laboratory reproducibility. Each experiment was performed under controlled and repeatable conditions to ensure consistency in pressure response and flow behaviour across different brine systems.
The research did not include detailed mineralogical analysis or pore size distribution testing during this study. The supplier together with academic sources provides the data which researchers use to display basic information about these materials instead of showing exact values from specific samples. Scientists need to conduct detailed evaluations of pore structures and mineral components to enhance their understanding of rock-fluid interactions while they should focus on this subject for upcoming research initiatives.
The core samples from Bentheimer and Salt Wash North show different characteristics which originate from their distinct petrophysical properties. The rock Bentheimer sandstone contains better permeability and expanded pore system which enables CO₂ to flow through the rock in a consistent pattern. The process probably extends the time before pores become blocked while creating a slow progression of changes in how the fluid moves. The Salt Wash North sandstone responds at a faster rate to salt build-up because it contains tight pore structures and diverse mineral content. The samples demonstrate this through their increased flow blockage and elevated pressure differences between two points in the system.
The research findings demonstrate that rock characteristics control the intensity of injectivity loss and determine how well remediation methods will perform. The way fluids behave in similar conditions will produce different results because of variations in pore structure and mineral composition. The assessment process requires scientists to evaluate their laboratory findings because these results will show different patterns when scientists study field-based samples.
3. Results
This section presents the experimental results of the impact of 20 wt% brine mixtures on Bentheimer and Salt Wash North sandstone cores, the brine flow behaviour during the core flooding experiments, and the effectiveness of two remediation fluids, 0.5 wt% low-salinity brine and 3.5 wt% seawater, in dissolving the precipitated salts and re-establishing the flow paths. According to [2], it is stated that CO2 reaches its supercritical state at 31 °C and 7.38 MPa. Additionally, it is mentioned that deep sandstone saline aquifers can extend to depths of 2400 m with a geothermal gradient of 20 °C/km [27]. Considering these conditions, experiments were conducted at 45 °C. To mimic in-situ conditions and to keep CO2 in its supercritical state during the entire process, injection pressure was set between 1100 and 1200 psig. Temperature was always kept constant to ensure reproducibility of the experiments. After the identification of salt formation, the remediation fluids were applied to the model without delay in accordance with the standard procedure set in previous works [10]. Results of remediation experiments with low salinity brine after initial saturation with 20 wt% brine composition are presented in Table 2. On the other hand, the results obtained post saturating the core samples with 20 wt% brine and later injected the seawater with 3.5 wt% are shown in Table 3.
A clearer understanding of the trends observed in Table 2 and Table 3 can be obtained by examining the relative changes in differential pressure and CO₂ volume before and after remediation. On average, the reduction in differential pressure following low-salinity remediation was significantly greater than that observed with seawater, indicating a stronger recovery of flow pathways. For example, across all brine types, differential pressure decreased by approximately 60–80% following low-salinity flushing, compared to a more limited reduction of 10–30% with seawater. This trend is consistent across both Bentheimer and Salt Wash North cores. Similarly, CO₂ volume measurements show a clear increase in post-remediation flow capacity, with low-salinity treatment resulting in a two- to fourfold increase in CO₂ throughput in several cases, while seawater produced only marginal improvements. These quantitative differences confirm that the choice of remediation fluid has a measurable and significant impact on permeability recovery. In addition, the differences between monovalent and divalent brines can be clearly quantified. Divalent systems (CaCl₂ and MgCl₂) consistently show higher pre-remediation differential pressures and lower CO₂ volumes compared to monovalent systems, indicating stronger flow restriction. The relative difference in breakthrough time also supports this observation, with divalent brines exhibiting earlier breakthrough by approximately 5–10% under similar conditions.
3.1. Flow Dynamics of CO₂, Brine, and Remediation Fluids
The interaction of CO2 with brine and remediation fluids displays unique trends related to the precipitation and subsequent dissolution of the salt. As brine salinity increases, CO₂ solubility is reduced due to the salting-out effect, where dissolved ions decrease the activity of water and limit the ability of CO₂ to dissolve in the aqueous phase. This reduction in solubility promotes earlier CO₂ breakthrough and enhances the concentration of salts in the remaining brine. In this case, the process of precipitation continues to build up, thereby creating constraints that limit the flow. In this case, the differential pressure is used as a parameter that gives a direct indication of the constraints. Figure 2 displays the characteristic differential pressure response as the process of injecting supercritical CO2 into a saturated Bentheimer core containing brine is conducted. After the remediation process is conducted, the differential pressure is used as the parameter that gives the indication of the constraints. In this case, the process of breakthrough is conducted at a stable and consistent manner before the CO2 is injected into the brine.
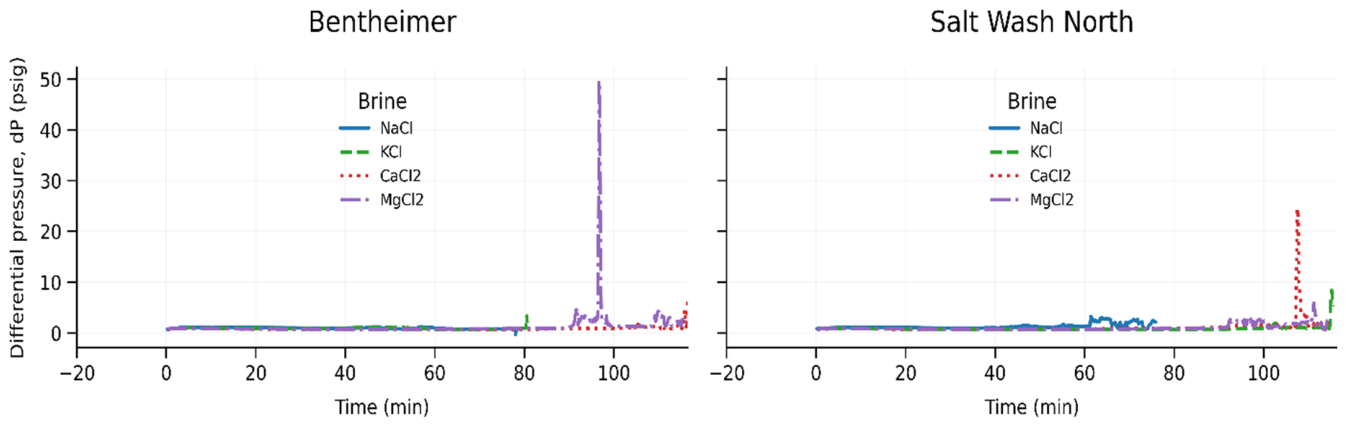
In all tests, the cores saturated with divalent fluids (MgCl₂ and CaCl₂) had earlier CO₂ breakthrough compared to those with monovalent fluids (NaCl and KCl). This can be attributed to the reduced CO₂ dissolution capacity of the divalent fluids, while the NaCl- and KCl-saturated cores had a higher CO₂ dissolution capacity and hence later breakthrough under identical and highly reproducible conditions. The earlier breakthrough observed in divalent brine systems (CaCl₂ and MgCl₂) can be attributed not only to fluid density differences but also to their lower CO₂ solubility and stronger ionic interactions. Divalent ions reduce water activity more significantly than monovalent ions, leading to earlier supersaturation and enhanced precipitation [18,26]. This results in more rapid pore blockage and earlier flow restrictions compared to monovalent systems.
The concentration of dissolved salts increases with further CO₂ displacement. As CO₂ continues to displace the brine, water evaporates into the CO₂ phase, increasing the concentration of dissolved salts in the residual brine. At the same time, the salting-out effect further reduces CO₂ solubility, limiting dilution. Once the solubility limit is exceeded, the system becomes supersaturated, leading to nucleation and growth of salt crystals within the pore space [5,22]. This phase is characterized by a reduced injectivity rate, requiring a remediation fluid to be injected. The corresponding increase in differential pressure reflects the reduction in effective pore radius caused by salt accumulation. As pore throats become constricted, flow resistance increases in accordance with Darcy’s law, while capillary forces become more significant due to reduced pore size [21]. The injection of a low salinity brine results in a large change in the differential pressure (dP), as presented in Figure 2 for all salts. This effect can be attributed to the viscosity and density differences between the treatment fluid and CO₂. During after stages of the remediation process, the dP for monovalent fluids reduces to values lower than those before the pre-flush, indicating a higher reopening effect for the monovalent fluids compared to the divalent fluids. This effect is further confirmed by the higher volumes of CO₂ displaced after the low salinity flushing, as presented in Table 2.
With respect to the Salt Wash North core, the differential pressure trends showed a significantly different pattern compared with the Bentheimer sample, both before and post treatment with the low-salinity treatment fluid. Post treatment, the magnitude and fluctuation of the differential pressure were consistently higher compared with the Bentheimer sample. This may indicate that flow resistance is more significant in this lithology. In addition, the range of differential pressure observed with the NaCl- and KCl-saturated cores (see Figure 2) showed significant differences between the two rock types.
Contrary to the expected trends with the monovalent brines, the breakthroughs with the MgCl2 and CaCl2 brines were observed earlier compared with the NaCl and KCl brines. This may indicate that the capacity of the brine solutions is lower compared with the monovalent brine solutions. In addition, the more pronounced salting-out effect, characterized by the continuously increasing differential pressure after breakthrough, is more significant with the divalent brine, particularly the CaCl2 brine. Thus, common with the previous observations by [1] and [18], which showed the CaCl2 brine solutions have a higher tendency to precipitate compared with the MgCl2 brine solutions.
The low-salinity remediation fluid treatment brought stable differential pressure values which remained within a narrow range when applied to NaCl- and KCl-saturated cores. The process seems to dissolve the accumulated salt deposits at a more rapid pace. The MgCl2- and CaCl2-saturated cores show high permeability damage which suggests that their restricted pore structure enables CO2 to move freely through them. The cores reached full saturation with brine solutions which contained equal salt levels, but the restricted pore structure of MgCl2- and CaCl2-saturated cores allowed CO2 to move freely through them. The CO2 volume stays at a much lower level than the monovalent brine solution saturated cores showed.
A more detailed analysis of Figure 2 provides further insight into the evolution of flow resistance during CO₂ injection and remediation. The differential pressure initially increases gradually, followed by a sharp rise as salt precipitation progresses, reaching a peak value that indicates maximum pore restriction. For example, peak differential pressure values for divalent brines are consistently higher than those for monovalent brines, confirming stronger permeability impairment. Following the introduction of the remediation fluid, a clear reduction in differential pressure is observed. The magnitude of this reduction can be used as a measure of recovery efficiency. Low-salinity brine results in a rapid and significant decrease in pressure, often restoring values close to or below the initial pre-precipitation levels. In contrast, seawater shows a more limited reduction, with post-remediation pressures remaining significantly higher. This difference highlights the stronger dissolution capacity of low-salinity fluids. The rate of pressure change also provides useful information. The sharp increase in pressure prior to remediation indicates accelerated pore blockage, while the steeper decline observed after low-salinity injection reflects faster reopening of flow pathways. These trends are consistent across multiple experiments and provide quantitative evidence of the differences in precipitation intensity and remediation performance.
The reported values in Table 2 and Table 3 include standard deviations, which provide an indication of measurement variability and experimental repeatability. The uncertainties stay small when compared to the total amount of change, so the patterns shown seem to be stable. For example, the variation in differential pressure and breakthrough time across repeated measurements is typically within 2%, which is significantly lower than the differences observed between brine types and remediation methods. The research findings remain trustworthy because multiple experiments using different core samples showed identical patterns throughout the study although no complete statistical analysis was performed. The observed behaviour shows a systematic pattern because precipitation appears more strongly in divalent brines and low-salinity remediation proves to be more effective which demonstrates these results stem from consistent physical phenomena. The standard deviation values which accompany the data enable users to check measurement stability while they show the statistical significance of differences between different cases.
3.2. CO₂–Seawater Interaction and Remediation Flow Characteristics
The response from seawater treatment fluid differed completely from the low-salinity fluid response which appears in Figure 3. The figure displays an immediate change in dP values which became substantially higher after seawater introduction than the values which appeared during diluted salinity fluid testing. During the initial 90 minutes the core maintained a constant pressure difference of about 0.9 psig when CO2 passed through the brine-filled core. The injection of seawater did not lead to the normal "tailing" effect which appears after remediation work. The data recorded in Figure 3 shows that the permeability values stayed constant before seawater injection began. The remediation process creates fluid-rock and fluid-fluid interactions which lead to the observed increase in dP.
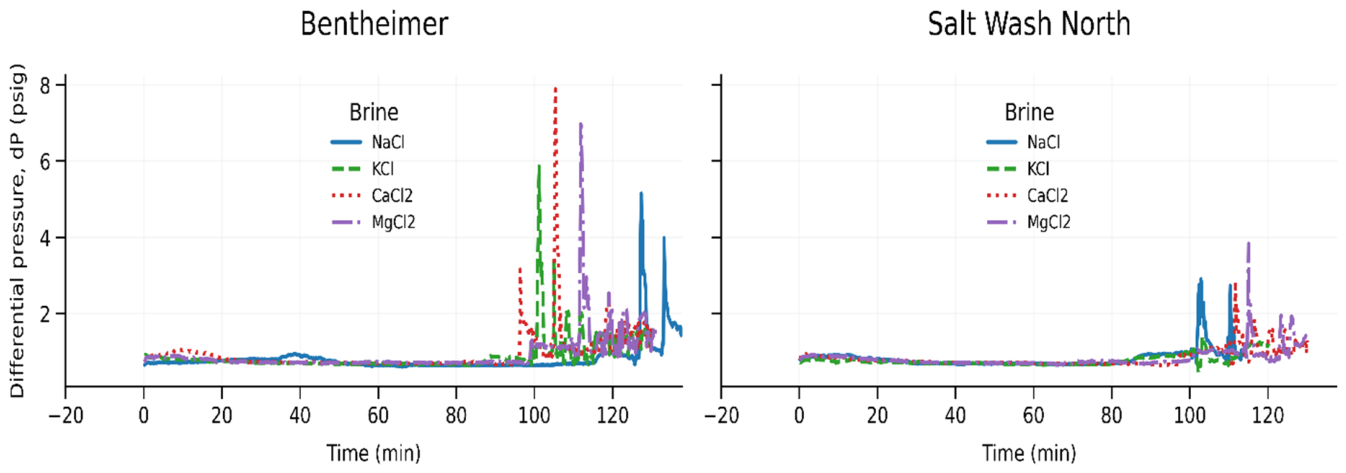
As expected, post infusion of the seawater treatment solution, there were notable an inconsistency in dP profile curves. This could be due to variations in fluid properties as well as complex interactions between injected brine solution and core samples. For Bentheimer cores, it was observed that dP was always highest in samples saturated with KCl solution. The order of dP from highest to lowest was CaCl2, NaCl, MgCl2, and then KCl. This suggests that saturation with KCl solution offered the highest resistance to flow of CO2.
It was expected that, once the treatment solution and CO2 flow were stopped, variations in differential pressure (dP) would continue to decrease as the system stabilized. This was observed for the low salinity remediation tests but not for the seawater tests. For a typical system, under normal circumstances, it is expected that the dP after treatment, with CO2 flow, will decrease below the pre-flush values. This was not observed for the seawater tests. The higher effectiveness of low-salinity remediation can be explained by its lower ionic strength, which creates a stronger chemical potential gradient between the injected fluid and the precipitated salts. This enhances dissolution through diffusion and mixing. In contrast, seawater, with higher ionic strength, reduces this gradient and therefore limits the thermodynamic driving force for salt dissolution [10].
The Salt Wash North core, as indicated in Figure 3, shows a significantly different flow behaviour compared with the Bentheimer core, despite the same process of seawater-based remediation. With respect to monovalent fluids, the CO2 breakthrough curves were nearly identical; however, the pre-remediation dP values were reduced and increased dramatically with the injection of the seawater remediation process. These results are believed to be related to the higher ionic strength of seawater with respect to the low-salinity brine. The divalent fluids exhibited a different breakthrough profile, with earlier breakthrough occurring for the CaCl2-saturated cores with respect to the MgCl2-saturated cores. Additionally, the post-remediation dP values for both divalent fluids exceeded the pre-remediation values, indicating that the seawater remediation process had a reduced effect on permeability restoration. These results collectively indicate that high-salinity remediation fluids enhance resistance to flow within the Salt Wash North sandstone and are highly dependent on the chemistry of the fluids.
Overall, the seawater remediation fluid yields greater resistance to CO₂ breakthrough and more dynamic pressure evolution, suggesting that higher salinity intensifies capillary forces and stabilizes residual brine clusters. The distinctions between brine chemistries are clearer under seawater conditions, highlighting the sensitivity of displacement behaviour to both salinity level and divalent ion presence.
To strengthen the mechanistic interpretation of the remediation process, it is important to clarify how brine flooding interacts with salt deposition at the pore scale. Low-salinity brine enhances dissolution by creating a strong chemical potential gradient that promotes diffusion-driven removal of precipitated halite and divalent salts. This mechanism aligns with the observed larger reductions in differential pressure and greater permeability recovery following low-salinity injection. In contrast, seawater exhibits weaker dissolution capacity due to its higher ionic strength, which reduces the driving force for salt removal. Compared with established remediation approaches such as acidizing and dissolved-water CO2 injection, brine-based remediation offers a non-reactive and operationally simple method for restoring injectivity. Acidizing is highly effective in carbonate systems but can mobilize fines or generate secondary precipitates in sandstone formations. Humidified CO2 injection reduces brine evaporation and mitigates salt formation at the injection stage, whereas the brine-based method applied here operates post-precipitation and is therefore suitable when dry CO2 injection cannot be avoided. Together, these mechanisms position low-salinity brine flooding as a practical and efficient remediation option for mitigating salt-induced injectivity impairment in deep saline aquifers.
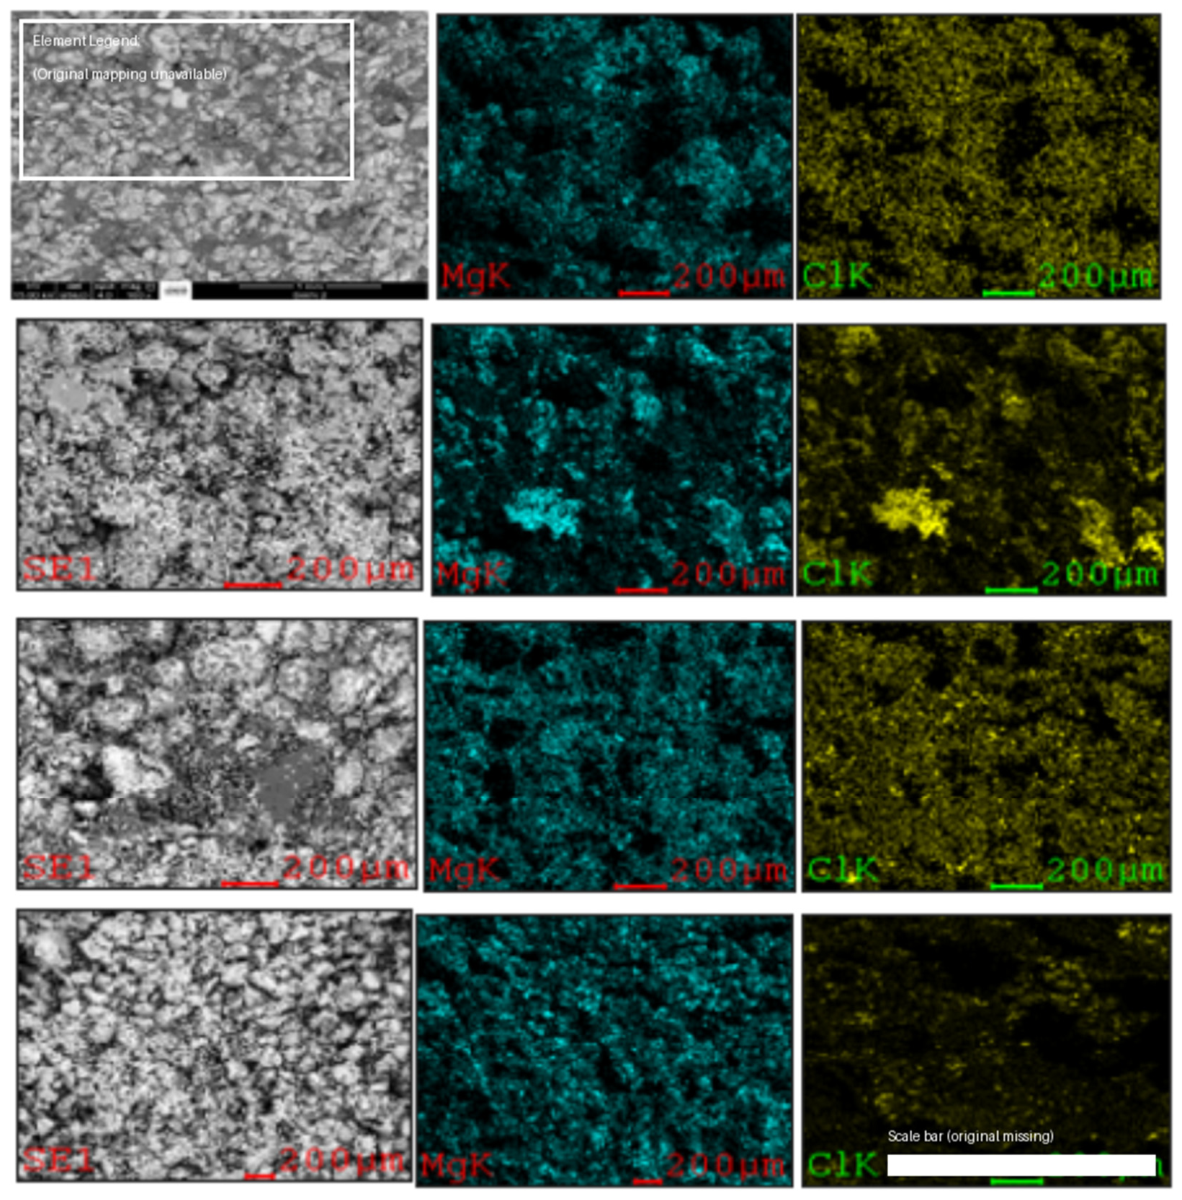
The analysis of Figure 3 shows how different remediation methods produce various patterns in pressure response. Seawater-treated systems maintain high peak differential pressure levels while their recovery process fails to remove salt deposits completely. The absence of a significant post-remediation decline in pressure suggests that the dissolution process is less effective under high ionic strength conditions. The pressure graphs from Figure 2 and Figure 3 demonstrate that low-salinity brine reduces peak pressure more effectively while it establishes steady flow patterns at a faster rate. The research data shows low-salinity remediation provides better permeability restoration results than seawater treatment during the experimental period. These trends are supported by pore-scale observations from SEM–EDX analysis, which show clear evidence of salt deposition within pore spaces following CO₂ injection (see Figure A3, Figure A4, Figure A5 and Figure A6). The increased presence of solid deposits observed in the images is consistent with the reduction in pore connectivity inferred from differential pressure measurements.
3.3. Mechanistic Interpretation of Salt Precipitation and Remediation
The research study shows experimental data which scientists can understand through their knowledge of thermodynamic principles and transport mechanisms and capillary effects that determine how CO₂ interacts with Brine at the pore level. The process of Brine displacement during CO₂ injection leads to mass transfer between the aqueous phase and the supercritical CO₂ phase. The Brine water evaporates into the CO₂ phase during its flow through the porous medium which causes salt concentrations to rise in the remaining Brine water [5,21]. As the process moves forward the Brine solution reaches its saturation limit which triggers the formation of salt crystals.
The dry-out process is governed by the balance between convective CO₂ flow and diffusive mass transfer of water into the CO₂ phase. Close to the injection point, where CO₂ saturation and flow velocity are highest, evaporation is more pronounced, causing faster brine concentration and earlier precipitation [22]. This explains the observed increase in differential pressure and the localization of injectivity impairment during the flooding experiments.
Salt nucleation begins once the local salt concentration exceeds its solubility limit. At this point, small crystalline nuclei tend to form on pore surfaces, where surface energy barriers for nucleation are lower. These nuclei grow as additional salt is supplied by the concentrated Brine, eventually leading to partial or complete blockage of pore throats. This pore blocking behaviour is consistent with previous experimental observations showing reductions in permeability due to salt deposition [5,15].
Capillary forces further amplify this process. As salt crystals accumulate, the effective pore radius decreases, which leads to an increase in capillary pressure according to the Young–Laplace relationship. This restricts CO₂ entry into smaller pores and creates a feedback effect, where reduced flow pathways promote more localized drying and further precipitation [21]. Under the low capillary number conditions of this study, capillary forces dominate over viscous forces, making pore-scale effects particularly significant in controlling injectivity.
The differences observed between monovalent and divalent brine systems can be explained by their ionic behaviour. Divalent ions such as Ca²⁺ and Mg²⁺ tend to have lower solubility limits and stronger ionic interactions compared to monovalent ions, which leads to earlier supersaturation and more severe precipitation [18,26]. This is consistent with the earlier CO₂ breakthrough and greater permeability reduction observed in the CaCl₂- and MgCl₂-saturated cores.
The remediation process effectively reverses the precipitation mechanism. The injection of low-salinity fluids establishes a powerful concentration difference between these fluids and the existing salt deposits. The gradients between salt concentrations enable dissolution through diffusion and mixing which lets the salts dissolve back into water [10]. The better performance of low-salinity brine for permeability recovery results from its reduced ionic concentration which produces a more intense chemical potential difference between the fluid being injected and the salt deposits that have formed. The process achieves dissolution through the combination of diffusion and mixing operations. Seawater creates a different situation because its higher salt levels decrease the concentration difference which blocks salt dissolution thermodynamics and leads to reduced permeability restoration [10].
The combined effects of evaporation-driven dry-out and salt supersaturation and pore-scale nucleation and growth and capillary flow restriction explain the observed increases in differential pressure and reductions in permeability. The research shows how salt deposits develop and disappear during CO2 injection because of the combined effects of transport mechanisms and capillary actions in the subsurface environment.
3.4. Porosity and Permeability Variations
The research shows that low-salinity brine performs better at opening blocked pore channels than seawater when quantitative tests get performed. The research detects petrophysical changes which show low-salinity brine creates porosity growth between 14.0 and 28.5% while seawater produces porosity growth between 2.2 and 12.9%. The research shows low-salinity water treatment achieved permeability recovery between 40.6 and 68.4% but seawater treatment only reached 7.4 to 17.2%. The relative remediation efficiency shows low-salinity brine produces 2.3–6.5 times better permeability restoration than seawater depending on the specific brine composition and mineral content of the core samples. The research shows low-salinity water treatment creates the most significant and fastest drop in differential pressure which indicates it better removes salt deposits to restore pore channels than other water treatment options.
The core flooding experiments revealed that different brine compositions caused porosity and permeability values to shift from their original reference values which were established using sandstone samples. The core samples received two different treatment fluids which consisted of low-salinity brine and seawater that operated at the same system parameters. The remediation fluids served to remove the accumulated salts which had blocked the flow of water through the pore spaces. The remediation process effectiveness appears in Table 4 and Table 5 because they show how salt precipitation initially reduced porosity and permeability before the remediation process created positive changes.
3.5. Variations in Porosity
The treatment fluids which included low salinity brine and seawater demonstrated different effects on sample porosity and permeability according to Table 4. The research shows that salt removal during remediation achieves better results through low salinity brine than through seawater. The remediation process shows a decrease in porosity and permeability values which matches the findings from Edem and his team who published their work in 2020. The current findings show the same patterns which previous researchers [15,20,25,28] have also identified. The discussion shows that Bentheimer core porosity values decreased at different rates depending on the type of brine which the researchers used during their saturation experiments. The CaCl2-saturated cores showed the highest reduction, whereas the NaCl-saturated cores showed the lowest reduction. The low salinity brine treatment produced better porosity values in cores with monovalent salt saturation than it did for cores which contained divalent salts. The treatment with seawater produced minimal enhancement in core porosity values because seawater contains high levels of ions which block its ability to dissolve salts. The seawater permeability improvement for cores exists as a limited process because seawater can only open blocked pore channels which otherwise would reduce CO2 storage capacity.
The Salt Wash North cores showed a different pattern of decreasing porosity than the Bentheimer sample during the evaluation of brine solution effects on saturation processes. The KCl-saturated core from Salt Wash North demonstrated the most substantial porosity decrease which resulted in a total loss of 14.1%. The NaCl brine cores from the experiment demonstrated a smaller porosity decrease than the Bentheimer cores during the study. The low-salinity fluid treatment produced excellent results because it raised porosity by 18.3% for NaCl brine cores and 25.2% for KCl brine cores. The seawater treatment produced minimal effects because it caused only a 1.1% porosity increase in CaCl2-saturated cores and a 1.2% increase in MgCl2-saturated cores.
3.6. Variations in Permeability
The low-salinity brine and seawater used as treatment fluids increased the porosity and permeability of the core samples to different extents, as shown in Table 5. However, considering the pore size distribution of the sandstone cores, there is also a strong possibility that permeability could be reduced. This is because salt crystals may precipitate and fill parts of the pore space. In some cases, this precipitation can block flow paths entirely, which may distort key rock properties, particularly permeability.
The baseline permeability of the Bentheimer core sample was the highest among all the samples, indicating a higher capacity for transmission. Therefore, the resistance to flow was lower for the Bentheimer core sample under the same conditions of flooding. As shown in previous studies, a stronger salting-out effect was observed in divalent brine systems compared to monovalent brine systems when they were exposed to CO2 [26]. Consequently, a higher reduction in permeability was observed for the core samples saturated with the divalent brine solutions, i.e., CaCl2 and MgCl2, as indicated by the changes presented in Table 5.
The large decrease in differential pressure and rise in the permeability confirmed the effectiveness of low-salinity brine for dissolving salts and restoring blocked flow paths. Conversely, the remediation process with seawater was not as effective. The permeability recovery, post saturation with various brine solutions, was higher for low-salinity brine, i.e., 64.5%, compared to 15.1% for the core sample remediated with seawater.
The impairment of permeability was also observed for the Salt Wash North core under CO2 flooding, as presented in Table 5. Consequently, this restriction in flow caused an increase in the interstitial velocity of CO2 as it passed through the core. This indicated that the process of salt crystallization had caused a blockage to major pores within the core. This, therefore, restricted the movement of CO2 through the pores. In agreement with the trends observed in the previous tests, the cores with the divalent brines had a greater reduction in permeability compared with the cores with the NaCl and KCl brines. The permeability of the Salt Wash North core increased significantly after the treatment with the low salinity brine, reaching a value of 68.4%. However, remediation with seawater only improved permeability by approximately 13.7%, irrespective of the original brine composition. These pressure-based observations are consistent with the measured permeability recovery, confirming that differential pressure can be used as a reliable indicator of pore-scale flow restriction and restoration.
The recovery in permeability after remediation is also reflected in SEM–EDX observations. Samples treated with low-salinity brine show visibly reduced salt coverage and clearer pore pathways, whereas those treated with seawater retain a higher level of residual deposits. This agreement between imaging and flow measurements confirms that pore-scale salt accumulation is the primary mechanism controlling injectivity impairment.
3.7. Pore-Scale Evidence from SEM–EDX Analysis
To support the interpretation of flow behaviour and permeability changes, SEM–EDX analysis was used to examine salt deposition at the pore scale. Although these results were originally presented in the appendix, they provide important insight into the mechanisms controlling injectivity impairment and recovery. Qualitative comparison of SEM images before and after CO₂ flooding shows a clear increase in solid deposits within the pore space, particularly in samples saturated with higher salinity brines. Regions that originally displayed clean pore surfaces exhibit visible crystalline features after flooding, indicating salt precipitation within pore throats. This observation is consistent with the increase in differential pressure and reduction in permeability measured during the experiments. A semi-quantitative assessment of the images indicates that the relative surface coverage of salt deposits increases systematically with brine salinity. Samples exposed to divalent brines (CaCl₂ and MgCl₂) show more extensive and continuous salt accumulation compared to monovalent systems, supporting the earlier onset of flow restriction observed in pressure measurements. Although full image segmentation was not performed, the increased brightness and spatial continuity of high-atomic-number regions in EDX maps provide a reliable indication of higher salt occupancy in these systems. Following remediation, SEM–EDX images show a noticeable reduction in visible salt deposits, particularly in samples treated with low-salinity brine. The pore surfaces appear cleaner, and previously blocked regions show partial reopening, which aligns with the observed reduction in differential pressure and recovery in permeability. In contrast, samples treated with seawater retain a higher proportion of residual salt, consistent with the lower effectiveness of seawater in restoring flow pathways. These observations provide independent, pore-scale validation of the flow-based measurements. While the SEM–EDX analysis remains qualitative in nature, it supports the interpretation that salt precipitation is responsible for pore blockage, and that low-salinity remediation enhances dissolution and reopening of pore channels. These pore-scale observations from SEM–EDX analysis (Section 3.7) provide direct visual evidence supporting the pressure and permeability trends observed during the core flooding experiments. Future work could incorporate automated image segmentation and pore occupancy analysis to provide a more quantitative assessment of salt distribution.
3.7.1. Semi-Quantitative Image Metrics
Across the samples, the proportion of pore surfaces covered by salt deposits increases as brine salinity rises, with much stronger effects observed in systems containing divalent ions. In the pre-flood samples, salt presence is almost negligible. After flooding under high-salinity conditions, however, deposits appear to cover roughly 20–40% of the visible pore surface. When low-salinity fluids are later introduced, this coverage drops noticeably, suggesting that some of the deposited salt is removed or redistributed. Seawater treatment, by contrast, leads to only a partial reduction, with a visibly higher level of residual salt left behind. SEM–EDX analysis supports these observations. It shows that divalent brines tend to form more widespread and continuous salt deposits than monovalent systems. This aligns with the stronger precipitation effects indicated by the pressure and permeability measurements.
4. Discussion
The study results provide a stable interpretation of brine chemical composition and salt formation and treatment methods which determine CO₂ flow rates through saline aquifers. The study creates an integrated understanding of pore-scale and core-scale processes through its analysis of differential pressure information and CO₂ flow data and petrophysical property changes and SEM–EDX results.
Researchers discovered that brine composition controls the initiation and timing of salt precipitation through their study. The study results demonstrate that brines with divalent ions including CaCl₂ and MgCl₂ cause CO₂ to appear earlier while creating higher pressure and stronger permeability damage than monovalent brines which contain NaCl and KCl. The research shows that divalent ions reduce CO₂ solubility more than other ions because their higher ionic strength causes them to reach saturation points at faster rates. The research results match established thermodynamic trends which increase researchers' confidence in their discoveries.
The observed differential pressure increase during CO₂ injection shows the status of pore space dynamics. The drying process of brine through evaporation causes supersaturation which produces salt crystals that form in the tightest sections of the pore system. The crystals grow until they create blockages which restrict the flow of water through the system. The experiments show rising pressure which indicates the system experiences steady blockage and SEM–EDX images confirm higher salt deposits form when water salinity increases.
The research shows how different treatment approaches lead to various levels of success when unblocking sealed pathways for water flow restoration. It also demonstrates how different treatment approaches lead to various levels of success when unblocking sealed pathways for water flow restoration.
The significantly higher effectiveness of low-salinity brine compared to seawater is consistent with previous experimental findings [10], which demonstrate that lower ionic strength enhances the dissolution of precipitated salts. In this study, low-salinity brine achieved substantially greater reductions in differential pressure and higher permeability recovery. This behaviour can be explained by the stronger potential chemical gradient driving dissolution, as well as improved fluid mixing within the pore space. Another important observation is the close agreement between core-scale flow measurements and pore-scale imaging. SEM–EDX analysis shows that salt accumulation increases with salinity and is more extensive in divalent systems, while low-salinity remediation leads to visible reduction in salt coverage. This agreement between independent measurements strengthens the interpretation that salt precipitation is the dominant mechanism controlling injectivity loss under the conditions studied. From a practical perspective, these findings have direct implications for CO₂ storage operations.
The research findings demonstrate that scientists need to study the brine composition which exists inside the reservoir. The presence of high divalent ion levels in formation brines leads to injectivity issues because salt precipitation creates flow barriers for injected fluids. The procedure operated at its best performance close to the wellbore because this area contained the highest formation salinity which directly affected injectivity.
The research findings show certain limitations which affect their overall significance. Scientists performed their research in a controlled laboratory environment where they maintained their testing environment with established parameters. The experimental setup fails to show the complete complexity which exists in natural reservoir systems. The research team discovered essential mechanisms which should operate in different reservoir settings across various environmental conditions.
The research findings about the 10% PV remediation slug demonstrate that small injection amounts can successfully restore permeability near wellbores which experience severe salt precipitation. The research supports earlier studies which showed that small initial flushing operations together with cleanup efforts would lead to better injection system performance [21]. However, at field scale, the required volume may vary depending on reservoir heterogeneity and the extent of salt deposition, indicating the need for further optimization through modelling and larger-scale testing. The study extends existing academic knowledge through its development of a testing platform which evaluates different brine solutions and treatment approaches through standardized test protocols. The research team studies small-scale pore operations which link to core flow systems to establish an entire understanding of saline aquifer injectivity issues which will lead to improved reservoir management methods.
4.1. Data Reliability and Experimental Validation
In this study, interpretations regarding the impairment of injectivity and the effectiveness of remediation are mainly based on differential pressure and CO₂ flow measurements, with additional support offered by post-flood petrophysical data. These measurements provide a direct view of the flow restrictions and improvements in the system. However, without a full mass balance or detailed quantitative imaging of the salt precipitation and dissolution processes, it is important to consider the reliability of these interpretations.
To address the reliability of the interpretations, several approaches were used to cross-check the findings. First, the differential pressure results were consistent and repeatable in all the experiments. The results from each of the brines were consistent during both the precipitation and remediation stages of the flooding experiments. The differential pressure increased during CO₂ flooding and decreased during the remediation flooding, aligning with the permeability and porosity measurements of the cores. This provides strong, albeit indirect, evidence of the pore blockage and reopening.
Second, the SEM–EDX imaging of the cores provided independent support for these interpretations. There was an increased presence of salt deposits in the cores after the flooding experiments, and reductions in salt deposits after the remediation flooding experiments. While these results are qualitative rather than quantified, they offer additional proof of the processes suggested by the flow data.
Third, the same overall trends were seen in the experiments with different core samples and brine. The differences in results between the monovalent and divalent brines and between the low-salinity and seawater treatments suggest that the results are not due to variations in the experiments but represent the physical mechanisms at play.
That said, there are limitations to this study. A full mass balance or image segmentation of the salt precipitation and dissolution is not included. Despite this, the consistency between the pressure, petrophysical, and SEM–EDX imaging results suggests that the interpretations are accurate. Future work can further verify these interpretations by performing a mass balance and quantitative image segmentation of the salt deposits in the cores.
4.2. Limitations and Field-Scale Implications
The researchers conducted their experiments at 45 °C while they maintained injection pressures between 1100 and 1500 psig and they operated at a flow rate of 3 mL/min. The researchers selected these specific conditions to create a simulation of what happens near wellbores during CO₂ injection operations in deep saline aquifers. Scientists could study various brine chemical effects because they kept their experimental setup constant throughout their research. The controlled environment fails to demonstrate all the different conditions which occur throughout the entire reservoir system.
Real reservoirs experience various temperature and pressure changes which also affect how water enters the system because these elements control salt formation and injection system performance. The process of water evaporation into the CO₂ phase becomes more intense when environmental temperatures rise. The process leads to faster brine evaporation which causes salt crystals to form. Pressure has a different effect. The brine solution absorbs more CO2 when pressure levels rise because CO2 becomes denser at higher pressures which also decreases salt formation. The wellbore region experiences typical pressure drops which decrease CO2 density to create a dry environment that speeds up salt formation in that area.
The system depends on injection flow rate to function properly. The experiments used low flow rates which produced low capillary numbers that showed capillary forces controlled the flow patterns. The reservoir receives more water when injection rates increase which creates a shift in the system that allows viscous forces to control the flow instead of capillary forces. The process generates viscous fingering during brine displacement which produces irregular flow patterns that result in areas of drying where salt deposits become more concentrated. Lower injection rates create a stable displacement front which slows down the process of salt build-up. The laboratory setup functions as a foundation which helps scientists study process dynamics, but it does not capture the full complexity of natural field environments.
The research work shows that core patterns will continue to exhibit strong qualitative similarity despite their existing limitations. The main factors which determine divalent brine system precipitation strength and low-salinity remediation success include thermodynamic and ionic system interactions instead of process settings. The low-salinity brine solution achieved better permeability recovery than seawater because of its different ionic strength and its ability to drive dissolution which should continue to affect various reservoir environments.
The research findings establish a basic reference point which helps scientists identify the main factors that create salt-related problems with injection equipment performance and its restoration. The research needs additional studies to verify its results under different pressure and temperature settings and flow situations before scientists can apply these findings to actual field environments through reservoir-scale simulations.
4.3. CO2 Scaling Considerations and Reservoir Applicability
The results of this study are obtained from laboratory scale core flooding experiments that mimic the flow of CO₂ through a porous media at a centimeter scale. The injection of CO₂ at a field scale, however, occurs over much larger spatial and temporal scales and is influenced by a variety of factors that dominate over the effects observed in these core flooding experiments. Due to these differences in scale and dominant factors, the results of these core scale experiments cannot be directly applied to the field scale reservoir.
The scaling of the results of the experiments can be considered using dimensionless parameters. These parameters include the capillary number and the Peclet number, which determine the behaviour of the CO₂ at different scales. The low flow rate and small pore scale of the core flooding experiments means that the CO₂ experiences capillary dominated flow conditions. At the field scale, the flow rate and physical size of the reservoir cause the CO₂ to experience viscous and gravitational forces that influence the flow of the CO₂ in a different manner. The mechanisms identified in the study, however, are governed by thermodynamic and transport processes that will be relevant at the field scale, as well.
It is therefore more appropriate to interpret the results of this study in a qualitative and mechanistic sense, rather than as direct quantitative predictions of field performance. For example, the observed stronger precipitation effects in divalent brines and the higher efficiency of low-salinity remediation are linked to ionic strength, solubility limits, and dissolution kinetics, which are intrinsic fluid properties and are expected to persist under reservoir conditions. However, the exact magnitude of permeability reduction or recovery may vary depending on reservoir heterogeneity, flow distribution, and operational conditions.
From a field perspective, the findings suggest that brine chemistry should be carefully considered when designing injection strategies, and that low-salinity remediation may be an effective approach for mitigating salt-induced injectivity loss, particularly in near-wellbore regions where dry-out effects are most pronounced. To fully translate these results to reservoir scale, integration with numerical simulation models that account for large-scale heterogeneity and operational variability is recommended.
5. Conclusion
This study investigates the effect of brine chemistry on salt precipitation and injectivity impairment during CO₂ injection, and the effectiveness of remediation strategies, through a series of controlled core-flooding experiments. The results provide insight into the mechanism of injectivity impairment and guidance on improving the performance of CO₂ storage in saline aquifers.
The experiments indicate that salt precipitation is the dominant cause of injectivity impairment, resulting from evaporation of the brine and crystallization of salts within the pores of the core samples. The severity of injectivity impairment depends on the composition of the brine. Brines containing divalent ions (CaCl₂ and MgCl₂) caused earlier breakthrough of the CO₂, higher differential pressures, and a greater reduction in permeability compared to samples flooded with monovalent ion brines (NaCl and KCl). This indicates that reservoirs containing divalent ions are more susceptible to severe injectivity loss during CO₂ injection.
Remediation results demonstrate that fluid selection plays a critical role in restoring injectivity. Low-salinity brine was significantly more effective than seawater across all tested conditions. Quantitatively, low-salinity treatment achieved permeability recovery of approximately 40.6–68.4%, compared to only 7.4–17.2% for seawater. This improvement was also reflected in larger reductions in differential pressure and increased CO₂ flow capacity. The superior performance of low-salinity brine is attributed to its lower ionic strength, which enhances salt dissolution through a stronger chemical potential gradient.
The effectiveness of remediation was also influenced by rock type. Bentheimer sandstone, with its higher permeability and larger pore structure, showed more efficient flow recovery and lower residual blockage compared to Salt Wash North sandstone, which exhibited stronger flow restrictions due to its smaller pore sizes and greater heterogeneity. These results highlight the importance of considering both fluid chemistry and rock properties when evaluating injectivity behaviour.
The practical analysis of findings reveals several essential elements which field teams can apply to their operational work. The research demonstrated that 10% pore volume (PV) remediation slug size delivered optimal permeability restoration during laboratory testing which showed small treatment volumes work well for near-wellbore application. The remediation process needs to start at the right moment because its timing remains essential throughout the whole operation. The research shows that deploying remediation fluids during the first stage of salt precipitation will produce better results because it stops complete pore blockage from happening.
The study shows that CO₂ storage system injectivity problems emerge from the combined effects of brine chemical composition and the physical structure of pores and how fluids move through them. Scientists achieved better understanding of salt precipitation through their combination of core-scale measurements and pore-scale observations, which also helped them understand remediation processes. The research findings show that low-salinity flushing functions as a successful operational method to reduce salt-induced injectivity problems which occur in high-salinity reservoirs with divalent ions.
The research needs further investigation to analyze how operational parameters and optimized slug dimensions affect results while scientists should use numerical simulations to apply these results to full-scale reservoir systems.
Author Contributions
Author Contributions: Conceptualization, methodology, data curation, investigation, project administration, visualization, formal analysis, writing—original draft preparation: Donatus Ephram Edem; Software, and validation, Nuhu Mohammed; Supervision, and review, Godpower C. Enyi. All authors have read and agreed to the published version of the manuscript.
Funding
This research received no external funding.
Data Availability Statement
All the raw data used for this study are generally available on request as agreed by all authors.
Conflicts of Interest
To the best of their knowledge all authors have declared that they have no competing financial or personal interests that could have influenced the work reported in this paper. This declaration is made in accordance with the conflict-of-interest policies highlighted journal Guide for Authors.
Acknowledgments
We would like to extend our deepest gratitude to the Nigerian Petroleum Technology Development Fund (PTDF) for awarding us this much-valued scholarship award.
Abbreviations
The following abbreviations are used in this manuscript:
| CCS | Carbon Capture and Storage |
| CCUS | Carbon Capture, Utilization and Storage |
| CO₂ | Carbon Dioxide |
| scCO₂ | Supercritical Carbon Dioxide |
| IFT | Interfacial Tension |
| SEM | Scanning Electron Microscopy |
| EDX | Energy-Dispersive X-ray Spectroscopy |
| PV | Pore Volume |
| LSB | Low-Salinity Brine |
| SW | Seawater |
| dP | Differential Pressure |
| BEN | Bentheimer Sandstone |
| SWN | Salt Wash North Sandstone |
| NaCl | Sodium Chloride |
| KCl | Potassium Chloride |
| CaCl₂ | Calcium Chloride |
| MgCl₂ | Magnesium Chloride |
| mD | Millidarcy |
| DI | Deionized |
| BPR | Back Pressure Regulator |
| QA/QC | Quality Assurance/Quality Control |
| CO₂-BW | Carbon Dioxide-Brine-Water System |
| SEM-EDX | Scanning Electron Microscopy–Energy Dispersive X-ray Spectroscopy |
| API | American Petroleum Institute |
| EOR | Enhanced Oil Recovery |
| GCS | Geological Carbon Storage |
| RCP | Relative Capillary Pressure |
| Kr | Relative Permeability |
| Pc | Capillary Pressure |
| μ | Dynamic Viscosity |
| φ | Porosity |
| K | Permeability |
Appendix A
Appendix
Figure A1.
Scanning Electron Microscopy (SEM) of Bentheimer.
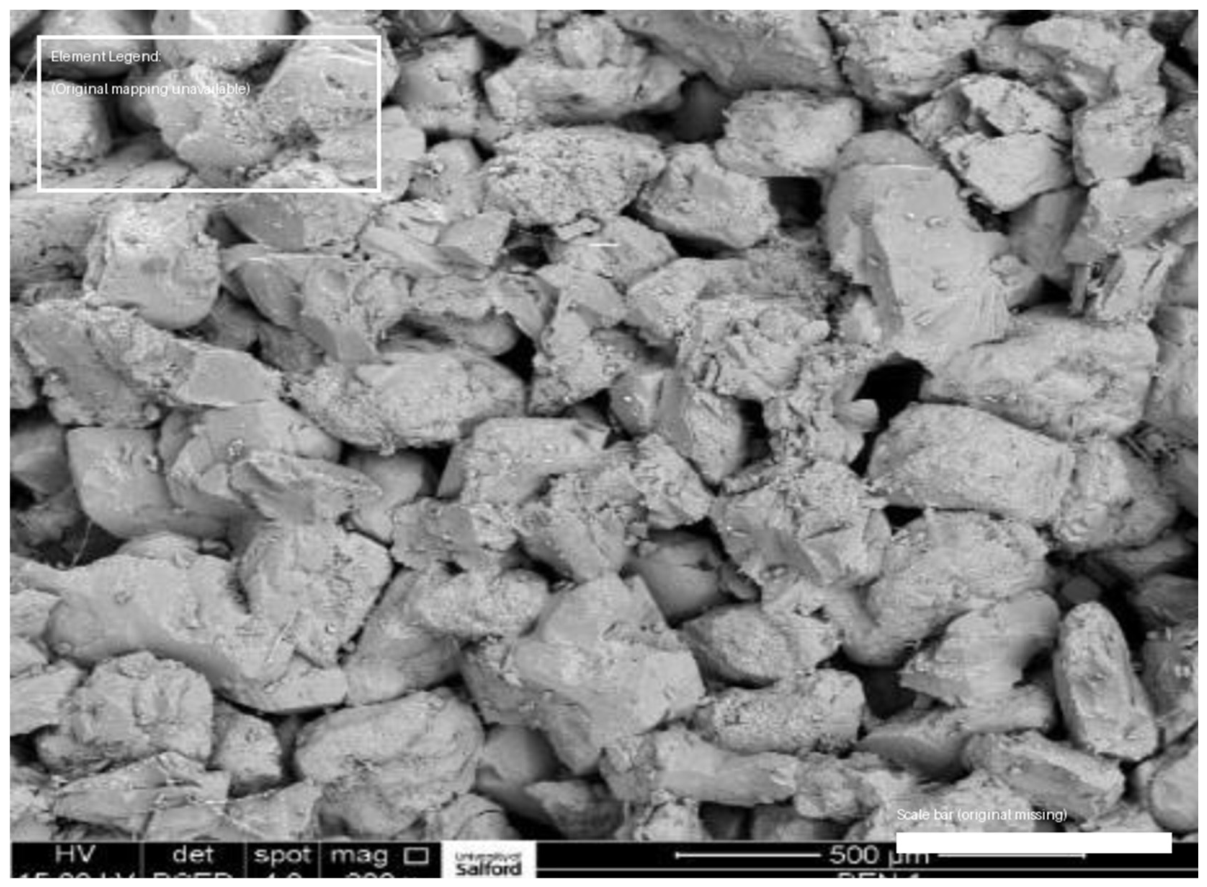
Figure A2.
Microstructural Features of the Salt Wash North Core Identified by SEM.
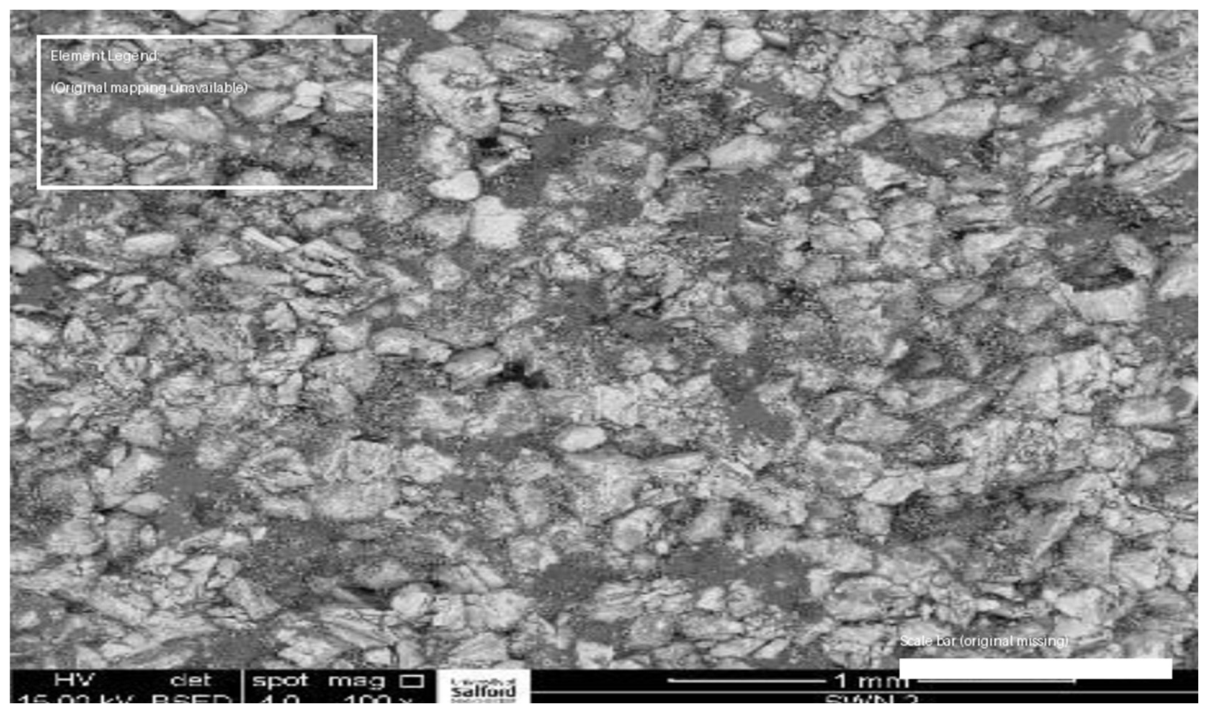
Figure A3.
SEM–EDX analysis of Bentheimer sandstone saturated with NaCl brine: (a) pre-flooding condition showing clean pore surfaces with no visible deposits; (b) post-CO₂ flooding, showing the appearance of salt crystals within pore spaces and along pore walls; (c) after low-salinity brine remediation, showing reduced salt coverage and partial reopening of pore pathways; (d) after seawater remediation, showing residual salt deposits and less effective pore clearing compared to low-salinity treatment.
Figure A3.
SEM–EDX analysis of Bentheimer sandstone saturated with NaCl brine: (a) pre-flooding condition showing clean pore surfaces with no visible deposits; (b) post-CO₂ flooding, showing the appearance of salt crystals within pore spaces and along pore walls; (c) after low-salinity brine remediation, showing reduced salt coverage and partial reopening of pore pathways; (d) after seawater remediation, showing residual salt deposits and less effective pore clearing compared to low-salinity treatment.
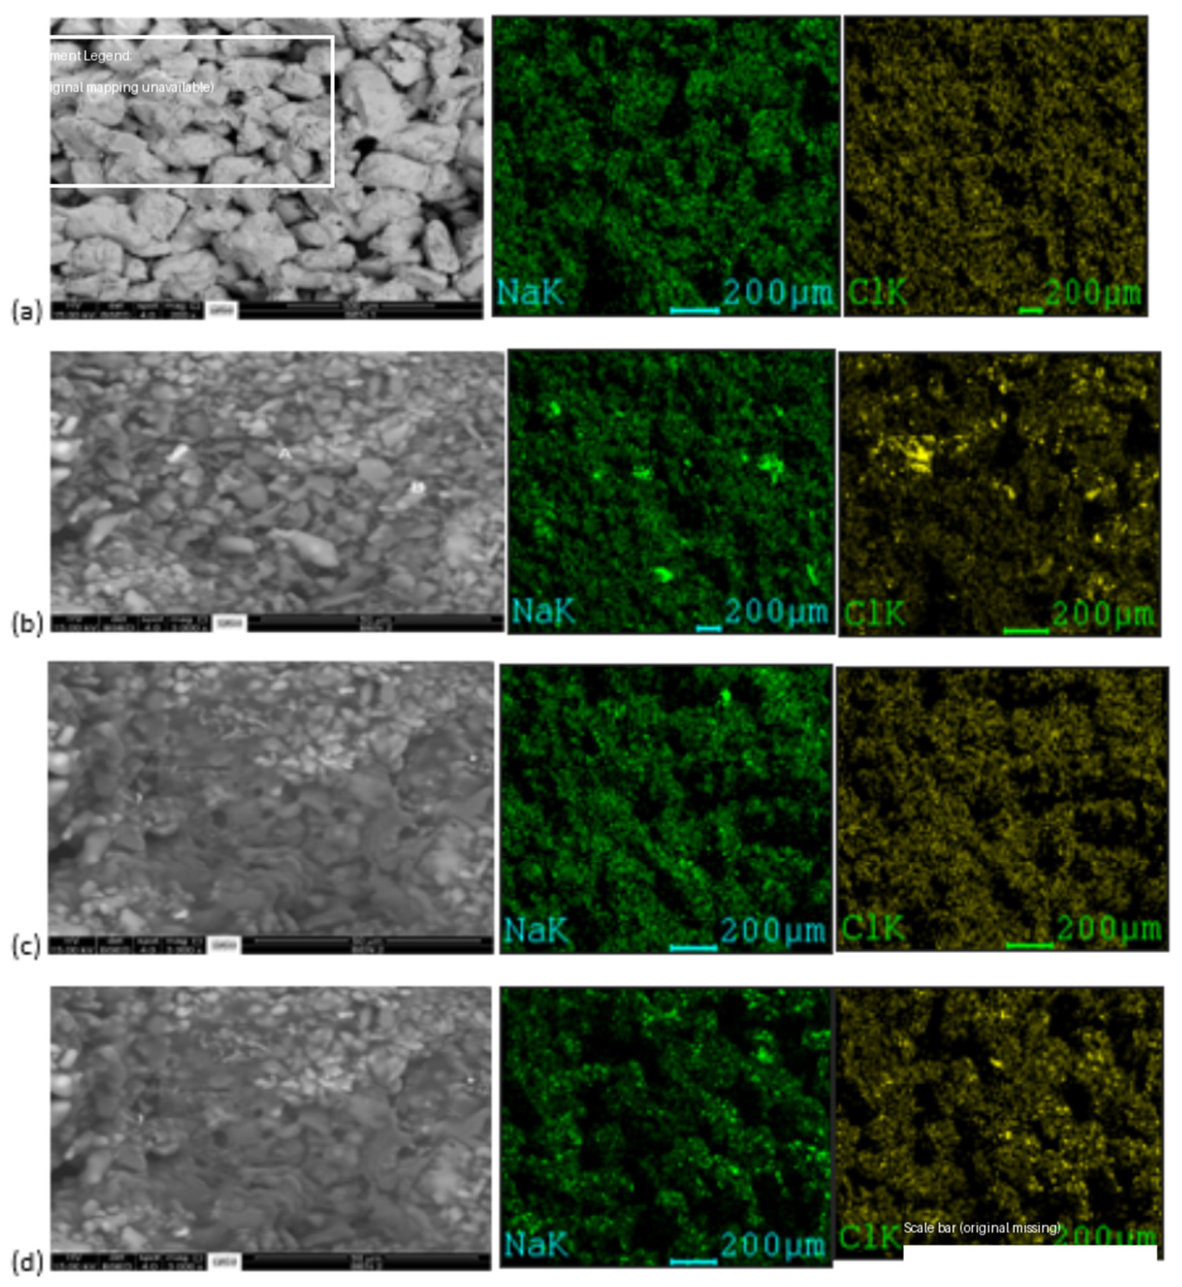
Figure A4.
SEM–EDX elemental mapping of NaCl-saturated Salt Wash North sandstone: (a) initial condition with minimal surface deposits; (b) post-CO₂ flooding, showing increased Na and Cl signal intensity corresponding to salt accumulation; (c) after low-salinity brine treatment, showing reduced signal intensity and improved pore clarity; (d) after seawater treatment, showing persistent salt deposits with limited removal.
Figure A4.
SEM–EDX elemental mapping of NaCl-saturated Salt Wash North sandstone: (a) initial condition with minimal surface deposits; (b) post-CO₂ flooding, showing increased Na and Cl signal intensity corresponding to salt accumulation; (c) after low-salinity brine treatment, showing reduced signal intensity and improved pore clarity; (d) after seawater treatment, showing persistent salt deposits with limited removal.
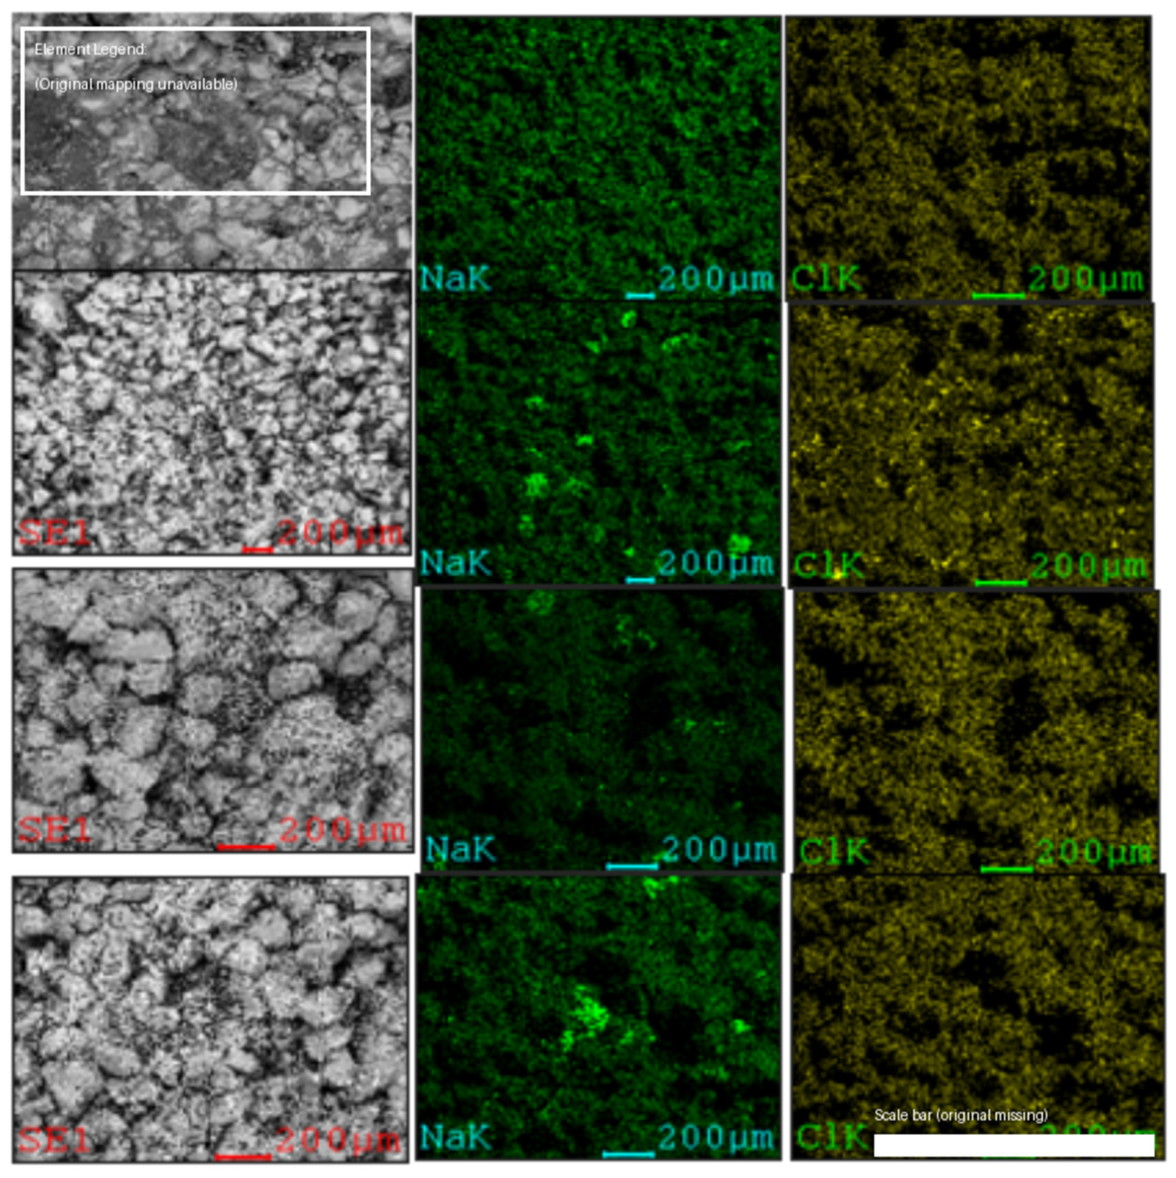
Figure A5.
SEM–EDX characterization of MgCl₂-saturated Bentheimer sandstone: (a) pre-flooding condition; (b) post-CO₂ flooding, showing widespread salt deposition with increased surface coverage; (c) after low-salinity remediation, showing partial dissolution of salt and restoration of pore connectivity; (d) after seawater remediation, showing higher residual salt compared to low-salinity treatment.
Figure A5.
SEM–EDX characterization of MgCl₂-saturated Bentheimer sandstone: (a) pre-flooding condition; (b) post-CO₂ flooding, showing widespread salt deposition with increased surface coverage; (c) after low-salinity remediation, showing partial dissolution of salt and restoration of pore connectivity; (d) after seawater remediation, showing higher residual salt compared to low-salinity treatment.
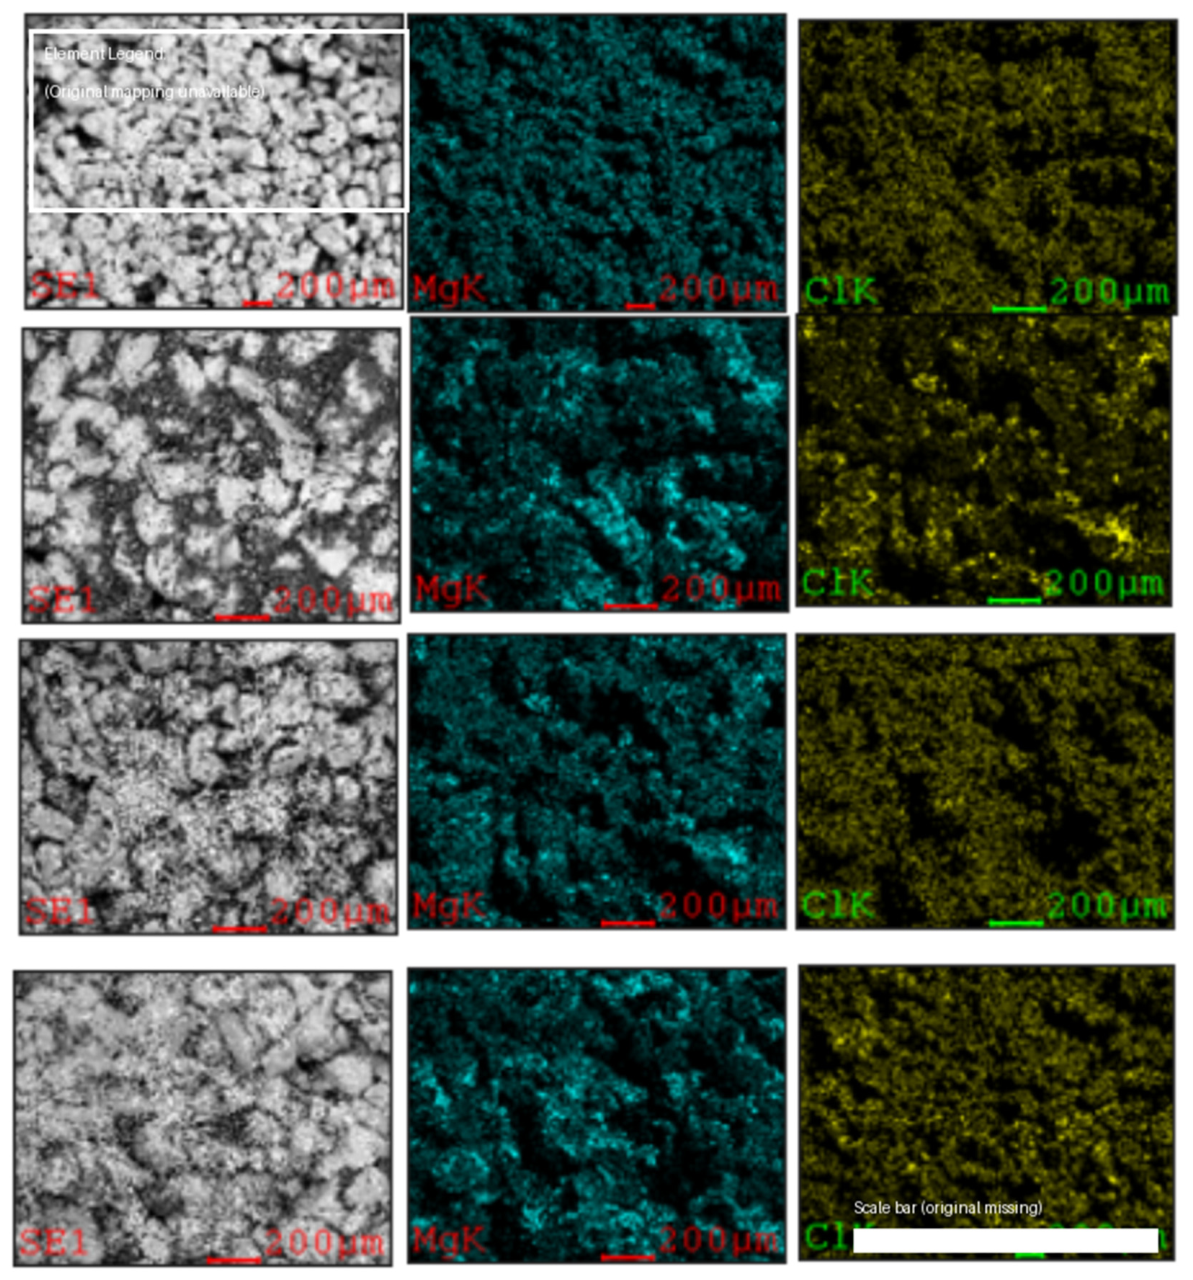
Figure A6.
SEM–EDX maps of MgCl₂-saturated Salt Wash North sandstone: (a) before flooding; (b) after CO₂ flooding, showing dense and continuous salt deposition; (c) after low-salinity treatment, showing significant reduction in salt presence; (d) after seawater treatment, with limited reduction in salt distribution.
Figure A6.
SEM–EDX maps of MgCl₂-saturated Salt Wash North sandstone: (a) before flooding; (b) after CO₂ flooding, showing dense and continuous salt deposition; (c) after low-salinity treatment, showing significant reduction in salt presence; (d) after seawater treatment, with limited reduction in salt distribution.
References
- Abba, M.K. Enhanced gas recovery by CO2 injection: Influence of monovalent and divalent brines and their concentrations on CO2 dispersion in porous media. J. Nat. Gas. Sci. Eng. 2020, 84. [Google Scholar] [CrossRef]
- Abba, M.K.; Abbas, A.J.; Nasr, G.G.; Al-Otaibi, A.; Burby, M.; Saidu, B.; Suleiman, S.M. Solubility trapping as a potential secondary mechanism for CO2 sequestration during enhanced gas recovery by CO2 injection in conventional natural gas reservoirs: An experimental approach. J. Nat. Gas. Sci. Eng. 2019, 71. [Google Scholar] [CrossRef]
- Alemu, B.L.; Aagaard, P.; Munz, I.A.; Skurtveit, E. Caprock interaction with CO2: A laboratory study of reactivity of shale with supercritical CO2 and brine. Appl. Geochem. 2011, 26, 1975–1989. [Google Scholar] [CrossRef]
- Bacci, G.; Korre, A.; Durucan, S. Experimental investigation into salt precipitation during CO2 injection in saline aquifers. Energy Procedia 2011, 4, 4450–4456. [Google Scholar] [CrossRef]
- Bacci, G.; Korre, A.; Durucan, S. Experimental and numerical investigation into halite scaling during CO₂ injection in saline aquifers. Int. J. Greenh. Gas. Control 2013, 12, 219–233. [Google Scholar]
- Bachu, S.; Adams, J. Sequestration of CO₂ in geological media: criteria and approaches for site selection in response to climate change. Energy Convers. Manag. 2003, 44(1), 3151–3175. [Google Scholar] [CrossRef]
- Bachu, S. Review of CO2 storage efficiency in deep saline aquifers. Int. J. Greenh. Gas. Control. 2015, 40, 188–202. [Google Scholar] [CrossRef]
- Baumann, G.; Henninges, J.; De Lucia, M. Monitoring of saturation changes and salt precipitation during CO2 injection using pulsed neutron-gamma logging at the Ketzin pilot site. Int. J. Greenh. Gas. Control. 2014, 28, 134–146. [Google Scholar] [CrossRef]
- Buttinelli, M.; Procesi, M.; Cantucci, B.; Quattrocchi, F.; Boschi, E. Deep saline aquifers for CO₂ storage: Geological characterisation and modelling. In Energy Procedia; 2011; Volume 4, pp. 3884–3891. [Google Scholar]
- Edem, D.E.; Abba, M.K.; Nourian, A.; Babaie, M.; Naeem, Z. Experimental Study on the Interplay between Different Brine Types/Concentrations and CO2 Injectivity for Effective CO2 Storage in Deep Saline Aquifers. Sustainability 2022, 14, 986. [Google Scholar] [CrossRef]
- Edem, D.; Abba, M.; Nourian, A.; Babaie, M.; Naeem, Z. Experimental Investigation of the Extent of the Impact of Halite Precipitation on CO2 Injection in Deep Saline Aquifers. In Proceedings of the SPE Europec featured at 82nd EAGE Conference and Exhibition, Amsterdam, The Netherlands, 18–21 October 2021. [Google Scholar]
- Grude, S.; Landrø, M.; Dvorkin, J. Pressure effects caused by CO2 injection in the Tubåen Fm., the Snøhvit field. Int. J. Greenh. Gas. Control. 2014, 27, 178–187. [Google Scholar] [CrossRef]
- Hansen, O.; Gilding, D.; Nazarian, B.; Osdal, B.; Ringrose, P.; Kristoffersen, J.-B.; Eiken, O.; Hansen, H. Snøhvit: The History of Injecting and Storing 1 Mt CO2 in the Fluvial Tubåen Fm. Energy Procedia 2013, 37, 3565–3573. [Google Scholar] [CrossRef]
- Hurter, S.; Berge, J.G.; Labregère, D. Simulations for CO₂ injection projects with a compositional simulator. Offshore Europe Conference, Aberdeen, Scotland, 2007. [Google Scholar]
- Jeddizahed, J.; Rostami, B. Experimental investigation of injectivity alteration due to salt precipitation during CO2 sequestration in saline aquifers. Adv. Water Resour. 2016, 96, 23–33. [Google Scholar] [CrossRef]
- Kharaka, Y.K.; Thordsen, J.J.; Hovorka, S.D.; Nance, H.S.; Cole, D.R.; Phelps, T.J.; Knauss, K.G. Potential environmental issues of CO2 storage in deep saline aquifers: Geochemical results from the Frio-I Brine Pilot test, Texas, USA. Appl. Geochem. 2009, 24, 1106–1112. [Google Scholar] [CrossRef]
- Muller, N.; Qi, R.; Mackie, E.; Pruess, K.; Blunt, M.J. CO2 injection impairment due to halite precipitation. Energy Procedia 2009, 1, 3507–3514. [Google Scholar] [CrossRef]
- Messabeb, H.; Contamine, F.; Cézac, P.; Serin, J.P.; Pouget, C.; Gaucher, E.C. Experimental Measurement of CO2 Solubility in Aqueous CaCl2 Solution at Temperature from 323.15 to 423.15 K and Pressure up to 20 MPa Using the Conductometric Titration. J. Chem. Eng. Data 2017, 62, 4228–4234. [Google Scholar] [CrossRef]
- Nooner, S.L.; et al. Time lapse gravity monitoring of CO₂ storage. Geophys. Res. Lett. 2007, 34, L12307. [Google Scholar]
- Othman, F.; Naufaliansyah, M.A.; Hussain, F. Effect of water salinity on permeability alteration during CO₂ sequestration. Adv. Water Resour. 2019, 127, 237–251. [Google Scholar] [CrossRef]
- Pruess, K.; Müller, N. Formation dry-out from CO2 injection into saline aquifers: 1. Effects of solids precipitation and their mitigation. Water Resour. Res. 2009, 45. [Google Scholar] [CrossRef]
- Pruess, K. Formation dry out from CO₂ injection into saline aquifers. Water Resour. Res. 2009, 45, W03402. [Google Scholar] [CrossRef]
- Shukla, R.; Ranjith, P.; Haque, A.; Choi, X. A review of CO₂ storage in deep saline aquifers. In Applied Energy; 2010; Volume 88, pp. 3567–3574. [Google Scholar]
- Sminchak, J.; Zeller, E.; Bhattacharya, I. Analysis of unusual scale build-up in a CO2injection well for a pilot-scale CO2storage demonstration project. Greenh. Gases Sci. Technol. 2014, 4, 357–366. [Google Scholar] [CrossRef]
- Sokama-Neuyam, Y.A.; Forsetløkken, S.L.; Lien, J.-E.; Ursin, J.R. The Coupled Effect of Fines Mobilization and Salt Precipitation on CO2 Injectivity. Energies 2017, 10, 1125. [Google Scholar] [CrossRef]
- Tong, D.; Trusler, J.P.M.; Vega-Maza, D. Solubility of CO2 in Aqueous Solutions of CaCl2 or MgCl2 and in a Synthetic Formation Brine at Temperatures up to 423 K and Pressures up to 40 MPa. J. Chem. Eng. Data 2013, 58, 2116–2124. [Google Scholar] [CrossRef]
- Yang, F.; Bai, B.; Tang, D.; Shari, D.-N.; David, W. Characteristics of CO2 sequestration in saline aquifers. Pet. Sci. 2010, 7, 83–92. [Google Scholar] [CrossRef]
- Yusof, M.A.M.; Mohamed, M.A.; Akhir, N.A.M.; Ibrahim, M.A.; Mardhatillah, M.K. Combined Impact of Salt Precipitation and Fines Migration on CO2 Injectivity Impairment. Int. J. Greenh. Gas. Control. 2021, 110. [Google Scholar] [CrossRef]

Table 1.
Typical petrophysical properties of core samples (from supplier).
| S/No | Core Sample | Diameter (mm) | Length (mm) |
Porosity (%) |
Permeability (mD) |
Dominant Mineral | Clay Content, % | Average pore size, |
|---|---|---|---|---|---|---|---|---|
| 1 | Bentheimer | 25.49 | 76.23 | 23 - 26 | 1500 - 3500 | Quartz (>90) | <2 | 10-50 |
| 2 | Salt wash north | 25.26 | 75.62 | 20 -22 | 440 – 800 | Quartz + feldspar | 5-10 | 5-20 |
Table 2.
Shows the results obtained post saturation with 20 wt% various brine and later injected with 0.5 wt% low salinity brine.
Table 2.
Shows the results obtained post saturation with 20 wt% various brine and later injected with 0.5 wt% low salinity brine.
| Brine | Core | Brine Saturation [%] ± SD | Breakthrough Time [min] ± SD | dP Before [psig] ± SD | CO2 Volume Before [L] ± SD | Injection Time [min] ± SD | dP After [psig] ± SD | CO2 Volume After [L] ± SD |
|---|---|---|---|---|---|---|---|---|
| NaCl | BEN | 89 ± 1.00 | 97.17 ± 0.35 | 1.00 ± 0.03 | 1.25 ± 0.04 | 107.17 ± 2.14 | 0.20 ± 0.01 | 5.34 ± 0.16 |
| NaCl | SWN | 93 ± 0.93 | 102.34 ± 1.02 | 1.44 ± 0.04 | 2.34 ± 0.07 | 112.34 ± 2.25 | 0.40 ± 0.01 | 4.95 ± 0.15 |
| KCl | BEN | 90 ± 0.90 | 99.50 ± 0.99 | 0.66 ± 0.02 | 3.09 ± 0.09 | 109.50 ± 2.19 | 0.30 ± 0.01 | 5.89 ± 0.18 |
| KCl | SWN | 89 ± 0.89 | 101.00 ± 1.01 | 1.03 ± 0.03 | 3.86 ± 0.12 | 110.83 ± 2.22 | 0.91 ± 0.03 | 5.08 ± 0.15 |
| CaCl2 | BEN | 90 ± 0.90 | 97.67 ± 0.98 | 0.92 ± 0.03 | 4.19 ± 0.13 | 102.67 ± 2.05 | 0.82 ± 0.02 | 6.01 ± 0.18 |
| CaCl2 | SWN | 94 ± 0.94 | 97.17 ± 0.97 | 1.59 ± 0.05 | 3.35 ± 0.10 | 103.17 ± 2.06 | 0.49 ± 0.01 | 5.32 ± 0.16 |
| MgCl2 | BEN | 94 ± 0.94 | 91.17 ± 0.91 | 2.22 ± 0.07 | 5.83 ± 0.17 | 95.51 ± 1.91 | 1.02 ± 0.03 | 6.38 ± 0.19 |
| MgCl2 | SWN | 95 ± 0.95 | 92.17 ± 0.92 | 1.75 ± 0.05 | 4.12 ± 0.12 | 96.67 ± 1.93 | 0.31 ± 0.01 | 6.03 ± 0.18 |
Table 3.
Results obtained post saturation with 20 wt% brine and later injected seawater with 3.5 wt%.
Table 3.
Results obtained post saturation with 20 wt% brine and later injected seawater with 3.5 wt%.
| Brine | Core | Brine Saturation [%] ± SD | Breakthrough Time [min] ± SD | dP Before [psig] ± SD | CO2 Volume Before [L] ± SD | Injection Time [min] ± SD | dP After [psig] ± SD | CO2 Volume After [L] ± SD |
|---|---|---|---|---|---|---|---|---|
| NaCl | BEN | 85 ± 0.85 | 113.51 ± 1.14 | 0.70 ± 0.02 | 1.55 ± 0.05 | 123.17 ± 2.46 | 0.69 ± 0.02 | 5.23 ± 0.16 |
| NaCl | SWN | 91 ± 0.91 | 91.67 ± 0.92 | 0.91 ± 0.03 | 2.30 ± 0.07 | 101.67 ± 2.03 | 0.75 ± 0.02 | 4.27 ± 0.13 |
| KCl | BEN | 92 ± 0.92 | 87.01 ± 0.87 | 0.73 ± 0.02 | 2.99 ± 0.09 | 97.01 ± 1.94 | 0.81 ± 0.02 | 5.01 ± 0.15 |
| KCl | SWN | 85 ± 0.85 | 90.51 ± 0.91 | 0.89 ± 0.03 | 3.88 ± 0.12 | 100.51 ± 2.01 | 0.85 ± 0.03 | 4.35 ± 0.13 |
| CaCl2 | BEN | 97 ± 0.97 | 91.51 ± 0.92 | 0.66 ± 0.02 | 3.99 ± 0.12 | 102.34 ± 2.05 | 1.02 ± 0.03 | 4.70 ± 0.14 |
| CaCl2 | SWN | 91 ± 0.91 | 96.83 ± 0.97 | 0.70 ± 0.02 | 3.37 ± 0.10 | 114 ± 2.28 | 1.10 ± 0.03 | 4.58 ± 0.14 |
| MgCl2 | BEN | 95 ± 0.95 | 98.83 ± 0.99 | 0.70 ± 0.02 | 5.72 ± 0.17 | 114.17 ± 2.28 | 1.0 ± 0.03 | 5.83 ± 0.17 |
| MgCl2 | SWN | 95 ± 0.95 | 100.83 ± 1.01 | 0.79 ± 0.02 | 4.15 ± 0.12 | 115.67 ± 2.31 | 1.09 ± 0.03 | 4.29 ± 0.13 |
Table 4.
Porosity Variations.
| Brine | Core | % Reduction (Low Salinity) ± SD | % Increase (Low Salinity) ± SD | % Reduction (Seawater) ± SD | % Increase (Seawater) ± SD |
|---|---|---|---|---|---|
| NaCl | BEN | 13.60 ± 0.41 | 22.70 ± 0.68 | 16.90 ± 0.51 | 11.70 ± 0.35 |
| NaCl | SWN | 10.20 ± 0.31 | 24.80 ± 0.74 | 18.30 ± 0.55 | 6.70 ± 0.20 |
| KCl | BEN | 24.80 ± 0.74 | 20.70 ± 0.62 | 22.70 ± 0.68 | 12.90 ± 0.39 |
| KCl | SWN | 22.80 ± 0.68 | 18.50 ± 0.56 | 25.20 ± 0.76 | 10.50 ± 0.32 |
| CaCl2 | BEN | 27.40 ± 0.82 | 16.70 ± 0.50 | 28.30 ± 0.85 | 8.30 ± 0.25 |
| CaCl2 | SWN | 14.10 ± 0.42 | 14.00 ± 0.42 | 12.10 ± 0.36 | 3.10 ± 0.09 |
| MgCl2 | BEN | 36.20 ± 1.09 | 15.60 ± 0.47 | 34.10 ± 1.02 | 6.50 ± 0.20 |
| MgCl2 | SWN | 18.70 ± 0.56 | 28.50 ± 0.85 | 15.80 ± 0.47 | 2.20 ± 0.07 |
Table 5.
Permeability Variations.
| Brine | Core | % Reduction (Low Salinity) ± SD | % Increase (Low Salinity) ± SD | % Reduction (Seawater) ± SD | % Increase (Seawater) ± SD |
|---|---|---|---|---|---|
| NaCl | BEN | 50.00 ± 1.50 | 64.50 ± 1.94 | 40.10 ± 1.20 | 15.10 ± 0.45 |
| NaCl | SWN | 49.10 ± 1.47 | 68.40 ± 2.05 | 50.30 ± 1.51 | 12.10 ± 0.36 |
| KCl | BEN | 40.80 ± 1.22 | 65.30 ± 1.96 | 39.30 ± 1.18 | 17.20 ± 0.52 |
| KCl | SWN | 34.50 ± 1.04 | 45.30 ± 1.36 | 31.80 ± 0.95 | 13.70 ± 0.41 |
| CaCl2 | BEN | 37.00 ± 1.11 | 53.20 ± 1.60 | 41.50 ± 1.25 | 12.60 ± 0.38 |
| CaCl2 | SWN | 48.60 ± 1.46 | 43.20 ± 1.30 | 32.50 ± 0.98 | 8.80 ± 0.26 |
| MgCl2 | BEN | 36.20 ± 1.09 | 50.10 ± 1.50 | 52.80 ± 1.58 | 10.20 ± 0.31 |
| MgCl2 | SWN | 52.20 ± 1.57 | 40.60 ± 1.22 | 35.00 ± 1.05 | 7.40 ± 0.22 |
Disclaimer/Publisher’s Note: The statements, opinions and data contained in all publications are solely those of the individual author(s) and contributor(s) and not of MDPI and/or the editor(s). MDPI and/or the editor(s) disclaim responsibility for any injury to people or property resulting from any ideas, methods, instructions or products referred to in the content. |
© 2026 by the authors. Licensee MDPI, Basel, Switzerland. This article is an open access article distributed under the terms and conditions of the Creative Commons Attribution (CC BY) license (http://creativecommons.org/licenses/by/4.0/).
Copyright: This open access article is published under a Creative Commons CC BY 4.0 license, which permit the free download, distribution, and reuse, provided that the author and preprint are cited in any reuse.


