

Submitted:
04 August 2026
Posted:
05 August 2026
You are already at the latest version
Abstract
Lignocellulose must be pretreated to digest efficiently, yet the residence time of hydrothermal treatment is seldom isolated as a variable, least of all without acid. Willow (Salix viminalis) and maize silage (Zea mays) were treated by microwave autohydrolysis with explosive decompression at 130 °C, held for 0, 5, 15 or 25 min without acid, and assessed for solubilisation, by-products, methane potential, kinetics and net energy balance. Extending the hold to 25 min raised methane potential by 81% in maize silage (to 193.8 ± 11.5 NmL CH4 g-1 VS) and by 142% in willow (to 154.8 ± 6.9 NmL CH4 g-1 VS), the larger gain going to the more recalcitrant feedstock. Solubilisation was front-loaded into the first 5 min, whereas the methane gain was back-loaded to 15–25 min and correlated most strongly with continuously released xylose (r ≥ 0.95), not the early COD or glucose burst. The acid-free route formed negligible furanic inhibitors and only sub-inhibitory phenolics, so yield rose monotonically without turnover. The incremental energy balance stayed negative (−5.4 to −8.7 kJ g-1 DM), dominated by the heating ramp; because the hold consumes no energy, longer holds improve the balance at no marginal cost.
Keywords:
anaerobic digestion
; biochemical methane potential
; microwave pretreatment
; autohydrolysis
; explosive decompression
; residence time
; energy balance
; lignocellulose
; Salix viminalis
; maize silage
1. Introduction
Woody and herbaceous lignocellulosic biomass is an abundant, non-food feedstock for biomethane, yet its conversion by anaerobic digestion is held back by the recalcitrance of the lignin–carbohydrate matrix, which restricts hydrolysis and depresses methane yield [1]. Anaerobic digestion of lignocellulosic material is consequently governed less by bulk organic content than by matrix architecture [2], and its individual structural components exert distinct effects on methane productivity and on the composition of the methanogenic community [3]. The two feedstocks studied here bracket this problem. Willow (Salix viminalis), a fast-growing short-rotation coppice, is structurally recalcitrant and yields low, highly variable methane when digested untreated — a biochemical methane potential of roughly 198 NmL CH4 g-1 VS has been reported, with values falling as low as 28.6 depending on provenance and handling [4,5]; within willow itself, fermentation efficiency is tied closely to woody-tissue traits, particularly lignin content [6]. Interest in the species is not confined to biogas, since willow is increasingly assessed as an integrated biorefinery feedstock [7]. Maize silage, by contrast, is partly hydrolysed during ensiling and digests readily (typically 196–335 NmL CH4 g-1 VS) [8,9], although the ensiling route itself measurably alters fibre composition and the biogas subsequently obtained [10]. As a widely grown energy crop it competes with food production, so raising the efficiency of its conversion remains worthwhile. A pretreatment that lifts the recalcitrant feedstock without a disproportionate energy or chemical penalty would broaden the practical substrate base for biomethane.
Thermal and thermochemical pretreatments counter recalcitrance by disrupting the fibre matrix and solubilising hemicellulose and part of the cellulose ahead of digestion; the mechanisms, and the reasons why gains differ so widely between feedstocks, have been reviewed extensively [11,12]. Acid-assisted hydrothermal treatment is effective but adds reagent cost, corrosion and neutralisation burdens and can accelerate the formation of furanic and phenolic inhibitors [13,14]. Autohydrolysis — hydrothermal treatment with water alone, in which hydronium ions from in-situ-generated organic acids catalyse hemicellulose hydrolysis — avoids added chemicals and is simpler to operate, at the cost of requiring more severe or longer conditions to reach comparable solubilisation. Microwave heating is an attractive means of delivering that severity, since volumetric energy transfer heats the aqueous matrix rapidly and can enhance solubilisation relative to conductive heating at the same nominal temperature. Microwave irradiation has been shown to disrupt the lignocellulosic structure of corn straw and release cellulose, hemicellulose and their derivatives, with a methane gain of up to 73.1% [15], and an independent comparison of convective and microwave hydrothermal pretreatment, including an energy balance, reached the same qualitative conclusion for Napier grass [16]. A complementary route to intensify treatment is to release the pressure that builds during heating in a single rapid decompression: the sudden expansion mechanically ruptures the softened matrix, in a manner related to steam explosion, exposing fresh surface to hydrolysis and to microbial attack. That the decompression itself contributes, rather than merely accompanying the heating, has been demonstrated directly: separating the two steps in the steam explosion of spruce showed that the explosion improved enzymatic digestibility by up to 90% relative to an equivalent steam treatment without it [17]. For willow specifically, steam explosion has been reported to raise methane yield by up to 50%, with the best results obtained at temperatures from 210 °C upwards [18].
Time and temperature are not independent in hydrothermal processing; they are conventionally combined into a single severity term [19]. Within this landscape, however, temperature has received far more attention than residence time, and residence time is seldom isolated as an independent variable — least of all under acid-free conditions. Yet residence time is exactly the parameter that trades fermentable-carbon release against inhibitor accumulation: prolonging the hold continues to solubilise sugars but also lets phenolics and furans build up, and every additional minute carries an energy cost. How that trade-off resolves — whether a longer hold keeps improving methane yield or tips into inhibition, and whether the marginal methane gain repays the marginal energy input — has not been established for microwave autohydrolysis of these feedstocks. Studies on other substrates show that hydrothermal severity has an optimum beyond which furan inhibition dominates [13]; in wheat straw, thermal–sulfuric acid pretreatment lowered methane yield by 29–44% relative to the untreated control, an effect attributed to furfural and HMF accumulation [20]. The acid-free, moderate-temperature, time-resolved case, however, remains unmapped. We therefore isolated residence time as the sole treatment variable in a pretreatment that couples microwave autohydrolysis with explosive decompression. Both willow and maize silage were heated to a fixed 130 °C, held for 5, 15 or 25 min and then rapidly decompressed, with an untreated feedstock as the reference control, and were assessed for liquid-phase solubilisation (COD, TOC, glucose, xylose), inhibitor formation (phenolics, HMF, furfural), biochemical methane potential, production kinetics and — as the practical criterion — the incremental net energy balance. The design is deliberately distinct from two adjacent lines of work. In a companion study on the same prototype reactor, these feedstocks were treated across temperature and heating mode at a fixed acid dose [21]; here the acid is removed and the temperature fixed, exposing the effect of residence time alone. Separately, acid-free microwave thermohydrolysis of maize silage has been mapped across temperature and time in a closed-vessel microwave system that applies heating only [22]; the present work differs in mechanism — the explosive decompression that follows heating adds a physical disruption absent from closed-vessel microwave heating — and extends the question to a second, far more recalcitrant feedstock, willow. It is likewise distinct from earlier work in which the pretreatment carried a chemical agent, such as microwave-assisted chemical thermohydrolysis of lignocellulosic waste at semi-technical scale [23]; here no reagent is added at any stage.
We hypothesised that methane yield would rise monotonically with residence time, more steeply for the recalcitrant willow than for the readily degradable silage, and that — because solubilisation is front-loaded into the first minutes of treatment — short residence times might capture most of the achievable methane gain at a fraction of the energy cost. The findings speak to how time-resolved, chemical-free pretreatment should be configured if it is to be energetically justified.
2. Materials and Methods
2.1. Feedstock
Two lignocellulosic feedstocks contrasting in recalcitrance were studied: chips of common osier (Salix viminalis, willow) and maize silage (Zea mays). Each feedstock was characterised for total, mineral and volatile solids by gravimetry. Carbon, nitrogen and hydrogen were measured with a Flash 2000 elemental analyser (Thermo Scientific). Structural fractions were resolved by detergent fractionation on a semi-automatic ANKOM220 analyser, with cellulose obtained as ADF − ADL, hemicellulose as NDF − ADF and lignin taken as ADL. The organic fraction represented 97.5% of willow dry matter and 87.2% of maize-silage dry matter, and the two feedstocks differed sharply in structural carbohydrate content (willow: 41.24% cellulose, 15.87% hemicellulose; maize silage: 8.28% and 6.14%, respectively). Feedstock properties are collected in Table 1.
2.2. Microwave Autohydrolysis with Explosive Decompression
Pretreatment was carried out in a purpose-built two-chamber prototype reactor designed to destabilise the lignocellulosic matrix by coupling hydrothermal treatment with rapid decompression. No chemical catalyst was added at any stage: solubilisation was driven by water and heat alone (autohydrolysis). Each feedstock was first comminuted to a particle size of 5–10 mm and then brought to 90% moisture with distilled water and homogenised by shaking (60 min, 130 rpm; IKA KS 4000).
The hydrated biomass was loaded into the thermally insulated upper chamber (0.5–2 L working volume) and heated by microwave to a set temperature of 130 °C under an autogenous pressure of approximately 2.5 bar, with continuous stirring for uniform heating. The reactor and the process sequence are shown in Figure 1, and the experimental design is summarised in Table 2. The experimental variable was the residence time at 130 °C, tested at 5, 15 and 25 min, so that residence time was the only variable separating the pretreated variants. An untreated feedstock, which received the same comminution and hydration but neither heating nor decompression, served as the reference control; comparisons against it therefore quantify the effect of the complete pretreatment rather than of residence time alone. On completion of the hold, the pressurised contents were released to atmospheric pressure in under 1 s into the larger lower chamber, adding a physical disruption step to the thermal–chemical solubilisation. This configuration — microwave heating followed by explosive decompression — distinguishes the pretreatment from closed-vessel microwave heating without a decompression stage. Per the reactor manual, the microwave is switched off once 130 °C is reached and only stirring operates during the hold until decompression. Because heating is not reapplied, the charge is not held isothermally but cools slowly from the setpoint; residence times are therefore nominal times elapsed after 130 °C was reached, not isothermal holds.
2.3. Liquid – Phase Characterization
After pretreatment the liquid fraction was separated and analysed. Chemical oxygen demand and total phenolics were quantified with Hach cuvette tests (LCK 914 and LCK 346, respectively); total, inorganic and organic carbon (TC, IC, TOC) were measured on a Shimadzu carbon analyser; and glucose and xylose were determined in the filtrate with Megazyme enzymatic assay kits.
Furanic degradation products (5-hydroxymethylfurfural, HMF, and furfural) were quantified by high-performance liquid chromatography on a Sykam system (S 1125 pump, S 5300 injector, S 3345 PDA detector, S 4115 oven) with a Zorbax SB-C18 column (4.6 × 150 mm, Agilent), a methanol:water (1:1) mobile phase at 0.300 mL/min, 20 µL injection and detection at 280 nm; calibration used six dilution levels of a 0.5 g/L furfural–HMF standard (Sigma-Aldrich) injected in triplicate. Samples were stored at −15 °C, thawed, centrifuged (10 min, 4500 rpm) and the supernatant analysed. All liquid-phase results are means of three replicates (n = 3).
2.4. Biochemical Methane Potential
Methane potential was measured in an AMPTS II system (Bioprocess Control, Sweden), following established practice for biochemical methane potential assays [24,25,26], in which carbon dioxide is scrubbed upstream of the volumetric cell so that the recorded volume corresponds to methane; the resolution of the volumetric cells was 10 mL. Digestion was mesophilic: the 500 mL bioreactors were held in a water bath at a constant 36 °C and stirred intermittently (30 s every 10 min at 100 rpm). Each bottle had a working volume of 200 mL, comprising the weighed substrate made up to volume with inoculum. Substrate was loaded as 3.9 g of hydrated willow slurry and 5.4 g of hydrated maize silage slurry per bottle, corresponding to 0.433 and 0.478 g VS respectively at the slurry solids content used throughout, against inoculum-only blanks, over a batch assay run to plateau. The charge was identical for the control and for all three residence times within a feedstock. Methane yield was calculated as net methane (sample minus inoculum blank) divided by the substrate VS loaded and expressed as NmL CH4 g−1 VS. Biogas composition (CH4, CO2) was determined by gas chromatography with thermal-conductivity detection.
The inoculum was anaerobic sludge obtained from an agricultural biogas plant, with a total solids content of 19.85 mg g−1, of which 13.43 mg g−1 was volatile (organic) and 6.42 mg g−1 mineral. The inoculum charge differed between the two assays (willow 5.23 g VS; maize silage 2.54 g VS per bottle), giving inoculum-to-substrate ratios of ≈ 5.9 and ≈ 2.8, respectively; this is relevant to the cross-substrate comparison and was verified against the raw AMPTS records. Blanks containing 200 mL of inoculum and no substrate were run alongside each series. All variants were run in triplicate, and means ± SD and kinetic fits are based on n = 3. Following the validation elements set out for BMP testing [25], each assay included inoculum-only blanks, was continued until the daily methane production had levelled off, and the blank was subtracted from each bottle at the matching time point and scaled to the inoculum volume actually present in that bottle rather than at the blank plateau; the inoculum contributed a large share of the gas produced, so this correction is material to the reported yields.
2.5. Energy Balance
The energetic return of pretreatment was assessed on an incremental basis. The energy input, Ein, was taken as the electrical power drawn by the reactor multiplied by the measured time needed to reach the set temperature and normalised to the dry matter charged:
where P = 0.9 kW is the rated maximum draw of the whole unit taken from the manufacturer’s manual (not the 800 W microwave output of the magnetron, and with no efficiency factor applied), theat is the measured time to reach 130 °C (30 min for maize silage, 33 min for willow) and mDM is the 200 g of dry matter charged per 2-L batch. Because heating is switched off once the set temperature is reached and only stirring operates until decompression, the hold contributes no heating energy and Ein is independent of residence time.
Ein = P × theat / mDM
The energy output, Eout, was computed from the measured methane yield and the lower heating value of methane:
where BMP is the biochemical methane potential (NmL CH4 g−1 VS), fVS the volatile-solids fraction of the dry matter (0.975 for willow, 0.872 for maize silage) and LHV = 35.8 kJ NL−1.
Eout = BMP × fVS × LHV
Two balances were computed. The gross balance is Eout − Ein. The incremental balance, used as the primary criterion, is (Eout,treated − Eout,control) − Ein, since the untreated control yields methane at no energy cost; the share of the input recovered is (Eout,treated − Eout,control) / Ein. These figures are estimates from rated power and measured heating time rather than direct wattmeter readings, and they exclude the stirring draw during the hold.
2.6. Data Analysis
Results are reported as means ± standard deviation (n = 3). For each feedstock, the effect of residence time on methane yield was tested by one-way analysis of variance across the four residence times, with treated variants compared to the untreated control by two-sided Dunnett tests. Cumulative methane curves were fitted with the modified Gompertz model [27] by non-linear least squares, giving the modelled plateau (Pmax), the maximum production rate (Rm) and the lag phase (λ). Fits reported in the main text were made to the mean net curve of each group, expressed per gram of substrate VS; per-replicate fits are given in Table S3. Associations between liquid-phase composition and methane yield were examined by Pearson correlation. The substrate-specific theoretical methane potential was calculated from the Buswell–Boyle relation using the measured C, H and N contents, with oxygen obtained by difference (100% minus C, H, N and ash) and sulphur neglected, expressed on a volatile-solids basis. Computations were performed in Statistica 13.3 (TIBCO Software Inc.).
3. Results and Discussion
3.1. Solubilisation and Sugar Release
Across both feedstocks, acid-free microwave autohydrolysis mobilised organic matter into the liquid phase in direct proportion to residence time (Table 3). For willow, soluble chemical oxygen demand rose from 4.02 g L−1 in the untreated control to 10.55, 12.40 and 13.85 g L−1 after 5, 15 and 25 min — a 3.4-fold increase — and total organic carbon followed the same trajectory (1793 → 5787 mg L−1, 3.2-fold). Maize silage, which enters digestion already partly solubilised by ensiling, started from a much higher baseline (COD 25.7 g L−1; TOC 13 320 mg L−1) and increased 2.4- and 4.9-fold, to 62.3 g L−1 and 65 550 mg L−1 at 25 min. In both feedstocks the largest single increment occurred within the first 5 min: willow COD, for example, gained 6.53 g L−1 between 0 and 5 min but only a further 3.30 g L−1 over the next 20 min. Most of the accessible organic matter is therefore released early, and each additional minute of holding returns progressively less — a pattern that becomes important when the energy cost of a longer hold is weighed against its yield (Section 3.6).
The monosaccharide data expose a sharper contrast between the two feedstocks. In willow, filtrate glucose rose from 4.4 to 537 mg L−1, a 122-fold increase, while xylose rose 3.8-fold (28.3 → 106 mg L−1). The magnitude of the glucose response is consistent with willow’s high cellulose content (41.24%): even without an acid catalyst, water at 130 °C progressively hydrolysed accessible glucan, and the near-absence of soluble glucose in the untreated control underscores how effectively native willow resists solubilisation until it is treated. Maize silage showed a more modest glucose response (13 → 139 mg L−1, 10.7-fold) but carried higher absolute xylose throughout (191 → 445 mg L−1), reflecting both its lower structural-carbohydrate content and the partial hydrolysis already achieved during ensiling. That willow overtakes silage in absolute soluble glucose by 25 min (537 vs 139 mg L−1), despite starting an order of magnitude lower, is the clearest signature of autohydrolysis acting on a cellulose-rich, initially recalcitrant matrix [28]. Liquid hot water treatment of woody biomass shows the same directional response, with sugar release rising as conditions intensify [29].
Taken together, the liquid-phase results identify residence time as an effective, catalyst-free lever on solubilisation, acting most strongly on the more recalcitrant feedstock. The same progressive hydrolysis that liberates fermentable carbon, however, also generates by-products (Section 3.2), so its net consequence for methane recovery cannot be inferred from solubilisation alone (Section 3.3).
3.2. Formation of By-Products
Two classes of potential inhibitor were followed: phenolics released from lignin, and the furanic sugar-degradation products HMF and furfural (Table 4). Their behaviour diverged sharply. Phenolic concentrations rose steadily with residence time in both feedstocks — from 35.0 to 200.1 mg L−1 in willow (5.7-fold) and from 93.4 to 154.6 mg L−1 in maize silage — tracking the solubilisation trend of Section 3.1. This is the reverse of what we found under acid-assisted treatment of the same feedstocks, where phenolics declined as acid catalysed their condensation into humin-like material [21]; with no acid present, that condensation pathway is suppressed and phenolics accumulate in solution as lignin is progressively hydrolysed. Rising phenolics need not translate into inhibition. In batch assays on cellulose, specific methanogenic activity was only half-inhibited at 1.40 g L−1 of phenol, and digester performance was maintained at 0.50 g L−1 [30]; the maximum measured here, 0.200 g L−1 in willow, lies well below both. The same decoupling has been reported for enzymatic pretreatment, where a marked increase in total phenolics never reached inhibitory values, with willow among the substrates releasing most phenolics because of its lignin content [31,32,33].
3.3. Biochemical Methane Potential
Methane potential increased with residence time in both feedstocks, with no sign of the yield turnover that inhibitor accumulation would produce (Figure 2; Table S1). For maize silage, BMP rose from 133.1 ± 22.7 NmL CH4 g−1 VS in the untreated control to 236.5 ± 9.6, 312.6 ± 22.3 and 384.8 ± 21.4 NmL CH4 g−1 VS after 5, 15 and 25 min — a 189% gain at the longest hold. For willow, BMP climbed from 145.7 ± 14.4 to 160.6 ± 6.8, 229.2 ± 13.8 and 333.5 ± 14.2 NmL CH4 g−1 VS, a 129% increase. Measured against the substrate-specific theoretical potential calculated from the elemental composition (Buswell–Boyle: 465.7 NmL CH4 g−1 VS for willow, 522.0 for maize silage), the treatment lifted willow from 31 to 72% and maize silage from 26 to 74% of theoretical, so both feedstocks finish at a comparable degree of conversion despite their different starting points. One-way ANOVA confirmed a significant effect of residence time in both (willow F(3,8) = 136.6, p < 0.001; maize silage F(3,8) = 89.1, p < 0.001). The untreated silage control (133.1 NmL CH4 g−1 VS) sits below the 196–335 NmL CH4 g−1 VS range cited above; the ash content of this silage batch (12.8% of dry matter, against 3–8% typical for maize silage) points to soil contamination, which dilutes the fermentable organic fraction. Because every variant within a feedstock was run at an identical charge, this offset does not affect the residence-time series on which the study rests.
The contrast between feedstocks is the central result: the two substrates reach a similar final conversion but on very different timescales. Maize silage responds immediately: 5 min of residence already delivers a 78% gain (p < 0.001), and by 15 min it has more than doubled. Willow does not move at all in the same window — its 5-min gain of 10% is not significant (p = 0.390) — and only from 15 min does it respond, then steeply, to +129% at 25 min. This ordering follows the accessibility of the two matrices. Silage enters digestion already partly hydrolysed by ensiling, so a brief pressurised soak followed by decompression is enough to release the fraction that was still bound; willow’s cellulose is protected by a lignified woody structure that a 5-min hold does not open, and the gain appears only once the hold is long enough for hydrolysis to reach the structural carbohydrate before decompression disrupts it. The magnitude for willow is consistent with the literature while being reached by a different route: aqueous ammonia soaking, an alkaline treatment, raised willow methane yield by 94–162% [34], and steam explosion raised it by up to 50%, though only at temperatures from 210 °C [18]. The present +129% was obtained without any reagent and at 130 °C, which suggests that the decompression step substitutes for part of the severity that would otherwise have to be supplied thermally or chemically — in line with the finding that explosive decompression alone can improve digestibility by up to 90% over steaming without it [17]. Set against the wider literature, where pretreatment effects on methane yield span roughly 20–100% and thermal treatment at 120–121 °C typically returns 20–30% [35], both gains sit at or above the upper end of what pretreatment normally delivers. Steam explosion of birch, another woody feedstock, raised methane by 118% — but required 210 °C [36].
The timing of the response is worth noting, because it decouples from solubilisation. Solubilisation is front-loaded into the first 5 min (Section 3.1) in both feedstocks, yet only silage converts that early release into methane at once. In willow the 5-min solubilisation spike produces no significant methane gain, and the yield appears later, between 15 and 25 min. The early spike and the methane are therefore not the same currency: what silage gains at 5 min is readily fermentable material liberated from an already loose matrix, whereas what willow gains after 15 min is structural carbohydrate made accessible by progressive disruption. A comparison of several physicochemical pretreatments applied to a single corn stover feedstock under identical digestion conditions likewise found that the greatest organic-matter solubilisation did not correspond to the greatest methane yield [37].
3.4. Linking Liquid-Phase Chemistry to Methane Yield
Across the four residence times, methane yield rose together with every liquid-phase indicator, but the two feedstocks are not equally informative (Figure 3). In willow, BMP correlated far more strongly with soluble xylose (Pearson r = 0.996) than with COD, TOC, glucose or phenolics (r = 0.63–0.84), a clear separation. In maize silage every indicator correlated strongly (r = 0.93–1.00, highest for glucose at 0.996), so no variable stands out; with a monotonic four-point series this is expected and the silage coefficients should not be read as evidence for a specific mechanism. With only four time points per feedstock all coefficients are indicative rather than definitive.
3.5. Methane Production Kinetics
The modified Gompertz model [27] was fitted to the mean net cumulative methane curves (Figure 4, Table 5). For willow the fits were well conditioned (R2 = 0.72–0.93) and the modelled plateau tracked the measured yield closely, rising from 113.5 to 330.7 NmL CH4 g−1 VS between the control and the 25-min hold. The lag phase was effectively absent in every variant (λ ≈ 0), pointing to an active inoculum and immediately available early substrate, consistent with the front-loaded solubilisation of Section 3.1. Willow released 30–51% of its net methane within the first two days, so the rate constant is resolvable at daily sampling; Rm did not vary systematically with residence time (15.6–41.6 NmL g−1 VS d−1), indicating that the treatment expressed itself as a higher ultimate yield rather than a faster conversion of the woody matrix.
For maize silage the rate could not be resolved. Between 64 and 112% of the net methane appeared within the first two days, and in the 15-min variant the net curve peaked on day 2 and then declined as the inoculum blank continued to rise, so the fitted Rm values (70–364 NmL g−1 VS d−1) are numerical artefacts of an almost vertical initial rise rather than measurable kinetics. Only the modelled plateau is meaningful for this feedstock; it is reported in Table 5 and the full parameter set, with fit diagnostics, is given in Table S3. Higher-frequency gas measurement would be required to characterise silage kinetics under this pretreatment. Interpreting the plateau through biochemical composition is consistent with recent batch-kinetic work on maize silage [9]. The converse pattern to willow is also documented: CO2-assisted hydrothermal pretreatment of five lignocellulosic feedstocks accelerated hydrolysis by 20–30%, and by 172% for the highly refractory Douglas fir bark, yet had no discernible effect on ultimate biodegradation [38]. Rate and extent are therefore separable in either direction, and in steam-exploded birch combined with bioaugmentation both rose together [36]. The willow result here — extent raised, rate unchanged — is consistent with a treatment that makes additional substrate available without altering how fast the woody matrix is hydrolysed.
3.6. Net Energy Balance
The pretreatment energy input was set entirely by the heating stage. Reaching 130 °C took 30 min for maize silage and 33 min for willow at 0.9 kW; the microwave was off during the hold (only stirring operated), so residence time added no energy and the input was fixed per feedstock at 8.10 and 8.91 kJ g−1 DM respectively (Table 6). Methane output, by contrast, rose with residence time, so the balance improved monotonically as the hold lengthened even though the energy cost did not change.
On an incremental basis — the additional methane energy of a treated variant over the untreated control, minus the pretreatment input — every variant remained net-negative, but the deficit narrowed sharply with residence time and the longest hold came close to break-even (Figure 5; Table 6). A pretreatment is justified only when its energy balance is positive [39], and an energy assessment of thermal and microwave pretreatments concluded that treatments below 100 °C tend to return a positive balance whereas those at or above 100 °C generally do not [40]; the present 130 °C window lies entirely above that threshold. A direct comparison on corn stover reached the same conclusion for this class of treatment specifically: liquid hot-compressed water pretreatment had an economic basis within a biogas plant, whereas steam explosion and ultrasonic disintegration were not energetically profitable [41]. At 5 min the incremental methane recovered only 6% of the input for willow and 40% for maize silage; at 25 min recovery reached 74% and 97%, narrowing the deficit to −2.36 and −0.24 kJ g−1 DM. On a gross basis (total methane energy minus input) the 25-min variants were already positive for both feedstocks (+2.73 kJ g−1 DM for willow, +3.91 for maize silage), as was maize silage at 15 min.
Two conclusions follow. First, because no additional heating energy is applied during the hold, longer holds are favourable — they raise methane recovery at no marginal heating cost, so the 25-min variant is the best operating point on energy grounds as well as on yield, and nothing in these data suggests the optimum has been passed. Second, the remaining deficit is small enough that modest improvements to the heating stage would close it: a shorter or more efficient ramp, a lower set temperature, or heat recovery. One route that does not require cutting the input is to stop discarding the liquid phase: digesting the hydrolysate generated during microwave-assisted hydrothermal pretreatment as a co-substrate has been shown to raise the overall energy gain [42]. A positive incremental balance is therefore within reach by reducing the heating energy, not by shortening the hold — the same conclusion the acid-assisted route reached [21]. These figures are estimates built from rated power and measured heating time rather than wattmeter logging, and they exclude the stirring draw during the hold.
4. Conclusions
Residence time is an effective, catalyst-free lever on methane recovery from lignocellulose when microwave heating is combined with explosive decompression. Extending the hold at 130 °C from 0 to 25 min raised the biochemical methane potential of maize silage by 189% (to 384.8 NmL CH4 g−1 VS) and of willow by 129% (to 333.5 NmL CH4 g−1 VS), bringing both feedstocks to 72–74% of their theoretical potential from very different starting points. The two responded on different timescales: maize silage gained 78% within the first 5 min, whereas willow showed no significant gain before 15 min, reflecting how much structural disruption each matrix requires before its carbohydrate becomes accessible. Solubilisation was front-loaded into the first 5 min in both feedstocks, so for willow the early solubilisation spike and the methane gain are decoupled, the yield instead following progressively released, hemicellulose-derived xylose. Because the acid-free route formed only negligible furanic inhibitors and sub-inhibitory phenolics, yield rose monotonically with no turnover across the range tested. The incremental energy balance remained negative throughout, dominated by the 30–33 min microwave ramp to 130 °C, but improved steadily with residence time and approached break-even at 25 min, recovering 74% of the input for willow and 97% for maize silage; on a gross basis the longest hold was already energy-positive for both. Since the hold consumes no heating energy, the longest hold tested is the preferred operating point, and the route to a positive incremental balance lies in reducing the heating energy rather than in shortening the hold.
Supplementary Materials
The following supporting information can be downloaded at the website of this paper posted on Preprints.org. Table S1: Biochemical methane potential (mean ± SD, n = 3) and gain over the untreated control; Table S2: ANOVA and Dunnett outputs; Table S3: per-replicate Gompertz fits.
Author Contributions
Conceptualization, A.N. and M.Z.; methodology, A.N. and M.Z.; validation, A.N.; formal analysis, A.N. and M.D.; investigation, M.D.; data curation, A.N.; writing—original draft preparation, A.N.; writing—review and editing, A.N. and M.Z.; visualization, A.N.; supervision, M.Z.; project administration, A.N.; funding acquisition, A.N. All authors have read and agreed to the published version of the manuscript.
Funding
This study was part of the project “Development of pretreatment technology for lignocellulosic biomass in context to second generation biofuel production”, carried out under the LIDER XIII programme and financed by the National Centre for Research and Development, grant no. LIDER 13/0050/2022. Co-financing amount: PLN 1,410,000.00.
Data Availability Statement
The data presented in this study are available on request from the corresponding author.
Conflicts of Interest
The authors declare no conflicts of interest.
Acknowledgments
During the preparation of this work, the authors used an AI-based assistant (Claude, Anthropic) to support translation, language editing, and the preparation of the graphical abstract. After using this tool, the authors reviewed and edited the content as necessary and take full responsibility for the content of the publication.
References
- Anacleto, T.M.; Kozlowsky-Suzuki, B.; Björn, A.; Shakeri Yekta, S.; Masuda, L.S.M.; de Oliveira, V.P.; Enrich-Prast, A. Methane yield response to pretreatment is dependent on substrate chemical composition: a meta-analysis on anaerobic digestion systems. Sci. Rep. 2024, 14, 1240. [Google Scholar] [CrossRef] [PubMed]
- Kamperidou, V.; Terzopoulou, P. Anaerobic digestion of lignocellulosic waste materials. Sustainability 2021, 13, 12810. [Google Scholar] [CrossRef]
- Pokoj, T.; Klimiuk, E.; Bułkowska, K.; Kowal, P.; Ciesielski, S. Effect of individual components of lignocellulosic biomass on methane production and methanogen community structure. Waste Biomass Valoriz. 2020, 11, 1421–1433. [Google Scholar] [CrossRef]
- Ohlsson, J.A.; Harman-Ware, A.E.; Sandgren, M.; Schnürer, A. Biomass recalcitrance in willow under two biological conversion paradigms: enzymatic hydrolysis and anaerobic digestion. BioEnergy Res. 2020, 13, 260–270. [Google Scholar] [CrossRef]
- Turick, C.E.; Peck, M.W.; Chynoweth, D.P.; Jerger, D.E.; White, E.H.; Zsuffa, L.; Kenney, W.A. Methane fermentation of woody biomass. Bioresour. Technol. 1991, 37, 141–147. [Google Scholar] [CrossRef]
- Dudits, D.; Cseri, A.; Török, K.; Sass, L.; Zombori, Z.; Ferenc, G.; Poór, P.; Borbély, P.; Czekus, Z.; Vanková, R.; Dobrev, P.; Szantó, J.; Bagi, Z.; Kovács, K.L. Triploid hybrid vigor in above-ground growth and methane fermentation efficiency of energy willow. Front. Plant Sci. 2022, 13, 770284. [Google Scholar] [CrossRef] [PubMed]
- Baker, P.; Charlton, A.; Johnston, C.; Leahy, J.J.; Lindegaard, K.; Pisano, I.; Prendergast, J.; Preskett, D.; Skinner, C. A review of willow (Salix spp.) as an integrated biorefinery feedstock. Ind. Crops Prod. 2022, 189, 115823. [Google Scholar] [CrossRef]
- Gao, R.; Yuan, X.; Zhu, W.; Wang, X.; Chen, S.; Cheng, X.; Cui, Z. Methane yield through anaerobic digestion for various maize varieties in China. Bioresour. Technol. 2012, 118, 611–614. [Google Scholar] [CrossRef] [PubMed]
- Pilarski, K.; Pilarska, A.A.; Pietrzak, M.B.; Igliński, B. Bioenergy from maize silage by anaerobic digestion: batch kinetics in relation to biochemical composition. Energies 2026, 19, 1105. [Google Scholar] [CrossRef]
- Kupryaniuk, K.; Witaszek, K.; Vaskina, I.; Filipek-Kaźmierczak, S.; Kupryaniuk, J.; Sołowiej, P.; Dach, J. The effect of corn ensiling methods on digestibility and biogas yield. Energies 2025, 18, 188. [Google Scholar] [CrossRef]
- Mirmohamadsadeghi, S.; Karimi, K.; Azarbaijani, R.; Parsa Yeganeh, L.; Angelidaki, I.; Nizami, A.-S.; Bhat, R.; Dashora, K.; Vijay, V.K.; Aghbashlo, M.; Gupta, V.K.; Tabatabaei, M. Pretreatment of lignocelluloses for enhanced biogas production: a review on influencing mechanisms and the importance of microbial diversity. Renew. Sustain. Energy Rev. 2021, 135, 110173. [Google Scholar] [CrossRef]
- Khan, M.U.; Usman, M.; Ashraf, M.A.; Dutta, N.; Luo, G.; Zhang, S. A review of recent advancements in pretreatment techniques of lignocellulosic materials for biogas production: opportunities and limitations. Chem. Eng. J. Adv. 2022, 10, 100263. [Google Scholar] [CrossRef]
- Phuttaro, C.; Sawatdeenarunat, C.; Surendra, K.C.; Boonsawang, P.; Chaiprapat, S.; Khanal, S.K. Anaerobic digestion of hydrothermally-pretreated lignocellulosic biomass: influence of pretreatment temperatures, inhibitors and soluble organics on methane yield. Bioresour. Technol. 2019, 284, 128–138. [Google Scholar] [CrossRef] [PubMed]
- Pekárová, S.; Dvořáčková, M.; Stloukal, P.; Ingr, M.; Šerá, J.; Koutný, M. Quantitation of the inhibition effect of model compounds representing plant biomass degradation products on methane production. BioResources 2017, 12, 2421–2432. [Google Scholar] [CrossRef]
- Wang, C.; Shao, Z.; Qiu, L.; Hao, W.; Qu, Q.; Sun, G. The solid-state physicochemical properties and biogas production of the anaerobic digestion of corn straw pretreated by microwave irradiation. RSC Adv. 2021, 11, 3575–3584. [Google Scholar] [CrossRef] [PubMed]
- Saritpongteeraka, K.; Kaewsung, J.; Charnnok, B.; Chaiprapat, S. Comparing low-temperature hydrothermal pretreatments through convective heating versus microwave heating for Napier grass digestion. Processes 2020, 8, 1221. [Google Scholar] [CrossRef]
- Pielhop, T.; Amgarten, J.; Rudolf von Rohr, P.; Studer, M.H. Steam explosion pretreatment of softwood: the effect of the explosive decompression on enzymatic digestibility. Biotechnol. Biofuels 2016, 9, 152. [Google Scholar] [CrossRef] [PubMed]
- Estevez, M.M.; Linjordet, R.; Morken, J. Effects of steam explosion and co-digestion in the methane production from Salix by mesophilic batch assays. Bioresour. Technol. 2012, 104, 749–756. [Google Scholar] [CrossRef] [PubMed]
- Overend, R.P.; Chornet, E.; Gascoigne, J.A. Fractionation of lignocellulosics by steam-aqueous pretreatments. Philos. Trans. R. Soc. Lond. A 1987, 321, 523–536. [Google Scholar] [CrossRef]
- Rahmani, A.M.; Tyagi, V.K.; Kazmi, A.A.; Ojha, C.S.P. Hydrothermal and thermal-acid pretreatments of wheat straw: methane yield, recalcitrant formation, process inhibition, kinetic modeling. Energy 2023, 283, 129083. [Google Scholar] [CrossRef]
- Nowicka, A.; Dudek, M.; Zieliński, M. Microwave versus conventional acid-assisted thermohydrolysis of willow and maize silage: methane yield and the energy cost of pretreatment. Preprints 2026, 2026071774. [Google Scholar] [CrossRef]
- Nowicka, A.; Dudek, M.; Dębowski, M.; Markowski, M.; Białobrzewski, I.; Zieliński, M. Influence of microwave thermohydrolysis on biomass digestion. Energies 2025, 18, 1370. [Google Scholar] [CrossRef]
- Dębowski, M.; Zieliński, M.; Nowicka, A.; Kazimierowicz, J. Influence of microwave-assisted chemical thermohydrolysis of lignocellulosic waste biomass on anaerobic digestion efficiency. Energies 2024, 17, 4207. [Google Scholar] [CrossRef]
- Filer, J.; Ding, H.H.; Chang, S. Biochemical methane potential (BMP) assay method for anaerobic digestion research. Water 2019, 11, 921. [Google Scholar] [CrossRef]
- Holliger, C.; Alves, M.; Andrade, D.; Angelidaki, I.; Astals, S.; Baier, U.; Bougrier, C.; Buffière, P.; Carballa, M.; de Wilde, V.; et al. Towards a standardization of biomethane potential tests. Water Sci. Technol. 2016, 74, 2515–2522. [Google Scholar] [CrossRef] [PubMed]
- VDI 4630; Fermentation of Organic Materials — Characterisation of the Substrate, Sampling, Collection of Material Data, Fermentation Tests. Verein Deutscher Ingenieure: Düsseldorf, Germany, 2016.
- Zwietering, M.H.; Jongenburger, I.; Rombouts, F.M.; van ’t Riet, K. Modeling of the bacterial growth curve. Appl. Environ. Microbiol. 1990, 56, 1875–1881. [Google Scholar] [CrossRef] [PubMed]
- Kučerová, V.; Výbohová, E. Release of saccharides during hot-water pretreatment of willow wood (Salix alba L.). Cellul. Chem. Technol. 2018, 52, 381–386. [Google Scholar]
- Antonopoulou, G.; Papadopoulou, K.; Alexandropoulou, M.; Lyberatos, G. Liquid hot water treatment of woody biomass at different temperatures: the effect on composition and energy production in the form of gaseous biofuels. Sustain. Chem. Pharm. 2024, 38, 101485. [Google Scholar] [CrossRef]
- Chapleur, O.; Madigou, C.; Civade, R.; Rodolphe, Y.; Mazéas, L.; Bouchez, T. Increasing concentrations of phenol progressively affect anaerobic digestion of cellulose and associated microbial communities. Biodegradation 2016, 27, 15–27. [Google Scholar] [CrossRef] [PubMed]
- Schroyen, M.; Vervaeren, H.; Vandepitte, H.; Van Hulle, S.W.H.; Raes, K. Effect of enzymatic pretreatment of various lignocellulosic substrates on production of phenolic compounds and biomethane potential. Bioresour. Technol. 2015, 192, 696–702. [Google Scholar] [CrossRef] [PubMed]
- Monlau, F.; Sambusiti, C.; Barakat, A.; Quéméneur, M.; Trably, E.; Steyer, J.-P.; Carrère, H. Do furanic and phenolic compounds of lignocellulosic and algae biomass hydrolyzate inhibit anaerobic mixed cultures? A comprehensive review. Biotechnol. Adv. 2014, 32, 934–951. [Google Scholar] [CrossRef] [PubMed]
- Tan, Z.; Li, X.; Yang, C.; Liu, H.; Cheng, J.J. Inhibition and disinhibition of 5-hydroxymethylfurfural in anaerobic fermentation: a review. Chem. Eng. J. 2021, 424, 130560. [Google Scholar] [CrossRef]
- Jurado, E.; Gavala, H.N.; Skiadas, I.V. Enhancement of methane yield from wheat straw, miscanthus and willow using aqueous ammonia soaking. Environ. Technol. 2013, 34, 2069–2075. [Google Scholar] [CrossRef] [PubMed]
- Pilarski, K.; Pilarska, A.A. Kinetics and energy yield in anaerobic digestion: effects of substrate composition and fundamental operating conditions. Energies 2025, 18, 6262. [Google Scholar] [CrossRef]
- Mulat, D.G.; Huerta, S.G.; Kalyani, D.; Horn, S.J. Enhancing methane production from lignocellulosic biomass by combined steam-explosion pretreatment and bioaugmentation with cellulolytic bacterium Caldicellulosiruptor bescii. Biotechnol. Biofuels 2018, 11, 19. [Google Scholar] [CrossRef] [PubMed]
- Fernández-Rodríguez, M.J.; Mushtaq, M.; Tian, L.; Jiménez-Rodríguez, A.; Rincón, B.; Gilroyed, B.H.; Borja, R. Evaluation and modelling of methane production from corn stover pretreated with various physicochemical techniques. Waste Manag. Res. 2022, 40, 698–705. [Google Scholar] [CrossRef] [PubMed]
- Eskicioglu, C.; Monlau, F.; Barakat, A.; Ferrer, I.; Kaparaju, P.; Trably, E.; Carrère, H. Assessment of hydrothermal pretreatment of various lignocellulosic biomass with CO2 catalyst for enhanced methane and hydrogen production. Water Res. 2017, 120, 32–42. [Google Scholar] [CrossRef] [PubMed]
- Witaszek, K.; Pilarski, K.; Niedbała, G.; Pilarska, A.A.; Herkowiak, M. Energy efficiency of comminution and extrusion of maize substrates subjected to methane fermentation. Energies 2020, 13, 1887. [Google Scholar] [CrossRef]
- Balasundaram, G.; Vidyarthi, P.K.; Gahlot, P.; Arora, P.; Kumar, V.; Kumar, M.; Kazmi, A.A.; Tyagi, V.K. Energy feasibility and life cycle assessment of sludge pretreatment methods for advanced anaerobic digestion. Bioresour. Technol. 2022, 357, 127345. [Google Scholar] [CrossRef] [PubMed]
- Capári, D.; Dörgő, G.; Dallos, A. Comparison of the effects of thermal pretreatment, steam explosion and ultrasonic disintegration on digestibility of corn stover. J. Sustain. Dev. Energy Water Environ. Syst. 2016, 4, 107–126. [Google Scholar] [CrossRef]
- Zhao, Z.; Shao, Z.; Qu, Q.; Ji, M.; Cheng, D.; Guo, X. Promoting the overall energy profit through using the liquid hydrolysate during microwave hydrothermal pretreatment of wheat straw as co-substrate for anaerobic digestion. Sci. Total Environ. 2023, 857, 159463. [Google Scholar] [CrossRef] [PubMed]
Figure 1.
The two-chamber pretreatment reactor and the process sequence. (a) Layout of the unit: the microwave-heated, stirred upper chamber, the quick-release valve, and the lower chamber held at atmospheric pressure into which the charge is discharged. (b) Process sequence for one run: the charge is heated to the 130 °C set point over 30–33 min with the microwave on, held for 5, 15 or 25 min with the microwave off and only stirring in operation, then released through the valve in under 1 s (▼).
Figure 1.
The two-chamber pretreatment reactor and the process sequence. (a) Layout of the unit: the microwave-heated, stirred upper chamber, the quick-release valve, and the lower chamber held at atmospheric pressure into which the charge is discharged. (b) Process sequence for one run: the charge is heated to the 130 °C set point over 30–33 min with the microwave on, held for 5, 15 or 25 min with the microwave off and only stirring in operation, then released through the valve in under 1 s (▼).
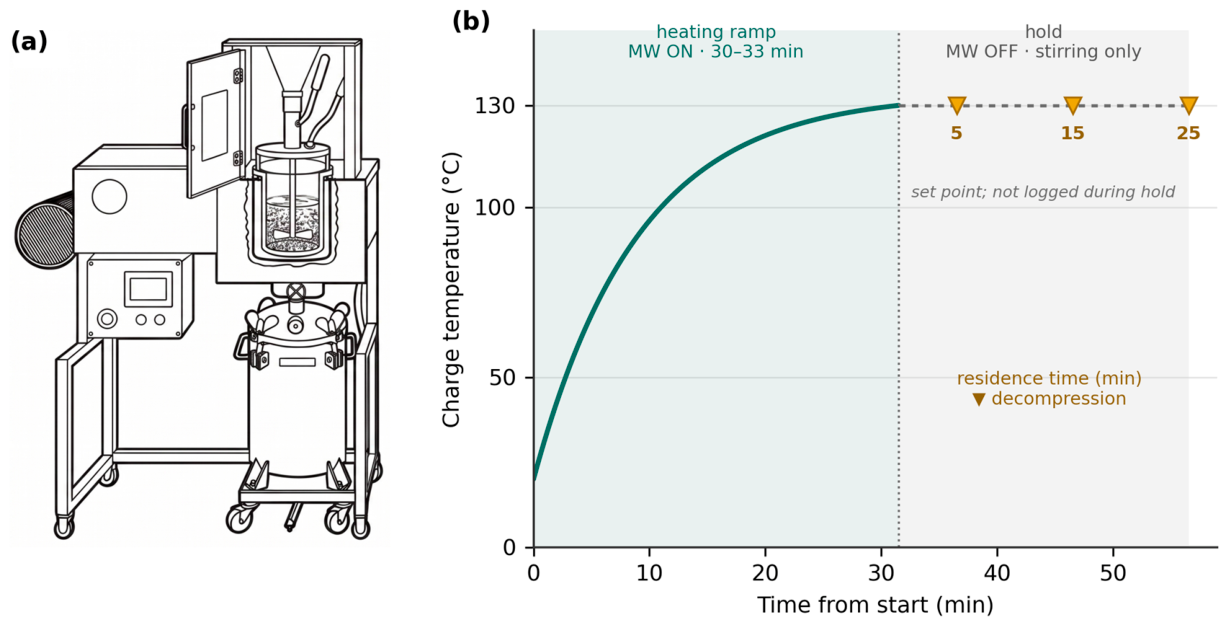
Figure 2.
Biochemical methane potential (net CH4 per g substrate VS) of willow and maize silage after microwave autohydrolysis with explosive decompression at 130 °C for 0 (control), 5, 15 and 25 min. Bars are means ± SD (n = 3); labels give the gain over the untreated control, tested by one-way ANOVA with two-sided Dunnett tests against the control (ns, not significant; *** p < 0.001; Table S2).
Figure 2.
Biochemical methane potential (net CH4 per g substrate VS) of willow and maize silage after microwave autohydrolysis with explosive decompression at 130 °C for 0 (control), 5, 15 and 25 min. Bars are means ± SD (n = 3); labels give the gain over the untreated control, tested by one-way ANOVA with two-sided Dunnett tests against the control (ns, not significant; *** p < 0.001; Table S2).
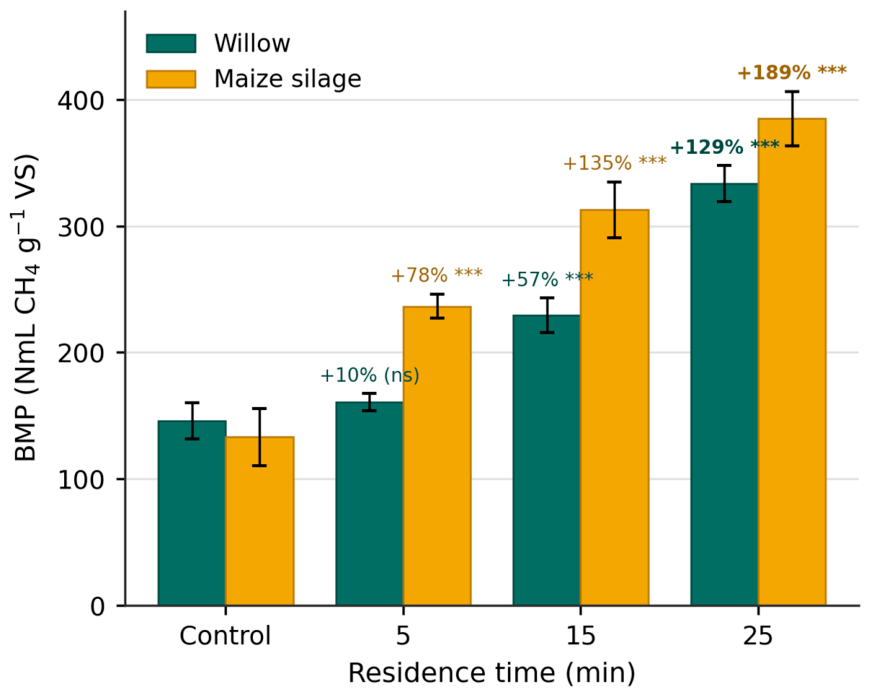
Figure 3.
Liquid-phase chemistry versus methane yield: (a) BMP against soluble xylose with per-feedstock linear fits and Pearson r; (b) Pearson correlation of BMP with each liquid-phase indicator across the four residence times (indicative given only four points).
Figure 3.
Liquid-phase chemistry versus methane yield: (a) BMP against soluble xylose with per-feedstock linear fits and Pearson r; (b) Pearson correlation of BMP with each liquid-phase indicator across the four residence times (indicative given only four points).
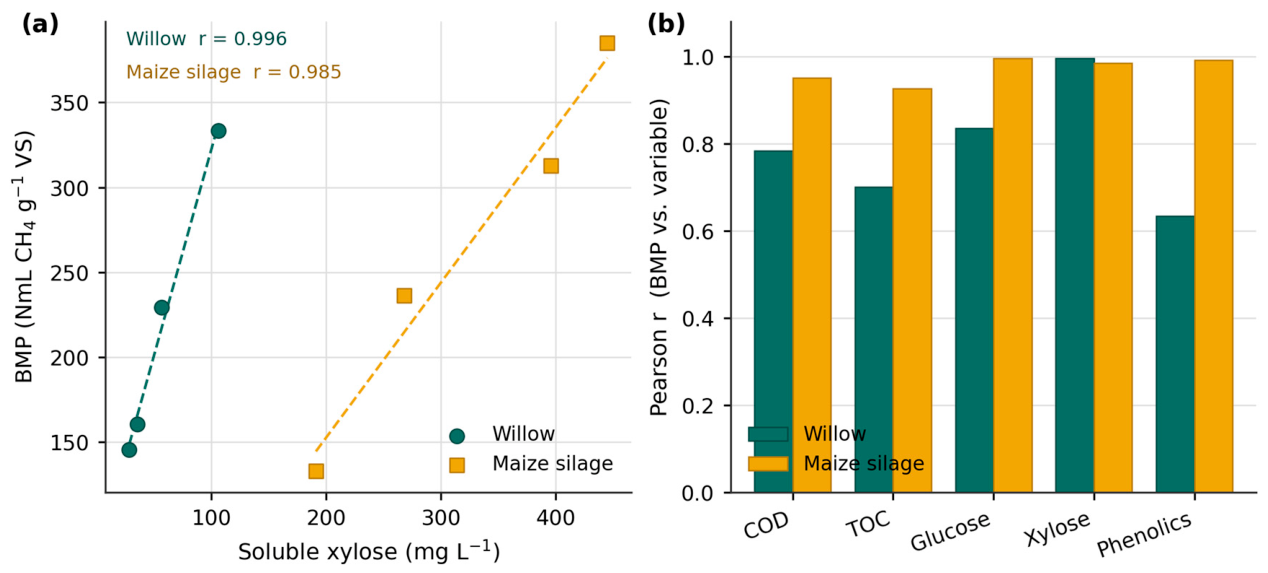
Figure 4.
Measured net cumulative methane production for (a) willow and (b) maize silage at each residence time. Lines are means of three replicates and shaded bands are ± SD; yields are expressed per gram of substrate VS after time-matched subtraction of the inoculum blank. Fitted Gompertz parameters are given in Table 5; note the different y-axis scales.
Figure 4.
Measured net cumulative methane production for (a) willow and (b) maize silage at each residence time. Lines are means of three replicates and shaded bands are ± SD; yields are expressed per gram of substrate VS after time-matched subtraction of the inoculum blank. Fitted Gompertz parameters are given in Table 5; note the different y-axis scales.
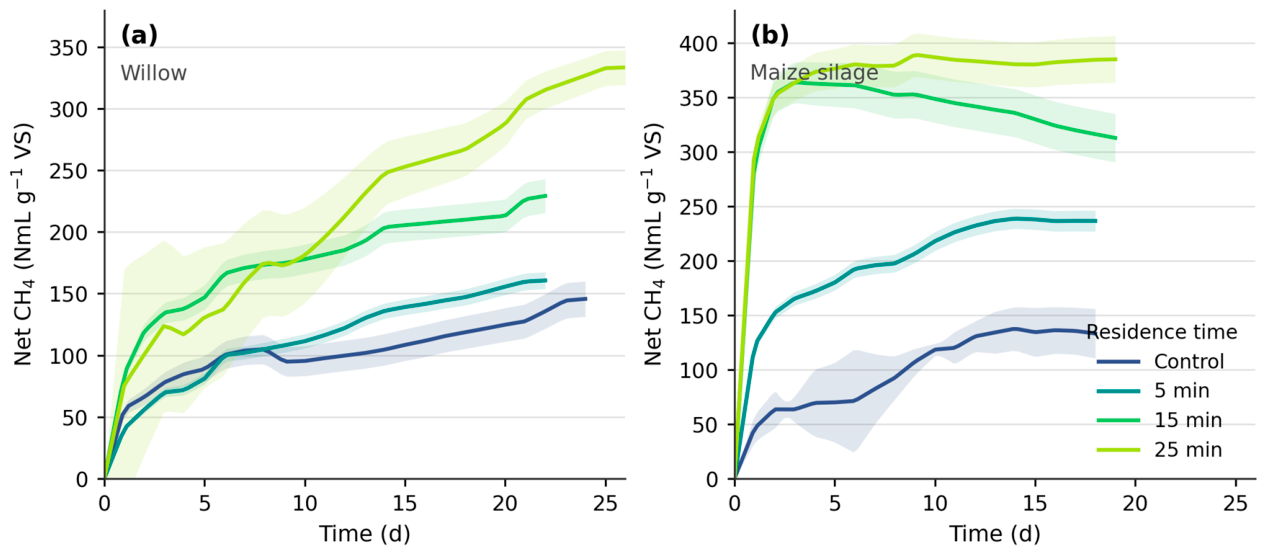
Figure 5.
Incremental net energy balance (additional methane energy over the untreated control minus pretreatment input) for willow and maize silage at 5, 15 and 25 min. All variants are net-negative; labels give the percentage of pretreatment energy recovered (Table 6).
Figure 5.
Incremental net energy balance (additional methane energy over the untreated control minus pretreatment input) for willow and maize silage at 5, 15 and 25 min. All variants are net-negative; labels give the percentage of pretreatment energy recovered (Table 6).
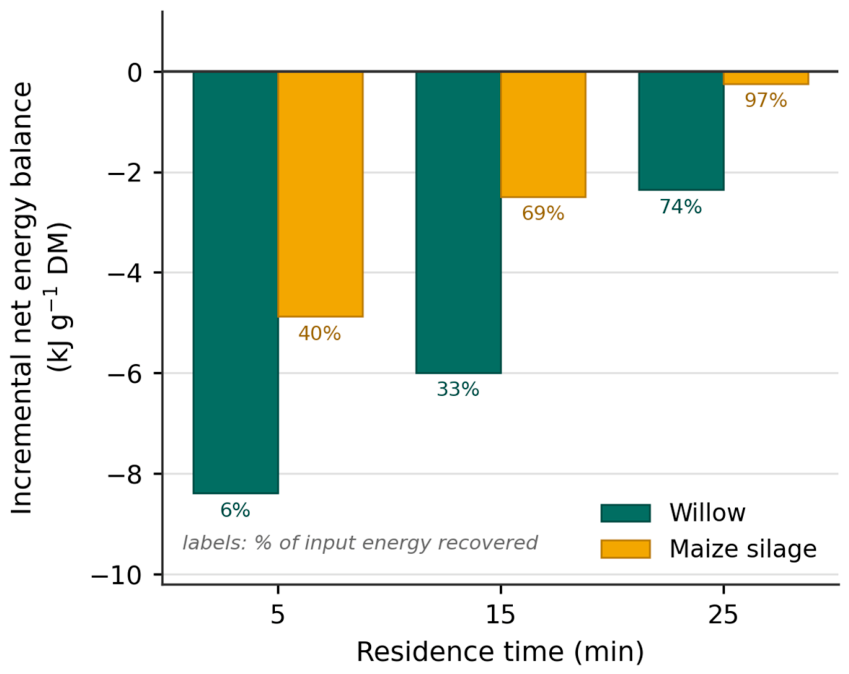

Table 1.
Characteristics of the raw feedstocks.
| Parameter | Willow (Salix viminalis) | Maize silage (Zea mays) |
| Total solids [mg/g] | 498.06 | 335.05 |
| Volatile solids [mg/g] | 485.46 | 292.22 |
| Mineral solids [mg/g] | 12.60 | 42.83 |
| Lignin [%] | 12.05 | 9.19 |
| Cellulose [%] | 41.24 | 8.28 |
| Hemicellulose [%] | 15.87 | 6.14 |
| Carbon [% DM] | 47.97 | 44.99 |
| Hydrogen [% DM] | 5.85 | 6.01 |
| Nitrogen [% DM] | 1.37 | 1.87 |
| C/N ratio | 35.0 | 24.1 |
Table 2.
Experimental design.
| Item | Description |
|---|---|
| Feedstocks | Willow chips (Salix viminalis); maize silage (Zea mays) |
| Pretreatment | microwave autohydrolysis + explosive decompression |
| Temperature | 130 °C (fixed) |
| Residence time | 5 / 15 / 25 min, against an untreated control |
| Hydration | to 90% moisture; shaken 60 min at 130 rpm (IKA KS 4000) |
| Reactor | two-chamber prototype (HL-P), microwave-heated upper chamber, decompression to lower chamber |
| BMP | AMPTS II, batch assay run to plateau (18–26 d); 0.433 g VS per bottle (willow), 0.478 g VS (maize silage) |
| Inoculum charge | 5.23 g VS per bottle (willow assay); 2.54 g VS per bottle (maize silage assay) |
| Replication | n = 3 (liquid-phase analyses and BMP) |
Table 3.
Liquid-phase solubilisation versus residence time (mean, n = 3).
| control | 5 min | 15 min | 25 min | |
|---|---|---|---|---|
| Willow — COD [g L−1] | 4.02 | 10.55 | 12.40 | 13.85 |
| Willow — TOC [mg L−1] | 1793 | 4956 | 5372 | 5787 |
| Willow — glucose [mg L−1] | 4.4 | 318.4 | 424.6 | 537.4 |
| Willow — xylose [mg L−1] | 28.3 | 35.4 | 56.6 | 106.1 |
| Maize silage — COD [g L−1] | 25.7 | 51.05 | 57.9 | 62.3 |
| Maize silage — TOC [mg L−1] | 13 320 | 52 700 | 63 350 | 65 550 |
| Maize silage — glucose [mg L−1] | 13 | 72 | 99 | 139 |
| Maize silage — xylose [mg L−1] | 191 | 268 | 396 | 445 |
Table 4.
By-product concentrations in the liquid phase versus residence time (mg L−1).
| control | 5 min | 15 min | 25 min | |
|---|---|---|---|---|
| Willow — phenolics | 35.0 | 180.3 | 197.6 | 200.1 |
| Willow — HMF | 0.04 | 0.00 | 0.17 | 0.26 |
| Willow — furfural | 0.26 | 0.00 | 0.00 | 0.00 |
| Maize silage — phenolics | 93.4 | 124.9 | 136.6 | 154.6 |
| Maize silage — HMF | 0.35 | 0.78 | 0.35 | 0.62 |
| Maize silage — furfural | 0.41 | 2.73 | 2.07 | 3.29 |
Table 5.
Modified Gompertz parameters fitted to the mean net cumulative methane curves.
| Feedstock / residence time | Pmax [NmL CH4 g−1 VS] | Rm [NmL g−1 VS d−1] | λ [d] | R2 |
|---|---|---|---|---|
| Willow — control | 113.5 | 26.8 | ≈ 0 | 0.72 |
| Willow — 5 min | 146.9 | 15.6 | ≈ 0 | 0.91 |
| Willow — 15 min | 198.3 | 41.6 | ≈ 0 | 0.84 |
| Willow — 25 min | 330.7 | 20.0 | ≈ 0 | 0.93 |
| Maize silage — control | 139.4 | n.r. | ≈ 0 | 0.88 |
| Maize silage — 5 min | 218.8 | n.r. | ≈ 0 | 0.82 |
| Maize silage — 15 min | 343.4 | n.r. | 0.09 | 0.93 |
| Maize silage — 25 min | 379.7 | n.r. | 0.02 | 0.99 |
n.r. = not resolvable: maize silage released 64–112% of its net methane within two days, so the fitted rate constant reflects the sampling interval rather than the process (Section 3.5). Full per-replicate fits are given inTable S3.
Table 6.
Net energy balance of the pretreatment (kJ g−1 DM; microwave 0.9 kW, LHV CH4 35.8 kJ NL−1, 200 g DM per charge).
Table 6.
Net energy balance of the pretreatment (kJ g−1 DM; microwave 0.9 kW, LHV CH4 35.8 kJ NL−1, 200 g DM per charge).
| Feedstock / residence time | E input | E output | Gross (out − in) | Incremental | Input recovered (incr.) |
| Maize silage — control | — | 4.16 | — | — | — |
| Maize silage — 5 min | 8.10 | 7.38 | −0.72 | −4.87 | 40% |
| Maize silage — 15 min | 8.10 | 9.76 | +1.66 | −2.50 | 69% |
| Maize silage — 25 min | 8.10 | 12.01 | +3.91 | −0.24 | 97% |
| Willow — control | — | 5.08 | — | — | — |
| Willow — 5 min | 8.91 | 5.61 | −3.30 | −8.39 | 6% |
| Willow — 15 min | 8.91 | 8.00 | −0.91 | −6.00 | 33% |
| Willow — 25 min | 8.91 | 11.64 | +2.73 | −2.36 | 74% |
Input fixed per feedstock (heating to 130 °C only; no heating during the hold); charge mass 200 g DM per 2-L batch.
Disclaimer/Publisher’s Note: The statements, opinions and data contained in all publications are solely those of the individual author(s) and contributor(s) and not of MDPI and/or the editor(s). MDPI and/or the editor(s) disclaim responsibility for any injury to people or property resulting from any ideas, methods, instructions or products referred to in the content. |
© 2026 by the authors. Licensee MDPI, Basel, Switzerland. This article is an open access article distributed under the terms and conditions of the Creative Commons Attribution (CC BY) license (http://creativecommons.org/licenses/by/4.0/).
Copyright: This open access article is published under a Creative Commons CC BY 4.0 license, which permit the free download, distribution, and reuse, provided that the author and preprint are cited in any reuse.