

Submitted:
04 August 2026
Posted:
05 August 2026
You are already at the latest version
Abstract
The development of highly sensitive surface-enhanced Raman spectroscopy (SERS) substrates is essential for detecting cancer-associated biomarkers and cellular signa-tures. Here, we developed a SERS-active platform by integrating silver nanowires (AgNWs) onto gold (Au) thin-film and glass substrates for enhanced Raman analysis of cancer cells. Au thin films were deposited on silicon substrates via thermal evapora-tion, followed by AgNW deposition through drop-casting. Human cells were subse-quently immobilized on the AgNW-modified surfaces, and substrate morphology and cell interactions were characterized using field-emission scanning electron microscopy and confocal microscopy. The AgNW networks supported efficient cell adhesion and enabled direct, reproducible SERS measurements. AgNW-coated Au substrates exhib-ited approximately 1500-fold greater Raman enhancement than bare Au films, demonstrating strong plasmonic coupling between AgNWs and the underlying Au layer. The substrates were evaluated using the breast cancer cell line SKBR3, the non-cancerous HEK-293 cell line, and cell culture medium. Distinct spectral differ-ences were observed among samples, reflecting interactions between the nanostruc-tured substrates and cell-specific biochemical constituents. Notably, a characteristic Raman peak at ~1028 cm⁻¹ was detected exclusively in SKBR3 cells on AgNW-based substrates, suggesting a potential biomarker associated with phenylalanine-containing collagen. Overall, AgNW-coated Au thin films provided superior signal enhancement and spectral reproducibility, highlighting their potential for sensitive cancer diagnos-tics and biomedical sensing applications.
Keywords:
silver nanowires
; glass substrate
; gold thin-film substrate
; SKBR3 cells
; surface-enhanced Raman spectroscopy
; SERS
1. Introduction
Breast cancer remains the most commonly diagnosed cancer worldwide and continues to pose a major public health challenge. In the United States alone, an estimated 321,910 new cases of invasive breast cancer are expected in 2026 [1]. Globally, breast cancer accounted for approximately 2.4 million new cases in 2026, making it the most frequently diagnosed cancer among women and a leading cause of cancer-related mortality, with a mortality rate of approximately 6.9% [2]. Early detection is critical for improving patient outcomes, and routine breast cancer screening has been shown to reduce mortality by up to one-third, with some studies reporting reductions of 40–50%. Current clinical screening and diagnostic modalities include mammography, ultrasonography, magnetic resonance imaging (MRI), and positron emission tomography (PET), which are routinely employed to identify tumors at early and more treatable stages.
Surface-enhanced Raman spectroscopy (SERS) has emerged as a powerful analytical technique for cancer diagnosis because of its ability to provide highly sensitive biochemical information from cells and tissues [3,4,5,6,7]. SERS has been successfully applied to distinguish normal and malignant tissues in multiple organ systems, including the lung [8], breast [9,10,11,12,13,14], esophagus [15,16,17], and stomach [18]. The technique enables label-free detection of biomolecular constituents such as nucleic acids, proteins, lipids, collagen, phospholipids, phenylalanine, saccharides, and water, providing comprehensive biochemical fingerprints associated with disease states. Compared with conventional diagnostic methods, SERS offers several advantages, including high sensitivity, excellent molecular specificity, minimal interference from aqueous environments, high spatial resolution, and the capability for non-destructive and non-invasive analyses [19,20,21,22,23,24,25,26]. These features make SERS particularly attractive for both live-cell studies and potential clinical applications.
The performance of a SERS system is strongly dependent on the properties of the plasmonic substrate used to generate electromagnetic enhancement. Noble metal nanostructures, particularly gold (Au) and silver (Ag), are widely used because their localized surface plasmon resonance can significantly amplify Raman scattering signals [27,28,29,30]. However, conventional nanoparticle-based substrates often suffer from poor reproducibility, high background signals, aggregation-related variability, and limited biocompatibility. Consequently, the development of robust and reproducible SERS substrates capable of generating highly concentrated electromagnetic “hot spots” remains an active area of research.
Recent studies have demonstrated the potential of advanced SERS substrates for breast cancer detection. Chen et al. identified protein- and collagen-related spectral features associated with breast cancer progression [31]. Pan et al. developed a silver nanoparticle/porous silicon Bragg mirror (AgNPs/PSB) substrate that enabled the detection of serum-derived breast cancer biomarkers through characteristic protein and collagen signatures [32]. Yang et al. reported a single silver nanowire (AgNW)-based SERS platform capable of probing molecular information from breast cancer cells [33], while a three-dimensional Au@Ag bimetallic nanosphere substrate was subsequently employed for metabolite analysis in breast cancer patients [34]. In addition, Plancarte et al. demonstrated the discrimination of breast cancer cells using functionalized silver nanoparticles deposited on Au substrates [35].
Several studies have identified phenylalanine-associated Raman bands as potential markers of breast cancer. Gold nanoparticle-coated quartz substrates have been employed for cancer cell analysis, where prominent Raman features were attributed to protein vibrations, including the C–H in-plane bending mode of substituted benzene rings in phenylalanine [36]. González et al. further investigated the variation of phenylalanine band intensity across different stages of breast cancer [37], while Feng et al. reported enhanced phenylalanine-related Raman signals in malignant esophageal tissues [38]. These observations suggest that phenylalanine-associated spectral features may serve as valuable biomarkers for cancer diagnosis. The sensitivity of SERS arises from the strong local electromagnetic fields generated around metallic nanostructures, producing signal enhancements of several orders of magnitude when target molecules are located near plasmonic “hot spots” [39].
Despite significant progress, challenges remain in achieving high signal enhancement, low background noise, and reproducible spectral responses from biological samples. In the present study, we developed and evaluated two AgNW-based SERS platforms for breast cancer cell detection. AgNWs were deposited onto glass substrates to form conductive nanowire networks, while a hybrid AgNW/Au substrate was fabricated by depositing AgNWs onto thermally evaporated Au thin films on silicon. The morphology of the resulting substrates was characterized using field-emission scanning electron microscopy (FESEM), and their SERS performance was assessed using a model Raman probe molecule. To demonstrate their biological applicability, breast cancer SKBR3 cells and non-cancerous HEK-293 cells were immobilized on the substrates and analyzed using SERS. The study aimed to determine whether AgNW-modified Au thin films could provide enhanced spectral sensitivity and facilitate the identification of breast cancer-specific Raman signatures.
2. Materials and Methods
2.1. Cell Lines and Cell Culture Methods
Human breast cancer SKBR3 cells (ATCC, HTB-30) and human embryonic kidney HEK-293 cells (ATCC, CRL-1573) were used in this study. SKBR3 cells were cultured in McCoy’s 5A Modified Medium (Thermo Fisher Scientific, Waltham, MA, USA; Cat. No. 16600082), whereas HEK-293 cells were maintained in Eagle’s Minimum Essential Medium (EMEM) containing L-glutamine (Quality Biological, Gaithersburg, MD, USA; Cat. No. 112-018-101). All culture media were supplemented with 10% heat-inactivated fetal bovine serum (FBS; Gibco, Thermo Fisher Scientific; Cat. No. A3840101) and 1% antibiotic–antimycotic solution (Gibco; Cat. No. 15240062).
Cells were maintained in T-25 tissue culture flasks (VWR, Radnor, PA, USA; Cat. No. 10062-874) at 37 °C in a humidified incubator supplied with 5% CO₂. Upon reaching approximately 80–90% confluence, cells were detached using 0.25% trypsin–EDTA solution (VWR; Cat. No. L0154-0100). The harvested cells were washed twice with Hank’s Balanced Salt Solution (HBSS) lacking calcium, magnesium, and phenol red (Fisher Scientific, Hampton, NH, USA; Cat. No. MP091810554) by centrifugation and resuspension.
Cell concentration was determined using methylene blue staining and a hemocytometer. The cell density was adjusted to 3 × 10⁶ cells mL⁻¹. Prior to surface-enhanced Raman spectroscopy (SERS) measurements, cell suspensions were stored on ice and gently dispersed by repeated pipetting immediately before deposition onto the Ag nanowire (AgNW)-coated substrates.
2.2. Preparation of AgNW-Based SERS Substrates and Cell Immobilization
Glass microscope slides were sequentially cleaned with ethanol and deionized (DI) water and allowed to dry prior to use. Silver nanowire (AgNW) suspensions (ACS Material, Pasadena, CA, USA; AgNW-120, Cat. No. NWAG04W1) were deposited onto the glass slides by drop-casting 20 μL aliquots at three separate locations. The coated slides were dried on a hot plate at 100 °C for 1 h.
For fabrication of Au-coated substrates, a chromium/gold (Cr/Au) thin film was deposited onto silicon wafers using a thermal evaporation system (PVD75 Thermal Evaporator, Kurt J. Lesker Company, Jefferson Hills, PA, USA). A 10 nm chromium adhesion layer was first deposited from 99.998% pure chromium pellets (Cat. No. EVMCR48-J) at a deposition rate of 0.8 Å s⁻¹ onto p-type silicon wafers (100 orientation; resistivity 1–10 Ω·cm; diameter 76.2 mm; thickness 525 ± 25 μm). Subsequently, a gold layer of 70 nm thickness was deposited using 99.999% pure gold pellets (Cat. No. EVMAU50QXQ) at deposition rates ranging from 1 to 3 Å s⁻¹.
AgNWs were then deposited onto the fabricated Au/Cr-coated silicon substrates via the same drop-casting procedure described above and dried at 100 °C for 1 h. For SERS measurements, 10 μL of each cell suspension was deposited onto both AgNW-coated glass and AgNW-coated Au substrates and allowed to immobilize prior to spectral acquisition (Figure 1).
2.3. SERS and Morphological Characterization
SERS measurements were performed using a SENTERRA II Raman microscope (Bruker Optics, Billerica, MA, USA) equipped with a thermoelectrically cooled charge-coupled device (CCD) detector. A 785 nm laser was focused onto the sample through a 20× objective lens. Raman spectra were collected over the spectral range of 50–3000 cm⁻¹ with a spectral resolution of 4 cm⁻¹. Unless otherwise stated, spectra were acquired using a laser power of 25 mW and an integration time of 1 s.
For each experimental condition, measurements were obtained from five independent samples, and the reported spectra represent the average signal intensity. The SERS enhancement performance of the fabricated substrates was evaluated using 1-octanethiol (Sigma-Aldrich, St. Louis, MO, USA; Cat. No. 8218610100) dissolved in ethanol as a probe molecule.
The morphology of the fabricated substrates was examined using field-emission scanning electron microscopy (FESEM; Hitachi S-4700, Hitachi High-Technologies, Tokyo, Japan). Samples (5 × 4 mm²) were mounted on aluminum stubs using conductive carbon tape. Imaging was performed at an accelerating voltage of 15 kV.
3. Results
3.1. Morphological Characterization of AgNW-Based Substrates
The morphology of the fabricated substrates was investigated using FESEM, and representative images are shown in Figure 2. The AgNW-coated glass substrate exhibited a densely interconnected nanowire network covering most of the glass surface (Figure 2A). Higher-magnification imaging revealed extensive nanowire overlap and junction formation throughout the film. At the boundary between the coated and uncoated regions, portions of the underlying glass substrate remained visible, indicating the presence of pores within the AgNW network (Figure 2B).
The Au thin film exhibited a smooth and uniform surface morphology prior to AgNW deposition (Figure 2C). Following AgNW deposition, a dense nanowire network was formed on the Au surface (Figure 2D). The interface between the AgNW layer and the Au film is shown in Figure 2E, confirming successful assembly of the nanowire network on the metallic substrate.
After cell immobilization, both single cells and cell aggregates were observed on the AgNW-coated surfaces (Figure 2F). The cells remained attached to the nanowire film and occupied a substantial portion of the available surface area.This section may be divided by subheadings. It should provide a concise and precise description of the experimental results, their interpretation, as well as the experimental conclusions that can be drawn.
3.2. Optical Characterization of Cell-Functionalized Substrates
Confocal microscopy was used to visualize HBSS controls, HEK-293 cells, and SKBR3 cells on the fabricated substrates. Representative images obtained from AgNW-coated glass substrates are presented in Figure 3, whereas images collected from Au and AgNW/Au substrates are shown in Figure 4.
Cells were readily distinguishable from HBSS-coated regions on all substrate types. Both isolated cells and cell aggregates were observed. HEK-293 cells generally appeared smaller than SKBR3 cells. The images further confirmed successful immobilization of cells on the SERS-active substrates and enabled selection of cell-containing regions for subsequent Raman measurements.
3.3. SERS Performance Evaluation Using 1-Octanethiol
The SERS performance of the fabricated substrates was evaluated using 1-octanethiol as a model analyte. Figure 5 compares Raman spectra collected from AgNW-coated and uncoated substrates.
A characteristic Raman peak at approximately 1120 cm⁻¹ was clearly observed on both AgNW/glass and AgNW/Au substrates (Figure 5A,B). In contrast, the corresponding uncoated glass and Au substrates produced either negligible Raman signals or substantially weaker responses. The AgNW/Au substrate exhibited an enhancement factor of approximately 1500 relative to the bare Au substrate.
3.4. SERS Analysis of Cells on AgNW/Glass Substrates
Representative SERS spectra of HBSS, HEK-293 cells, and SKBR3 cells collected from AgNW/glass substrates are shown in Figure 6. Common Raman bands were observed near 1001, 1046, 1230, and 1450 cm⁻¹.
The spectra of HBSS and HEK-293 cells showed similar spectral profiles. In contrast, SKBR3 cells exhibited an additional Raman band at approximately 1028 cm⁻¹. Additional differences were observed in the spectral region between 1200 and 1500 cm⁻¹.
3.5. SERS Analysis of Cells on Au and AgNW/Au Substrates
SERS measurements performed on bare Au films generated weak and poorly defined spectra for HBSS, HEK-293, and SKBR3 samples (Figure 7).
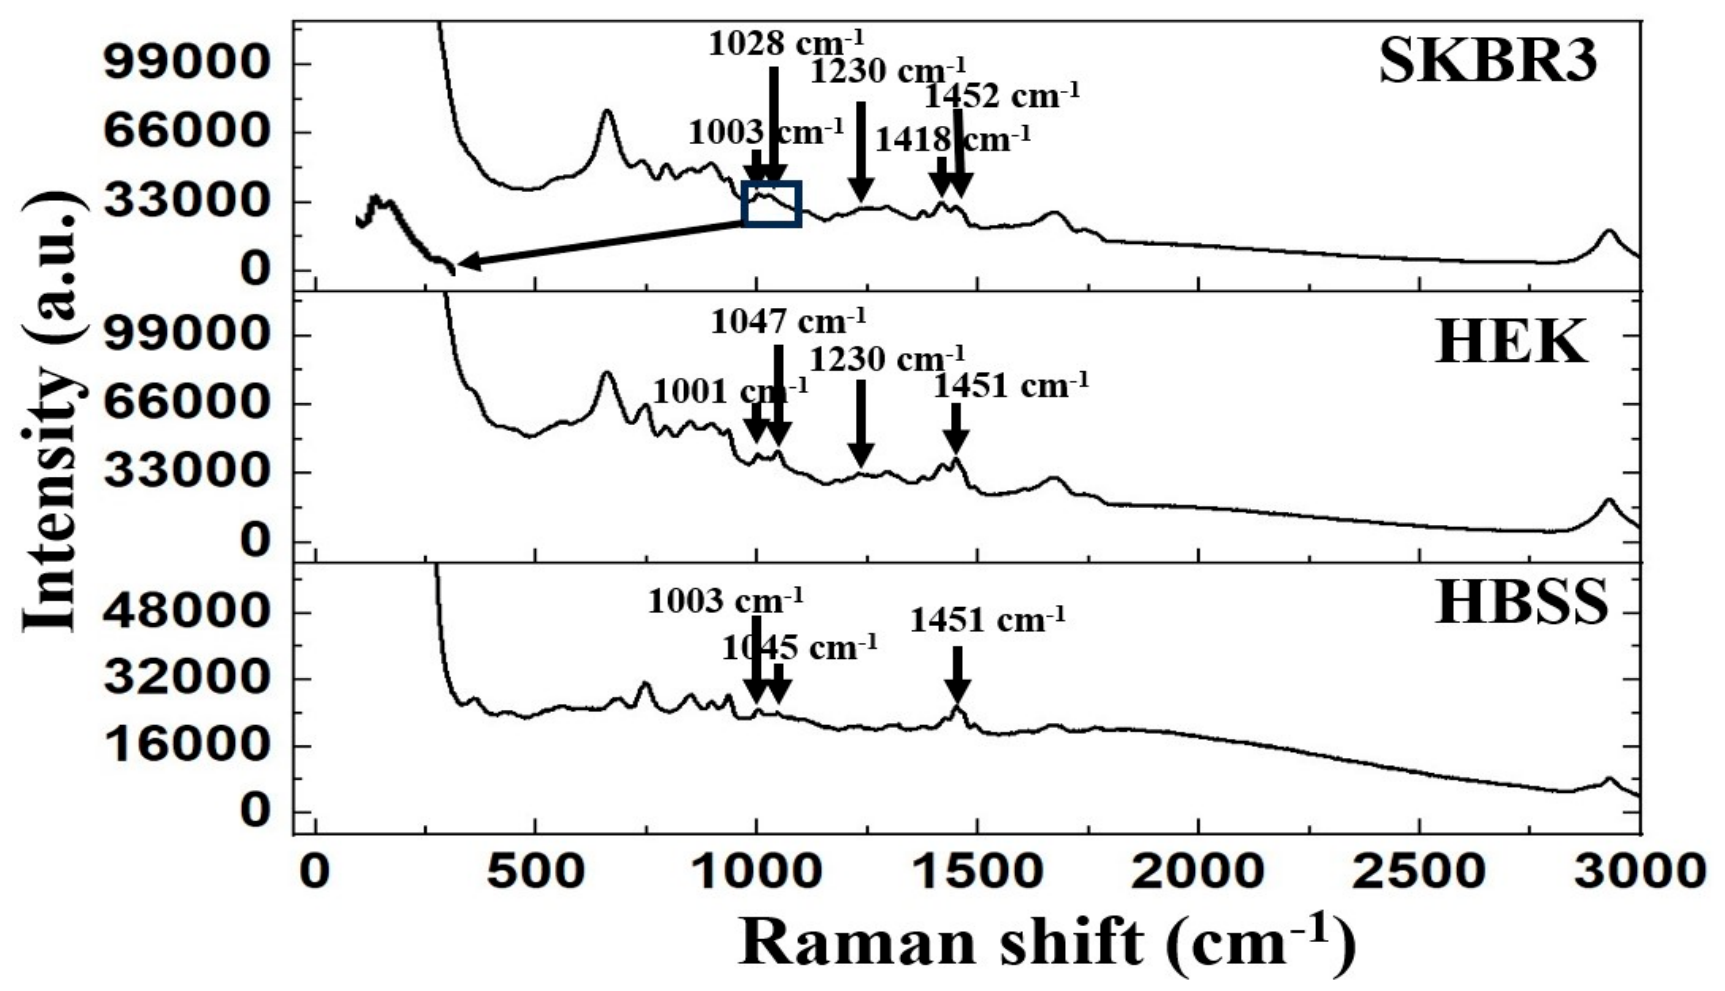
Following the deposition of AgNWs onto the Au film, substantially enhanced Raman signals were observed (Figure 8). Peaks at approximately 1001, 1230, and 1451 cm⁻¹ were detected in all samples. Distinct bands at approximately 1003, 1028, and 1418 cm⁻¹ were observed in SKBR3 cells.
4. Discussion
The FESEM characterization confirmed the successful fabrication of interconnected AgNW networks on both glass and Au-film substrates. Such interconnected architectures are advantageous for SERS because nanowire junctions serve as localized electromagnetic hot spots that significantly enhance the Raman signals through localized surface plasmon resonance effects [27,28,29,30,39]. The dense nanowire coverage observed on the Au-supported substrates is expected to promote stronger plasmonic coupling between neighboring AgNWs and the underlying Au film, thereby increasing the local electromagnetic field intensity and improving SERS performance.
Confocal microscopy demonstrated successful immobilization of both HEK-293 and SKBR3 cells on the fabricated substrates. The ability to visually distinguish cells from HBSS-coated regions enabled accurate selection of measurement locations for Raman analysis. This observation is particularly important because reliable cell localization is essential for reducing spectral variability and improving the reproducibility of cell-based SERS measurements.
The use of 1-octanethiol as a model analyte revealed that the AgNW coatings were primarily responsible for the observed signal enhancement. Bare glass and Au substrates generated either negligible or weak Raman signals, whereas the AgNW/Au hybrid substrate produced an approximately 1500-fold enhancement of its intensity relative to the bare Au film. These results are consistent with previous studies demonstrating that Ag nanostructures provide stronger SERS enhancement than planar metallic films due to the formation of nanoscale hot spots at nanowire junctions and interparticle gaps [27,28,29,30,33,39]. Furthermore, the enhanced performance of the AgNW/Au substrate suggests that coupling between the AgNW network and the conductive Au support contributes to improved electromagnetic enhancement compared with AgNWs deposited on glass alone.
The SERS spectra obtained from SKBR3 breast cancer cells exhibited several characteristic Raman peaks that were absent or significantly weaker in HEK-293 cells and HBSS controls. Most notably, the Raman band observed at approximately 1028 cm⁻¹ can be attributed to C–H deformation vibrations associated with phenylalanine-containing proteins and collagen-related components [34,36,37,38]. Phenylalanine-associated Raman bands have previously been identified as important biomarkers in breast cancer and other malignancies [36,37,38]. Similarly, the band at approximately 1003 cm⁻¹ corresponds to the symmetric ring-breathing mode of phenylalanine, while the peak near 1230 cm⁻¹ has been assigned to tryptophan-associated vibrational modes [42,43]. The Raman band observed at approximately 1418 cm⁻¹ is consistent with COO⁻ symmetric stretching vibrations and nucleic-acid-related components that have been associated with cellular metabolic activity and alterations in cancerous tissues [44,45].
The detection of these characteristic spectral signatures is consistent with previous reports demonstrating that SERS can differentiate malignant and non-malignant cells based on their biochemical composition [9,10,11,12,13,14,31,32,33,34,35]. Chen et al. reported protein- and collagen-related Raman signatures associated with breast cancer progression [31], while Yang et al. demonstrated the capability of AgNW-based SERS substrates to probe molecular information from breast cancer cells [33]. Likewise, Plancarte et al. successfully discriminated breast cancer cells using silver nanostructures deposited on Au substrates [35]. The agreement between the present findings and these earlier studies supports the validity of the observed SKBR3-specific biomarkers.
Importantly, the SKBR3 spectra acquired on AgNW/glass and AgNW/Au substrates exhibited highly similar peak positions, indicating that the detected Raman signatures arise from cellular biochemical constituents rather than substrate-derived artifacts. However, the AgNW/Au hybrid substrate provided substantially stronger signal enhancement and improved spectral definition compared with the AgNW/glass platform. The Au support also permitted the use of thinner AgNW coatings while maintaining high SERS activity, thereby reducing substrate heterogeneity and facilitating more reproducible measurements. In contrast, thicker AgNW coatings were required on glass substrates to minimize background contributions from the underlying substrate, which may complicate optical interrogation of small cells and reduce measurement consistency.
Taken together, the results demonstrate that the AgNW/Au hybrid architecture combines the strong plasmonic activity of silver nanowires with the conductivity and structural stability of Au thin films. This synergistic interaction produces enhanced Raman sensitivity and facilitates the discrimination of breast cancer cells from non-cancerous controls based on phenylalanine-, protein-, and nucleic-acid-related biomarkers. These characteristics make AgNW/Au hybrid substrates promising candidates for label-free cancer diagnostics and cellular sensing applications.
5. Conclusions
Uniform and reproducible AgNW networks were successfully fabricated on both glass and Au thin-film substrates, yielding SERS-active platforms capable of enhancing Raman signals from molecular and cellular targets. Using 1-octanethiol as a model analyte, the AgNW-modified substrates exhibited substantially greater signal intensity than the corresponding bare glass and Au substrates, confirming the effectiveness of the AgNW network in generating strong plasmonic enhancement.
The developed substrates were subsequently evaluated for the detection of biological samples, including HBSS medium, non-cancerous HEK-293 cells, and breast cancer SKBR3 cells. While SERS measurements acquired on bare Au films produced weak and poorly defined spectra, AgNW-coated glass and AgNW/Au hybrid substrates generated multiple well-resolved Raman bands associated with cellular biochemical components. Notably, a distinct Raman peak at approximately 1028 cm⁻¹ was consistently detected in SKBR3 cells but was absent in HEK-293 cells and HBSS controls. This feature is associated with phenylalanine-containing biomolecules and represents a potential spectral marker for breast cancer cell identification.
Although both AgNW/glass and AgNW/Au platforms enabled the detection of cancer-related spectral signatures, the AgNW/Au hybrid substrate demonstrated several practical advantages, including reduced spectral background, improved signal quality, and enhanced measurement reproducibility. These benefits are attributed to the synergistic interaction between the highly conductive Au thin film and the AgNW network, which promotes efficient plasmonic coupling and increased electromagnetic hot-spot density.
Overall, the results demonstrate that AgNW/Au hybrid thin-film substrates provide a robust and sensitive SERS platform for the label-free detection and discrimination of breast cancer cells. The ability to identify characteristic cancer-associated Raman signatures, combined with the enhanced signal amplification afforded by the hybrid architecture, highlights the potential of this platform for future applications in cancer diagnostics, biomarker discovery, and biomedical sensing. Future studies will focus on validating the approach using additional breast cancer cell lines and clinical specimens to further establish its diagnostic utility.
Author Contributions
Conceptualization, M.F.H., K.S, M.B, G.S., A.M.; methodology, M.F.H. K.S., S.P., S.D., J.C., P.M. M.C., and A.M.; validation, M.F.H., S.D., K.S., S.P. M.B., P.M, and A.M.; formal analysis, M.F.H., S.P and S.D.; investigation, M.F.H., K.S., S.P., S.D., J.C., M.C. and A.M.; resources, K.S., M.B., P.M., G.S., J.C. and A.M.; data curation, M.F.K, S.P., M.B., P.M., S.D., J.C., G.S. and A.M.; writing—original draft preparation, M.F.H.; writing—review and editing, A.M.; visualization, M.F.H. and A.M.; supervision, K.S., M.B., P.M., G.S. and A.M.; project administration, A.M..; funding acquisition, K.S., M.B., G.S. and A.M. All authors have read and agreed to the published version of the manuscript.
Funding
This research was funded by the National Science Foundation, grant number ECCS1954330.
Data Availability Statement
The data presented in this study are available within the article. Additional raw data supporting the findings of this study are available from the corresponding author upon reasonable request.
Conflicts of Interest
The authors declare no conflicts of interest.
Acknowledgments
We are grateful for the support from Marvin Kim at the Norfolk State University’s Micron-NSU Nanofabrication Cleanroom. During the preparation of this manuscript, the authors used MS Copilot for the purposes of generating a graphical abstract and the graphical methods figure. The authors have reviewed and edited the output and take full responsibility for the content of this publication.
Abbreviations
The following abbreviations are used in this manuscript:
| Ag | Silver |
| AgNPs | Silver Nanoparticles |
| AgNWs | Silver Nanowires |
| ATCC | American Tissue Type Collection |
| Au | Gold |
| CCD | Charge-Coupled Device |
| Cr/Au | Chromium/Gold |
| DI | Deionized |
| EMEM | Eagle’s Minimum Essential Medium |
| FBS | Fetal Bovine Serum |
| FESEM | Field-Emission Scanning Electron Microscopy |
| HBSS | Hank’s Balanced Salt Solution |
| HEK-293 | Human Embryonic Kidney 293 Cells |
| MRI | Magnetic Resonance Imaging |
| PET | Positron Emission Tomography |
| PSB | Porous Silicon Bragg Mirror |
| SERS | Surface Enhanced Raman Spectroscopy |
References
- Siegel, R.L.; Kratzer, T.B.; Wagle, N.S.; Sung, H.; Jemal, A. Cancer Statistics, 2026. CA Cancer J. Clin. 2024, 76, e70043.
- Sung, H.; Ferlay, J.; Siegel, R.L.; Laversanne, M.; Soerjomataram, I.; Jemal, A.; Bray, F. Global Cancer Statistics 2020: GLOBOCAN Estimates of Incidence and Mortality Worldwide for 36 Cancers in 185 Countries. CA Cancer J. Clin. 2021, 71, 209–249. [CrossRef]
- Raikhlin, A.; Curpen, B.; Warner, E.; Betel, C.; Wright, B.; Jong, R. Breast MRI as an Adjunct to Mammography for Breast Cancer Screening in High-Risk Patients: Retrospective Review. AJR Am. J. Roentgenol. 2015, 204, 889–897. [CrossRef]
- Disha, E.D.; Kerliu, S.M.; Ymeri, H.; Kutllovci, A. Comparative Accuracy of Mammography and Ultrasound in Women with Breast Symptoms According to Age and Breast Density. Bosn. J. Basic Med. Sci. 2009, 9, 131–136. [CrossRef]
- Yang, S.K.; Cho, N.; Moon, W.K. The Role of PET/CT for Evaluating Breast Cancer. Korean J. Radiol. 2007, 8, 429–437. [CrossRef]
- Yang, B.; Chen, C.; Chen, C.; Cheng, H.; Yan, Z.; Chen, F.; Zhu, Z.; Zhang, H.; Yue, F.; Lv, X. Detection of Breast Cancer of Various Clinical Stages Based on Serum FT-IR Spectroscopy Combined with Multiple Algorithms. Photodiagnosis Photodyn. Ther. 2021, 33, 102199. [CrossRef]
- Zhang, L.; Li, C.; Peng, D.; Yi, X.; He, S.; Liu, F.; Zheng, X.; Huang, W.E.; Zhao, L.; Huang, X. Raman Spectroscopy and Machine Learning for the Classification of Breast Cancers. Spectrochim. Acta A Mol. Biomol. Spectrosc. 2022, 264, 120300. [CrossRef]
- Huang, Z.; McWilliams, A.; Lui, H.; McLean, D.I.; Lam, S.; Zeng, H. Near-Infrared Raman Spectroscopy for Optical Diagnosis of Lung Cancer. Int. J. Cancer 2003, 107, 1047–1052. [CrossRef]
- Surmacki, J.; Pluska, B.B.; Kordek, R.; Abramczyk, H. The Lipid-Reactive Oxygen Species Phenotype of Breast Cancer: Raman Spectroscopy and Mapping, PCA and PLSDA for Invasive Ductal Carcinoma and Invasive Lobular Carcinoma. Analyst 2015, 140, 2121–2133. [CrossRef]
- Pluska, B.B.; Kopec, M.; Niedzwiecka, I.; Sztandera, A. Label-Free Determination of Lipid Composition and Secondary Protein Structure of Human Salivary Noncancerous and Cancerous Tissues by Raman Microspectroscopy. Analyst 2015, 140, 2107–2113. [CrossRef]
- Abramczyk, H.; Pluska, B.B.; Surmacki, J.; Musial, J.; Kordek, R. Oncologic Photodynamic Diagnosis and Therapy: Confocal Raman/Fluorescence Imaging of Metal Phthalocyanines in Human Breast Cancer Tissue In Vitro. Analyst 2014, 139, 5547–5559. [CrossRef]
- Pluska, B.B.; Kopec, M.; Surmacki, J.; Abramczyk, H. Raman Microspectroscopy of the Noncancerous and Cancerous Human Breast Tissues. Identification and Phase Transitions of Linoleic and Oleic Acids by Raman Spectroscopy and Raman Low-Temperature Studies. Analyst 2015, 140, 2134–2143. [CrossRef]
- Fung, M.F.K.; Senterman, M.K.; Mikhael, N.Z.; Lacelle, S.; Wong, P.T.T. Pressure-Tuning Fourier Transform Infrared Spectroscopic Study of Carcinogenesis in Human Endometrium. Biospectroscopy 1996, 2, 155–165. [CrossRef]
- Taleb, A.; Diamond, J.; McGarvey, J.J.; Beattie, J.R.; Toland, C.; Hamilton, P.W. Raman Microscopy for the Chemometric Analysis of Tumor Cells. J. Phys. Chem. B 2006, 110, 19625–19631. [CrossRef]
- Rekha, P.; Aruna, P.; Daniel, A.; Prasanna, S.W.; Udayakumar, K.; Ganesan, S.; Bharanidharan, G.; David, B. Raman Spectroscopic Characterization of Blood Plasma of Oral Cancer. In Proceedings of the 2013 IEEE 4th International Conference on Photonics (ICP), Melaka, Malaysia, 28–30 October 2013; pp. 135–137. [CrossRef]
- Matthews, Q.; Brolo, A.G.; Lum, J.; Duan, X.; Jirasek, A. Raman Spectroscopy of Single Human Tumour Cells Exposed to Ionizing Radiation In Vitro. Phys. Med. Biol. 2011, 56, 19–38. [CrossRef]
- Zhu, J.; Zhou, J.; Guo, J.; Cai, W.; Liu, B.; Wang, Z.; Sun, Z. Surface-Enhanced Raman Spectroscopy Investigation on Human Breast Cancer Cells. Chem. Cent. J. 2013, 7, 37. [CrossRef]
- Feng, S.; Chen, R.; Lin, J.; Pan, J.; Wu, Y.; Li, Y.; Chen, J.; Zeng, H. Gastric Cancer Detection Based on Blood Plasma Surface-Enhanced Raman Spectroscopy Excited by Polarized Laser Light. Biosens. Bioelectron. 2011, 26, 3167–3174. [CrossRef]
- Abramczyk, H.; Pluska, B.B. New Look Inside Human Breast Ducts with Raman Imaging. Raman Candidates as Diagnostic Markers for Breast Cancer Prognosis: Mammaglobin, Palmitic Acid and Sphingomyelin. Anal. Chim. Acta 2016, 909, 91–100. [CrossRef]
- Liu, L.; Shangguan, C.; Guo, J.; Ma, K.; Jiao, S.; Yao, Y.; Wang, J. Ultrasensitive SERS Detection of Cancer-Related miRNA-182 by MXene/MoS₂@AuNPs with Controllable Morphology and Optimized Self-Internal Standards. Adv. Opt. Mater. 2020, 8, 2001214. [CrossRef]
- Fabris, L. SERS Tags: The Next Promising Tool for Personalized Cancer Detection? ChemNanoMat 2016, 2, 249–258. [CrossRef]
- Wang, Z.; Zong, S.; Wang, Y.; Li, L.; Li, J.; Lu, Z.; Wang, B.; Chen, Y.; Cui, Y. Screening and Multiple Detection of Cancer Exosomes Using an SERS-Based Method. Nanoscale 2018, 10, 9053–9062. [CrossRef]
- Guo, L.; Zhang, Y.; Lu, J.Y.; Gao, W.B.; Wu, S.F.; Wang, R.Y. Multivariate Statistical Analysis of Serum from Breast Cancer Patients Using Surface-Enhanced Raman Spectrum. Spectrosc. Spectr. Anal. 2013, 33, 1553–1556.
- Yamamoto, Y.S.; Ishikawa, M.; Ozaki, Y.; Itoh, T. Fundamental Studies on Enhancement and Blinking Mechanism of Surface-Enhanced Raman Scattering and Basic Applications of SERS Biological Sensing. Front. Phys. 2014, 9, 31–46. [CrossRef]
- Chaturvedi, D.; Balaji, S.A.; Bn, V.K.; Ariese, F.; Umapathy, S.; Rangarajan, A. Different Phases of Breast Cancer Cells: Raman Study of Immortalized, Transformed, and Invasive Cells. Biosensors 2016, 6, 57. [CrossRef]
- Kaminska, A.; Szymborski, T.; Witkowska, E.; Gawronska, E.K.; Swieszkowski, W.; Nicinski, K.; Danielewicz, J.T.; Girstun, A. Detection of Circulating Tumor Cells Using Membrane-Based SERS Platform: A New Diagnostic Approach for Liquid Biopsy. Nanomaterials 2019, 9, 366. [CrossRef]
- Stamplecoskie, K.G.; Scaiano, J.C.; Tiwari, V.S.; Anis, H. Optimal Size of Silver Nanoparticles for Surface-Enhanced Raman Spectroscopy. J. Phys. Chem. C 2011, 115, 1403–1409. [CrossRef]
- Michota, A.; Bukowska, J. Surface-Enhanced Raman Scattering of 4-Mercaptobenzoic Acid on Silver and Gold Substrates. J. Raman Spectrosc. 2003, 34, 21–25. [CrossRef]
- Cho, W.J.; Kim, Y.; Kim, J.K. Ultrahigh-Density Array of Silver Nanoclusters for SERS Substrate with High Sensitivity and Excellent Reproducibility. ACS Nano 2012, 6, 249–255. [CrossRef]
- Farah, A.A.; Vasquez, J.P.B.; Puebla, R.A.A.; Cho, J.Y.; Fenniri, H. Robust Au-PEG/PS Microbeads as Optically Stable Platforms for SERS. Small 2009, 5, 1283–1286. [CrossRef]
- Cheng, Z.; Li, H.; Chen, C.; Lv, X.; Zuo, E.G.; Xie, X.D.; Li, Z.G.; Liu, P.; Li, H.T.; Chen, C. Application of Serum SERS Technology Based on Thermally Annealed Silver Nanoparticle Composite Substrate in Breast Cancer. Photodiagnosis Photodyn. Ther. 2023, 41, 103284. [CrossRef]
- Pan, X.T.; Yang, X.Y.; Mao, T.Q.; Liu, K.; Chen, Z.Z.; Jiang, D.; Wang, K.; Gu, Z.Z.; Xia, X.H. Super-Long SERS Active Single Silver Nanowires for Molecular Imaging in 2D and 3D Cell Culture Models. Biosensors 2022, 12, 875. [CrossRef]
- Yang, Z.; Su, H.S.; You, E.M.; Liu, S.; Li, Z.; Zhang, Y. High Uniformity and Enhanced Au@AgNS 3D Substrates for the Diagnosis of Breast Cancer. ACS Omega 2022, 7, 15223–15230. [CrossRef]
- Wu, X.; Luo, L.; Yang, S.; Ma, X.; Li, Y.L.; Dong, C.; Tian, Y.C.; Zhang, L.; Shen, Z.; Wu, A. Improved SERS Nanoparticles for Direct Detection of Circulating Tumor Cells in the Blood. ACS Appl. Mater. Interfaces 2015, 7, 9965–9971. [CrossRef]
- Plancarte, A.P.; Poniatowski, E.H.; Picquart, M.; Méndez, J.G.M.; Cruz, C.L.; Salazar, J.E.J.; Matsumura, P.D.; Alarcón, L.E.; Batina, N. Development of a Nanostructured Platform for Identifying HER2 Heterogeneity of Breast Cancer Cells by Surface-Enhanced Raman Scattering. Nanomaterials 2018, 8, 549. [CrossRef]
- Solís, J.L.G.; Serrano, B.I.A.; Espinosa, J.C.M.; Villanueva, A.O. Stage Determination of Breast Cancer Biopsy Using Raman Spectroscopy and Multivariate Analysis. AIP Conf. Proc. 2011, 1364, 33–40. [CrossRef]
- Feng, S.; Lin, J.; Huang, Z.; Chen, G.; Chen, W.; Wang, Y.; Chen, R.; Zeng, H. Esophageal Cancer Detection Based on Tissue Surface-Enhanced Raman Spectroscopy and Multivariate Analysis. Appl. Phys. Lett. 2013, 102, 043702. [CrossRef]
- Aljakouch, K.; Lechtonen, T.; Yosef, H.K.; Hammoud, M.K.; Alsaidi, W.; Kötting, C.; Mügge, C.; Kourist, R.; El-Mashtoly, S.F.; Gerwert, K. Raman Microspectroscopic Evidence for the Metabolism of a Tyrosine Kinase Inhibitor, Neratinib, in Cancer Cells. Angew. Chem. Int. Ed. 2018, 57, 7250–7254. [CrossRef]
- Campion, A.; Kambhampati, P. Surface-Enhanced Raman Scattering. Chem. Soc. Rev. 1998, 27, 241–250. [CrossRef]
- Pluska, B.B.; Kopec, M.; Surmacki, J. Surface-Enhanced Raman Spectroscopy Analysis of Human Breast Cancer via Silver Nanoparticles: An Examination of Fabrication Methods. J. Spectrosc. 2018, Article 4893274. [CrossRef]
- Movasaghi, Z.; Rehman, S.; Rehman, I.U. Raman Spectroscopy of Biological Tissues. Appl. Spectrosc. Rev. 2007, 42, 493–541. [CrossRef]
- Satheeshkumar, E.; Makaryan, T.; Melikyan, A.; Minassian, H.; Gogotsi, Y.; Yoshimura, M. One-Step Solution Processing of Ag, Au and Pd@MXene Hybrids for SERS. Sci. Rep. 2016, 6, 32049. [CrossRef]
- Haldavnekar, R.; Krishnan, K.V.; Tan, B. Non-Plasmonic Semiconductor Quantum SERS Probe as a Pathway for In Vitro Cancer Detection. Nat. Commun. 2018, 9, 3065. [CrossRef]
- Sun, F.; Hung, H.C.; Sinclair, A.; Zhang, P.; Bai, T.; Galvan, D.D.; Jain, P.; Li, B.; Jiang, S.; Yu, Q. Hierarchical Zwitterionic Modification of a SERS Substrate Enables Real-Time Drug Monitoring in Blood Plasma. Nat. Commun. 2016, 7, 13437. [CrossRef]
- Keshavarz, M.; Tan, B.; Venkatakrishnan, K. Label-Free SERS Quantum Semiconductor Probe for Molecular-Level and In Vitro Cellular Detection: A Noble-Metal-Free Methodology. ACS Appl. Mater. Interfaces 2018, 10, 34886–34904. [CrossRef]
Figure 1.
Schematic illustration of the fabrication and cell integration process for SERS substrates. (A) AgNW-coated glass substrate fabricated by AgNW deposition onto a glass slide followed by cell immobilization. (B) AgNW/Au thin-film hybrid substrate prepared by deposition of a Cr/Au layer on a silicon wafer, subsequent AgNW assembly, and cell immobilization. SKBR3 and HEK-293 cells were analyzed using a 785 nm excitation laser for SERS measurements.
Figure 1.
Schematic illustration of the fabrication and cell integration process for SERS substrates. (A) AgNW-coated glass substrate fabricated by AgNW deposition onto a glass slide followed by cell immobilization. (B) AgNW/Au thin-film hybrid substrate prepared by deposition of a Cr/Au layer on a silicon wafer, subsequent AgNW assembly, and cell immobilization. SKBR3 and HEK-293 cells were analyzed using a 785 nm excitation laser for SERS measurements.
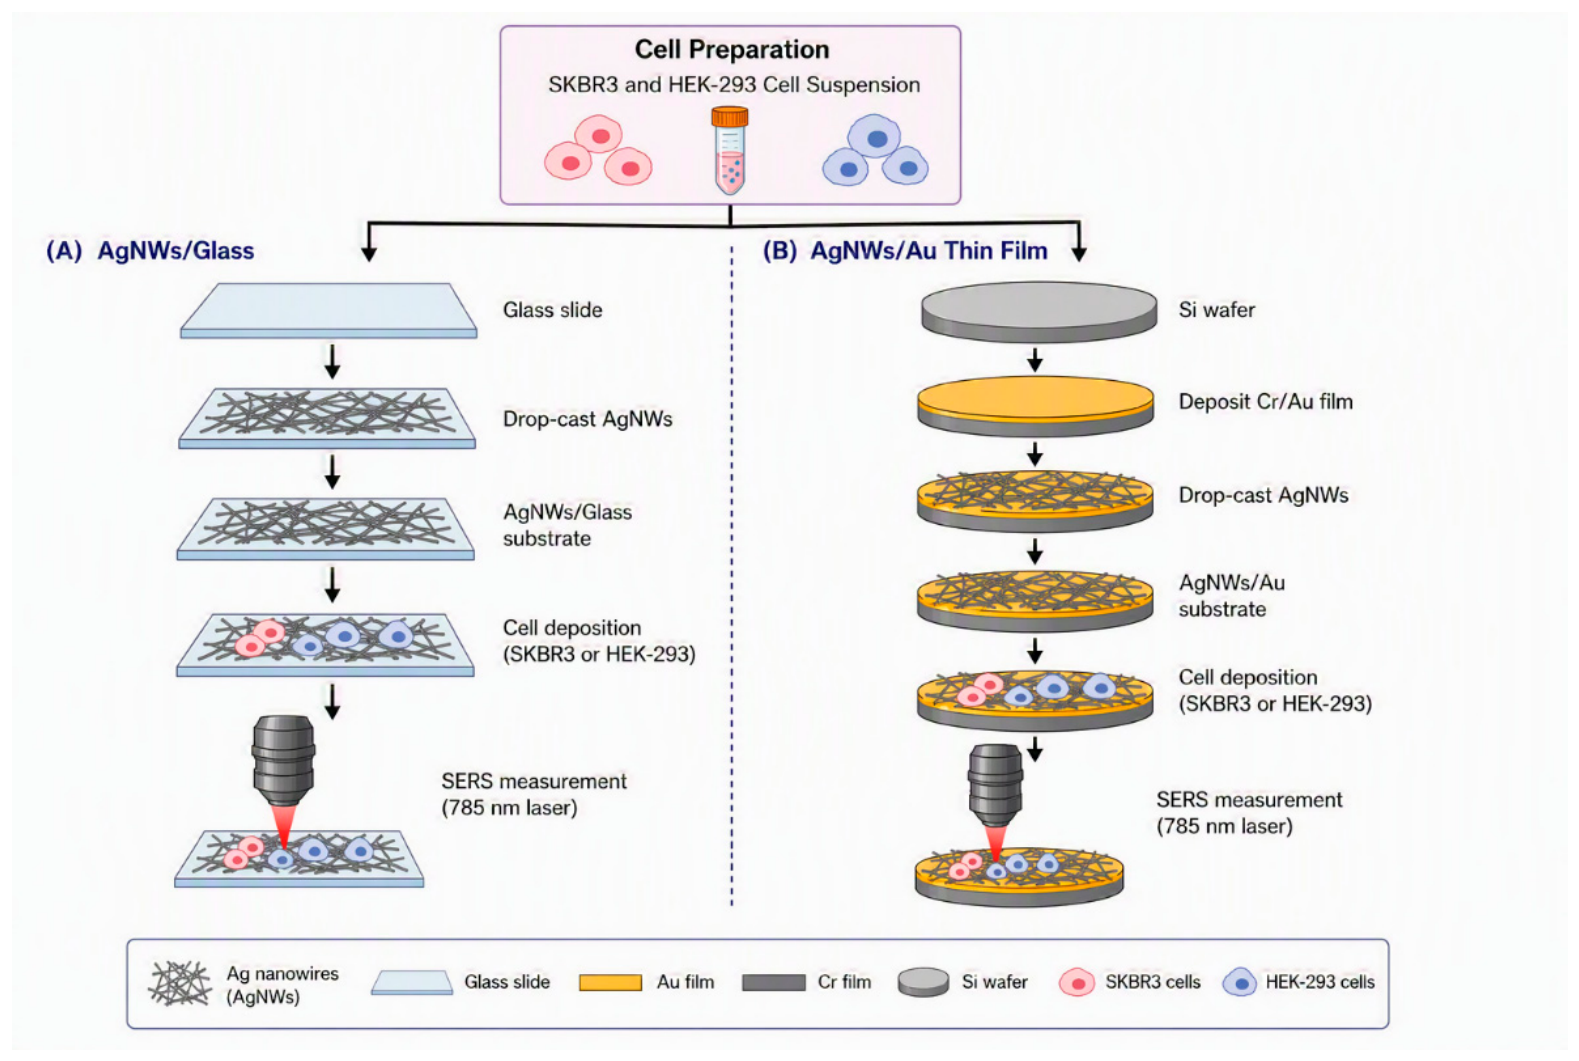
Figure 2.
FESEM images of AgNW films deposited on glass substrates (A,B), Au-film substrates (C–E), and immobilized cells on the AgNW/Au substrate (F).
Figure 2.
FESEM images of AgNW films deposited on glass substrates (A,B), Au-film substrates (C–E), and immobilized cells on the AgNW/Au substrate (F).
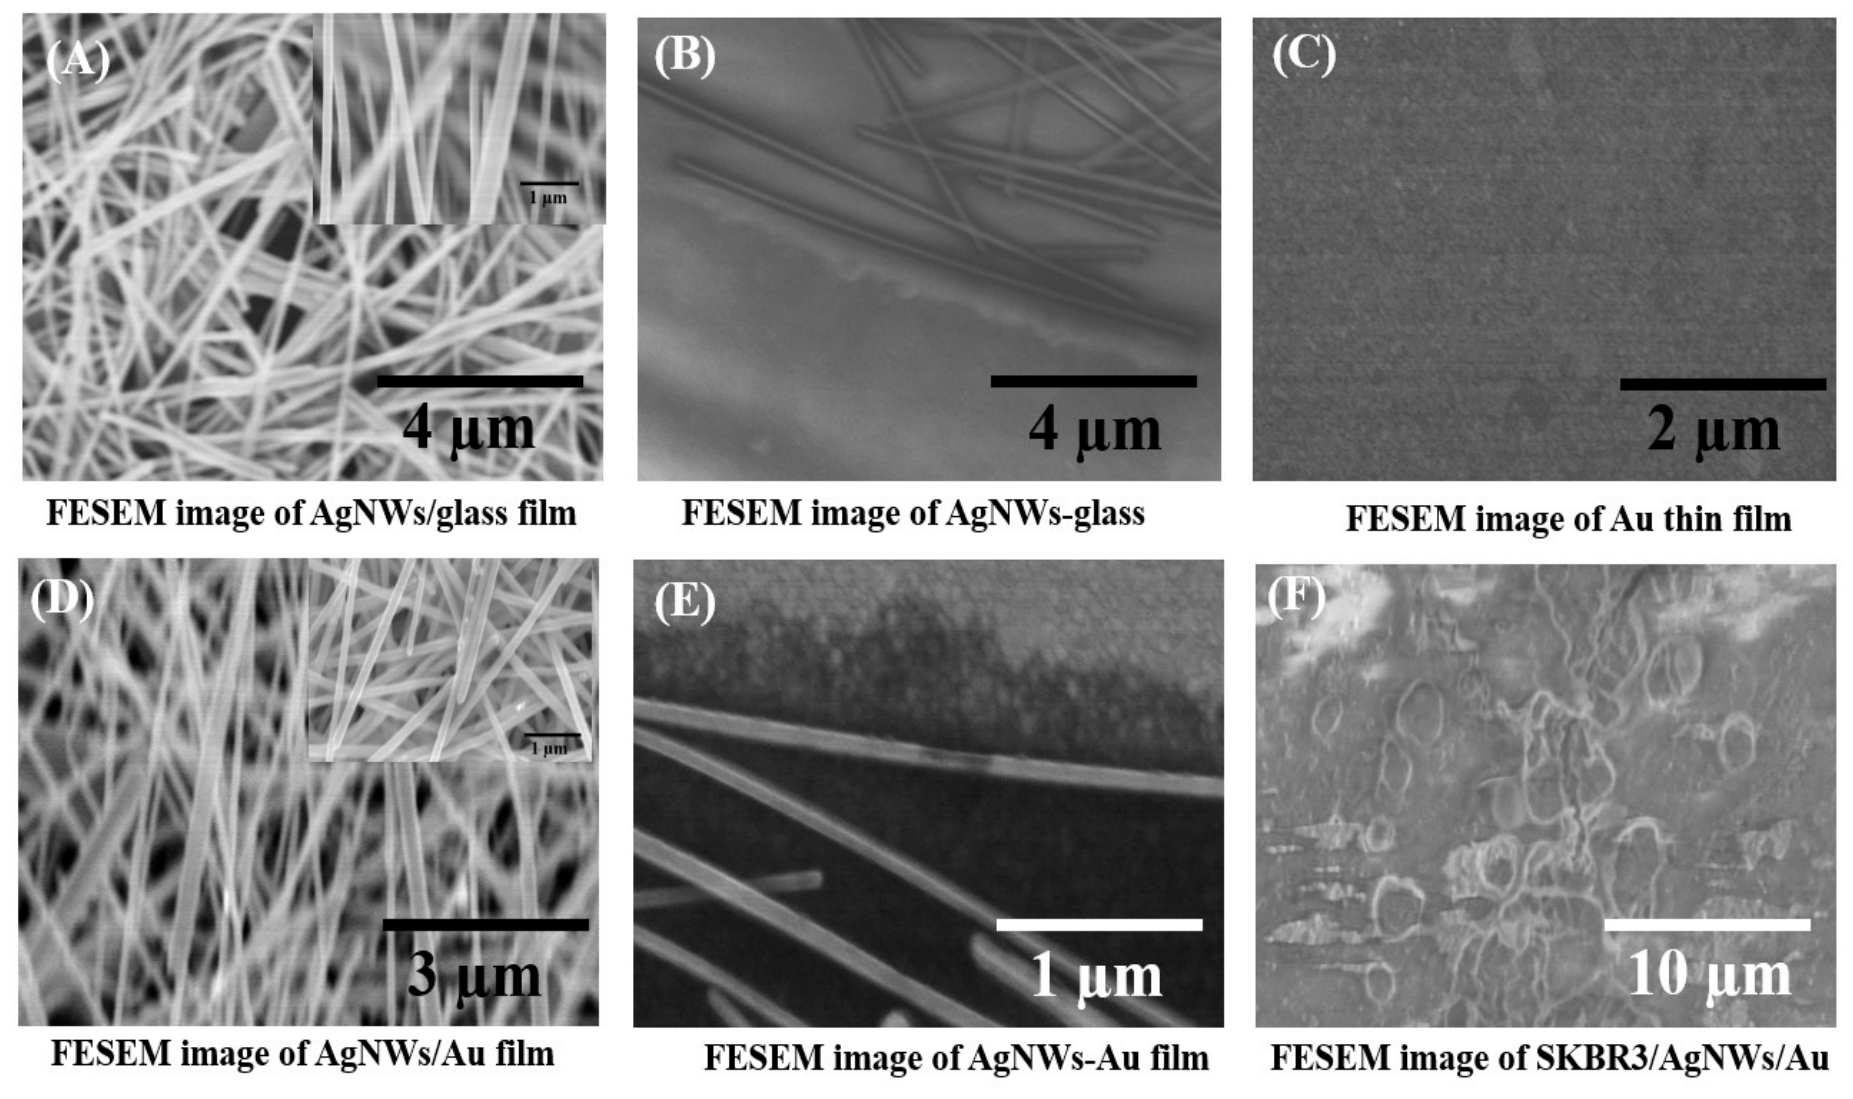
Figure 3.
Confocal images of HBSS (A), HEK-293 cells (B), and SKBR3 cells (C) deposited on AgNW-coated glass substrates.
Figure 3.
Confocal images of HBSS (A), HEK-293 cells (B), and SKBR3 cells (C) deposited on AgNW-coated glass substrates.
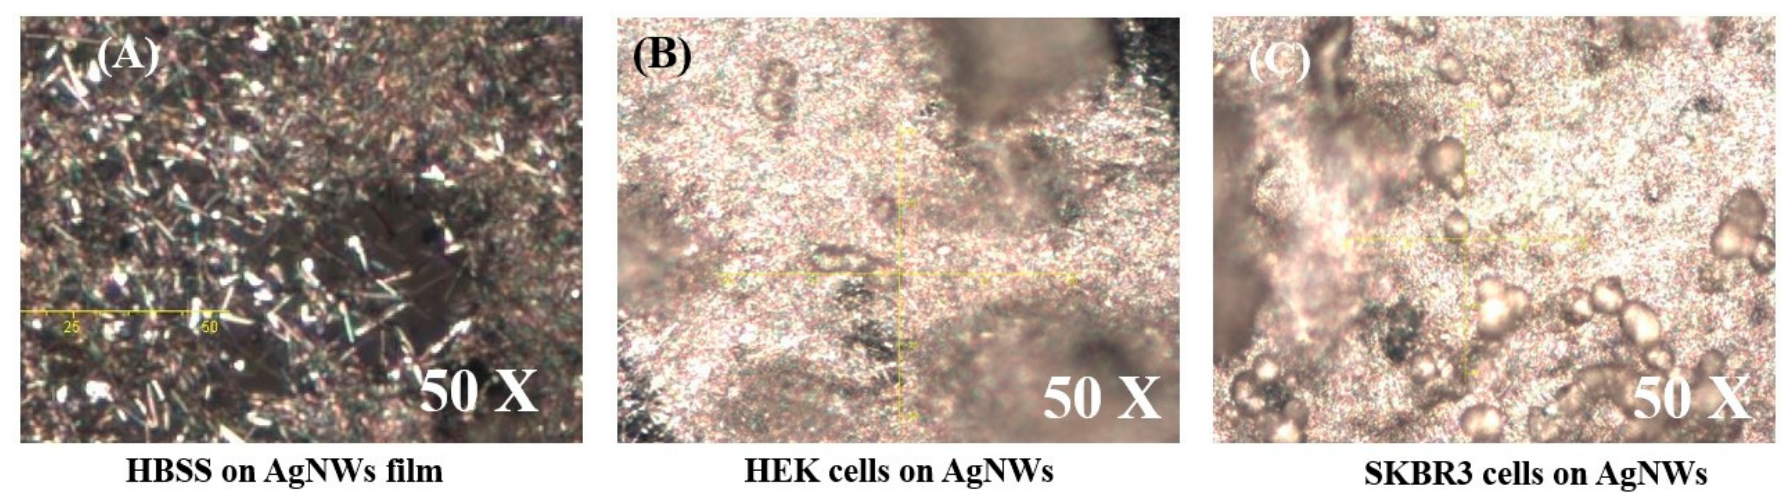
Figure 4.
Optical micrographs of HBSS, HEK-293 cells, and SKBR3 cells deposited on Au-film and AgNW/Au hybrid substrates.
Figure 4.
Optical micrographs of HBSS, HEK-293 cells, and SKBR3 cells deposited on Au-film and AgNW/Au hybrid substrates.
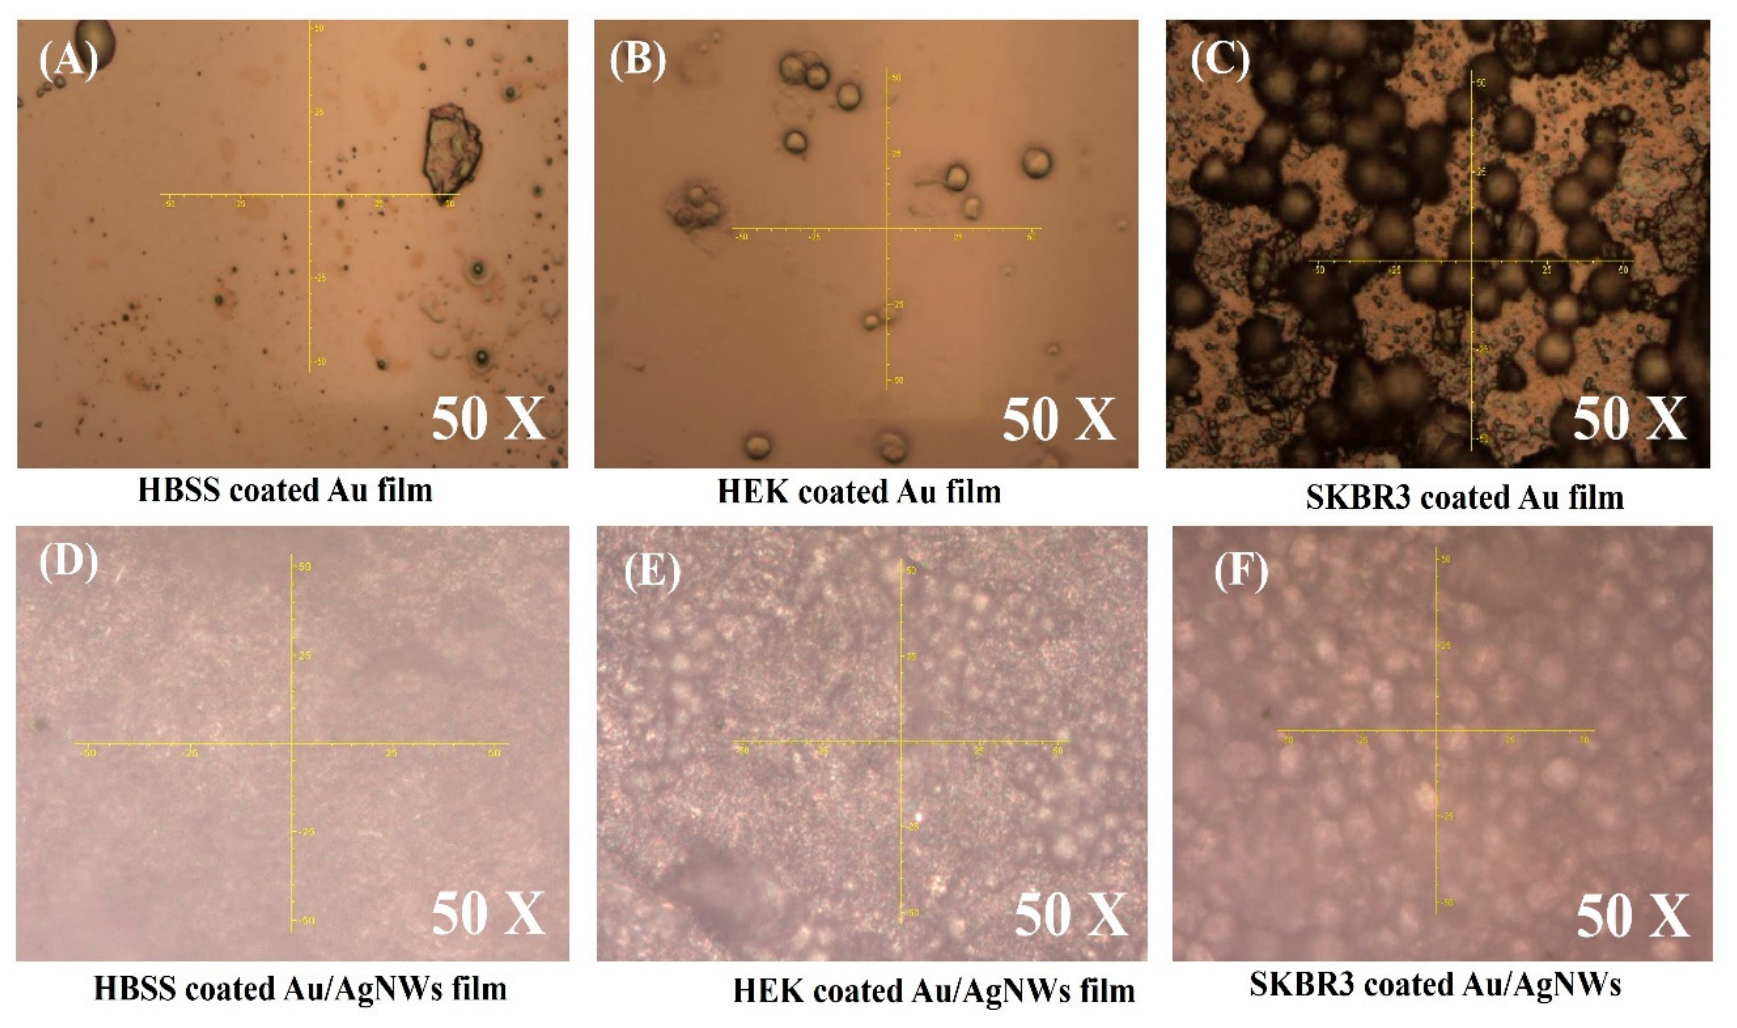
Figure 5.
SERS spectra of 1-octanethiol adsorbed on AgNW/glass and bare glass substrates (A), and AgNW/Au and bare Au substrates (B), acquired using 785 nm excitation.
Figure 5.
SERS spectra of 1-octanethiol adsorbed on AgNW/glass and bare glass substrates (A), and AgNW/Au and bare Au substrates (B), acquired using 785 nm excitation.
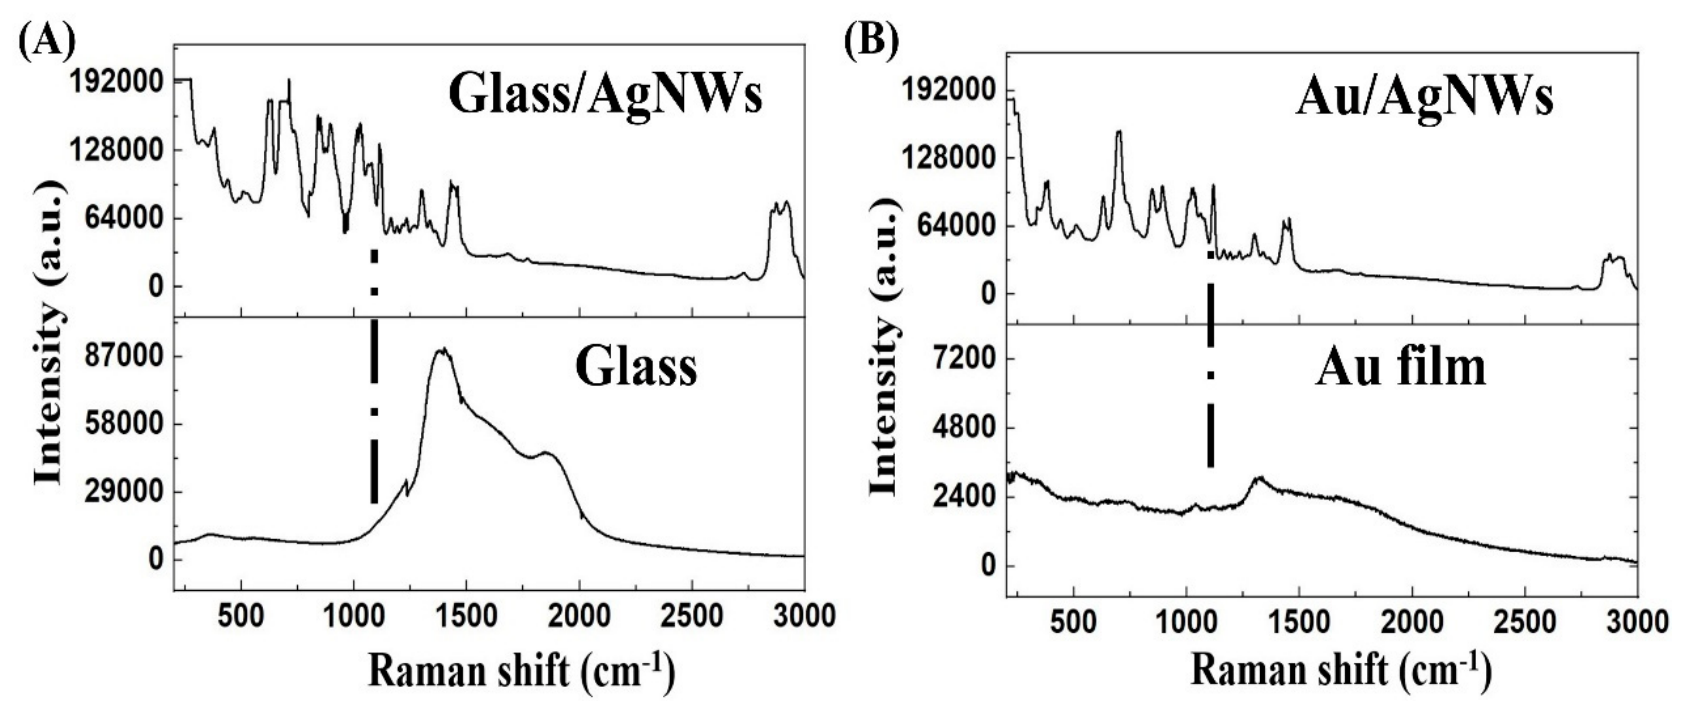
Figure 6.
SERS spectra of HBSS, HEK-293 cells, and SKBR3 cells deposited on AgNW/glass substrates at 785 nm excitation.
Figure 6.
SERS spectra of HBSS, HEK-293 cells, and SKBR3 cells deposited on AgNW/glass substrates at 785 nm excitation.
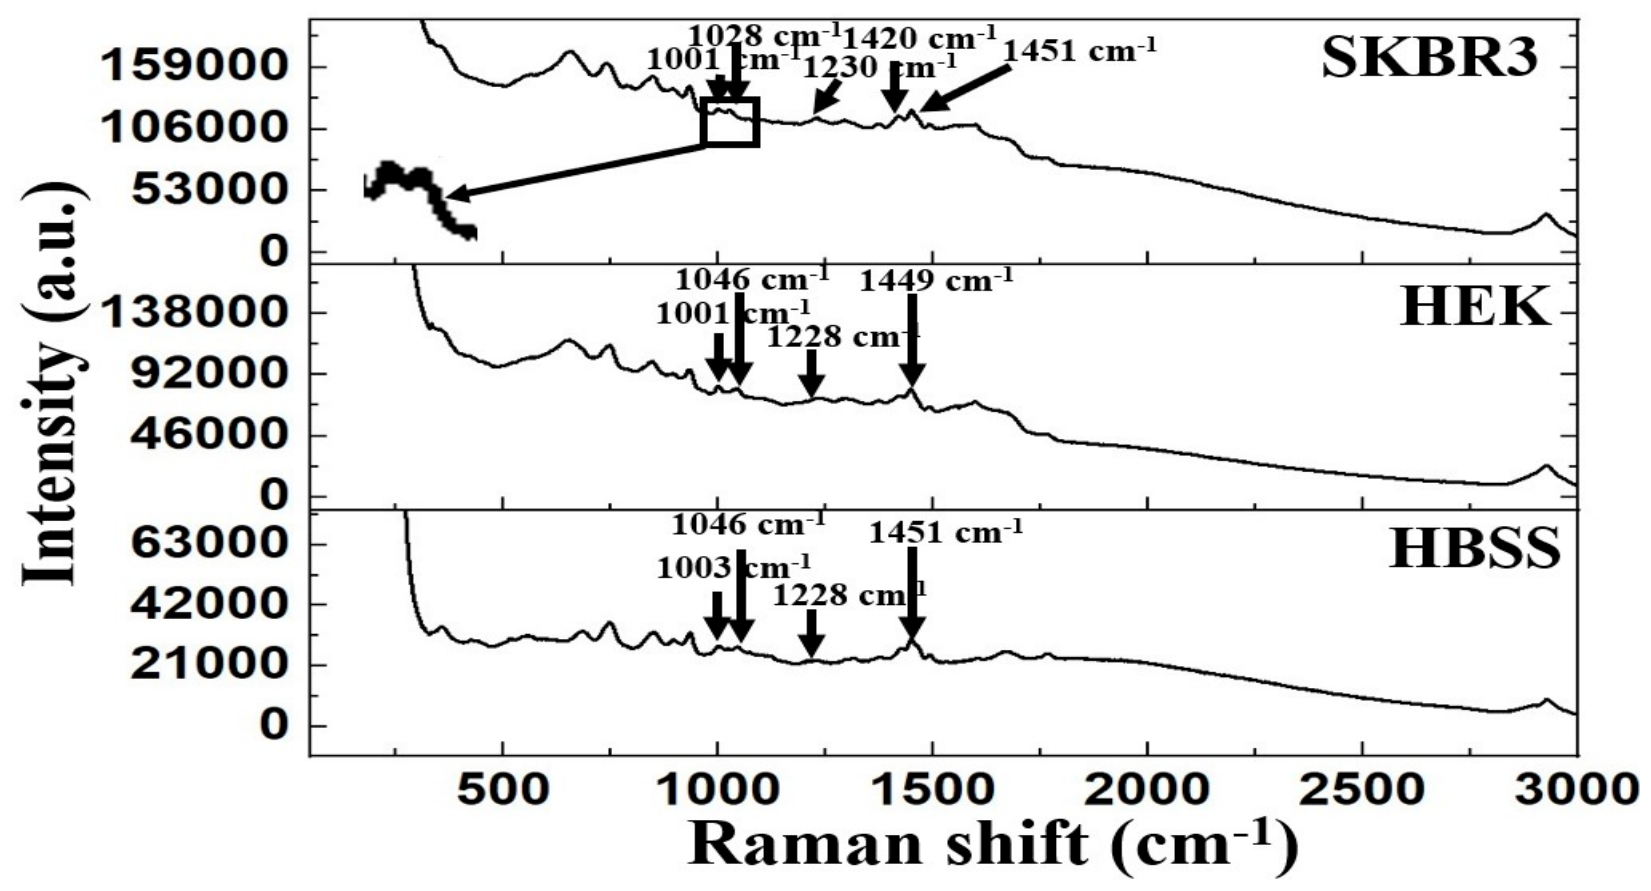
Figure 7.
Raman spectra of HBSS, HEK-293 cells, and SKBR3 cells deposited on Au-film substrates at 785 nm excitation.
Figure 7.
Raman spectra of HBSS, HEK-293 cells, and SKBR3 cells deposited on Au-film substrates at 785 nm excitation.
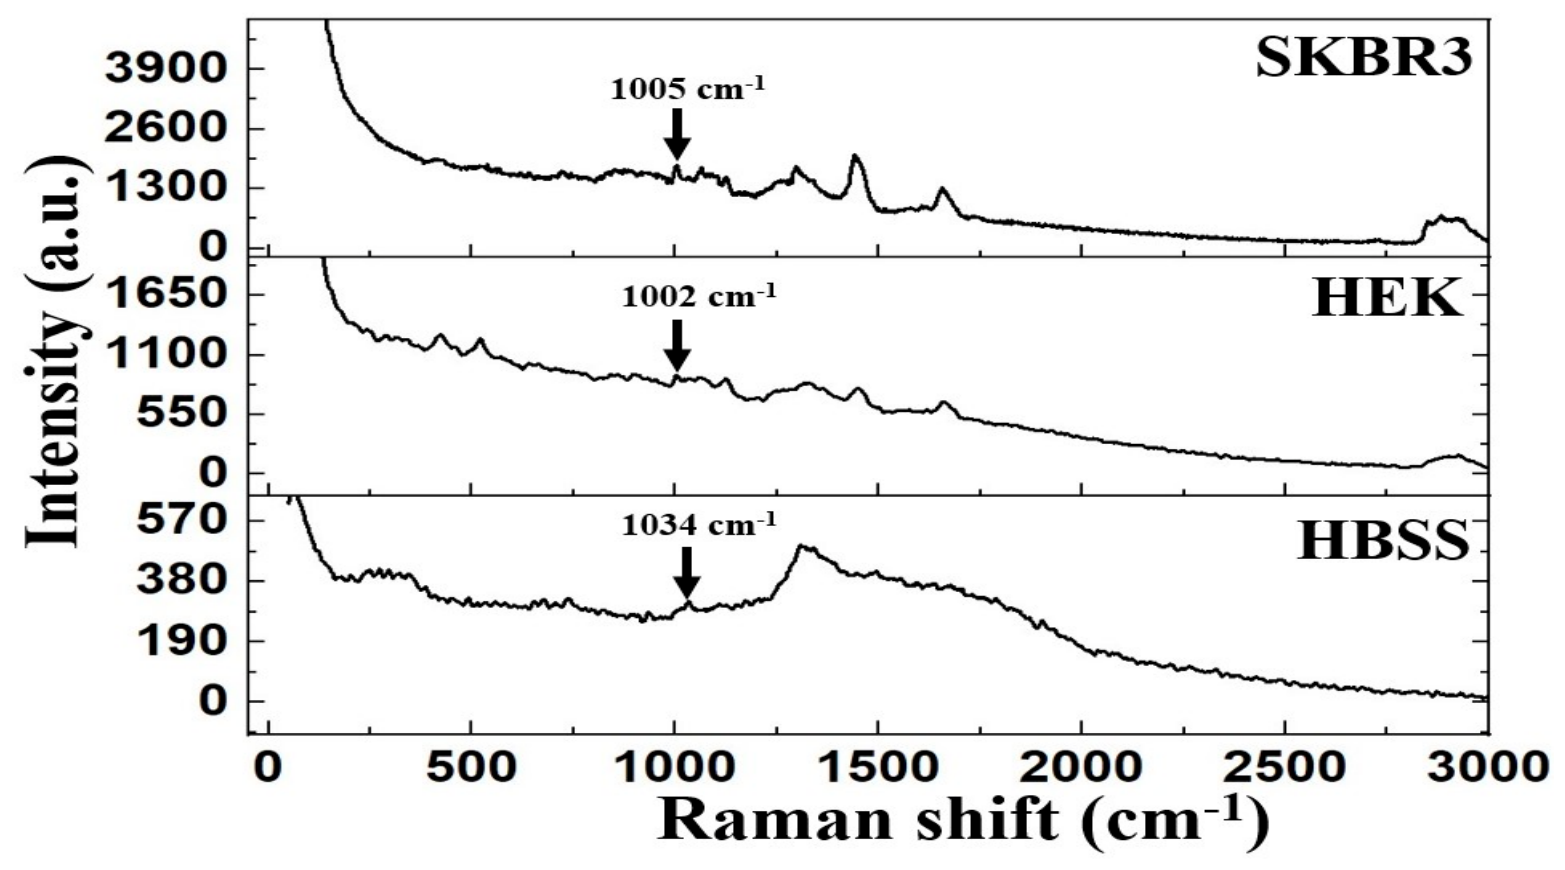
Figure 8.
SERS spectra of HBSS, HEK-293 cells, and SKBR3 cells deposited on AgNW/Au hybrid substrates at 785 nm excitation.
Figure 8.
SERS spectra of HBSS, HEK-293 cells, and SKBR3 cells deposited on AgNW/Au hybrid substrates at 785 nm excitation.
Disclaimer/Publisher’s Note: The statements, opinions and data contained in all publications are solely those of the individual author(s) and contributor(s) and not of MDPI and/or the editor(s). MDPI and/or the editor(s) disclaim responsibility for any injury to people or property resulting from any ideas, methods, instructions or products referred to in the content. |
© 2026 by the authors. Licensee MDPI, Basel, Switzerland. This article is an open access article distributed under the terms and conditions of the Creative Commons Attribution (CC BY) license (http://creativecommons.org/licenses/by/4.0/).
Copyright: This open access article is published under a Creative Commons CC BY 4.0 license, which permit the free download, distribution, and reuse, provided that the author and preprint are cited in any reuse.