
Submitted:
03 August 2026
Posted:
05 August 2026
You are already at the latest version
Abstract
This article presents the results of measuring the permittivity of a powder material. The measurements were performed using a resonance method. The method is based on a volumetric strip-slot. A computer model was developed to demonstrate the fundamental feasibility of using such a device for permittivity measurements. Calculations were made to determine the optimal number of measurements to achieve the specified accuracy. Confidence intervals for the measured parameters were obtained.

Keywords:
permittivity
; volumetric strip-slot junction
; scattering matrix
1. Introduction
When studying materials at low frequencies in the range from 10 MHz to 300 MHz, the wavelength ranges from 30 m to 1 m. Therefore, waveguide measurements are challenging. This requires waveguide dimensions that are comparable to the dimensions of the material samples being studied. The minimum frequency at which waveguide technology is used is 1.45 GHz. For lower frequencies, waveguide dimensions become very large and, as a rule, such waveguides are only manufactured on request or for special applications.
A coaxial transmission line supports the propagation of an electromagnetic wave at any frequency. This is because the critical frequency for a coaxial transmission line is zero. When measuring in a coaxial transmission line, the sample of the material being studied is positioned between the outer and inner conductors. During the study, the reflection and transmission coefficients, or scattering matrix S, are measured. Based on this matrix, the permittivity and magnetic permeability are calculated.
The main difficulty with measurements using a section of coaxial transmission line is the need to fabricate a cylinder from the sample under study with precisely defined outer and inner diameters. This is not always possible. In most cases, a powder material based on the material being studied is used for measurements.
Another difficulty is that at low frequencies, when measuring the S-matrix and subsequently calculating the electrodynamic parameters, the measurement and calculation errors increase. Based on numerous studies, it has been established that this method provides acceptable accuracy starting at a frequency of 2 GHz.
2. Measuring the Permittivity of Materials
Measuring permittivity is an important task in various fields of science and engineering, including radio frequency identification, wireless communications, sensors, and materials science. Permittivity determines how a material responds to an electric field and influences its behavior in the microwave frequency range. Understanding these properties allows us to optimize the designs of antennas, filters, and other radio frequency components.
There are several methods for measuring permittivity, each with its own advantages and limitations.
2.1. Reflectometry Method
This method is based on the analysis of reflected signals during the interaction of an electromagnetic wave with a material. In the centimeter and millimeter ranges, waveguides are widely used to analyze materials with varying loss levels. They allow determination of permittivity and magnetic permeability, as well as the loss tangent. The main drawback of this method is its narrow operating frequency band, limited by the waveguide's critical frequency, below which the waves attenuate. Broadband measurements require a set of sections of different cross-sections and samples of corresponding sizes.
Single-port vector reflectometers can provide information on the reflectivity and, consequently, the dielectric properties of a sample. This method is particularly effective for rapid scanning and can be used for various types of materials. This article presents a device for measuring the permittivity of PCBs. PCBs are being developed based on the scattering characteristics of electromagnetic waves by dielectric materials [1].
This article proposes a device and method for measuring the permittivity of composites under load [2].
A new method for determining the complex permittivity of conductors with a dielectric coating on the plates is described. The constant can be found by measuring the angle of maximum radiation and two angles of half-peak power radiation from a leaky-wave antenna. This method is particularly useful for millimeter waves and allows for automatic measurement [3].
2.2. Resonance Method
Resonance methods involve the use of resonators, which can be coaxial or planar. Filling the resonator with the material being studied changes the resonance frequency, allowing for precise determination of the permittivity. This method is particularly useful for low-loss materials, where high accuracy is required. Lumped-parameter resonant circuits are used to determine the real (ε') and imaginary (ε") parts of the permittivity in the range from a few kHz to 50 MHz.
Various design solutions have been described in the literature. A resonator apparatus with a split cylinder has been developed. This split-cylinder resonator can measure materials with low dielectric loss [4]. A portable device designed for measuring the complex permittivity of dielectric materials at microwave frequencies is used to measure permittivity. The equipment consists of a single-port vector reflectometer and a resonant coaxial bi-entrant microwave cavity [5].
2.3. Time Domain Method
This method uses pulsed signals to analyze the temporal response of a material to an electric field. It provides information on dielectric properties over a wide frequency range and can be used to study dynamic changes in materials. Portable microwave sensors are used [6].
Time-domain reflectometry (TDR) methods are used to measure the dielectric properties of materials [7].
2.4. Methods of Measurement Using Antennas
These methods involve the use of antennas to measure material parameters based on their placement within the antenna field. They enable the study of dielectric properties under conditions similar to real-world applications, such as antennas and other radio-frequency devices. To measure complex permittivity, a reflection method has been developed using a monostatic horn antenna integrated with two processes to reduce errors [8].
2.5. Measuring Instruments
Modern dielectric constant measurement devices include portable instruments that can be used in the field.
Vector network analyzers are widely used. These devices allow complex measurements and analysis of both the amplitude and phase of signals, which significantly improves measurement accuracy.
High-Q resonators are most effective when measuring up to 2 GHz. The use of high-Q resonators makes it possible to achieve high sensitivity when measuring material parameters. Such devices can be used to study both solid and liquid samples.
Portable systems that are available as an option for various measuring instruments. New models of reflectometers are equipped with automation and data processing functions, which greatly simplifies the measurement process and reduces the likelihood of errors. This makes them ideal for use in the field and for rapid evaluation of materials.
3. Research Direction
The authors' research focuses on measuring the electrodynamic parameters of materials over a wide frequency range. Various powder materials have been studied in the frequency range from 2 GHz to 18 GHz [9,10,11,12].
To verify the validity of the measured S-parameters, an algorithm for validating the obtained data was developed. The algorithm is based on the Kramers-Kronig relation. A comparison of theoretical and experimental values is provided, confirming the validity of the obtained relations and conclusions [13,14].
All studied and proposed methods operate in the frequency range above 2 GHz. This is due to the fact that the measurements used a coaxial transmission line of a specific length, which is commensurate with the wavelength of the range. For lower frequencies, it is necessary to increase the measuring transmission line. This leads to an increase in the amount of material tested and an increase in manufacturing and production costs. Measurements of electrodynamic parameters in the low frequency range can only be achieved using resonant methods or a cavity resonator.
The authors proposed a measurement method based on the resonant method. The proposed method is based on the use of the volumetric strip-slot [15]. Research was conducted to determine the fundamental feasibility of using this method at frequencies below 2 GHz. Computer modeling was conducted, and a design for the volumetric strip-slot was developed.
When measuring powder materials, numerous factors influence the final values [16]. This requires research based on probabilistic methods. This will allow us to determine the precise number of measurements required to assess measurement accuracy.
4. Computer Model of a Volumetric Strip-Slot Junction
To evaluate the feasibility of measuring the dielectric properties of powder materials, a computer model of the junction was developed.
The design of a bulk stripline junction with a slot resonator consists of four dielectric plates (Figure 1). These plates are made of Arlon AD350 with a permittivity of 3.5. This material is widely used in the design of various high-frequency devices. The plate thickness was chosen to be 1.524 mm. Rogers 4350B with a permittivity of 3.6 can be selected as a dielectric material.
Between these dielectric plates are stripline transmission lines 7-9, which are located on opposite sides of the multilayer structure. All these dielectric plates are attached to a metal base 5. A U-shaped slot resonator 7 is cut into the metal base.
The microstrip transmission line intersect the slot line and terminate in a break at a distance of a quarter wavelength (λ/4) from the intersection [17,18].
4.2. The Principle of Measuring
The principle of measuring the permittivity of the test material is as follows. The first step is to calibrate the vector network analyzer used for the measurements. For the measurements, TRL calibration is performed in the frequency range from 500 MHz to 1500 MHz.
The slot resonator impedance is selected so that at a given frequency, the impedance is equal to the waveguide impedance of the microstrip transmission line.
When the slot line is filled with the test material, the characteristic impedance changes inversely proportional to √ε. Due to the change in characteristic impedance, the resonant frequency shifts. By calculating the frequency difference, the permittivity of the test material is calculated.
The input characteristic impedance of the microstrip transmission lineis calculated to be 50 ohms. Each channel uses slot resonators with a length of λ/2, as well as resonators with a length of λ/4. An idle circuit is formed at the end of each line.
Figure 2.
Scattering parameters of the VSS junction with the air-filled and dielectric-filled slot.
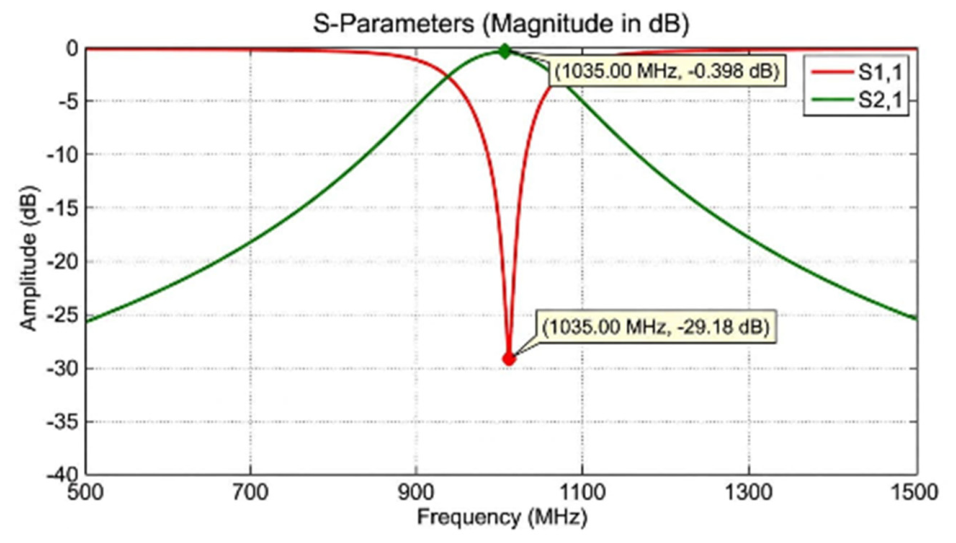
The studied materials with different permittivity values shift the resonant frequency. This occurs due to changes in the characteristic impedance of the slot line in the junction..
In the computer model, the test sample was defined as a material with permittivity ε = 1, ε = 3, ε = 5, and ε = 10.
The central resonant frequency shifts from 1035 MHz (for air filling) to 980 MHz when filled with test sample #2, to 932 MHz when filled with test sample #3, and to 837 MHz when filled with test sample #4. The measurement results are shown in Figure 3 and Figure 4.
Using the obtained elements of the junction scattering matrix, we can determine the permittivity of the materials in the gap and compare it with that specified in the model. The computer model demonstrates that it is fundamentally possible to measure permittivity. Using the developed the volumetric strip-slot junction, we can determine the resonator frequency shift and measure the full scattering matrix.
5. Experimental Study of the VSS-Junction Based Meter
5.1. Preparing for Measurement
A Planar S50244 vector network analyzer was used for the measurements.
Thru-Reflect-Line (TRL) calibration is a method for calibrating vector network analyzers (VNAs) that ensures high measurement accuracy by using three calibration standards. This method is particularly useful in situations where maximum accuracy is required and standard calibration kits do not contain suitable standards. Calibration was performed using a Rosenberg calibration kit.
After calibration, S-parameter measurements were performed using an air-filled slot resonator. The measurement results are shown in Figure 6.
Titanium-doped barium hexaferrite was chosen as the test material. This material has been extensively studied in various frequency ranges. Varying the degree of doping allows for a wide range of permittivity variations. The permittivity of barium hexaferrite BaFe10Ti2O19 with x(Ti)=2 is ε=10.
5.2. Calculating the Number of Measurements
In most of the described methods, the authors perform only a single measurement. The obtained measurement results are not analyzed to assess the accuracy of the obtained values. When measuring the electrodynamic parameters of powder materials, the final S-parameter values are influenced by many factors, including the particle size of the material and the packing density of the material within the measuring line. Each time the measuring line is filled with material, the particles are arranged differently, which affects the final values.
The articles did not estimate the number of measurements required to determine the true value of a given parameter with any certainty.
Let's calculate the required number of measurements to be able to assert with a probability of at least 0.9 that the arithmetic mean of these measurements differs from S11 and S21 by less than 0.5 dB in absolute value.
To do this, we'll write the law of large numbers in Chebyshev form.
The results of measuring the scattering parameters (the S11 reflection coefficient and the S21 transmission coefficient) are given in Table 1 and Table 2.
Based on the calculations performed for the number of measurements, S-parameter measurements were performed. The measurements were performed on an empty, bulk stripe-gap junction. The resonator was disassembled and reassembled each time. A series of measurements were then performed on the test material, barium hexaferrite BaFe10Ti2O19 x(Ti)=2.
Let us show that the obtained values of the measured parameters, which are given in the Table 1 and Table 2, do not have a significant scatter and are in the standard deviation.
It follows from the measurement results that with repeated measurements of the reflection and transmission coefficients of dielectric materials, during which the junction was assembled and disassembled, a scatter of the measured values of at least 20-30%, depending on the parameter, was observed in the frequency band.
Let the measured values be random variables depending on the number of measurements.
We consider these random variables as deterministic, since they depend on the number of measurements. Let us show that the law of large numbers holds for such values. The mean value of the sample converges in probability to the mathematical expectation:
That is, for any , the following expression is fulfilled:
Let us show that the random variables (1) with finite variance are within the interval, the boundaries of which are specified as [16], where is the variance of random variables (1).
For these random variables, the following relation must be fulfilled:
We calculate the mean values of each variable and their mathematical expectation. The results are given in Table 3.
We check the obtained values by formula (4) and calculate. The obtained values are presented in Table 4.
The results in Table 4 show that the difference has a small value, compared to the value of the parameter, for each variable. As the number of measurements increases, the difference tends to zero and the law of large numbers is fulfilled. This statement shows normal distribution of the measurement results and the stability of the measurement mean values.
Based on the experimental values of the S-parameters, we find the confidence interval.
We find the confidence interval using the formula:
where - average value of the studied quantity;
- Student's coefficient, for =0.05, n=30 ;
– Standard deviation.
6. Conclusion
Further refinement of the VSS-based measuring device prototype will enable even higher measurement accuracy. This can be achieved by optimizing the geometric parameters of the strip-and-gap junction itself, as well as by using more sensitive and precise measuring instruments. In particular, studying the influence of various substrate materials on the characteristics of the VSS junction may open up new possibilities for expanding the range of measured permittivities and reducing measurement errors.
Furthermore, adapting this method to measure the permittivity of other types of powder materials, including composites, ceramics, and polymers, is a pressing task. The development of specialized measuring cells that take into account the specific properties of these materials (e.g., hygroscopicity and anisotropy) will expand the scope of application of the VSS method. The software for processing experimental data can also be improved, for example, by implementing artificial intelligence algorithms to automatically determine optimal measurement parameters and more accurately calibrate the device.
Analysis of the study results showed that the confidence intervals for all measured parameters were calculated correctly and reflect the degree of uncertainty inherent in any experimental measurement. Since virtually all measured values fall within the corresponding confidence intervals, this fairly demonstrates that the experimental data are normally distributed. This result provides a reliable basis for further use and development of the proposed method.
Thus, the presented method for measuring the permittivity of powder materials using a bulk strip-and-gap junction has demonstrated its validity and potential for practical application. The achieved accuracy of 10% is acceptable for many applications, and further research and improvements can lead to the development of even more effective and versatile measuring systems.
Author Contributions
Conceptualization, Dudarev N.V., Dudarev S.V. and Klygach D.S.; methodology, Klygach D.S.; software, Klygach D.S.; formal analysis, Klygach D.S.; investigation, Klygach D.S.; visualization, Klygach D.S.; supervision, Klygach D.S. ; validation, Dudarev N.V., Dudarev S.V. and Klygach D.S.; resources, Dudarev N.V.; data curation, Dudarev N.V.; writing—original draft preparation, Klygach D.S.; writing—review and editing, Dudarev N.V., Dudarev S.V.
Funding
This work was supported by the the Russian Science Foundation (project No. 25-29-01634).
Data Availability Statement
The datasets generated or analyzed during this study are available from the corresponding author on reasonable request.
Conflicts of Interest
The funders had no role in the design of the study; in the collection, analyses, or interpretation of data; in the writing of the manuscript; or in the decision to publish the results.
Disclosure of interests
The authors have no relationships, activities or interests for the last three years related with for-profit or not-for-profit third parties whose interests may be affected by the content of the article.
References
- H. XI, X. Liao and X. Li, "Application of Free Space Method in Measuring Dielectric Constant in PCB," 2023 Cross Strait Radio Science and Wireless Technology Conference (CSRSWTC), Guilin, China, 2023, pp. 1-3. [CrossRef]
- H. Li, D. Liu, M. Bai and Q. Li, "Composite Material Dielectric Constant Measuring Device and Method under Stress," 2018 International Applied Computational Electromagnetics Society Symposium - China (ACES), Beijing, China, 2018, pp. 1-2. [CrossRef]
- Li Guoding, Sun Qing and Shi Changsheng, "Measuring complex dielectric constant of dielectric slab-coated conductors in millimeter waves by radiating technique," IEEE International Digest on Microwave Symposium, Dallas, TX, 1990, pp. 435-438 vol.1. [CrossRef]
- Measurement of microwave dielectric properties of diamond films using split-cylinder resonator method / J. J. Su, Z. Yang, Y. F. Li [et al.] // Wuji Cailiao Xuebao. – 2015. – Vol. 30, No. 7. – P. 751-756. [CrossRef]
- A New Stand-Alone Microwave Instrument for Measuring the Complex Permittivity of Materials at Microwave Frequencies / J. D. Gutierrez-Cano, P. Plaza-Gonzalez, A. J. Canos [et al.] // IEEE Transactions on Instrumentation and Measurement. – 2020. – Vol. 69, No. 6. – P. 3595-3605. [CrossRef]
- Javanbakht, N. A Comprehensive Review of Portable Microwave Sensors for Grains and Mineral Materials Moisture Content Monitoring / N. Javanbakht, R. E. Amaya, G. Xiao // IEEE Access. – 2021. – Vol. 9. – P. 120176-120184. [CrossRef]
- A time-domain reflectometry method with variable needle pulse width for measuring the dielectric properties of materials / A. Wilczek, A. Szypłowska, M. Kafarski, W. Skierucha // Sensors. – 2016. – Vol. 16, No. 2. [CrossRef]
- Y. Yamaguchi and Y. Sato, "Measuring method of complex dielectric constant with monostatic horn antenna in W-band using multiple distance measurements and analysis," 2017 IEEE Asia Pacific Microwave Conference (APMC), Kuala Lumpur, Malaysia, 2017, pp. 666-669. [CrossRef]
- Crystal structure and peculiarities of microwave parameters of Co1−xNixFe2O4 nano spinel ferrites / M. M. Hussein, S. A. Saafan, H. F. Abosheiasha [et al.] // RSC Advances. – 2023. – Vol. 13, No. 38. – P. 26879-26891. [CrossRef]
- Studies of the electrodynamic parameters of a powdered material depending on the fractional composition in the frequency range of 8-12 GHz / M. Vakhitov, D. Klygach, V. Zhivulin, D. Vinnik // 2019 International Conference on Engineering and Telecommunication, EnT 2019, Dolgoprudny, 20–21 нoября 2019 гoда. – Dolgoprudny, 2019. – P. 9030578. [CrossRef]
- Influence of phase ratio on structural, magnetic, and microwave characteristics of hard/soft SrEr0.01Cr0.01Fe11.98O19/NiFe2O4 magnetic nanocomposites / M. A. Almessiere, Y. Slimani, A. D. Korkmaz [et al.] // Applied Physics A: Materials Science & Processing. – 2023. – Vol. 129, No. 3. – P. 187. [CrossRef]
- Impact of Ho substitution on structure, magnetic and electromagnetic properties hard-soft nanocomposites / M. A. Almessiere, S. Caliskan, A. Baykal [et al.] // Materials Science and Engineering: B. – 2024. – Vol. 308. – P. 117571. [CrossRef]
- Shestakov, A. L. Algorithm for Verifying the Measurements / A. L. Shestakov, D. S. Klygach, M. G. Vakhitov // Bulletin of the South Ural State University. Series: Mathematical Modelling, Programming and Computer Software. – 2022. – Vol. 15, No. 3. – P. 134-141. [CrossRef]
- 14. The Method for Measuring the Permittivity to Assess the Influence of External Factors / A. Malkin, V. Chechetkin, A. Korotkov [et al.] // 2021 29th Telecommunications Forum, TELFOR 2021 - Proceedings : 29, Virtual, Belgrade, 23–24 нoября 2021 гoда. – Virtual, Belgrade, 2021. [CrossRef]
- Permittivity Measurement for Powder Materials Using a Volumetric Strip-slot Junction / D. Klygach, M. Vakhitov, A. Khashimov [et al.] // 2021 International Conference Engineering and Telecommunication, En and T 2021, Dolgoprudny, 24–25 нoября 2021 гoда. – Dolgoprudny: Institute of Electrical and Electronics Engineers Inc., 2022. [CrossRef]
- Measuring permittivity and permeability for a powdered material / D. S. Klygach, M. G. Vakhitov, A. B. Khashimov, K. M. Yusupov // Proceedings of the 2019 21st International Conference on Electromagnetics in Advanced Applications, ICEAA 2019 : 21, Granada, 09–13 сентября 2019 гoда. – Granada, 2019. – P. 309-311. [CrossRef]
- Klygach D.S., Vakhitov M.G., Dudarev N.V., Darovskikh S.N., Dudarev S.V. Simulation of a volumetric strip-slot transition // Radio electronics journal [electronic journal]. 2020. No. 7. (in Russian).
- N. V. Dudarev and S.N. Darovskih, "Development of a hybrid power divider on a multilayer structure," Bulletin of South Ural State University, 2017, vol. 17, no. 1, pp. 34-41 (in Russian).
Figure 1.
The meter model based on the volumetric strip-slot (VSS) junction.
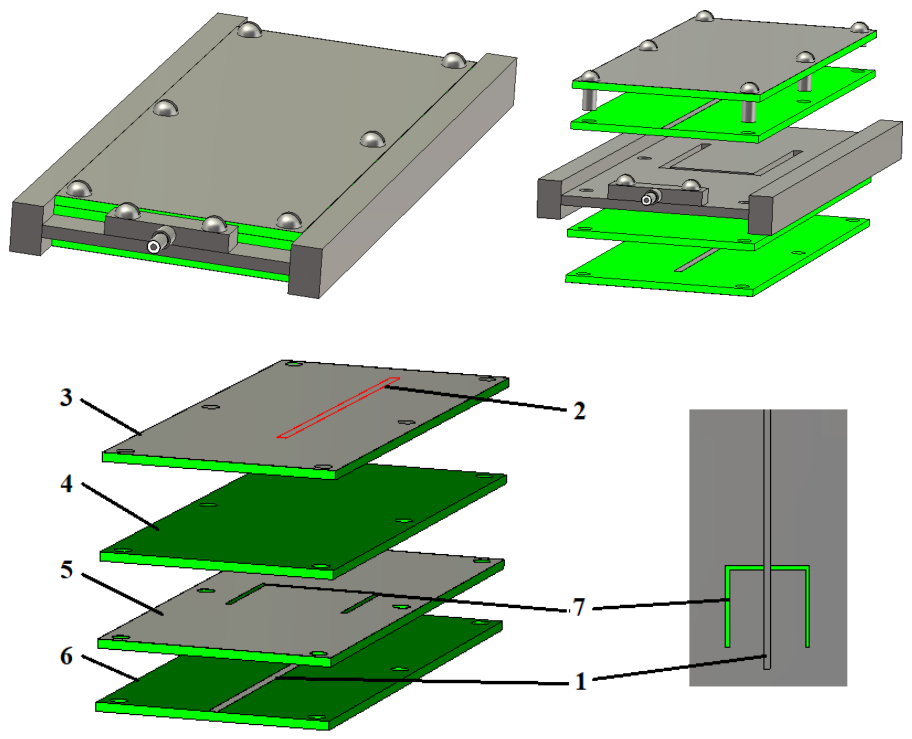
Figure 3.
Dynamics of the change in the reflection coefficient of the VSS junction when changing the permittivity of the slot medium.
Figure 3.
Dynamics of the change in the reflection coefficient of the VSS junction when changing the permittivity of the slot medium.
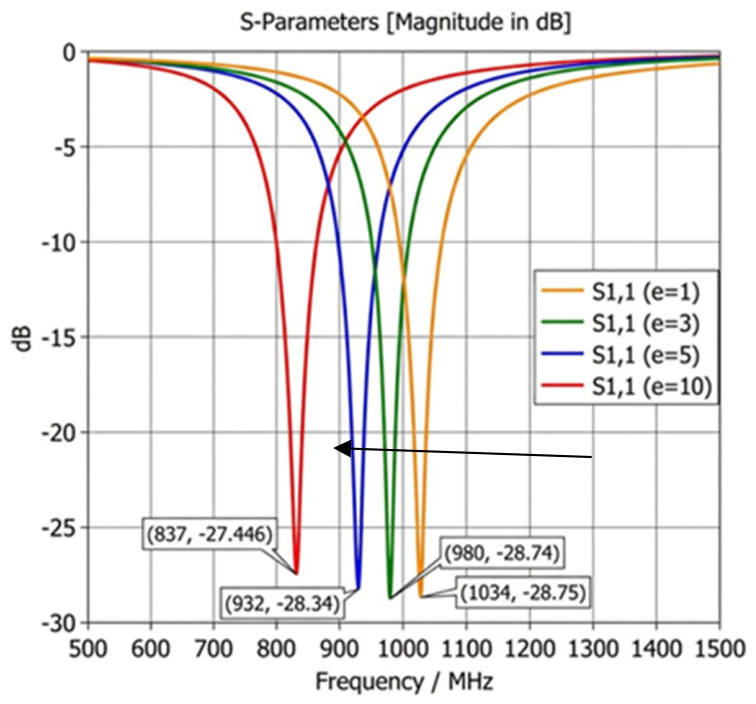
Figure 4.
Dynamics of the change in the transmission coefficient of the VSS junction when changing the permittivity of the slot medium.
Figure 4.
Dynamics of the change in the transmission coefficient of the VSS junction when changing the permittivity of the slot medium.
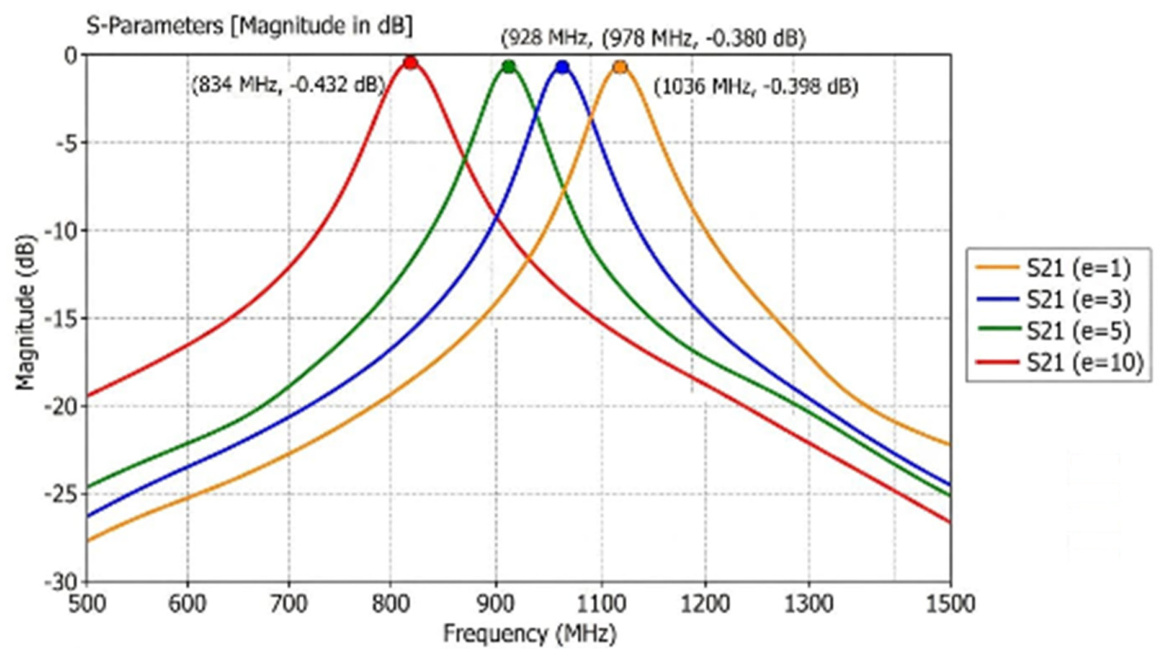
Figure 6.
Scattering parameters of the VSS junction with the air-filled and dielectric-filled slot.
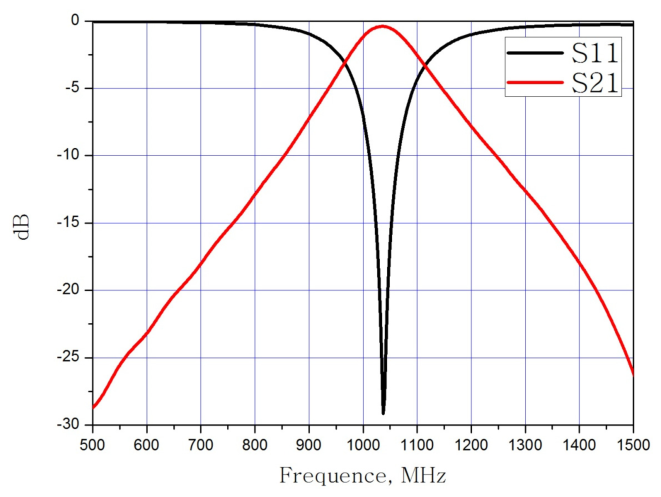

Table 1.
Characteristics of the VSS joint with the air-filled slot.
| № | f, MHz | S11, dB | S21, dB | № | f, MHz | S11, dB | S21, dB |
| 1 | 1098 | -15,38 | -1,23 | 17 | 1079 | -17,23 | -1,14 |
| 2 | 1098 | -15,91 | -1,24 | 18 | 1092 | -15,32 | -1,16 |
| 3 | 1098 | -16,32 | -1,27 | 19 | 1079 | -17,96 | -1,14 |
| 4 | 1092 | -16,56 | -1,39 | 20 | 1072 | -18,51 | -1,25 |
| 5 | 1079 | -15,34 | -1,13 | 21 | 1079 | -18,51 | -1,15 |
| 6 | 1072 | -15,40 | -1,24 | 22 | 1079 | -17,74 | -1,13 |
| 7 | 1092 | -15,15 | -1,05 | 23 | 1073 | -17,80 | -1,14 |
| 8 | 1092 | -15,23 | -1,05 | 24 | 1079 | -17,32 | -1,14 |
| 9 | 1066 | -23,56 | -1,32 | 25 | 1079 | -18,21 | -1,15 |
| 10 | 1092 | -15,13 | -1,21 | 26 | 1079 | -18,88 | -1,14 |
| 11 | 1092 | -15,32 | -1,16 | 27 | 1073 | -17,75 | -1,13 |
| 12 | 1092 | -14,92 | -1,06 | 28 | 1066 | -17,66 | -1,46 |
| 13 | 1092 | -15,05 | -1,05 | 29 | 1066 | -16,60 | -1,28 |
| 14 | 1092 | -14,90 | -1,01 | 30 | 1066 | -16,60 | -1,28 |
| 15 | 1098 | -15,38 | -1,24 | 31 | 1079 | -16,90 | -1,14 |
| 16 | 1066 | -27,30 | -1,38 | 32 | 1078 | -20,58 | -1,33 |
Table 2.
Characteristics of the VSS joint with the powder-filled slot.
| № | f, MHz | S11, dB | S21, dB | № | f, MHz | S11, dB | S21, dB |
| 1 | 852 | -31,94 | -3,14 | 17 | 864 | -30,94 | -5,20 |
| 2 | 852 | -31,81 | -3,14 | 18 | 856 | -32,69 | -5,77 |
| 3 | 842 | -25,02 | -2,75 | 19 | 862 | -29,38 | -5,54 |
| 4 | 845 | -28,02 | -2,86 | 20 | 836 | -26,66 | -2,65 |
| 5 | 845 | -30,97 | -2,86 | 21 | 836 | -26,74 | -2,65 |
| 6 | 864 | -37,42 | -4,32 | 22 | 839 | -21,90 | -2,72 |
| 7 | 839 | -25,02 | -2,85 | 23 | 836 | -27,03 | -2,81 |
| 8 | 832 | -25,15 | -2,99 | 24 | 836 | -26,88 | -2,82 |
| 9 | 858 | -26,49 | -3,02 | 25 | 839 | -26,61 | -3,22 |
| 10 | 852 | -30,90 | -3,14 | 26 | 852 | -31,02 | -3,09 |
| 11 | 865 | -35,01 | -4,32 | 27 | 858 | -27,17 | -3,22 |
| 12 | 865 | -28,46 | -3,14 | 28 | 845 | -30,85 | -2,86 |
| 13 | 865 | -34,01 | -3,88 | 29 | 832 | -28,65 | -3,00 |
| 14 | 865 | -34,82 | -3,84 | 30 | 832 | -29,28 | -2,97 |
| 15 | 865 | -34,75 | -3,84 | 31 | 832 | -29,19 | -2,97 |
| 16 | 858 | -27,02 | -3,05 | 32 | 845 | -28,45 | -2,85 |
Table 3.
Probabilistic characteristics of measured variables.
| f | S11 | S21 | fM | S11M | S21M | |
| 1082.3 | -17.09 | -1.1903 | 848.7 | -23.52 | -3.386 | |
| 1081.9 | -16.9 | -1.1933 | 848.03 | -23.67 | -3.33 | |
| 11.36 | 2.64 | 0.108 | 12.28 | 7.76 | 0.848 |
Table 4.
Calculation results.
| f | S11 | S21 | fM | S11M | S21M | |
| 1082.3 | -17.09 | -1.1903 | 848.7 | -23.52 | -3.386 | |
| 1081.9 | -16.9 | -1.1933 | 848.03 | -23.67 | -3.33 | |
| 11.36 | 2.64 | 0.108 | 12.28 | 7.76 | 0.848 |
Table 5.
Confidence intervals.
| Parameters | Confidence interval |
| f, MHz | 1078.07< f <1086.53 |
| S11, dB | -18.07< S11<-16.11 |
| S21, dB | -1.23< S21<-1.15 |
| fM, MHz | 848.70< fM <853.27 |
| S11M, dB | -26.41< S11M <-20.63 |
| S21M, dB | -3.70< S21M <-3.07 |
Disclaimer/Publisher’s Note: The statements, opinions and data contained in all publications are solely those of the individual author(s) and contributor(s) and not of MDPI and/or the editor(s). MDPI and/or the editor(s) disclaim responsibility for any injury to people or property resulting from any ideas, methods, instructions or products referred to in the content. |
© 2026 by the authors. Licensee MDPI, Basel, Switzerland. This article is an open access article distributed under the terms and conditions of the Creative Commons Attribution (CC BY) license (http://creativecommons.org/licenses/by/4.0/).
Copyright: This open access article is published under a Creative Commons CC BY 4.0 license, which permit the free download, distribution, and reuse, provided that the author and preprint are cited in any reuse.


