
Submitted:
31 July 2026
Posted:
04 August 2026
You are already at the latest version
Abstract
A unified experimental database and a reproducible Python-based harmonisation workflow are presented for local heat transfer analysis in rectangular-minichannel flow boiling. The database integrates 449 experimental source files and 64,385,791 point-level records covering six working fluids, multiple surface conditions, channel configurations, and orientations. The workflow combines template-based files, central-line in-frared wall-temperature data, geometric and operating metadata, local pressure and saturation-temperature reconstruction, bulk-fluid temperature interpolation, heat-loss correction, local heat transfer coefficient and Nusselt number calculation, operational regime labelling, and auditable quality-control flags. The database is characterised at point and source-file levels to identify regime imbalance, unequal experiment sizes, and heterogeneous coverage. A leakage-safe pilot benchmark is then conducted on streaming-sampled subcooled and saturated subsets using Random-Forest regressors with source-file-level train/test separation. The strongest result is obtained for subcooled Nusselt number (R² = 0.88), followed by subcooled heat transfer coefficient (R² = 0.80); saturated targets are more difficult (R² = 0.46 for Nu and 0.41 for heat transfer coefficient). These results are treated as feasibility screening rather than final model ranking. The proposed database architecture and validation strategy establish a repro-ducible foundation for controlled physical interpretation and extended machine-learning assessment.
Keywords:
flow boiling
; rectangular minichannel
; experimental database
; data harmonisation
; quality control
; Nusselt number
; heat transfer coefficient
; source-file-level validation
; pilot machine learning
; Random Forest
1. Introduction
Flow boiling in mini- and minichannel systems is an effective approach to compact thermal management because sensible and latent heat transport can provide high local heat transfer rates within small flow passages. The measured response, however, depends simultaneously on working-fluid properties, channel geometry, heated-surface condition, spatial orientation, mass-flow level, pressure, heat flux, wall temperature, and the local boiling state. Experimental programmes conducted over several years therefore produce archives that are heterogeneous not only in physical coverage but also in file structure, metadata conventions, spatial resolution, and data-reduction history.
This heterogeneity becomes a methodological problem before any physical ranking or machine-learning model is attempted. Local records extracted from the same source experiment are strongly related, different experimental campaigns may contribute very different numbers of rows, and apparently large point-level sample sizes can therefore be dominated by a comparatively small number of experimental series. A credible foundation for statistical analysis and machine learning requires explicit provenance, reproducible harmonisation, regime-aware local reconstruction, auditable quality control, experiment-level diagnostics, and validation strategies that prevent records from the same source experiment from appearing on both sides of the train/test boundary.
1.1. Consolidated Flow-Boiling Databases and Machine-Learning Methodology
Machine learning has developed rapidly in boiling heat transfer research, including prediction of heat transfer coefficients, critical heat flux, pressure drop, and boiling-regime characteristics. The recent review by Chu et al. [1] shows that this growth has been accompanied by recurring limitations: incomplete or unevenly distributed datasets, inconsistent source quality, overfitting, and weak extrapolation beyond the range represented during training. These limitations are especially important for flow-boiling archives because the target quantities are commonly reconstructed from measured and derived variables rather than observed directly. Previous work on related rectangular-minichannel systems also demonstrated that uncertainty in heated-wall temperature measurements should be propagated into the calculated heat-transfer quantities rather than considered independently of the reconstruction procedure [2].
A major advance was the construction of consolidated multi-source databases. Qiu et al. [3] trained an artificial neural network on 16,953 saturated flow-boiling records collected from 50 sources and 16 fluids. Their additional tests with complete databases withheld from training showed that predictions remained comparatively strong when the working fluid was represented elsewhere in the training data, but deteriorated for a previously unseen fluid. Bard et al. [4] subsequently examined the same consolidated database using exploratory data analysis, missing-data imputation, multiple feature-selection procedures, and seven model families. Support vector regression produced the strongest overall result, while the analysis also exposed the influence of high-leverage experiments and extreme observations. Qiu et al. [5] then combined physically motivated candidate variables with Pearson correlation and mutual information to optimise an ANN input set, demonstrating that increasing the number of features does not improve performance monotonically.
Recent studies have expanded both the range of operating conditions and the model families considered. Mudawar et al. [6] used 29,226 heat transfer records spanning highly subcooled to high-quality saturated flow boiling under microgravity and different Earth-gravity orientations, obtaining an overall ANN error of 7.99% and assessing whether the predicted trends remained physically plausible. Bediako and Elbarghthi [7] compared nine machine-learning models using dimensional and dimensionless representations for high-saturation-temperature flow boiling. Noh et al. [8] applied XGBoost to 11,470 pre-dryout records from 41 sources and 23 fluids, combining dryout filtering, permutation importance, SHAP analysis, and hyperparameter optimisation. Ayegba et al. [9] recently assembled 20,891 saturated-flow-boiling measurements from 83 studies and used physics-aligned features with neural-network, support-vector, random-forest, and gradient-boosting models. Their study achieved strong pooled performance but did not establish transfer to unseen studies or fluids; the authors explicitly identified study-wise cross-validation and fluid-held-out tests as priorities for future work.
The validation design is therefore as important as the selected algorithm. Loyola-Fuentes et al. [10] proposed a six-stage framework for heat transfer regression that explicitly includes data pretreatment, feature selection, splitting philosophy, model training, hyperparameter tuning, and performance assessment. In their case study, machine learning improved interpolation accuracy but extrapolated less reliably than a semi-empirical correlation. Mehdi et al. [11] reached a similar methodological conclusion for enhanced pool boiling: models that performed well on a conventional train/test split showed distinctly larger errors on six deliberately excluded fluid-surface datasets. Wang and Kharangate [12] further demonstrated that database size alone is not a measure of information content. Their pointwise uncertainty analysis distinguished epistemic uncertainty caused by insufficient coverage from aleatoric uncertainty associated with noise and showed that adding observations near high-uncertainty regions improved prediction much more than adding data in already dense regions.
Taken together, these studies identify four requirements for credible machine-learning analysis of heterogeneous boiling data: the source and composition of the database must remain traceable; regime filtering and feature construction must be physically justified; validation must reflect the intended level of transfer rather than merely interpolate between related records; and database coverage and uncertainty must be examined alongside aggregate error metrics. The literature also shows that strong pooled performance may coexist with weak transfer to a previously unseen fluid, surface, operating range, or experimental source.
The methodological progression is therefore moving from model-centred performance comparisons toward validation-aware and uncertainty-aware analysis. Nevertheless, most published workflows begin after a consolidated dataset has already been assembled, and several of the strongest reported results still rely on random record-level splitting. Such designs quantify interpolation within the pooled database but do not fully test transfer to an unseen experiment when many neighbouring local records share the same geometry, operating sequence, measurement chain, and data-reduction assumptions.
The remaining gap concerns the complete provenance-preserving path from heterogeneous experimental files to a modelling-ready local database. This path must harmonise evolving templates and metadata, preserve source-file identity, restructure spatial thermographic data, reconstruct local pressure and thermal reference quantities, define regime-dependent heat transfer outputs, retain explicit QC decisions, and characterise both point-level scale and experiment-level coverage before machine learning is applied.
The present article addresses this gap as the methodological foundation of a wider study series. Its scope is deliberately restricted to experimental provenance, the integrated database, the Python-based harmonisation and local-reconstruction workflow, system-level quality control, global database diagnostics, and a leakage-safe pilot Random-Forest benchmark. Detailed matched analyses of surface state, orientation, and nominal mass-flow level, together with the final comparison and repeated validation of machine-learning models, are treated in a companion study. Detailed infrared line-profile anomaly assessment is reserved for a separate diagnostic paper.
Accordingly, the objectives are: (i) to document the experimental campaigns and source-file provenance; (ii) to define the unified data model and the sequence of local thermal-hydraulic reconstruction; (iii) to describe the operational regime branches and auditable QC architecture; (iv) to quantify the composition, imbalance, and coverage of the integrated database at point and source-file levels; and (v) to establish pilot machine-learning baselines using source-file-level group separation rather than random row splitting.
2. Materials and Methods
2.1. Experimental Campaigns and Database Provenance
2.1.1. Experimental Facility and Representative Rectangular-Minichannel Module
The experimental data were obtained using a closed-loop flow-boiling facility comprising the working-fluid circuit, the electrical power-supply and control systems, and synchronised thermal and visual measurement systems. The working-fluid circuit included a gear pump controlled by a variable-frequency drive, a pressure-stabilization tank, and a Coriolis mass flowmeter. The principal instrumentation also included inlet and outlet pressure transducers and temperature sensors. An infrared camera was used to observe the external surface of the heated plate, whereas a high-speed camera was positioned on the opposite side of the test section to record the flow through the glass plate.
Because the integrated database combines several experimental campaigns and test-section variants, no single drawing can represent every geometric configuration used in the experiments. Figure 1 therefore presents a representative rectangular-minichannel test section, identifies its principal structural components, and illustrates selected configurations containing different numbers of parallel minichannels. The experimental concept and infrared wall-temperature measurements build on the authors’ earlier rectangular-minichannel investigations, including uncertainty-aware heat transfer calculations [2] and comparative analyses based on Trefftz functions and Simcenter STAR-CCM+ [13].
As shown in Figure 1, the test section had a modular structure that allowed the number of parallel minichannels to be varied while retaining the same general arrangement of the heated plate, glass plate, base, cover, and inlet manifold. The configurations presented in Figure 1c illustrate the geometric diversity represented in the integrated database and should therefore be interpreted as selected module variants rather than as a single test-section geometry used throughout all experimental campaigns.
A recent direct comparison of liquid crystal thermography and infrared thermography in flow-boiling minichannels showed convergent heated-wall temperature distributions and average relative differences below 15% in the resulting local heat-transfer coefficients. This finding provides direct methodological support for the use of non-contact thermographic wall-temperature measurements as the thermal input to the present database workflow [14]. The relationship between the thermographic measurements and the principal hydraulic, thermal, and electrical measurements is illustrated schematically in Figure 2.
Figure 2 shows that the infrared wall-temperature measurement formed only one component of the complete experimental measurement chain. The central longitudinal temperature profile extracted from the externally observed heated surface was linked to the corresponding source-file metadata, electrical power input, mass-flow rate, inlet and outlet fluid temperatures, pressure measurements, working-fluid identity, surface condition, test-section configuration, and spatial orientation. The diagram is intentionally simplified and presents the general measurement and data-flow architecture rather than the complete arrangement of every facility component or a single geometric configuration common to all 449 source files.
2.1.2. Scope and Heterogeneity of the Experimental Archive
The integrated archive contains 449 processed experimental source files. The campaign covers six dielectric working fluids: FC-72, FC-770, HFE-649, HFE-7000, HFE-7100, and HFE-7200, together with multiple surface identifiers, different channel-count configurations, and a broad range of nominal module orientations. Table 1 summarises the high-level experimental and database scope that defines the input domain of the foundation study.
Table 1 demonstrates that the database is not a single-condition benchmark but a heterogeneous experimental archive. This breadth is useful for later generalisation studies, but it also means that pooled averages cannot be interpreted as direct causal effects of a fluid, surface, or orientation. In the present article, the diversity is therefore treated primarily as a data-architecture and modelling problem, whereas controlled physical comparisons are addressed in the companion study.
To make the heterogeneity visually explicit, Figure 3 illustrates the experimental archive from source files to the principal experimental descriptors and downstream data products. The figure is intended to show how a moderate number of provenance groups expands into a very large point-level database after spatial restructuring and local reconstruction.
Figure 3 emphasises two methodological facts. First, all local records remain traceable to their source file, which becomes the natural grouping unit for validation. Second, the point-level scale of the database is generated by repeated local observations within experiments rather than by millions of independent experiments. This distinction motivates both the source-file-level statistical diagnostics presented later and the leakage-safe train/test separation used in the pilot ML benchmark.
2.2. Unified Data Model and Python-Based Harmonisation Workflow
2.2.1. Source Files, Harmonisation, and Output Architecture
The source experiments were processed through a modular Python workflow designed for large batch runs and repeatable reprocessing. The workflow reads template-based experimental files, extracts geometry and operating metadata, restructures the central longitudinal infrared temperature line into local records, merges the thermal profile with frame- or state-level operating data, reconstructs local thermodynamic quantities, applies regime and quality-control logic, and writes columnar outputs suitable for subsequent analysis.
The complete processing sequence is summarised in Figure 4. The purpose of the figure is to separate the data-engineering stages from the later physical and machine-learning analyses and to make the lineage of each derived variable explicit.
As Figure 4 shows, the database is not produced by a single transformation but by a sequence of traceable operations. The separation of raw inputs, intermediate thermodynamic reconstruction, derived heat transfer quantities, QC flags, and final analytical subsets allows the pipeline to be rerun when a definition or threshold is revised. The use of a columnar Parquet output also permits selective reading and batch analysis without loading the complete dataset into memory.
2.2.2. Unified Variable Groups
For reproducibility, the merged dataset is organised into clearly defined variable groups rather than treated as an undifferentiated table. Table 2 summarises these groups, provides representative variables, and specifies their analytical roles. This structure also supports subsequent feature auditing by clearly distinguishing measured inputs, reconstructed thermodynamic quantities, derived heat-transfer outputs, provenance identifiers, and quality-control variables.
Table 2 makes clear that the local heat-transfer coefficient α and Nusselt number Nu are derived quantities rather than direct sensor measurements. This distinction is important in the pilot machine-learning analysis because some candidate input variables, particularly heat-flux descriptors, are mathematically related to the target definitions and should therefore be treated as target-proximal features rather than as independent physical predictors. The database and code identifiers used in Figure 5, including Twall, Tf,used, qw, and qnet, are mapped to the corresponding scientific symbols listed in the Nomenclature.
2.2.3. Local Thermal Reconstruction and Regime-Aware Reference Temperature
The local heat transfer calculation requires a reference fluid temperature that changes with the local thermal state. The implemented workflow therefore separates the subcooled and saturated branches rather than imposing one denominator over the complete database. Figure 5 summarises the two branches and identifies the variables entering the local heat transfer coefficient and Nusselt number calculations. Because α and Nu depend on reconstructed temperature differences, uncertainty in the heated-wall and fluid-temperature measurements propagates directly into these derived quantities and becomes especially influential when the effective denominator is small. In a related rectangular-minichannel study, temperature-measurement uncertainty was evaluated using both Monte Carlo simulation and the uncertainty-propagation method and was incorporated into the heat transfer coefficient calculations [2].
Figure 5 shows why the reference-temperature definition must be explicit. The implemented Python module (alpha_nu.py) first evaluates the wall-to-saturation temperature difference, ΔTws = Twall − Tsat. Values ≤ −2 K are assigned to the operational subcooled branch, values ≥ 2 K to the operational saturated branch, and values within the ±2 K deadband to an ambiguous branch. For records classified as ambiguous, Tf,used is set to NaN (“Not a Number”), indicating that no valid reference temperature is assigned under the adopted operational criterion. Consequently, the local heat transfer coefficient α and Nusselt number Nu are not calculated for these records. Accordingly, the selected reference temperature is Tf,lin for the subcooled boiling region and Tsat for the saturated boiling region. The temperature correction for conduction through the heated plate is ΔTcond = qw δp/kp, with kp = 8.3 W/(m K). The effective temperature-difference denominator, denoted in the code as “denom”, is defined as Twall − Tf,used − ΔTcond, after which the local heat transfer coefficient α is calculated from Newton’s law of cooling (using qnet) and the Nusselt number is then calculated from its standard definition (Nu=αDh/kf). These categories define operational data-reduction branches and should not be interpreted as a complete classification of the bulk thermodynamic state or flow pattern.
2.2.4. Operational Regime Labelling and Analytical Use
An operational regime label is stored for each local record and is subsequently used to construct regime-specific analytical and machine-learning subsets. This separation prevents records evaluated using different reference-fluid temperatures from being combined within the same heat-transfer analysis. Records assigned to the ambiguous branch remain in the integrated database for traceability but are excluded from the calculation of α and Nu and from regime-specific modelling. The regime label therefore functions as a data-reduction and filtering variable rather than as a complete classification of the bulk thermodynamic state or the observed two-phase flow pattern.
2.3. Quality-Control Architecture
2.3.1. QC Logic and Record-Level Flags
Quality control is implemented as a set of explicit flags rather than as an irreversible deletion step. Records may therefore remain present in the full merged database while being excluded from a specific analytical subset. Figure 6 presents the intended decision structure from regime assignment through QC checks to the final record-retention status.
The ±2 K deadband and the 0.5 K denominator limit were adopted as operational thresholds within the data-reduction and quality-control workflow. The former separates the subcooled and saturated branches from the ambiguous region around the saturation condition, whereas the latter prevents the calculation of α and Nu when the effective temperature-difference denominator approaches zero. These thresholds should be interpreted as methodological settings of the present workflow rather than as universal physical limits. Their selection was informed by the authors’ long-term experimental experience, repeated analyses of flow-boiling data, and comparisons of heat-transfer calculations performed using different methods.
Figure 6 emphasises that quality control is not equivalent to generic outlier removal. Some records are excluded by methodological design, for example, when the operational regime is ambiguous and no valid thermal reference temperature can be assigned, whereas other exclusions result from missing, non-finite, or physically invalid reconstructed quantities. This distinction is important because exclusion due to methodological ambiguity does not necessarily indicate an experimental or measurement failure.
The implemented QC rules are summarised in Table 3 and illustrated in Figure 6. The Python module (qc.py) constructs a pipe-delimited QCflags field and assigns QCkeep = True only when no quality-control flag is present. The default QC gate excludes records with an ambiguous regime assignment; missing or non-finite critical variables; non-positive local absolute pressure, fluid thermal conductivity, net heat flux, heat-transfer coefficient α, or Nusselt number Nu; an absolute effective temperature-difference denominator below 0.5 K; and non-positive Reynolds or Prandtl numbers when these quantities are available.
Table 3 distinguishes the reasons for record exclusion from the final retention status. This distinction is important for subsequent extensions of the processing pipeline because detailed thermographic anomaly detection may refine the quality assessment without altering the underlying data provenance or raw measurements. The present foundation article therefore documents the system-level QC framework, whereas the dedicated diagnostic study examines the detailed behaviour of the infrared line profiles.
2.4. Leakage-Safe Pilot Machine-Learning Methodology
2.4.1. Pilot Objective and Sampling Strategy
The machine-learning component of the present study is intentionally limited to a pilot screening task. Its purpose is to test whether the harmonised database contains learnable signal under a leakage-safe validation design, not to establish a final ranking of algorithms. Because the complete merged dataset is too large for direct in-memory tree training, the pilot data were constructed by streaming the Parquet outputs and sampling within source-file groups.
The validation principle is illustrated in Figure 7. All records originating from a source file are assigned to one side of the train/test boundary, so that closely related local points from the same experiment cannot appear in both sets.
Figure 7 shows that the effective unit of validation is the experimental source file, even though the regressor is trained on point-level rows. This design is more conservative than random row splitting and better reflects the intended use of the model on data from experiments not seen during training.
The complete database comprised 449 source files. The pilot datasets were constructed by group-balanced streaming sampling directly from the Parquet outputs. Fifty valid records were sampled from each source file containing eligible records for the respective operational branch. This procedure yielded 22,350 subcooled records from 447 source files and 22,050 saturated records from 441 source files; the remaining files did not contain valid records for the corresponding branch after regime and QC filtering. All sampled records originating from a given source file were retained within a single data partition. Source-file groups, rather than individual point-level rows, were assigned to the training or test subset, thereby preventing closely related observations from the same experiment from occurring on both sides of the validation boundary.
The source-file groups were divided using a single GroupShuffleSplit with a test fraction of 0.20 and random_state = 42. For the subcooled datasets, 357 source files comprising 17,850 records were assigned to the training subset and 90 source files comprising 4,500 records to the test subset. The full numerical predictor set comprised Re, Pr, qnet, qw, Tf,used, Tf,lin, Tsat, Dh, Lobs, and θ. Source-file identity was used exclusively as the grouping variable and was not supplied to the regressor. For the saturated datasets, the same group-based split configuration was applied to 441 source files and 22,050 records, yielding 352 training groups with 17,600 records and 89 test groups with 4,450 records.
The pilot Random-Forest implementation used 10 trees, a maximum depth of 8, a minimum of 10 samples per leaf, square-root feature sampling at each split, bootstrap resampling with max_samples = 0.3, and random_state = 42. These deliberately conservative settings were adopted for the feasibility-screening stage and to permit memory-safe processing of the streamed samples.
Two reduced predictor variants were additionally examined to assess the dependence of the pilot results on heat-flux descriptors that are mathematically close to the target definitions. The variant denoted as “without qw” excluded the wall heat flux, which enters the conductive temperature correction ΔTcond, whereas the variant denoted as “without qnet” excluded the net heat flux appearing directly in the numerator of the local heat transfer coefficient. Because Nu is calculated from α, both heat-flux descriptors are also target-proximal for the Nusselt-number task. In Table 5, “full” denotes the complete ten-predictor set, whereas “without qw” and “without qnet” denote the corresponding nine-predictor variants. The preferred pilot baseline for each regime–target combination was selected from the screened variants on the basis of test-set performance and should not be interpreted as a definitive feature-ranking result.
3. Results
3.1. Database Composition and QC Retention
The experiment-level summary provides a consistent view of regime composition and QC retention without reopening the full merged Parquet. Figure 8 presents the mean within-file shares of subcooled, saturated, and ambiguous records for each working fluid, with each source file contributing one experiment-level observation. Figure 9 then compares the QC-retained share across source files for the six fluids.
Figure 8 reveals a pronounced fluid dependence in regime composition. FC-770, HFE-7100, and HFE-7200 are dominated by subcooled records at the experiment level, whereas HFE-7000 is represented by only three source files and is overwhelmingly saturated. FC-72 and HFE-649 contain larger ambiguous and saturated fractions than the other broadly represented fluids. This unequal regime coverage is a structural property of the archive and must be considered in pooled statistics and regime-resolved modelling.
The distribution of the QC-retained share across source files, grouped by working fluid, is illustrated in Figure 9.
Figure 9.
Distribution of the QC-retained share across source files, grouped by working fluid.
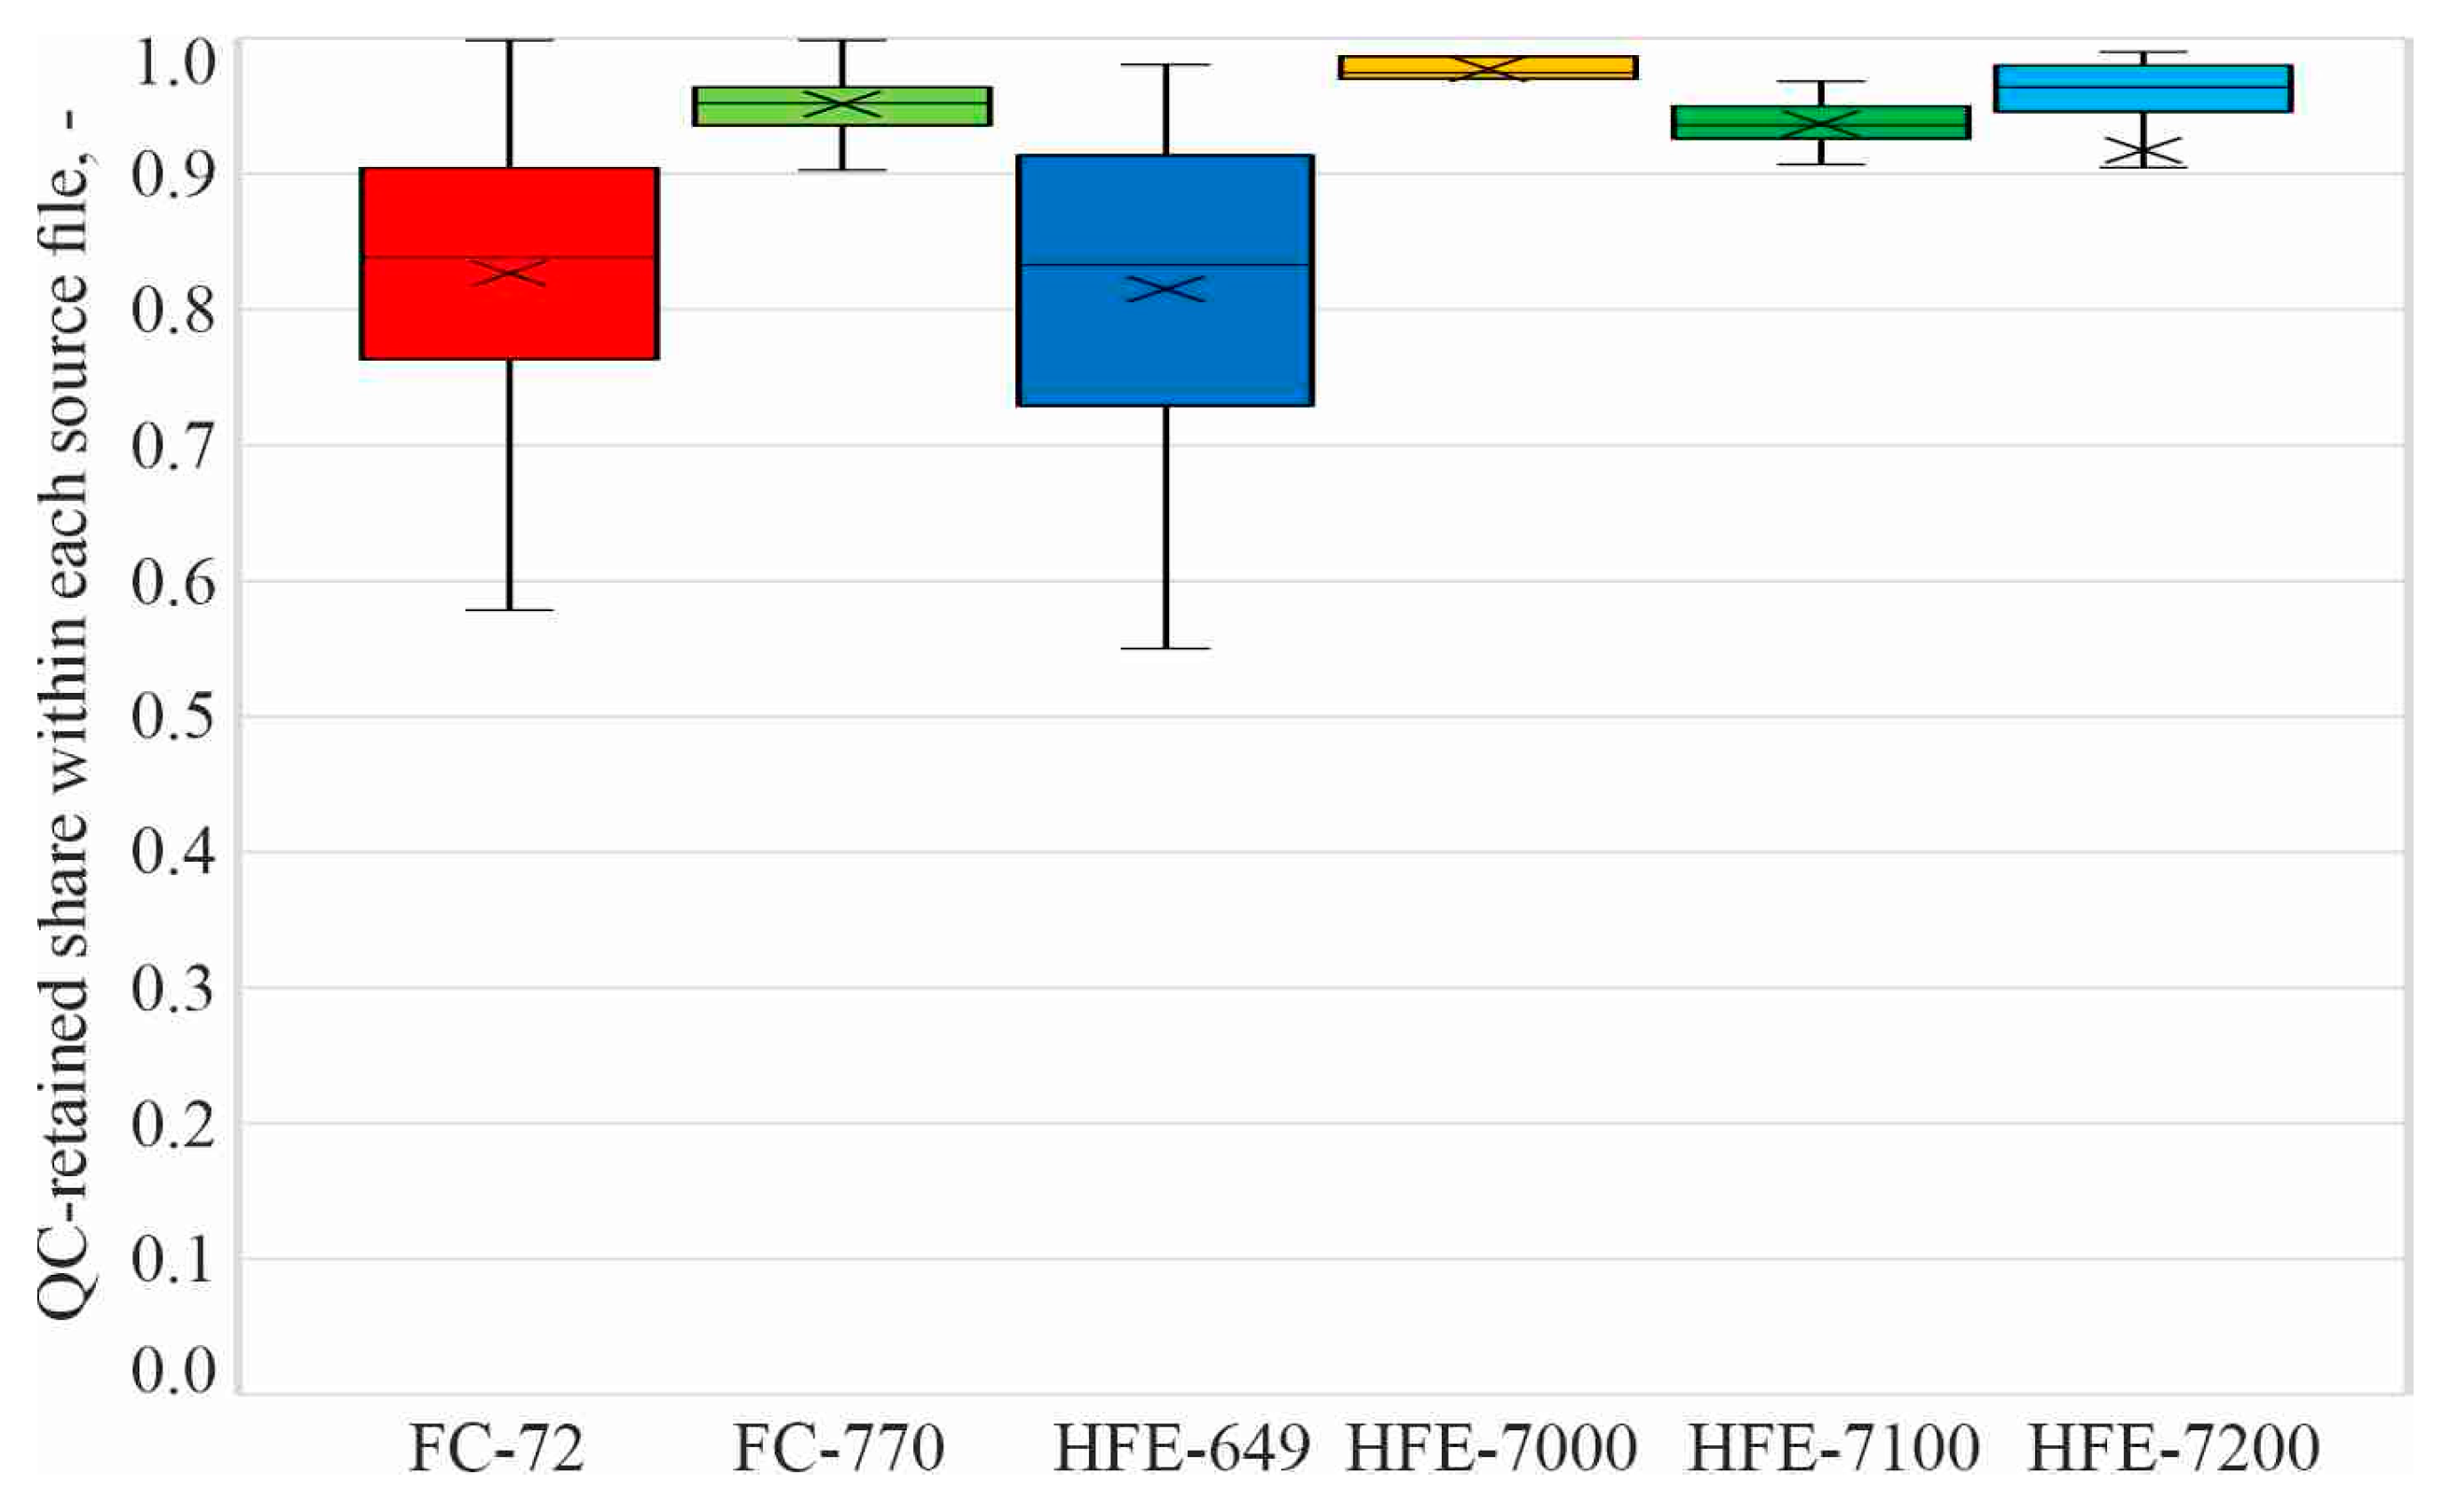
Figure 9 shows that QC retention varies across experiments and fluids. The median retained share is highest for FC-770, HFE-7000, HFE-7100, and HFE-7200, while FC-72 and HFE-649 show broader distributions and lower central retention. One HFE-7200 source file has a zero retained share and therefore requires source-file-level review, but it is not silently removed from the archive. The experiment-level mean QCkeep share over all 449 files is approximately 0.860.
3.2. Global Database Characteristics
3.2.1. Distribution of Experiment-Level Heat Transfer Outputs
The experiment-level summary also permits a robust view of the joint distribution of the two main heat transfer outputs without allowing very large source files to dominate the display. Figure 10 plots the median α against the median Nu for each source file on logarithmic axes and identifies the dominant regime of each experiment from its largest within-file regime share.
Figure 10 shows a strong positive association between experiment-level median α and median Nu, as expected from their related definitions, while also revealing a broad spread across source files. Among the 448 source files with positive paired median values suitable for logarithmic plotting, 394 are subcooled-dominant, 48 are saturated-dominant, and 6 are ambiguous-dominant. One source file has zero median values of both α and Nu and is therefore omitted from the logarithmic display but retained in the database and in the descriptive summary.
Table 4 provides the numerical companion to Figure 10 using the same experiment-level summary. Each source file contributes one median α and one median Nu value, so the statistics describe variability between experiments rather than the much larger number of nested local points.
Table 4 confirms that the experiment-level distributions are right-skewed. For α, the mean exceeds the median by approximately 50%, and the 95th percentile is nearly seven times the median. Nu shows a similar but less extreme pattern. These results support the use of medians and percentile summaries for database characterisation and reinforce the decision not to interpret global arithmetic means as direct surface or fluid effects.
3.2.2. Point-Level Scale Versus Source-File-Level Evidence
The very large point-level database can create a false impression of equally large statistical independence. Figure 11 therefore contrasts the 449 experimental source-file groups with the 64,385,791 local point-level records in the final integrated database. The logarithmic scale is used because the two levels differ by more than five orders of magnitude.
Figure 11 demonstrates the hierarchical scale of the archive: tens of millions of local rows are nested within only 449 provenance groups. The point-level sample size therefore cannot be interpreted as an equivalent number of independent experiments. This scale mismatch is the principal reason for using source file as the grouping variable in validation rather than randomly splitting individual rows.
3.2.3. Coverage Across Working Fluids and Orientations
The integrated archive also has an uneven factorial structure. Figure 12 maps the number of source files for every observed combination of working fluid and nominal orientation angle. The exact nominal orientation angles were retained rather than collapsed into broad classes so that sparse inclined configurations remain visible.
Figure 12 shows that the archive is concentrated at a limited set of principal orientations, particularly 0, 90, 180, and 270 degrees, while the intermediate inclined angles are represented by only a few source files. Coverage also differs strongly between fluids. The map is therefore a coverage diagnostic, not a performance comparison, and it explains why the companion physical study uses matched subsets rather than pooled orientation averages.
3.3. Leakage-Safe Pilot Random-Forest Results
Four regime-target combinations were screened: subcooled Nu, subcooled α, saturated Nu, and saturated α. The pilot used Random-Forest regressors [15] and compared reduced feature variants in order to limit the use of target-proximal heat-flux descriptors. Table 5 reports the selected feature variant for each pilot task and the corresponding test-set metrics. In this table 5 “full” denotes the complete ten-predictor set, whereas “without qw” and “without qnet” denote nine-predictor variants obtained by excluding the indicated heat flux descriptor.

Table 5.
Leakage-safe pilot Random-Forest configurations and test-set metrics.
| Regime | Target | Pilot feature variant | Rows | Source-file groups | Features | R² test | RMSE test | MAE test |
|---|---|---|---|---|---|---|---|---|
| Subcooled | Nu | without qw | 22,350 | 447 | 9 | 0.89 | 2.85 | 1.85 |
| Subcooled | α | full | 22,350 | 447 | 10 | 0.80 | 112.25 | 66.15 |
| Saturated | Nu | without qw | 22,050 | 441 | 9 | 0.46 | 170.76 | 123.80 |
| Saturated | α | without qnet | 22,050 | 441 | 9 | 0.41 | 6819.42 | 5023.81 |
Table 5 shows a clear regime effect in predictive difficulty. The subcooled Nu target gives the strongest pilot result, followed by subcooled α. Both saturated targets are materially more difficult, indicating that the available tabular descriptors capture only part of the variability associated with the saturated regime.
The same result is summarised visually in Figure 13 so that the relative difficulty of the four tasks is immediately apparent. The figure is deliberately restricted to the pilot Random-Forest benchmark and should not be interpreted as the final model ranking, which belongs to the companion modelling study.
Figure 13 reinforces the conclusion from Table 5: learnability is strongly regime-dependent. The subcooled tasks provide a clear proof of concept for the integrated database, whereas the saturated results remain only moderate. This difference is scientifically useful because it identifies the regime in which additional descriptors, more careful physical decomposition, and more stringent validation are most needed.
4. Discussion
4.1. Interpretation of the Pilot Benchmark
The pilot results should not be overinterpreted. Heat transfer coefficients and Nusselt numbers are derived quantities, and some candidate features are mathematically close to their definitions. In the present study, the term “leakage-safe” refers specifically to the prevention of source-file leakage across the train/test boundary; it does not imply that formula-derived target proximity has been eliminated. For this reason, the feature variants and their exact contents must be documented transparently, and the pilot benchmark should be interpreted as an assessment of surrogate learnability within the adopted data-reduction framework.
The companion modelling study extends this foundation with clean-filtered source-file-level validation, comparison of HGB and a Level-0 MLP, and repeated group-split stability analysis. Those results are intentionally not reproduced here so that the present article remains focused on database construction, data integrity, and first-stage feasibility.
4.2. Scope, Limitations, and Relation to Subsequent Studies
The integrated database is large but not factorially balanced. Fluids, surfaces, orientations, and module configurations have unequal coverage, and the number of point-level records per source file is not uniform. Consequently, global descriptive statistics are used to characterise the database rather than to infer causal effects. The thermographic information propagated through the database is based on the central longitudinal line of the externally observed heated plate rather than on the full two-dimensional detector field. This representation is appropriate for the streamwise local reconstruction used in the database, but detailed assessment of line-profile artefacts, abrupt local anomalies, and physics-guided thermographic QC is outside the scope of the present article.
The pilot machine-learning benchmark is intended as an initial assessment of the predictive information contained in the harmonised database under source-file-level separation. Although the results confirm that the dataset supports meaningful prediction, they do not establish transferability across working fluids, the general validity of a universal correlation, or a definitive ranking of modelling approaches. These issues require repeated group-based validation, leave-one-fluid-out and leave-one-source-out testing, and systematic comparison with classical and physics-informed models.
5. Conclusions
A unified experimental database was assembled from 449 rectangular-minichannel flow boiling source files covering six working fluids and multiple geometric, surface, and orientation configurations.
The Python-based workflow provides a traceable sequence from template-based experimental data and central-line infrared wall-temperature measurements to local thermodynamic reconstruction, regime-aware α and Nu calculation, QC flags, Parquet outputs, experiment-level summaries, and ML subsets.
The database must be analysed at both point and source-file levels because millions of local records are nested within a much smaller number of experimental provenance groups and the coverage is strongly imbalanced.
System-level QC is treated as explicit, auditable logic rather than irreversible outlier deletion; detailed thermographic anomaly assessment is reserved for a separate diagnostic study.
The leakage-safe pilot Random-Forest benchmark demonstrates substantial predictive signal for subcooled Nu and useful predictive signal for subcooled α, whereas saturated targets remain materially more difficult.
The present article therefore establishes the database and modelling foundation required for subsequent controlled physical interpretation, extended source-file-level model validation, and physics-guided thermal diagnostics.
Author Contributions
Conceptualization, M.P.; methodology, M.P.; software, M.P.; validation, M.P.; formal analysis, M.P.; investigation, M.P.; resources, M.P.; data curation, M.P.; writing—original draft preparation, M.P. and A.P.; writing—review and editing, M.P. and A.P.; visualization, A.P.; supervision, M.P.; project administration, M.P.; funding acquisition, M.P. All authors have read and agreed to the published version of the manuscript.
Funding
This research was funded by the National Science Centre, Poland, grant no. UMO-2025/57/B/ST8/00907. For the purpose of Open Access, the authors have applied a CC BY public copyright licence to the Author Accepted Manuscript (AAM) version arising from this submission.
Data Availability Statement
A representative processed data sample and basic documentation will be made publicly available in the GitHub repository “boiling-heat-transfer-minichannel” at https://github.com/MagdalenaPiasecka/boiling-heat-transfer-minichannel upon publication. The complete experimental datasets, source-file-level metadata, analysis code, and integrated Parquet database are archived in the PRACE-LAB data-storage infrastructure at Kielce University of Technology and are available from the corresponding author upon reasonable request.
Use of Generative Artificial Intelligence
During the preparation of this manuscript, the authors used ChatGPT (OpenAI) for language editing, structural organisation, and drafting assistance. The authors reviewed and edited the output and take full responsibility for the content of this publication.
Conflicts of Interest
The authors declare no conflicts of interest.
Nomenclature
| Symbols | |
| Hydraulic diameter, m | Dh |
| Mass flux, kg m⁻² s⁻¹ | G |
| Thermal conductivity of the working fluid, W m⁻¹ K⁻¹ | kf |
| Thermal conductivity of the heated plate, W m⁻¹ K⁻¹ | kp |
| Heated length, m | L |
| Observation length of the thermographically analysed section, m | Lobs |
| Not a Number; undefined numerical value, – | NaN |
| Nusselt number, – | Nu |
| Pressure, Pa | p |
| Prandtl number, – | Pr |
| Wall heat flux, W m⁻² | qw |
| Net heat flux transferred to the fluid, W m⁻² | qnet |
| Coefficient of determination, – | R2 |
| Reynolds number, – | Re |
| Linearly interpolated local bulk-fluid temperature, K | Tf,lin |
| Reference fluid temperature selected by the operational branch, K | Tf,used |
| Saturation temperature, K | Tsat |
| Local heated-wall temperature, K | Twall |
| Streamwise coordinate, m | x |
| Greek letters | |
| Local heat transfer coefficient, W m⁻² K⁻¹ | α |
| Heated-plate thickness, m | δp |
| Temperature correction for conduction through the heated plate, K | ΔTcond |
| Wall-to-saturation temperature difference, K | ΔTws |
| Nominal module orientation angle, ° | θ |
| Subscripts | |
| Conduction correction | cond |
| Fluid | f |
| Channel inlet | in |
| Linearly interpolated value | lin |
| Net value after heat-loss correction | net |
| Observation | obs |
| Channel outlet | out |
| Heated plate | p |
| Saturation condition | sat |
| Test subset | test |
| Reference value selected by the operational branch | used |
| Heated wall (heated plate) | wall |
| Ambiguous operational regime assignment | ambiguous |
| Associated reconstructed quantity does not satisfy the adopted QC criterion | bad |
| Critical variable is missing, NaN, or non-finite | critical |
| Effective temperature-difference denominator below the adopted 0.5 K limit | small |
| Abbreviations | |
| Artificial neural network | ANN |
| Histogram-based gradient boosting | HGB |
| Infrared | IR |
| Mean absolute error | MAE |
| Machine learning | ML |
| Multilayer perceptron | MLP |
| Quality control | QC |
| Random Forest | RF |
| Root-mean-square error | RMSE |
| SHapley Additive exPlanations | SHAP |
| Database and code variables | |
| Pipe-delimited record-level field containing one or more quality-control flags | QCflags |
| Boolean record-retention indicator equal to True when no QCflags are present and False otherwise | QCkeep |
References
- Chu, H.; Ji, T.; Yu, X.; Liu, Z.; Rui, Z.; Xu, N. Advances in the application of machine learning to boiling heat transfer: A review. International Journal of Heat and Fluid Flow 2024, 108, 109477. [CrossRef]
- Piasecka, M.; Maciejewska, B.; Piasecki, A. Heat Transfer Calculations during Flow in Mini-Channels with Estimation of Temperature Uncertainty Measurements. Energies 2023, 16, 1222. [CrossRef]
- Qiu, Y.; Garg, D.; Zhou, L.; Kharangate, C.R.; Kim, S.-M.; Mudawar, I. An artificial neural network model to predict mini/micro-channels saturated flow boiling heat transfer coefficient based on universal consolidated data. International Journal of Heat and Mass Transfer 2020, 149, 119211. [CrossRef]
- Bard, A.; Qiu, Y.; Kharangate, C.R.; French, R. Consolidated modeling and prediction of heat transfer coefficients for saturated flow boiling in mini/micro-channels using machine learning methods. Applied Thermal Engineering 2022, 210, 118305. [CrossRef]
- Qiu, Y.; Vo, T.; Garg, D.; Lee, H.; Kharangate, C.R. A systematic approach to optimization of ANN model parameters to predict flow boiling heat transfer coefficient in mini/micro-channel heatsinks. International Journal of Heat and Mass Transfer 2023, 202, 123728. [CrossRef]
- Mudawar, I.; Darges, S.J.; Devahdhanush, V.S. Prediction technique for flow boiling heat transfer and critical heat flux in both microgravity and Earth gravity via artificial neural networks (ANNs). International Journal of Heat and Mass Transfer 2024, 220, 124998. [CrossRef]
- Bediako, E.G.; Elbarghthi, A.F.A. Machine learning-based approach for predicting flow boiling heat transfer coefficient at high saturation temperatures. International Communications in Heat and Mass Transfer 2025, 161, 108538. [CrossRef]
- Noh, H.; Kim, J.; Lee, S.; Kim, S.-M.; Mudawar, I. XGBoost algorithm for predicting heat transfer coefficient of saturated flow boiling in mini/micro-channels. International Journal of Heat and Mass Transfer 2026, 256, 128095. [CrossRef]
- Ayegba, P.O.; Basarkar, S.S.; Abdul Quddus, R.M.; Patil, V.N. Predicting heat transfer coefficient for saturated flow-boiling in micro/mini tubes using machine learning and annular-flow surrogates. International Journal of Thermofluids 2026, 34, 101630. [CrossRef]
- Loyola-Fuentes, J.; Nazemzadeh, N.; Diaz-Bejarano, E.; Mancin, S.; Coletti, F. A framework for data regression of heat transfer data using machine learning. Applied Thermal Engineering 2024, 248, 123043. [CrossRef]
- Mehdi, S.; Borumand, M.; Hwang, G. Accurate and robust predictions of pool boiling heat transfer with micro-structured surfaces using probabilistic machine learning models. International Journal of Heat and Mass Transfer 2024, 226, 125487. [CrossRef]
- Wang, H.; Kharangate, C.R. Uncertainty quantification of a flow boiling dataset for mini/micro-channels. Applied Thermal Engineering 2026, 287, 129498. [CrossRef]
- Pawińska, A.; Piasecki, A.; Dadas, N.; Hożejowska, S.; Piasecka, M. Homotopy Perturbation Method with Trefftz Functions and Simcenter STAR-CCM+ Used for the Analysis of Flow Boiling Heat Transfer. Acta Mechanica et Automatica 2024, 18, 233–243. [CrossRef]
- Piasecka, M.; Piasecki, A.; Maciejewska, B. Liquid Crystal Thermography and Infrared Thermography Application in Heat Transfer Research on Flow Boiling in Minichannels. Energies 2025, 18, 940. [CrossRef]
- Breiman, L. Random Forests. Machine Learning 2001, 45, 5–32. [CrossRef]
Figure 1.
Representative rectangular-minichannel test sections: (a) longitudinal section showing the main components: 1—minichannel, 2—heated plate, 3—glass plate, 4—inlet manifold, 5—base, and 6—cover; (b) view from the cover side for the configuration with five minichannels; (c) selected test-section configurations containing 5, 7, 9, 11, 13, 15, 17, and 19 parallel minichannels.
Figure 1.
Representative rectangular-minichannel test sections: (a) longitudinal section showing the main components: 1—minichannel, 2—heated plate, 3—glass plate, 4—inlet manifold, 5—base, and 6—cover; (b) view from the cover side for the configuration with five minichannels; (c) selected test-section configurations containing 5, 7, 9, 11, 13, 15, 17, and 19 parallel minichannels.
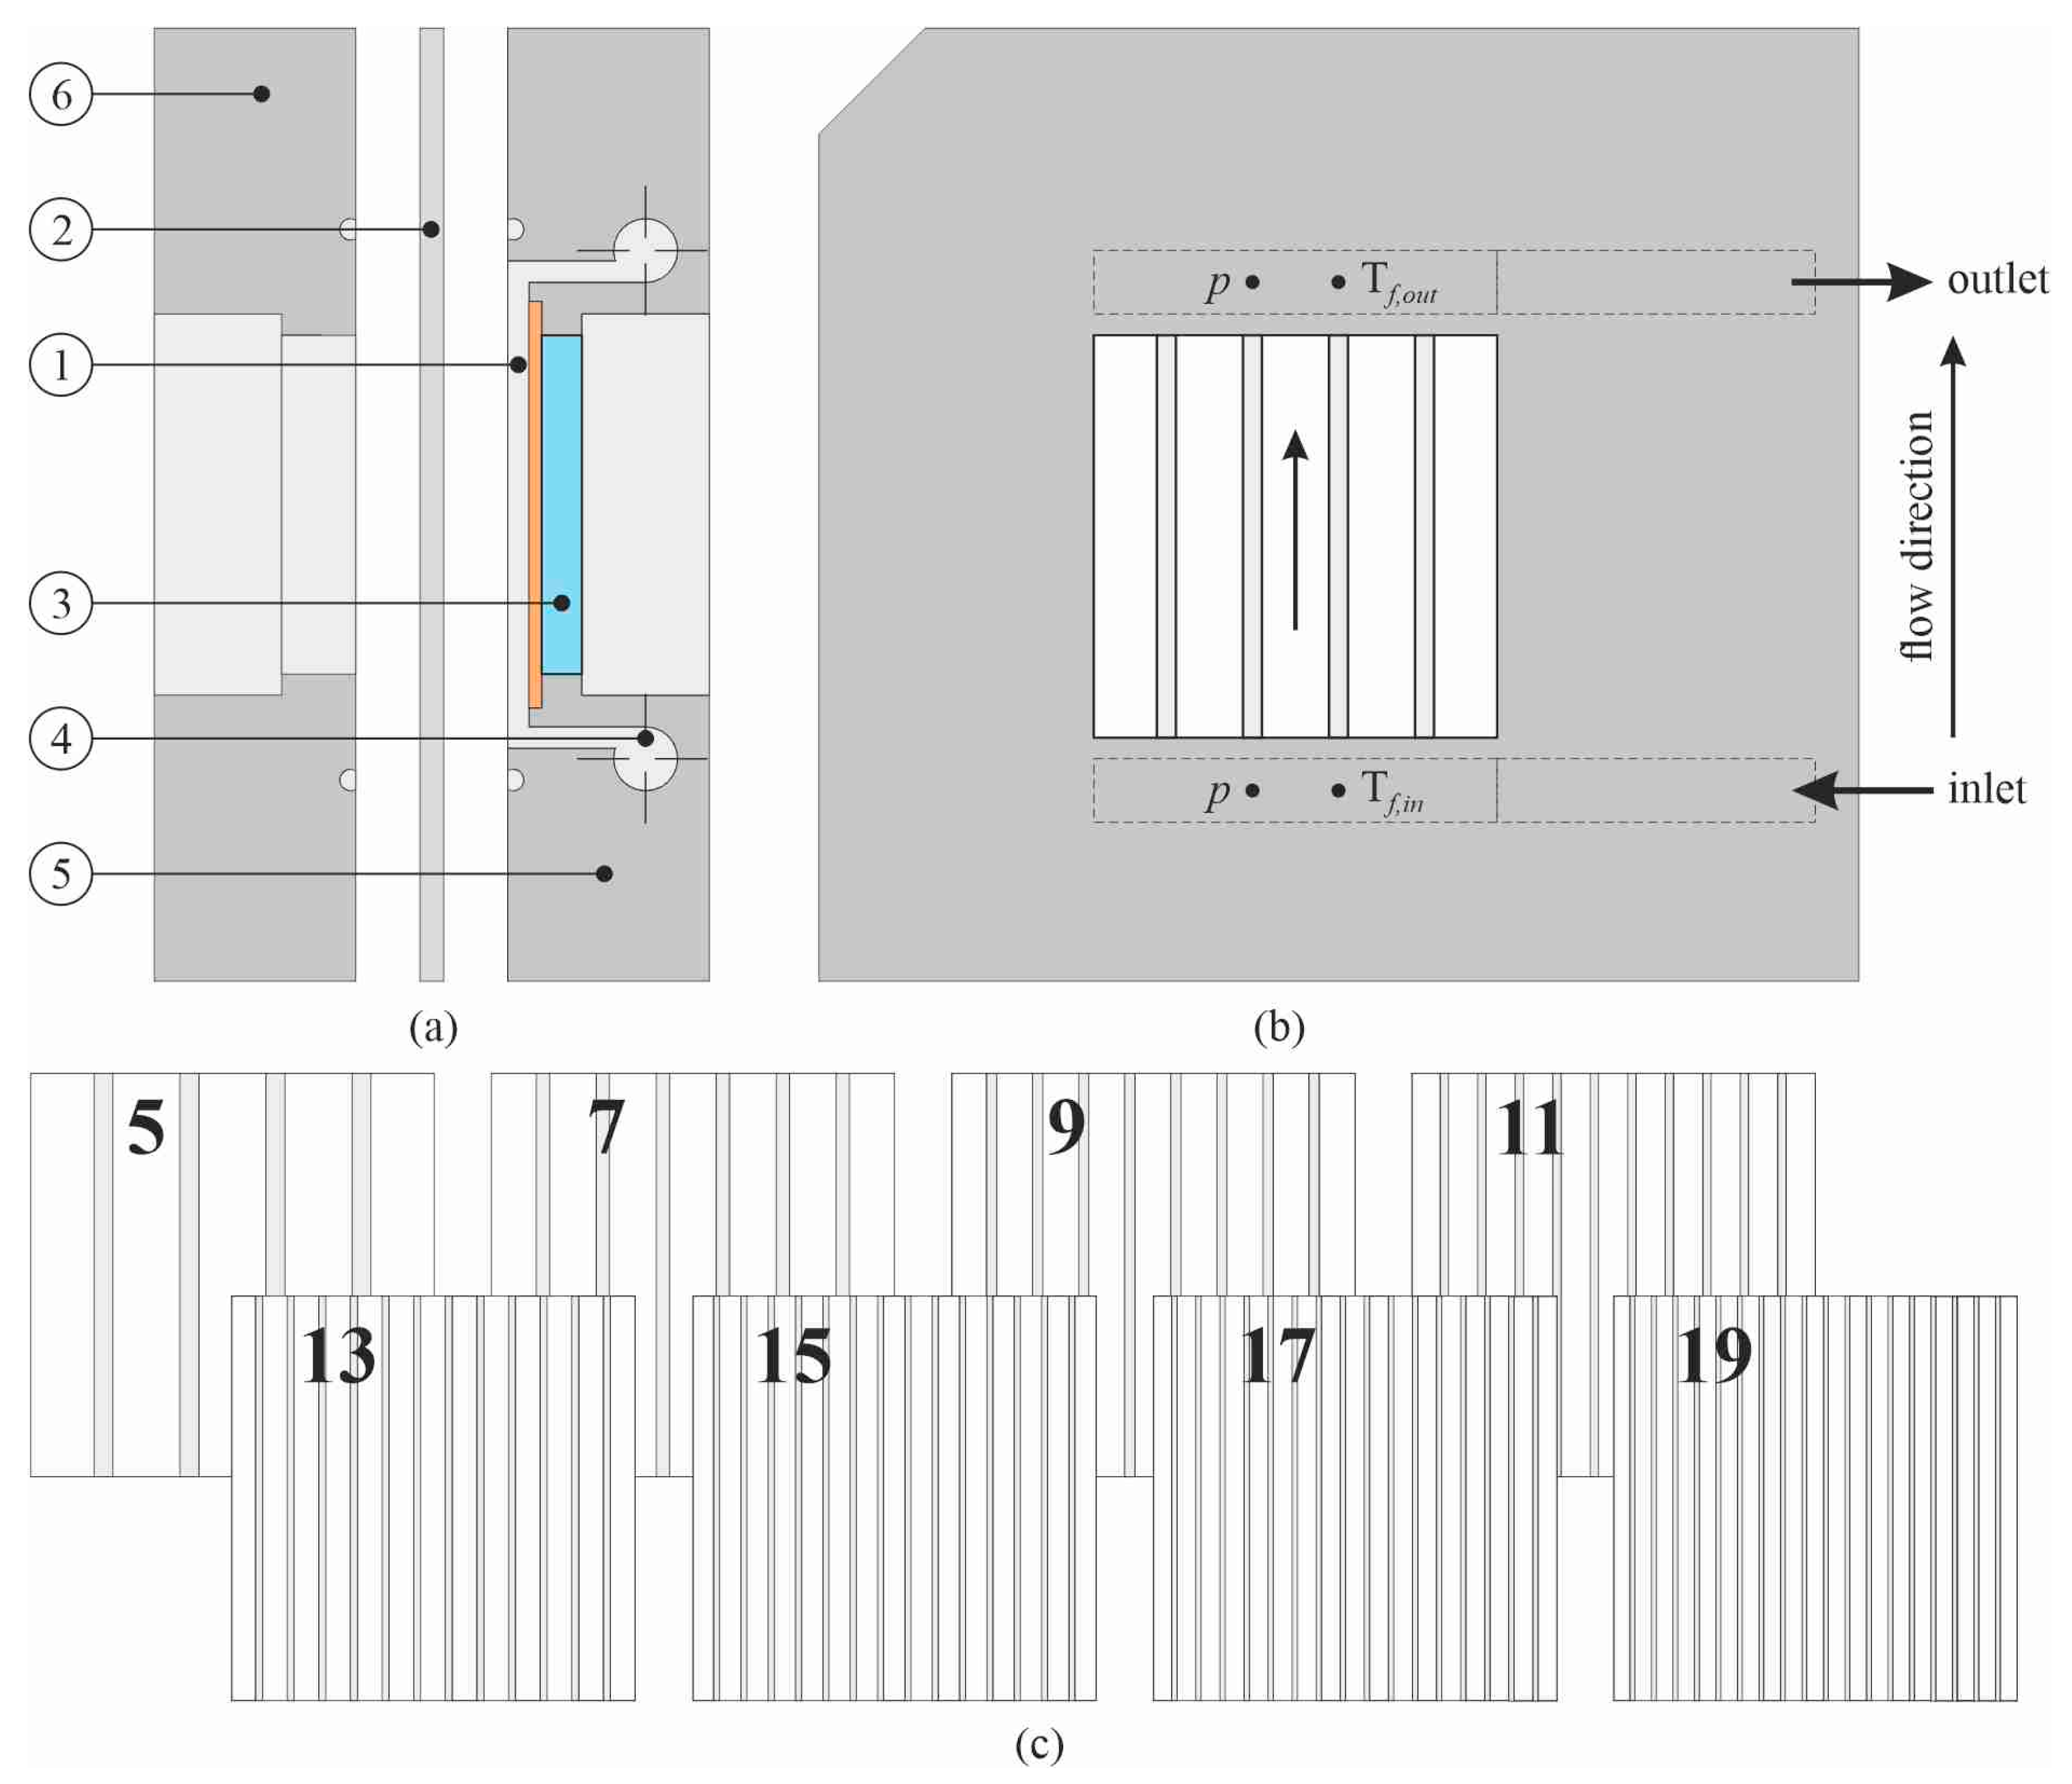
Figure 2.
Simplified scheme of the closed-loop experimental facility and the associated thermal, hydraulic, electrical, and visual measurement chain.
Figure 2.
Simplified scheme of the closed-loop experimental facility and the associated thermal, hydraulic, electrical, and visual measurement chain.

Figure 3.
Data provenance and database composition overview from 449 source files to local reconstructed records and analysis subsets.
Figure 3.
Data provenance and database composition overview from 449 source files to local reconstructed records and analysis subsets.

Figure 4.
Unified Python-based data-processing workflow from raw experimental files to the integrated Parquet database, QC outputs, experiment-level summaries, and pilot ML subsets.
Figure 4.
Unified Python-based data-processing workflow from raw experimental files to the integrated Parquet database, QC outputs, experiment-level summaries, and pilot ML subsets.

Figure 5.
Regime-aware reconstruction of local thermal quantities for subcooled and saturated branches.
Figure 5.
Regime-aware reconstruction of local thermal quantities for subcooled and saturated branches.
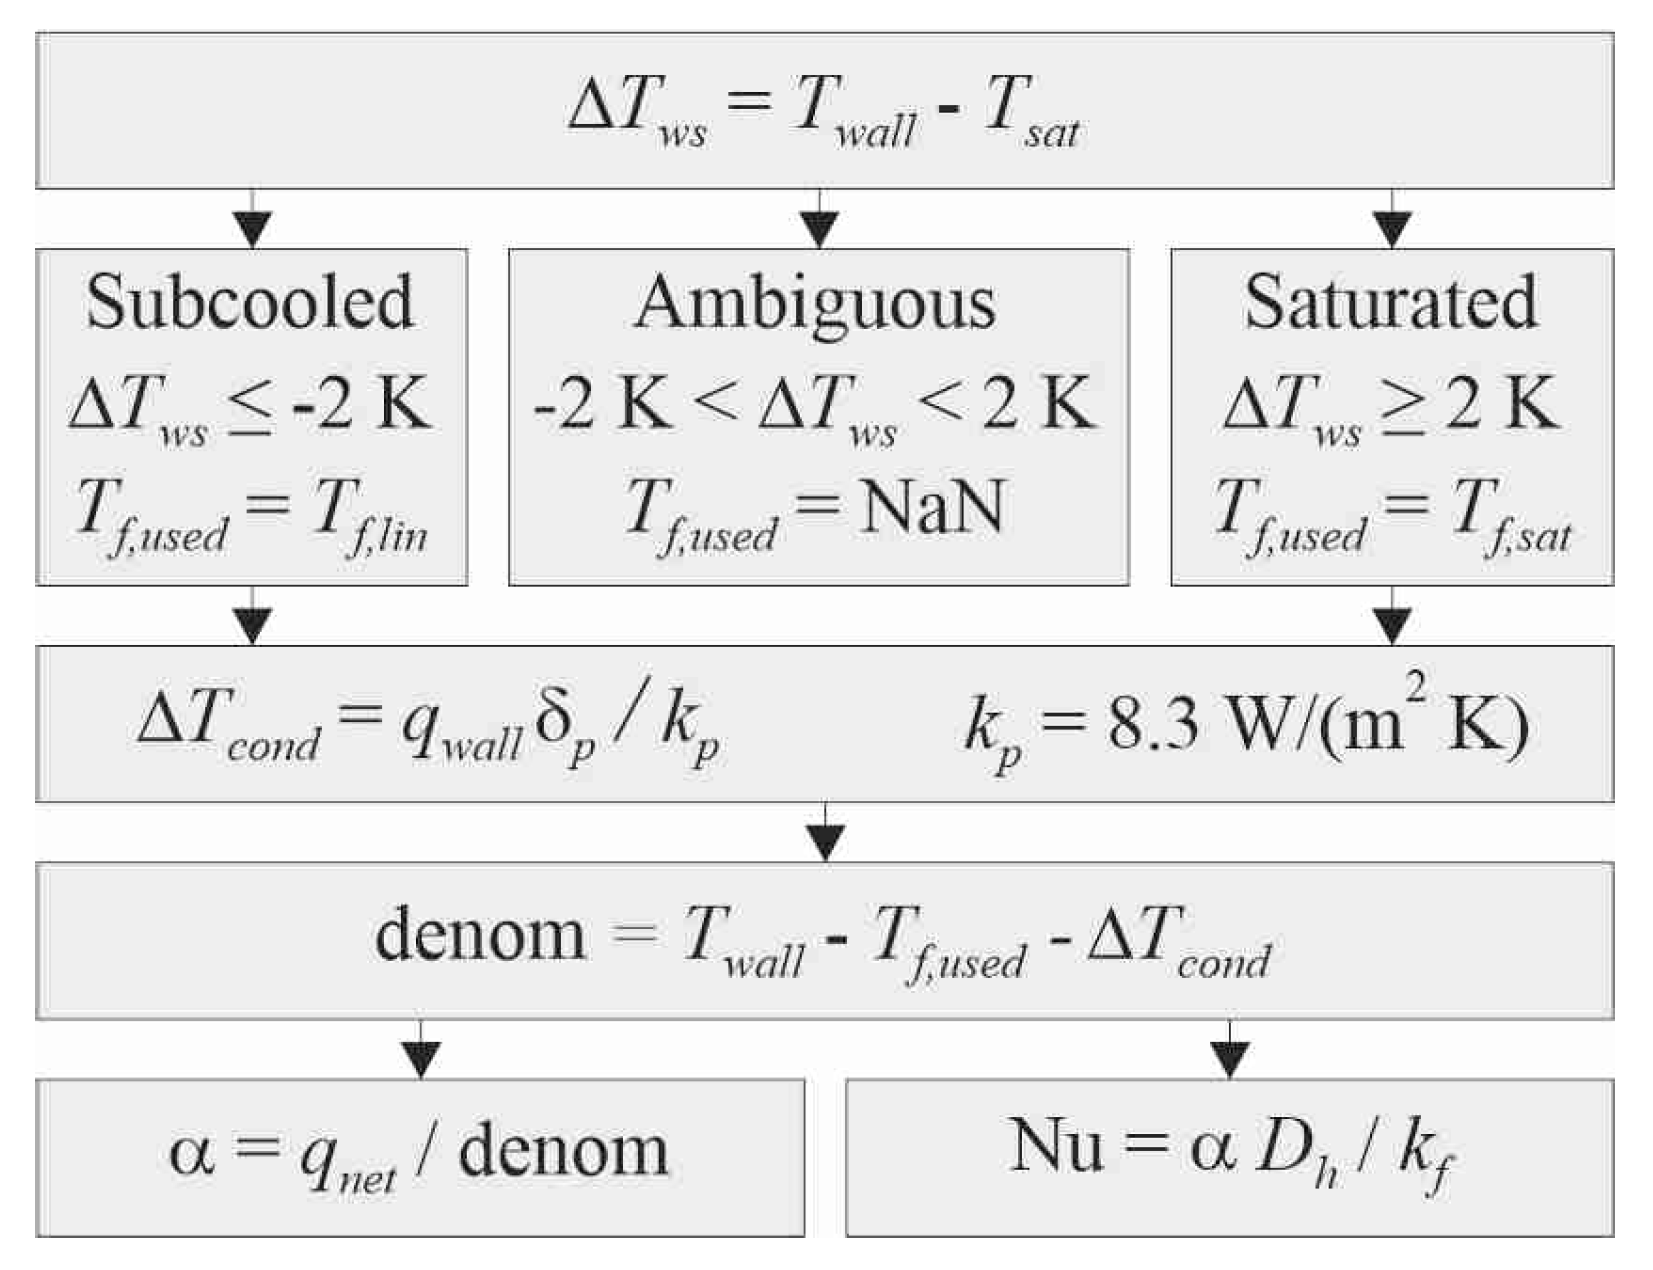
Figure 6.
Regime-labelling and quality-control framework from the locally reconstructed record to the final record-retention status.
Figure 6.
Regime-labelling and quality-control framework from the locally reconstructed record to the final record-retention status.

Figure 7.
Leakage-safe source-file-level train/test separation for local point-level machine learning.
Figure 7.
Leakage-safe source-file-level train/test separation for local point-level machine learning.
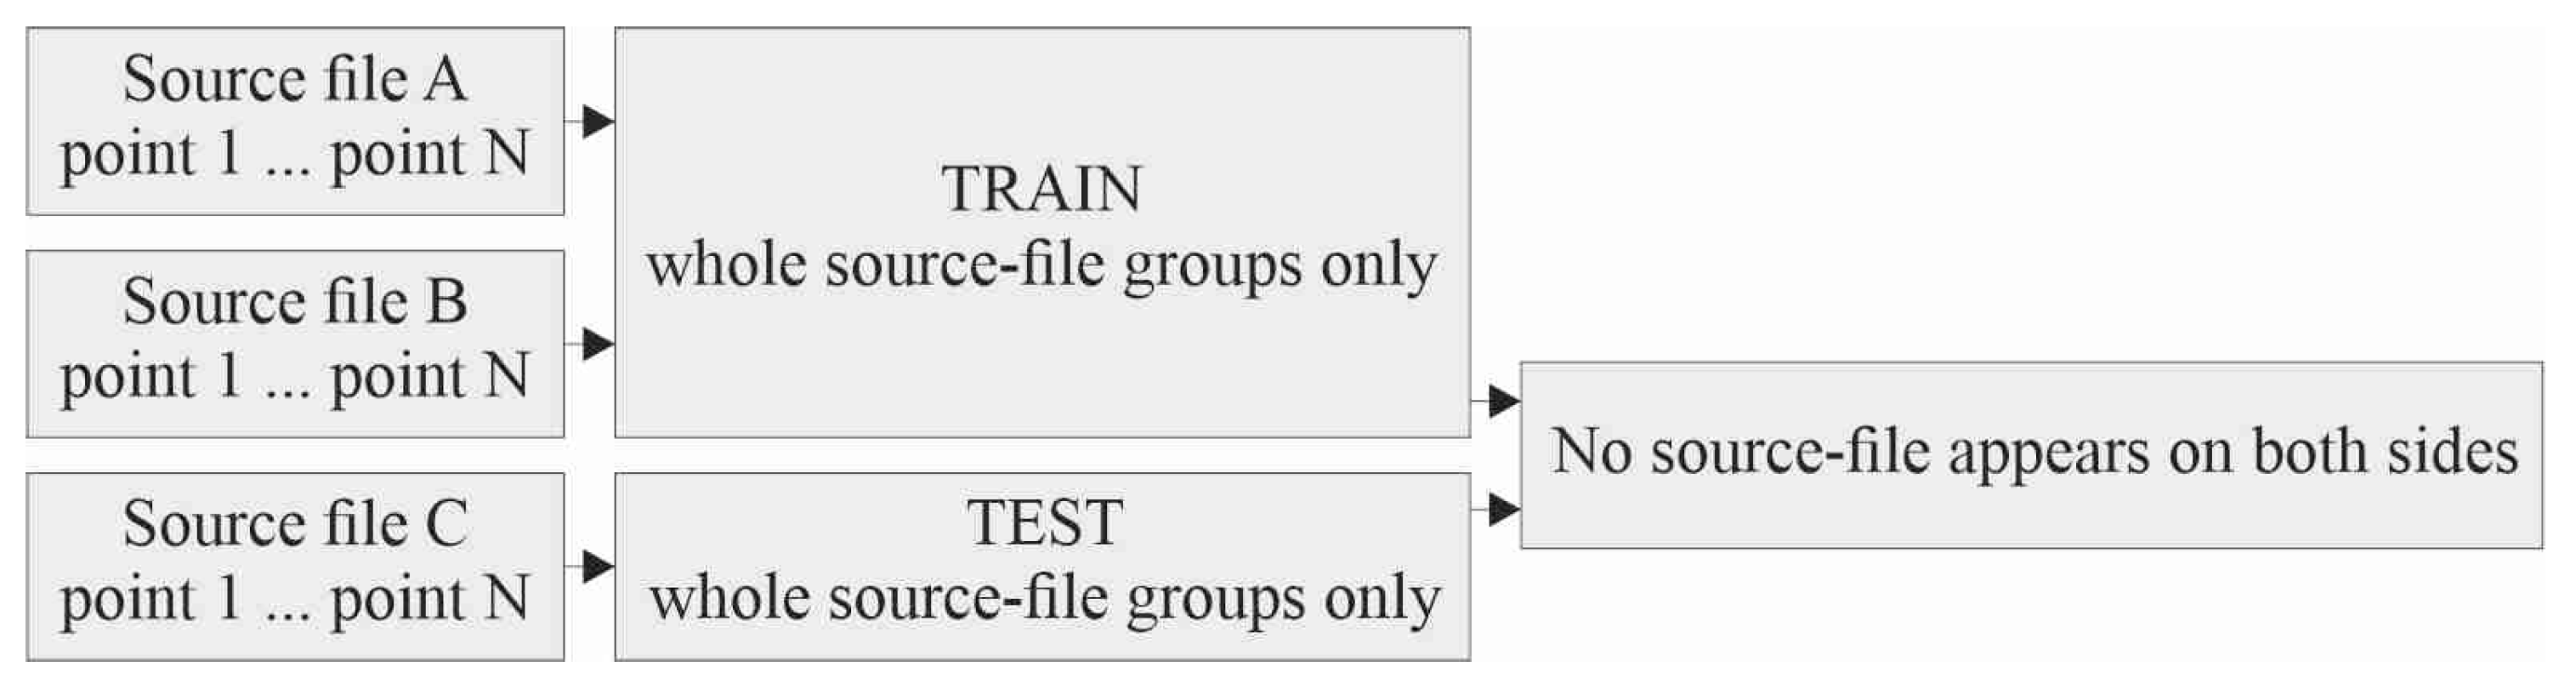
Figure 8.
Mean within-source-file regime composition by working fluid. Each source file contributes one experiment-level set of regime shares.
Figure 8.
Mean within-source-file regime composition by working fluid. Each source file contributes one experiment-level set of regime shares.
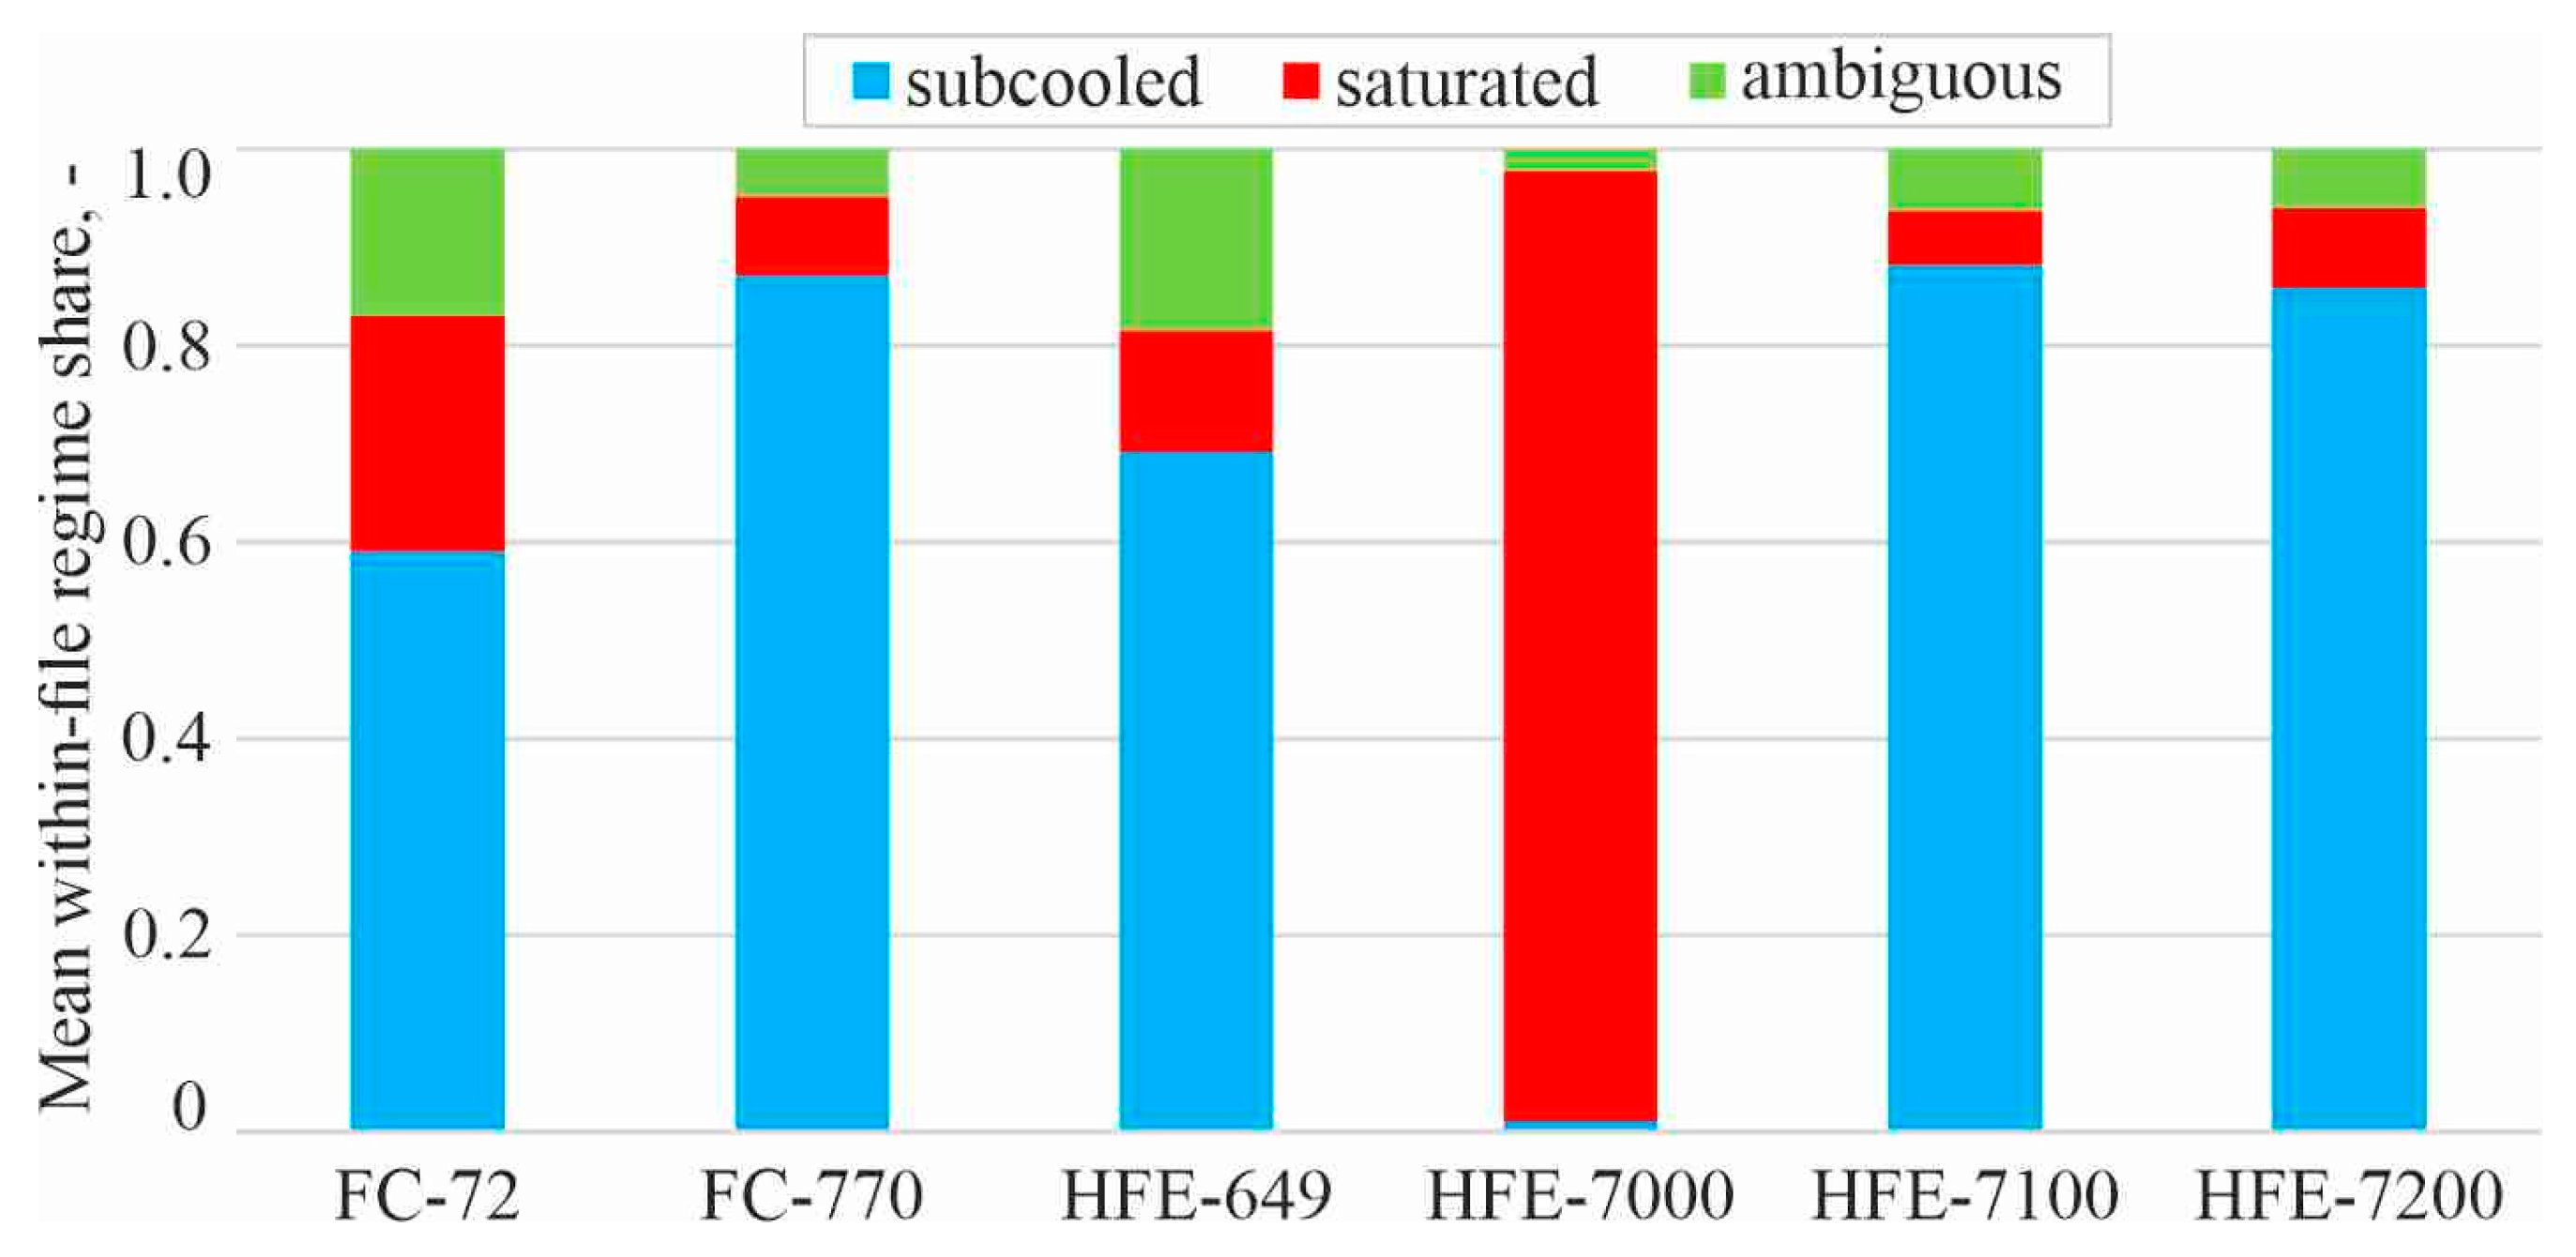
Figure 10.
Joint distribution of experiment-level median heat transfer coefficient and Nusselt number, classified by dominant within-file regime.
Figure 10.
Joint distribution of experiment-level median heat transfer coefficient and Nusselt number, classified by dominant within-file regime.
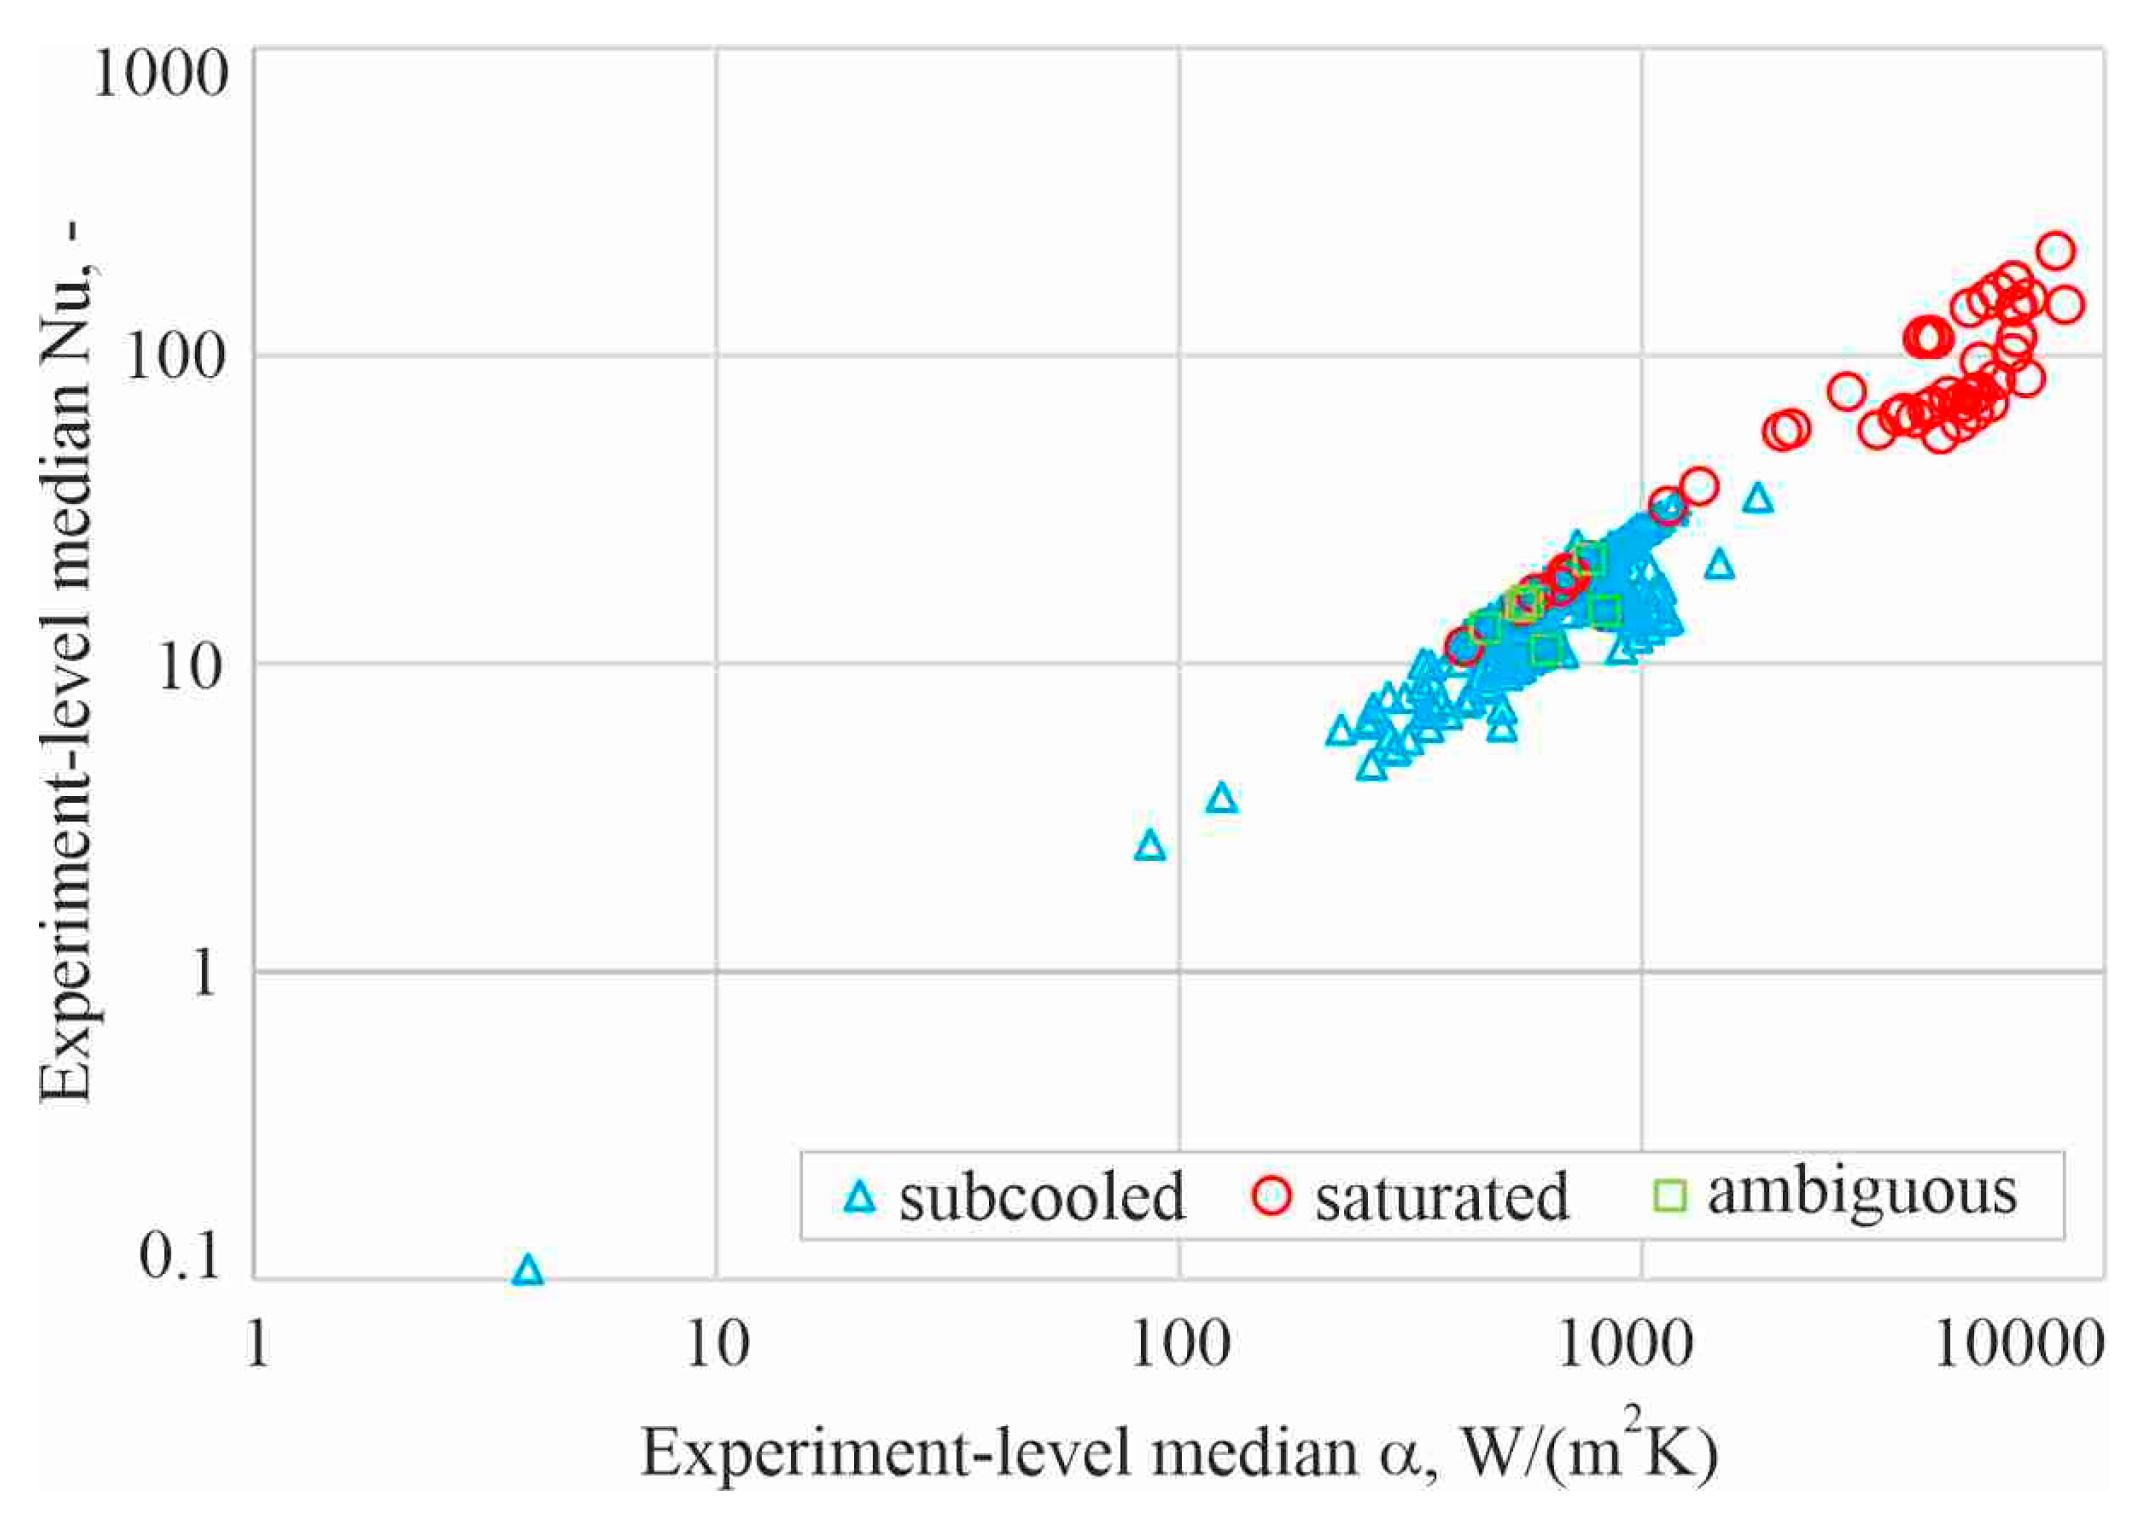
Figure 11.
Hierarchical scale of the integrated database: source-file provenance groups versus local point-level records in the final integrated database.
Figure 11.
Hierarchical scale of the integrated database: source-file provenance groups versus local point-level records in the final integrated database.
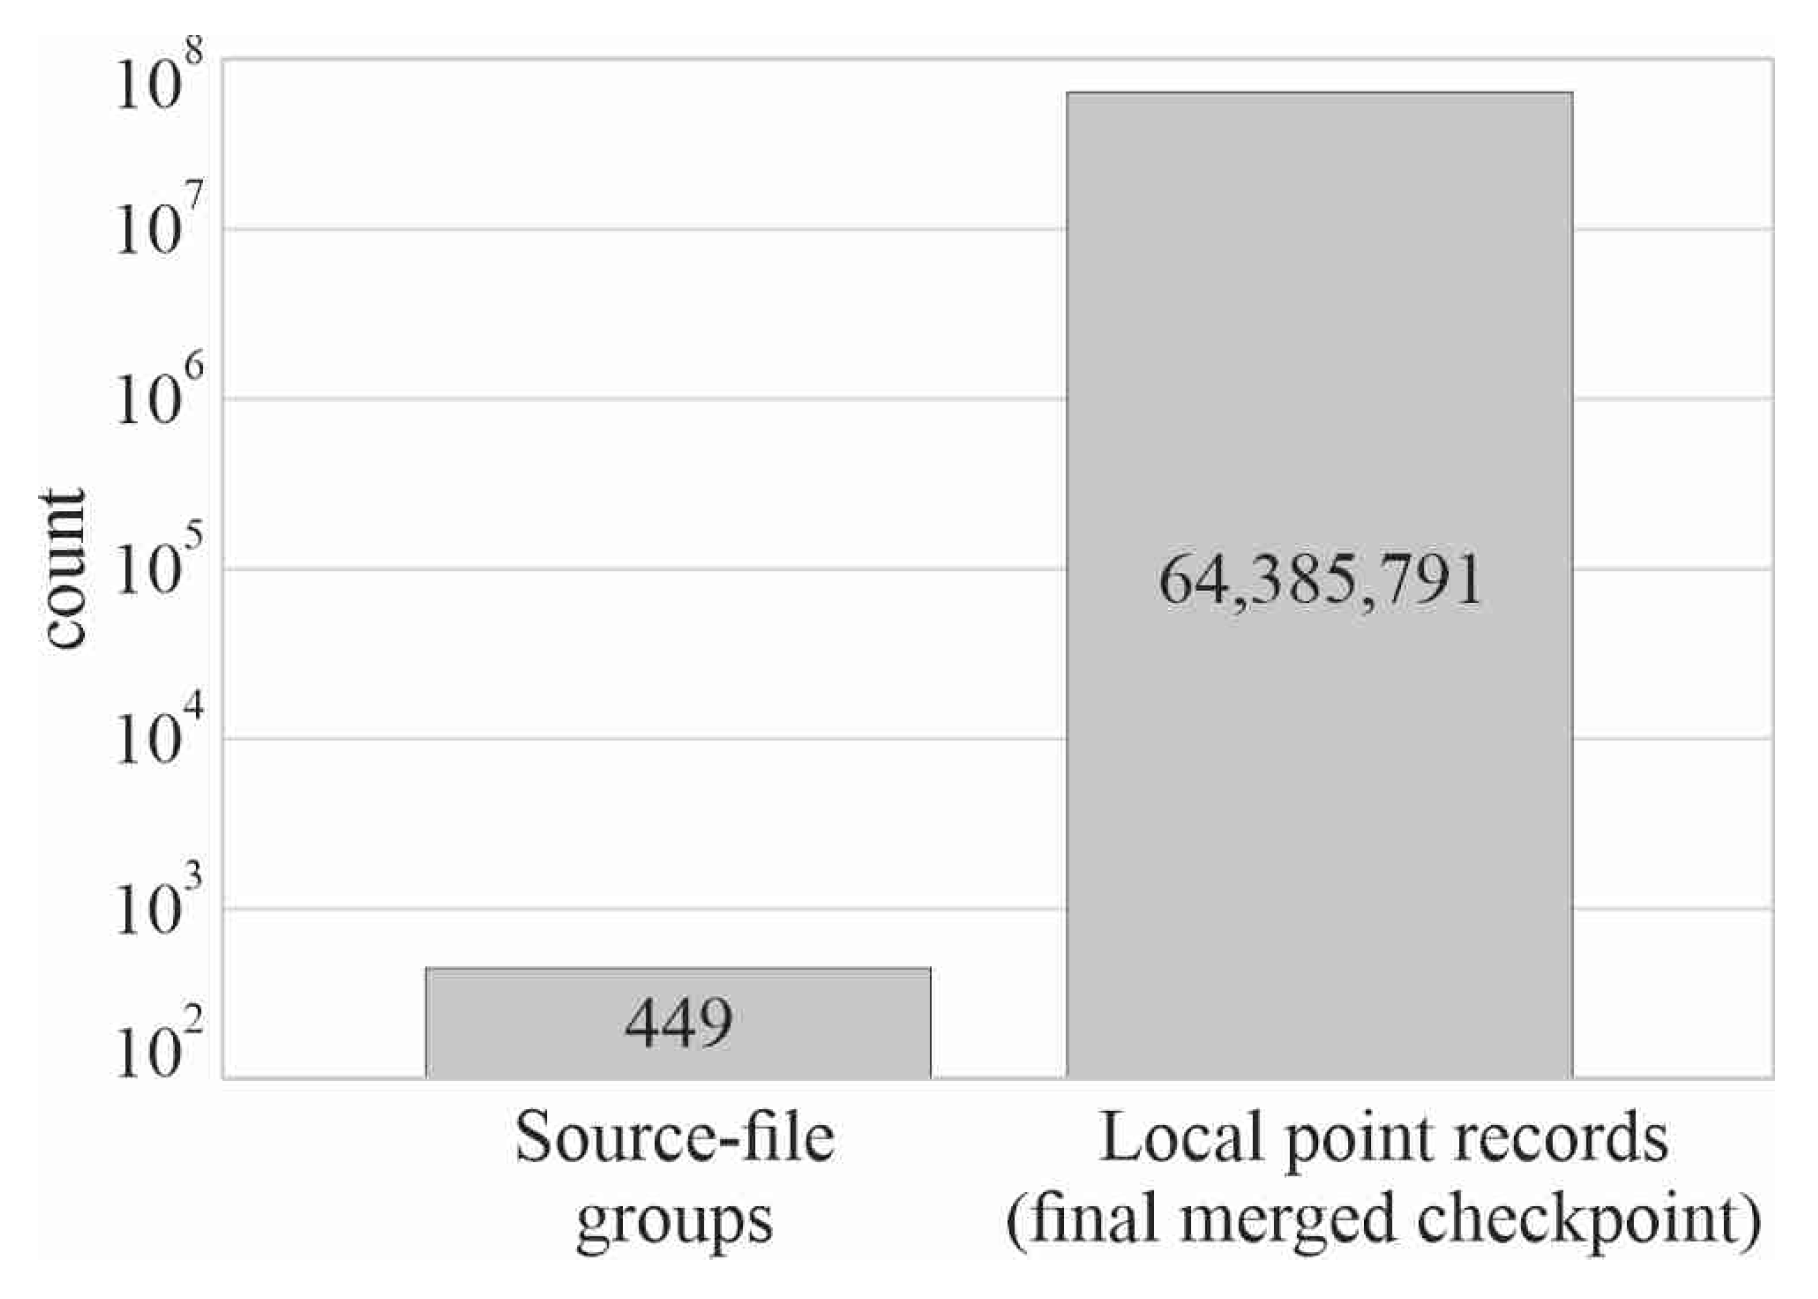
Figure 12.
Source-file coverage across working fluids and nominal orientation angles.
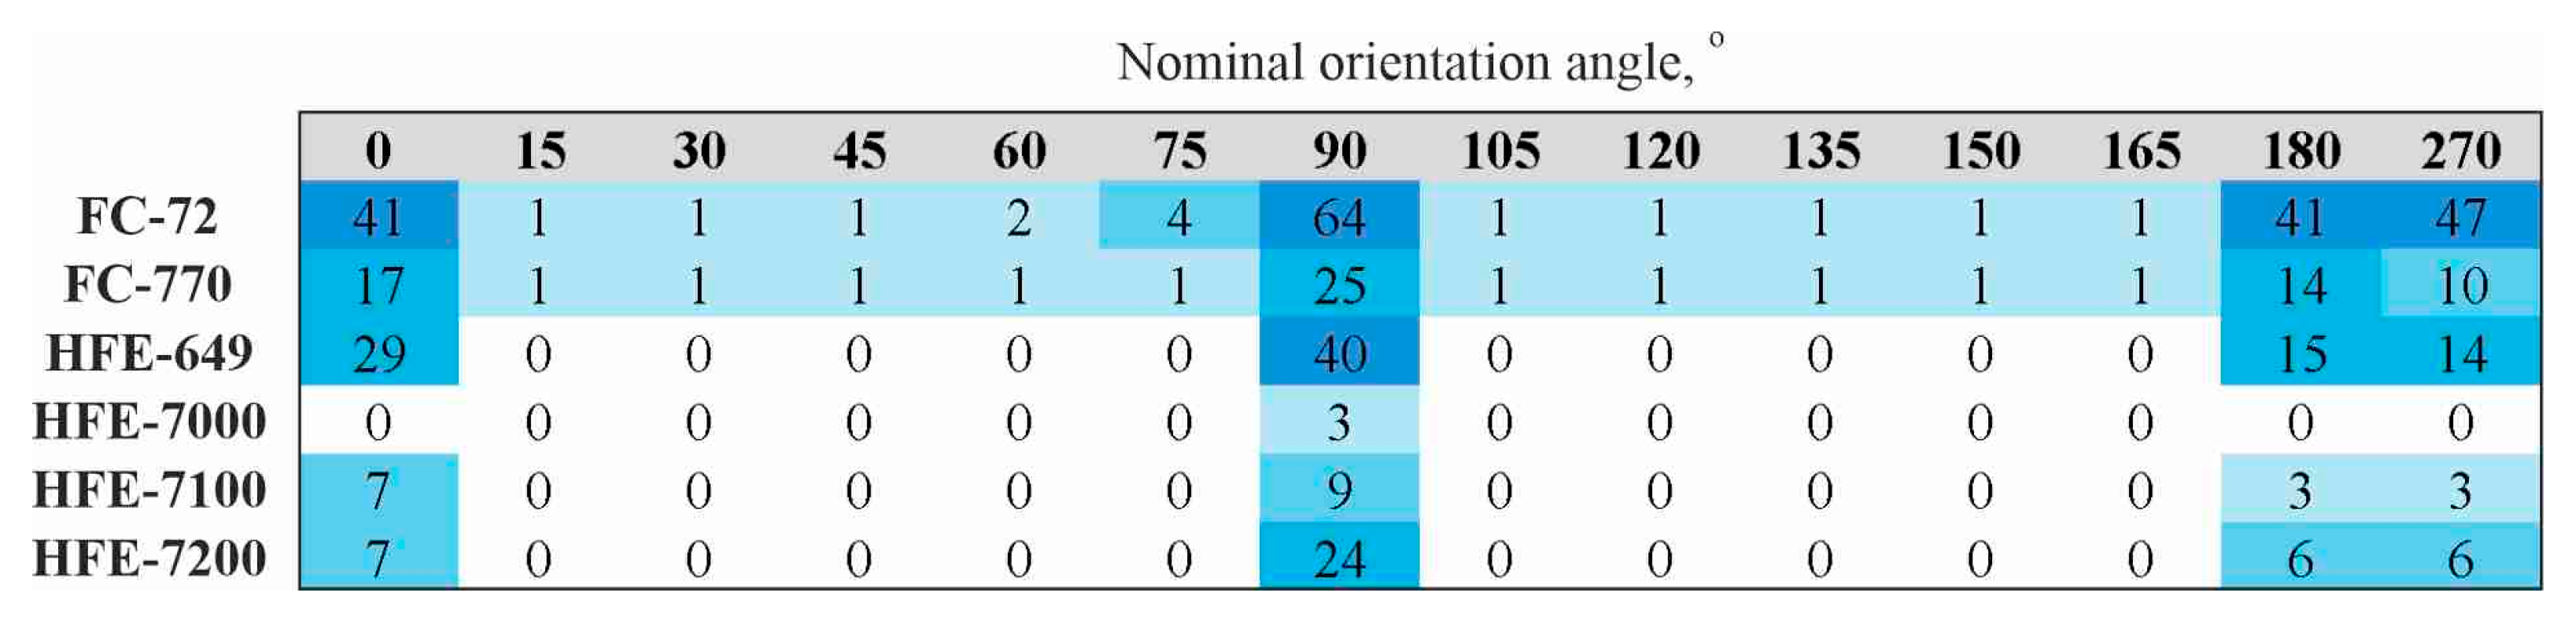
Figure 13.
Pilot Random-Forest test-set performance for regime-resolved Nu and α prediction.
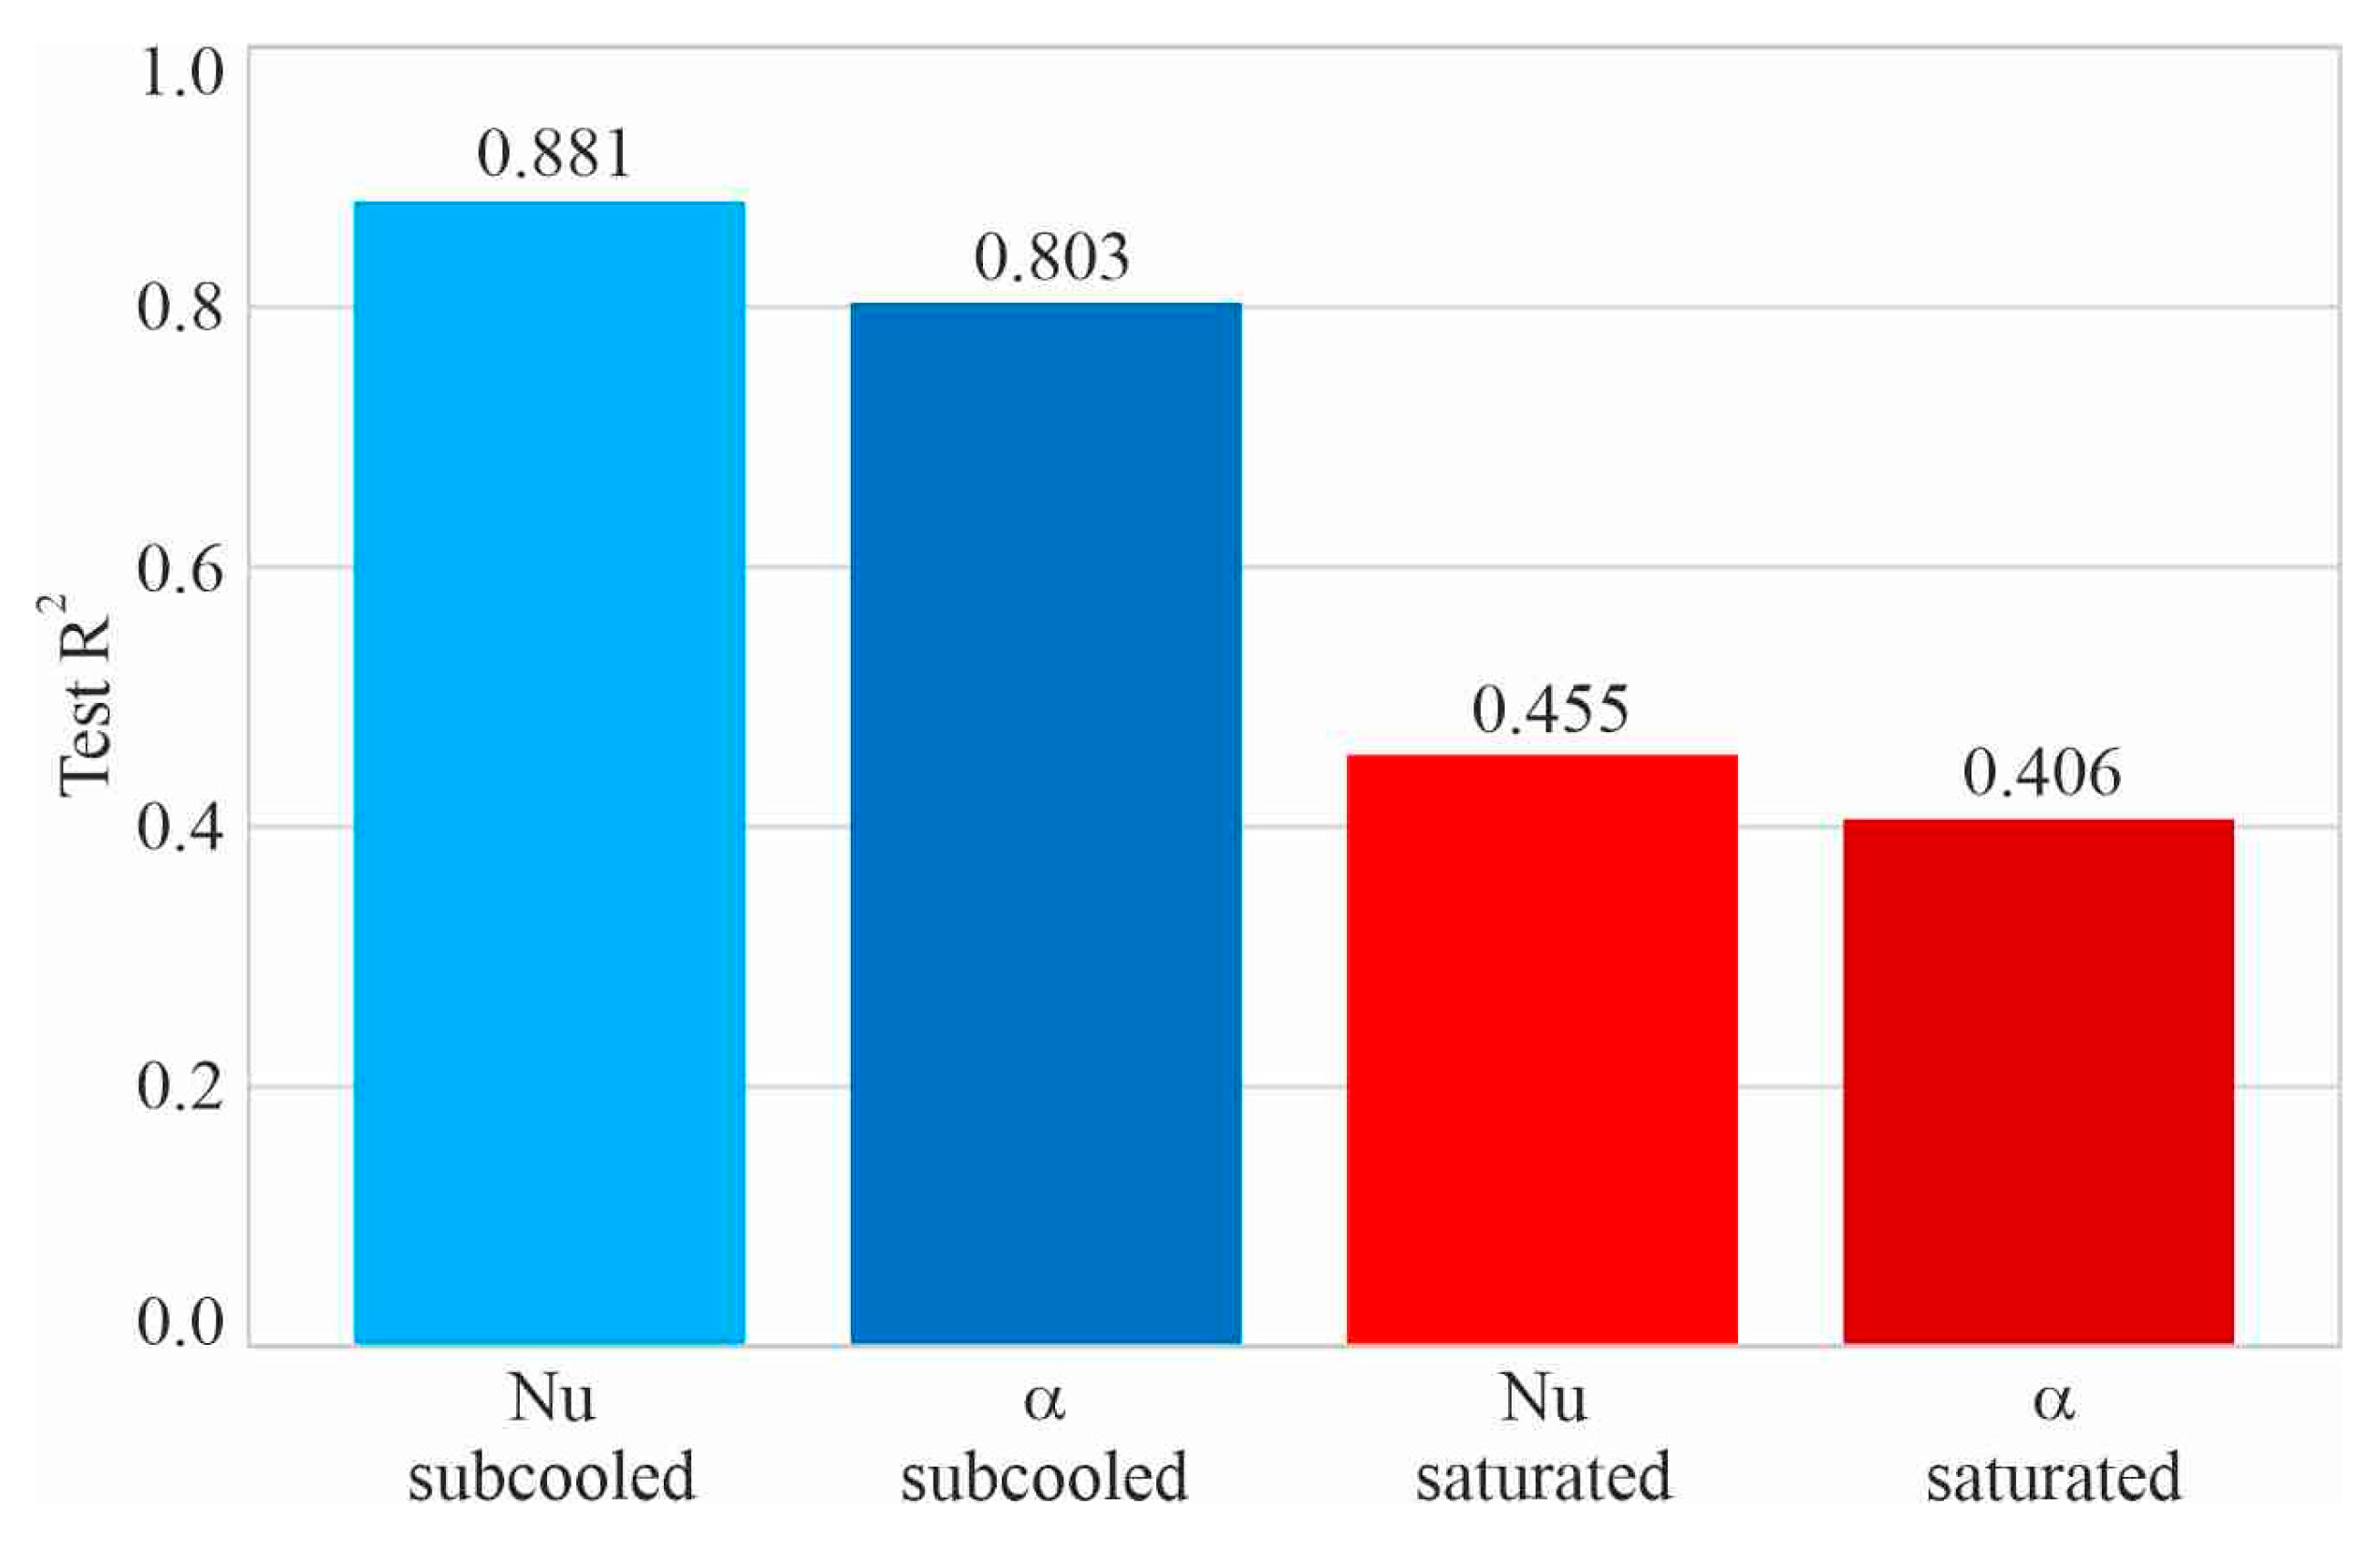
Table 1.
High-level scope and heterogeneity of the integrated experimental archive.
| Database descriptor | Current value / scope | Role in the present article |
|---|---|---|
| Processed experimental source files | 449 | Primary provenance groups |
| Point-level records | 64,385,791 in the final integrated database | Local reconstructed records |
| Working fluids | 6 | Coverage and stratification variable |
| Working fluids included | FC-72, FC-770, HFE-649, HFE-7000, HFE-7100, HFE-7200 |
Fluid identity |
| Surface conditions | Smooth and multiple modified/developed identifiers | Database heterogeneity; no pooled physical ranking here |
| Nominal orientations | Multiple horizontal, vertical, and inclined positions | Coverage variable |
| Channel-count configurations | Multiple configurations | Geometry metadata |
| Primary local outputs | α and Nu | Targets for diagnostics and pilot ML |
Table 2.
Variable groups in the unified point-level database and their analytical roles.
| Variable group | Representative variables | Primary purpose |
|---|---|---|
| Provenance | Source file and experiment identifiers | Data grouping, traceability, and prevention of source-file leakage |
| Geometry | Channel dimensions, hydraulic diameter, observation length, and number of minichannels |
Local thermal-hydraulic reconstruction and definition of geometric similarity variables |
| Operating conditions | Mass flow rate, electric current and voltage, working-fluid inlet and outlet temperatures, inlet and outlet gauge pressures, and atmospheric pressure |
Definition of hydraulic, thermal, and electrical boundary conditions |
| Thermographic line data | Central-line wall temperature and streamwise coordinate x | Spatially resolved thermal input |
| Reconstructed thermodynamics |
Local absolute pressure, corresponding local saturation temperature of the working fluid, interpolated bulk-fluid temperature, and selected reference temperature |
Reconstruction of the regime-dependent local thermodynamic state |
| Heat-flux terms | Electrical heat input, wall heat flux, net heat flux, and related heat-flux descriptors |
Energy-balance calculations and construction of heat-transfer outputs |
| Derived heat transfer quantities | Local heat-transfer coefficient α, Nusselt number Nu, Reynolds number Re, Prandtl number Pr, and related descriptors |
Analysis and pilot ML |
| Regime and QC | Operational regime label, QCflags, QCkeep | Regime-specific filtering, quality assessment, and analytical-subset definition |
Table 3.
Quality-control categories, record-level actions, and interpretation.
| QC category | Typical condition | Effect on record | Interpretive meaning |
|---|---|---|---|
| Regime ambiguity | Reference-temperature branch not uniquely assigned | Flagged and excluded from the retained and regime-specific α and Nu subsets; preserved in the full archive |
Methodological ambiguity, not necessarily a measurement error |
| Missing/invalid input |
Required input unavailable or non-finite |
Flagged and excluded from the retained subset |
Insufficient data |
| Invalid reconstruction |
Non-finite or unstable derived denominator/quantity |
Flagged and excluded | Derived quantity not considered reliable |
| Physical plausibility |
Value outside accepted physical/processing limits |
Flagged and excluded from the retained subset; preserved in the full archive for review |
Potential measurement or reconstruction problem |
| Valid retained record |
Required inputs and derived outputs pass all checks | QCkeep = True | Eligible for global diagnostics and predefined analytical subsets |
Table 4.
Descriptive statistics of experiment-level median heat transfer coefficient and Nusselt number.
Table 4.
Descriptive statistics of experiment-level median heat transfer coefficient and Nusselt number.
| Statistic | Experiment-level median α, W/(m² K) |
Experiment-level median Nu, – |
|---|---|---|
| Count | 449 | 449 |
| Mean | 1092 | 25.0 |
| Median | 726 | 18.3 |
| P95 | 4905 | 75.4 |
| P99 | 6479 | 153.3 |
| Maximum | 8218 | 218.6 |
Disclaimer/Publisher’s Note: The statements, opinions and data contained in all publications are solely those of the individual author(s) and contributor(s) and not of MDPI and/or the editor(s). MDPI and/or the editor(s) disclaim responsibility for any injury to people or property resulting from any ideas, methods, instructions or products referred to in the content. |
© 2026 by the authors. Licensee MDPI, Basel, Switzerland. This article is an open access article distributed under the terms and conditions of the Creative Commons Attribution (CC BY) license (http://creativecommons.org/licenses/by/4.0/).
Copyright: This open access article is published under a Creative Commons CC BY 4.0 license, which permit the free download, distribution, and reuse, provided that the author and preprint are cited in any reuse.


