

Submitted:
04 August 2026
Posted:
04 August 2026
You are already at the latest version
Abstract
The recent surge in the number of energy plants reliant on fossil fuels such as oil, coal, and natural gas has escalated the challenge of achieving a 100% reduction in carbon emissions by 2050. However, in a commendable joint effort with the Australian States, the Australian Government is unwavering in its commitment to making low-emission energy systems more affordable. This collaborative initiative, backed by substantial funding and policies, instills confidence and incentivizes technology makers and businesses to adopt innovative, solution-driven practices. It underscores the crucial role of diverse stakeholders in this transformative process, painting a promising picture of the future of clean energy in Australia. This vision implies spatiotemporal divisions across the renewable energy chain and interoperability, from electricity supply to electricity demand and vice versa. This study makes inductive inferences by combining an initiative logic of the renewable energy scenario thinking model targeting the Capacity Factor of the renewable energy framework. The foresight of merging diverse renewable energy models contributes to involving diverse stakeholders from now on to define an appropriate architecture of future uncertain capacity, promising a future with reduced carbon emissions and a healthier planet.
Keywords:
sustainability
; renewable
; non-renewable
; policy
; technology
; environment
; capacity factor
1. Introduction
The world emits 50 billion tonnes of greenhouse gases annually, making climate change mitigation a critical step in defining what can and cannot be eliminated (Ritchie, 2020). The energy system is undergoing a paradigm shift, influenced by marginal costs associated with Net Zero Emissions (NZE)generation and driven by the challenges of high variability and distributed generation. Grid stabilization, along with the pursuit of Net Zero Emissions (NZE, offers a range of clean and renewable energy solutions. For instance, deploying gas generation in balance with solar and wind sources is considered a likely and technologically mature combination. This stabilization is further enhanced by the use of storage batteries for short-term energy needs and pumped hydro for long-term renewable support. The critical challenge in climate change policy, particularly regarding global average temperature targets, is closely tied to technological advancement, although the base of change remains uncertain. Studies such as GenCost, conducted by the Australian Energy Market Operator (AEMO) and Commonwealth Scientific and Industrial Research Organization (CSIRO), focus on projecting current and future capital costs while also considering spatiotemporal factors in incorporating renewable energy sources (RE) and their mutual impact on climate change (CSSIRO, 2023); (Graham, Hayward & Foster, 2023). The overall breakdown picture of gas emissions reveals that 75% of emissions are caused by using fossil fuels to serve the electricity, food, and transport sectors. Despite significant contributions from fossil fuel power generators to global energy consumption, there is a push at both global and domestic levels to achieve the NZE goal. Achieving NZE of gases means not adding greenhouse gases to the existing amount in the atmosphere. Thus, searching for solutions for net-zero emissions is a valid goal. As the world transitions from plan "A" of fossil fuel energy sources to plan "B" of renewable energy sources, the issue of greenhouse gas emissions becomes increasingly urgent. By understanding climate change's influence, advocating for policies to combat climate change is necessary to create a sustainable future through a renewable energy approach. Greenhouse gases (GHG) such as CO2, CH4, NOX, CH4, CFCs, HFCs, PFCs, SFs, NFs, O3, and N2O, along with other significant sources of hydrocarbon and non-hydrocarbon gases, are potentially contributing. Like many other countries, Australia currently lacks the mechanics of long-term plans to limit fossil fuels, instead focusing on keeping heavy industries like mining viable as long as global demand persists. These challenges pose significant obstacles to achieving the NZE goal.
In light of the net zero emissions goal, extensive efforts have been made through hundreds of published studies to predict future energy systems. However, the integration of individual solution assumptions may lead to divergence from the optimal path and hinder the development of agile solutions. This divergence is often driven by the complex interplay of multiple integrated factors, including rapid technical, political, social, and economic changes. Consequently, this forecasting study focuses on feasible models by selectively considering particular factors and disregarding others. This study reviews the Australian Energy Market Operator reports and journal papers to determine factors influencing new generation capacity and existing commissioned capacity of renewable energy impact net zero emissions. After gathering the literature and numerical data, the net zero projection assessment was conducted using Machine Learning (ML) tools implemented in Python. This method divides the net zero emissions goal between two requirements: increasing renewable energy while decreasing non-renewable energy. The literature review and analysis in this study aim to establish a strategic approach for developing a transitional energy system, defined by its reliability, complexity, and interconnectedness, drawing on reports from the Australian Energy Market Operators and various journal publications. This review seeks to improve the integration of renewable energy while reducing reliance on non-renewable energy sources, offering a much-needed comprehensive system for understanding the transition. Guided by four objectives rooted in historical data, this approach aims to create a clear and comprehensive Capacity Factor for the Renewable Energy (RE) transition system. Thus, this study addresses the challenging task of predicting future capacity factors for renewable energy sources, a crucial step in ensuring grid systems can support the ambitious goal of achieving net-zero greenhouse gas emissions (NZE) by 2050.
As illustrated in Figure 1, the diagram provides a simplified overview of the broader scope of this research. The detailed analysis further highlights four key factors to assess the complex dynamics of renewable energy deployment: (1) Committed addition rate of RE, (2) Proposed addition rate of RE, (3) Anticipated addition rate of RE, and (4) Expansion/upgrade of RE infrastructure. Utilizing stochastic analysis within a Gradient Descent simulation model, this study integrates these dynamic factors with the penetration capacities of the five major renewable energy sources in Australia: (1) Wind, (2) Solar, (3) Hydro, (4) Battery storage, and (5) Biomass. By analyzing the impact of capacity factors across these diverse energy sources, the research contributes to the broader field of energy management. It highlights the inherent complexities in managing capacity factors under varying market conditions, offering simulations that depict the likelihood of scenarios ranging from low to high impacts on renewable energy transitions. This revision emphasizes the novelty of the work and its aim to tackle the complex task of managing capacity factors for a sustainable energy future.
The urgency of reducing greenhouse gas (GHG) emissions, which drive increases in average global temperatures, cannot be overstated. GHGs are primarily produced by fossil fuel combustion; industrial processes and deforestation are leading contributors. Climate Change is not just an environmental issue; it is a pressing concern that directly impacts human health, ecosystems, social life, and economics. Electricity generation is one of the leading causes of GHGemissions, trapping heat in the atmosphere and contributing to global warming and serious environmental problems. This issue of GHG causes additional warming of the Earth's atmosphere and traps extra heat. The implications are severe: rising temperatures contribute to increased sea levels and a higher risk of natural disasters, and achieving net zero emissions is not just an environmental goal but a necessity for our future.
Achieving NZE is a top priority on both international and domestic political agendas. The challenge lies in aligning the vision of NZE with current energy systems, aiming to eliminate fossil fuel emissions through adopting clean and renewable energy sources (Integrated System Plan for the National Electricity Market, 2024); (Zaghwan et al., 2024); (Zaghwan, Gunawan & Efatmaneshnik, 2024); (Zaghwan, 2017); (Zaghwan & Gunawan, 2021). This goal is not merely aspirational but essential, and it can be achieved by phasing out fossil fuels, reducing gas emissions from these sources, leveraging advanced emission-capturing technologies, and enhancing carbon capture through reforestation efforts. However, fossil fuel generators continue to play a significant role in meeting global energy demand. The urgent goal of reaching NZE promises a sustainable future that is heavily reliant on the increased penetration of renewable energy sources and the continuous reduction of electricity costs. This vision highlights the urgency of transitioning to higher levels of renewable energy penetration.
The transition strategy requires more than partially derived suboptimal solutions; it necessitates a systematic evaluation and objective selection to achieve a model-driven solution. This suggests an optimization problem can be addressed by using the gradient descent (GD) method to tackle the issue, considering independent variables from different RE perspectives. Gradient Descent is an effective method for optimizing functions. In this context, GD helps minimize the error between actual and desired rates, leading to more accurate predictions. For this purpose, GD should be employed to increase renewable energy value driven by decreasing fossil fuel energy sources. The algorithms assess the extent to which the challenging electricity demand opposes fossil fuel energy. The primary objectives of GD are to maximize renewable energy and minimize non-renewable energy, respectively, based on four indicators of capacity factors depicted in Figure 1. By referencing these indicators, one can trace the influence ranges and consider the associated energy management capacities.
Alongside the NZE goal, the decarbonization challenge focuses on nuclear power and carbon removal. However, the complex interplay between spatiotemporal access, mobility requirements, and the reactive and dynamic nature of these environments makes it difficult to accurately forecast the most effective options. As investment in electricity generation grows, alternative policies are being implemented to reduce CO2 emissions at both national and regional scales. Besides GHG's carbon capture and storage technology (CCS), renewable energy is essential for reducing gas emissions regionally. However, achieving dispatchable renewable electricity generation necessitates the optimization of renewable energy sources. In conclusion, the potential of renewable energy to transform our energy landscape and address climate change is promising. Yet, this transition presents challenges that require a carefully planned integration strategy for renewable energy systems, which this study seeks to develop.
2. Main Resources of Energy Generation in Australia
An uncertain strategy in renewable energy complicates the accurate prediction of the interplay between fossil fuel, renewable, and clean energy sources in Australia. This complexity is crucial for quantifying their collective impact on achieving the net zero emission goal. Addressing the uncertainties faced by various energy types is essential to identify the range of potential values where the optimal contribution of each source lies. The evolution of electricity resources continues until they achieve a fully integrated and mature state. Identifying key indicators to navigate these uncertainties and assess progress toward net-zero emissions is vital. The following sections provide a brief overview of the changes in electricity generation shares within the National Electricity Market (NEM) by power source type.
2.1. Black & Brown Coal
Coal is a sedimentary substance formed by the accumulation of decomposed plant matter. Over time, this organic material becomes buried and subjected to intense pressure and temperature in an oxygen-deprived environment, gradually undergoing chemical and physical changes. These changes determine the coal’s rank, which progresses through distinct stages: from the initial form of peat to lignite, sub-bituminous, bituminous, and finally, the most mature and energy-dense form, anthracite.
Black coal typically refers to bituminous, sub-bituminous, and anthracite, while brown coal is commonly known as lignite. This writing space of literature does not focus on the specific properties of coal types but rather on coal’s role as a fuel resource for many industrial sectors and electricity generation. Coal is one of the enormous Australian resources in the world, taking the global role of producing 87645 million tonnes (Mt) of black coal and 81234 Mt of brown coal produced annually. Together, these exports account for more than 58% of Australia’s total energy exports. Additionally, Australia is the largest exporter of brown coal and ranks among the top three coal exporters globally, making it a huge commodity worldwide, as depicted in the accompanying Figure 2.
Ninety-one operating black coal mines and more than three brown coal mines currently account for 100% of Australian saleable coal production, with recent prices not exceeding $100/MWh. Over the past decade, coal production has grown at an annual rate of 2%. Brown coal, although representing only a third of black coal's generation capacity, still surpasses the capacity of all other energy sources. In the first quarter of 2024, brown coal-fired generation increased by 0.6%, reaching 3675 MW. This generation from brown coal is characterized by increases during the evening and overnight peaks and decreases during the daytime. The vital role of brown coal is underscored by its increased availability during outages. Although its contributions to the National Electricity Market (NEM) supply have slightly declined annually, black coal-fired generation remains the dominant fuel source for energy generation. In fact, black coal-fired generation capacity increased over the last year, with a 1.1% rise in quarterly generation to 10613 MW. Despite these trends, price volatility remains high, driven by rising demand and concurrent weather events (McConnell & Sandiford, 2020).
Australia depends heavily on coal, which accounts for 60% of the country’s total electricity generation. As depicted in Figure 3, coal has remained the primary fuel source for energy production for decades. A significant portion of coal production is directed towards the export market.
2.2. Gas
The global requirement to lower GHG emissions is recognized as a key victory in the fight against climate change, as formalized in the Paris Agreement. Natural gas plays a significant market role in undergoing a decarbonization transition from Non-Renewable Energy (NRE) to fully RE. The intersection of the electricity generation market and the gas supply-driven electricity market is a focal point for examining the dynamics of the Australian market in relation to the international gas market. Despite significant efforts to identify the most cost-effective transition pathways, the integration between different energy sectors has not adequately adapted to evolving market dynamics.
In 2024, gas-fired generation reduced by 8%, equivalent to a capacity of 87 MW, coinciding with lower spot prices. The most significant output reduction was recorded in South Australia, from 204 MW in 2023 to 127 MW in 2024. The most significant decline occurred in South Australia, where output fell from 204 MW in 2023 to 127 MW in 2024 (McConnel & Sandiford, 2020). Despite this reduction, gas generation still saw increased output during peak evening hours, as depicted in Figure 4. The Australian gas market remains heavily centered on the electricity sector, reflecting the country's strong reliance on traditional fuels and the trade-offs associated with a carbon-intensive economy. Notably, Australian gas prices were 20% of Japanese (JPEX) prices, 50% of European (Platts PEP) prices, and much lower than US (Ercott/PJMWest) prices. In both relative and absolute terms, Australian prices surged dramatically in 2017, with wholesale electricity prices doubling Platts PEP and quadrupling Ercott/PJMWest. As RE expands within the national electricity market (NEM), the transitional arrangements require a careful balance between demand and supply, leading to heightened volatility and upward pressure on prices. The Australian Energy Market Commission (AEMC) reported that the current market structure, influenced by transitional market power, could hinder sufficient investment and impact progress toward NZE. Market concentration indices, such as the closure of coal generation plants (740 MW), further reinforce market power and influence the achievement of the NZE target (McConnel & Sandiford, 2020).
2.3. Biomass
As a dispatchable renewable energy resource, biomass plays a crucial role in meeting short-term energy demand and supporting the grid by filling gaps in the electricity supply, along with serving other energy needs. In Australia, biomass currently accounts for approximately 1.4% of electricity generation capacity and 4% of other energy consumption. While biomass's existing capacity stands at 1.7 GW, modestly competitive compared to other renewable energy sources, aiming for a total capacity of 148 GW at a levelized cost of electricity (loce) of around 10 ¢/kWh, the goal is to increase biomass capacity up to 15 times. This would involve boosting biomass's share by 25%, thereby reducing the total required renewable energy capacity to 110 GW at a reduced loce of 8 US ¢/kWh, making it a valuable contribution (Li et al., 2020; Generation Information, 2024).
However, the potential for biomass energy generation is constrained by land availability and use. Despite these limitations, recent biomass mapping in Australia has identified significant untapped resources, indicating that bioenergy could have a much larger impact if fully exploited (Li et al., 2020). From a spatial and temporal perspective, biomass has the advantage of balancing the variability inherent in other predominant renewable energy sources like solar and wind. The challenges related to the spatiotemporal aspects of biomass utilization include site availability, costs, and ecological impacts.
Biomass is a versatile renewable energy resource derived from organic materials, offering a sustainable alternative to fossil fuels. One of its key benefits is the reduction of waste that would otherwise contribute to landfills and pollution. The simplest application of biomass is direct combustion to produce heat and electricity. Additionally, biomass can be converted into various other energy products, such as biogas through anaerobic digestion or biofuels like ethanol and biodiesel by converting biomass into liquid fuels. Biomass can also be used to produce biochemical products such as adhesives and solvents. Thus, biomass can be converted into a wide range of biofuels to generate bioelectricity and bio-heat, and for transportation.
The ambition of the United Nations Sustainable Development Goals (SDGs) and the Paris Agreement on climate change includes the increased use of bioenergy in the future. However, current statistics show that biomass is the least utilized renewable energy source in Australia, contributing only 0.05% of the total renewable energy generation in 2024, as depicted in the accompanying Table 1.
2.4. Large-Scale Solar (PV.)
Australia has one of the highest solar irradiations per square meter among any landmass (Csereklyei, Anantharama & Kallies, 2021). Grid-scale Variable Renewable Energy (VRE) increased by 10%, about 482 MW, to match the total capacity of 5136 MW. Most of the solar power capacity, about 69%, was from grid-scale solar with a capacity of 331 MW annually. In this quarter of 2024, up to 18% of the generated power rate goes to solar PV. The indicator of grid-scale solar output continuously increases in Australia and all mainland regions, as illustrated in Figure 5. Most of this increase goes to Queensland and New South Wales, up to 84 MW. The curtailment of the grid-scale average reduced from 5.6% in 2023 to 4.5% in 2024. This increases the average availability of solar power with expected fluctuations compared to previous years.
A high instantaneous distributed PV generation record is in 2024, which aligns with the demand-side flexibility goal. Relative to one calendar year, the new solar capacity connected to the grid offered additional power availability of up to 245 MW. However, the commissioning capacity of solar power connected to the grid before the recent calendar year displays ramping behaviours as it has yet to reach its full capacity, as depicted above in Figure 5. Maximizing the demand for renewable energy-available assets adds great value to increasing the grid system flexibility and smoothing the transition from a one-directional to a unidirectional energy supply (Zaghwan & Gunawan, 2021). Demand response and contingency services on the demand side also contributed to wholesale demand response (WDR), enabling large electricity consumers to reduce their electricity usage to balance supply and demand in the grid in response to wholesale electricity market signals. WDR primarily benefits large consumers such as institutional entities and commercial clients. In the meantime, other electricity marketing mechanisms allow smaller entity aggregators to combine loads for the reduction capabilities of multiple smaller consumers. Relatively, there was an increase in the number of WDR participants up to 65.0 MW in 2024 (only 17.2 MW in 2021).
2.5. Storage Batteries
Uncertainties exist about the battery's technology, cost, market structure, and business models; nonetheless, there is a general agreement about its potential role in the NZE goal. Storage batteries (SB) are a major clean energy player, promising high RE mix penetrations as well as reduction to loce. Exclusively in Australia, Keck, F. et al. (2024) study found SB capacity up to 180 GWh with cost levels of $1000 AUS kWh-1 economically successful in reducing spilled energy by 76% and total RE installed capacity by 22% loce by 22% (Keck et al., 2024). Electricity energy storage via storage batteries has the potential to mitigate the influence of intermittent sources of RE and enable the transition to the NZE goal. Most traditional fossil-fired power generators, particularly coal-fired plants, are designed to maximize reliability and profit for full-load operation conditions. These operational conditions also suit control devices for gas emissions, depending on the plant's specifications and design. Additional flexibility is driven in operation through renewable energy generation such as wind and solar, adding a wider operating range and the privilege of avoiding costly plant shutdowns. This improvement in power generation flexibility and environmental friendliness shifted the traditional operational profile to face new challenges, such as more frequent shutdowns, a lower minimum sustainable load, and more aggressive load ramp rate occurrences. Recent studies have defined integrated energy storage systems as one that could improve the required flexibility of operating renewable and non-renewable energy sources (Sarunac et al, 2024). Battery-driven flexibility indicates the capacity of a grid system to manage the supply efficiently during large and transient demand-supply imbalances. The expectation that the battery energy storage system responds conveniently depends on the system design. Table 1 above summarises Australian batteries' capacity. Although a 30 MW battery capacity increased quarterly based on average generation, the total contribution was negligible at 0.1% of capacity. The net revenue generated in the first quarter of 2024 for grid-scale batteries was about $47.8 million, with an annual increase rate of 134% (Sarunac et al, 2024).
2.6. Wind
Australia is defined as one of the best RE ecologies of wind energy resources in the world, influenced by the low cost of technology and effective support policy. The adoption of wind turbines is favoured by low-cost wind generation that is paired with compatible wind conditions. Australia, through NEM, committed to diminish GHG emissions from the perspective of limiting anthropogenic climate change to below 2 degrees Celsius, consistent with limiting 50-75% emission reduction (Gilmore, Nelson & Nolan, 2023). The inherent challenge of wind variability in supply due to weather dependency limits wind energy penetration. Given this variability of wind sources, 100% of intermittent wind energy is not the objective function of wind modeling within the Australian NEM. Given the high capacity of current coal plants, which are expected to retire within the coming two decades, it is anticipated that there will be further transitions to renewable energy sources. The high expectation for wind energy sources to influence future NZE plans is influenced by its intermittent availability, which could also be affected by other renewable energy technologies.
Where,
New Capacity:The Capacity is connected to the grid for the last calendar year.
Commissioning:The Capacity is connected to the grid and started before the last calendar year
Existing:Power facilities are fully commissioned before 2024 (May appear in commissioning or new capacity)
Curtailment:Reducing the amount of energy generation due to operational constraints (involves revenue loss)
Offloading:Redistributing energy to manage load (Optimise distribution without reducing total generation)
The progressive growth of wind power availability increases annually and is driven by new facilities connected to the grid. A recent annual increase of wind power was recorded in 2024 by 151 MW supplied from newly installed wind facilities, while 74 MW from previously installed capacity continued its commissioning. A 51 MW wind capacity reduction is evident with an additional 8 MW curtailment. Offloading 14 MW this year to the set of wind turbines involves redirecting, reducing, and managing the wind turbines' power generation. Wind curtailment rose by 34%, resulting in an average offloading of 32 MW. Offloading, along with the definitions of existing, commissioning, and new capacity, serves as a critical indicator. These curtailments can occur for various reasons, including the need to maintain grid stability when power generation exceeds demand. Their different roles arise to perform maintenance and safety checks or to respond to market demand response and pricing, as, in some cases, selling all the generated capacity is not economically viable. These indicators help assess optimal operation, economic efficiency, and grid stability, as depicted in Figure 6. (Gilmore, J. et al., 2023) modeled nine financial years of data to capture the variability of wind resources, claiming that data that does not include poor wind performance due to poorer weather leads to imperfect performance prediction. This deficiency in investment in wind energy toward NZE calls for further penetration of other RE sources, such as biomass and hydrogen. The capacity factor intervention in Australia concerns the RE capacity that meets the requirements of NZE evolution held in some factors. These factors include the total capacity of individual RE sources required and their standing by operating reserve systems for any further requirements (Sarunac et al, 2024).
The adoption of wind turbines is favoured by low-cost wind generation that is paired with compatible wind conditions. Starting with the year 2018, a substantial increase in the wind energy supply. As the penetration of renewable energy increases, the disruption to the current electricity grid increases from a system reliability perspective and a market structure point of view (Csereklyei, Z. et al., 2021).
2.7. Hydro/Water
Hydro supply of electricity is a low-cost solution with significant discrepancies with its intermittent nature and availability; however, it is likely to be a valuable renewable energy source. It primarily relies on the hydro storage system, and its operational system depends on energy sources such as solar, wind, or fossil fuel, and the cost of doing this. Thus, the potential and cost of pumped hydro storage (PHS) are the challenges to designing the future capacity and building a clear view of Australian demand reliability toward NZE. Hydropower is the energy produced from water movement through rivers, dams, and tidal systems. Hydroelectric power plants are highly influenced by the regions experiencing rainfall. Hydro output fell by 10%, equivalent to 142 MW, and reached 1344 MW. Hydro output is purposely reduced during the day unless evening peak times exist. The highest reduction was noticed in NSW, while Victoria is the only region with increased hydro output. Most importantly, the mechanics of most pumped hydro systems (PHS) are designed to operate with input from non-renewable energy sources that are not intermittent and are within a highly controllable and constant rate during dark hours, enabling ramp-down fossil fuel sources (Eerkens, 2006), (McConnell & Sandiford, 2020), (Department of Climate Change, Energy, the Environment and Water, 2024). These operational circumstances put the hydro system on hold for extended periods at a low annual capacity factor, effectively diminishing its role. Another concern related to PHS is that its pumping rate frequently varies, with water volume influencing efficiency.
3. Analysis of Australia’s NZE Target By 2050 Using Gradient Descent Approach
3.1. Capacity Factor of RE
Ensuring Australia's energy demands are met sustainably requires roughly 70 GW of renewable energy capacity, equivalent to 204 TWh. Solar and wind stand out with 23 GW and 45 GW capacity, respectively, covering 168 TWh, with the expectation of a 7% loss being massively high (Eerkens, 2006). However, the challenges in distribution, influenced by demographics and seasonal variations, are significant and need careful consideration. Managing the high capacity of wind, storage battery, solar, and hydro requires thoughtful strategies, underlining the gravity of the situation. Thus, the operational tasks are influenced by various uneven patterns from different sources, with environmental factors being the most significant. It differs in how each energy source might contribute to covering the electricity demand, as shown in past trends and future projections and as depicted in Table 2 and Figure 7.
Consequently, the capacity factor for an entirely reliable renewable energy source is relatively easy to decide with a reliable reference and compatible information. To put it differently, it involves looking for optimum stationary points of polynomial factors relevant to the current system transient behaviour when adding renewable energy to the grid system. This point of capacity factor is relevant to the complex interplay of multiple facets of technical advancements, policy frameworks, economic conditions, environmental imperatives, market dynamics, and social acceptance, holistically making the transition to a renewable and sustainable energy future challenging (Feruson & Ashworth, 2021). The head issue here is that the suggested future capacity of wind, storage battery, solar, and hydro has a very high value, and we are open to the question of how to manage it based on what factors! Most significantly, relevant factors rather than the "cost less" goal confront sufficient redundant capacity to meet the demand at all times of day.
To put it in practical terms, renewable energy systems exhibit a great deal of redundancy; coal-fired capacity is still required within a range of 1.4 times the average for a 100% renewable supply system in the US, and 5 to 7 times the average to meet peak demand in Australia. Nonetheless, the Australian version of a 100% renewable energy solution is also affected by the location of the average capacity factor of renewable energy, where some sites maximize the energy output. In contrast, others would not do the same, making the fleet average capacity below the current average from 43% to 30% (Csereklyei, Anantharama & Kallies, 2021). Whatever the future adopted scenario is, finding a realistic solution to avoid this issue is essential. In addition to the obstacles of the "RE Capacity Factor", renewable energy availability typically varies widely from one season to another and from one location to another, creating a substantial inter-seasonal challenge that should be carefully considered and addressed. Concurrently, storage capacity in Australia is estimated at roughly 450 GWh, and storage options will play a pivotal role in meeting Australia's annual demand. Several findings' characteristics are drawn from multiple simulations of generating capacity to sufficiently cover Australian demand, and most of these exercises rely primarily on an assumption of 58% wind penetration across regions. In many case scenarios for RE, they should be located in less ideal locations, maintaining higher efficiency in poor weather than in big sites. The intermittent RE capacity factor limits the reliability of the RE system, accounting for only 16% of the influence of the site factor, which is evident in bad weather (Csereklyei, Anantharama & Kallies, 2021; Feruson & Ashworth, 2021). These indicators require careful reconsideration of the Capacity Factor, referring to what references influence the transitional capacity the system requires to move efficiently towards the NZE goal.
3.2. Analysis Methods
Hybrid Gradient Descent approaches are applied in this study to provide results through an iterative process, typically achieved by running the algorithm multiple times with various combinations of learning rates and momentum values. This hybrid GD method transforms Standard-GD into multi-mode, mixed, or integrated GD approaches, sometimes broadly referred to as GD techniques. In this study, we combine Standard-GD with Pseudo-GD; this combined method is referred to as a Multi-Mode Gradient Descent Approach (MMGD) (Abo-Khamis, M. et al., 2020).
The function of gradient descent f(w) is used to find the initial random value of w at which the multivariate function attains the goal of a minimum value (Tian, Zhang & Zhang, 2023). Testing different learning rates and momentum configurations allows us to observe their impact on convergence and error reduction. Each result block begins at iteration 0 with an initial error value, representing one specific run with a particular set of parameters. By comparing these runs, we can assess how different learning rates and momentum affect convergence speed and overall selective options.
Based on expected functions of stationary points in a system, its derivative is equal to zero when no parametric increase or decrease occurs. Among the most common stationary inflection points, minimum points, and maximum points, the GD method is the stationary point where the function changes from decreasing to increasing, where the gradient is zero, defined as a minimum turning point. Thus, the GD method typically defines stationary points and adjusts related factors iteratively to minimize the difference between the original function and its desired factorized form.
To effectively communicate the role of the Gradient Descent tool (GD) in this study, the Standard Gradient Descent method is often enhanced by combining it with other gradient descent analytical techniques, such as Conjugate, HGDSA, SGD, NAG, BFGS, Adgrad, RMSprop, Pseudo, and many others (Xue, Y. et al., 2023); (Wu X. et al., 2024); (Yin, J. et al., 2021). Standard-GD analysis represents numeric values within a range, allowing RE capacities to vary continuously across optimization scenarios derived from applying “Learning rate” and “Momentum”. In this context of Standard-GD, the learning rate (Ƞ) determines the step size where the algorithm takes in the direction of the gradient to minimize an error function. Ƞ values used in this study are 0.05, 0.5, and 0.8; those mean the algorithm, through several scenarios, takes 5%, 50%, and 80%, respectively, of the gradient’s magnitude as the adjustment for the parameters (weights) in each iteration. For instance, at k =1,∇w f(w1) denotes the committed adding rate of solar per year, where ∇w f(w1) =1980 MW, the learning rate is Ƞ=0.05, and the momentum factor ꞵ=0.5, it adjusts the step size by adding a fraction ꞵ of the previous velocity (vk-1) to the current gradient-based update. Doing this smooths the convergence path and prevents oscillation. This adjustment moves the parameter closer to the optimal value. Momentum (µ) adds a fraction of the previous velocity to the current gradient-based update, accelerating convergence and smoothing out oscillations by incorporating a fraction of the last step into the current update. In brief, the learning rate controls the size of adjustments in each iteration, affecting how quickly the model updates weights and biases. A small learning rate slows convergence, while a high rate can cause instability, sometimes leading to prioritizing less impactful sources like hydro or biomass, whereas a low learning rate treats minor sharing capacities as outliers, focusing on major capacities like solar and wind to reach stable capacity targets. Momentum aids the direction and smoothing adjustments, guiding the algorithm toward the minimum. Together, these configuration factors enable us to compare performance across settings to identify the most efficient or stable path for minimizing error, which is the primary goal of MMGD. We are evaluating the multiple objectives of RE sources based on their distinct variables of continuation and categorical and discrete influences toward NZE.
Additionally, Pseudo-GD analysis covers categorical variables and classifies data into distinct groups such as strong, medium, and low influence rather than assigning numerical values. Meanwhile, numeric and countable discrete variables represent separate, whole values for renewable energy capacities, treating each value independently. Standard (continuous) and Pseudo (discrete/categorical) GD methods use learning rates to ensure adjustments are neither too large nor too small in each iteration, smoothing outputs to approach minimal or even zero error values. The final error values after all iterations indicate how closely the algorithm minimized the function, with near-zero values signaling that GD has effectively found a point close to the desired minimum. To sum up, the goal of GD analysis in this research is to balance target matching with error minimization by aligning with the predefined capacities of various RE sources. Leveraging categorical-discrete and continuous variables allows the model to define (1) appropriate adjustments (pseudo-GD) while (2) minimizing error (standard-GD).
These GD approaches demonstrate combining Standard-GD (equations 1-12) with Pseudo-GD (equations 13-17), which is defined as the Multi-Mode Gradient Descent Approach (MMGD) (Abo-Khamis, M. et al., 2020); (Heaton, J. et al., 2019); (Goodfellow, I., et al., 2016).
- Starting point: Initial coordinates where the algorithm starts.
- Learning Rate: Step size control during each iteration
- Momentum: Directing and smoothing GD algorithm based on the history of past gadgets.
- Iterations: number of rounds/iterative/steps the algorithm takes.
- Path: Coordinates GD algorithm at each step moves from the starting point toward a minimum.
- Error History: Stores the error values found at each iteration.
- Mesh grid: Using x, y values for contour plotting
- Contours: Displays the function value on the grid.
- Learning Rate: Controls the step size toward the minimum of the objective function during each iteration.
3.3. Analysis Results
The following graphs in Figure 8 visualize the GD convergence paths for different learning rates and momentum values.
Each graph conveys specific learning rates and momentum based on the MMGD path (red line), global minimum (white dot), and minimum found (red cross). The red line denotes the trajectory of the gradient descent algorithm, which iterates from a starting point toward the minimum value. Low learning rates show small steps adjacent to one another with the absence of momentum, resulting in a steady but slow convergence. The white dot point denoted the true minimum point of the function, where the lowest value was considered. The red cross at the centre of the white dot is the targeted value that indicates where the gradient descent algorithm stopped after iterations. This illustrates that the MMGD algorithm sufficiently found the global minimum when the overlap of the red cross of MMGD with the white dot occurs, and the algorithm's minimum values validate its success in finding the global minimum. A higher learning rate leads to faster convergence and can cause overshooting and instability. Adding momentum helps smooth the path, leading to quicker and more stable convergence. A balanced learning rate and momentum combination could be around LR = 0.5 and momentum = 0.5 or higher to provide the best trade-off between speed and stability. Correctly tuning hyperparameters via MMGD helps efficiently derive optimal convergence to the global minimum. The findings of this analysis are in Table 4, followed by short statements:
The analysis of gradient descent paths with varying learning rates and momenta demonstrates distinct path stability and convergence efficiency behaviours. For a learning rate of 0.05 and momentum of 0, the gradient descent (MMGD) algorithm progresses in small, incremental steps toward the global minimum (Yellow dot), achieving convergence with minimal erratic behaviour, as indicated by the red cross overlapping with the yellow dot. As the learning rate increases to 0.5, the steps become larger and more erratic, though the algorithm still finds the global minimum. The path becomes highly unstable at a learning rate of 0.8, but the algorithm converges to the global minimum with a highly erratic path. Introducing momentum (0.5) at various learning rates improves stability, making paths smoother and convergence faster. The most stable and efficient convergence is observed with a high momentum denoted as (0.9), particularly at higher learning rates, where the algorithm smoothly and quickly converges to the global minimum, indicating a balance between speed and stability in the optimization process. The minimum convergence values in the minimum gradient descent optimization process refer to the values at which the influence factors stop or stabilize significantly. The following graphs display the minimum convergence values for all influence categories. They converged strongly at 400 iterations and reached the desired state closer to zero, probably beyond 600 iterations.
Each plot corresponds to different influence levels and initial values that are iteratively adjusted to reduce the errors, leading to more efficient transformation decisions to maximize energy conversion while minimizing the loss. The variations of the y-axis define a consistent range for all subplots. The transformation plan of the influence over iterations shows divergent values diminishing gradually with each iteration, denoting effective convergence toward the desired rates. All convergences over iterations show a similar pattern and gradual alignments with different influence values affected by the energy source capacities required to replace.
The curves in Figure 9 display the iteration of the MMGD optimization process and the mean squared error (MSE) behavior. At the left side of the graph, where the iteration equals zero, the MSE is high, about 2.7 ×10⁷ indicates the significant variations between the desired and actual influence values. During the first few hundred iterations, the MSE value steeply declined, indicating the initial parameter updates were effectively moving toward the optimal values. The MSE curve slowed and flattened after 400 iterations, indicating that the algorithm was approaching the optimal solution. The error reduction becomes less significant at 600 iterations and so forth, with each subsequent iteration lasting up to 1000 iterations, demonstrating this slowness-diminishing behavior as the parameters get closer to the low error levels, which is the desirable outcome one wants to reach. The consistency around or close to zero value is defined as the successful reduction in error to the desired values. Figure 9 highlights the effectiveness of the GD optimization process. The downward trend on the y-axis towards zero indicates successful error minimization, rather than the planned capacity reaching zero at varying influence levels. Each curve reflects the proposed rate based on the influence level, and the observed reductions provide insights into the optimization process. This analysis showcases how the GD algorithm adeptly minimizes error across different influence levels, illustrating its adaptability.
As the number of iterations increases, particularly beyond 600, we see the most substantial adjustments in influence levels. The three LI, MI, and HI graphs highlight the influence change as a function of the amount of RE nominated for addition. The vertical y-axis in the graph’s sheds light on the magnitude of influence, where LI is around 4000 units, MI is up to 10000 units, and HI is the highest up to 20000 units.
The adjustment ratios vary across different RE resources and influence levels, representing the percentage increase or decrease required in specific energy sources to achieve the annual target leading up to the NZE in 2050. This simulation analysis is based on the current system status and future strategic plans for NZE, which can be shaped by various foreseeable and unforeseeable factors. As a result, involving stakeholders is crucial in selecting and modifying the appropriate strategic plan for NZE. As shown in Figure 10, the "High Influence" is the most effective for adjusting renewable energy capacity, though it carries a potentially high risk and high cost. On the other hand, " Low Influence" is minimal, and its reliability is also low. The " Medium Influence" adjustment offers a more balanced approach, indicating a moderate level of risk and likelihood, making it a viable path toward achieving NZE.
The gradient Descent algorithm optimized the grid system, aligning with the desired renewable energy rates, as evidenced by the final influence values. Renewable energy influences include solar, wind, water/hydro, biomass, and storage batteries, which display a proportional relationship across low, medium, and high influences. An acceptable level of consistency with the study limitations indicates the algorithm maintained predefined connections among various influence levels. Therefore, effective adjustments can be made between initial high values and final adjusted values, considering the actual influence and desired rates. The proportional scalability across multiple levels of influence demonstrates the transformational model's reliability in acting through various levels of influence, trading with the possibility of efficient resource allocations and effective energy management. The insights gained from this analysis can guide future planning and decision-making, ensuring a more efficient and adaptive energy system.
4. Key Insights and Future Outlook
4.1. Summary
The study’s key contribution is its emphasis on the capacity factor of renewable energy as a significant barrier to achieving NZE. The analysis and its interpretations are based on data from the Australian Energy Market Operator (AEMO). Building on several previous studies, our analysis emphasizes the importance of considering the capacity factor integration of RE and NRE during the transition process, especially when additional energy capacity is introduced to the grid system in the pursuit of NZE emissions. One of the aspects that was not precisely anticipated is how the gradient transience in the energy market structure less impacted the settlement of the future capacity of RE. This raises concerns about how effectively the system structure will adapt to the expanding role of RE in the notion of the future anticipated capacity factor. This study, therefore, explores the dependency of capacity factor improvements for adding renewable energy on four key variables: (1) Committed addition rate of RE, (2) Proposed addition rate of RE, (3) Anticipated addition rate of RE, and (4) Expansion/upgrade of RE infrastructure. Utilizing stochastic analysis within a Gradient Descent simulation model, the study integrates these dynamic factors alongside the penetration capacities of the five major renewable energy sources in Australia: (1) Wind, (2) Solar, (3) Hydro, (4) Battery storage, and (5) Biomass. It is important to acknowledge that the limitations in the available data, potentially due to proprietary constraints, have impacted the interpretation of the results.
The value of 1.0 represents the AEMO reference data in Table 3, indicating the target capacity as claimed by AEMO, with each reading equating to 100%. These values serve as the benchmark for comparison with the output data from the GD analysis. As shown in Table 6, the “Low Influence” scenario, with solar at 0.679 and wind at 1.43, indicates minimal capacity additions. While characterized by lower costs and risks, it is likely insufficient for supporting a strong energy transition. Water/hydro at 0.39, biomass at 0.22, and battery storage at 0.93 further reflect underinvestment in these areas, falling below the ideal 1.0 unit. The “Medium Influence” scenario, proposed as the most balanced option, involves solar at 3.39, wind at 7.16, water/hydro at 1.94, biomass at 1.10, and storage battery at 4.64. This scenario compromises between capacity, cost, and risk, with biomass and water/hydro closer to the ideal unit of 1.0, indicating more efficient capacity expansion, with solar at 6.79, wind at 14.33, water/hydro at 3.88, biomass at 2.19, and storage battery at 9.29. While maximizing the likelihood of meeting net-zero targets, this scenario carries substantial capacity, costs, and risks, potentially straining financial resources and management of the energy system. Rather than simply adopting a single influence scenario, improving transition efficiency is more important. This may require reconsidering the capacity factor and its role in ensuring a successful transition. The integration of renewable energy sources must not only increase capacity but also optimize their contribution to the overall system, ensuring that the transition is both effective and sustainable. From a technical perspective, the medium influence scenario strikes a balance by providing adequate capacity increases across key renewable energy sources, offering a more practical solution by mitigating the extremes of both underperformance and overinvestment. Relatively, this scenario could achieve a trade-off pathway to a scalable energy system that remains adaptive to uncertainties while maintaining a manageable risk and cost profile. This scenario allows for a more reasonable and gradual transition to a sustainable energy system, reducing potential financial strains while still effectively supporting Australia’s net-zero emissions goals. It is important to note that this interpretation of the analysis reflects the author’s perspective, which is informed by the data and trends observed within the stochastic modeling output process. The results of Gradient Descent stochastic analysis point toward the medium influence scenario as the most balanced and feasible option for the renewable energy transition. While less costly and risky, the low-influence scenario entails lower costs and minimal risk. However, the capacity increases projected under this scenario may be insufficient to effectively meet the net zero emissions target. On the other hand, the high-influence scenario, though promising in terms of capacity, carries a higher risk and cost burden, potentially straining system stability and investment feasibility, making it a less viable option.
Through industry consultation in 2023, AEMO developed three forward-looking scenarios, each aimed at guiding Australia’s energy transition in alignment with government policy and global climate goals. Those scenarios are depicted in Figure 11 below and defined as: (1) Step Change, (2) Progressive Change, and (3) Green Energy Exports (Australian Energy Market Operator, 2024). The step change scenario is designed to drive an energy transition that helps Australia fulfill its climate commitments, supporting a trajectory to keep global warming below 2oC. It emphasizes strong contributions from consumer energy resources (CER) and steady investment, making it the most balanced and achievable path. Progressive Change, meanwhile, aligns with Australia’s current policy framework, but anticipates a slower pace due to economic and supply chain challenges. In this scenario, investment in large-scale utility assets and CER faces delays, reflecting a more conservative approach to the transition. Lastly, the Green Energy Exports scenario envisions an accelerated decarbonization path to support global targets for a 1.5oC temperature limit. This rapid approach leverages strong electrification and an ambitious green export economy, placing Australia as a leader in low-emission energy exports. To ensure resilience, AEO’s Integrated System Plan (ISP) tests each scenario through to 2050. Following extensive consultation with over 30 experts across industry and government, AEMO assigned probabilities of 43% for Step Change, 42% for progressive Change, and 15% for Green Energy Exports. These scenarios provide a robust framework to guide Australia’s energy landscape, with Step Change emerging as the most probable path forward for a secure, low-emission future.
The analysis in this paper presents a detailed examination of the renewable energy (RE) Capacity Factor and aligns with AEMO’s scenarios to some extent but with distinct insights, particularly in emphasizing the Capacity Factor as a key challenge in achieving net-zero emissions (NZE). While AEMO’s report highlights different decarbonization pathways (Step Change, Progressive Change and Green Energy Exports), it does not explicitly single out the capacity factor of RE as a central barrier. Our study fills this gap, emphasizing the importance of understanding and integrating capacity factors for both RE and non-renewable energy (NRE) sources during the transition. This nuanced focus adds depth to AEMO’s scenarios by accounting for operational limitations in RE integration and the challenge of meeting demand sustainability. AEMO’s Step Change scenario reflects a balanced yet robust approach to meet Australia’s emissions targets, aligning with our “Medium Influence” scenario. However, our provided analysis concerns the barriers posed by uneven capacity factors across RE sources, showing that an optimally balanced capacity factor is crucial. The low Influence scenario in our analysis, which aligns with AEMO’s “Progressive Change” scenario, shows the risk of underinvestment and highlights that minimal capacity expansions in solar, wind, and renewables are insufficient for a robust transition. Similarly, AEMO’s Green Energy Exports scenario and our study reveal the financial strain and risk associated with aggressive capacity expansion, underscoring that while capacity increases are desirable, they must be managed to avoid resource strain and risks to system stability. The findings of technical balance and financial feasibility propose a Medium Influence scenario as the most feasible, akin to AEMO’s Steo Change in its balancing of capacity growth, cost and risk. This paper and AEMO’s report imply this scenario suggests a more practical approach to transition, maintaining stability and allowing for gradual, scalable expansion, highlighting a practical trade-off path. The stochastic optimization analysis in this study identifies Medium Influence as the most feasible pathway, reflecting the data-driven adaptation employed by AEMO’s scenario-based approach. However, by emphasizing capacity factor integration, we address how structural market changes and technical efficiencies influence RE performance in ways capacity factor optimization must directly quantify. In conclusion, AEMO’s report and the findings of this study converge on the value of a balanced approach (Medium Influence/ Step Change) to support a sustainable energy transition. .
Although finding a suitable projection model for enhancing renewable energy resources is not easy, but it is possible. Future projection modelling
of net zero emissions is a global scenario requiring substantial global coordination to agree on feasible objectives. Renewable energy projects under offset environmental assessments imply requirements to mitigate, monitor, and prevent undesirable impacts. At the same time, the strategic assessment of ecological offsets is required to avoid significant effects on protected plants, places, and animals. Thus, theoretical renewable projects without a clear road map and contracts are only relevant to possible future projects and cannot be counted as a new addition to the installed capacity. Renewable integration costs reflect an essential factor in grid integration, while a greater challenge than increasing renewable energy capacity for producing clean energy is when projecting this increase improperly.
4.2. Emerging Technologies and Innovations
Emerging technologies like green hydrogen, advanced solar cells, and nuclear power are vital renewable energy sources for achieving net zero emissions (NZE). Cutting-edge innovations in energy storage, carbon capture, and bioenergy actively support the seamless integration of variable renewable energy into the power grid. This section showcases these groundbreaking technologies.
4.2.1. The Future of Hydrogen Toward NZE
Global warming and government policy support sustainable energy for the future by using products like Hydrogen; otherwise, hydrocarbon products such as coal and gas are the options. Fortunately, the availability of Hydrogen represents 75% of the universe's mass, making it a promising sustainable energy source. This molecule of Hydrogen is often attached to another component and is impossible to find as a single atom, H2 can generate heat when burning with oxygen and also can generate electricity throughout fuel cells. The main difference between fossil fuel and hydrogen fuel is that hydrogen fuel does not generate CO2, which has the potential of zero carbon and Nitrogen Oxide products. Hydrogen from a carbon-free process can only be produced from water. Otherwise, the rest of the H2 can only be extracted from fossil fuel sources, which are also called hydrocarbon fuels. And the fact is more than 70% of Hydrogen production relies on fossil fuels. In this study, we are specifically concerned with the practical enablers and challenges of renewable energy generation systems. The practical concern of H2 is not occurring instantly and requires an equitable electricity supply, which solar power should do, and hydrocarbon products to extract hydrogen. In the matter of accepting H2 fuel as an alternative to fossil fuels, a spatiotemporal study in Australia might be worthwhile to provide a very clear answer to a couple of challenges concurrent with cost-effective like the intermittent source of renewable energy to supply electricity to H2 plants, the high pressure of storage capacity, safety and clear preference of H2 types based on their colours. In the context of hydrogen production, specific colour methods exhibit different processes that some may already be familiar with. However, common concerns surrounding all these hydrogen sources raise doubts about their current and future roles in achieving NZE. Key issues include the cost and source of electricity used for hydrogen generation, the intermittent nature of production, operational pressures exceeding 200 bars and reaching up to 800 bars, and the safety and cost of equipment required to operate hydrogen systems. It is crucial to reconsider these factors, particularly from a spatiotemporal perspective in the context of Australia (Elliston, MacGill & Diesendorf, 2013). Several studies evaluate hydrogen availability based on site availability and development and cost-effectiveness independently of the hydrogen location, which also depends on local energy resources such as solar and wind (Scovell & Walton, 2024); (Shobeiri et al., 2023). Thus, access to the infrastructure and water supply is the key to the economic model of hydrogen. Five years back, the Australian federal government adopted its national hydrogen strategy, aiming to put Australian hydrogen production at the front as a major global supplier by 2030. This momentum of the national strategy has not yet been heard in the local goal of NZE, where the H2 sharing is so humble compared to other RE sources. The economic assessments of hydrogen projects have relied mainly on several spatiotemporal segments of individual hydrogen projects in conjunction with regional infrastructure geospatial factors. Along with the hydrogen challenges discussed above, identifying regions favourable to several “grey, blue, green, pink, yellow” production methods remain unclear in the Australian hydrogen production plans and upon renewable energy NZE goal (Australian House of Representatives Committees, 2006). Some evidence in the published papers concerning the region's favoured locations to produce hydrogen reveals some spots highly ranked to produce hydrogen, benefiting from local infrastructure and investment capability. To summarise, Successful hydrogen production requires combining several factors mainly dependent on water resources, sufficient energy and reliable infrastructure, which directly affect the success of Hydrogen's capacity factor toward the NZE goal. With the uncertainty of hydrogen assessment toward NZE, the method to assess the capacity factor under today’s models tends to remain valuable in promoting H2 upon substantial changes and remaining competitive compared to other RE sources.
Hydrogen production could be grey Hydrogen when natural gas conversion, i.e. CH4 is steam heated (800 Co) and breaks down into Hydrogen and carbon monoxide, reacts with water and produces Hydrogen and carbon dioxide (one hydrogen ton releases ten carbon dioxide tons). Pink Hydrogen is produced via electrolysis powered by nuclear energy, which splits the water into oxygen and Hydrogen and generates clean power with low indirect carbon emission. Through electrolysis, yellow Hydrogen is powered by a mix of renewable and fossil fuel electricity. Blue Hydrogen engenders the grey Hydrogen. The CO2 produced from the grey hydrogen process is captured using carbon capture and storage (CCS) technology. This catch of CO2 has remaining Hydrogen collected but is now called blue Hydrogen. The key difference between blue and grey Hydrogen is that the CO2 emissions are controlled in the blue hydrogen stage, making it a more environmentally friendly option. Green Hydrogen is another type of hydrogen product family produced by using electricity in the polymer electrolysis membrane (PEM) of water, which only represents 3% of total hydrogen production. However, green Hydrogen introduces a good ratio of energy conversion efficiency of about 84%, while 1 kg of green Hydrogen requires 39KWh. Although Hydrogen safety is the matter, and hydrogen storage is the bottleneck, renewable energy such as Hydrogen minimises carbon footprint, adds cost competitiveness, positive public perspective and globe-friendly policy. Most Hydrogen (H2) programs opt for research directions to foster revolutionary advances in H2 production, delivery, storage, and conversion technologies. Understanding the possible risks of complex interactions between the components of H2 systems can be leveraged to reduce the environmental, societal and cost impacts. This breakthrough is needed to enable and enhance the evaluation of risk concepts and possible pathways. In renewable energy, the emphasis on Hydrogen no carbon will be on defining the knowledge of risk-based Hydrogen, which is the concern that enables us to realise what the expected risks are to adopt appropriate technology-based safety approaches. The generation of H2 is a process that can be achieved in multiple ways under several Hydrogen colour names like green, blue, grey, pink and yellow (Kreveld, 2021); (Walsh et al., 2021); (Scovell & Walton, 2024). Despite the complexity of these techniques, H2 molecules themselves are the simplest and lightest elements on Earth. This simplicity provides a reassuring foundation for understanding the more intricate aspects of H2 generation, such as its tendency to attract and attach to other elements.
It is crucial to have a clear understanding of the risks and benefits of hydrogen production. A carbon-free process can only be achieved from water H2O. At the same time, the rest of the products are hydrocarbons, such as CH4 and other products of fossil fuels, following the formula CXHY. H2's scientific properties form a combination reaction with other elements due to the flammability dangers of H2. Risk mitigation aims to increase the uptake of offshore green H2.
4.2.2. The Future of Nuclear Power (LR & SMR) Toward NZE
The strength of nuclear power is that it does not produce greenhouse gases that pollute the air. Nuclear power also produces less waste compared to other fossil fuel power plants. The International Atomic Energy Agency (IAEA) defined a scale of spent nuclear fuel (SNF) of 1000 MW nuclear reactors producing 30 tons of solid waste annually, while 1000 MW produced from coal plants causes 300,000 tons of ash (Zhang et al., 2019); (Lukens & Saslow, 2017) (Wallenius, 2019). However, nuclear wastes have undesirable characteristics that cause a high ecological risk (Vinoya et al., 2023).
Generally, designing renewable energy systems is influenced by technological, economic, environmental, and socio-political reasons, all of which have a cost estimate that challenges through two unique forms: (1) unprecedented technology in its design and efficiency; (2) and On-the-run costs and challenges after deploying the system (Graham, Hayward & Foster, 2023).
The uncertainty of nuclear power plants massively challenges developing countries seeking this technology due to continuous increases in capital costs, as displayed in Figure 12. For instance, in the 1970s, the capital cost of $100 KW increased to $6000 KW in 2008 and $10000 in 2009. This field of nuclear power-driven SMRs proposed a modular construction design that did not exceed 700 MW in power generation by considering the advantage of economic scales and expected future expansions. With the uncertainty of the cost of small-scale nuclear generators, projected costs expected SMR Cost to be 50-100% higher than the cost of large-scale nuclear in a range of $12500/KW to $16700/KW. For instance, Canadian SMR defined the cost as $8200/KW to $19100/KW.
In contrast, the US defined the SMR project cost as $10300/KW. Similarly, Australian publications provided costs for SMR projects of about $4800/KW and $6200/KW. However, Australia has no previous experience, so the cost would likely be higher than the premium estimations. Adding recent estimates from leading US projects (Utah Associated Municipal Power Systems), US SMR projects received design certification from the Nuclear Regulatory Commission before construction. However, it was temporarily cancelled due to the estimated cost increase of $31100 per KW. This cost is much larger than the average of 20% for other technology projects. Technology costs directly impact the electricity market modelling studies for planning and forecasting the investment in electricity projects and managing future electricity costs (Eerkens, 2006).
Despite more than seventy SM designs introduced globally, no one is currently under construction, and there is uncertainty about how future SMRs will be connected to the grid systems. Within the view of electricity regulators in 2023, the Senate committee in Australia estimated SMR development completion times require 15 years to first production, which is most of the time taken to revise the related regulations. Regardless of the date and time required to build SMR in Australia, there remains a very high likely level of uncertainty related to legislative changes (Graham, Hayward & Foster, 2023).
Nuclear energy is a reliable and environmentally friendly energy source compared to emissions generated from other energy sources. The nuclear agenda is a part of energy security, especially with the recent world energy crisis that was affected by events in Ukraine and other oil production countries. The escalated issue of annual CO2 gas emissions from the energy supply sector is estimated at 14.4 Gt in 2010. This estimate is also estimated to be tripled by 2050 compared to 2010. Several research studies have defined nuclear power as a partial substitute for fossil fuels for approximately 20% of the globe's energy requirements. The global state of nuclear power plants contains more than ten reactor types with a total capacity connected to the grid systems up to 39353 MW generated from 441 units. Reactors under construction found about 54517 MW for 53 reactors.
Meanwhile, 200 reactor units shuttered down were producing 96271 MW (Walsh et al., 2021). These statistics can predict an increase in reactor plant rate worldwide of about 13.84% and a shutdown rate mostly double of around 24.44%. Part of this is attributed to the reactors' life cycle exceeding 30 years old. Thus, the decommissioning rate of nuclear power plants becomes significant. Among these, the highest expertise of existing reactors in service units goes to the US (93 reactors), followed by France (56 reactors), then Russia (38 reactors), and Japan (33 reactors). More than 40% of nuclear plant fuel is supplied from four countries, namely, Kazakhstan (41%), Canada (13%), Australia (12%), and Namibia (10%). With this fact, Australia has no nuclear power generation yet, although its annual mass production of uranium exceeds 6500 tons (Alwaeli & Mannheim, 2022).
Large conventional reactors are an alternative, concurrent with a massive challenge toward the concept of performance. Factors such as finance, people, and time are a part of the nuclear choice. Regardless of the attention to net zero gas emissions, defining the issues and challenges of nuclear power requires further knowledge for practice reasons. The minimisation factor is a potential approach with nuclear thinking, which lowers capital costs, reduces risk and increases design simplifications and off-grid applications (Alwaeli & Mannheim, 2022). This makes smaller unit sizes an option to mitigate this issue and lower upfront costs and the complexity of operations. Providing a better return within a short investment time is essential in assessing renewable and non-renewable energy power generation sources. The construction of large reactors increases capital costs, and developing countries find it difficult to afford it and deliver the expected economic progress. Statistically, large reactor generator (LR) costs increase by 50-200% in countries like the US, Germany, France, and Canada. Meanwhile, for other renewable energy sources, their cost continuously decreases, i.e., PV decreases by 10-25%, and wind energy decreases by 21-43%. Nuclear (SMR).
Nuclear power plants are a critical decarbonization source in reducing greenhouse gases in the energy industry. Worldwide, developing local electricity generation projects of small nuclear modular reactors (SMR) is identified as a carbon-free power project (CFPP) with an expected gross capacity of 462 MW (Graham, Hayward & Foster, 2023). It is claimed that SMRs are categorized into six types based on their coolant type, location, and neutron energy (Alwaeli & Mannheim, 2022).
The advantage of a smaller modular reactor is that it typically can be shop fabricated and easily transported as a module to a site for installation and power generation. Also, the learning scale and construction schedule provide a fast iterative process, adding more experience and learning-driven effectiveness improvements. Refueling is only needed once every 2-10 years. Generating thermal heat causes Riskless with smaller nuclear reactors. Nevertheless, several issues are concurrent with the full adoption of SMR plants, determining the country's suitability for this type of investment and the areas of improvement. The lack of safety culture with this type of technology increases the challenges, including cost, waste, safety, and proliferation. People have been concerned about witnessing previous incidents such as Chornobyl, Fukushima, and Three Mile Island. This concern seizes the idea of not-in-my-backyard behaviour as one of the weaknesses that limit the deployment of nuclear power. Therefore, societal acceptance is confronted at the front and arises due to safety concerns driven by technology sustainability. Technically, Germany decided to ban nuclear power use by 2022, while other countries such as Finland, China, Saudi Arabia, the US, Turkey, UAE, the UK, France and Hungary are pursuing this goal.
This required further study to assess and predict expected scenarios related to the mentioned indicators. The barriers of those SMR designs do not show a substantial factor in competing in the marketplace from a technical perspective, including a lack of regulatory permission and approval. These prototype uncertainties arising from different aspects of nuclear power capacity systems could be partially clear with the targeted new capacity (Elliston, MacGill & Diesendorf, 2013). The following prediction is based on the preliminary information in the literature and recent applications of nuclear power plants.
4.2.3. Carbon Capture and Storage (CCS)
In line with the efforts to combat climate change and reduce global emissions, CCS serves as a vital mitigation tool, particularly for industries that are difficult to decarbonize, such as steel, cement, and chemicals. CCS is recognized as a crucial technology for achieving NZE in scenarios where RE alone cannot entirely eliminate greenhouse gas emissions. The central argument for transitioning to NZE includes understanding that geo-sequestration facilitated by CCS is essential for securely capturing and storing CO2 to prevent its release into the atmosphere, thereby reducing CO2 emissions.
Besides coal production, clean energy sources like hydrogen also produce CO2, particularly in the form of grey Hydrogen. While coal is abundant across Australia, implementing CCS in coal plants remains underdeveloped and less common, hindering the integration of CCS with other RE sources to fully eliminate CO2 emissions, a goal worth pursuing in the future (Zaghwan, Gunawan & Efatmaneshnik, 2024); (Gunawan, Indra & Ashraf Zaghwan, 2022); (Zaghwan, Ashraf et al, 2026). The application of CCS to hydrogen, particularly blue hydrogen, is essential for transitioning to a hydrogen economy while still utilizing existing natural gas infrastructure. CCS has varying impacts depending on the type of hydrogen produced, whether grey, blue, green, pink or yellow. Notably, green and pink hydrogen do not generate CO2 emissions except when accounting for emissions related to the lifecycle costs of electricity, added to the baseline cost corresponding to lifecycle commissioning and decommissioning requirements.

Table 2.
Annual Gas Emissions in Australia by Sector (Marshall, 2016).
| Sector Annual Emissions (Mt CO2-e) | 2023 - Emissions (Mt CO2-e) | 2024 - Emissions (Mt CO2-e) |
| Energy -Electricity | 153.8 | 151.1 |
| Energy-Stationary energy excluding electricity | 101.6 | 100.7 |
| Energy Transport | 95.7 | 98.2 |
| Energy – Fugitive emissions | 47.9 | 47.1 |
| Industrial processes and product use | 32.7 | 32.5 |
| Agriculture | 85.7 | 85.1 |
| Waste | 13.9 | 13.9 |
| Land Use, Land Use Change & Forestry | -88.4 | -88.4 |
| National Inventory Total | 442.9 | 440.2 |
Ferguson, M., & Ashworth, P. (2021) align with Gardezi and Arbuckle's interpretation of “human techno-optimism”, emphasising human ingenuity in addressing challenges like climate change. While there is a clear public preference for renewable energy technologies, techno-optimism tends to increase support for CCS when associated with nuclear, biomass, gas and coal sources but decreases support for renewable energy, especially hydroelectricity and wind (Australian House of Representatives Committees, 2006). Despite CCS being a key technology for controlling and reducing energy emissions, it also highlights the misalignment between pro-environmental attitudes and the inconsistency in federal government policies, such as energy infrastructure changes that may conflict with public preference. CCS technology undeniably serves as a vital intermediary between RE and NRE resources, supporting the stabilization of the grid and facilitating negative emissions. Unlike fossil fuels, which contribute to higher emissions, clean energy inherently reduces them.
Australia’s annual CO2 emissions total approximately 440.2 million tonnes. In the electricity sector, 38% of total annual CO2 emissions generate roughly 0.6167 kg of CO2-e pr kWh, with associated costs ranging from 3.1 to 4.0 Australian Cents, as shown in Table 2. The estimated cost for CO2 storage and monitoring varies between $1 and $17 per tonne of CO2 Ferguson, M., & Ashworth, P., 2021; Australian House of Representatives Committees, 2006; Marshall, 2016). Simply put, CCS-driven geo-sequestration is a crucial process that involves three key steps: capturing CO2 from emission sources, separating it from other gases, transporting the CO2 via pipelines to a storage site, and injecting it into deep underground geological formations, such as unamenable coal seams, oil and gas fields, or saline aquifers, where the CO2 is securely trapped.
4.3. Complexity of Transition with Inherent Tensions
AEMO, through Integrated System Plans (ISPs), provides a comprehensive analysis of Australia's national electricity market to inform future power system needs (Integrated System Plan for the National Electricity Market, 2024). ISP has been developed over two years with input from stakeholders such as planners, policymakers, consumers, and industry; it prioritizes reliable, secure, and affordable electricity while aligning with NZE goals. The ISP Scenario-based planning for integrating NEM modelling optimizes generation, firming, and transmission needs. ISP tasks fulfil its regulatory scopes by setting a robust plan to expand to address gas integration, demand forecasts, coal withdrawal, system security, and alignment with state policies.
The energy transition represents a once-in-a-country transformation in how energy is generated, stored, distributed, and utilised across the economy. As coal generators are phased out, renewables emerge as the lowest-cost replacement, supported by transmission and distribution networks, firmed with storage, and backed by gas-powered generation. Projections indicate that the NEM power system must nearly triple its installed capacity within the next 30 years to meet future demands. AEMO has partnered with consumers, the energy industry, the government and the community to develop a clear plan for the essential infrastructure needed to meet future energy demands.
Households and businesses are shaping energy futures by adopting innovative solutions to invest in ‘Customer energy resources’ (CER), solar batteries and electric vehicles and participating in virtual power plants (VPPs). Effectively coordinating these resources enhances energy reliability and security, reduces the need for traditional grid-scale investments, and cuts energy sector emissions.
The transition to NZE is critical, with timing essential before coal fully retires. An orderly exit mechanism, guided by the energy minister, is being developed to support the transition while investments in clean technologies and infrastructure progress rapidly. While urgency is key, rushing poses risks. Market rules, supply chains, transmission challenges, skilled workforce policies, and community engagement are factors that must be carefully integrated and managed.
One of the areas of attention lies in integrating the wide variety of technologies, both small and large, required for a multi-gigawatt clean energy system. However, Australia’s processes for registering, connecting, and commissioning new resources are well-regarded internationally and continue to improve; in this matter, AEMO recognizes the need for further streamlining. Another involves transitioning from coal to renewables. Coal generators have long been the backbone of the power system. As they are going to phase out entirely, AEMO and other planning bodies are rapidly adapting to the innovations and standards required for a power system dominated by RE. This goal required collaborating with global system operators and research institutions to share knowledge and best practices.
Communities’ engagement is a source of complexity in hosting infrastructure essential for Australia’s energy future while ensuring they share in the benefits alongside new industries, regional areas, and urban households and businesses. Encountering these developments involves responding to farmers’ rights to farm, the harmony of rural life, and the cultural practices of Aboriginal and Torres Strait Islander peoples. Thus, trust and delivering promised benefits are key to gaining community acceptance for NE projects. The intersection challenge with people and populations occurs when households, businesses, and communities have invested in their energy resources. Excess electricity from rooftop solar and batteries can sometimes help balance individual and system-wide energy needs; these resources can reduce large-scale infrastructure and significantly lower the costs of the energy transition. To sum up, the following ten key factors (knowledge areas) conclude the influencing NZE transition as defined by AEMO via ISP and illustrated in Figure 13, followed by 10 concluded points (Integrated System Plan for the National Electricity Market, 2024):
The spiral model introduced in Figure 13 has been used as a foundational framework for understanding knowledge flow. In the later stages of this research paper, we call this model because its methodology aligns well with systems analysis and design, particularly in the context of prototyping. The spiral model uses a gradual, iterative process that mirrors the gradient descent approach, where each cycle refines the system, progressively bringing it closer to the desired outcome. In terms of design to manage risk, the spiral model repeats project steps in iterative cycles, starting with modest goals and expanding outward in wider spirals, called rounds; each round represents a phase of the project and can follow a traditional development methodology, like the modified waterfall. A risk analysis is conducted at each cycle, identifying potential flaws early on, which can be addressed more easily in the early stages, ultimately reducing the overall risk of the project. This approach ensures that large risks are identified and mitigated early. Adding clarity and value to this model, we merge the spiral model with the quadrant power/influence grid from stakeholders’ analysis, as outlined in the PMBOK. This grid categorizes stakeholders based on their authority, “Power”, and involvement, “Influence”, in the project. Combining these models, we gather quantitative and qualitative data to understand stakeholders’ interests, expectations, and influence. This integration helps build coalitions and partnerships, increasing the project’s chances of success while managing risks throughout the iterative cycles of the spiral model design (Project Management Institute, 2021).
The replacement of coal generators with RE must prioritize the lowest-cost energy source, integrating storage solutions backed by gas-powered generation to ensure firming capacity. Alongside this, a significant infrastructure expansion is needed, including tripling the NEM’s installed capacity within 30 years to meet future energy demands. This objective matches the “medium influence” solution proposed by the MMGD analytical approach in this study (please refer to sections 3 and 4). Additionally, adopting Consumer Energy Resources (CER), such as solar systems, batteries, electric vehicles (EVs), and virtual power plants (VPPs), can improve reliability, reduce grid-scale investments, and cut emissions. Timing is a critical factor for an Orderly Transition, requiring RE capacity to be in place before coal retirements. Thus, developing mechanisms to manage the orderly exit of coal generators, guided by energy ministers, must be implemented. Furthermore, streamlining processes to improve new energy resource registration, connection, and commissioning is essential. This also requires addressing challenges in transmission, market rules, and supply chains. In addition, collaborating with global operators and research institutions will foster innovation and standards for renewable-dominated systems (g., solar, wind).
Equally important, Community Engagement is crucial to building trust and benefits shared with communities hosting energy infrastructure while addressing concerns related to farmers’ rights, rural harmony, and cultural practices of Aboriginal and Torres Strait Islander peoples. To support this, policies must ensure a skilled workforce is available, and market rules align with the energy transition needs. Aligning market rules and policies with energy transition needs. On a global scale, collaboration and knowledge-sharing with international operators will help adopt best practices. Finally, decentralized resources like rooftop solar and batteries can reduce reliance on large-scale infrastructure, improving cost efficiency and system security during the shift to the RE grid.
4.4. Recommendations for the Renewable Energy Transition
Assessing the extent of RE transition is affected by numerous factors, indicating that the relationship between RE and NRE extends beyond a simple linear equilibrium. Several studies have examined electricity markets governed by rules encompassing interconnections between renewable energy sources (RE) and non-renewable energy sources (NRE). Reducing CO2 emissions could be a challenge to many sectors, such as steel production, cement production, industrial heat, large-scale machinery, and heavy transport (Australian House of Representatives Committees, 2006). Various models have been proposed to develop a structured approach for capturing appropriate transients, incorporating a range of independent variables and linear approaches. However, the pivotal transient structure from RE to NRE on the path to NZE remains insufficiently developed. Accurately assessing the extent of the RE transition is tricky and complex due to the multivariate factors that undermine the reliability of linear capacity factor measures of RE and NRE. These linear solutions are significantly affected by non-linear measures of spot prices and wholesale rates, complicating the understanding of flexibility and hard positioning on the electricity dispatch merit curve to achieve net-zero emissions (NZE). Thus, one of the current transient issues is that indices for RE capacity do not align well with market dynamics, revealing shortcomings in transient structure and unrealistic system transition measures. Managing energy sources separately limits the effective integration of all RE sources. Consequently, a coherent transient structure from RE to NRE toward NZE is lacking, with this gap relying heavily on the dynamics of demand and generation. Given the significant trade-offs between various energy sources, it is unsurprising that the cause-and-effect relationships in the chain of events of RE transition are not well managed. This lack of clarity in management can be particularly problematic when multiple energy sources intersect.
4.5. Technological Cost, Site and Ecological Impact
Creating new operational strategies that account for energy sources' costs would be critical to developing Australia's future energy mix. Much criticism exists of the feasibility of shifting from fossil fuels to renewable energy. The up-to-date capital cost of electricity commissioned by AEMO provides a foresight projection of future changes in electricity costs concurrent with the requirements of global climate policy.
Where;
AEMO: Australian Energy Market Operator (40% industry-owned)
AEMC: Australian Energy Market Commission (Energy market rule setting)
COAG: Council of Australian Governments (Peak intergovernmental forum)
AER: Australian Energy Regulator (Energy market economic regulator & rule enforcement)
SCER: Standing Council on Energy &Resources (Energy market policy development)
GenCost: Generation Cost annual report
CSIRO: Commonwealth Scientific and Industrial Research Organization (operating and constituted under the provisions of science and industry research)
The capital costs of different technologies are relatively linked to each other, where unique material sets, supply chains, and lifetimes are unequal. 20% of the cost increase is attributed to various technologies. The cost of onshore wind generation technology increased by 8%. Oppositely, the cost of large-scale solar farms decreased by 8% and rooftops by 2%. The technological cost of gas turbines added 14% to their previous capital cost. Other technologies were relatively steady. The projection of the levelized cost of electricity (lcoe) is an estimation of $/MWh involving up to forty technologies in Australia. It takes into account several comprehensive assessment factors for operation prediction, concluded in the following formulas:
5. Conclusions
By taking the final perspective, the comparison metrics of lcoe are alarming in the probable low and high technological cost. However, the retirement of existing fossil fuel and renewable energy capacity forces future investment in power synthesis sources to keep flexible capacity and provide reliable support to the grid system. This unforeseen scenario is defined via additional integration costs of variable renewable energy (VRE) sources, which incur additional transmission and integration costs. The VRE ingression estimate was between $34/MWh and $41/MWh in 2023. The prediction of this figure in 2030 was much lower, between $25 and $34/MWh. The VRE cost, including integration costs, was the lowest among all new-build technologies up to 2030. The coal bottom margin overlaps with VRE sources, with a condition of delivering power with a high-capacity factor, implying low-cost fuel and financing at the rate of denying climate policy risk of gas emissions, which is not competitive. Gas generation with carbon capture and storage is the next nominated generation technology. Clean energy, like nuclear power from small modular reactors (SMRs), lies between renewable and fossil fuel and proposes a higher cost hit of 70% compared to other technologies, averaging up to 20%. Storage technologies are based on various types and operational durations. Concentrating solar thermal (CST) allows 14 hours of storage; pumped hydro energy storage (PHES) and adiabatic compressed air energy storage (A-CAES) all lack enough information in $/MWh to come up with a clear idea of which technology is preferred over others (Trainer, 2019). Also, the costs of generation, storage, and hydrogen technologies are increasing rapidly. Two factors cause this inflation: raw material costs and increased freight rates, where solar and wind modules are most impacted. However, longer storage durations increase capital costs, which is most costly for storage battery technology during the low-storage-period of application. Among these challenges, solar and wind remain the fastest-growing renewable energy sources, leading the global effort to expand electricity generation and achieve the Net Zero Emissions(NZE)target by 2050. The quest for suitable engagement to provide the lowest-cost subsidy extends beyond technology expenses, encompassing a multitude of political, economic, societal, and environmental challenges. In alignment with this approach, generation cost projections for various challenges must constantly align with the NZE objective.
In addition to what we have discussed above, the simulation of low-carbon electricity systems with a continuously increasing share of RE toward NZE has been widely researched at national and global levels. Conducting sufficient simulations that account for spatiotemporal resolutions is crucial to ensure reliable settings. This is essential to accurately determine the capacity factors needed to balance the increasing integration rates of renewable energy sources. Mengyu Li et al., findings are drawn from several simulations of the generating capacity to meet Australian and global demands: “Europe, North America, Northeast Asia, Southeast Asia, United States, Germany, Denmark, Finland, Ireland, China, and Australia.” This study covered the assessment of several grid systems, i.e., 30 grids in Europe, 33 grids for Southeast and Northeast Asia, 13 grids for the United States, and 43 cells for Australia. Most of those studies concern the goal of least-cost configuration based on time, space, and optimization methods. However, the temporal factor is limited to certain time slots, and the space factor lacks generation and transmission topologies, causing low spatial resolution (Quarterly Energy Dynamics Q1 2024). Under certain analytical contexts, the optimization results from simulations in most of these studies are assumed to be linear based on the prior dispatch order. In Australia's transition to renewable energy, the Australian Government is placing significant emphasis on protecting the environment and promoting ecologically sustainable development. Several annual reports and studies are pivotal in updating cost estimates for future newly built electricity power generation in Australia to achieve net zero emissions by 2050. This collaboration between AEMO and CSIRO aims to provide unbiased, up-to-date economic information, as depicted in Figure 14. The study provides a broad view of both non-renewable and renewable energy sources, including natural gas, coal, small nuclear modular reactors, onshore and offshore wind, solar thermal, pumped hydro, bioenergy, batteries, and hydrogen electrolyzers, with projections focused on the year 2050. This comprehensive approach also addresses concerns about the feasibility of pre-2030 projects, which may underestimate the barriers and cost challenges associated with the renewable energy transition.
Authorship Contribution Statement: Dr Ashraf Zaghwan: Conceptualization, investigation, project administration, methodology, software, data analysis, visualization, writing original draft, review and editing. Professor Indra Gunawan: Conceptualization, investigation, project administration, methodology, software, data analysis, visualization, writing original draft, review and editing. Dr Yousef Amer: Conceptualization, investigation, project administration, methodology, data analysis, visualization, writing original draft, review and editing.
Funding
This research was funded by a grant from the FAME (Foci And Magnets for Excellence) Sustainability Strategy at the University of Adelaide in Australia, which is dedicated to developing and accelerating solutions that promote sustainability, equity, and prosperity for both the planet and its inhabitants, all driven by groundbreaking research.
References
- Ritchie, Hannah. "Sector by sector: where do global greenhouse gas emissions come from? " Published online at OurWorldInData.org. 2020. Available online: https://ourworldindata.org/ghg-emissions-by-sector'.
- CSIRO. GenCost: annual electricity cost estimates for Australia. Www.csiro.au. 2023. Available online: https://www.csiro.au/en/research/technology-space/energy/Energy-data-modelling/GenCost.
- Graham, P.; Hayward, J.; Foster, J. GenCost 2023-24: Consultation draft; CSIRO, Australia, 2023. [Google Scholar]
- Coal, Australian Government. Geoscience Australia, 2024. Available online: https://www.ga.gov.au/digital-publication/aecr2022/coal#references-section.
- Quarterly Energy Dynamics Q1 2024. 2024. Available online: https://aemo.com.au/-/media/files/major-publications/qed/2024/qed-q1-2024.pdf?la=en#:~:text=Increases%20in%20black%20coal%2Dfired.
- McConnell, D.; Sandiford, M. Impacts of LNG Export and Market Power on Australian Electricity Market Dynamics, 2016–2019. Curr. Sustain. Renew. Energy Rep. 2020, 7, 176–185. [Google Scholar] [CrossRef] [PubMed]
- Li, M.; Lenzen, M.; Yousefzadeh, M.; Ximenes, F. A. The roles of biomass and CSP in a 100 % renewable electricity supply in Australia. Biomass Bioenergy 2020, 143, 105802. [Google Scholar] [CrossRef]
- Generation information Aemo.com.au; AEMO. 29 July 2024. Available online: https://aemo.com.au/en/energy-systems/electricity/national-electricity-market-nem/nem-forecasting-and-planning/forecasting-and-planning-data/generation-information.
- Csereklyei, Z.; Anantharama, N.; Kallies, A. Electricity market transitions in Australia: Evidence using model-based clustering. Energy Econ. 2021, 103, 105590. [Google Scholar] [CrossRef]
- Zaghwan, A.; Gunawan, I. Energy Loss Impact in Electrical Smart Grid Systems in Australia. Sustainability 2021, 13, 7221. [Google Scholar] [CrossRef]
- Keck, F.; Lenzen, M.; Vassallo, A.; Li, M. The impact of battery energy storage for renewable energy power grids in Australia. Energy 2019, 173, 647–657. [Google Scholar] [CrossRef]
- Sarunac, N.; Khalesi, J.; Khuda, M.A.; Mancini, R.; Kulkarni, P.; Berger, J. Energy Storage Improves Power Plant Flexibility and Economic Performance. Energies 2024, 17, 2775. [Google Scholar] [CrossRef]
- Gilmore, J.; Nelson, T.; Nolan, T. Firming Technologies to Reach 100% Renewable Energy Production in Australia’s National Electricity Market (NEM). Energy J. 2023, 44(6), 189–210. [Google Scholar] [CrossRef]
- Eerkens, J.W. The Nuclear Imperative: A Critical Look at the Approaching Energy Crisis; Springer: Dordrecht, The Netherland, 2006; p. 160p. ISSN ISBN 1402049307. [Google Scholar]
- Ferguson, M.; Ashworth, P. Message framing, environmental behaviour and support for carbon capture and storage in Australia. Energy Res. Soc. Sci. 2021, 73, 101931. [Google Scholar] [CrossRef]
- Elliston, B.; MacGill, I.; Diesendorf, M. Least cost 100% renewable electricity scenarios in the Australian National Electricity Market. Energy Policy 2013, 59, 270–282. [Google Scholar] [CrossRef]
- McConnell, D.; Sandiford, M. Impacts of LNG Export and Market Power on Australian Electricity Market Dynamics, 2016–2019. Curr. Sustain. Renew. Energy Rep. 2020, 7, 176–185. [Google Scholar] [CrossRef]
- Department of Climate Change; Energy; the Environment and Water. Incorporating preliminary emissions up to June 2024 Australia’s National Greenhouse Accounts. Quarterly Update of Australia’s National Greenhouse Gas Inventory: March 2024. March 2024. Available online: https://www.dcceew.gov.au/sites/default/files/documents/nggi-quarterly-update-march-2024.pdf.
- Kreveld, Phil. Hydrogen, the new energy source for Australia. In Electrical Connection; 2021; pp. 14–16. [Google Scholar]
- Walsh, S. D. C.; Easton, L.; Weng, Z.; Wang, C.; Moloney, J.; Feitz, A. Evaluating the economic fairways for hydrogen production in Australia. Int. J. Hydrogen Energy 2021, 46(73), 35985–35996. [Google Scholar] [CrossRef]
- Scovell, M.; Walton, A. Blue or Green? Exploring Australian acceptance and beliefs about hydrogen production methods. J. Clean. Prod. 2024, 444, 141151. [Google Scholar] [CrossRef]
- Shobeiri, E.; Genco, F.; Hoornweg, D.; Tokuhiro, A. Small Modular Reactor Deployment and Obstacles to Be Overcome. Energies 2023, 16, 3468. [Google Scholar] [CrossRef]
- The economic benefits and costs of CCS. 2006. Available online: https://www.aph.gov.au/parliamentary_business/committees/house_of_representatives_committees?url=scin/geosequestration/report/chapter6.pdf.
- Zhang, Q.; Huang, Y.; Sand, W.; Wang, X. Effects of deep geological environments for nuclear waste disposal on the hydrogen entry into titanium. Int. J. Hydrogen Energy CrossRef. 2019, 44, 12200–12214. [Google Scholar] [CrossRef]
- Lukens, W.W.; Saslow, S.A. Aqueous synthesis of technetium-doped titanium dioxide by direct oxidation of titanium powder, a precursor for ceramic nuclear waste forms. Chem. Mater. CrossRef. 2017, 29, 10369–10376. [Google Scholar] [CrossRef]
- Wallenius, J. Maximum efficiency nuclear waste transmutation. Ann. Nucl. Energy CrossRef. 2019, 125, 74–79. [Google Scholar] [CrossRef]
- Vinoya, C.L.; Ubando, A.T.; Culaba, A.B.; Chen, W.-H. State-of-the-Art Review of Small Modular Reactors. Energies 2023, 16, 3224. [Google Scholar] [CrossRef]
- Alwaeli, M.; Mannheim, V. Investigation into the Current State of Nuclear Energy and Nuclear Waste Management—A State-of-the-Art Review. Energies 2022, 15, 4275. [Google Scholar] [CrossRef]
- Trainer, T. Some questions concerning the Blakers et al. case that pumped hydro storage can enable 100% electricity supply. Energy Policy 2019, 128, 470–475. [Google Scholar] [CrossRef]
- Tian, Y.; Zhang, Y.; Zhang, H. Recent Advances in Stochastic Gradient Descent in Deep Learning. Mathematics 2023, 11, 682. [Google Scholar] [CrossRef]
- Marshall, J. P. Disordering fantasies of coal and technology: Carbon capture and storage in Australia. Energy Policy 2016, 99, 288–298. [Google Scholar] [CrossRef]
- Australian Energy Market Operator. 2024 Integrated System Plan for the National Electricity Market, A roadmap for the energy transition. 26 June 2024. Available online: https://www.dieselduck.info/machine/02%20propulsion/2012%20MAN%20Basic%20Ship%20Propulsion.pdf.
- Zaghwan, A.; Gunawan, I.; Efatmaneshnik, M. Analytical Research of Energy Loss in Electrical Grid Systems. In Frontiers of Performability Engineering. Risk, Reliability and Safety Engineering.; Karanki, D.R., Ed.; Springer: Singapore, 2024. [Google Scholar]
- Gunawan, Indra; Zaghwan, Ashraf. Energy Losses Analysis for Electrical Grid Systems. In 2022 IEEE International Conference on Industrial Engineering and Engineering Management (IEEM); IEEE, 2022; p. 0696. [Google Scholar]
- Zaghwan, Ashraf. ‘A Cleaner Demand-Side Management Approach Utilizing Hybrid Fractal-Fuzzy Intelligence for Energy Loss Reduction in Smart Energy Systems’ (2026). In 33 Cleaner Engineering and Technology. [CrossRef]
- Zaghwan, A.; Amer, Y.; Efatmaneshnik, M.; Gunawan, I. Advancing System of Systems Engineering Using Intangible Value Logic Measurements from Intellectual Capital Thinking Approach. Heliyon 2024, e39814-. [Google Scholar] [CrossRef] [PubMed]
- Zaghwan, A.; Amer, Y.; Efatmaneshnik, M.; Abdussamie, N. Monitoring Energy-Loss-Driven-Cost by Using Earned Value Simulation in Complex Systems. J. Energy Power Technol. 2024, 6(1), 004. [Google Scholar] [CrossRef]
- Zaghwan, A. S. The contribution of complexity theory in resolving energy losses in electrical smart grid systems: a case study of electricity supply and use in regional New South Wales – Australia; 2017. [Google Scholar]
- Zaghwan, A.; Gunawan, I. Resolving energy losses caused by end-users in electrical grid systems. Designs 2021, 5(1), 23. [Google Scholar] [CrossRef]
- Gilmore, N.; Koskinen, I.; Burr, P.; Obbard, E.; Sproul, A.; Konstantinou, G.; …; Bruce, A. Identifying weak signals to prepare for uncertainty in the energy sector. Heliyon 2023, 9(11), e21295. [Google Scholar] [CrossRef] [PubMed]
- Xue, Y.; Tong, Y.; Neri, F. A hybrid training algorithm based on gradient descent and evolutionary computation. Appl. Intell. 2023, 53(18), 21465–21482. [Google Scholar] [CrossRef]
- Wu, X.; Ye, X.; Han, D. A family of accelerated hybrid conjugate gradient method for unconstrained optimization and image restoration. J. Appl. Math. Comput. 2024, 70(4), 2677–2699. [Google Scholar] [CrossRef]
- Yin, J.; Jian, J.; Jiang, X.; Liu, M.; Wang, L. A hybrid three-term conjugate gradient projection method for constrained nonlinear monotone equations with applications. Numer. Algorithms 2021, 88(1), 389–418. [Google Scholar] [CrossRef]
- Abo-Khamis, M.; Im, S.; Moseley, B.; Pruhs, K.; Samadian, A. A Relational Gradient Descent Algorithm For Support Vector Machine Training. In arXiv; Cornell University, 2020. [Google Scholar] [CrossRef]
- Heaton, J. Ian Goodfellow, Yoshua Bengio, and Aaron Courville: Deep learning. Genet Program Evolvable Mach. 2018, 19, 305–307. [Google Scholar] [CrossRef]
- Goodfellow, I.; Bengio, Y.; Courville, A. Deep learning; The MIT Press, 2016. [Google Scholar]
- Boje, D.M.; Baca-Greif, H.; Intindola, M.; Elias, S. The episodic spiral model: a new approach to organizational processes. J. Organ. Change Manag. 2017, Vol. 30(No. 5), 683–709. [Google Scholar] [CrossRef]
- Boehm, B.; Turner, R. The incremental commitment spiral model (ICSM): principles and practices for successful systems and software. ACM Int. Conf. Proceeding Ser. 2015, 24-26-, 175–176. [Google Scholar] [CrossRef]
- Project Management Institute; Project Management Institute. A guide to the project management body of knowledge (PMBOK guide), 7th ed.; Project Management Institute, 2021. [Google Scholar]
Figure 1.
Influential Capacity Factors on Generation Capacity.
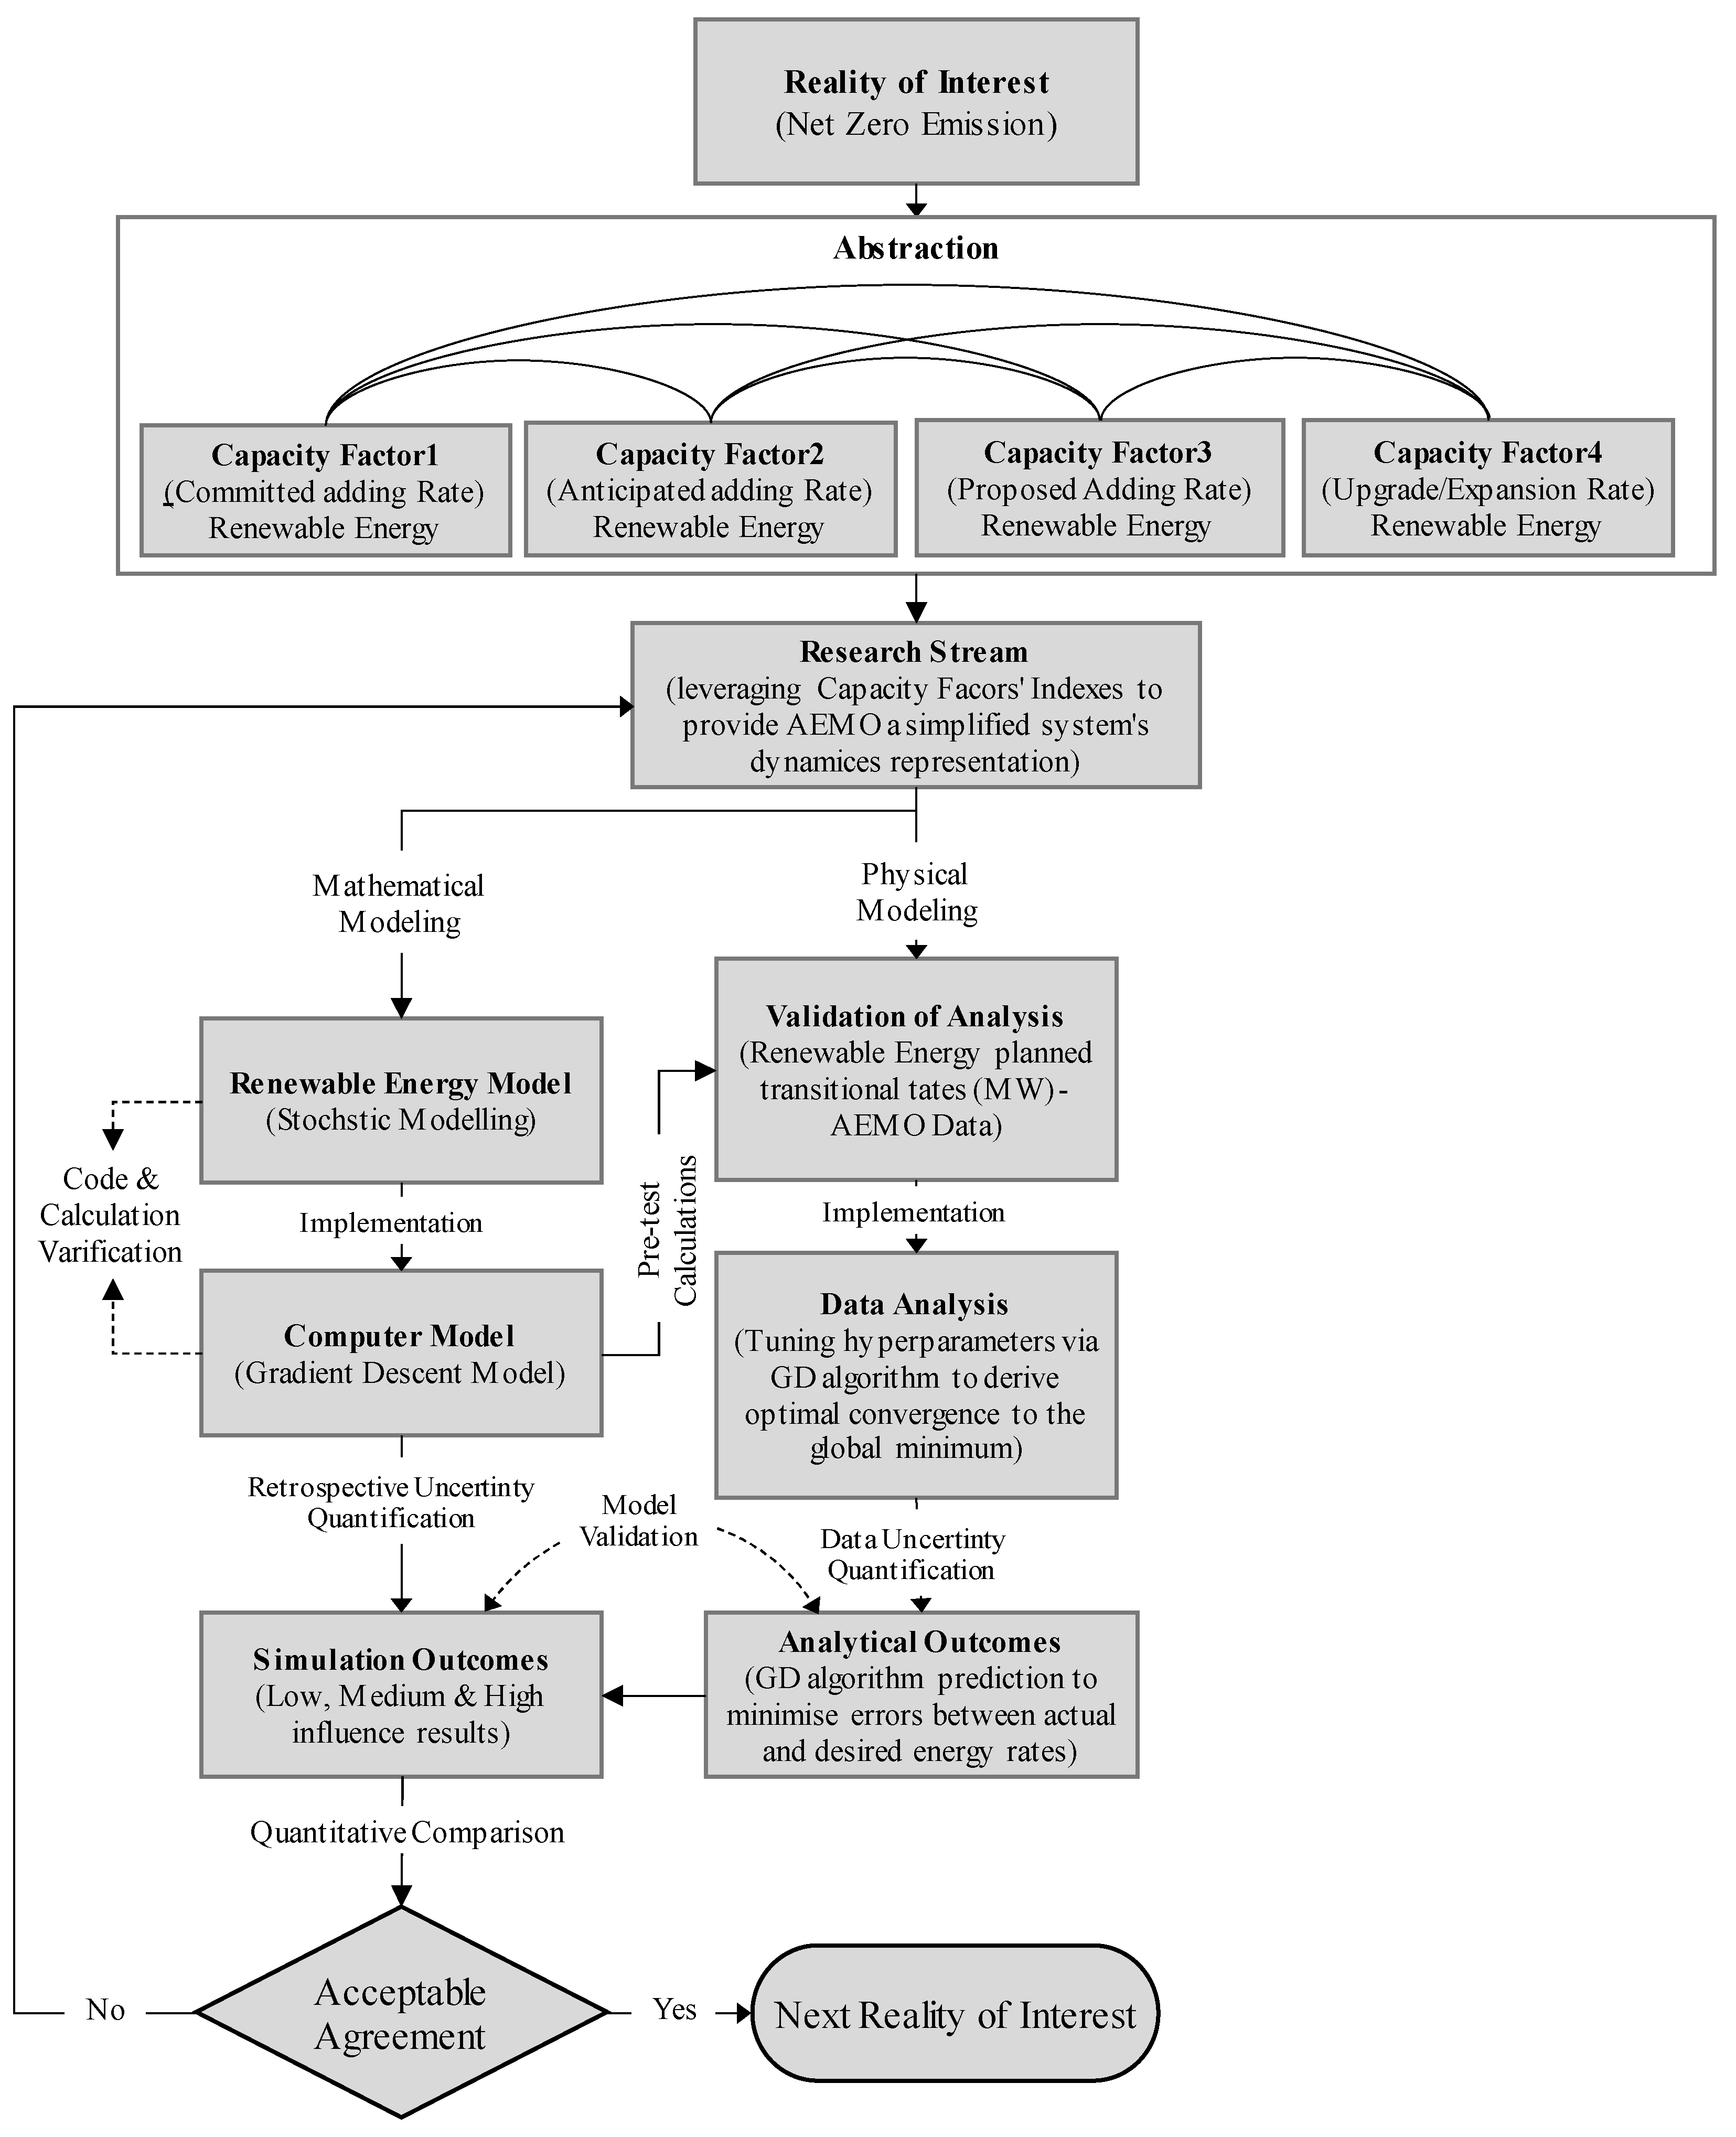
Figure 2.
Australian Coal (Australian Government, Geoscience Australia, 2024).
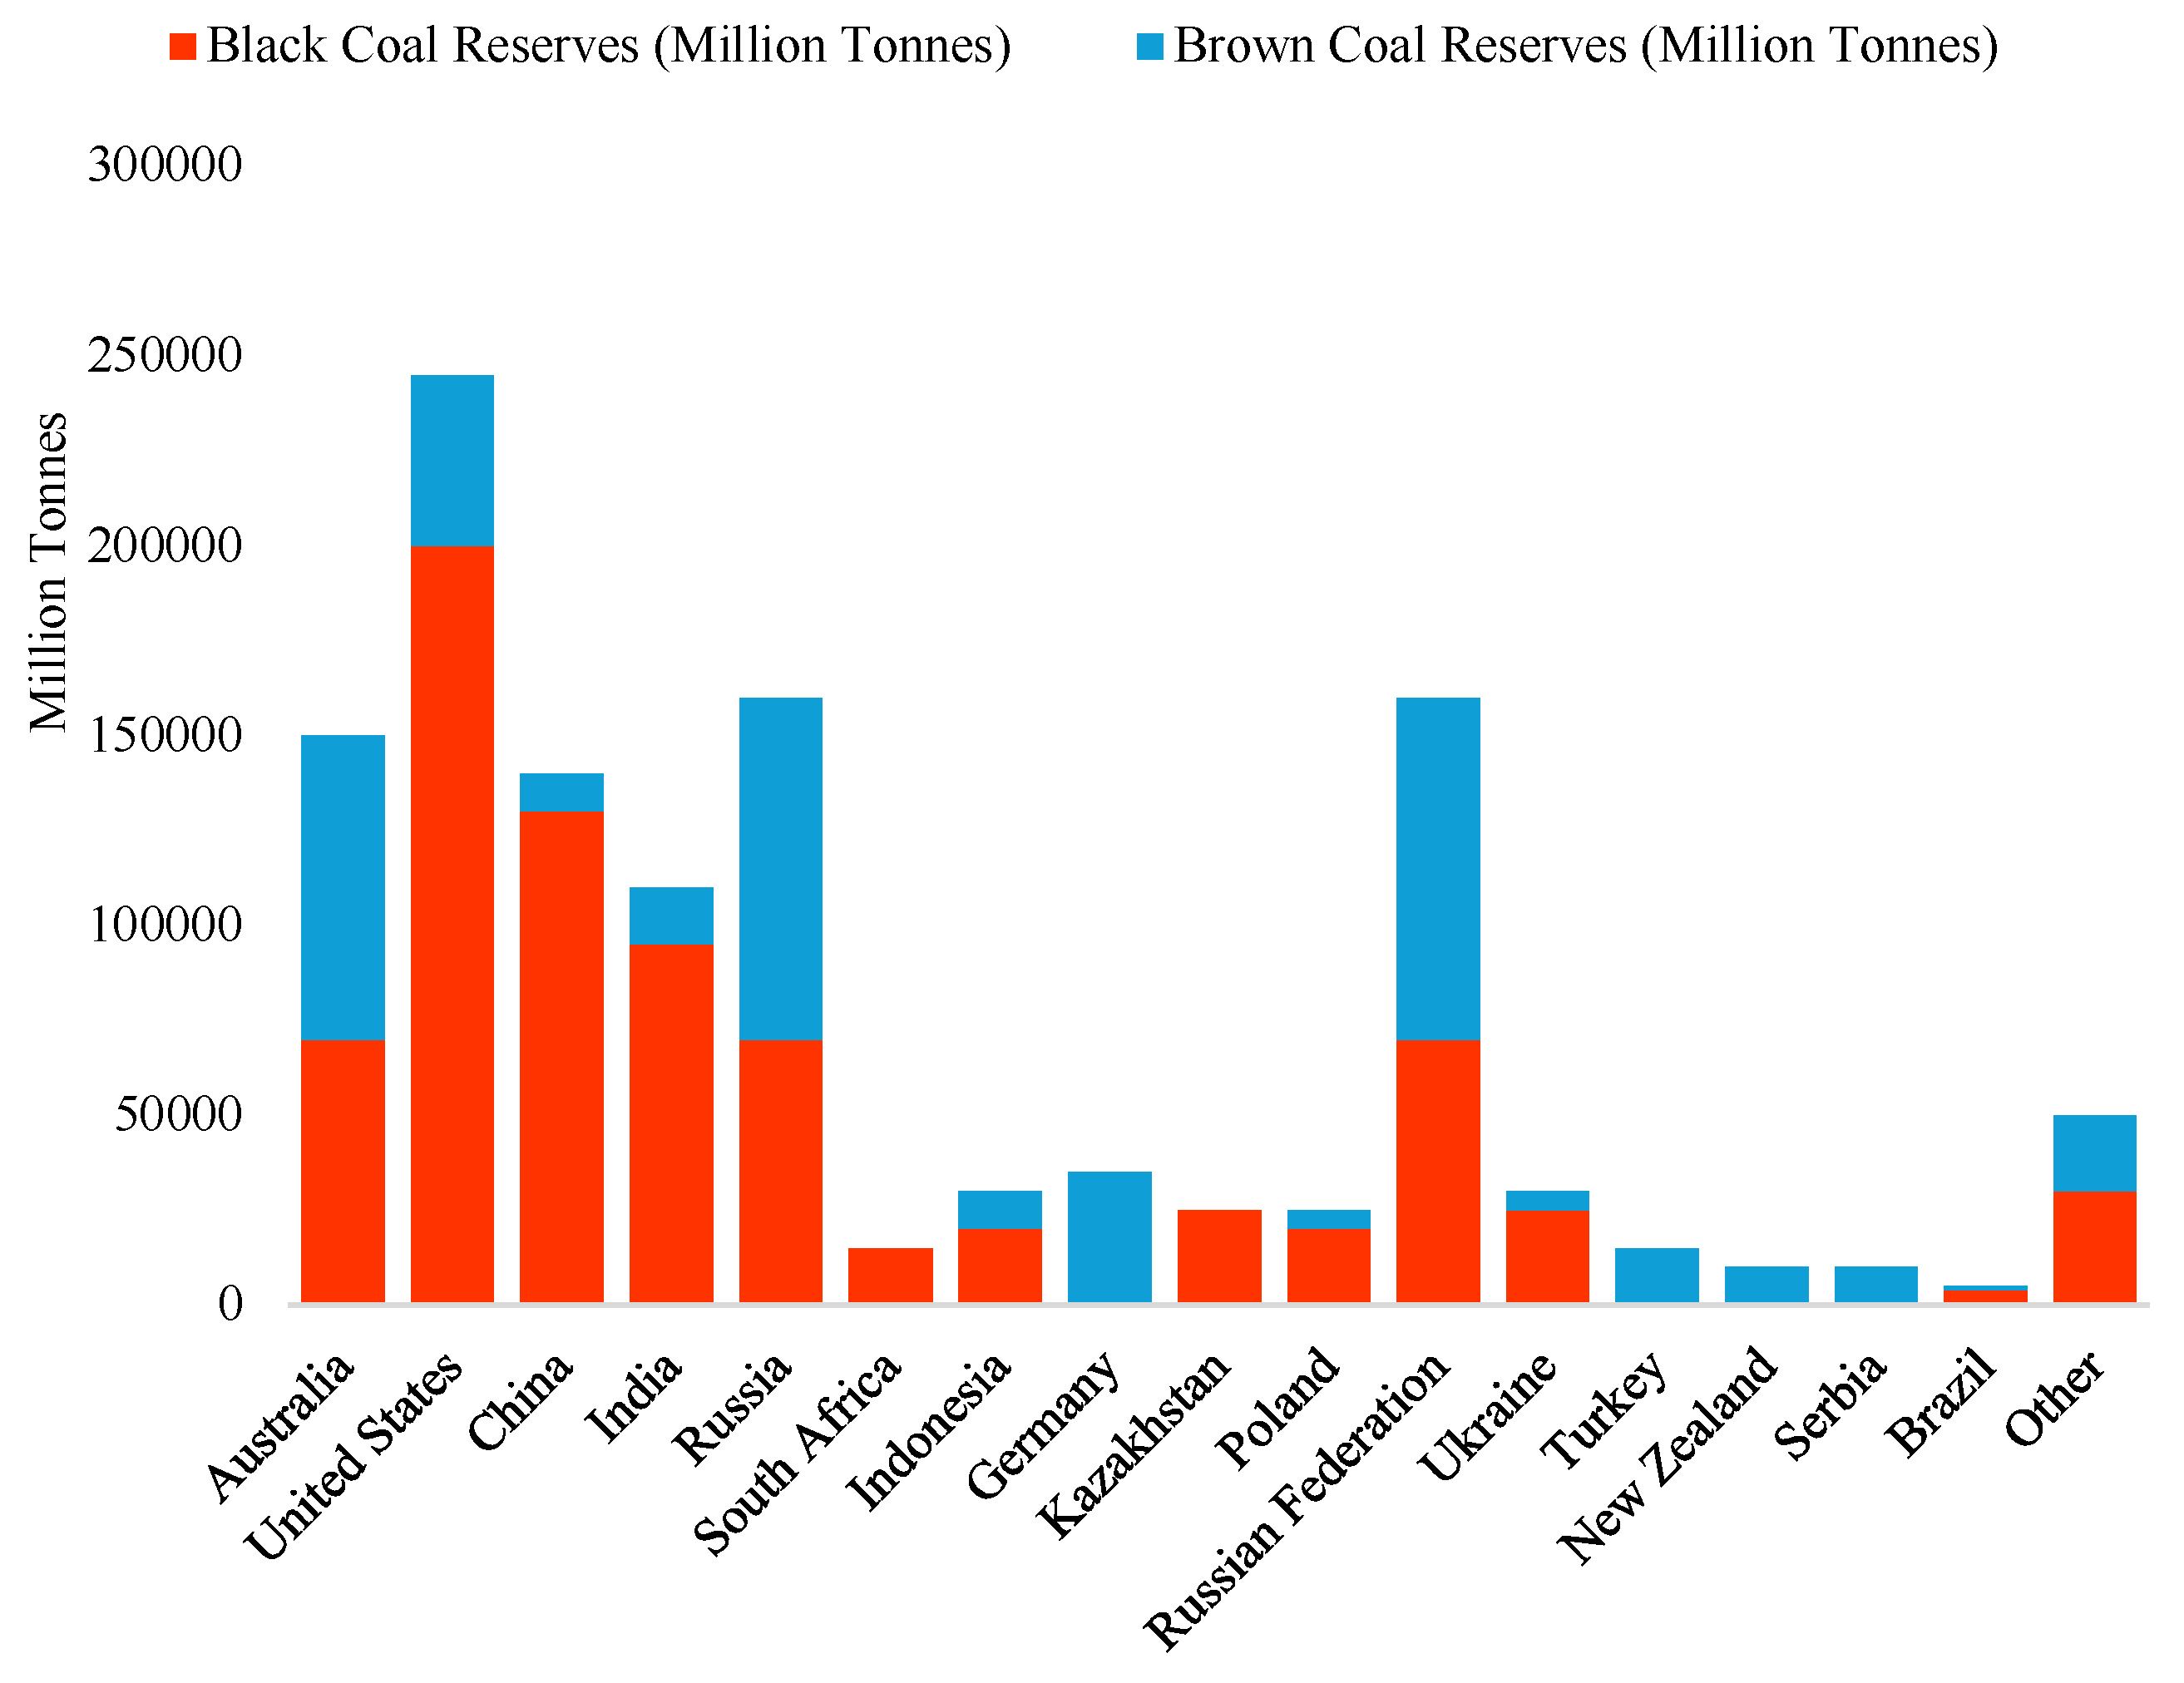
Figure 3.
Australia's Production Trend of Black Coal (Australian Government, Geoscience Australia, 2024).
Figure 3.
Australia's Production Trend of Black Coal (Australian Government, Geoscience Australia, 2024).
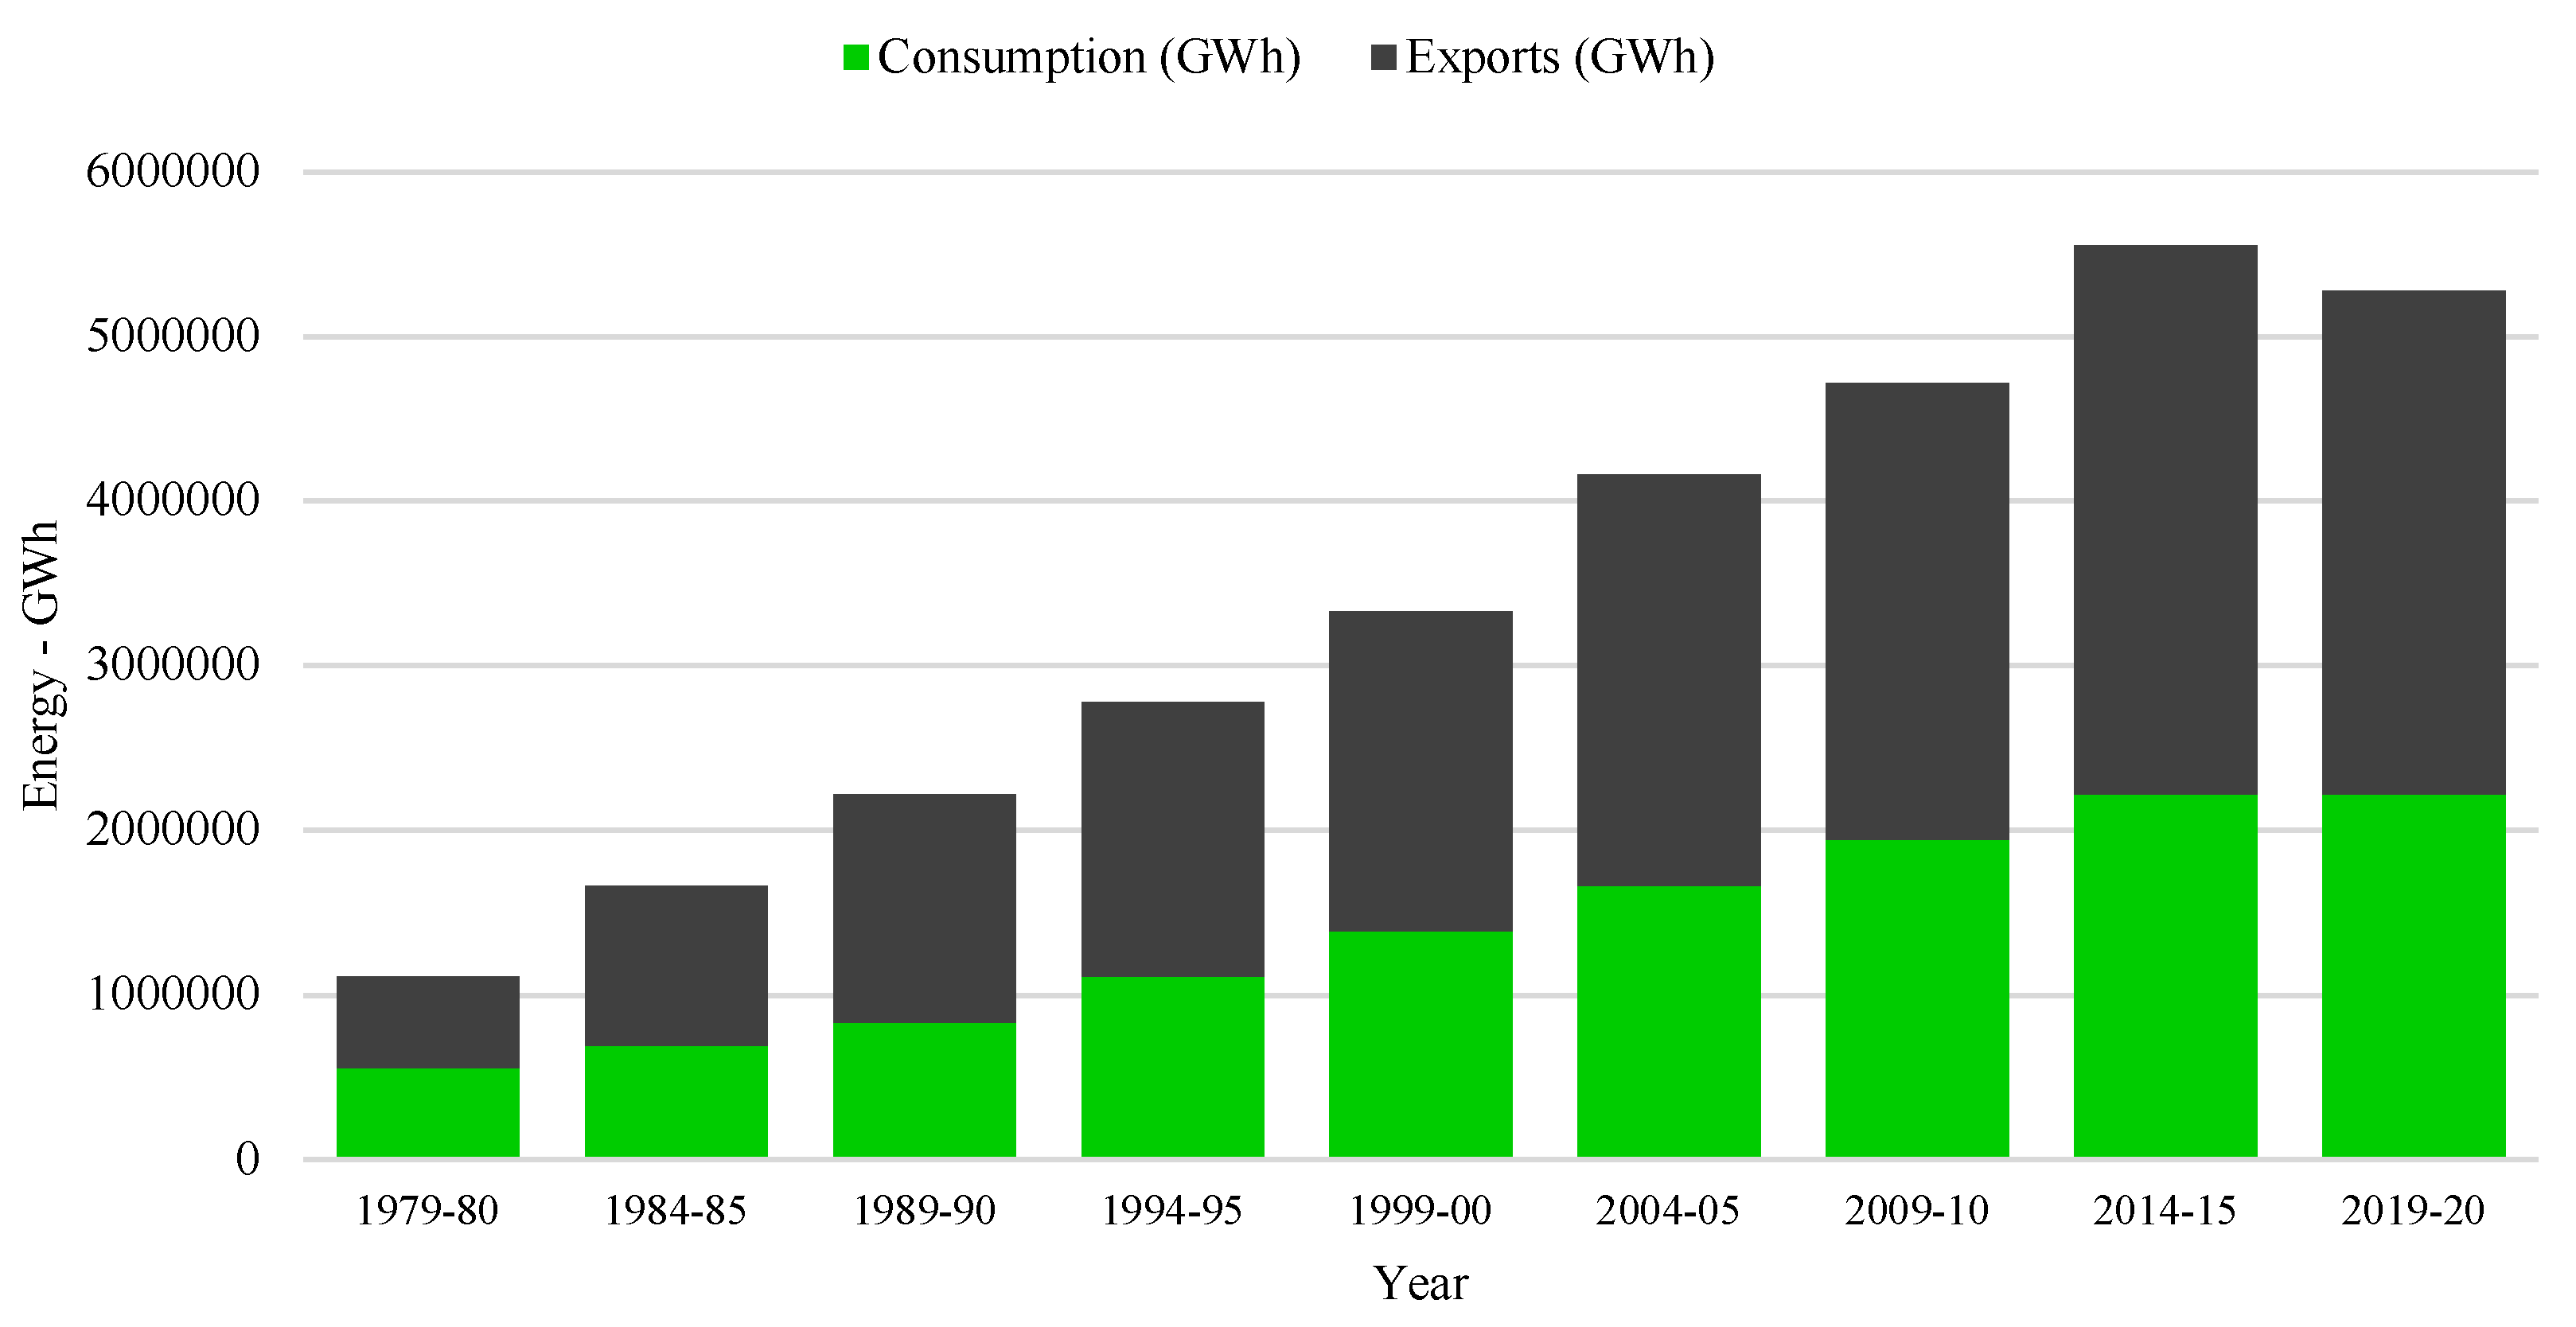
Figure 4.
Figure 4. Gas power generation in the marketplace (McConnel & Sandiford, 2020).
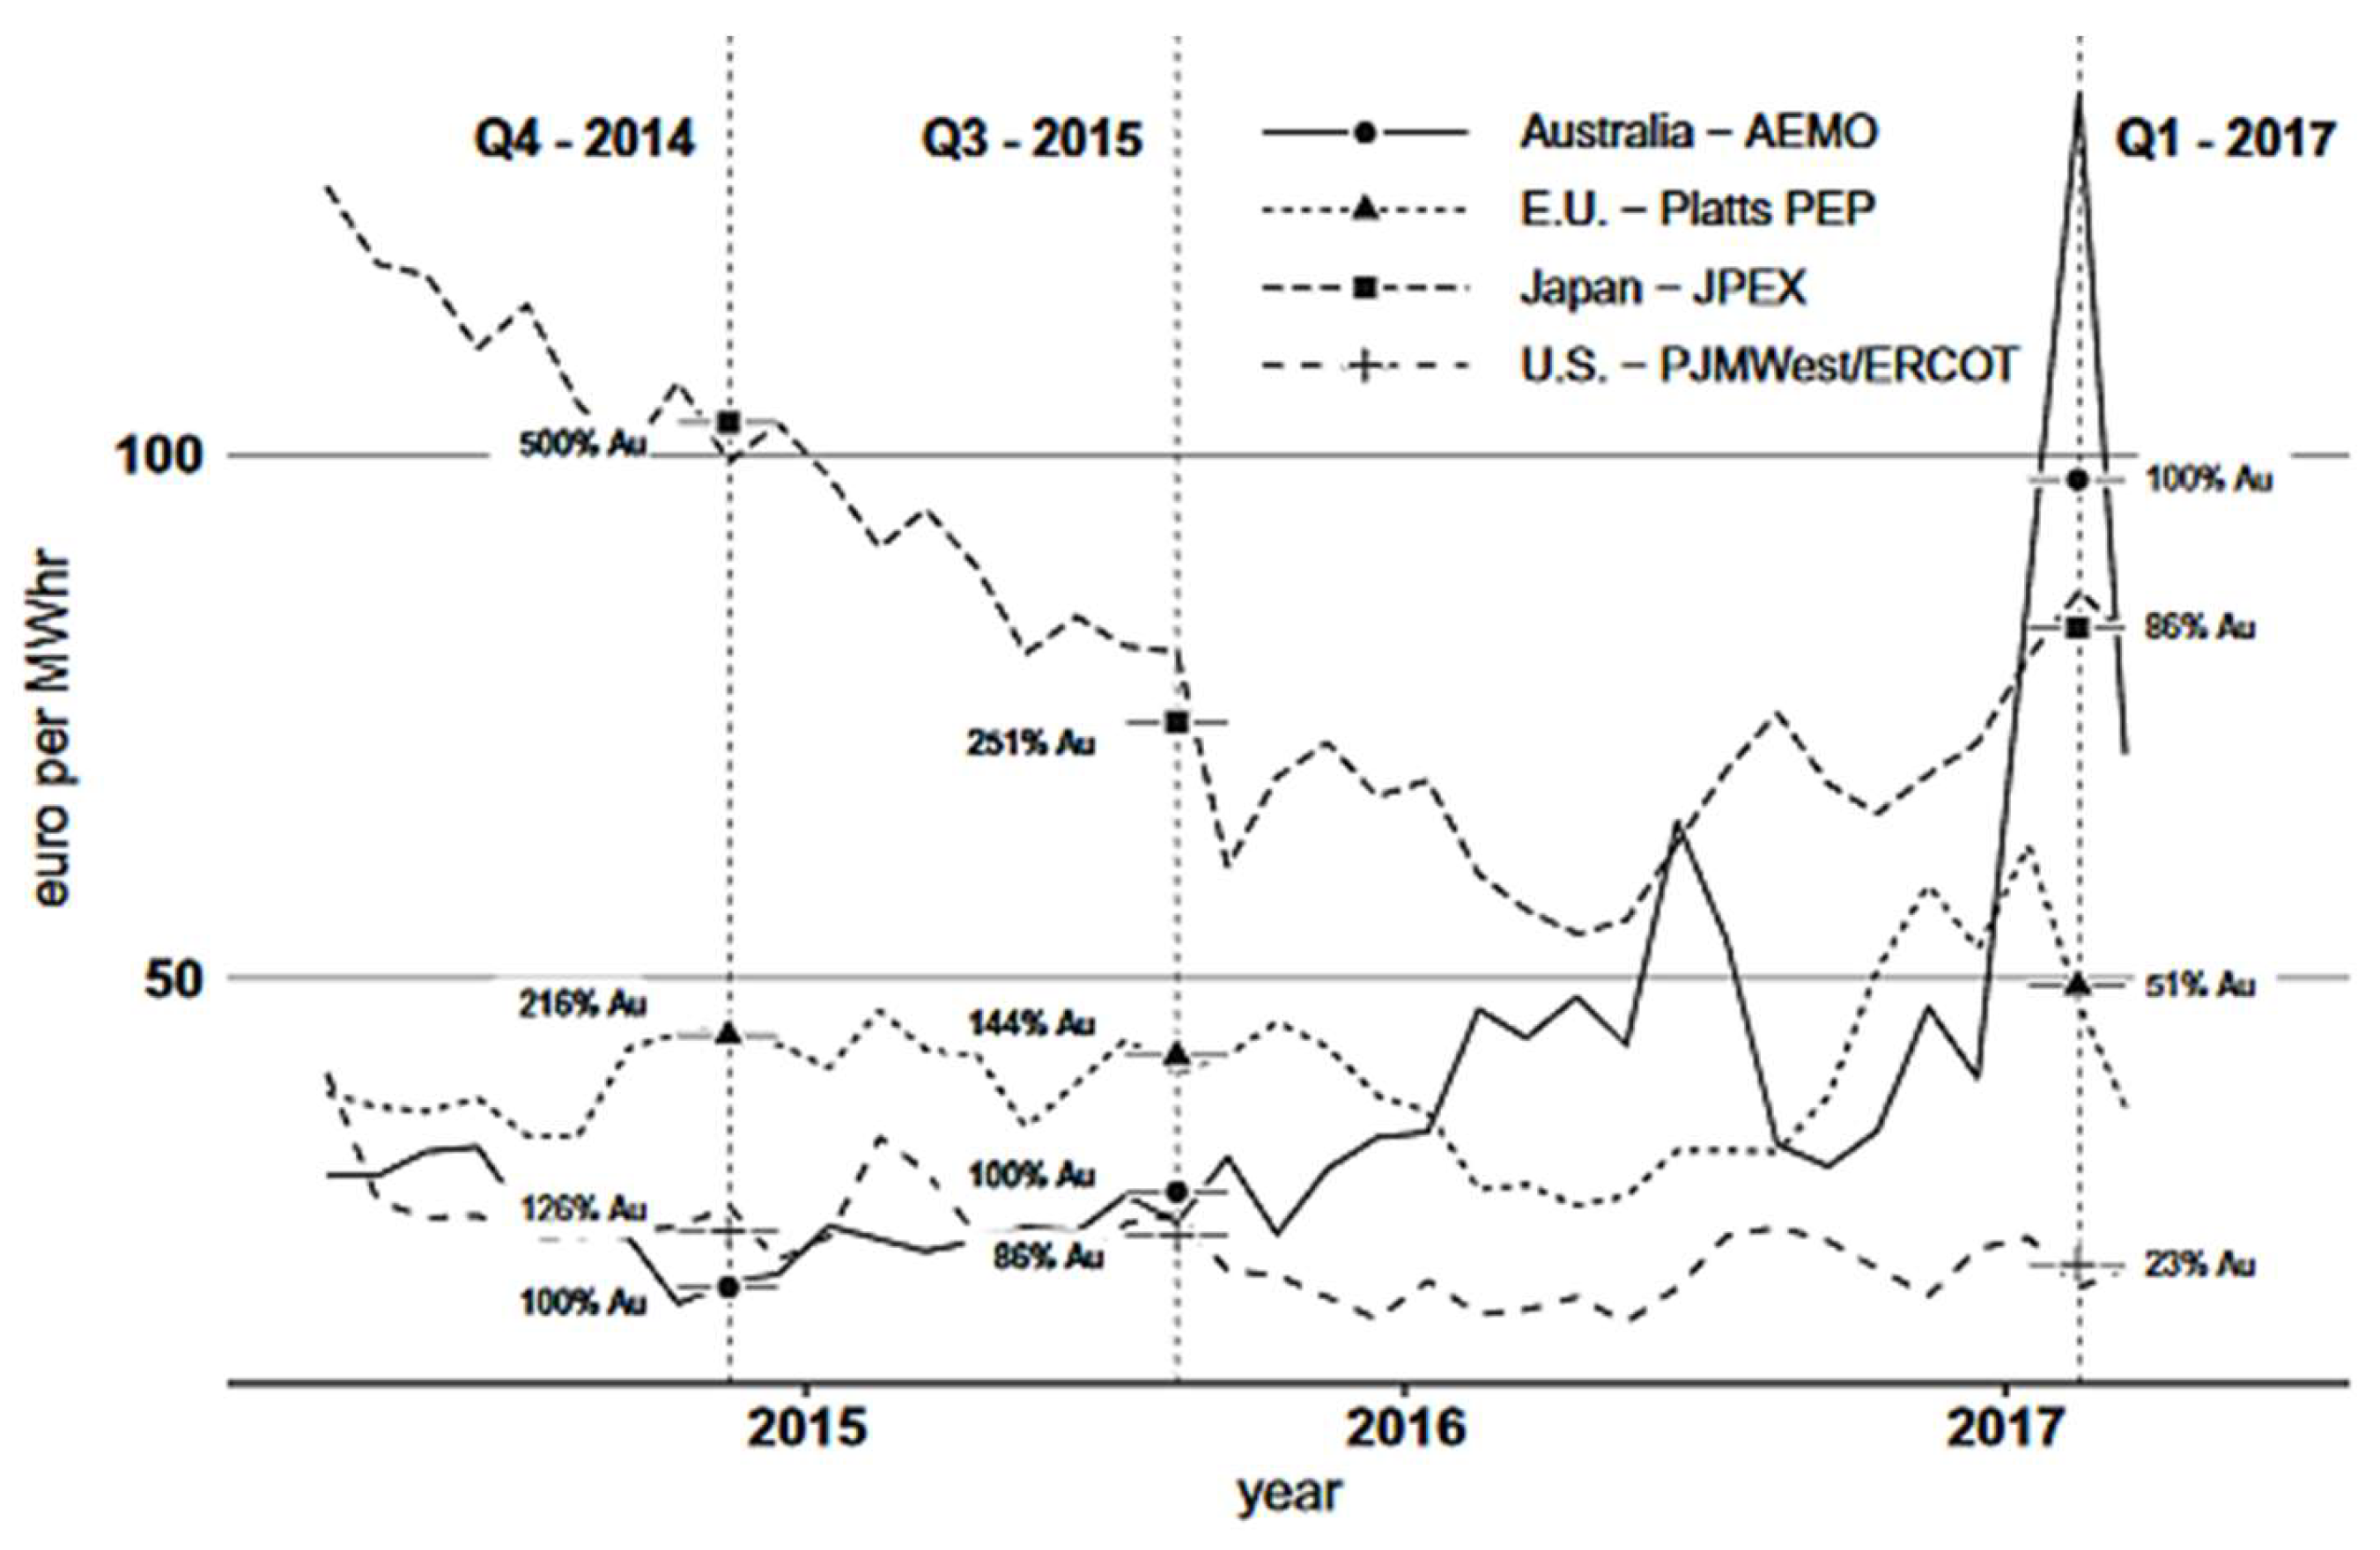
Figure 5.
New and Commissioning Solar Capacities Growth (Quarterly Energy Dynamics Q1, 2024).
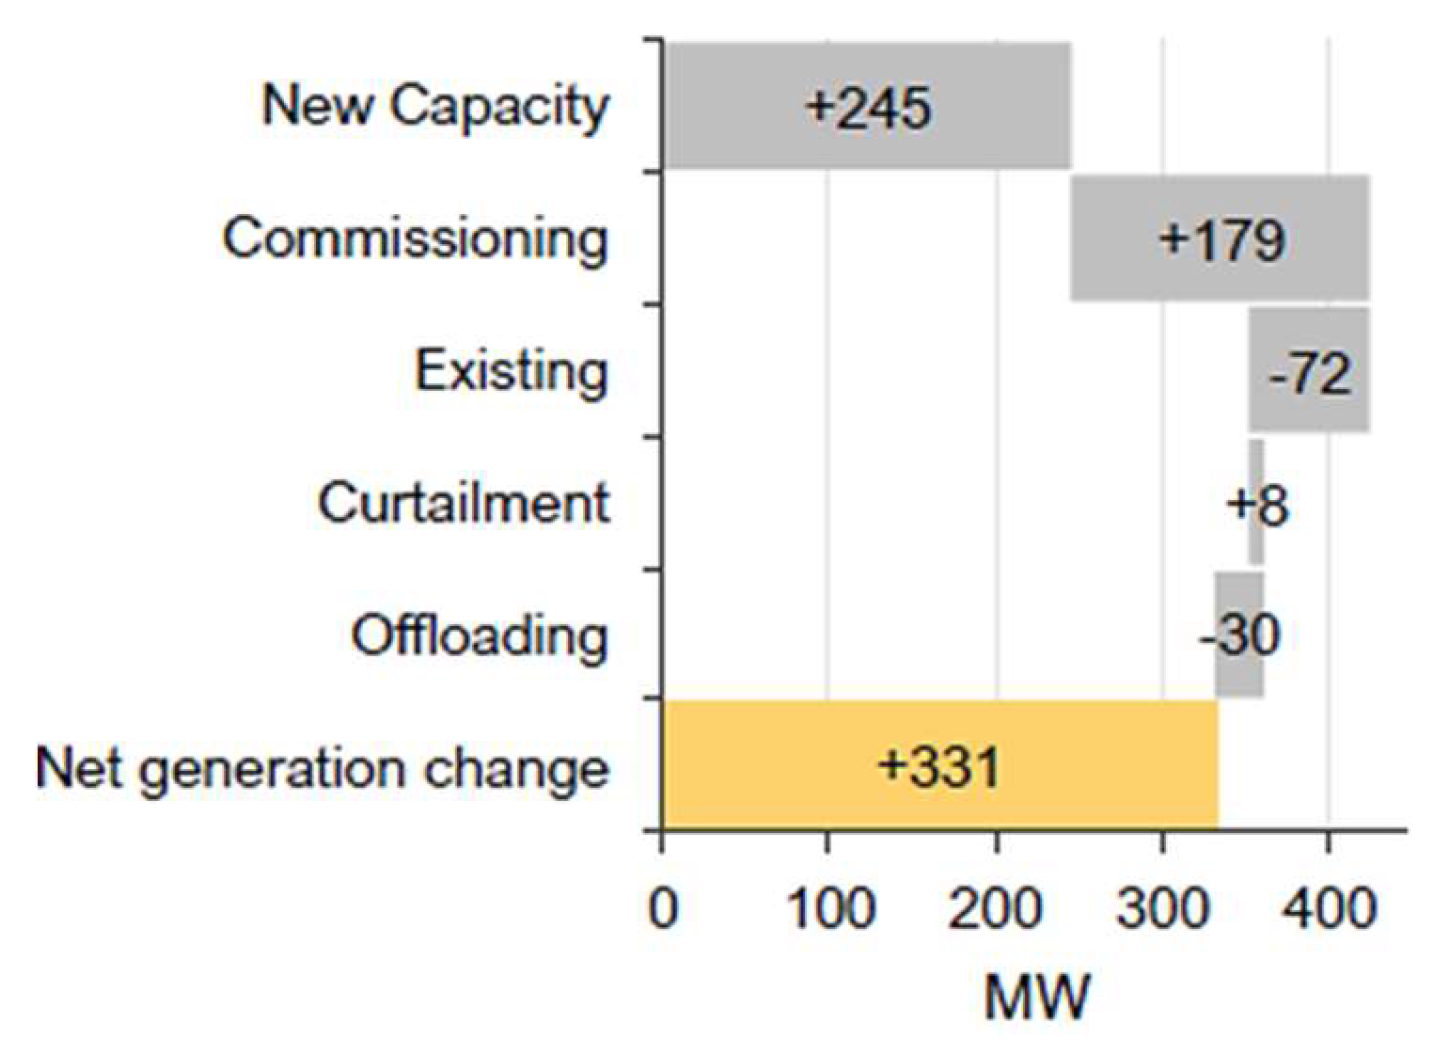
Figure 6.
New and Commissioning Wind Capacities Growth (Quarterly Energy Dynamics Q1, 2024).
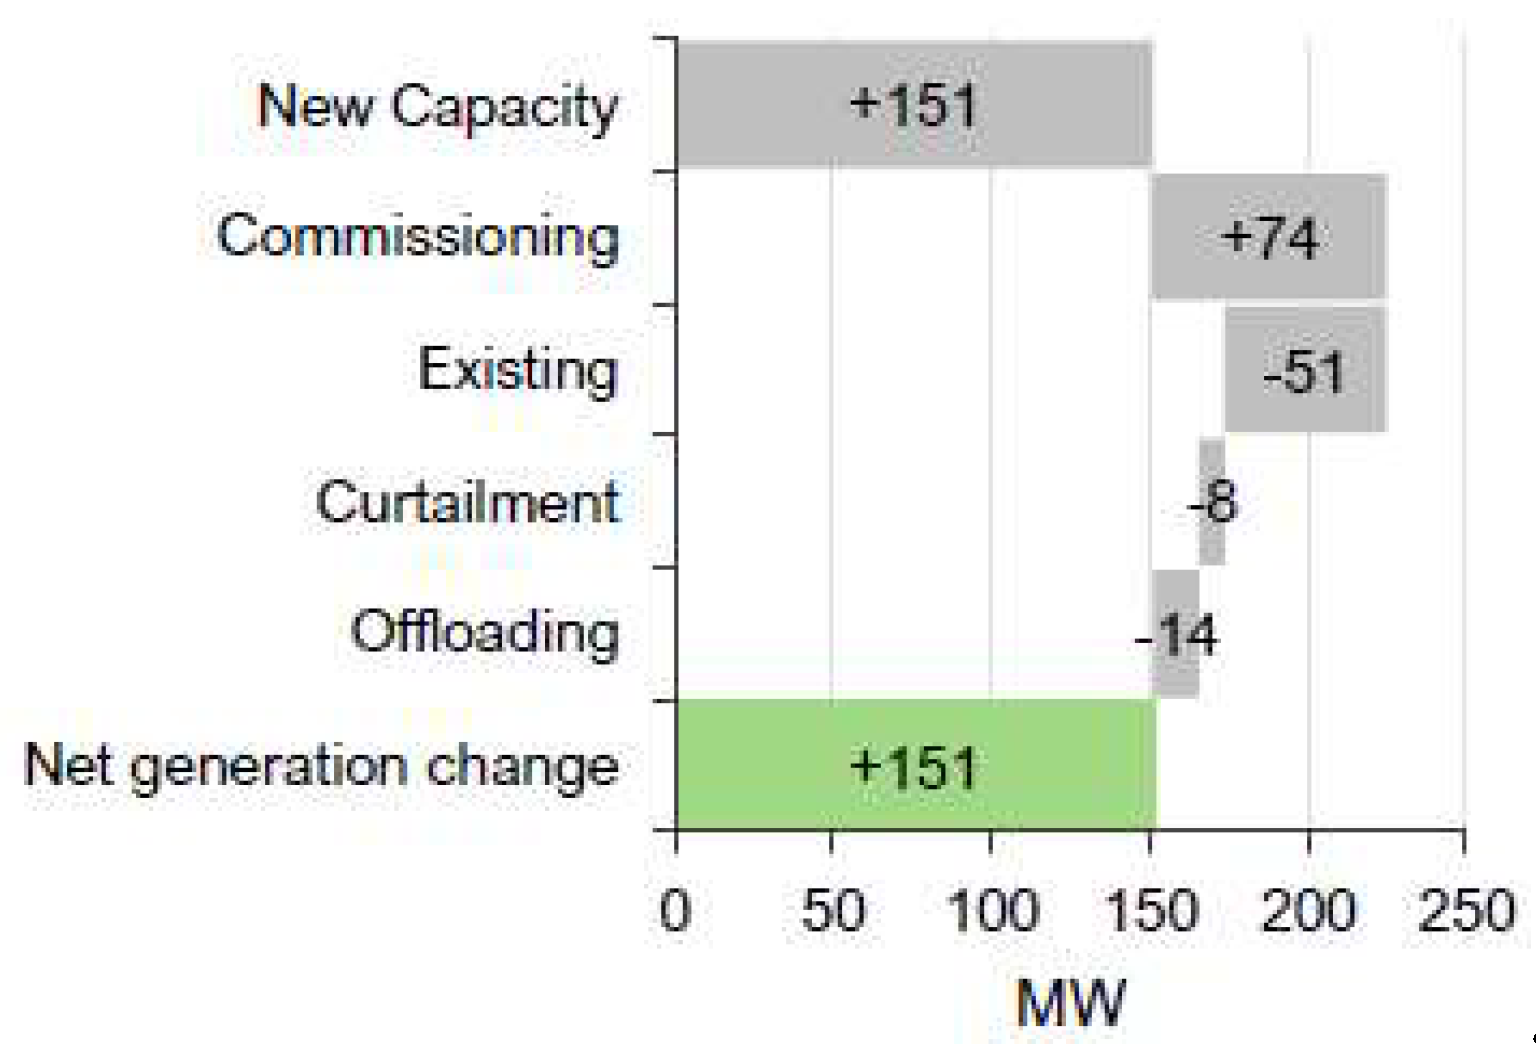
Figure 7.
Renewable Energy Expectations in 2050 (Csereklyei, Anantharama & Kallies, 2021).
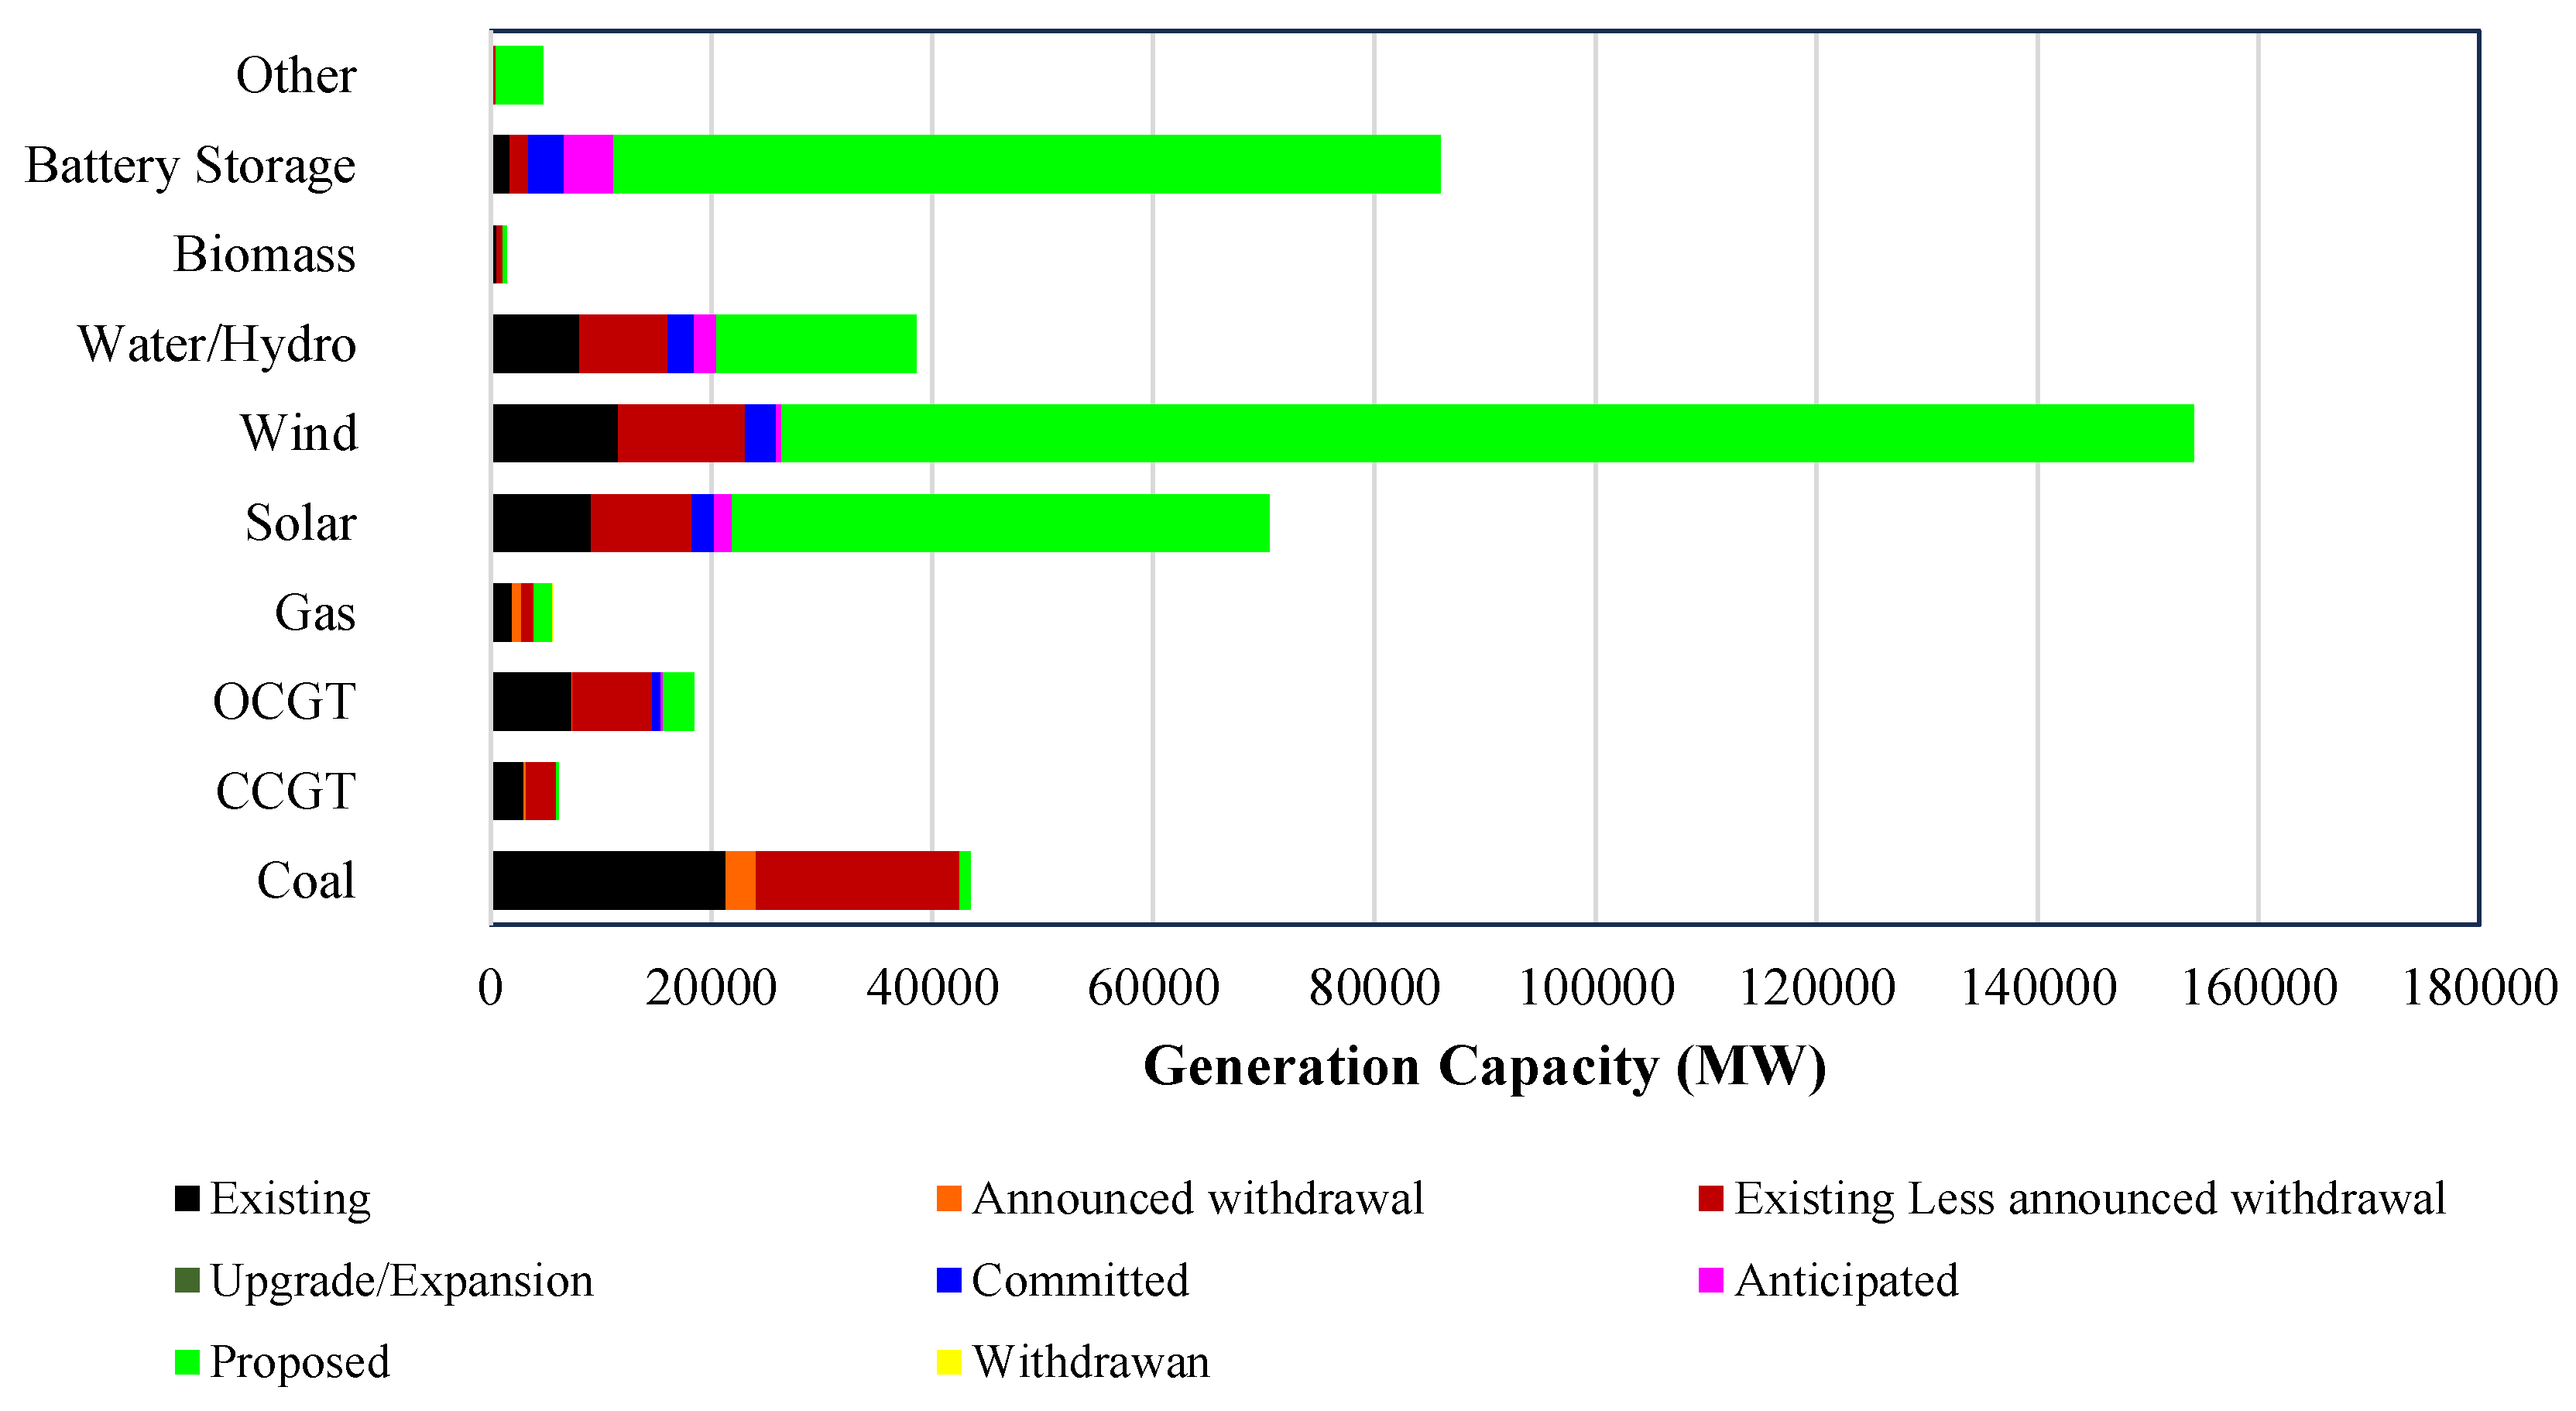
Figure 8.
Gradient Descent Paths with Varying Rates and Momentums.
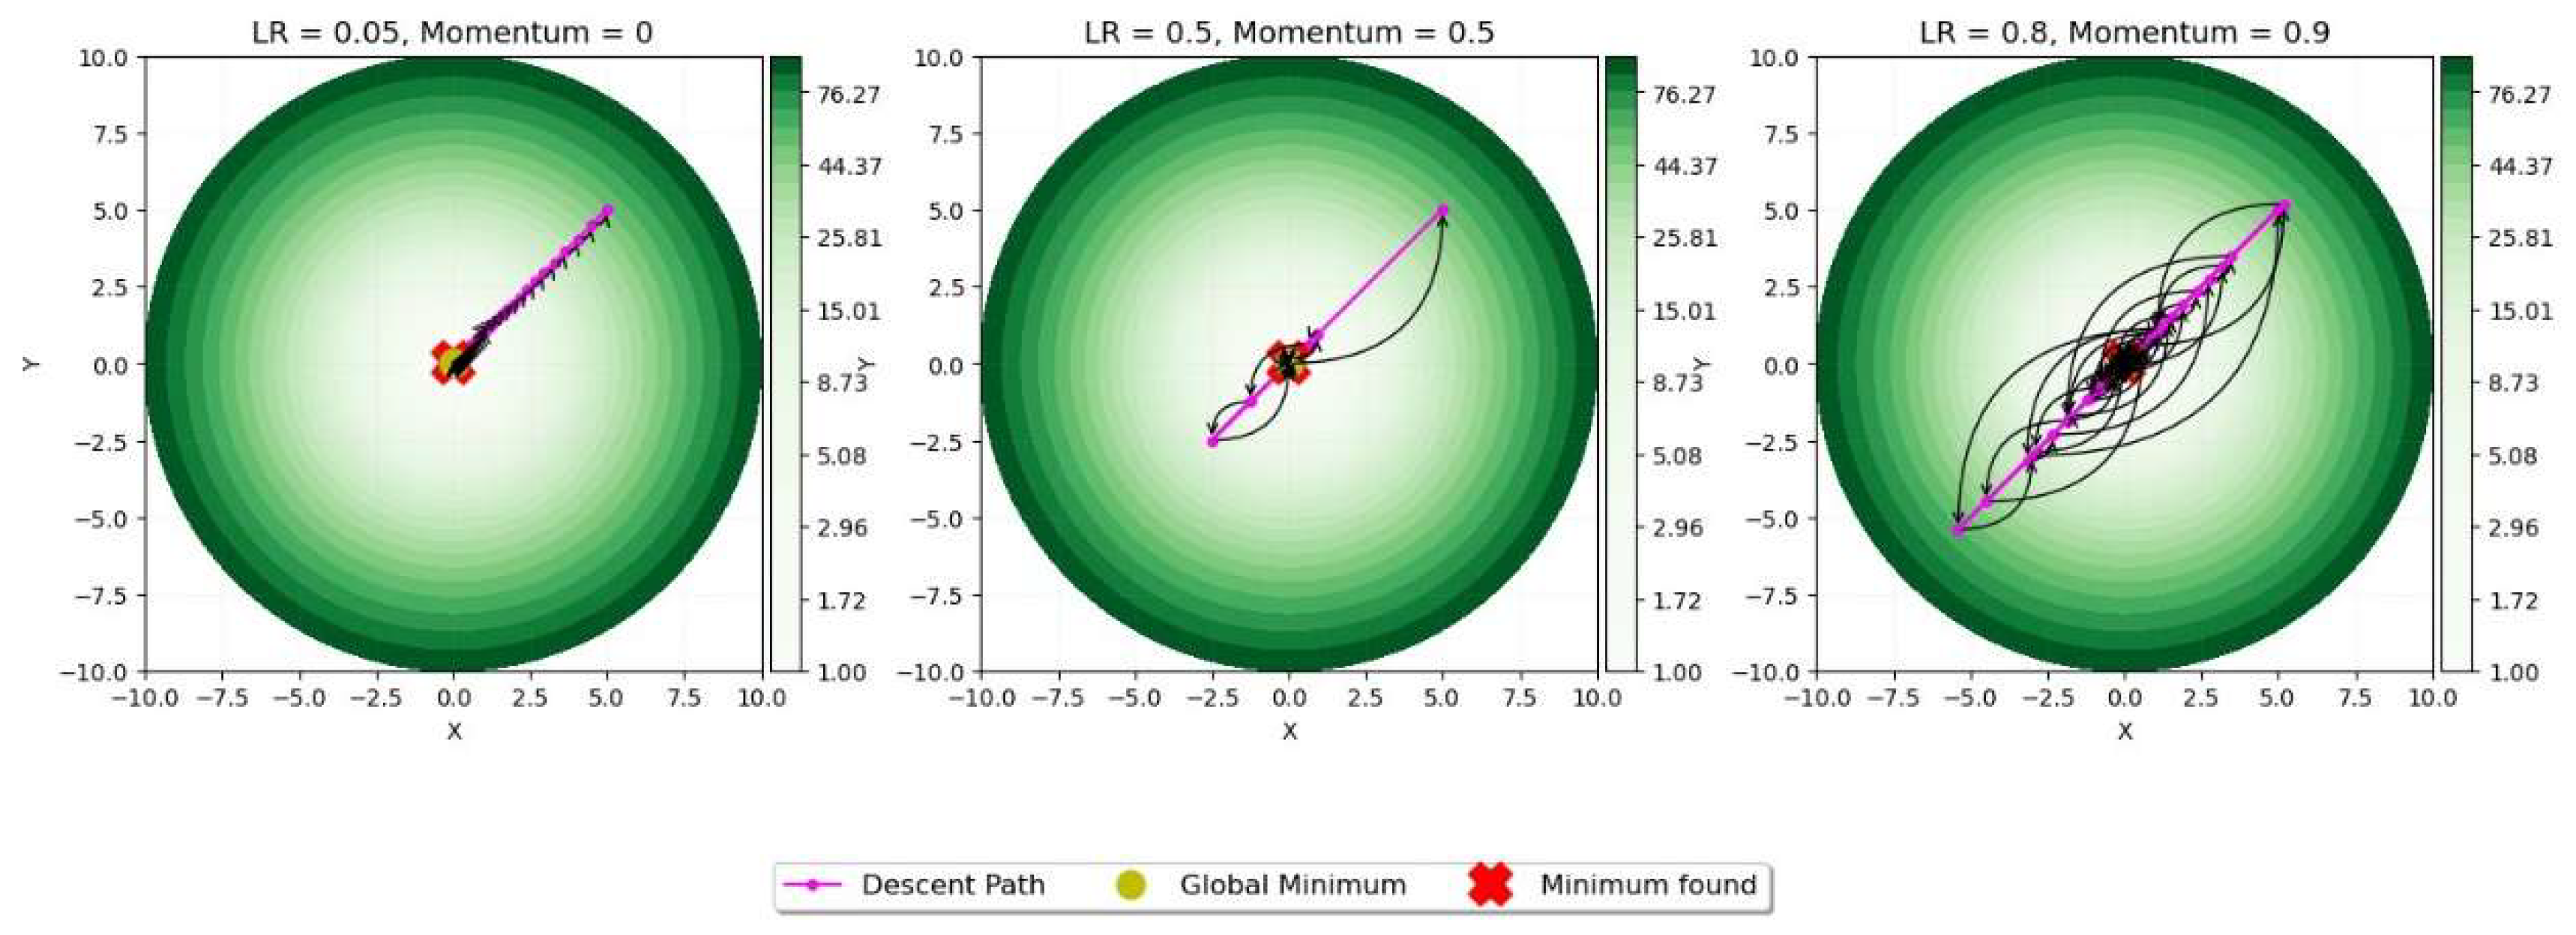
Figure 9.
Convergence Iterations Vs. Levels of Error Reduction for RE Capacities (MW).
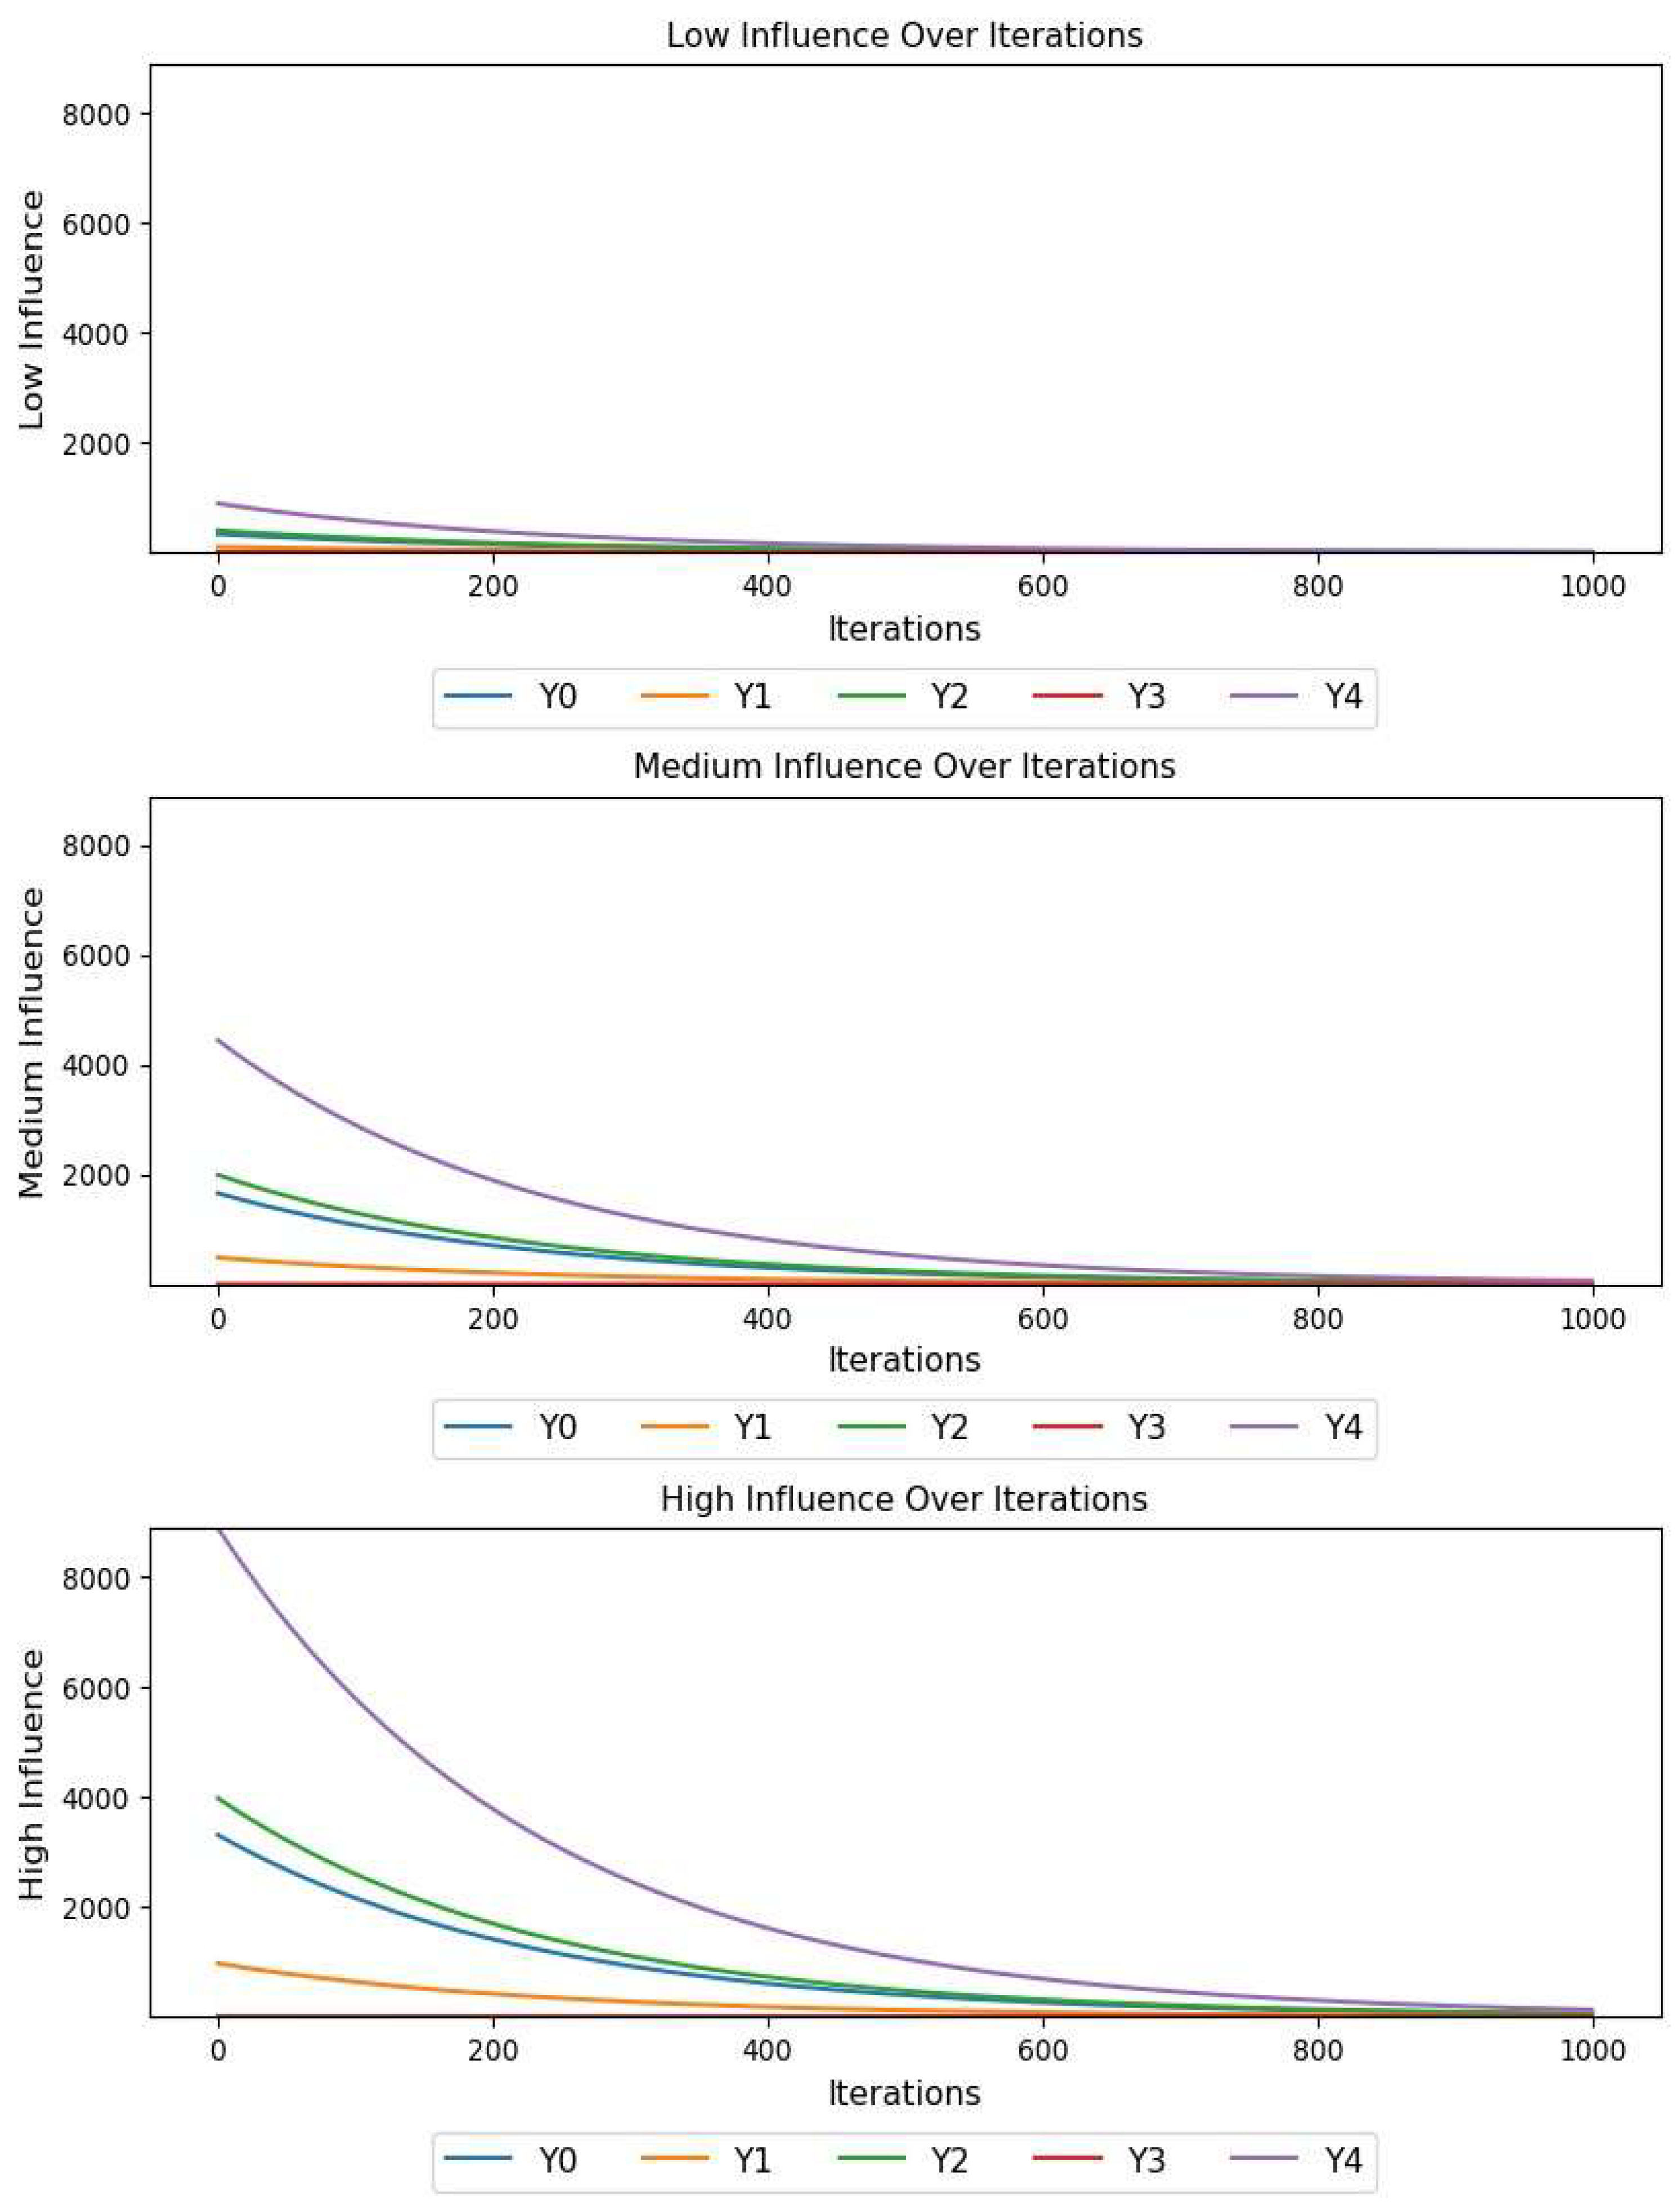
Figure 10.
Figure 10. GD Prediction Vs. AEMO Estimate of RE Annual Capacity Addition.
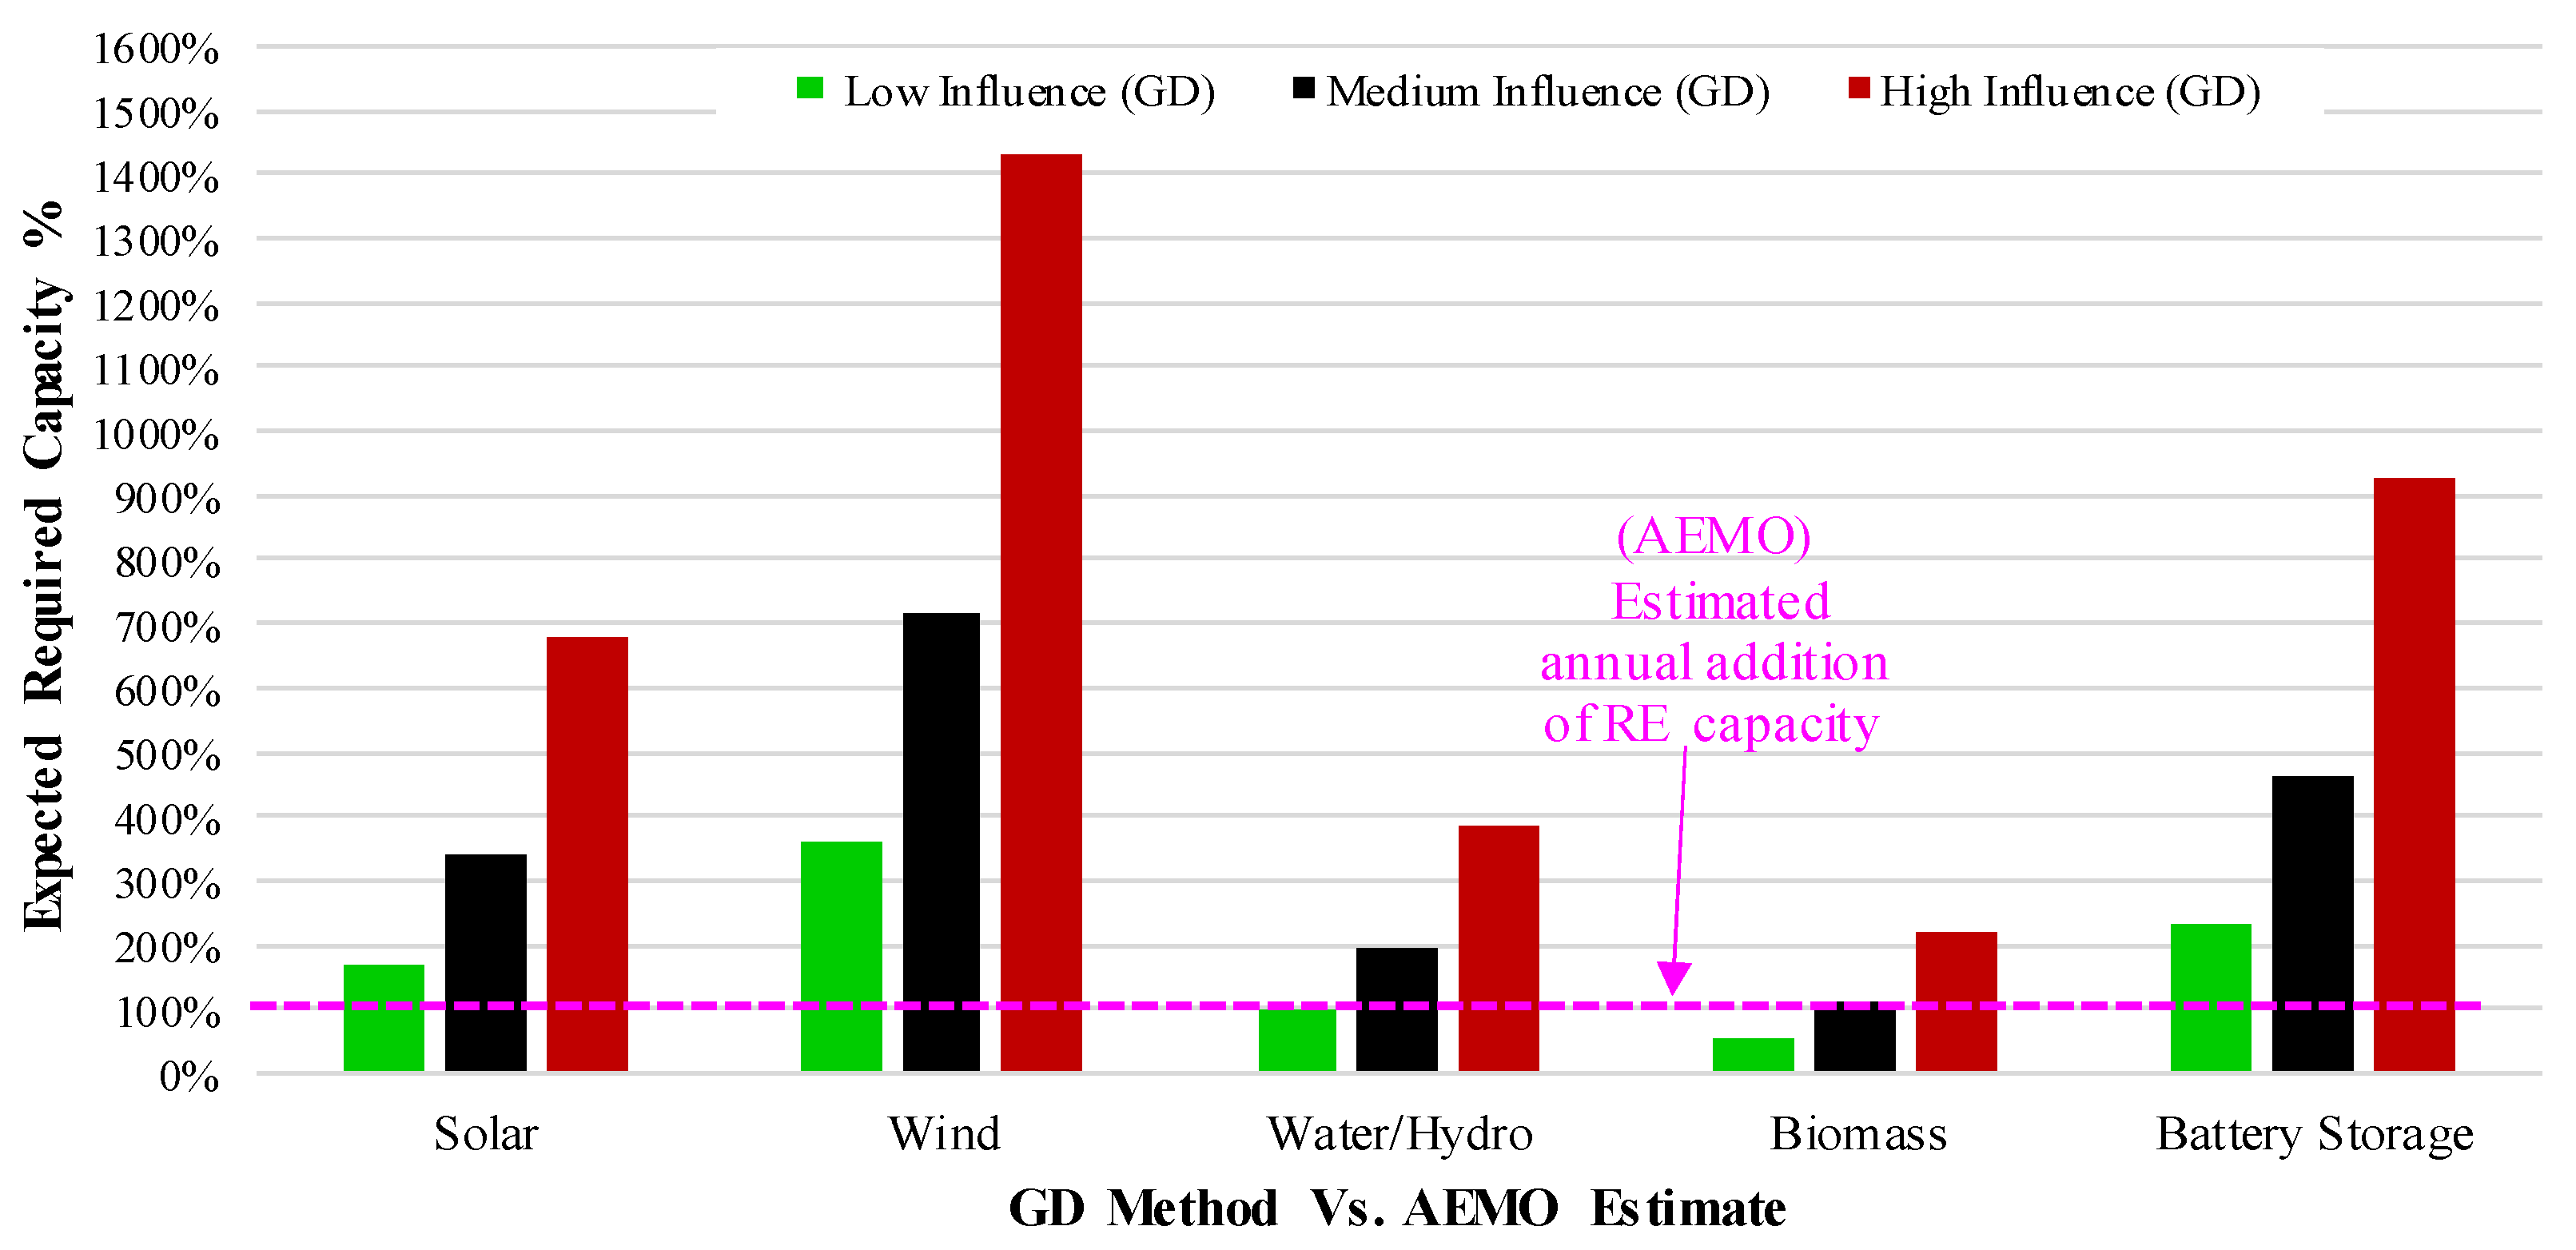
Figure 11.
Step Change, Progressive Change, and Green Energy Exports (Integrated System Plan for the National Electricity Market, 2024).
Figure 11.
Step Change, Progressive Change, and Green Energy Exports (Integrated System Plan for the National Electricity Market, 2024).
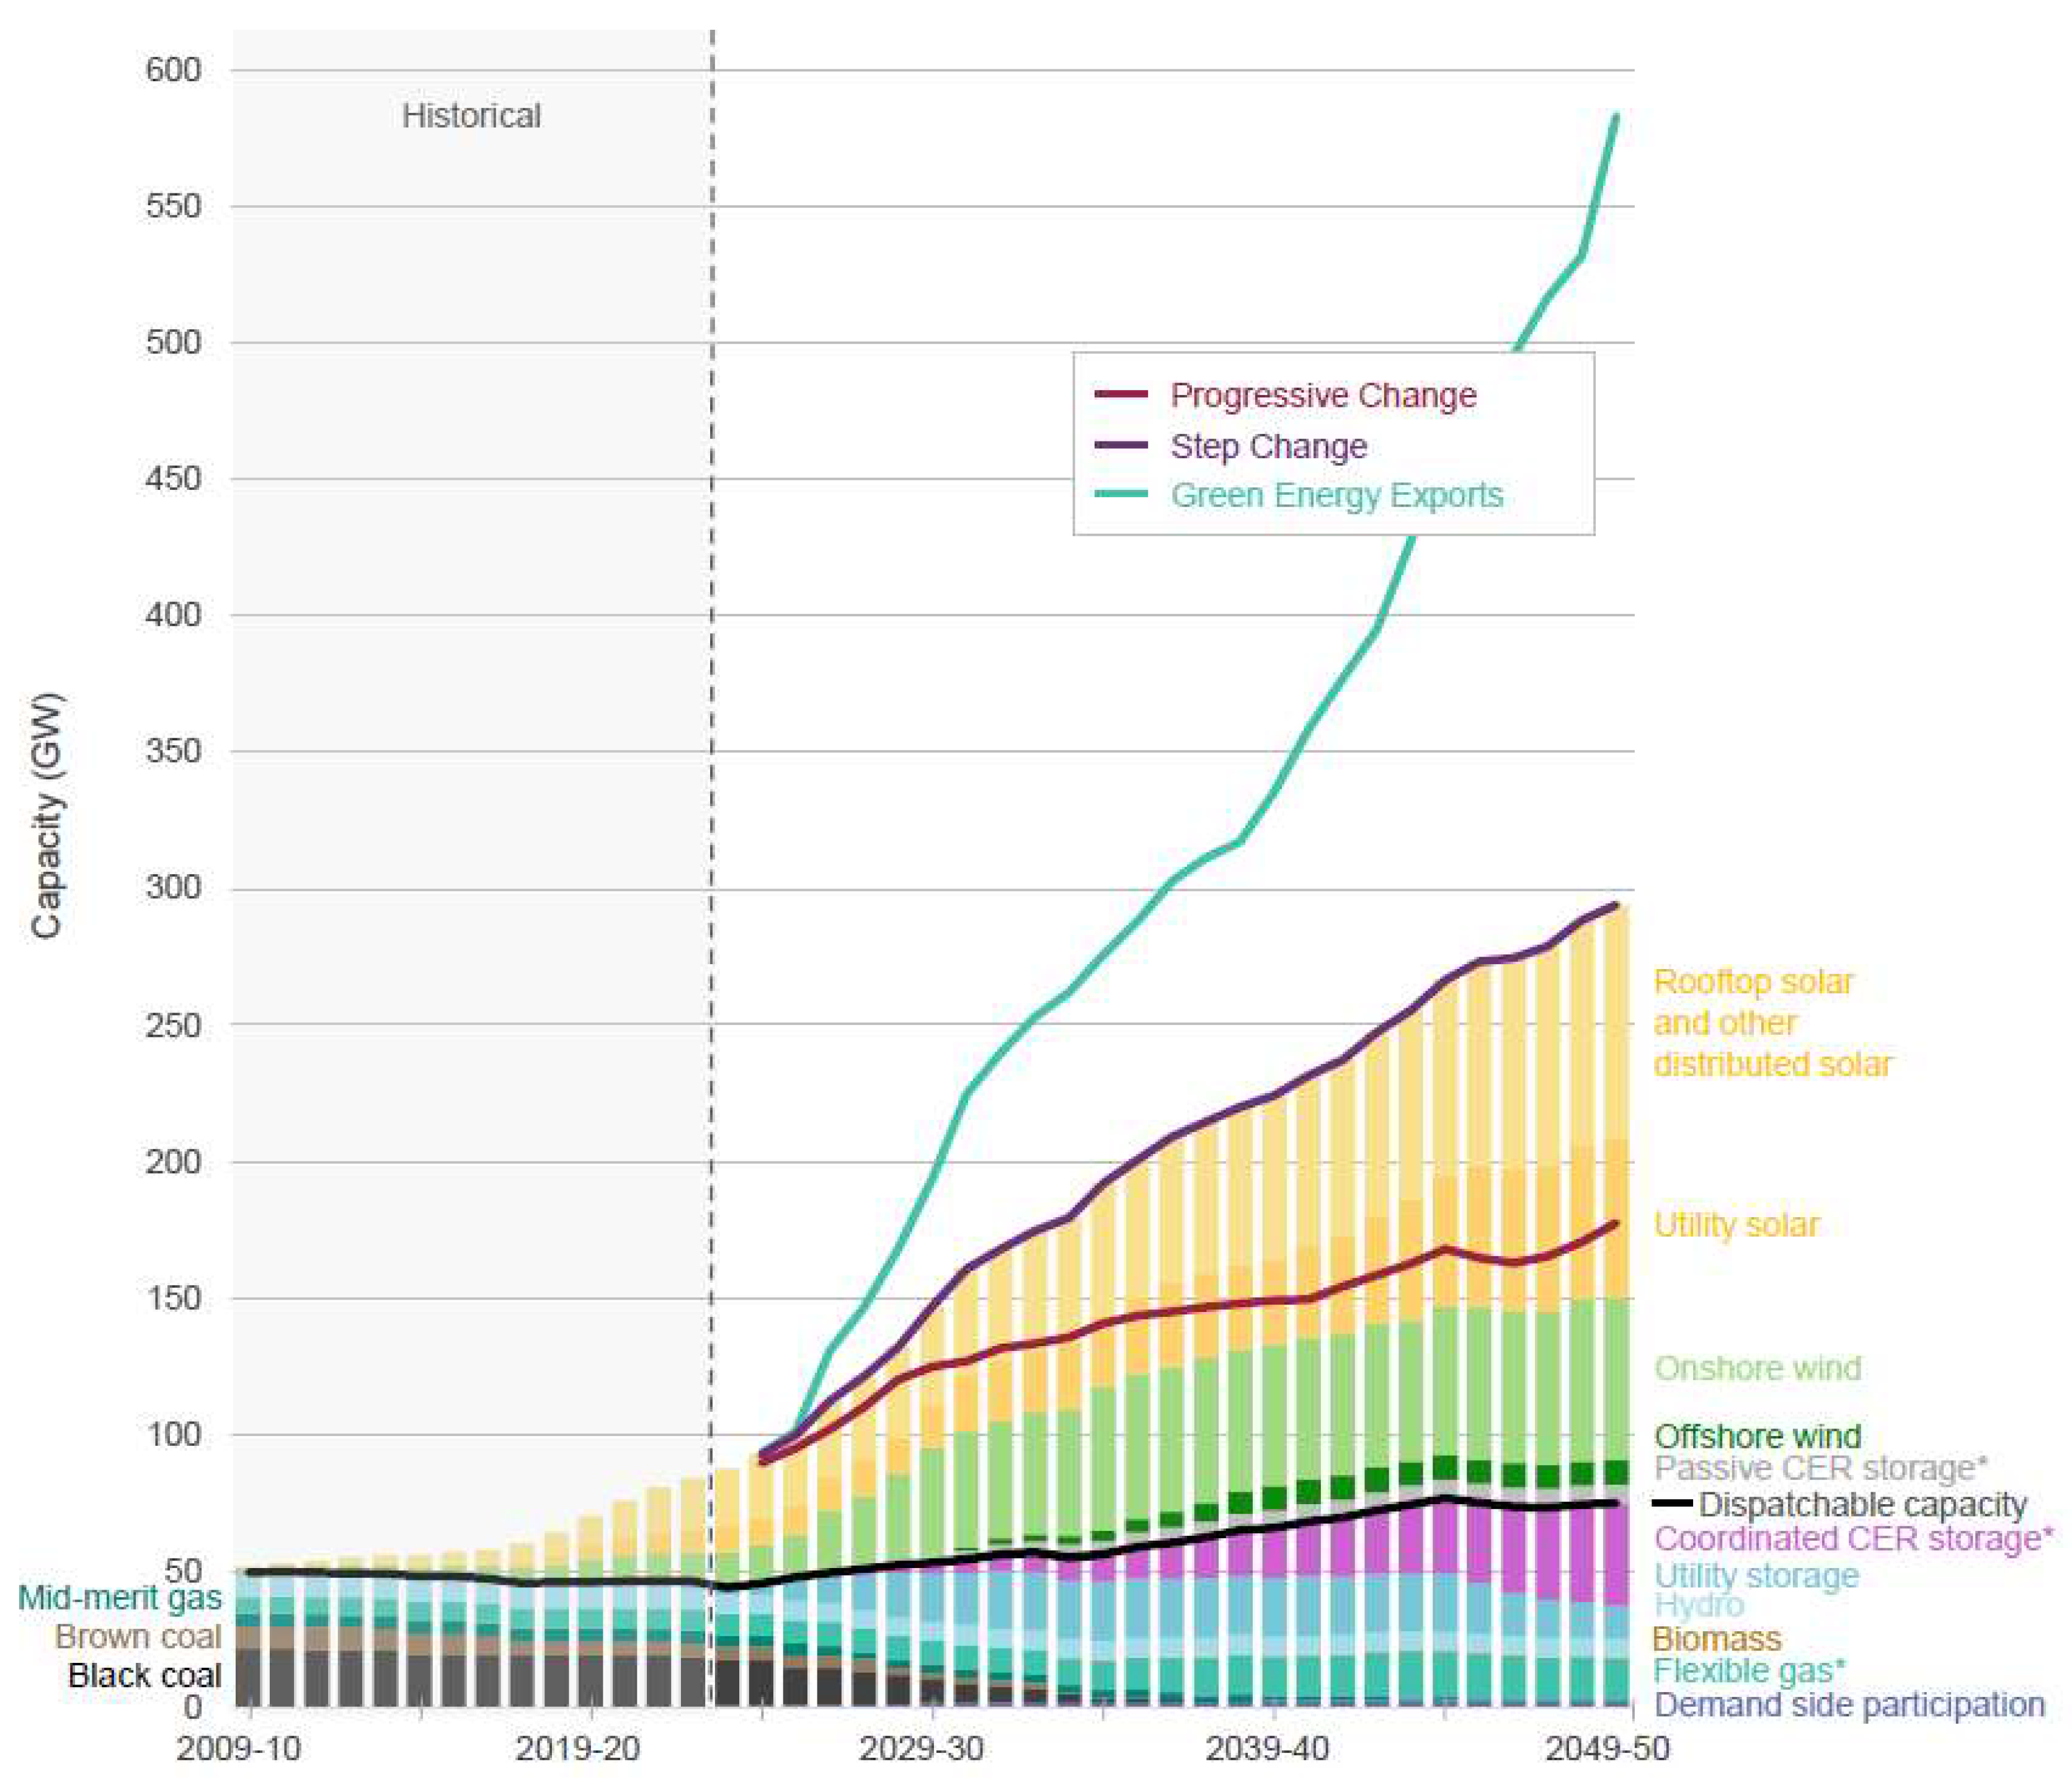
Figure 12.
Foreseen of Nuclear Power Application.
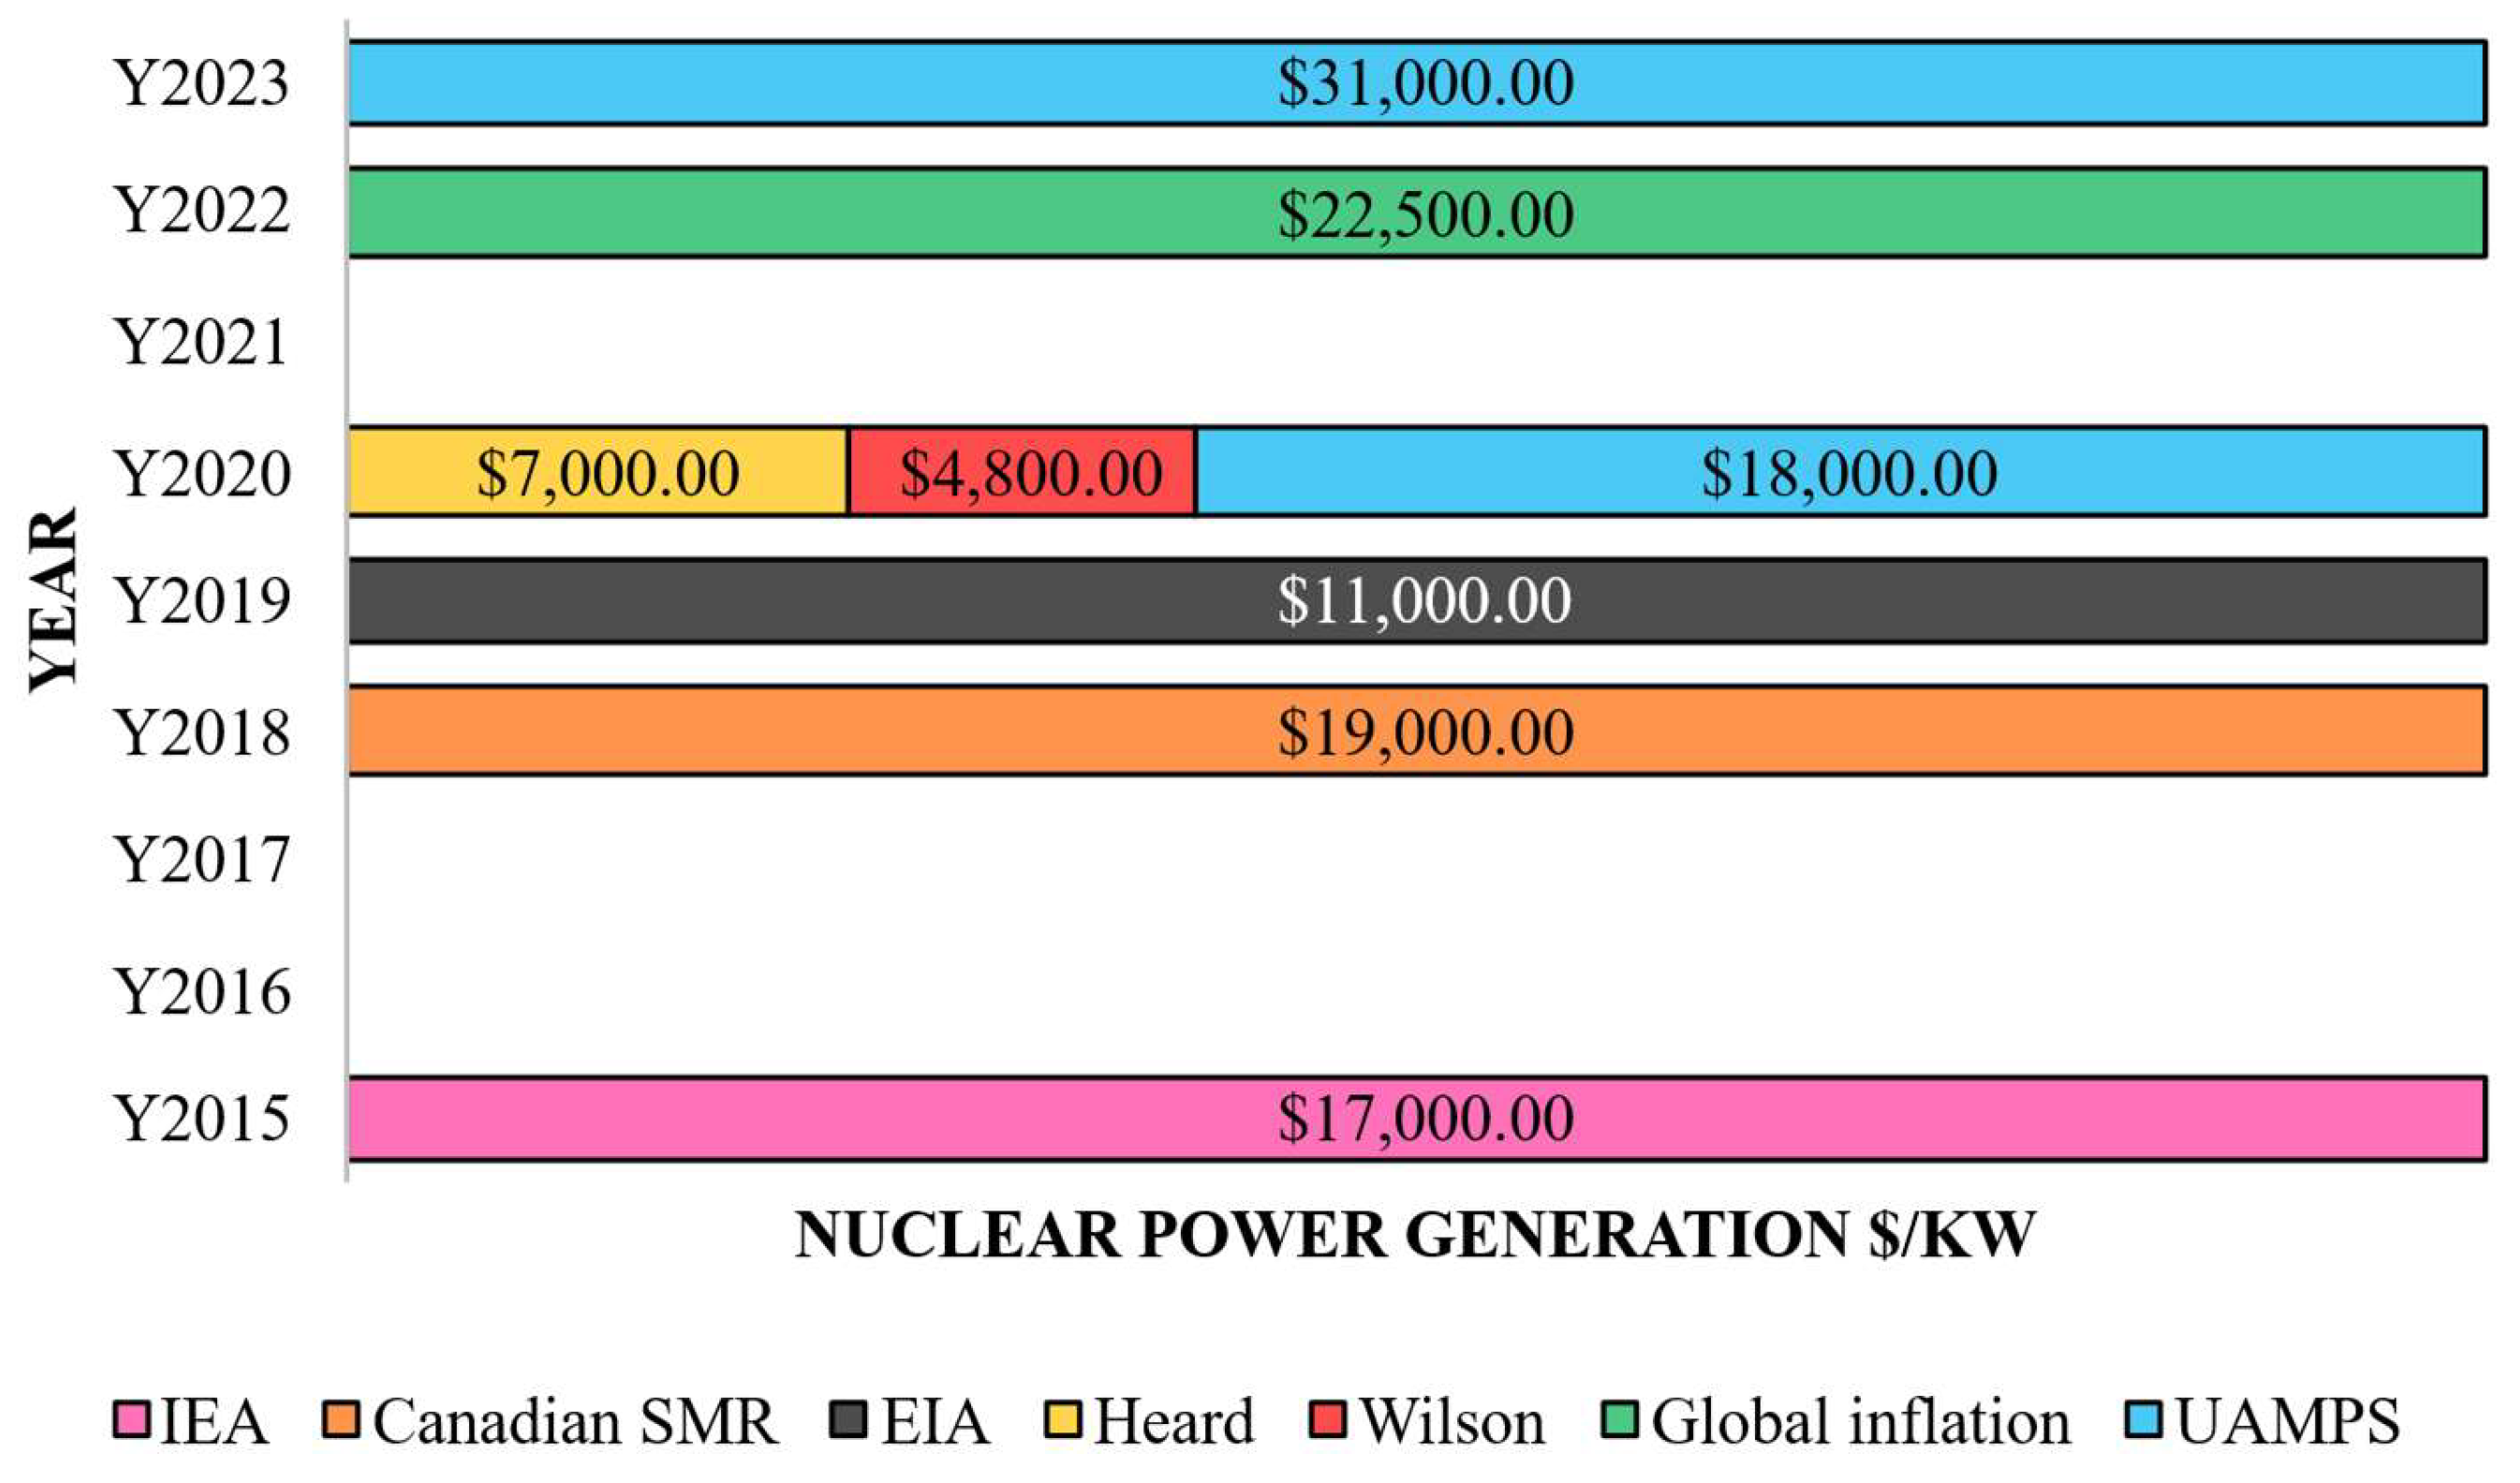
Figure 13.
Life Cycle Spiral Model (Boje, D.M. et al., 2017), (Boehm, B., & Turner, R., 2015); (Project Management Institute, 2021).
Figure 13.
Life Cycle Spiral Model (Boje, D.M. et al., 2017), (Boehm, B., & Turner, R., 2015); (Project Management Institute, 2021).
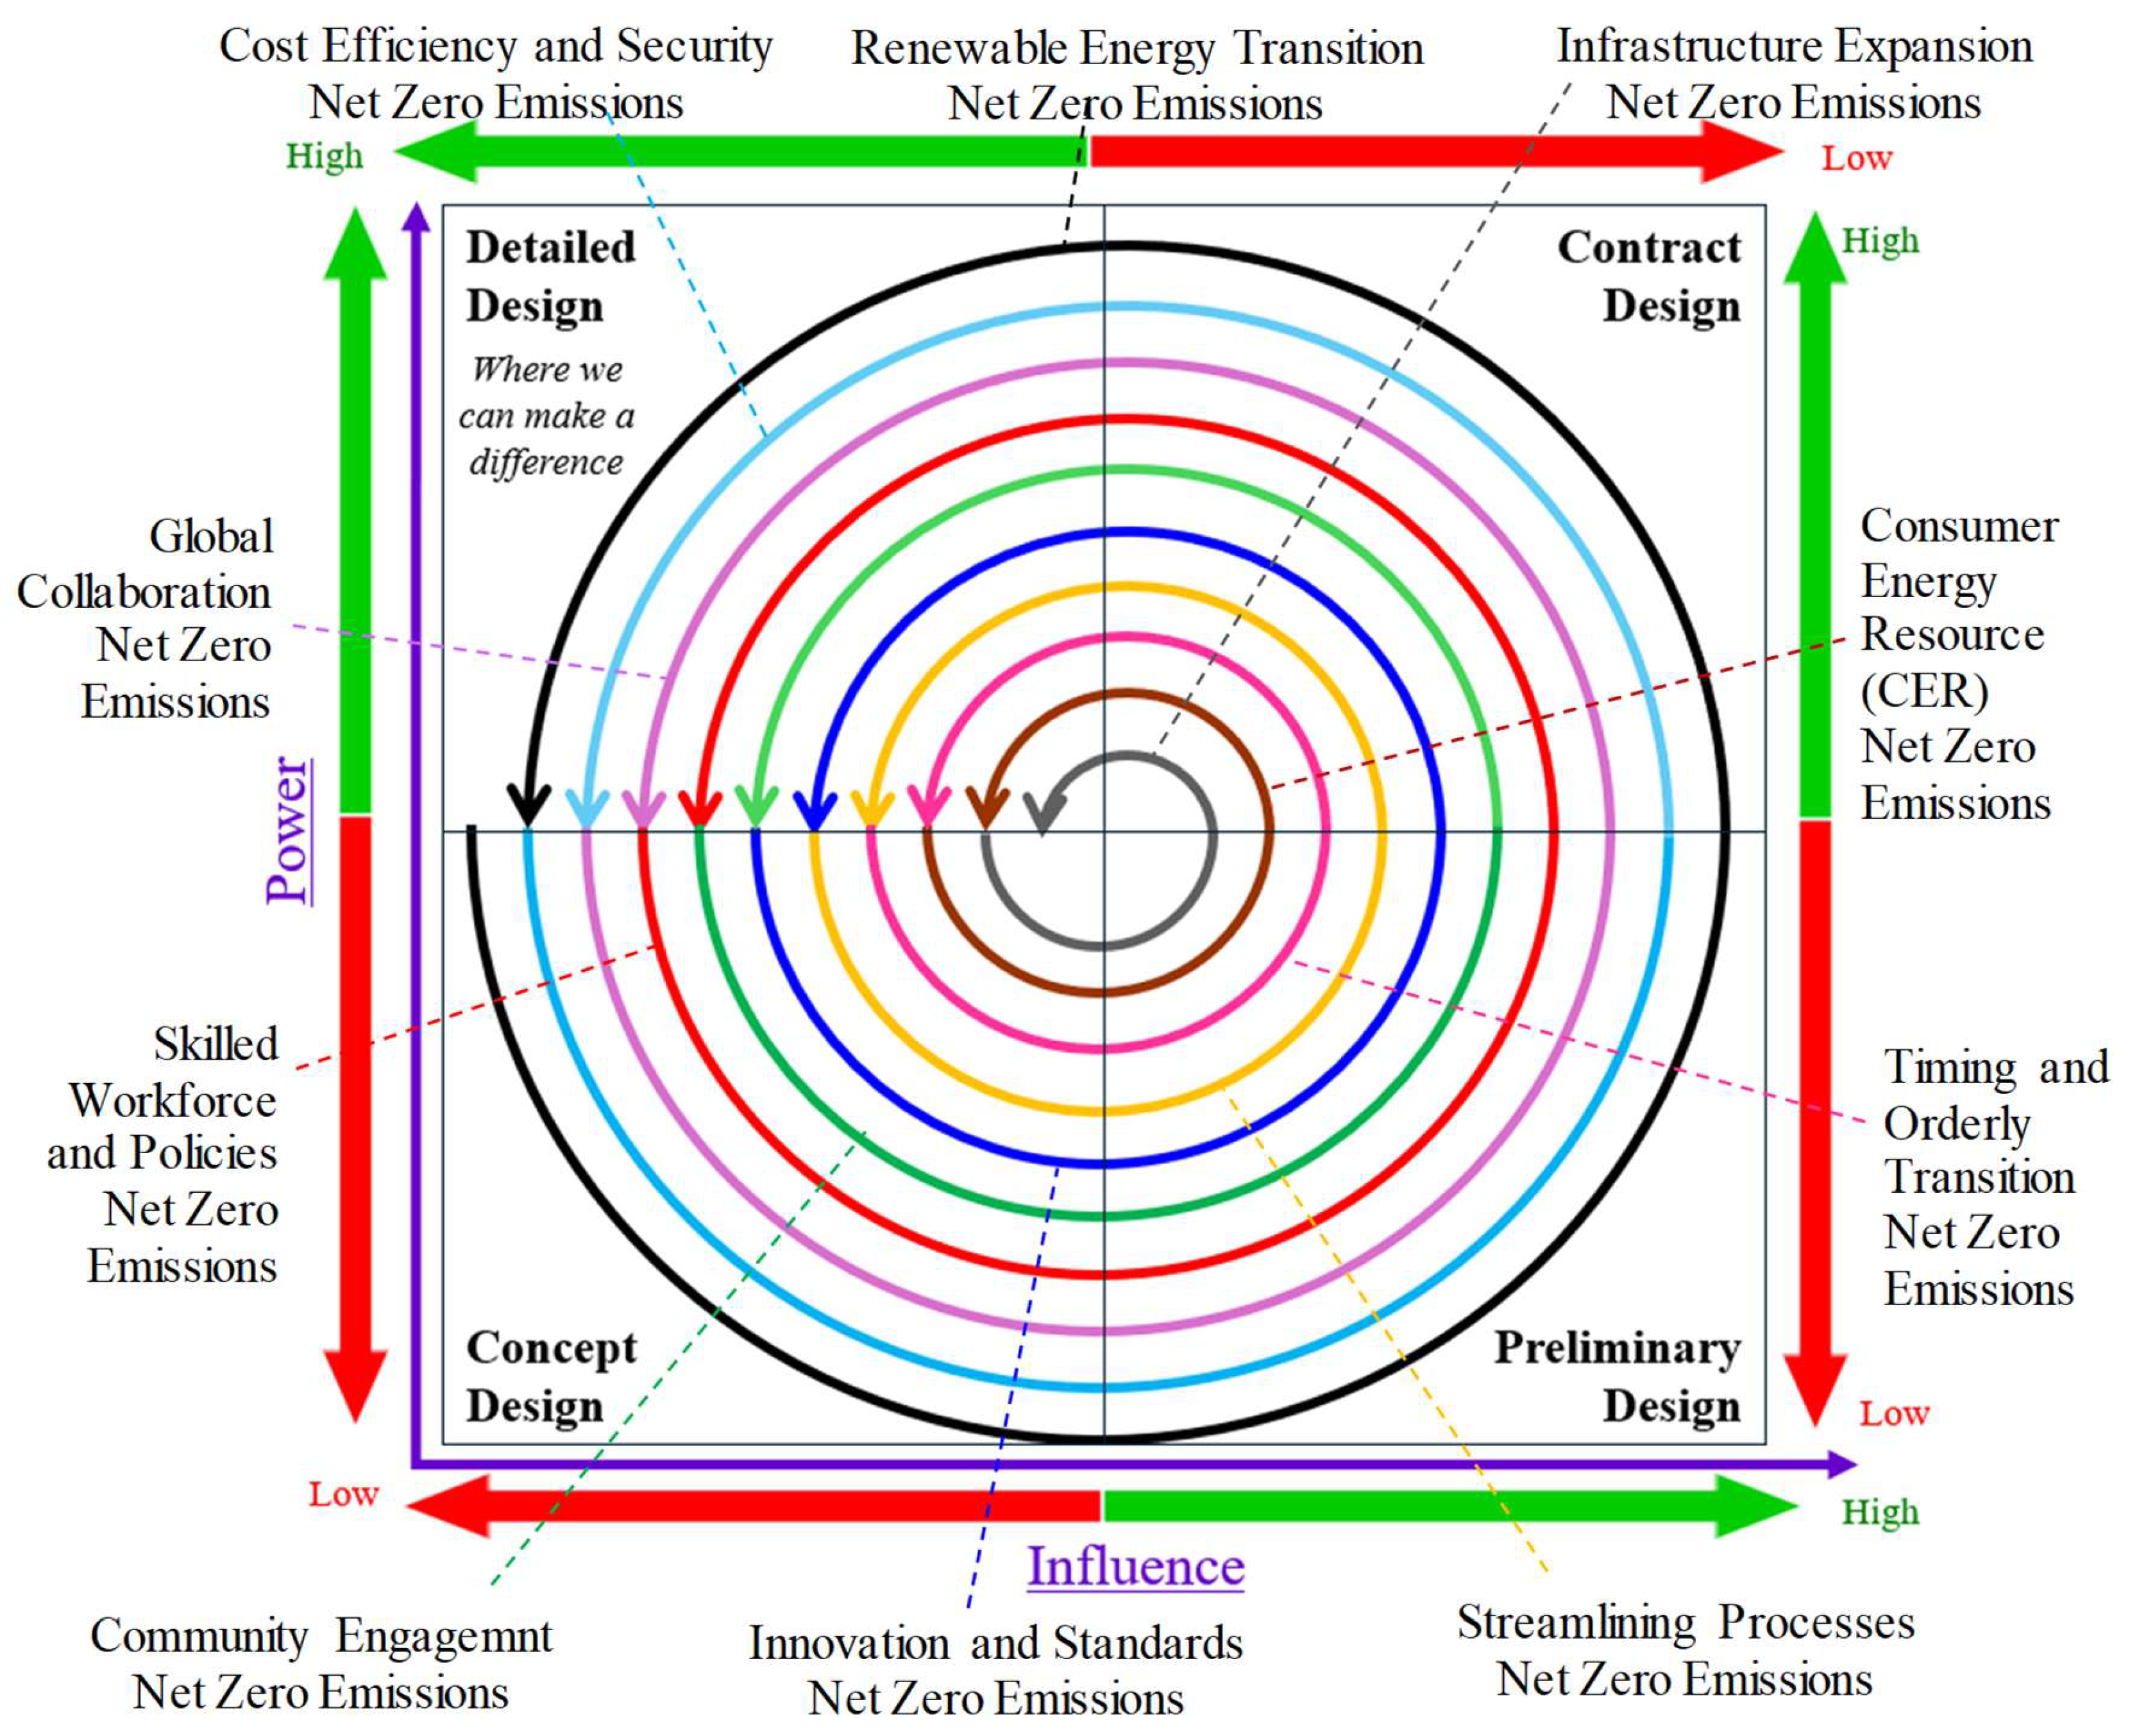
Figure 14.
Boundaries of Supply-Demand Policies.
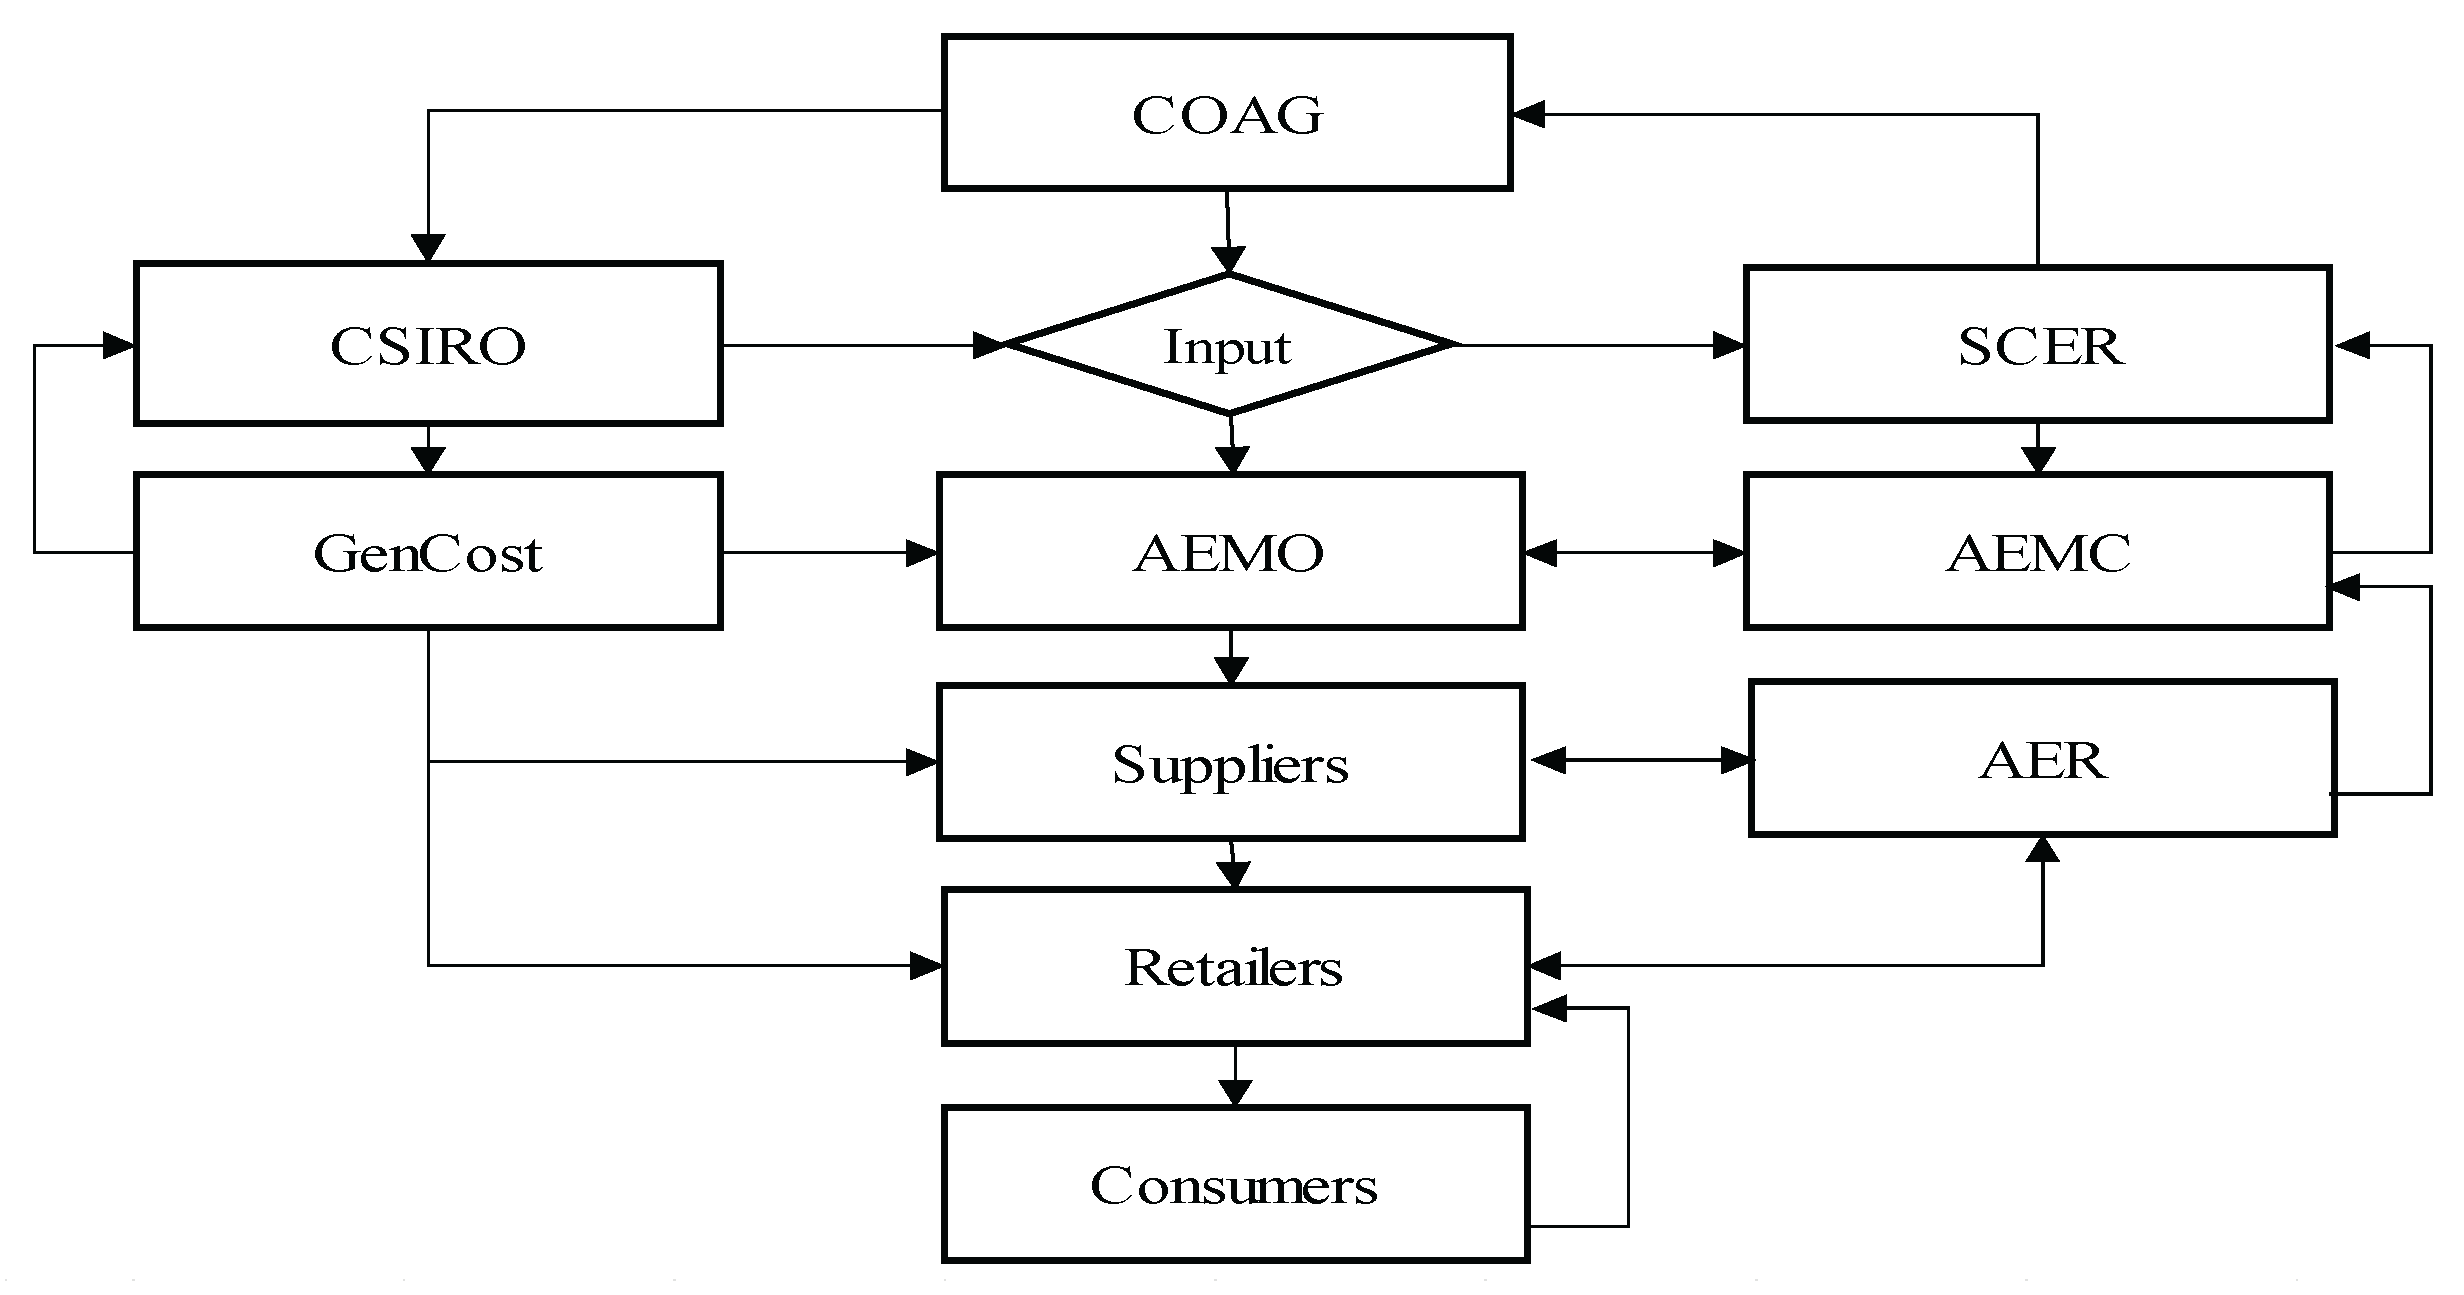
Table 1.
NEM Supply Mix Contribution by Fuel Type (Li et al., 2020).
| NRE | RE | |||||||||
| Quarter | Black Coal | Brown Coal | Gas | Liquid Fuel | Distributed PV | Wind | Grid Solar | Hydro | Battery | Biomass |
| Q1 2023 | 43.0% | 15.0% | 4.6% | 0.02% | 12.1% | 11.6% | 7.5% | 6.1% | 0.1% | 0.02% |
| Q2 2024 | 42.2% | 14.6% | 4.1% | 0.05% | 13.0% | 11.8% | 8.6% | 5.3% | 0.2% | 0.05% |
| Change | -0.8% | -0.4% | -0.5% | 0.03% | 0.9% | 0.3% | 1.1% | -0.7% | 0.1% | 0.03% |
Table 2.
Present and Future Capacity of RE (MW) (Csereklyei, Anantharama & Kallies, 2021).
| Future Plan | Solar | Wind |
Water/ Hydro |
Biomass | Battery Storage |
| Actual Adding Capacity | 180 | 2800 | 137 | 0 | 800 |
| Total Required Capacity | 21255 | 2985 | 7314 | 1945 | 224 |
| Total Proposed adding capacity by 2050 | 48683 | 127898 | 18071 | 333 | 74926 |
| Total Proposed adding capacity per year up to 2050 | 1947.32 | 5115.92 | 722.84 | 13.32 | 2997.04 |
| Committed adding Rate | 1980 | 2754 | 2450 | 0 | 3242 |
| Anticipated adding Rate | 1662 | 486 | 1998 | 0 | 4463 |
| Total Proposed adding capacity by 2050 | 48683 | 127898 | 18071 | 333 | 74926 |
| Upgrade/Expansion Rate | 0 | 0 | 0 | 0 | 0 |
Table 4.
Learning Rate and Momentum.
| Learning Rate | Momentum | Path | Global Minimum | Minimum Found |
| 0.05 | 0 | Low | True at the centre | Converges with overlapping path |
| 0.5 | 0 | Medium | True at the centre | Converges with unstable path |
| 0.8 | 0 | High | True at the centre | Converges with a highly erratic path |
| 0.05 | 0.5 | Low | True at the centre | Converges with a reasonably smooth path |
| 0.5 | 0.5 | Medium | True at the centre | Converges with a more stable path |
| 0.8 | 0.5 | Very high | True at the centre | Converges with fewer erratic steps |
| 0.05 | 0.9 | Low | True at the centre | smooth convergence |
| 0.5 | 0.9 | Medium | True at the centre | smooth convergence |
| 0.8 | 0.9 | High | True at the centre | Smoother and quicker convergence |
Table 3.
RE Planned Transitional Rates (MW).

Table 6.
Gradient Descent Optimization Results of LI, MI, and HI(1.0 denotes AEMO Reference Estimate = 100%).
Table 6.
Gradient Descent Optimization Results of LI, MI, and HI(1.0 denotes AEMO Reference Estimate = 100%).
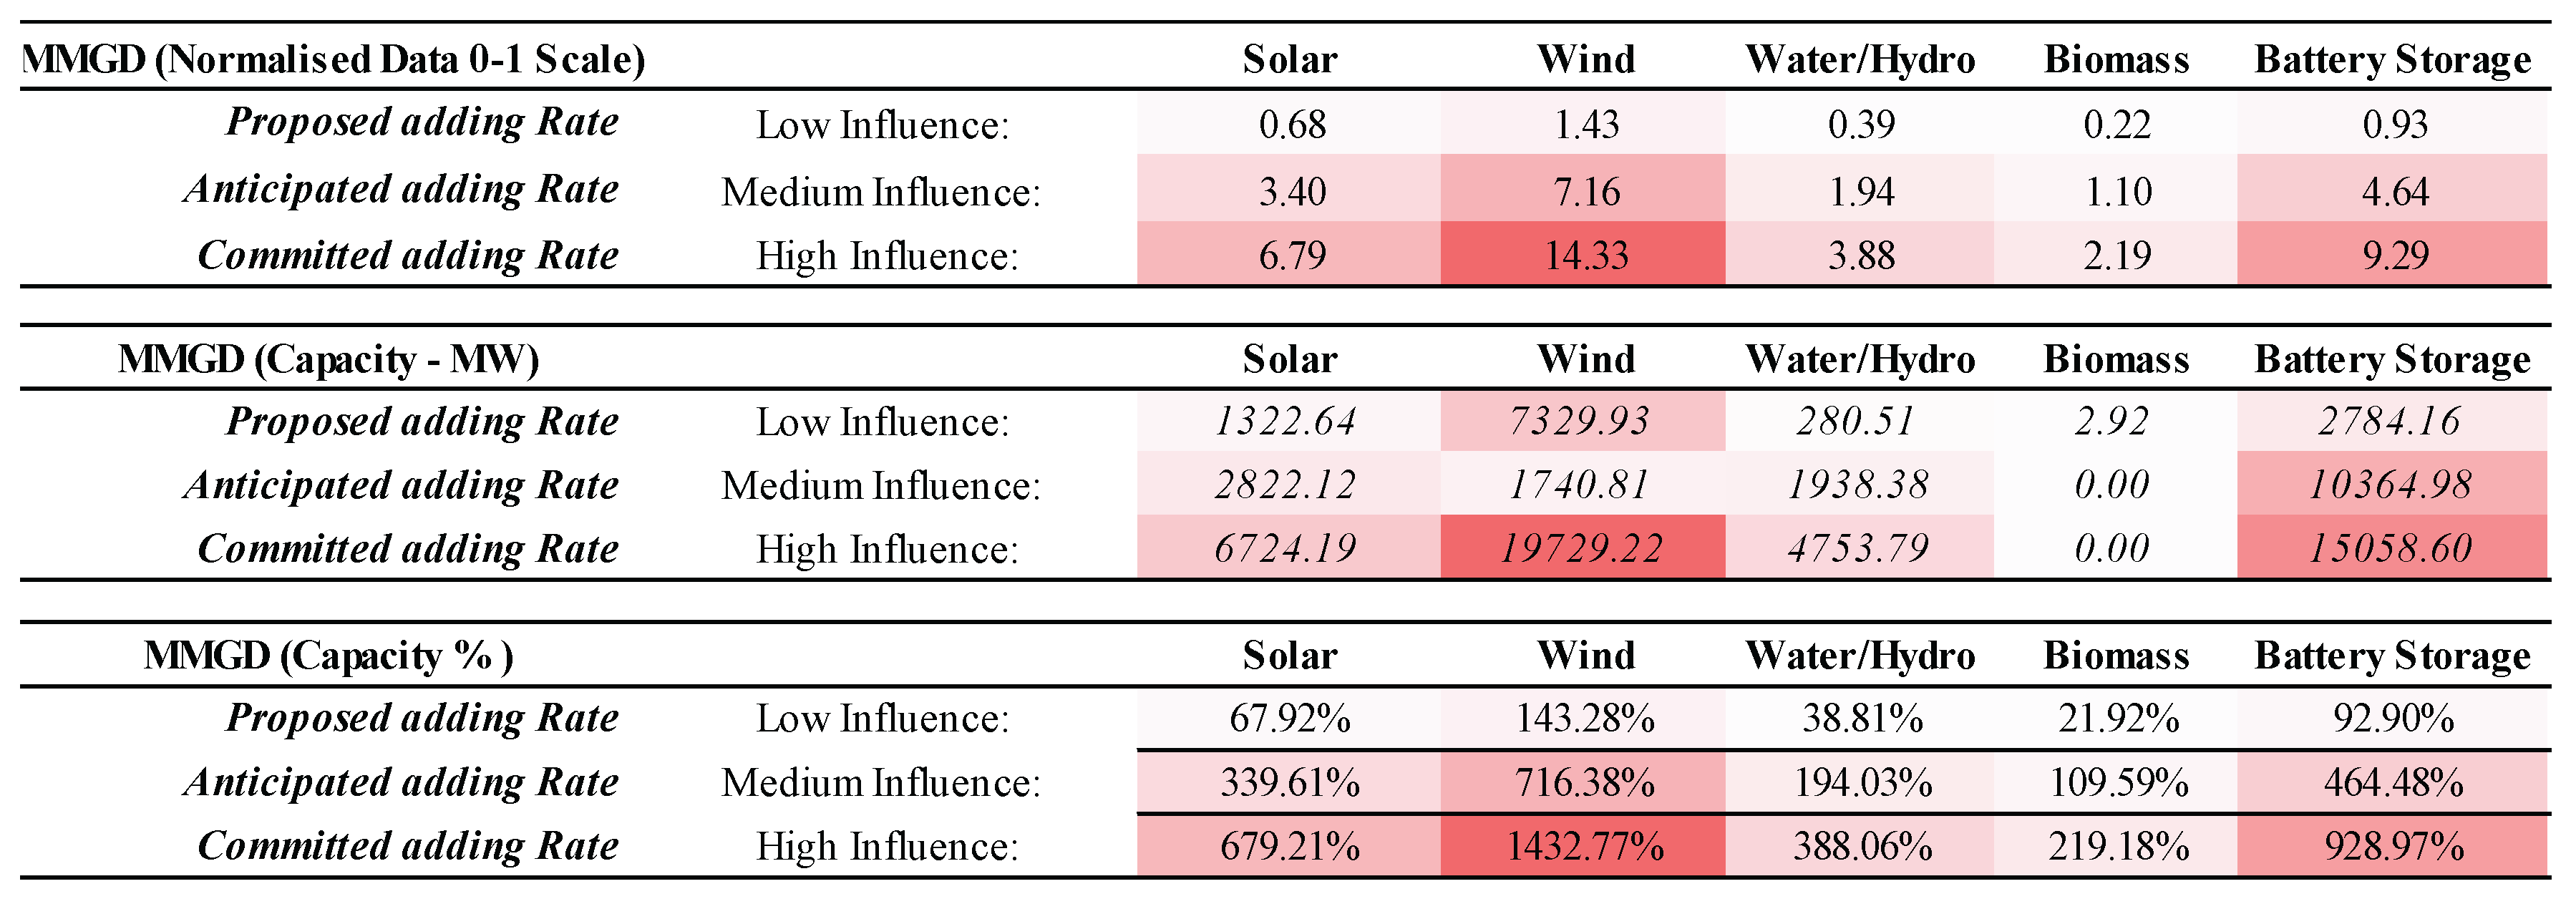
Disclaimer/Publisher’s Note: The statements, opinions and data contained in all publications are solely those of the individual author(s) and contributor(s) and not of MDPI and/or the editor(s). MDPI and/or the editor(s) disclaim responsibility for any injury to people or property resulting from any ideas, methods, instructions or products referred to in the content. |
© 2026 by the authors. Licensee MDPI, Basel, Switzerland. This article is an open access article distributed under the terms and conditions of the Creative Commons Attribution (CC BY) license.
Copyright: This open access article is published under a Creative Commons CC BY 4.0 license, which permit the free download, distribution, and reuse, provided that the author and preprint are cited in any reuse.


