
Submitted:
04 August 2026
Posted:
04 August 2026
You are already at the latest version
Preprints on COVID-19 and SARS-CoV-2
Abstract
Post-COVID balance and postural-control alterations have been reported after SARS-CoV-2 infection, but individual-level identification remains challenging because post-acute sequelae are heterogeneous and often lack clear clinical ground truth. We analyzed motion-capture balance data from 140 participants, including 114 post-COVID participants and 26 Controls, who completed sensory organization/postural balance tasks under standard and Stroop-augmented conditions. Relative joint-angle trajectories were transformed into 0–5 Hz frequency-domain spectra, from which 13 balance-derived task contrasts were constructed to capture responses to cognitive distraction, visual input removal, and task-condition changes. Joint-wise spectral contrast features were encoded using a vector-quantized variational autoencoder. Abnormal-like subgroup discovery was then formulated as a control-anchored, graph-based QUBO clustering problem and solved using a quantum annealing workflow, with Gaussian mixture modeling used as an unconstrained classical comparator. Control-anchored QUBO clustering identified a selective subset of post-COVID participants with abnormal-like latent balance profiles while largely preserving the Control reference structure. Across all task contrasts, QUBO assigned 1 of 307 Control contrast-level observations (0.3%) and 118 of 1366 post-COVID observations (8.6%) to the abnormal-like group, compared with 63 of 307 Control observations (20.5%) and 266 of 1366 post-COVID observations (19.5%) under GMM. Frequency-band profiles further suggested that QUBO-derived abnormal-like assignments corresponded to interpretable postural-control patterns, particularly in low-frequency postural-sway-dominant and normal postural-control activity bands. These findings support the feasibility of objective-driven, QUBO-based quantum-assisted clustering for exploratory subgroup discovery in heterogeneous, label-limited biomedical datasets. The proposed framework does not establish diagnostic criteria for Long COVID, but provides a hypothesis-generating approach for interpretable post-COVID neuromotor phenotyping and related medical data analysis applications.
Keywords:
post-COVID condition
; balance
; postural control
; motion capture
; frequency-domain analysis
; vector-quantized variational autoencoder
; QUBO
; quantum annealing
; unsupervised phenotyping
1. Introduction
Since the emergence of the COVID-19 pandemic, hundreds of millions of individuals worldwide have been infected with SARS-CoV-2. Although many patients recover from the acute phase of infection, a substantial proportion experience persistent symptoms that extend well beyond the initial illness. This condition, commonly referred to as long COVID or post-acute sequelae of COVID-19 (PASC), has been formally defined as the presence of new, returning, or ongoing symptoms several months after acute infection [1]. Epidemiological and biological studies indicate that long COVID affects a substantial subset of individuals after COVID-19 and may involve persistent multisystem abnormalities rather than a single disease mechanism [2,3]. A defining challenge of long COVID is its marked heterogeneity, with symptoms spanning fatigue, cognitive dysfunction, autonomic disturbance, sensory complaints, and neuromotor impairment [2]. This heterogeneity complicates objective identification, particularly when impairments are subtle, intermittent, or compensated by adaptive motor strategies. As a result, some individuals may perceive themselves as clinically recovered despite residual balance or postural-control abnormalities that can be detected using objective assessment [4,5]. Postural control provides a sensitive window into the interaction among visual, vestibular, proprioceptive, neuromuscular, and cognitive systems. Human balance is regulated through coordinated sensory integration and motor control mechanisms that stabilize the body during standing and movement [6]. Measures of postural steadiness have long been used to quantify balance differences across healthy adults, aging populations, and individuals with neurological or sensorimotor impairment [7]. In the context of COVID-19, emerging evidence suggests that infection history may be associated with changes in motor control, balance function, and movement coordination even after apparent clinical recovery [4,5,8]. Balance testing under sensory or cognitive perturbation may therefore reveal latent neuromotor deficits that are not readily apparent during routine clinical evaluation.
Despite this potential, translating balance and motion-capture measurements into reliable individual-level markers of post-COVID dysfunction remains challenging. Conventional balance metrics are influenced by substantial inter-individual variability, including differences in body morphology, habitual movement strategies, baseline postural sway, and compensatory control. These factors can obscure subtle disease-related effects, causing many studies to detect differences at the group level while leaving individual-level separation unresolved. This limitation is particularly important in long COVID, where abnormal neuromotor patterns may occur only in a subset of individuals rather than uniformly across the post-COVID population.
Frequency-domain analysis offers an alternative representation of postural-control dynamics by characterizing movement signals according to their spectral content. Spectral analysis of postural sway can capture changes in balance stability that may not be evident from time-domain measures alone [9]. Frequency-based analysis has also been used to interpret tremor-related movement components and distinguish low-frequency postural sway from higher-frequency oscillatory activity [10]. Our previous work showed that joint-wise spectral representations derived from inverse kinematics can reveal task-dependent group-level differences between post-acute COVID and non-COVID individuals, particularly under cognitive perturbation [11]. However, spectral analysis alone does not determine whether these group-level differences reflect a uniform post-COVID effect or distinct latent phenotypes within a heterogeneous population.
In the absence of reliable clinical ground truth for post-COVID neuromotor impairment, supervised classification approaches are inherently limited. The problem is better framed as phenotype discovery, in which latent subgroups are identified from high-dimensional data without predefined labels. Unsupervised learning has been widely used in biomedical research to discover computational phenotypes, latent disease clusters, and patient subgroups from noisy, sparse, or heterogeneous clinical data [12,13,14]. Autoencoder-based representation learning is well suited to this setting because it can compress high-dimensional observations into lower-dimensional latent spaces while preserving salient structure. Vector-quantized variational autoencoders (VQ-VAEs) extend this idea by learning discrete latent codebooks rather than purely continuous latent variables [15]. Discrete latent representations can support the aggregation of recurring patterns and provide an interpretable interface for downstream clustering of complex time-series or motion-derived data [16,17].
Classical clustering methods provide useful baselines for latent subgroup discovery but may impose assumptions that are not well matched to heterogeneous clinical data. Gaussian mixture modeling (GMM), for example, represents latent structure as a mixture of Gaussian components and is therefore influenced by the geometry and covariance structure of the latent space [18]. In post-COVID balance phenotyping, this can be problematic because the goal is not merely to partition latent space geometrically, but to identify abnormal-like subgroups while preserving the structure of the Control reference group. A clustering objective that explicitly incorporates relational structure and clinical assumptions may therefore be more appropriate for label-limited biomedical phenotyping.
Quantum computing is increasingly being explored as an emerging computational paradigm in biomedical science, with potential applications in drug discovery, molecular simulation, bioinformatics, genomics, multi-omics integration, and precision medicine [19,20]. Recent work has demonstrated proof-of-concept biomedical applications of quantum-enhanced algorithms, including molecular and drug-discovery workflows [21]. However, many medical applications of quantum computing remain at an early translational stage, and current studies should be framed cautiously in terms of potential rather than established clinical acceleration [19]. In this context, the value of quantum-assisted methods is not limited to hardware speed, but also includes the ability to formulate clinically meaningful problems as structured optimization objectives.
Quadratic unconstrained binary optimization (QUBO) provides a natural framework for encoding clustering and subgroup discovery as an explicit energy minimization problem. QUBO and related Ising formulations represent combinatorial optimization problems using binary decision variables and pairwise interactions [22,23]. Quantum annealing provides a hardware-assisted approach for sampling low-energy configurations of QUBO objectives, and recent studies have explored its use in optimization, clustering, scheduling, and graph-structured decision problems [24,25,26]. For biomedical phenotyping, a QUBO formulation is particularly attractive because prior structure can be encoded directly into the objective function. In the present setting, this allows control anchoring, sparsity of abnormal-like assignments, outlier preference, and graph smoothness over latent similarity relationships to be incorporated into a single optimization problem.
In this study, we propose a balance-focused, quantum-assisted framework for exploring post-COVID neuromotor phenotypes from motion-capture data. Participants completed seven sensory organization and postural balance tasks under standard and Stroop-augmented conditions. Relative joint-angle trajectories were transformed into 0–5 Hz frequency-domain spectra, from which 13 balance-derived task contrasts were constructed to capture responses to cognitive distraction, visual input removal, and task-condition changes. Full 256-bin joint-wise spectral contrast features were encoded using a VQ-VAE to obtain latent neuromotor representations. We then formulated abnormal-like subgroup discovery as a control-anchored, graph-based QUBO clustering problem and solved it using a quantum annealing workflow, with GMM used as an unconstrained classical comparator.
This work is exploratory and does not aim to establish diagnostic criteria for long COVID or to determine infection status. Instead, the goal is to test whether latent frequency-domain balance representations can be combined with a control-anchored QUBO objective to identify interpretable abnormal-like post-COVID balance phenotypes under label-limited and heterogeneous clinical conditions. Because latent clustering assignments are difficult to interpret physiologically on their own, we further summarized the joint-wise spectral contrast maps into predefined frequency bands to examine whether abnormal-like subgroups showed interpretable postural-control patterns. This band-wise analysis served as an explanatory layer linking the optimization-derived subgroup assignments to low-frequency sway, postural-control, compensatory, and tremor-like/high-frequency components.
By framing post-COVID balance phenotyping as a control-anchored graph optimization problem, this study provides an early step toward objective-driven quantum-assisted medical data analysis for individualized subgroup discovery. The resulting participant-level assignments were further examined using demographic information, available clinical notes, and frequency-band spectral profiles to evaluate whether the derived subgroups were clinically plausible and physiologically interpretable. The proposed framework is intended as a hypothesis-generating phenotyping approach rather than a diagnostic model.
2. Methodology
2.1. System Overview
This study uses an unsupervised analytical framework to identify balance-related neuromotor phenotypes from motion-capture-derived joint kinematic signals in a heterogeneous post-COVID cohort. An overview of the complete workflow is shown in Figure 1. The pipeline begins with standard sensory organization/postural balance tasks and Stroop-augmented balance conditions collected from Control and post-COVID participants. Relative joint-angle trajectories are extracted using inverse kinematics and transformed into 0–5 Hz frequency-domain spectral representations.
From these spectral representations, 13 balance-derived task contrasts are constructed to capture responses to cognitive distraction, visual input removal, and task-condition changes. Full 256-bin joint-wise spectral contrast features are encoded using a vector-quantized variational autoencoder (VQ-VAE) to obtain compact latent neuromotor representations. These latent representations are then analyzed using a control-anchored graph-based QUBO clustering objective solved through a quantum annealing workflow. Gaussian mixture modeling (GMM) is used as an unconstrained classical comparator to evaluate whether similar abnormal-like assignments arise from geometry-driven latent-space clustering alone.
The resulting contrast-level cluster assignments are aggregated into patient-level abnormal-like scores and interpreted using available demographic and clinical information, together with four-band spectral phenotype heatmaps. The framework is designed as an exploratory, hypothesis-generating approach for discovering control-preserving abnormal-like balance phenotypes under label-limited and heterogeneous clinical conditions. It is not intended to establish diagnostic criteria for Long COVID or to classify infection status.
2.2. Data Acquisition and Study Tasks
Motion-capture data were acquired during balance assessments using a unified sensing and recording protocol to ensure consistent measurement conditions across task conditions. A markerless, depth-based camera system (Microsoft Kinect series) was used to capture full-body kinematic data in three dimensions. All experimental procedures were approved by the Institutional Review Board of Florida Atlantic University (IRB No. 1423095-10), and written informed consent was obtained from all participants prior to data collection, in accordance with the Declaration of Helsinki. This study did not involve a clinical trial, and therefore clinical trial registration was not applicable.
COVID-19 status was determined from available study records, laboratory testing documentation, and clinical information. Participants classified as post-COVID had documented prior SARS-CoV-2 infection confirmed using clinically accepted COVID-19 testing, including RT-PCR or clinically validated antigen testing. All post-COVID participants included in the analysis cohort had a documented positive COVID-19 test before enrollment in the balance-assessment study. Where available, diagnosis dates and physician confirmation were recorded. Among the post-COVID participants, one individual had a physician-documented diagnosis of Long COVID established at a specialty clinic. Participants were included in the post-COVID group only after documented recovery from the acute phase of infection.
Participants in the Control group were defined as individuals without a known history of diagnosed COVID-19. Among the 26 Control participants in the analysis cohort, 22 had documented negative COVID-19 testing at study enrollment, whereas 4 reported no known prior COVID-19 history but did not have prior diagnostic confirmation available. Serological antibody testing was available for a subset of participants but was not required for group assignment. COVID classification was used for descriptive and comparative purposes only and was not used as a ground-truth label in the unsupervised analytical framework.
For each participant, three-dimensional joint position trajectories (x, y, z) were recorded for major body segments, including the pelvis, spine, neck and head, upper extremities, lower extremities, and selected facial landmarks. Joint positions were captured bilaterally for left and right body sides where applicable. The motion-capture system recorded kinematic data at approximately 30 frames per second, corresponding to an effective sampling interval of approximately 0.033 s. The number of temporal samples per trial varied depending on task duration. All recordings were processed using the same temporal resolution across participants and task conditions.
Each participant was asked to complete seven sensory organization and postural balance tasks in the following order: Romberg with eyes open, Romberg with eyes closed, Tandem Romberg with eyes open, Tandem Romberg with eyes closed, Clinical Test of Sensory Interaction on Balance (CTSIB) with eyes open, CTSIB with eyes closed, and Fukuda. These tasks were designed to probe postural stability, sensory integration, visual dependence, and compensatory balance control under varying task demands. The same seven tasks were then repeated under a Stroop-augmented balance condition, in which an auditory cognitive perturbation was presented during standing balance. This protocol allowed comparison between standard balance responses and balance responses under concurrent cognitive distraction.
The final analysis cohort included 140 participants with valid balance-task data, consisting of 26 Control participants and 114 post-COVID participants. Some participants did not complete every task condition; therefore, participants with incomplete task data were retained for task-specific analyses to avoid unnecessary loss of available data. Patient-level abnormal-like scores were subsequently normalized by the number of available task contrasts for each participant.
Basic demographic and clinical metadata, including age, sex, and available clinical notes, were used for descriptive and exploratory interpretation only and were not included as inputs to the analytical pipeline. Participant demographics for the analysis cohort are summarized in Table 1.
2.3. Joint-Wise Spectral Representation for Balance Analysis
This subsection describes the transformation of motion-capture-derived kinematic signals into joint-wise spectral representations for balance analysis. Three-dimensional joint trajectories were converted into relative joint-angle signals between connected body segments along the kinematic chain, allowing the representation to capture joint-level motion rather than absolute camera-space position. Each joint signal was then transformed into the frequency domain within the 0–5 Hz range and represented using 256 frequency bins. These full 256-bin joint-wise spectra served as the basis for balance-derived task contrasts, VQ-VAE latent representation learning, and downstream clustering.
2.3.1. Frequency-Domain Joint Representation
For each trial, relative joint-angle signals were derived from pairs of connected landmarks along the anatomical kinematic chain, including the axial skeleton, upper extremities, and lower extremities. Joint motion was parameterized using roll and pitch components, which were combined into a single vector-magnitude representation for each joint. Yaw was excluded because it was not essential for the balance tasks analyzed in this study and could introduce additional variability related to participant orientation rather than postural-control dynamics.
For each joint, the resulting motion signal was transformed into the frequency domain using the discrete Fourier transform (DFT). Spectral representations were retained within the 0–5 Hz range, corresponding to physiologically relevant frequencies for postural control and corrective balance responses. Frequencies above 5 Hz were excluded because they were considered more likely to reflect noise or non-voluntary high-frequency fluctuations than meaningful postural-control dynamics. To obtain a fixed-dimensional representation across trials of varying duration, the 0–5 Hz frequency axis was uniformly discretized into 256 frequency bins.
For each task condition, the raw joint-wise spectral magnitude for joint j and frequency bin f was denoted as . Balance-derived task contrasts were computed by subtracting the reference-condition spectrum from the target-condition spectrum:
The resulting contrast map was then normalized independently for each joint using the sum of absolute contrast magnitudes across the 256 frequency bins:
where and denote the raw spectral magnitudes for the target and reference task conditions, respectively, denotes the raw spectral contrast, denotes the normalized spectral contrast representation, and is a small constant used to avoid division by zero. This normalization was applied after contrast computation, thereby preserving the direction of spectral modulation between task conditions while reducing scale differences across participants, joints, and trials.
Based on the anatomical kinematic chain, a total of 17 joint-wise angle features were retained for subsequent analysis. These features spanned the trunk, head, upper extremities, lower extremities, and major joints involved in balance control. The resulting representation formed a structured joint-wise spectral contrast map with joint and frequency dimensions, which was used for VQ-VAE latent encoding and downstream clustering.
2.3.2. Stroop Versus Non-Stroop Task Contrasts
To quantify the effect of cognitive distraction on balance control, Stroop versus Non-Stroop task contrasts were constructed for all seven balance tasks: Romberg with eyes open, Romberg with eyes closed, Tandem Romberg with eyes open, Tandem Romberg with eyes closed, CTSIB with eyes open, CTSIB with eyes closed, and Fukuda. For each task, the raw joint-wise spectral representation obtained during the standard Non-Stroop condition was subtracted from the corresponding representation obtained during the Stroop-augmented balance condition. The resulting contrast map was then normalized at the joint level as described above.
The Stroop-related raw contrast was defined as:
where denotes the raw joint-wise spectral representation during the Stroop-augmented condition, and denotes the corresponding raw spectral representation during the standard balance condition. The normalized contrast representation, , was used as the input representation for downstream latent encoding. This procedure generated seven Stroop-related task contrasts and was designed to isolate spectral modulation associated with concurrent cognitive perturbation during balance control.
For visualization and physiological interpretation, contrast values can also be summarized as band-wise spectral differences:
For Stroop-related contrasts, the target condition corresponds to the Stroop-augmented balance condition, whereas the reference condition corresponds to the standard Non-Stroop balance condition for the same task. The term reference condition is used to avoid confusion with the Control participant group.
2.3.3. Closed-Eyes Versus Open-Eyes Task Contrasts
To quantify the effect of visual input removal on balance control, Closed-eyes versus Open-eyes task contrasts were constructed for the three balance tasks that included paired eyes-open and eyes-closed conditions: Romberg, Tandem Romberg, and CTSIB. These contrasts were computed separately for standard Non-Stroop balance tasks and Stroop-augmented balance tasks.
For compact notation, the visual-input removal contrast under the standard Non-Stroop condition was denoted as , where indicates the visual-input removal contrast and indicates the Non-Stroop condition. This raw contrast was defined as:
where and denote the raw spectral representations during the eyes-closed and eyes-open standard balance conditions, respectively. The normalized contrast representation, , was used for downstream latent encoding.
For Stroop-augmented balance tasks, the corresponding visual-input removal contrast was denoted as , where indicates the Stroop-augmented condition. This raw contrast was defined as:
where and denote the raw spectral representations during the eyes-closed and eyes-open Stroop-augmented balance conditions, respectively. The normalized contrast representation, , was used for downstream latent encoding. This procedure produced six Closed-eyes versus Open-eyes contrasts. Together with the seven Stroop versus Non-Stroop contrasts, this yielded 13 balance-derived task contrasts for downstream latent representation learning and clustering.
For band-wise visualization, the target condition corresponds to the eyes-closed task, whereas the reference condition corresponds to the eyes-open task of the same balance condition. This definition allows spectral modulation associated with visual input removal to be interpreted consistently while avoiding ambiguity with the Control participant group.
Although the full 256-bin spectral contrasts were used as inputs to the VQ-VAE and clustering pipeline, four frequency bands were also used for physiological interpretation and heatmap visualization: postural-sway-dominant activity, 0.0–0.5 Hz; normal postural-control activity, 0.5–1.5 Hz; corrective or overcompensatory activity, 1.5–3.5 Hz; and tremor-like/high-frequency components, 3.5–5.0 Hz. These band-wise summaries were used only for interpretation of group-level and phenotype-level spectral patterns and were not used as the primary input representation for latent encoding.
2.4. Discrete Latent Encoding via VQ-VAE
To move beyond descriptive spectral summaries and enable participant-level phenotype discovery, the joint-wise spectral contrast representations were encoded using a vector-quantized variational autoencoder (VQ-VAE). As summarized in the overall workflow in Figure 1, the VQ-VAE was used as an unsupervised representation-learning module between the spectral contrast generation stage and the downstream clustering stage. For each balance-derived task contrast, the normalized 0–5 Hz spectral contrast representation was resampled into 256 frequency bins, ensuring consistent input dimensionality across joints, tasks, and participants. Each input sample therefore consisted of a joint-wise spectral contrast map with 17 joint-angle features and 256 frequency bins. These full 256-bin spectral contrast maps were used as the input to the VQ-VAE.
The VQ-VAE architecture consisted of an encoder, a discrete codebook, and a decoder. The encoder mapped each normalized spectral contrast map into a continuous latent representation, which was then quantized by assigning each latent vector to its nearest codebook entry. In this study, the latent embedding dimensionality was set to 64, and the codebook consisted of 128 embedding vectors. The resulting quantized latent representation captured recurring spectral motion patterns across balance tasks while providing a compact representation for downstream unsupervised clustering.
The decoder was trained jointly to reconstruct the original spectral contrast input from the quantized latent representation. The training objective combined mean-squared reconstruction loss with the standard vector-quantization loss terms used to update the codebook and encourage encoder commitment to discrete embeddings. This reconstruction objective encouraged the discrete codebook to preserve task-relevant spectral structure while reducing the dimensionality of the original joint-wise frequency-domain representation. Compared with conventional autoencoders that rely on continuous latent variables, the discrete latent space induced by the VQ-VAE enables aggregation of recurring spectral patterns and provides a structured representation for unsupervised phenotype discovery.
The VQ-VAE was trained using all available balance-derived spectral contrast maps pooled across the 13 task contrasts, because all contrasts shared the same joint-wise frequency-domain input structure. Training was performed using the Adam optimizer with an initial learning rate of , a batch size of 32, and 600 training epochs. A cosine annealing learning-rate scheduler was used with and a minimum learning rate of . No obvious codebook collapse was observed during training, indicating that the learned discrete codebook retained usable latent diversity for downstream clustering.
After VQ-VAE encoding, the discrete latent codes were aggregated to construct participant-level representations for each balance-derived task contrast. Specifically, the occurrence frequency of each codebook entry was counted across the encoded joint-wise spectral representation, yielding a fixed-length latent histogram for each participant and contrast. This histogram summarized the distribution of learned spectral patterns in the discrete latent space.
All encoded joint-wise spectral components were pooled into a single histogram without explicit joint weighting. This avoided imposing a priori assumptions about the relative importance of specific joints and allowed the representation to reflect the collective distribution of joint-level spectral patterns. Each histogram was normalized to sum to one, resulting in a probability distribution over codebook entries that was invariant to the number of encoded components available for a given participant and task contrast.
Because the VQ-VAE was used for unsupervised representation learning rather than supervised prediction, model evaluation was not based on classification accuracy or held-out label performance. Instead, the trained encoder and codebook were used to extract participant-level latent histograms for each balance-derived task contrast. These latent histograms served as task-specific neuromotor signatures and were exported for downstream clustering, including control-anchored QUBO clustering and Gaussian mixture modeling as a classical comparator.
2.5. Control-Anchored Graph-Based QUBO Clustering
Following VQ-VAE encoding, participant-level latent representations were analyzed using a control-anchored graph-based QUBO clustering framework. QUBO and related Ising formulations provide standard representations for encoding combinatorial optimization problems as binary energy-minimization objectives [22,23]. In this study, the goal was to identify abnormal-like latent profiles while preserving the Control group as a normal-like reference structure. Clustering was performed independently for each of the 13 balance-derived task contrasts.
For each contrast, the VQ-VAE latent representation was first standardized and reduced using principal component analysis (PCA) [27]. PCA was applied after standardization, with the number of retained components selected automatically to preserve 95% of the explained variance. This PCA step was used as a hardware-aware preprocessing step to obtain a compact latent geometry for Control-distance scoring and graph construction. It was not intended to optimize clinical separation, but to reduce latent-space dimensionality while preserving the dominant latent variance for QPU-compatible BQM construction.
To quantify deviation from the Control reference distribution, a Control-distance score was computed for each participant. For participant i, the raw Control-distance score was defined as the mean Euclidean distance from that participant to its nearest Control samples in the PCA-transformed latent space, where . The raw scores were then robustly normalized to the range using the 5th and 95th percentiles, with values clipped to this interval. Higher values therefore indicate greater latent-space distance from the Control reference distribution.
A k-nearest-neighbor graph [28] was then constructed in the PCA-transformed latent space using . The kNN graph was used as a hardware-aware sparsification strategy: rather than constructing a fully connected participant graph, which would introduce a quadratic number of pairwise interactions, only local latent-neighborhood relationships were encoded in the QUBO smoothness term. This reduced BQM interaction density while preserving local geometric structure in the latent space. Pairwise distances between neighboring samples were converted into RBF affinities,
where is the Euclidean distance between neighboring participants i and j, and is the median of the nonzero kNN distances for the corresponding contrast. Duplicate symmetric edges were merged by retaining the stronger affinity.
For each participant i, a binary variable was defined as
The QUBO objective was formulated as
where denotes the normalized Control-distance score for participant i. The first term penalizes assignment of Control participants to the abnormal-like group, thereby anchoring the Control group to the normal-like reference state. The second term imposes sparsity on abnormal-like assignments among post-COVID participants. The third term rewards abnormal-like assignment for post-COVID participants that are farther from the Control reference distribution. The fourth term enforces graph smoothness by penalizing neighboring participants in the latent similarity graph when they are assigned different labels.
The QUBO weights were fixed as , , , and . These weights encode the intended behavior of the clustering objective: strong Control anchoring, sparse abnormal-like assignment, preference for Control-distant post-COVID samples, and local consistency over the latent similarity graph.
The QUBO was implemented as a binary quadratic model (BQM), a form suitable for quantum annealing and related binary optimization workflows, including clustering and graph-structured optimization problems [24,25,26]. The graph-smoothness term was expanded using the binary identity
which contributes linear biases to and and a quadratic interaction between the corresponding binary variables. Each contrast-specific BQM was solved using a D-Wave Advantage2 quantum annealing workflow through an embedding composite. For each BQM, 1000 reads were performed, and the chain strength was computed using uniform torque compensation. The lowest-energy sample was selected as the clustering solution for that contrast. To assess solution stability, the QPU sampling procedure was repeated three times; the resulting abnormal-like assignment patterns were unchanged across repeated runs, although best-energy values varied slightly.
The resulting binary assignments were interpreted as contrast-specific normal-like or abnormal-like labels. These labels were subsequently aggregated across the 13 task contrasts to compute participant-level abnormality scores.
2.6. Classical Comparator: Gaussian Mixture Modeling
Gaussian mixture modeling (GMM) was used as a classical unsupervised comparator for the QUBO-based clustering framework. GMM provides a probabilistic mixture-model representation of latent structure and is commonly used for unsupervised clustering in continuous feature spaces [18]. In this study, GMM was not intended to replace the control-anchored QUBO formulation, but rather to provide a conventional baseline for assessing whether abnormal-like participant assignments could be obtained from the same VQ-VAE latent representations without graph-based binary optimization or explicit Control anchoring.
For each of the 13 balance-derived task contrasts, the VQ-VAE latent features were standardized using z-score normalization and fitted with a two-component GMM. Unlike the QUBO-based clustering procedure, no PCA reduction and no k-nearest-neighbor graph construction were applied prior to the primary GMM fitting. This choice was intentional because the VQ-VAE latent histograms already represented a learned feature extraction step, and the full 128-dimensional latent representation preserved the complete discrete codebook distribution available for classical clustering. The number of mixture components was fixed at two to provide a direct normal-like versus abnormal-like comparison with the binary QUBO assignments. A diagonal covariance structure was used to improve stability in the high-dimensional latent space relative to the number of participants. The GMM was fitted with 50 random initializations and covariance regularization of .
Because GMM cluster labels are arbitrary and do not directly encode normal-like or abnormal-like status, clusters were mapped post hoc using their relationship to the Control reference distribution. For each participant, a Control-distance score was computed in the standardized latent space as the mean Euclidean distance to the nearest five Control participants, followed by robust normalization to the range using the 5th and 95th percentiles. The GMM cluster with the higher mean Control-distance score was assigned as the abnormal-like cluster, and the remaining cluster was assigned as normal-like.
For each participant and contrast, the fitted GMM therefore produced a binary normal-like or abnormal-like assignment, together with the posterior probability of belonging to the abnormal-like component. These contrast-specific assignments were used for participant-level abnormality scoring in the same manner as the QUBO-based assignments, allowing comparison between the control-anchored QUBO objective and an unconstrained, geometry-driven classical mixture model.
As a preprocessing sensitivity check, GMM was also fitted after the same PCA transformation used for QUBO graph construction. This analysis did not improve Control preservation: GMM-PCA assigned 182 of 307 Control contrast-level observations (59.3%) and 831 of 1366 post-COVID observations (60.8%) to the abnormal-like component, compared with 63 of 307 Control observations (20.5%) and 266 of 1366 post-COVID observations (19.5%) for the primary GMM analysis. Therefore, the primary GMM comparator was reported using the full VQ-VAE latent representation, while the GMM-PCA sensitivity results were retained only as a preprocessing check.
2.7. Participant-Level Abnormality Scoring
After contrast-specific clustering, binary normal-like and abnormal-like assignments were aggregated at the participant level. This aggregation was performed separately for the control-anchored QUBO clustering results and the GMM comparator results. For each participant p, an abnormal flag was defined for each available task contrast c as
Because not all participants completed all task contrasts, participant-level scores were normalized by the number of available contrasts. Let denote the number of task contrasts available for participant p, and let denote the number of abnormal-like contrast assignments:
The normalized abnormality score was then computed as
Thus, represents the abnormal-like contrast count, whereas represents the proportion of available task contrasts in which the participant was assigned to the abnormal-like group. This normalization allowed participants with incomplete task data to be retained while reducing bias from differences in the number of completed contrasts. Participants with fewer available contrasts were interpreted cautiously because a small number of abnormal-like assignments can have a larger effect on the normalized score.
Participants were also assigned to operational abnormality groups based on the number and proportion of abnormal-like contrast assignments. Participants with no abnormal-like contrast assignments were labeled as normal-like. Participants with one abnormal-like contrast assignment were labeled as having a single-test deviation. Participants with two abnormal-like contrast assignments were labeled as possible abnormal. Participants with three or more abnormal-like assignments and an abnormality score below 0.67 were labeled as probable abnormal. Participants with three or more abnormal-like assignments and an abnormality score of at least 0.67 were labeled as strong abnormal. These thresholds were prespecified for descriptive ranking and were not optimized against clinical outcomes. These labels were used as descriptive abnormality-burden categories and were not intended to represent clinical diagnostic categories.
For participant ranking, results were sorted primarily by normalized abnormality score and then by the number of abnormal-like task contrasts. For the QUBO-based method, additional tie-breaking was performed using the maximum and mean Control-distance scores. For the GMM comparator, ranking additionally incorporated the maximum and mean posterior probability of belonging to the abnormal-like GMM component. This ranking procedure was used to prioritize participants for exploratory review of abnormal-like neuromotor patterns.
Demographic and clinical metadata were merged with the ranked participant-level results for post hoc interpretation. Available metadata included age, sex, clinical notes, COVID-related documentation, long-COVID or fatigue-related notes, balance-related notes, cardiovascular or hypertension-related notes, autoimmune history, orthopedic or surgical notes, and Control-related notes. Age was calculated from date of birth and record date when valid date information was available. These metadata were used only for exploratory clinical review of the derived abnormality rankings and were not used as inputs to the VQ-VAE, QUBO clustering, GMM clustering, or abnormality scoring procedures.
Per-contrast abnormal flags were also retained for both QUBO and GMM outputs to identify which task contrasts contributed to each participant’s abnormality score. This allowed participant-level abnormality burden to be traced back to specific balance-derived contrasts while preserving the distinction between model-derived clustering assignments and clinical metadata.
3. Results
This section reports balance-derived neuromotor patterns identified from normalized joint-wise spectral contrasts, VQ-VAE latent encoding, and unsupervised clustering. Analyses were performed using 13 balance-derived task contrasts constructed from standard sensory organization/postural balance tasks and Stroop-augmented balance conditions. Because not all participants completed every task condition, contrast-specific sample sizes varied across analyses. Across the 13 balance-derived task contrasts, the number of available samples ranged from 123 to 132 participants per contrast, with Control sample sizes ranging from 22 to 25 and post-COVID sample sizes ranging from 101 to 108. Participant-level abnormality scores were therefore normalized by the number of available task contrasts for each participant, as described in the Methods. Contrast-specific sample availability is summarized in Table 2.
3.1. QUBO Optimization Characteristics Across Balance-Derived Contrasts
For each of the 13 balance-derived task contrasts, a separate control-anchored QUBO problem was constructed and solved. The number of binary variables corresponded to the number of participants available for that contrast and ranged from 123 to 132. The resulting kNN graph contained 2686 to 2981 edges across contrasts, which were encoded as quadratic interactions in the BQM. The RBF bandwidth varied across contrasts from 2.12 to 3.56, reflecting contrast-specific latent-space geometry after PCA transformation.
Across the 13 QUBO problems, the best observed energy ranged from to . These values summarize the optimization outcome for each contrast-specific BQM and should be interpreted as objective-specific energy values rather than directly comparable physiological severity scores across tasks. The contrast-specific QUBO optimization characteristics are summarized in Table 3.
3.2. Control-Anchored QUBO Clustering Identifies Selective Abnormal-like Balance Profiles
The lowest-energy QUBO solution for each contrast was converted into binary normal-like and abnormal-like assignments. Across all 13 contrasts, control-anchored QUBO clustering assigned only one Control contrast-level observation to the abnormal-like group, corresponding to 1 of 307 available Control contrast assignments. This single Control abnormal-like assignment occurred in the Romberg Closed-Eyes Stroop contrast. Thus, the QUBO formulation largely preserved the Control reference structure across balance-derived task contrasts.
In contrast, abnormal-like assignments were observed more consistently among post-COVID participants but remained sparse. Across individual task contrasts, the proportion of post-COVID participants assigned to the abnormal-like group ranged from 4.8% to 15.4%. Overall, 118 of 1366 available post-COVID contrast-level observations were assigned to the abnormal-like group, corresponding to 8.6% of post-COVID contrast-level assignments. The highest post-COVID abnormal-like assignment rate was observed for the CTSIB Open-Eyes Stroop contrast, with 16 of 104 post-COVID participants classified as abnormal-like.
This pattern indicates that the QUBO objective did not simply separate participants by COVID status. Instead, it identified a relatively small subset of post-COVID participants with abnormal-like latent balance profiles while preserving the Control reference structure. This selectivity is consistent with the heterogeneous nature of post-COVID neuromotor effects, in which balance-related abnormalities may be present only in a subset of individuals rather than uniformly across all post-COVID participants.
The contrast-level assignment rates are shown in Figure 2. Compared with GMM (Figure 2b), control-anchored QUBO clustering (Figure 2a) produced lower Control abnormal-like assignment rates across nearly all task contrasts, consistent with stronger preservation of the intended Control reference structure.
3.3. Participant-Level Abnormality Burden Across Task Contrasts
Participant-level abnormality burden was computed by aggregating contrast-specific abnormal-like assignments across the 13 available balance-derived task contrasts. For each participant, the abnormality count represented the number of contrasts assigned to the abnormal-like group, and the abnormality score represented this count normalized by the number of completed contrasts. This aggregation allowed incomplete task availability to be retained while enabling participant-level ranking.
The participant-level abnormality burden heatmaps are shown in Figure 3. Under control-anchored QUBO clustering, abnormal-like assignments were concentrated in a subset of post-COVID participants, while the Control group showed minimal abnormal-like burden. Most Control participants had no abnormal-like assignments across all available contrasts, consistent with the contrast-level preservation of the Control reference structure.
In contrast, GMM produced a broader distribution of abnormal-like assignments across both post-COVID and Control participants. This broader spread indicates that GMM was more likely to assign Control participants to abnormal-like latent components, consistent with the higher Control abnormal-like rates observed at the contrast level. These participant-level patterns support the interpretation that the control-anchored QUBO formulation better matched the intended sparse, Control-preserving abnormal-like phenotyping objective than the unconstrained GMM comparator.
3.4. Comparison with GMM Reveals Greater Control Contamination
To evaluate whether the abnormal-like assignments obtained from control-anchored QUBO clustering reflected a general property of the VQ-VAE latent space or were specific to the control-anchored graph-based objective, we compared the QUBO results with a two-component Gaussian mixture model (GMM) fitted independently to each task contrast. The GMM used diagonal covariance matrices and was fitted in the 128-dimensional VQ-VAE latent space after standardization. For each contrast, the GMM component with the higher mean Control-distance score was mapped to the abnormal-like group.
At the contrast level, GMM produced substantially higher abnormal-like assignment rates among Control participants than the QUBO-based method. Across the 13 task contrasts, the Control abnormal-like rate under GMM ranged from 4.5% to 37.5%, compared with 0.0% to 4.2% under control-anchored QUBO clustering. Aggregated across all Control contrast-level observations, GMM assigned 63 of 307 Control observations to the abnormal-like group, corresponding to 20.5%. In contrast, control-anchored QUBO clustering assigned only 1 of 307 Control observations to the abnormal-like group.
GMM also showed highly variable abnormal-like assignment rates among post-COVID participants, ranging from 4.6% to 45.2% across task contrasts. The highest abnormal-like rates occurred in Tandem Romberg Closed-Eyes Stroop, Fukuda, CTSIB Open-Eyes Stroop, and the Non-Stroop visual-removal Romberg contrast. However, because several of these contrasts also showed high Control abnormal-like rates, these GMM assignments appear to reflect broad latent-space separation rather than selective identification of a Control-preserving post-COVID abnormal-like balance profile.
This pattern was also evident at the participant level. Under GMM, only 5 of 26 Control participants were classified as normal-like across all available task contrasts. Moreover, 11 of 26 Control participants were assigned to probable or strong abnormality groups, compared with 35 of 114 post-COVID participants. The mean number of abnormal-like task contrasts was similar between Control and post-COVID participants under GMM, with 2.42 abnormal-like contrasts in Controls and 2.33 in post-COVID participants. These findings indicate that GMM captured broad latent-space heterogeneity but did not preserve the Control reference structure as strongly as the control-anchored QUBO formulation. Table 4 summarizes the contrast-level and participant-level differences between the QUBO-based method and GMM.
The GMM AIC and BIC values confirmed that the two-component mixture models were successfully fitted across contrasts, but these criteria do not evaluate whether the resulting clusters satisfy a Control-preserving phenotyping objective. This is consistent with the role of GMM as a geometry-driven latent-space clustering method: it can partition the latent distribution into Gaussian components, but it does not explicitly encode Control anchoring, sparsity of abnormal-like assignments, or graph smoothness. In contrast, the QUBO objective incorporated these assumptions directly into the optimization problem, resulting in more selective abnormal-like assignments and stronger preservation of the intended Control reference group.
3.5. Exploratory Clinical Review of QUBO and GMM Participant-Level Rankings
To assess the clinical plausibility of the participant-level rankings, we performed an exploratory post hoc review of available clinical notes for selected participants. Clinical notes, demographic variables, and diagnostic annotations were not used as inputs to the VQ-VAE, QUBO clustering, GMM clustering, or participant-level abnormality scoring. Therefore, this analysis should be interpreted as a qualitative clinical-context review rather than diagnostic validation.
Among participants with available clinical notes, PC013 represented the clearest supportive case. This participant was the only individual in the cohort with a physician-documented Long COVID evaluation note in the available records. Control-anchored QUBO scoring assigned this participant to the probable abnormal group, with abnormal-like assignments in 4 of 10 available task contrasts. GMM also assigned this participant to the probable abnormal group, with abnormal-like assignments in 5 of 10 available task contrasts. Although the exact ranks differed between methods, both approaches identified this participant as having elevated abnormality burden across the available balance-derived contrasts. This concordance supports the clinical plausibility of the latent balance phenotype identified in this case, while remaining exploratory because clinical notes were incomplete and were not used as model inputs.
However, the GMM rankings showed a different pattern from the QUBO-derived rankings. GMM assigned high abnormality burden to several Control participants. A notable example was NC008, a Control participant who was ranked first by GMM and assigned to the abnormal-like group in all 7 of 7 available task contrasts. In contrast, QUBO classified the same participant as having only a single-test deviation, with abnormal-like assignment in 1 of 7 available contrasts. Because this participant had fewer available task contrasts than many other participants, the GMM rank should not be interpreted as an absolute clinical severity ranking. Nevertheless, this case illustrates that GMM was more likely to produce high abnormality burden in Control participants, whereas QUBO produced a more conservative abnormal-like assignment relative to the Control-anchored objective.
A similar pattern was observed in other Control participants. Several Controls, including NC002, NC003, NC004, and NC005, were assigned possible or probable abnormality burden by GMM despite available notes indicating no known COVID history or negative antibody status in some cases. In contrast, QUBO classified these Control participants as normal-like across their available task contrasts. These selected examples are consistent with the contrast-level and participant-level analyses showing greater Control contamination under GMM compared with control-anchored QUBO clustering.
Clinical notes related to non-COVID conditions or testing artifacts also did not necessarily correspond to high QUBO abnormality burden. For example, PC080 had notes indicating chronic fatigue or long-hauler symptoms, autoimmune history, and cardiovascular issues, but QUBO classified this participant as having only a single-test deviation. GMM, in contrast, classified this participant as probable abnormal. Similarly, NC018 had notes indicating discomfort during balance testing and wall-holding behavior, yet QUBO classified this participant as normal-like, whereas GMM classified the participant as probable abnormal. These cases suggest that GMM may be more sensitive to broad latent-space deviations, including deviations that may reflect non-COVID variability or testing artifacts, whereas QUBO produced more selective abnormal-like assignments relative to the Control-anchored objective.
Selected clinical-note examples are summarized in Table 5. Overall, this exploratory review does not establish that control-anchored QUBO clustering can diagnose Long COVID or identify all clinically abnormal participants. Rather, it suggests that the QUBO-derived participant rankings were clinically plausible in selected cases: the participant with the clearest available Long COVID note was assigned to an abnormal-like subgroup, while most Control participants were preserved as normal-like. In contrast, GMM produced broader abnormal-like assignments and included more Control participants among high-burden cases, suggesting that GMM captured general latent heterogeneity but was less aligned with the intended Control-preserving post-COVID abnormal-like phenotyping objective.
3.6. Frequency-Band Interpretation of Abnormal-like Balance Profiles
3.6.1. Band-Averaged Physiological Profiles
To interpret the abnormal-like balance profiles in physiologically meaningful terms, we summarized the joint-wise spectral contrast maps into four predefined frequency bands. The full joint-resolved heatmaps contained 17 joint pairs and were useful for detailed inspection, but were difficult to compare across contrasts and clustering methods. Therefore, for the main frequency-band interpretation, Energy values were averaged across the 17 joint pairs within each frequency band. This produced compact band-level profiles for each task contrast, participant subgroup, and clustering method.
The four frequency bands were interpreted as postural-sway-dominant activity, normal postural-control activity, corrective or overcompensatory activity, and tremor-like/high-frequency components. In the present analysis, interpretation focused primarily on Band 1 and Band 2, because these low-frequency and mid-low-frequency components are most directly related to postural sway and balance-control dynamics. Band 3 and Band 4 were retained for visualization and exploratory interpretation, but were interpreted more cautiously because they may reflect compensatory movement, high-frequency correction, tremor-like activity, measurement noise, or task-specific movement artifacts.
Figure 4 and Figure 5 show the compact frequency-band profiles for the Stroop versus Non-Stroop contrasts and the visual-removal contrasts, respectively. In each panel, the original Control and post-COVID group profiles are shown alongside post-COVID normal-like and abnormal-like profiles derived from control-anchored QUBO clustering and GMM. This layout allows direct comparison between the original diagnostic grouping and the latent subgroups identified by each unsupervised method.
3.6.2. Band-Specific Patterns in QUBO and GMM Subgroups
Across the Stroop versus Non-Stroop contrasts, QUBO-derived abnormal-like profiles frequently showed stronger band-specific separation than the corresponding GMM profiles. In several contrasts, including Romberg Open Eyes, Tandem Romberg Open Eyes, CTSIB Closed Eyes, and Fukuda, the QUBO abnormal-like subgroup showed more prominent changes in Band 1 and Band 2 compared with the QUBO normal-like subgroup and the post-COVID original group. This suggests that the QUBO abnormal-like assignments captured a subset of post-COVID participants with more distinct low-frequency balance-control responses that were partially averaged out when all post-COVID participants were analyzed together.
In Romberg Open Eyes, for example, the QUBO abnormal-like profile showed a stronger decrease in Band 1 and a stronger increase in Band 2 relative to the post-COVID original group, while preserving the overall direction of the post-COVID response. Similar Band 1/Band 2 separation was observed in Tandem Romberg Open Eyes and Fukuda. These patterns suggest that, for several Stroop-related contrasts, QUBO selected abnormal-like subgroups whose frequency-band responses were not simply arbitrary partitions of the latent space, but reflected interpretable changes in postural-control dynamics.
Romberg Closed Eyes showed a different pattern. In this contrast, the QUBO normal-like and abnormal-like profiles showed Band 1/Band 2 directions that were less consistent with the post-COVID original profile than in other Stroop contrasts. This made the physiological interpretation of the QUBO partition less straightforward for this task. Notably, Romberg Closed Eyes was also the only contrast in which a Control participant was assigned to the abnormal-like group by control-anchored QUBO clustering, as shown in Figure 3. This suggests that the Romberg Closed-Eyes Stroop contrast may represent a more difficult latent separation problem than the other Stroop contrasts.
In CTSIB Open Eyes, the QUBO abnormal-like profile showed attenuation rather than amplification of the original post-COVID band pattern. This indicates that abnormal-like profiles do not necessarily correspond to increased Energy in all tasks. Instead, abnormal-like balance phenotypes may involve either amplification, attenuation, or inversion of specific frequency-band responses depending on the sensory and cognitive context of the task.
The visual-removal contrasts showed additional task-dependent patterns. In the Non-Stroop Romberg and Non-Stroop CTSIB contrasts, QUBO abnormal-like profiles showed increased Band 1 and decreased Band 2 relative to the post-COVID original group, suggesting altered low-frequency sway and postural-control responses when visual input was removed. In the Non-Stroop Tandem Romberg contrast, however, the QUBO abnormal-like profile showed a stronger Band 3 component, suggesting that the more challenging tandem stance may induce compensatory spectral responses rather than a simple increase in low-frequency sway.
Under Stroop-augmented visual-removal conditions, the CTSIB contrast showed a particularly strong QUBO abnormal-like pattern, with increased Band 1 and decreased Band 2 relative to the post-COVID original group. This pattern suggests that the combination of visual removal and cognitive load may reveal abnormal-like balance-control responses in a subset of post-COVID participants. However, because this contrast also had a less favorable QUBO energy than several other contrasts, the physiological interpretation should remain exploratory.
Compared with QUBO, GMM profiles were generally less selective. In several contrasts, GMM abnormal-like profiles resembled the post-COVID original group more closely and showed weaker separation from the GMM normal-like profiles. In other cases, GMM produced large band-specific changes in the normal-like group rather than in the abnormal-like group, or generated profiles that appeared broadly blended across subgroups. This is consistent with the earlier observation that GMM captured latent-space heterogeneity but produced greater Control contamination and less Control-preserving abnormal-like assignment than the QUBO formulation.
3.6.3. Relationship Between QUBO Energy and Band-Profile Interpretability
The frequency-band profiles also suggested a relationship between QUBO optimization behavior and downstream interpretability. As summarized in Table 3, each task contrast was solved as a separate QUBO problem, yielding a contrast-specific best energy. This energy reflects the degree to which the final binary assignment satisfied the combined control-anchoring, sparsity, outlier-reward, and graph-smoothness terms in the QUBO objective.
Contrasts with less favorable best-energy values tended to produce band profiles that were more difficult to interpret physiologically. The clearest example was the Romberg Closed-Eyes Stroop contrast, which had the highest best energy among the QUBO problems. This contrast also showed less consistent Band 1/Band 2 separation in the QUBO frequency-band profiles and was the only contrast in which QUBO assigned a Control participant to the abnormal-like group. Similarly, the Non-Stroop Tandem Romberg visual-removal contrast had a best energy close to zero and showed a more complex abnormal-like profile, with changes extending beyond Band 1 and Band 2 into Band 3.
In contrast, several lower-energy QUBO solutions produced more interpretable abnormal-like band profiles. In these contrasts, the QUBO abnormal-like subgroup often showed Band 1/Band 2 patterns that were directionally related to the post-COVID original profile but more strongly separated from the QUBO normal-like subgroup. This suggests that lower-energy solutions may correspond to binary partitions that more closely satisfy the intended control-anchored abnormal-like objective and yield more physiologically interpretable patterns.
Importantly, QUBO energy was not interpreted as a physiological severity score or clinical validity metric. Energy values depend on contrast-specific sample size, graph structure, RBF affinity weights, penalty terms, and the overall objective landscape. Therefore, best energy values should not be compared directly as measures of biological abnormality across tasks. Instead, the present post hoc analysis suggests that QUBO energy may serve as an optimization-level indicator of how well a contrast-specific abnormal-like partition satisfies the intended objective and how suitable that partition may be for downstream physiological interpretation.
Overall, the frequency-band analysis supports two complementary findings. First, QUBO-derived abnormal-like profiles often showed interpretable band-specific postural-control patterns, particularly in Band 1 and Band 2, whereas GMM profiles were more blended and less selective. Second, contrast-specific QUBO energy provided useful context for interpreting the plausibility of the derived band profiles. These findings should be considered exploratory and hypothesis-generating, as no independent clinical ground truth was available for validating specific frequency-band balance phenotypes.
4. Discussion
This study demonstrates the feasibility of a control-anchored, QUBO-based framework for identifying abnormal-like balance phenotypes in a heterogeneous post-COVID cohort using frequency-domain motion representations and unsupervised latent clustering. The main finding is not that post-COVID status can be directly detected from balance data, but that a subset of post-COVID participants exhibited abnormal-like latent balance profiles while the Control reference structure was largely preserved. This distinction is important because post-COVID status represents infection history rather than ground truth for persistent neuromotor impairment. The observation that most post-COVID participants were assigned to normal-like profiles is therefore not a failure of the model, but is consistent with the expected heterogeneity of post-acute sequelae, where balance-related dysfunction may be present only in a subset of individuals.
A key contribution of this work is the use of an objective-driven QUBO formulation rather than a purely geometry-driven clustering model. The QUBO objective explicitly combined Control anchoring, sparsity of abnormal-like assignments, Control-distance reward among post-COVID participants, and graph smoothness over the latent kNN structure. This design encouraged abnormal-like assignments only when they were both distant from the Control reference distribution and locally supported by the latent graph, while penalizing abnormal-like assignment among Controls. In contrast, GMM provided a useful classical comparator but addressed a different clustering question: it partitioned the latent feature distribution into Gaussian components without explicitly encoding Control preservation, sparsity, or graph consistency. Thus, GMM appeared sensitive to latent-space heterogeneity, but not necessarily specific to a Control-preserving abnormal-like post-COVID balance phenotype. This difference likely explains why GMM produced broader abnormal-like assignments and greater Control involvement, whereas QUBO produced more selective abnormal-like profiles aligned with the intended control-anchored objective. This does not imply that GMM failed as a clustering method; rather, it highlights the mismatch between an unconstrained mixture-model objective and the specific Control-preserving abnormal-like phenotyping objective of this study.
The frequency-band analysis provided an explainable view of what the clustering models appeared to separate. By averaging the joint-wise spectral contrast maps across 17 joint pairs within predefined frequency bands, we obtained compact physiological profiles for each task contrast and subgroup. These profiles suggested that QUBO-derived abnormal-like assignments often corresponded to interpretable changes in Band 1 and Band 2, which reflect low-frequency postural-sway-dominant activity and normal postural-control activity. In several contrasts, the QUBO abnormal-like subgroup showed stronger or more directionally coherent Band 1/Band 2 separation than the post-COVID original group, suggesting that group-level averaging may obscure subgroup-specific balance-control responses. In this sense, the band-level analysis functioned as an explanatory layer for the latent clustering output: it did not prove a clinical mechanism, but it helped translate abstract latent assignments into interpretable balance-response patterns. GMM profiles, in comparison, were often more blended or showed stronger responses in normal-like groups, consistent with the broader and less selective abnormal-like assignment behavior observed in the clustering results.
The QUBO energy values provided an additional optimization-level context for interpreting contrast-specific solutions. Best energy was not treated as a physiological severity score or clinical validity metric, because it depends on sample size, graph structure, RBF affinity weights, penalty terms, and the contrast-specific objective landscape. Nevertheless, post hoc inspection suggested that contrasts with less favorable energy values tended to yield band profiles that were more difficult to interpret physiologically. For example, the Romberg Closed-Eyes Stroop contrast had the highest best energy, showed less consistent Band 1/Band 2 separation, and was the only contrast in which a Control participant was assigned to the abnormal-like group. Similarly, the Non-Stroop Tandem Romberg visual-removal contrast had a best energy close to zero and produced a more complex abnormal-like band profile. These observations suggest that QUBO energy may serve as an optimization-level indicator of how well a contrast-specific binary assignment satisfies the intended control-anchoring, sparsity, outlier-reward, and graph-smoothness objective. This interpretation remains exploratory, but it provides a potentially useful bridge between the mathematical optimization output and downstream physiological interpretability.
Several limitations should be considered. First, the cohort size was modest, particularly for the Control group, and only one participant had a physician-documented Long COVID evaluation note in the available records. Therefore, the clinical review should be interpreted as exploratory plausibility assessment rather than diagnostic validation. Second, COVID status was used only as descriptive context and should not be interpreted as ground truth for persistent neuromotor impairment. Third, clinical notes were incomplete and heterogeneous, and standardized symptom scales, vestibular assessments, autonomic measures, fatigue scores, and longitudinal outcome data were not available for all participants. Fourth, the QUBO weights were fixed across all task contrasts. Although this avoided contrast-specific tuning after observing the results, it also means that the same Lagrange parameters were applied to latent graphs with different sample sizes, affinity structures, Control-distance distributions, and optimization landscapes. Fifth, PCA reduction and kNN graph sparsification were used as hardware-aware preprocessing steps to obtain compact QPU-compatible BQM formulations. Although PCA preserved 95% of the explained latent variance and kNN sparsification preserved local graph structure, these steps may discard lower-variance latent directions or longer-range graph relationships that could be relevant to phenotype discovery. Finally, the present study did not benchmark full end-to-end computational runtime or compare classical and quantum optimization under systematically matched solver conditions. These findings should therefore be interpreted as evidence of methodological feasibility and exploratory clinical plausibility, not as diagnostic proof of Long COVID or as evidence of practical quantum speedup.
Although external diagnostic ground truth for post-COVID balance impairment was not available, several indirect lines of evidence supported the plausibility of the abnormal-like assignments. First, the control-anchored QUBO method assigned very few Control observations to the abnormal-like group, indicating that the inferred abnormal-like pattern was not simply a broad redistribution of latent-space variability across all participants. Second, the proportion of post-COVID participants with abnormal-like burden was compatible with the expectation that persistent balance-related dysfunction would occur only in a subset of individuals rather than across the entire post-COVID cohort. Third, the abnormal-like assignments were accompanied by interpretable frequency-band differences in postural-control-related spectral components. Finally, the participant with physician-documented Long COVID was identified as abnormal-like by both the QUBO method and the GMM comparator, providing limited but clinically consistent case-level support. Taken together, these observations do not establish diagnostic validity, but they provide convergent internal and exploratory clinical support for the presence of a meaningful abnormal-like balance subgroup.
5. Future Work
Future work should validate this framework in larger and more clinically characterized cohorts, including participants with physician-confirmed Long COVID, standardized symptom inventories, vestibular and autonomic assessments, fatigue measures, and longitudinal follow-up. Such data would allow QUBO-derived abnormal-like balance profiles to be tested against clinically meaningful outcomes rather than interpreted only through exploratory clinical notes. Independent validation cohorts will also be needed to determine whether the frequency-band phenotypes observed here are reproducible across sites, sensors, and participant populations.
A second direction is systematic optimization of the QUBO formulation. In the present study, a single set of QUBO weights was used across all task contrasts. Future studies should evaluate sensitivity to the Control-anchoring, sparsity, outlier-reward, and graph-smoothness weights, and should investigate adaptive or data-driven strategies for selecting these parameters. Lagrange weights could be adjusted according to graph density, Control-distance separation, subgroup sparsity targets, or energy stability. In parallel, the relationship between QUBO energy and physiological interpretability should be tested using repeated solver runs, bootstrapped participant subsets, alternative graph constructions, and perturbation analyses.
The interpretability framework can also be expanded beyond band-averaged profiles. Although averaging across 17 joint pairs improved readability, joint-resolved and body-region-level analyses may reveal whether abnormal-like balance phenotypes preferentially involve distal lower-limb joints, trunk control, head-neck stabilization, or compensatory upper-body movement. Combining joint-resolved heatmaps with frequency-band summaries could provide a more complete explanation of how latent abnormal-like assignments map onto neuromotor control strategies.
Finally, future work should evaluate whether quantum-assisted optimization can support scalable diagnostic phenotyping across larger clinical populations and multi-site datasets. The present workflow was not designed to establish end-to-end quantum speedup, because preprocessing, VQ-VAE encoding, PCA, graph construction, minor embedding, CPU–QPU data transfer, queueing, and hybrid workflow overhead all contribute to practical runtime. Nevertheless, the annealing step itself is naturally suited to QUBO-formulated binary optimization problems, and future reductions in embedding overhead, data-transfer bottlenecks, and hybrid orchestration costs could make quantum-assisted optimization increasingly practical for selected large-scale phenotyping tasks. Such scalability would be particularly valuable for deployment across many patients, repeated balance tasks, longitudinal visits, and multiple clinical sites. Future benchmarking should therefore compare quantum annealing, simulated annealing, tabu search, and classical mixed-integer optimization under matched QUBO formulations, reporting both solver-level sampling behavior and end-to-end workflow runtime, to determine whether quantum-assisted optimization provides practical advantages for larger biomedical phenotyping datasets.
6. Conclusions
This study demonstrates the feasibility of using control-anchored QUBO clustering to identify abnormal-like balance phenotypes in a heterogeneous post-COVID cohort. By combining frequency-domain motion features, VQ-VAE latent representations, and graph-based binary optimization, the proposed framework identified a selective subset of post-COVID participants with abnormal-like balance profiles while largely preserving the Control reference structure.
Compared with GMM, control-anchored QUBO clustering produced fewer abnormal-like assignments among Control participants and yielded frequency-band profiles that appeared more interpretable in relation to postural-control dynamics. The band-level analysis further suggested that abnormal-like profiles were most evident in low-frequency postural-sway-dominant and normal postural-control activity bands, supporting the physiological plausibility of the derived subgroups.
These findings should be interpreted as exploratory and hypothesis-generating rather than diagnostic validation. Nevertheless, they highlight the potential of objective-driven, QUBO-based quantum-assisted clustering as a framework for subgroup discovery in label-limited biomedical datasets. With larger clinically characterized cohorts, systematic parameter optimization, matched solver benchmarking, and multi-site validation, this approach may support interpretable post-COVID neuromotor phenotyping and related medical data analysis applications.
Author Contributions
A.K. conceived the study, developed the analytical framework, performed the computational analysis, interpreted the results, and drafted the manuscript. A.N. contributed to the broader project context and provided senior advisory support. A.P. was senior author and PI, providing overall supervision, data collection, and guidance on study design, motion-capture technology, and neuromotor physiology. All authors reviewed and approved the final manuscript.
Funding
This study was supported in part by Florida Atlantic University through the Center for SMART Health and the Institute for Human Health and Disease Intervention (i-Health). Additional support was provided by pilot funding from the Florida Atlantic University Center for Complex Systems and Brain Sciences for the project “Quantum-Accelerated Discovery of Hidden Musculoskeletal Dynamics.”
Institutional Review Board Statement
The study was conducted in accordance with the Declaration of Helsinki and approved by the Institutional Review Board of Florida Atlantic University (IRB No. 1423095-10).
Informed Consent Statement
Informed consent was obtained from all subjects involved in the study. No identifiable individual data, images, or videos are presented in this article.
Data Availability Statement
The data that support the findings of this study are available from the corresponding author upon reasonable request. Due to ethical and privacy considerations involving human motion-capture data, the datasets are not publicly available.
Conflicts of Interest
The authors declare no conflicts of interest.
Acknowledgments
We are grateful for assistance with clinical review by Nai- Wei (William) Wang, clinical literature surveying by Presha Sridhar and early pilot data analysis by Jake Mitchell and Harikrishnan Mohanan.
Abbreviations
The following abbreviations are used in this manuscript:
| MDPI | Multidisciplinary Digital Publishing Institute |
| DOAJ | Directory of open access journals |
| TLA | Three-letter acronym |
| LD | Linear dichroism |
References
- Soriano, J.B.; Murthy, S.; Marshall, J.C.; Relan, P.; Diaz, J.V.; on Post-COVID-19 Condition, W.C.C.D.W.G. A clinical case definition of post-COVID-19 condition by a Delphi consensus. The Lancet Infectious Diseases 2022, 22, e102–e107. [CrossRef]
- Proal, A.D.; VanElzakker, M.B. Long COVID or Post-Acute Sequelae of COVID-19 (PASC): An Overview of Biological Factors That May Contribute to Persistent Symptoms. Frontiers in Microbiology 2021, 12, 698169. [CrossRef]
- Woodrow, M.; Carey, C.; Ziauddeen, N.; Thomas, R.; Akrami, A.; Lutje, V.; Greenwood, D.C.; Alwan, N.A. Systematic review of the prevalence of long COVID. In Proceedings of the Open Forum Infectious Diseases. Oxford University Press US, 2023, Vol. 10, p. ofad233.
- Yılmaz, O.; Mutlu, B.O.; Yaman, H.; Bayazıt, D.; Demirhan, H.; Bayazıt, Y.A. Assessment of balance after recovery from COVID-19 disease. Auris Nasus Larynx 2022, 49, 291–298. [CrossRef]
- Guzik, A.; Wolan-Nieroda, A.; Kochman, M.; Perenc, L.; Drużbicki, M. Impact of mild COVID-19 on balance function in young adults, a prospective observational study. Scientific Reports 2022, 12, 12181.
- Winter, D.A. Human balance and posture control during standing and walking; CRC Press, 1995.
- Prieto, T.E.; Myklebust, J.B.; Hoffmann, R.G.; Lovett, E.G.; Myklebust, B. Measures of postural steadiness: differences between healthy young and elderly adults. IEEE Transactions on Biomedical Engineering 1996, 43, 956–966.
- Pelicioni, P.H.S.; Santos, A.D.; Tako, K.V.; Santos, P.C.R. COVID-19 and its impact on human motor control. Brazilian Journal of Motor Behavior 2021, 15, 9–19. [CrossRef]
- Daniels, K.A.J.; Henderson, G.; Strike, S.; Cosgrave, C.; Fuller, C.; Falvey, É. The use of continuous spectral analysis for the assessment of postural stability changes after sports-related concussion. Journal of Biomechanics 2019, 97, 109400. [CrossRef]
- Gresty, M.; Buckwell, D. Spectral analysis of tremor: understanding the results. Journal of Neurology, Neurosurgery & Psychiatry 1990, 53, 976–981. [CrossRef]
- Kunapinun, A.; Ellison, P.J.; Danesh, A.A.; Cai, X.C.; Levy, X.; Fields, G.B.; Pelah, A. Joint-wise Spectral Analysis of Balance Responses Using Inverse Kinematics: A Motion Capture Study in Post-Acute COVID vs Non-COVID Individuals. In Proceedings of the Proceedings of the 18th International Convention on Rehabilitation Engineering and Assistive Technology (i-CREATe 2025), Bangkok, Thailand, 11 2025.
- Lasko, T.A.; Denny, J.C.; Levy, M.A. Computational phenotype discovery using unsupervised feature learning over noisy, sparse, and irregular clinical data. PLOS ONE 2013, 8, e66341. [CrossRef]
- Wu, W.; Bleecker, E.; Moore, W.; et al.. Unsupervised phenotyping of severe asthma research program participants using expanded lung data. Journal of Allergy and Clinical Immunology 2014, 133, 1280–1288. [CrossRef]
- Wang, Y.; Zhao, Y.; Therneau, T.M.; et al.. Unsupervised machine learning for the discovery of latent disease clusters and patient subgroups using electronic health records. Journal of Biomedical Informatics 2020, 102, 103364. [CrossRef]
- van den Oord, A.; Vinyals, O.; Kavukcuoglu, K. Neural discrete representation learning. In Proceedings of the Advances in Neural Information Processing Systems, 2017, Vol. 30, pp. 6306–6315.
- Razavi, A.; van den Oord, A.; Vinyals, O. Generating diverse high-fidelity images with VQ-VAE-2. In Proceedings of the Advances in Neural Information Processing Systems, 2019, Vol. 32, pp. 14866–14876.
- Fortuin, V.; Hüser, M.; Locatello, F.; Strathmann, H.; Rätsch, G. SOM-VAE: Interpretable Discrete Representation Learning on Time Series. In Proceedings of the International Conference on Learning Representations, 2019.
- Bishop, C.M. Pattern Recognition and Machine Learning; Springer, 2006.
- Nassir, N.; Hashmi, M.A.; Raji, K.G.; Jamalalail, B.; Maksymowsky, A.; Scherer, S.W.; Alsheikh-Ali, A.; Uddin, M. Quantum computing and the implementation of precision medicine. npj Genomic Medicine 2025, 10, 80. [CrossRef]
- Nałkecz-Charkiewicz, K.; Charkiewicz, K.; Nowak, R.M. Quantum computing in bioinformatics: a systematic review mapping. Briefings in Bioinformatics 2024, 25, bbae391. [CrossRef]
- Ghazi Vakili, M.; Gorgulla, C.; Snider, J.; Nigam, A.; Bezrukov, D.; Varoli, D.; Aliper, A.; Polykovsky, D.; Padmanabha Das, K.M.; Cox, H.; et al. Quantum-computing-enhanced algorithm unveils potential KRAS inhibitors. Nature Biotechnology 2025, 43, 1954–1959. [CrossRef]
- Lucas, A. Ising formulations of many NP problems. Frontiers in physics 2014, 2, 74887.
- Glover, F.; Kochenberger, G.; Du, Y. A tutorial on formulating and using QUBO models. arXiv preprint arXiv:1811.11538 2018.
- Lubinski, T.; Coffrin, C.; McGeoch, C.; Sathe, P.; Apanavicius, J.; Bernal Neira, D.; Consortium, Q.E.D.; et al. Optimization applications as quantum performance benchmarks. ACM Transactions on Quantum Computing 2024, 5, 1–44.
- Sijpesteijn, T.; Phillipson, F. Quantum approaches for medoid clustering. In Proceedings of the International Conference on Innovations for Community Services. Springer, 2023, pp. 222–235.
- Pérez Armas, L.F.; Creemers, S.; Deleplanque, S. Solving the resource constrained project scheduling problem with quantum annealing. Scientific Reports 2024, 14, 16784.
- Jolliffe, I.T. Principal Component Analysis, 2 ed.; Springer: New York, 2002.
- Cover, T.M.; Hart, P.E. Nearest neighbor pattern classification. IEEE Transactions on Information Theory 1967, 13, 21–27. [CrossRef]
Figure 1.
Overall framework for balance-based post-COVID phenotyping using VQ-VAE and control-anchored QUBO clustering. Motion-capture data from Control and post-COVID participants were collected during standard sensory organization/postural balance tasks and Stroop-augmented balance conditions. Relative joint-angle trajectories were extracted using inverse kinematics and transformed into 0–5 Hz frequency-domain spectral representations. Thirteen balance-derived task contrasts were constructed to capture cognitive-distraction, visual-removal, and task-condition effects. Full 256-bin joint-wise spectral contrast features were encoded using a vector-quantized variational autoencoder (VQ-VAE) to obtain latent neuromotor representations. These latent representations were analyzed using a control-anchored graph-based QUBO clustering objective solved through a quantum annealing workflow, with Gaussian mixture modeling (GMM) used as an unconstrained classical comparator. Outputs included patient-level abnormal-like scoring, exploratory clinical review, and four-band spectral phenotype heatmaps for physiological interpretation.
Figure 1.
Overall framework for balance-based post-COVID phenotyping using VQ-VAE and control-anchored QUBO clustering. Motion-capture data from Control and post-COVID participants were collected during standard sensory organization/postural balance tasks and Stroop-augmented balance conditions. Relative joint-angle trajectories were extracted using inverse kinematics and transformed into 0–5 Hz frequency-domain spectral representations. Thirteen balance-derived task contrasts were constructed to capture cognitive-distraction, visual-removal, and task-condition effects. Full 256-bin joint-wise spectral contrast features were encoded using a vector-quantized variational autoencoder (VQ-VAE) to obtain latent neuromotor representations. These latent representations were analyzed using a control-anchored graph-based QUBO clustering objective solved through a quantum annealing workflow, with Gaussian mixture modeling (GMM) used as an unconstrained classical comparator. Outputs included patient-level abnormal-like scoring, exploratory clinical review, and four-band spectral phenotype heatmaps for physiological interpretation.
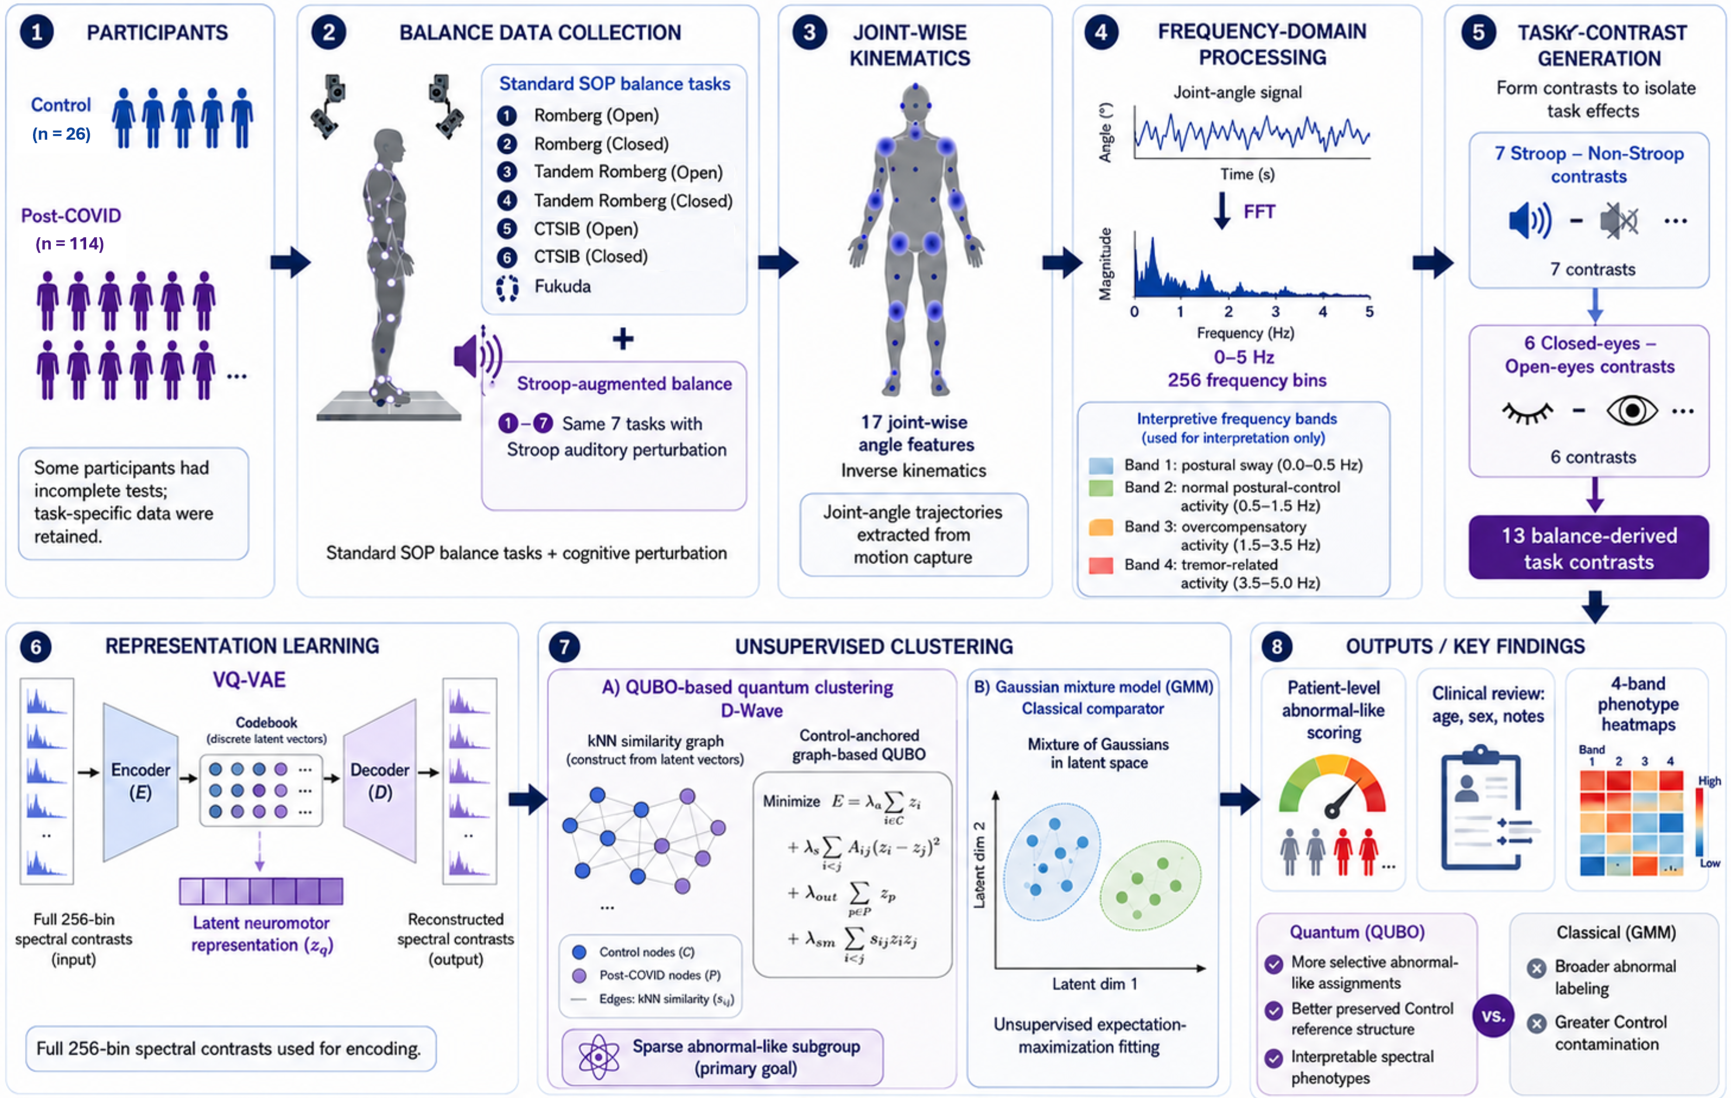
Figure 2.
Contrast-level abnormal-like assignment rates across balance-derived task contrasts. Heatmaps show the proportion of participants assigned to the abnormal-like group for each balance-derived task contrast, separately for post-COVID and Control participants. Each cell reports the number of abnormal-like assignments over the number of available participants for that contrast, with the corresponding percentage shown in parentheses. Panel (a) shows the results from the control-anchored QUBO clustering method, whereas panel (b) shows the corresponding results from the GMM comparator. Control-anchored QUBO clustering produced sparse abnormal-like assignments among post-COVID participants while assigning almost all Control participants to the normal-like group. In contrast, GMM produced higher abnormal-like assignment rates among Controls across multiple task contrasts, indicating weaker preservation of the Control reference structure under the unconstrained mixture-model comparator.
Figure 2.
Contrast-level abnormal-like assignment rates across balance-derived task contrasts. Heatmaps show the proportion of participants assigned to the abnormal-like group for each balance-derived task contrast, separately for post-COVID and Control participants. Each cell reports the number of abnormal-like assignments over the number of available participants for that contrast, with the corresponding percentage shown in parentheses. Panel (a) shows the results from the control-anchored QUBO clustering method, whereas panel (b) shows the corresponding results from the GMM comparator. Control-anchored QUBO clustering produced sparse abnormal-like assignments among post-COVID participants while assigning almost all Control participants to the normal-like group. In contrast, GMM produced higher abnormal-like assignment rates among Controls across multiple task contrasts, indicating weaker preservation of the Control reference structure under the unconstrained mixture-model comparator.
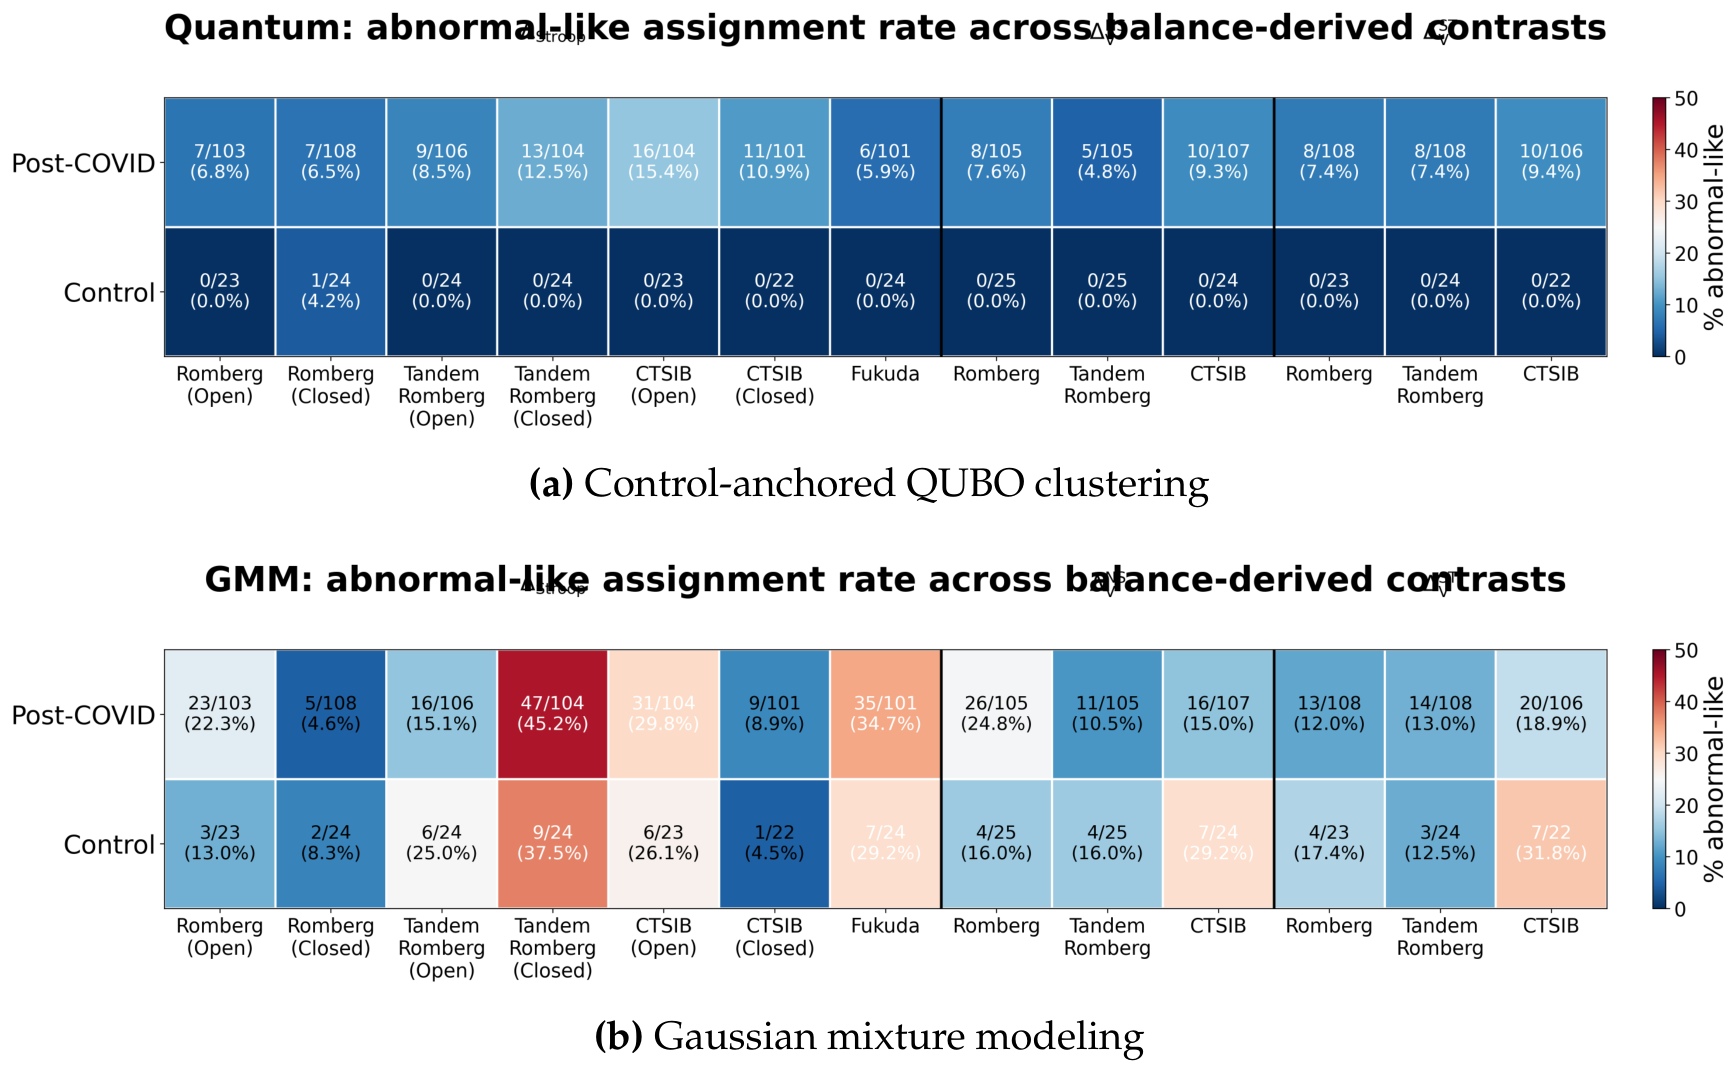
Figure 3.
Participant-level abnormality burden across balance-derived task contrasts. Each row represents one participant and each column represents one balance-derived task contrast. Red cells indicate abnormal-like assignments, whereas light-blue cells indicate normal-like assignments. Participants are grouped by post-COVID and Control status and sorted by the number of abnormal-like task contrasts. Control-anchored QUBO clustering showed concentrated abnormal-like burden in a subset of post-COVID participants with minimal Control involvement. GMM produced more widespread abnormal-like assignments across both post-COVID and Control participants, consistent with weaker preservation of the intended Control reference structure under the unconstrained mixture-model comparator.
Figure 3.
Participant-level abnormality burden across balance-derived task contrasts. Each row represents one participant and each column represents one balance-derived task contrast. Red cells indicate abnormal-like assignments, whereas light-blue cells indicate normal-like assignments. Participants are grouped by post-COVID and Control status and sorted by the number of abnormal-like task contrasts. Control-anchored QUBO clustering showed concentrated abnormal-like burden in a subset of post-COVID participants with minimal Control involvement. GMM produced more widespread abnormal-like assignments across both post-COVID and Control participants, consistent with weaker preservation of the intended Control reference structure under the unconstrained mixture-model comparator.
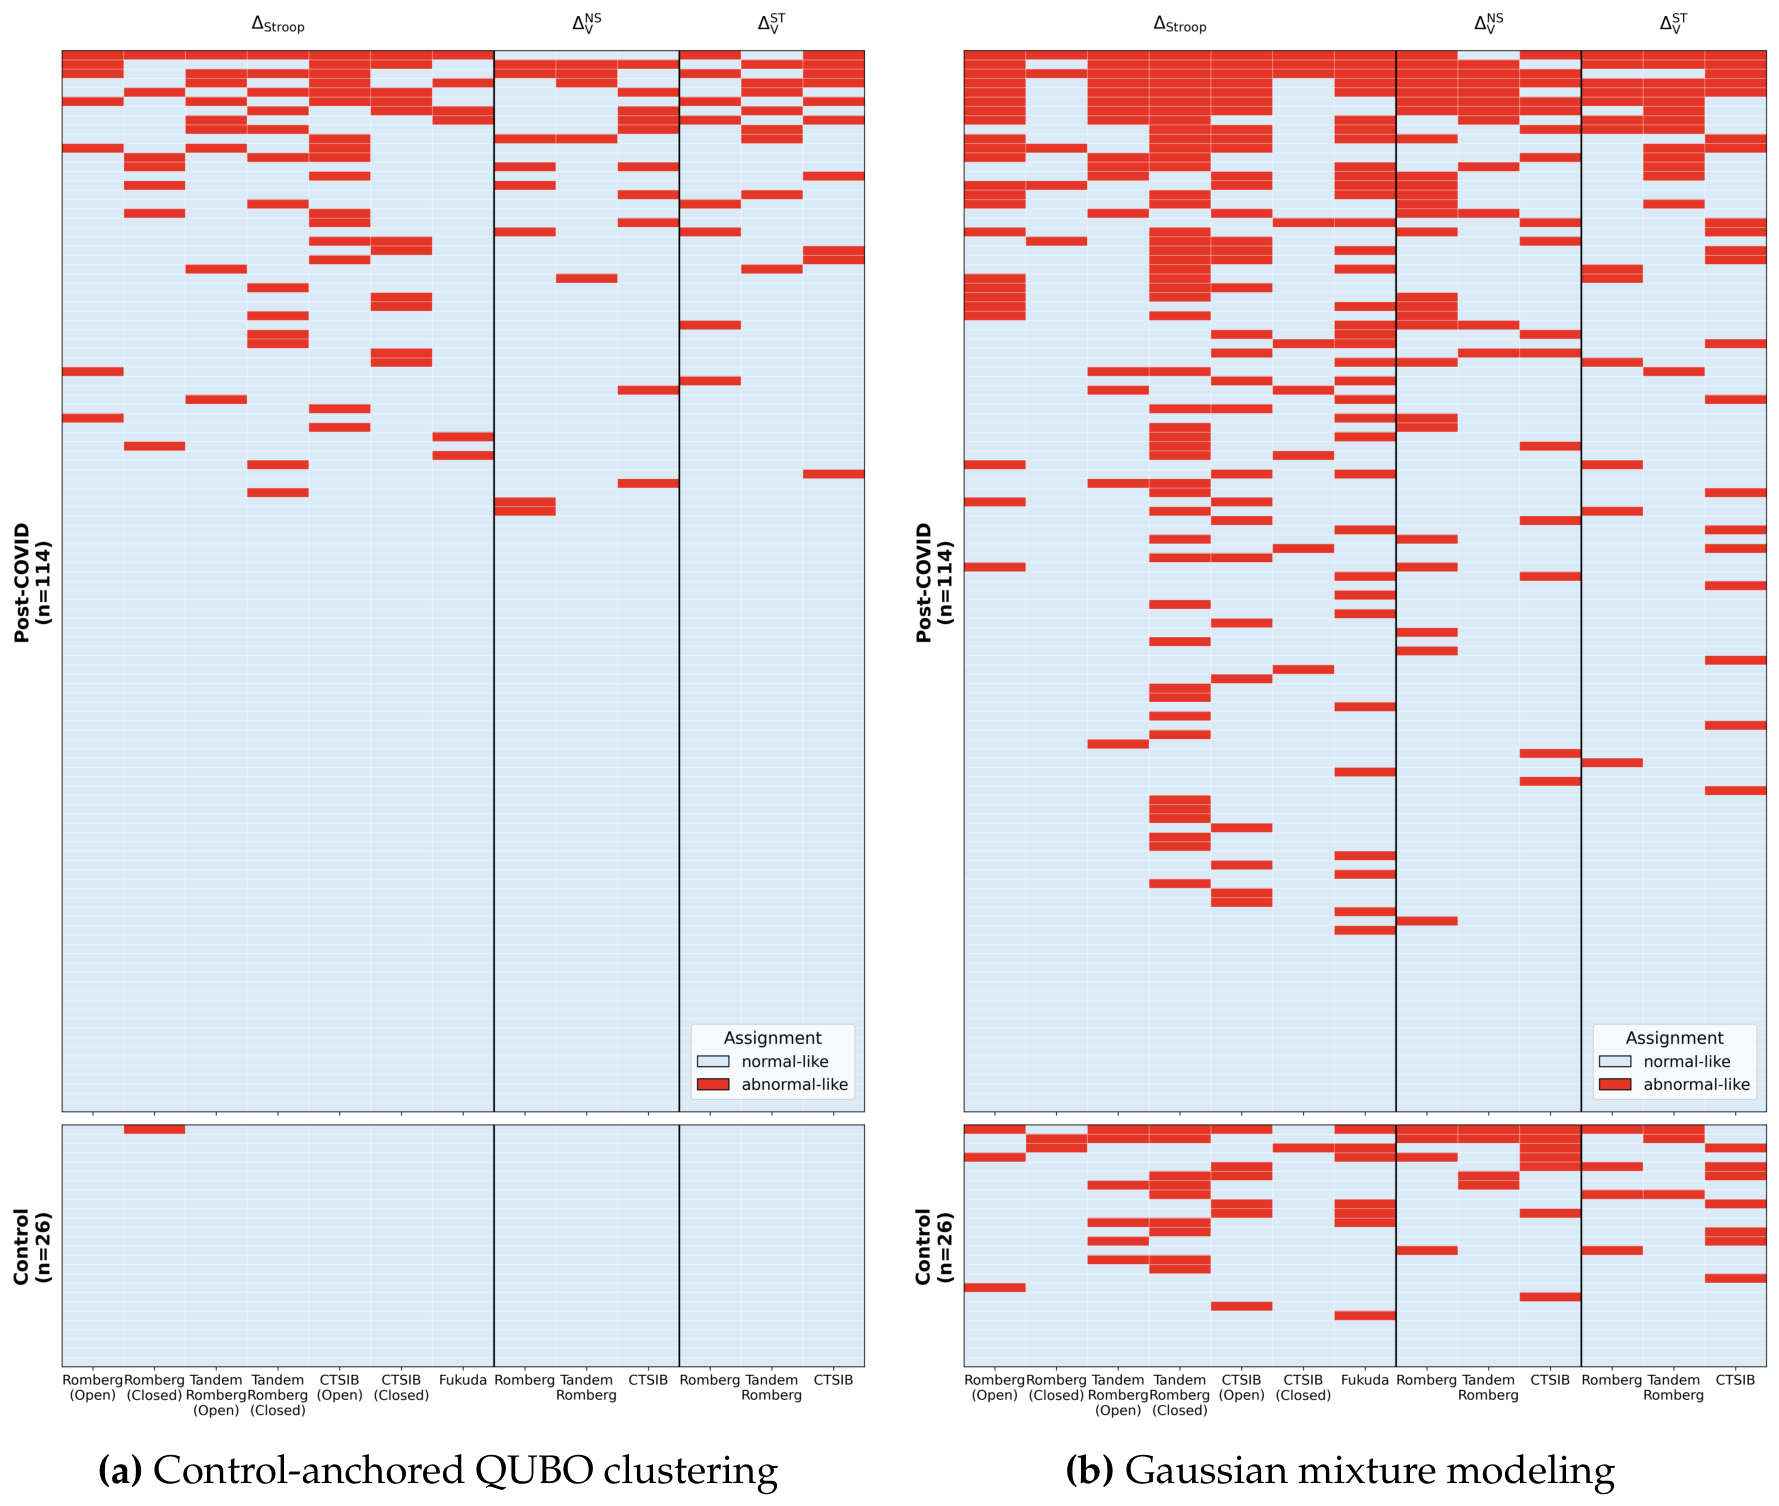
Figure 4.
Frequency-band profiles for Stroop versus Non-Stroop balance contrasts. Band-averaged Energy profiles are shown for each task, with defined as Stroop minus Non-Stroop. Values represent mean Energy across 17 joint pairs within each frequency band. Columns compare original group profiles with QUBO- and GMM-derived post-COVID normal-like and abnormal-like profiles. Panels show (a) Romberg Open Eyes, (b) Romberg Closed Eyes, (c) Tandem Romberg Open Eyes, (d) Tandem Romberg Closed Eyes, (e) CTSIB Open Eyes, (f) CTSIB Closed Eyes, and (g) Fukuda.
Figure 4.
Frequency-band profiles for Stroop versus Non-Stroop balance contrasts. Band-averaged Energy profiles are shown for each task, with defined as Stroop minus Non-Stroop. Values represent mean Energy across 17 joint pairs within each frequency band. Columns compare original group profiles with QUBO- and GMM-derived post-COVID normal-like and abnormal-like profiles. Panels show (a) Romberg Open Eyes, (b) Romberg Closed Eyes, (c) Tandem Romberg Open Eyes, (d) Tandem Romberg Closed Eyes, (e) CTSIB Open Eyes, (f) CTSIB Closed Eyes, and (g) Fukuda.
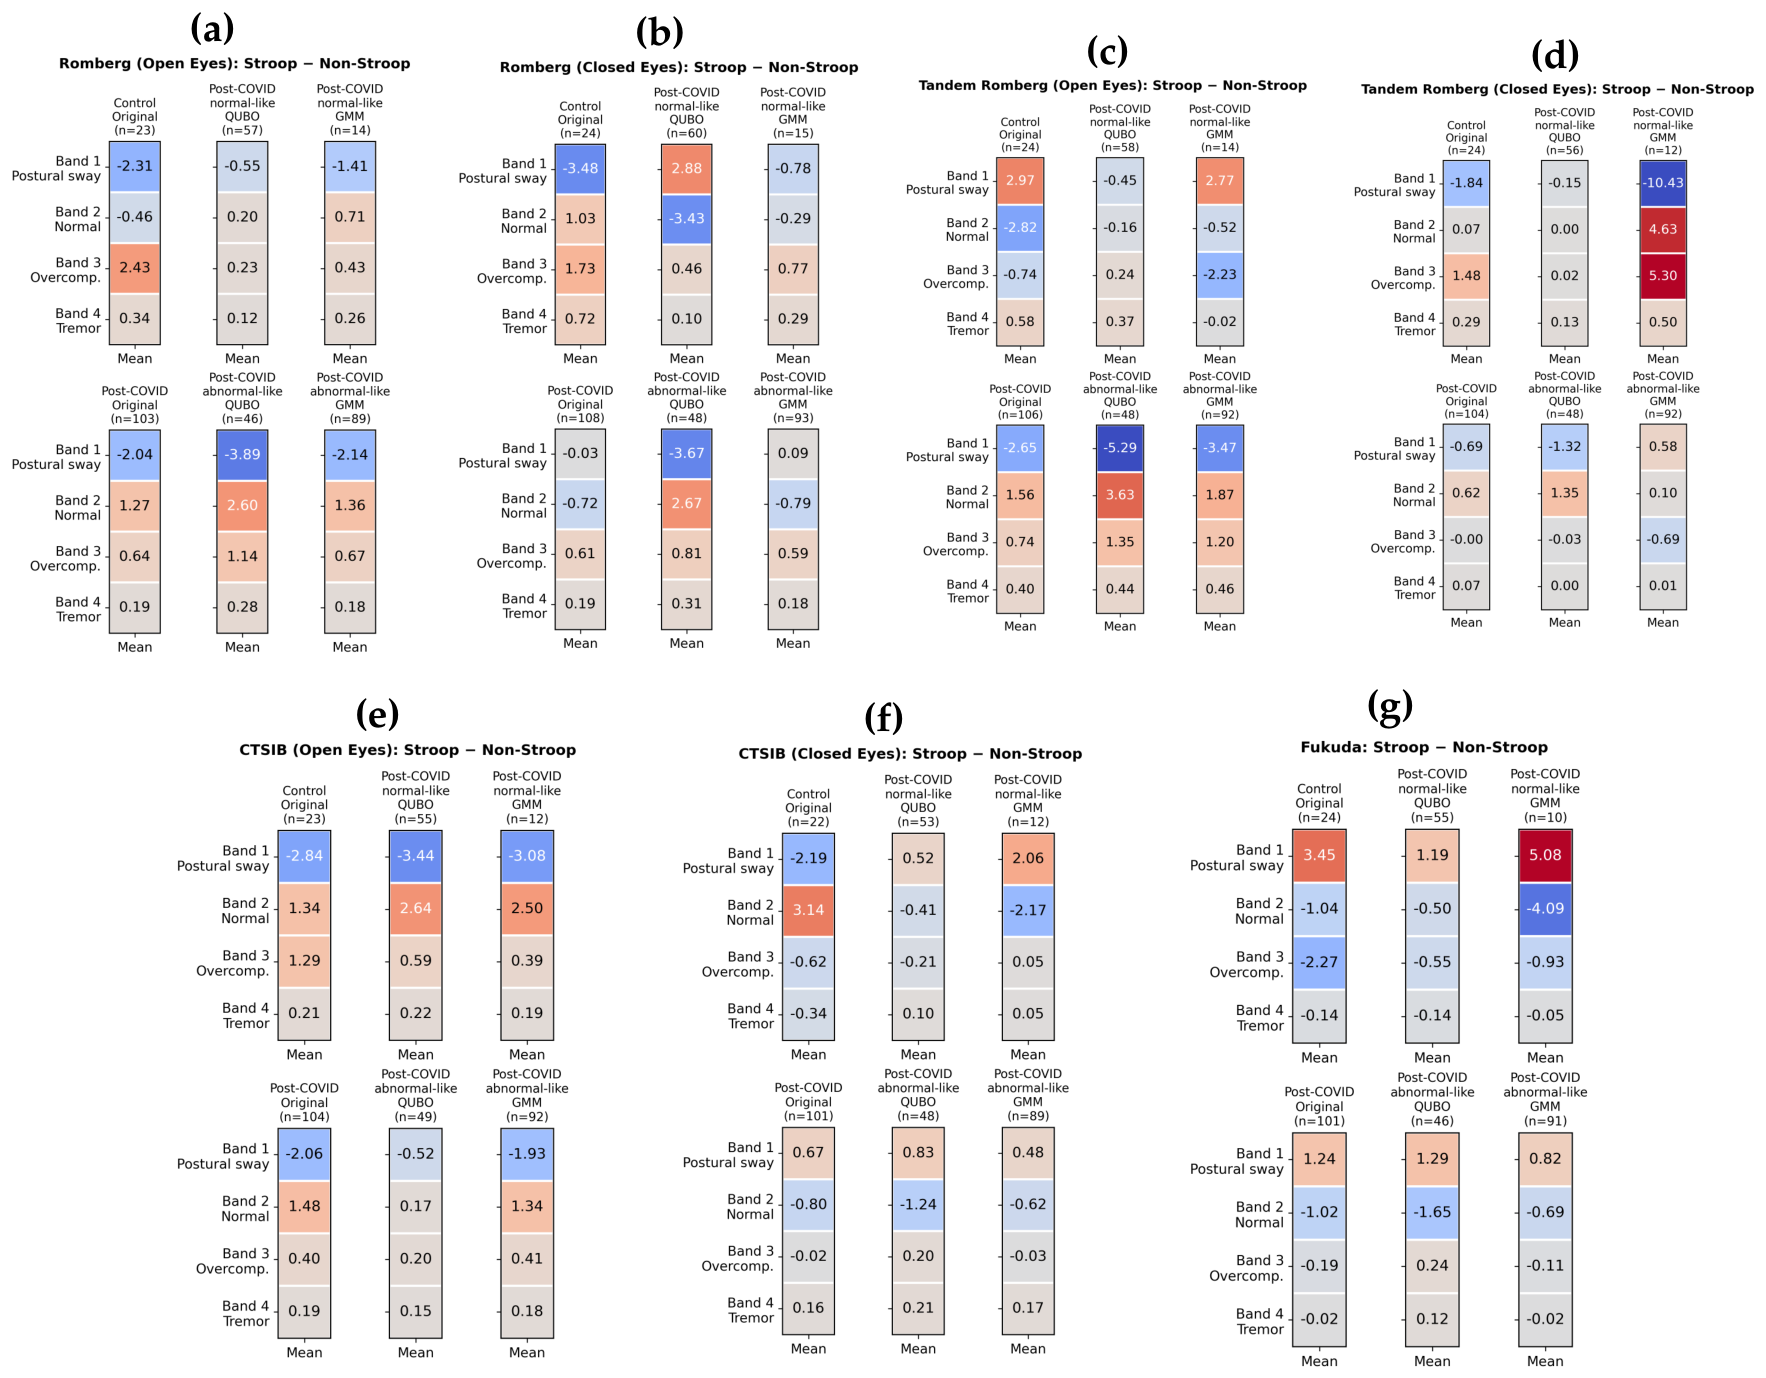
Figure 5.
Frequency-band profiles for visual-removal balance contrasts. Band-averaged Energy profiles are shown for Closed-Eyes minus Open-Eyes contrasts. Values represent mean Energy across 17 joint pairs within each frequency band. Columns compare original group profiles with QUBO- and GMM-derived post-COVID normal-like and abnormal-like profiles. The top row shows Non-Stroop contrasts and the bottom row shows Stroop-augmented contrasts: (a,d) Romberg, (b,e) Tandem Romberg, and (c,f) CTSIB.
Figure 5.
Frequency-band profiles for visual-removal balance contrasts. Band-averaged Energy profiles are shown for Closed-Eyes minus Open-Eyes contrasts. Values represent mean Energy across 17 joint pairs within each frequency band. Columns compare original group profiles with QUBO- and GMM-derived post-COVID normal-like and abnormal-like profiles. The top row shows Non-Stroop contrasts and the bottom row shows Stroop-augmented contrasts: (a,d) Romberg, (b,e) Tandem Romberg, and (c,f) CTSIB.
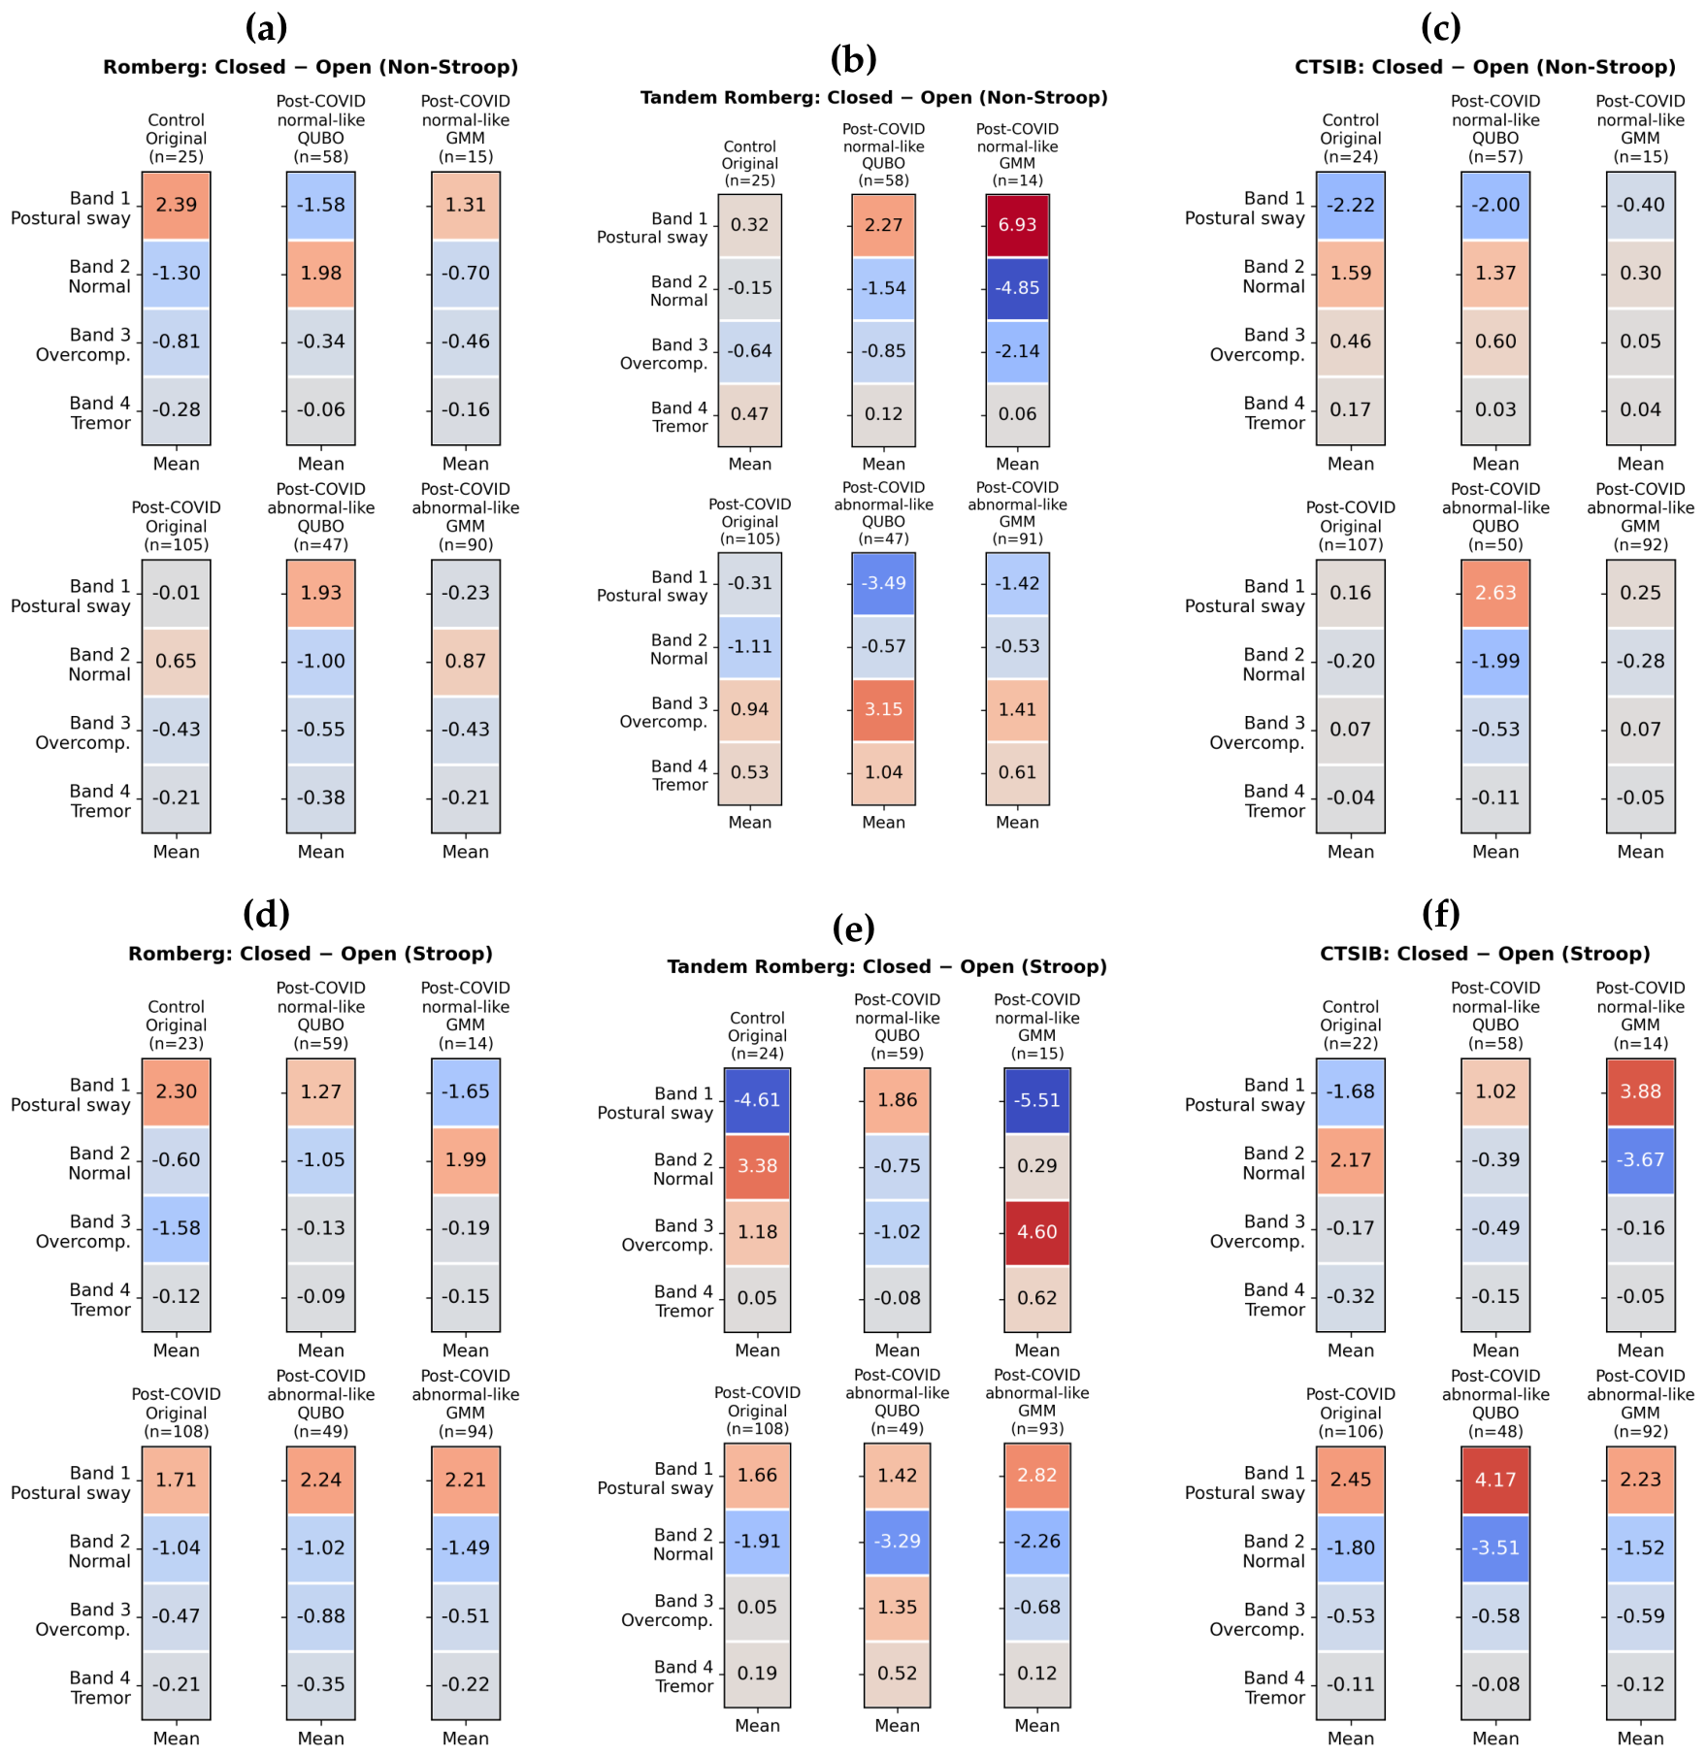

Table 1.
Participant characteristics
| Characteristic | Analysis cohort |
|---|---|
| Sample size, n | 140 |
| Age range, years | 10–91 |
| Age, years (mean ± SD) | |
| Age missing, n | 20 |
| Sex, n (%) | |
| Male | 54 (38.6%) |
| Female | 82 (58.6%) |
| Not reported | 4 (2.9%) |
| COVID status, n (%) | |
| Post-COVID | 114 (81.4%) |
| No known history of diagnosed COVID / Control | 26 (18.6%) |
| Age by sex, years (mean ± SD) | |
| Female | |
| Male |
Note: Age summary statistics were calculated using participants with valid age information. Post-COVID status was determined based on documented prior SARS-CoV-2 infection confirmed using clinically accepted COVID-19 testing. Among the 26 Control participants, 22 had documented negative COVID-19 testing at study enrollment, whereas 4 reported no known prior COVID-19 history but did not have prior diagnostic confirmation available. COVID status was used for descriptive and comparative purposes only and was not used as a ground-truth label in the unsupervised analytical framework.
Table 2.
Sample availability across balance-derived task contrasts
| Task contrast | Total, n | Control, n | Post-COVID, n |
|---|---|---|---|
| : Romberg (Open Eyes) | 126 | 23 | 103 |
| : Romberg (Closed Eyes) | 132 | 24 | 108 |
| : Tandem Romberg (Open Eyes) | 130 | 24 | 106 |
| : Tandem Romberg (Closed Eyes) | 128 | 24 | 104 |
| : CTSIB (Open Eyes) | 127 | 23 | 104 |
| : CTSIB (Closed Eyes) | 123 | 22 | 101 |
| : Fukuda | 125 | 24 | 101 |
| : Romberg | 130 | 25 | 105 |
| : Tandem Romberg | 130 | 25 | 105 |
| : CTSIB | 131 | 24 | 107 |
| : Romberg | 131 | 23 | 108 |
| : Tandem Romberg | 132 | 24 | 108 |
| : CTSIB | 128 | 22 | 106 |
Note: denotes the Stroop versus Non-Stroop contrast for the same balance task, computed as Stroop minus Non-Stroop. denotes the Closed-Eyes versus Open-Eyes contrast under the standard Non-Stroop condition, and denotes the corresponding Closed-Eyes versus Open-Eyes contrast under the Stroop-augmented condition; both visual-removal contrasts were computed as Closed-Eyes minus Open-Eyes. Sample sizes vary across task contrasts because some participants did not complete all balance-task conditions. Participant-level abnormality scores were normalized by the number of available task contrasts for each participant.
Table 3.
QUBO optimization characteristics across balance-derived task contrasts
| Task contrast | Variables | kNN edges | RBF | Best energy |
|---|---|---|---|---|
| : Romberg (Open) | 126 | 2686 | 3.19 | |
| : Romberg (Closed) | 132 | 2944 | 2.36 | |
| : Tandem Romberg (Open) | 130 | 2868 | 2.77 | |
| : Tandem Romberg (Closed) | 128 | 2891 | 2.71 | |
| : CTSIB (Open) | 127 | 2838 | 2.12 | |
| : CTSIB (Closed) | 123 | 2774 | 2.37 | |
| : Fukuda | 125 | 2687 | 3.56 | |
| : Romberg | 130 | 2871 | 2.15 | |
| : Tandem Romberg | 130 | 2919 | 2.82 | |
| : CTSIB | 131 | 2946 | 2.83 | |
| : Romberg | 131 | 2866 | 2.75 | |
| : Tandem Romberg | 132 | 2981 | 2.82 | |
| : CTSIB | 128 | 2813 | 3.03 |
Note: Each task contrast was formulated as a separate BQM. The number of variables corresponds to the number of available participants for that contrast. kNN edges correspond to RBF-weighted graph interactions included in the smoothness term. Best energy values are contrast-specific QUBO objective values and are not interpreted as physiological severity scores across tasks.
Table 4.
Comparison of QUBO and GMM abnormal-like assignments
| Metric | QUBO | GMM |
|---|---|---|
| Control abnormal-like observations, n/N (%) | 1/307 (0.3%) | 63/307 (20.5%) |
| Post-COVID abnormal-like observations, n/N (%) | 118/1366 (8.6%) | 266/1366 (19.5%) |
| Control abnormal-like rate across contrasts | 0.0–4.2% | 4.5–37.5% |
| Post-COVID abnormal-like rate across contrasts | 4.8–15.4% | 4.6–45.2% |
| Control participants with no abnormal-like contrasts, n/N (%) | 25/26 (96.2%) | 5/26 (19.2%) |
| Control participants classified as probable or strong abnormal, n/N (%) | 0/26 (0.0%) | 11/26 (42.3%) |
| Mean abnormal-like contrasts in Controls | 0.04 | 2.42 |
| Mean abnormal-like contrasts in post-COVID participants | 1.04 | 2.33 |
Note: Observation-level summaries aggregate all available participant–contrast assignments across the 13 balance-derived task contrasts. Participant-level summaries are based on abnormal-like contrast counts normalized by the number of available task contrasts. The GMM used two diagonal-covariance components, with the component having the higher mean Control-distance score mapped to the abnormal-like group. The comparison assesses how well each method satisfied the intended Control-preserving phenotyping objective rather than general clustering performance.
Table 5.
Selected clinical-note examples from participant-level QUBO and GMM rankings
| Participant | Group | Clinical-note summary | QUBO | QUBO group | GMM | GMM group |
|---|---|---|---|---|---|---|
| PC013 | Post-COVID | Physician-documented Long COVID evaluation note | 4/10 | Probable abnormal | 5/10 | Probable abnormal |
| PC043 | Post-COVID | No relevant symptom note available | 6/13 | Probable abnormal | 11/13 | Strong abnormal |
| PC080 | Post-COVID | Chronic fatigue/long-hauler, autoimmune, cardiovascular notes | 1/12 | Single-test deviation | 3/12 | Probable abnormal |
| NC008 | Control | Control participant; limited available contrasts | 1/7 | Single-test deviation | 7/7 | Strong abnormal |
| NC003 | Control | No known COVID; not vaccinated | 0/13 | Normal-like | 5/13 | Probable abnormal |
| NC018 | Control | Uncomfortable during balance testing; held wall | 0/13 | Normal-like | 3/13 | Probable abnormal |
Note: Clinical notes were incomplete and were not used as inputs to the VQ-VAE, QUBO clustering, GMM clustering, or participant-level scoring. The selected cases illustrate concordant and discordant patterns between model-derived abnormality rankings and available clinical context. QUBO and GMM values indicate the number of abnormal-like task contrasts over the number of available task contrasts.
Disclaimer/Publisher’s Note: The statements, opinions and data contained in all publications are solely those of the individual author(s) and contributor(s) and not of MDPI and/or the editor(s). MDPI and/or the editor(s) disclaim responsibility for any injury to people or property resulting from any ideas, methods, instructions or products referred to in the content. |
© 2026 by the authors. Licensee MDPI, Basel, Switzerland. This article is an open access article distributed under the terms and conditions of the Creative Commons Attribution (CC BY) license (http://creativecommons.org/licenses/by/4.0/).
Copyright: This open access article is published under a Creative Commons CC BY 4.0 license, which permit the free download, distribution, and reuse, provided that the author and preprint are cited in any reuse.


