
Submitted:
03 August 2026
Posted:
04 August 2026
You are already at the latest version
Abstract
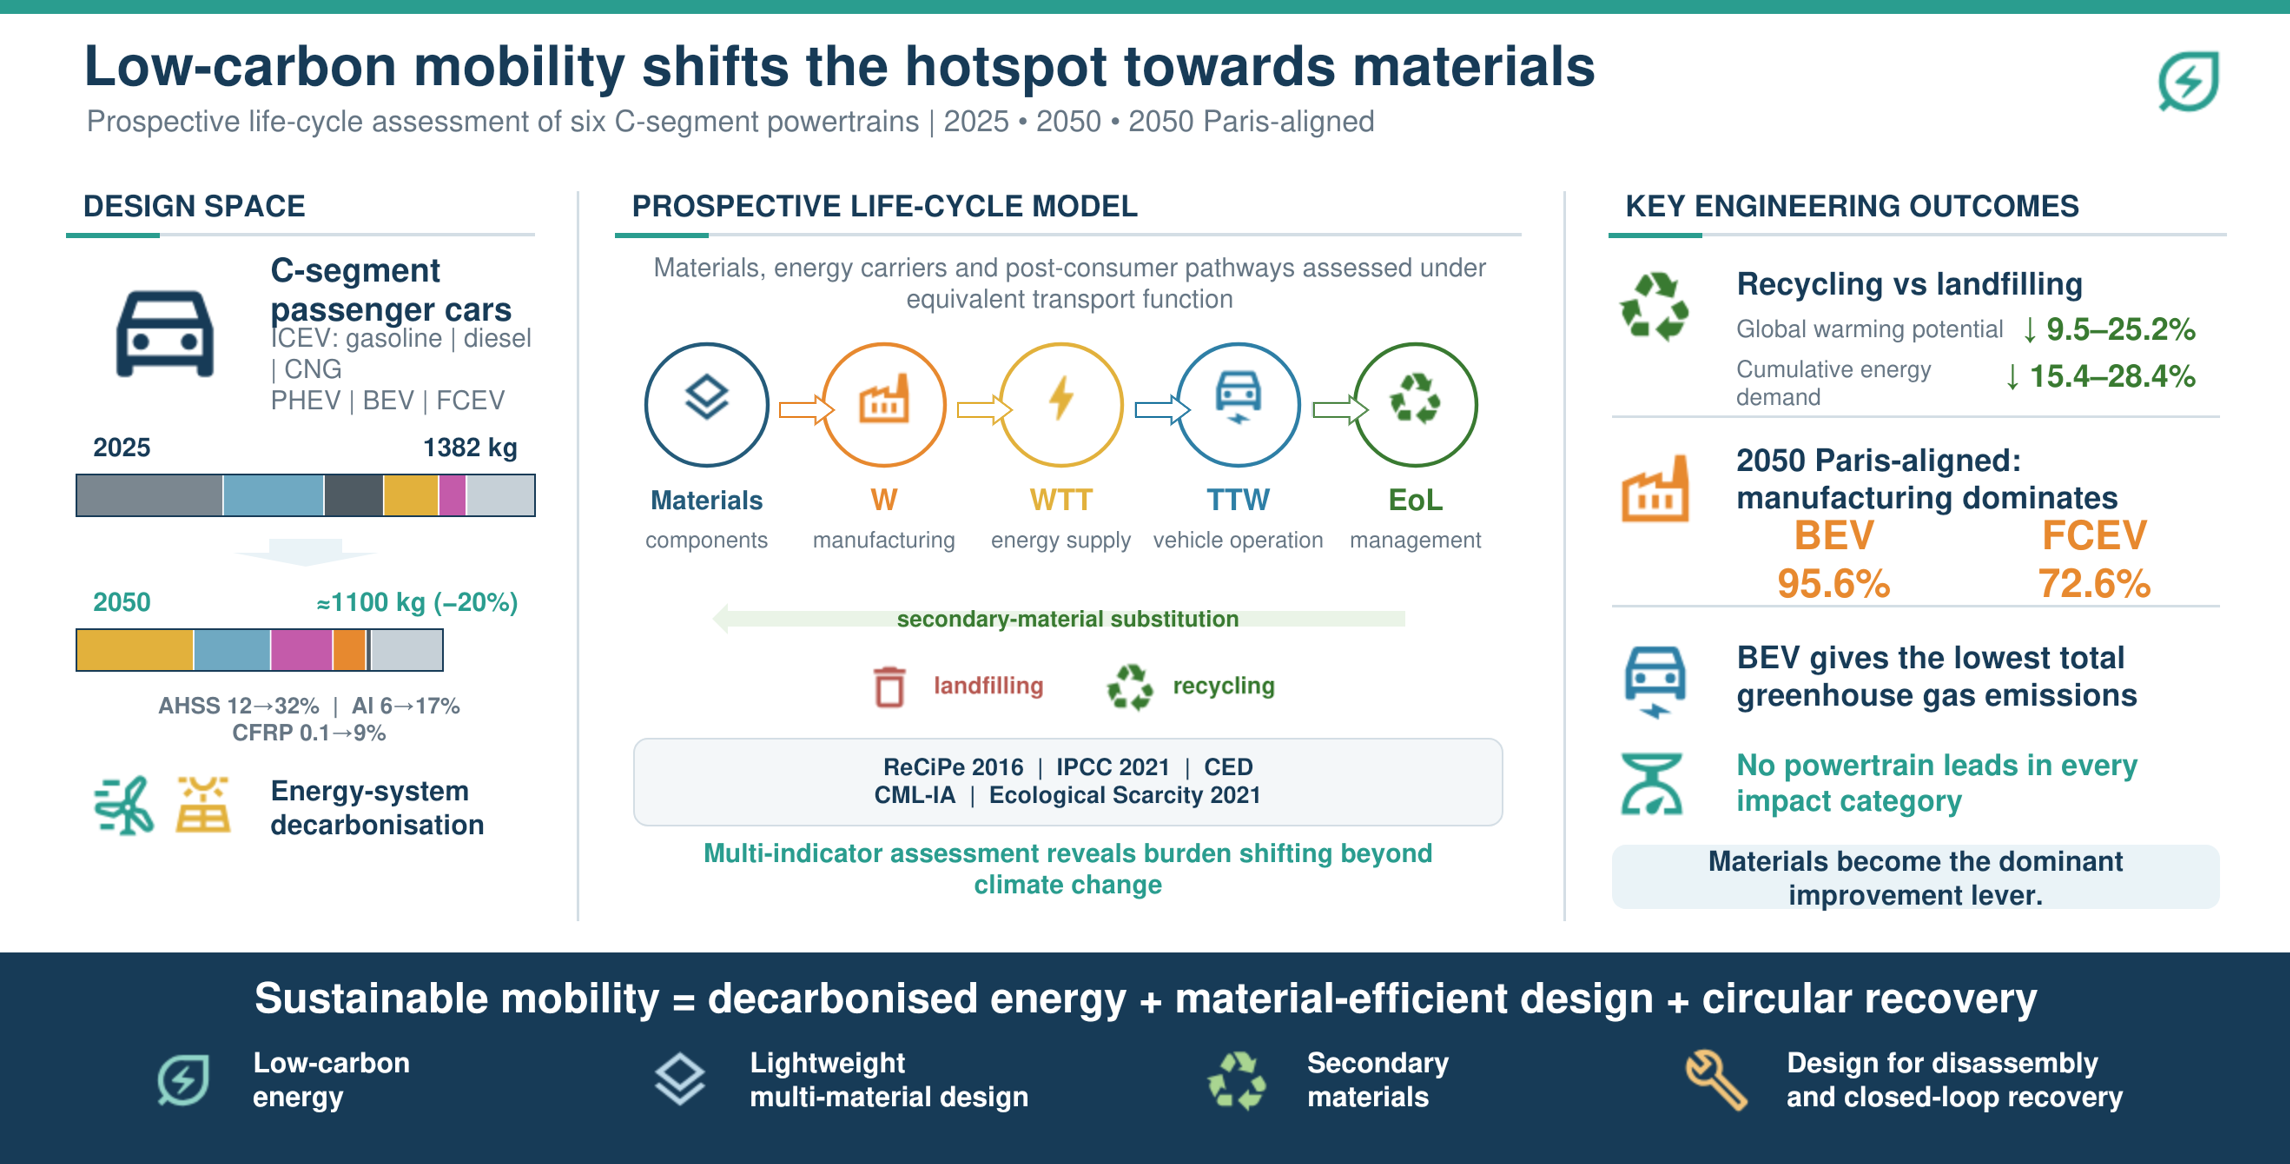
The transition to renewable-energy-based mobility is shifting environmental burdens from vehicle operation towards material production, component manufacturing and post-consumer management. This study evaluates how powertrain architecture, prospective material substitution, energy-system decarbonisation and end-of-life pathways affect the life-cycle performance of C-segment passenger cars. Internal combustion engine vehicles powered by gasoline, diesel and compressed natural gas, a gasoline plug-in hybrid electric vehicle, a battery electric vehicle (BEV) and a fuel cell electric vehicle (FCEV) were compared for 2025 and 2050. Vehicle materials and components were assessed using ReCiPe 2016, IPCC 2021, Cumulative Energy Demand, CML-IA baseline and Ecological Scarcity 2021 under landfilling and recycling scenarios. Well-to-tank and tank-to-wheel greenhouse gas emissions were evaluated separately, including a Paris Agreement-aligned 2050 scenario. Recycling reduced vehicle-related global warming potential by 9.5–25.2% and cumulative energy demand by 15.4–28.4%, with the largest net ReCiPe 2016 credits obtained for BEVs and FCEVs. In the Paris Agreement-aligned scenario, manufacturing represented 95.6% of total greenhouse gas emissions for the BEV and 72.6% for the FCEV. Energy-carrier decarbonisation should therefore be integrated with lightweight multi-material design, secondary-material use, design for disassembly and high-quality recovery of structural, battery, electronic and fuel-cell materials.
Keywords:
sustainable materials
; renewable energy transition
; life cycle assessment
; sustainable transport
; electric vehicle components
; alternative powertrains
; material circularity
; vehicle lightweighting
; end-of-life management
; recycling
1. Introduction
The decarbonisation of passenger transport involves not only replacing fossil fuels with electricity or hydrogen but also transforming vehicle material systems. Differences between internal combustion engine vehicles (ICEVs), plug-in hybrid electric vehicles (PHEVs), battery electric vehicles (BEVs) and fuel cell electric vehicles (FCEVs) concern powertrain architecture, material composition, manufacturing and post-consumer management. Their environmental ranking therefore depends on system boundaries, energy-carrier production, vehicle lifetime, battery capacity, manufacturing conditions and end-of-life assumptions [1,2,3,4,5]. At the operational level, fuel type, driving cycle, vehicle speed and engine torque also influence energy consumption and CO2 emissions, as demonstrated by simulations based on driving-test data [6,7].
Vehicle lightweighting can reduce propulsion-energy demand, but its life-cycle benefit depends on the selected materials, powertrain and lifetime mileage [8,9]. Replacing conventional steels and cast iron with advanced high-strength steels (AHSSs), aluminium alloys, magnesium alloys and carbon-fibre-reinforced polymers (CFRPs) enables mass reduction while maintaining the required strength, stiffness and crashworthiness [10,11,12]. However, the production of primary aluminium, magnesium and carbon fibres may partly offset operational savings. Multi-material structures also require joining solutions that affect manufacturability, repairability, disassembly and material separation. Consequently, structural performance, manufacturing and recovery must be considered jointly [13,14,15]. Complementary product-design methods that couple production- and use-stage energy consumption can support the identification of design modifications that reduce total energy demand [16].
Traction batteries contain electrochemically active materials together with aluminium, copper, steel, polymers, electrolytes, cooling systems and electronic components. Their impacts depend on battery chemistry, production scale, manufacturing location and electricity supply [17,18,19]. Electrification may substantially increase demand for lithium, nickel, cobalt, manganese, graphite, copper and aluminium by 2050 [20]. End-of-life batteries are therefore both a waste stream and a source of secondary materials [21]. Mechanical treatment, pyrometallurgy, hydrometallurgy and direct recycling differ in recovery efficiency, energy and chemical demand, and product quality, making battery design, safe dismantling and material separation important engineering considerations [22,23].
FCEVs introduce additional functional materials in proton-exchange membrane fuel-cell stacks and high-pressure hydrogen-storage systems. Platinum-group catalysts and flow-field plate materials contribute to stack-production burdens [24], whereas lightweight storage vessels require polymeric liners, metallic connection elements and CFRP overwraps with demanding strength, fatigue and crash-safety properties [25]. Their environmental performance additionally depends on the hydrogen-production pathway, with renewable or otherwise low-emission hydrogen providing the greatest potential benefits [26].
Increasing material diversity also complicates post-consumer management. Recovered carbon fibres may have altered length, surface condition and mechanical properties, restricting their subsequent structural applications [27]. Shredding produces heterogeneous residues containing polymers, elastomers, glass, fibres, electronics and residual metals [28]. Adhesive joints, enclosed modules and integrated systems may further reduce dismantling efficiency unless disassembly is incorporated into vehicle design [29]. Regional differences in collection, separation and recovery practices additionally affect recycling rates and secondary-material quality [30].
Prospective LCA enables future technologies to be assessed under assumptions concerning technological maturity, production scale, material composition and background energy systems [31,32]. Such scenarios should be technically consistent and should avoid temporal mismatches between future foreground technologies and background processes [33]. However, previous studies rarely integrate six powertrain configurations, detailed material substitution, battery and hydrogen technologies, contrasting post-consumer pathways and the decarbonisation of energy carriers within one segment-level 2025–2050 framework [34,35].
The present study addresses this gap through a materials-oriented prospective LCA of European C-segment passenger cars. Gasoline, diesel and compressed-natural-gas ICEVs are compared with gasoline PHEVs, BEVs and FCEVs under equivalent transport functionality. The 2025 reference scenario and prospective 2050 engineering scenario incorporate vehicle lightweighting, material substitution, battery development and manufacturing improvements. Landfill-oriented and recycling-oriented pathways are assessed using ReCiPe 2016, IPCC 2021, Cumulative Energy Demand, CML-IA baseline and Ecological Scarcity 2021. Vehicle manufacturing is additionally combined with well-to-tank and tank-to-wheel greenhouse gas emissions for the 2025, prospective 2050 and Paris Agreement-aligned 2050 scenarios.
Four working hypotheses were tested. First, compared with conventional ICEVs, PHEVs, BEVs and FCEVs were expected to exhibit higher vehicle-cycle environmental burdens because of the material- and energy-intensive production of traction batteries, power electronics, fuel-cell systems and hydrogen-storage components. Second, recycling-oriented post-consumer management was expected to generate greater avoided burdens for PHEVs, BEVs and FCEVs than for conventional ICEVs because of the larger quantities of recoverable metals and other high-impact functional materials. Third, prospective lightweight multi-material design was not expected to reduce all environmental indicators uniformly, because the benefits associated with lower vehicle mass could be partly offset by energy-intensive primary material production and limitations in recovering CFRPs and complex multi-material assemblies. Fourth, the decarbonisation of electricity and hydrogen production was expected to reduce fuel- and energy-cycle greenhouse gas emissions while increasing the relative contribution of material production and vehicle manufacturing to total life-cycle impacts. By testing these hypotheses, the study identifies the conditions under which advanced automotive materials, renewable energy carriers and circular post-consumer management can jointly support the sustainable development of passenger transport.
2. Materials and Methods
2.1. Object of Analysis
The objects of analysis were representative passenger cars classified within the European C segment, corresponding to compact or lower-medium-class vehicles. This segment was selected because it comprises vehicles with comparable dimensions, transport capacity and operational functions, while offering a sufficiently broad range of commercially available powertrain technologies. Six propulsion configurations were considered: gasoline-powered internal combustion engine vehicles (ICEVs), diesel-powered ICEVs, compressed natural gas (CNG)-powered ICEVs, gasoline plug-in hybrid electric vehicles (PHEVs), battery electric vehicles (BEVs) and fuel cell electric vehicles (FCEVs). The inclusion of these configurations is consistent with comparative vehicle life cycle assessment frameworks covering conventional, gaseous-fuel, battery-electric and hydrogen-based propulsion systems [36,37]. All variants were assumed to provide an equivalent transport function and to operate under the same service-life and mileage conditions. Consequently, the comparison focused on differences arising from powertrain architecture, material composition, energy-carrier requirements and end-of-life management.
The material inventory was developed using a modular approach. A common segment-level vehicle structure was combined with powertrain-specific components, including the internal combustion engine and fuel-supply system, the CNG installation, the electric drive system, the traction battery, and the fuel-cell and hydrogen-storage systems. This approach enabled the material and environmental consequences of individual powertrain configurations to be compared without changing the principal functional and dimensional characteristics of the vehicle. The separation of the common vehicle structure from technology-specific modules is consistent with comparative and prospective vehicle LCA approaches in which manufacturing, use and end-of-life stages are parametrised according to the selected powertrain [36,38].
Two time-horizon scenarios were analysed. The first represented passenger cars entering service in 2025 and reflected the material structure, vehicle mass, powertrain technologies and production conditions adopted as the study baseline. The second represented passenger cars expected to enter service in 2050. It was treated as a prospective engineering scenario rather than a forecast of a specific commercial vehicle model. Prospective vehicle LCAs commonly combine projected changes in vehicle technology, energy supply, production processes and material efficiency instead of attempting to predict a particular future model [38]. Accordingly, the 2050 scenario incorporated vehicle lightweighting, changes in the proportions of structural materials, increased use of advanced materials, improvements in component-manufacturing processes and the development of battery and hydrogen technologies. The assumed direction of material substitution was informed by published research on automotive multi-material design, advanced high-strength steels, aluminium alloys and fibre-reinforced composites [39,40].
The average mass of the C-segment reference vehicle in the 2025 scenario was 1382 kg. A reduction of approximately 20% was assumed for the 2050 scenario, resulting in a vehicle mass of 1106 kg. The corresponding material inventories are presented in Figure 1, whereas their percentage structures are shown in Figure 2. The adopted prospective scenario involved not only a reduction in total vehicle mass but also a substantial modification of the material structure. The 20% reduction and the individual material shares constitute scenario-specific modelling assumptions adopted in this study. They should not be interpreted as point forecasts derived from a single literature source. Nevertheless, their direction is consistent with research demonstrating the mass-reduction potential of multi-material vehicle structures [39,40].
In the 2025 configuration, the vehicle structure was dominated by the inventory categories of other steel, other polymeric materials, cast iron and advanced high-strength steel (AHSS). These groups accounted for approximately 32%, 22%, 13% and 12% of the vehicle mass, respectively. Cast and wrought aluminium represented approximately 4.5% and 1.5%, respectively, while carbon-fibre-reinforced polymers (CFRPs) accounted for only approximately 0.1%. The remaining material groups included textiles, glass, copper, magnesium, elastomers, zinc, lead, electronic components and other minor constituents. The dominance of ferrous alloys and polymeric materials in the baseline inventory is consistent with the general material structure reported for conventional passenger vehicles [40].
The 2050 scenario assumed the partial replacement of conventional ferrous materials with AHSS, aluminium alloys and CFRPs. The proportion of AHSS increased from 12% to 32%, corresponding to an increase from approximately 165.8 to 353.9 kg. Simultaneously, the share of cast aluminium increased from 4.5% to 14%, while that of wrought aluminium increased from 1.5% to 3%. The total mass of aluminium increased from approximately 84.3 to 189.1 kg, despite the reduction in overall vehicle mass. Aluminium alloys are particularly relevant to vehicle lightweighting because their low density can be combined with suitable strength, formability, corrosion resistance and established casting and forming processes [41]. CFRPs increased from approximately 0.1% to 9%, whereas the shares of cast iron and other steel decreased from 13% to 1.5% and from 32% to approximately 0.1%, respectively. The use of CFRPs offers substantial mass-reduction potential, although their production requirements, joining methods and end-of-life treatment differ considerably from those of metallic automotive materials [42]. These changes represented the material-substitution pathway adopted in the model to reduce vehicle mass while maintaining the required structural stiffness, strength, crashworthiness, durability and operational performance.
The proportion of other polymeric materials decreased slightly, from 22% in 2025 to 21% in 2050. Owing to the lower total vehicle mass, however, their absolute mass decreased from approximately 304.0 to 232.3 kg. When other polymeric materials and CFRPs are considered jointly, their contribution increased from approximately 22% to 30% of the vehicle mass. The prospective configuration therefore represented a transition from a structure dominated by conventional steels and cast iron towards a multi-material design combining AHSS, aluminium alloys and fibre-reinforced polymer composites. Such multi-material configurations require the coordinated consideration of mechanical performance, forming and casting technologies, dissimilar-material joining, corrosion control, repairability and separation during end-of-life processing [39,40].
For the battery-containing powertrain variants, the traction battery was modelled as a separate material module. Figure 3 presents the simplified composition of the representative traction battery adopted for the C-segment BEV inventory. Its total mass was approximately 400 kg. Aluminium was the principal constituent, with a mass of approximately 126 kg, corresponding to 31.5% of the battery mass. Graphite accounted for approximately 71 kg, nickel for 41 kg and the electrolyte for 37 kg. Other significant constituents included copper at 22 kg, polymeric materials at 21 kg, manganese at 12 kg, cobalt and electronic components at 9 kg each, lithium at 8 kg and steel at 3 kg. The remaining materials accounted for approximately 41 kg. The adopted inventory therefore included both bulk structural materials and electrochemically active or strategically important raw materials. Published battery inventories demonstrate the importance of distinguishing the cell active materials from the casing, module, electrical and thermal-management components [43,44,45]. As with the vehicle composition, the numerical masses used here represent the study-specific battery model and should not be interpreted as a universal composition applicable to every commercial battery pack.
Aluminium was primarily associated with the battery casing, module structure and cathode current-collection components. Graphite was used as the principal anode active material, whereas nickel, manganese, cobalt and lithium were associated mainly with the cathode active material. Copper was used in anode current collectors, busbars and electrical connections, while polymeric materials performed insulating, sealing and separator-related functions. The electrolyte enabled ionic transport between the electrodes. These functions are consistent with the material architecture of automotive lithium-ion cells and battery packs reported in the battery-material literature [43,45]. The battery composition was included in the assessment of raw-material acquisition, material processing, cell and pack manufacturing, vehicle production and end-of-life management.
For the baseline scenario, the battery calculations were based on the graphite-anode/NMC622-cathode chemistry adopted in the model. The prospective 2050 scenario assumed increased use of graphite-anode/NMC811-cathode cells, improvements in battery-production processes and a reduction in production-related environmental burdens. The transition from NMC622 towards cathode compositions with a higher nickel and lower cobalt content is consistent with the development of high-energy automotive cathode materials [45,46]. Nevertheless, the environmental consequences of such changes depend not only on cell chemistry but also on electrode production, manufacturing energy, material yields and end-of-life recovery [47].
The capacities of BEV and PHEV batteries were modelled separately because of the substantial differences between their electric-driving functions and energy-storage requirements. The representative BEV battery capacity in the baseline scenario was 45 kWh, whereas the PHEV battery capacity was 9.7 kWh. The material inventory presented in Figure 3 refers to the full-size traction battery used in the BEV configuration, while the PHEV battery inventory was adjusted to its lower capacity.
The FCEV configuration additionally included a proton-exchange-membrane fuel-cell stack and a high-pressure hydrogen-storage system. The fuel-cell module contained the membrane electrode assembly, catalyst layers, gas-diffusion layers, bipolar plates, seals and balance-of-plant components. These elements have distinct material and manufacturing requirements that should be represented separately from those of combustion engines and traction batteries [48]. The environmental inventory of the hydrogen-storage system accounted for the production of the pressure vessel and its auxiliary components, including the use of CFRP in the load-bearing composite overwrap. Carbon-fibre reinforcement is required to withstand the high circumferential stresses generated in compressed-hydrogen automotive tanks while limiting storage-system mass [49]. The fuel-cell and hydrogen-storage modules were therefore evaluated separately because their materials and manufacturing processes differ substantially from those of both conventional powertrains and battery systems.
A mean service life of 18 years was adopted for all analysed vehicles. The average annual mileage of a C-segment passenger car was assumed to be approximately 13,500 km, corresponding to a reference lifetime mileage of 243,000 km. These values constitute common scenario inputs rather than universal values for every European vehicle. A common service life and lifetime mileage were applied to all powertrain variants to maintain functional comparability because vehicle utilisation and lifetime mileage materially affect life-cycle results expressed per vehicle-kilometre [50]. Maintenance-related material flows included the replacement of tyres, operating fluids and selected wear components. Tyres were retained as a distinct maintenance-related material flow because their manufacture generates identifiable resource, energy and emission burdens over the vehicle life cycle [51].
The baseline fuel and electricity consumption values adopted for the C-segment vehicles were 7.1 l/100 km for gasoline ICEVs, 5.9 l/100 km for diesel ICEVs, 5.0 kg/100 km for CNG ICEVs, 4.1 l of gasoline and 12.1 kWh of electricity per 100 km for PHEVs, 20.6 kWh/100 km for BEVs and 1 kg H2/100 km for FCEVs. These values were selected as model inputs representing real-use conditions rather than type-approval results. The use of real-world inputs is important because the fuel consumption and CO2 emissions observed during vehicle operation can differ substantially from laboratory certification values [52]. The electricity-consumption values included the relevant charging losses for electrically powered vehicles. Changes in powertrain efficiency and in the production pathways of fuels, electricity and hydrogen were subsequently incorporated into the prospective scenarios.
The system boundaries covered raw-material acquisition and processing, material and component production, vehicle assembly, maintenance-related material consumption and end-of-life management. Fuel and energy production and their use during vehicle operation were evaluated separately within well-to-tank (WTT) and tank-to-wheel (TTW) modules. This separation enabled the environmental consequences of vehicle materials and manufacturing processes to be distinguished from those associated with fuel combustion, electricity generation and hydrogen production. The adopted boundary structure is consistent with vehicle LCAs that integrate vehicle-cycle and energy-cycle inventories while retaining the distinction between manufacturing and operational processes [36,38].
Two contrasting end-of-life scenarios were considered. The first was a landfill-oriented sensitivity scenario, in which the highest proportion of materials permitted within the adopted modelling assumptions was directed to disposal. This scenario constituted a counterfactual lower-recovery case and was not intended to represent current European end-of-life vehicle practice. The second was a recycling-oriented scenario that included the recovery of metals, polymers, battery materials and selected powertrain components. Studies of end-of-life vehicle systems demonstrate that dismantling, material identification, joining technologies and the efficiency of separation processes influence the amounts and quality of materials recovered from multi-material vehicles [53,54].
The recycling-oriented scenario also accounted for environmental credits associated with replacing primary materials with secondary raw materials. The achievable substitution depends on the recovered material quality, alloy separation, contamination levels and the possibility of closed- or open-loop utilisation. These factors are especially important for aluminium alloys and complex multi-material structures [55,56]. Battery recycling was included because the recovery route can influence both the environmental burdens of end-of-life processing and the avoided production of primary battery materials [47]. Separate LCA comparisons of ambient-temperature shredding, cryogenic shredding, combustion and pyrolysis also demonstrate that the selected treatment route materially affects the post-use environmental profile of tyres [57]. Comparison of the two scenarios enabled the influence of material recovery on the environmental performance of conventional and alternative C-segment powertrains to be assessed throughout their life cycles.
2.2. Methodology
A comparative prospective cradle-to-grave life cycle assessment was conducted in accordance with the framework and requirements of ISO 14040 and ISO 14044 [58,59,60]. The functional unit was defined as the provision of mobility by one representative C-segment passenger car during an 18-year service life and a lifetime mileage of 243,000 km. Six powertrain configurations were evaluated under consistent functional assumptions for the 2025 baseline and prospective 2050 scenarios. An additional Paris Agreement-aligned 2050 scenario was included in the analysis of fuel and energy cycles. The system boundary covered raw-material acquisition and processing, material and component production, vehicle assembly, maintenance and end-of-life management. Fuel or energy production and vehicle operation were additionally disaggregated into well-to-tank (WTT) and tank-to-wheel (TTW) modules. Selected climate-change results were further decomposed into vehicle manufacturing (W), WTT and TTW contributions.
The inventories were implemented in SimaPro 9.4 using ecoinvent 3.8 background datasets. Five complementary assessment methods were applied to identify potential burden shifting between material production, powertrain manufacturing, energy supply and post-consumer material management. The recycling scenario included credits for the substitution of primary materials by recovered secondary materials. Consequently, negative results represent avoided upstream burdens within the adopted substitution model and not negative physical emissions [61,62]. The 2050 results should be interpreted as conditional outcomes of the adopted technological and material scenarios rather than predictions of specific future vehicle models [63].
2.3. ReCiPe 2016
The ReCiPe 2016 Endpoint (H), World (2010), H/A method was applied to obtain an aggregated assessment of potential environmental consequences. Life cycle inventory flows are characterised along cause–effect pathways and subsequently assigned to three endpoint damage areas: Human Health, Ecosystems and Resources [64]. The H/A configuration combines the hierarchist characterisation perspective with World 2010 normalisation data and the average weighting set. The damage-area results were normalised, grouped and weighted to obtain environmental point values (Pt) and an aggregated single score.
ReCiPe 2016 integrates a broad range of environmental mechanisms, including climate change, particulate matter formation, toxicity, acidification, eutrophication, land and water use, and mineral and fossil resource scarcity. This scope is particularly relevant to the assessment of material-intensive vehicle systems because it captures potential consequences associated with raw-material extraction, material processing, component manufacturing and end-of-life treatment within a consistent methodological framework [65]. Because endpoint conversion, normalisation and weighting involve methodological assumptions and value choices, the total Pt score was interpreted together with the separate damage-area results rather than as an absolute measure of physical environmental damage.
2.4. IPCC 2021
Climate-change impacts were quantified using the IPCC 2021 GWP100 method. Global warming potential integrates the radiative forcing caused by a pulse emission over a 100-year time horizon and expresses the contribution of each greenhouse gas relative to carbon dioxide, for which the characterisation factor equals 1 [66]. Results were expressed in kg CO2 eq. The method enabled greenhouse gas emissions associated with vehicle materials, manufacturing, post-consumer management and the WTT and TTW stages to be compared on a consistent basis. As a single-issue indicator, GWP100 does not represent other consequences such as toxicity, resource scarcity, acidification or ecosystem degradation.
2.5. Cumulative Energy Demand (CED)
Cumulative energy demand was calculated using the Cumulative Energy Demand V1.11 method. CED quantifies the direct and indirect primary energy resources required throughout the complete product system and includes both non-renewable and renewable energy sources [67]. Results were expressed in MJ and represented the total energy-resource requirement associated with material production, component manufacturing, vehicle assembly and end-of-life processes [68]. Although CED can correlate with several environmental impact indicators in energy-intensive product systems, it remains an energy-resource indicator and not a direct measure of environmental damage [69]. It was therefore interpreted in combination with the results of the other LCIA methods.
2.6. CML-IA
The CML-IA baseline V3.08 method with the EU25 reference set was applied at midpoint level. The analysis focused on acidification and eutrophication because these categories capture emissions associated with energy generation, metal production, material processing and post-consumer treatment [70,71]. Acidification potential aggregates acidifying emissions using sulphur dioxide as the reference substance and is expressed in kg SO2 eq. Eutrophication potential represents the contribution of nutrient-releasing emissions and is expressed in kg PO4 eq. These indicators describe potential environmental pressures rather than measured, site-specific changes in soil or aquatic ecosystems.
2.7. Ecological Scarcity 2021
The Ecological Scarcity 2021 V1.00, eiv3 method was used to assess selected emissions to air, water and soil. The method converts inventory flows into eco-points, expressed as environmental impact points (UBP). Its eco-factors combine characterisation and normalisation with policy-based weighting derived from the relationship between current environmental flows and legally or politically defined critical flows [72]. The distance between current and target conditions receives non-linear weighting, with the current-to-critical-flow ratio raised to the second power.
The categories reported in this study comprised harmful emissions to air, water and soil. These indicators are particularly relevant to metal extraction, alloy and battery-material production, energy supply and end-of-life processing. Because the underlying eco-factors are derived from policy-defined environmental targets, absolute UBP values depend on the adopted policy framework and regional reference system [73,74,75]. They were therefore used for internally consistent comparison and hotspot identification rather than as universally transferable measures of physical damage.
3. Results
3.1. ReCiPe 2016
Figure 4 presents the weighted ReCiPe 2016 endpoint results for the vehicle-related life-cycle stages of the analysed C-segment passenger cars. Fuel and energy supply chains, which were assessed separately, were not included in this part of the analysis. Under the landfill-oriented scenario, all powertrain configurations generated positive environmental burdens ranging from 2.50 × 10³ to 3.64 × 10³ Pt in 2025 and from 2.34 × 10³ to 3.42 × 10³ Pt in 2050. In both time-horizon scenarios, the highest values were obtained for BEVs, followed by FCEVs and PHEVs. This ranking reflects the greater material and manufacturing intensity of advanced powertrains, including traction batteries, electric-drive components, power electronics, fuel-cell stacks and high-pressure hydrogen-storage systems. Among the ICEV variants, CNG-powered vehicles produced the highest scores because of the additional material requirements associated with the gas-storage and supply system, whereas gasoline-powered ICEVs showed the lowest burdens.
The application of the recycling-oriented scenario fundamentally changed the environmental balance of the analysed material systems. For the ICEV configurations, the weighted scores remained positive, although they decreased to 4.06 × 10²–5.14 × 10² Pt in 2025 and 2.18 × 10²–4.82 × 10² Pt in 2050. Considerably larger changes were observed for the more material-intensive PHEV, BEV and FCEV configurations. In 2025, their results decreased to −2.04 × 10³, −2.49 × 10³ and −2.45 × 10³ Pt, respectively. The corresponding values for 2050 were −1.93 × 10³, −2.34 × 10³ and −2.30 × 10³ Pt. Consequently, replacing the landfill-oriented scenario with recycling changed the net ReCiPe 2016 result by approximately 2.09 × 10³–6.13 × 10³ Pt in 2025 and 1.96 × 10³ –5.75 × 10³ Pt in 2050. The greatest differences were identified for BEVs and FCEVs, confirming that end-of-life management is particularly important for vehicles containing complex and resource-intensive electrical, electrochemical and hydrogen-related components.
The negative results obtained for the recycling scenarios should not be interpreted as an absence of environmental impacts or as actual negative emissions. They represent modelled environmental credits generated by the recovery of materials and the resulting avoidance of primary raw-material production within the adopted allocation and substitution framework. The magnitude of these credits indicates the environmental importance of recovering steel, aluminium, copper and selected materials contained in traction batteries, electric-drive systems, power electronics, fuel-cell components and hydrogen-storage systems. The results therefore demonstrate that the environmental performance of advanced powertrains depends not only on their operating energy carrier but also on material selection, component design, dismantlability, separation efficiency and the availability of high-quality recycling processes.
The landfill-oriented results for 2050 were approximately 5.4–6.4% lower than the corresponding 2025 values. This improvement is consistent with the assumed reduction in vehicle mass, the increased use of advanced high-strength steels and lightweight materials, and lower environmental burdens associated with future material and component manufacturing. For PHEVs, BEVs and FCEVs, the recycling credits remained substantial in 2050, although their absolute values were slightly lower than in 2025. This difference is consistent with a prospective material system characterised by lower vehicle mass and reduced impacts from the primary materials displaced through recycling. It should therefore not be interpreted as a decline in the importance of recycling.
The results show that low-carbon propulsion and renewable energy supply alone are insufficient to ensure favourable life-cycle performance. For BEVs powered by renewable electricity and FCEVs supplied with low-emission hydrogen, circular management of batteries, electrical components, fuel-cell systems and structural materials constitutes an essential material-side condition for achieving their full environmental potential. The findings support the integration of lightweight multi-material design, design for disassembly, recovery of critical raw materials and closed-loop recycling into the development of future C-segment passenger cars.
Table 1 provides a disaggregated interpretation of the ReCiPe 2016 single-score results by separating the total environmental burden into three endpoint damage areas: Human Health, Ecosystems and Resources. Fuel and energy supply chains, which were assessed separately, were not included in this part of the analysis. For the landfill-oriented scenarios, Human Health was the dominant damage area for every powertrain configuration, accounting for approximately 92.2–94.5% of the total weighted score. Ecosystem-related impacts contributed approximately 5.3–7.3%, whereas the numerical contribution of Resources remained below 0.5%. This distribution indicates that the endpoint results were determined primarily by emissions and processes affecting human health, including those associated with raw-material extraction, metallurgical processing, component production and end-of-life treatment.
In the 2025 landfill-oriented scenario, the Human Health score increased from 2.32 × 10³ Pt for gasoline-powered ICEVs to 3.44 × 10³ Pt for BEVs. FCEVs and PHEVs also produced relatively high values of 3.34 × 10³ and 2.92 × 10³ Pt, respectively. A similar ranking was obtained for Ecosystems and Resources. The highest resource-related burden was recorded for FCEVs at 1.56 × 101 Pt, followed by BEVs at 1.53 × 101 Pt and PHEVs at 1.14 × 101 Pt. The corresponding values for the ICEV variants ranged from 7.04 to 7.24 Pt. These differences reflect the additional material requirements of traction batteries, electric-drive components, power electronics, fuel-cell stacks and hydrogen-storage systems. They also demonstrate that the transition towards electrified and hydrogen-based propulsion shifts a greater proportion of the product-related environmental burden towards material extraction, processing and component manufacturing.
The recycling-oriented scenarios produced environmental credits in the Ecosystems damage area for all powertrain variants. In contrast, the Human Health results remained positive for the three ICEV configurations but became negative for PHEVs, BEVs and FCEVs. In 2025, the Human Health scores for these advanced powertrains reached −1.79 × 10³, −2.15 × 10³ and −2.12 × 10³ Pt, respectively, while their Ecosystems scores ranged from −2.69 × 10³ to −3.49 × 10² Pt. The combined credits in these two damage areas exceeded the remaining burdens, producing negative total scores for PHEVs, BEVs and FCEVs. This confirms that the environmental effects of recovering materials from complex powertrain systems can be considerably greater than those obtained for conventional ICEV structures.
The Resources damage area remained positive in every recycling scenario. In 2025, its values ranged from 5.98 Pt for gasoline-powered ICEVs to 12.8 Pt for FCEVs, while the corresponding 2050 values ranged from 3.42 Pt for CNG-powered ICEVs to 9.03 Pt for FCEVs. Consequently, even when the overall ReCiPe 2016 result became negative because of credits in the Human Health and Ecosystems damage areas, the demand for mineral and material resources was not fully compensated. This finding is particularly important for BEVs and FCEVs because recycling reduces, but does not eliminate, the resource burdens associated with batteries, electrical systems, fuel-cell components and hydrogen-storage systems.
The relatively small numerical share of Resources in the total weighted result should not be interpreted as evidence that material demand is environmentally insignificant. It results partly from the normalization and weighting structure of the ReCiPe 2016 endpoint method. From the perspective of sustainable materials, supply security and circular product design, the persistent positive resource scores remain relevant because they indicate continued dependence on primary materials and incomplete substitution by secondary raw materials. The results therefore support the development of high-efficiency recovery processes for aluminium, copper, steel and materials contained in batteries and fuel-cell systems, together with design solutions facilitating component removal, material separation and closed-loop recycling.
The prospective 2050 scenario reduced the total landfill-oriented results for all analysed powertrains, primarily through lower Human Health and Resources scores. The resource-related burdens of PHEVs, BEVs and FCEVs decreased by approximately 33%, 31% and 29%, respectively, compared with 2025. These reductions are consistent with the assumed decrease in vehicle mass, changes in material composition and improvements in material and component manufacturing. Nevertheless, the Ecosystems scores under the landfill-oriented scenario did not decrease uniformly. They rose from 1.85 × 10² to 1.92 × 10² Pt for PHEVs, from 1.94 × 10² to 2.03 × 10² Pt for BEVs and from 1.89 × 10² to 1.97 × 10² Pt for FCEVs. This result indicates that prospective lightweighting and material substitution may reduce the overall environmental burden while simultaneously shifting part of it towards ecosystem-related damage.
Under the recycling-oriented scenario, the ecosystem-related credits for PHEVs, BEVs and FCEVs became slightly greater in 2050 than in 2025. This demonstrates that recovery processes remain essential even when future vehicles are lighter and their manufacturing processes are less environmentally intensive. The results show that improvements in propulsion technology and access to renewable electricity or low-emission hydrogen must be accompanied by circular material management. Without effective recovery of structural metals, battery materials, electrical components and fuel-cell system materials, a substantial part of the environmental potential of advanced C-segment vehicles would remain unrealized.
- Global Warming Potential (IPCC)
Figure 5 presents the IPCC 2021 characterisation results for the global warming potential associated with the material and component life cycle of the analysed C-segment passenger cars. The reported values refer to the vehicle system, whereas the environmental impacts of fuel and energy supply chains are assessed separately. In the 2025 scenario, the results obtained for the landfill pathway range from 9.92 × 10³ kg CO2 eq for the gasoline ICEV to 14.09 × 10³ kg CO2 eq for the BEV. In the prospective 2050 scenario, the corresponding range decreases to 8.82 × 10³–12.49 × 10³ kg CO2 eq.
Under the landfill scenario, BEVs exhibit the highest greenhouse gas emissions in both analysed years, followed by FCEVs and PHEVs. This result is primarily associated with the material and manufacturing intensity of advanced powertrain systems. In the case of BEVs, the climate burden is affected by the production of the traction battery and its material constituents, including aluminium, graphite, nickel, copper and electronic components. The results for FCEVs are additionally influenced by the fuel-cell system and the material-intensive high-pressure hydrogen storage system, whereas PHEVs combine the material requirements of combustion and electric propulsion architectures. Consequently, the ranking shown in Figure 5 reflects the embodied emissions of materials and components and should not be interpreted as a comparison of direct vehicle-use emissions.
The application of recycling reduces the global warming potential of every powertrain configuration by approximately 9.5–25.2% compared with landfilling. The greatest benefit is observed for the PHEV, for which recycling decreases the result by approximately 3.07 × 10³ kg CO2 eq in 2025 and 2.72 × 10³ kg CO2 eq in 2050, corresponding to a reduction of approximately 25.2% in both scenarios. The reductions amount to approximately 19.9% for the BEV and 18.9% for the FCEV. For conventional ICEVs, the benefits are smaller because of their lower inventories of recoverable high-impact materials. Notably, after the inclusion of recycling credits, the result for the PHEV becomes approximately equal to that obtained for the CNG-powered ICEV, despite the considerably higher impact of the PHEV under the landfill pathway.
Between 2025 and 2050, the global warming potential decreases by approximately 11.0–11.3% under the landfill scenario and by approximately 11.3–16.3% under the recycling scenario. This improvement is consistent with the prospective assumptions concerning vehicle lightweighting, changes in material composition, technological development and a reduction in the carbon intensity of material and component production. Nevertheless, the results demonstrate that substantial embodied greenhouse gas emissions remain associated with electrified and hydrogen-powered vehicles.
The results confirm that end-of-life management constitutes an important design variable rather than merely a waste-treatment decision. The climate benefits of advanced powertrains can be strengthened through design for disassembly, efficient separation of multi-material structures and high-quality closed-loop recovery of aluminium, copper, steel and battery materials. Even when vehicles are powered by renewable electricity or low-emission hydrogen, the production and end-of-life treatment of materials remain relevant sources of greenhouse gas emissions. The transition towards low-emission mobility should therefore integrate powertrain development with material efficiency, increased use of secondary raw materials and circular management of vehicle components. Since the IPCC indicator addresses only climate change, these findings should be interpreted together with the results obtained for other environmental impact categories to identify potential burden shifting between climate, resource and ecosystem-related effects.
- 2.
- Cumulative Energy Demand (CED)
Figure 6 presents the total cumulative primary energy demand associated with the vehicle-related material and component life-cycle stages of the analysed C-segment passenger cars. The results include the primary energy required for raw-material extraction, material processing, component manufacturing, vehicle assembly and end-of-life management within the adopted system boundaries. Fuel- and energy-supply pathways are assessed separately. The CED results should therefore be interpreted primarily as an indicator of the energy intensity embodied in the vehicle materials, components and manufacturing processes rather than as a measure of operational energy consumption.
In the 2025 scenario, the cumulative energy demand under the landfill pathway ranges from 1.64 × 10⁵ MJ for the gasoline ICEV to 2.36 × 10⁵ MJ for the BEV. When recycling is applied, the corresponding values decrease to 1.31 × 10⁵ –1.77 × 10⁵ MJ. A similar ranking is observed in the prospective 2050 scenario, in which the results range from 1.50 × 10⁵ to 2.12 × 10⁵ MJ for landfilling and from 1.16 × 10⁵ to 1.59 × 10⁵ MJ for recycling. BEVs exhibit the highest cumulative energy demand in both analysed years, followed by FCEVs and PHEVs, whereas conventional ICEVs show lower material- and manufacturing-related energy requirements.
The comparatively high CED of BEVs is associated primarily with the energy-intensive production of traction batteries, including the extraction and processing of lithium, nickel, cobalt, manganese, graphite, aluminium and copper, as well as cell and electronic-component manufacturing. In FCEVs, substantial primary energy inputs are associated with the fuel-cell stack and the production of high-pressure hydrogen storage systems, particularly carbon-fibre-reinforced polymer components. The intermediate results obtained for PHEVs reflect their combined combustion and electric propulsion architecture, which requires both conventional drivetrain components and a traction battery.
Recycling reduces the cumulative energy demand of all powertrain configurations. In 2025, the reductions range from approximately 15.4% for the diesel ICEV to 28.4% for the PHEV, whereas in 2050 they range from approximately 19.8% for the CNG-powered ICEV to 28.4% for the PHEV. The largest absolute saving is obtained for the BEV and amounts to approximately 5.96 × 10⁴ MJ in 2025 and 5.35 × 10⁴ MJ in 2050. Recycling decreases CED by approximately 25.2% for the BEV and 24.6% for the FCEV. These benefits result from reducing the demand for primary material production through the recovery of aluminium, copper, steel and battery materials, even after accounting for the energy required by recycling processes.
Between 2025 and 2050, the CED results decrease by approximately 9.0–10.2% under the landfill scenario and by approximately 10.2–17.3% under the recycling scenario. This reduction is consistent with the prospective assumptions concerning vehicle lightweighting, changes in material composition and improved efficiency of material and component production. However, lightweighting should not be evaluated solely on the basis of vehicle mass. Materials such as aluminium and carbon-fibre-reinforced polymers can reduce structural mass but may require considerable primary energy during production. Material substitution should therefore be assessed using life-cycle energy indicators to ensure that the reduction in vehicle mass is not offset by an increase in embodied primary energy demand.
The findings demonstrate that the energy performance of future passenger cars depends not only on the efficiency of their propulsion systems but also on the material and structural design of the vehicle. Design for disassembly, reduced complexity of multi-material connections, efficient separation of components and closed-loop recovery of energy-intensive materials can significantly reduce cumulative primary energy demand. Consequently, renewable electricity and low-emission hydrogen should be combined with material-efficient vehicle architectures and circular supply chains. Since total CED quantifies primary energy demand without fully representing the environmental consequences or the composition of energy sources, these results should be interpreted together with the IPCC 2021, ReCiPe 2016 and other environmental indicators used in the study.
- 3.
- Acidification and Eutrophication Potential (CML-IA Baseline)
Figure 7 presents the acidification potential associated with the vehicle-related material and component life-cycle stages of the analysed C-segment passenger cars. The CML-IA baseline indicator, expressed in kg SO2 eq, aggregates the contributions of acidifying elementary flows, primarily sulphur dioxide, nitrogen oxides and ammonia. Within the adopted system boundaries, these emissions are associated mainly with raw-material extraction, metallurgical processing, the production of battery and powertrain components, process-energy generation and end-of-life management. Fuel- and energy-supply pathways are assessed separately.
In the 2025 scenario, the acidification potential under the landfill pathway ranges from 81.2 kg SO2 eq for the gasoline ICEV to 130.2 kg SO2 eq for the CNG-powered ICEV. Recycling reduces the corresponding range to 61.4–98.4 kg SO2 eq. The particularly high result obtained for the CNG configuration indicates that acidification is not determined solely by the presence of a traction battery. It is also sensitive to the quantity and type of materials used in high-pressure storage and fuel-system components, as well as to the upstream production processes represented in the life-cycle inventory. BEVs and PHEVs also show comparatively high values, reaching 120.9 and 118.5 kg SO2 eq, respectively, under the landfill scenario.
The acidification potential of electrified vehicles is influenced by the extraction, concentration and refining of metals used in traction batteries, electric machines, power electronics and electrical conductors. The production of nickel, cobalt, copper and aluminium can generate acidifying emissions through metallurgical processes and the combustion of fuels used to provide process heat and electricity. In the case of FCEVs, additional contributions may arise from the production of fuel-cell materials and high-pressure hydrogen storage components, including carbon-fibre-reinforced structures. These results demonstrate that the environmental performance of advanced powertrains depends on the production routes of their constituent materials and not only on the type of energy carrier used during vehicle operation.
In the prospective 2050 scenario, the acidification potential decreases to 70.0–102.6 kg SO2 eq for landfilling and 53.0–78.1 kg SO2 eq for recycling. The highest result is then obtained for the PHEV, closely followed by the BEV, whereas the gasoline ICEV remains the least burdensome configuration within the analysed vehicle-related system. The particularly pronounced decrease observed for the CNG vehicle, amounting to approximately 37.6% for landfilling and 34.3% for recycling relative to 2025, indicates a strong influence of the prospective assumptions concerning its material inventory, component design and manufacturing processes. For the remaining powertrains, the reductions under the landfill pathway range from approximately 12% to 18%.
Recycling provides a net reduction in acidification potential for every analysed powertrain. Across both years, the relative benefits range from approximately 20.4% to 24.6%. In 2025, the largest absolute reduction is obtained for the CNG-powered ICEV and amounts to approximately 31.7 kg SO2 eq. In 2050, the greatest absolute benefit is observed for the BEV, for which recycling decreases the result by approximately 24.9 kg SO2 eq. These reductions are associated with avoiding part of the primary extraction, concentration, smelting and refining processes through the recovery of steel, aluminium, copper and battery materials. The results therefore confirm that high-quality secondary-material production can reduce not only resource demand and greenhouse gas emissions but also upstream acidifying emissions.
The ranking obtained for acidification differs from that observed for cumulative energy demand and global warming potential. In particular, the highest 2025 result is obtained for the CNG configuration rather than the BEV. This finding demonstrates that the sustainability of a material system cannot be determined from its carbon footprint or energy demand alone. Material selection should account for the complete environmental profile of extraction, processing and recycling technologies to prevent burden shifting between climate change, energy-resource demand and acidification.
Reducing acidification requires the selection of lower-impact material supply routes, increased use of secondary metals, improved recovery yields and the application of manufacturing processes supplied by low-emission energy sources. Design for disassembly, accessible connections and effective separation of metals, polymers, electronic components and battery materials can further increase the environmental benefits of recycling. Consequently, the development of vehicles powered by renewable electricity or low-emission hydrogen should be integrated with sustainable material selection and circular component management. Such an approach is necessary to ensure that reductions in operational emissions are not accompanied by increased upstream impacts from the production of advanced materials.
Figure 8 presents the eutrophication potential associated with the vehicle-related material and component life-cycle stages of the analysed C-segment passenger cars. The CML-IA baseline indicator, expressed in kg PO4 eq, aggregates the potential effects of nutrient-enriching emissions released to air, water and soil, including nitrogen oxides, ammonia, nitrates and phosphates. The results represent potential environmental effects calculated from the life-cycle inventory and should not be interpreted as direct measurements of eutrophication in a specific receiving ecosystem. Fuel- and energy-supply pathways are assessed separately.
In the 2025 scenario, the eutrophication potential under the landfill pathway ranges from 11.67 kg PO4 eq for the gasoline PHEV to 24.60 kg PO4 eq for the diesel ICEV. Under the recycling pathway, the corresponding range increases to 14.19–26.89 kg PO4 eq. Conventional ICEVs exhibit higher results than the electrified and hydrogen-powered configurations, with the diesel and gasoline variants producing the highest values. Among the advanced powertrains, the BEV and FCEV show similar results, whereas the PHEV has the lowest eutrophication potential under the landfill scenario.
In contrast to the results obtained for global warming potential, cumulative energy demand and acidification potential, recycling increases the eutrophication indicator for every powertrain configuration. In 2025, the increase ranges from approximately 5.9% for the CNG-powered ICEV to 21.6% for the PHEV. The corresponding differences amount to approximately 12.5% for the BEV and 12.7% for the FCEV. This result indicates that the environmental credits associated with avoiding primary material production are insufficient to compensate for the category-specific burdens of the recycling processes represented in the adopted life-cycle inventory.
The increase may be associated with collection and transport operations, dismantling, shredding, separation and the subsequent metallurgical or chemical treatment of recovered materials. In particular, hydrometallurgical processing of battery and electronic components may require chemical reagents, process water and wastewater treatment. The production of process chemicals and electricity, as well as insufficient recovery or treatment of nitrogen- and phosphorus-containing compounds, can contribute to the eutrophication indicator. The magnitude of these contributions depends on the technological configuration, recovery yield, energy supply and wastewater-management system of the recycling process. A detailed process-level contribution analysis would therefore be required to identify the dominant sources for each material stream.
In the prospective 2050 scenario, the eutrophication potential increases to 15.87–29.27 kg PO4 eq for landfilling and 18.98–32.00 kg PO4 eq for recycling. The diesel ICEV remains the most burdensome configuration, followed by the gasoline and CNG-powered ICEVs. Recycling increases the results by approximately 5.9–21.6%, with the largest relative and absolute difference observed for the PHEV. For this powertrain, the indicator increases from 16.78 to 20.40 kg PO4 eq, corresponding to an additional 3.62 kg PO4 eq. The corresponding recycling-related increases reach 3.11 kg PO4 eq for the BEV and 3.24 kg PO4 eq for the FCEV.
The 2050 values are higher than the corresponding 2025 results for all powertrain technologies. Depending on the configuration, the increase amounts to approximately 9.8–43.8% under the landfill pathway and 16.7–43.8% under the recycling pathway. The greatest increase is observed for the PHEV. This pattern demonstrates that the prospective reduction in vehicle mass and the improvements obtained for climate change, cumulative energy demand and acidification do not necessarily produce an equivalent reduction in eutrophication potential. Changes in material composition, the increasing use of technologically advanced components and the processing requirements of future material-recovery systems can alter the proportions between individual environmental impact categories.
The higher eutrophication potential of the recycling pathways does not indicate that landfilling is environmentally preferable overall. Instead, it confirms that circularity should be assessed using multiple environmental indicators and that a high material-recovery rate alone is not a sufficient measure of sustainability. Recycling technologies should be designed to minimise chemical consumption, recover process reagents, operate in closed water circuits and provide effective treatment of liquid and gaseous emissions. Selective dismantling and improved separation of batteries, electronic components, metals, polymers and composite materials can also reduce contamination and limit the number of processing stages required to obtain secondary materials of suitable quality.
The results demonstrate that the environmental quality of secondary materials depends not only on the quantity recovered but also on the technological route by which recovery is achieved. For electric and hydrogen vehicles intended to operate using renewable energy, design for disassembly should therefore be integrated with low-emission material-processing and recycling technologies. Such an approach can preserve the climate, energy and resource benefits of circular material management while limiting unintended eutrophication-related burden shifting.
- 4.
- Ecological Scarcity 2021
Figure 9 presents the Ecological Scarcity 2021 weighting results for carcinogenic air emissions associated with the vehicle-related material and component life-cycle stages of the analysed C-segment passenger cars. The results are expressed in environmental impact points (UBP) calculated using policy-based eco-factors. These factors reflect the relationship between the current emission level and the corresponding critical or target level defined by environmental policy. Consequently, the UBP values do not represent the physical mass of emitted substances. They provide a weighted measure of the environmental relevance of emissions within the adopted life-cycle inventory.
In the 2025 scenario, the results obtained under the landfill pathway range from 3.63 × 10⁶ UBP for the CNG-powered ICEV to 6.55 × 10⁶ UBP for the BEV. FCEVs produce a similarly high result of 6.39 × 10⁶ UBP, whereas the PHEV reaches 4.26 × 10⁶ UBP. The gasoline and diesel ICEVs produce identical results of 3.72 × 10⁶ UBP under the adopted assumptions. This similarity indicates that the category is governed primarily by the common material and component inventories of these vehicles. It should not be interpreted as evidence of identical operational exhaust-emission profiles.
The comparatively high results obtained for BEVs and FCEVs are associated with their greater dependence on technologically advanced and processing-intensive materials. In the case of BEVs, potentially important sources include the extraction and refining of nickel, cobalt, copper and other battery materials, aluminium production, electronic-component manufacturing and the production of electric-drive components. The FCEV results may additionally be influenced by platinum-group metals used in fuel-cell stacks, electronic components and carbon-fibre-reinforced high-pressure hydrogen tanks. Metallurgical operations, ore processing, high-temperature material production and upstream electricity generation can release small quantities of strongly weighted harmful substances. A process-level contribution analysis would be required to identify the individual substances and manufacturing processes responsible for the total UBP results.
Recycling reduces the air-emission score for all analysed powertrains. In 2025, the relative reduction ranges from approximately 12.9% for the CNG-powered ICEV to 26.8% for the PHEV. The reduction amounts to approximately 20.4% for the BEV and 20.3% for the FCEV. The largest absolute benefit is obtained for the BEV, for which recycling decreases the result by approximately 1.34 × 10⁶ UBP. The corresponding reductions reach 1.30 × 10⁶ UBP for the FCEV and 1.14 × 10⁶ UBP for the PHEV.
The substantial recycling benefit observed for advanced powertrains results from the avoided extraction, concentration, refining and primary production of metals and other high-impact materials. The PHEV shows the greatest relative improvement because its combined combustion and electric propulsion architecture contains a comparatively diverse inventory of recoverable components. Under the 2025 recycling scenario, its result decreases to 3.12 × 10⁶ UBP and becomes slightly lower than the results obtained for the conventional ICEVs. This change in ranking demonstrates that the end-of-life pathway can materially alter the environmental performance of a powertrain architecture.
In the prospective 2050 scenario, the results decrease to 2.55 × 10⁶–5.35 × 10⁶ UBP for landfilling and 2.22 × 10⁶–4.26 × 10⁶ UBP for recycling. The BEV remains the highest-impact configuration, followed by the FCEV and PHEV. Recycling reduces the results by approximately 12.9–26.8%, with the largest relative benefit again observed for the PHEV. The greatest absolute reduction is obtained for the BEV and amounts to approximately 1.09 × 10⁶ UBP.
Between 2025 and 2050, the weighted harmful air-emission score decreases for every powertrain configuration. The reduction ranges from approximately 18.3% to 29.8% under the landfill pathway and from approximately 18.3% to 31.1% under the recycling pathway. These improvements are consistent with the prospective assumptions concerning vehicle lightweighting, changes in material composition, cleaner material-production processes and improved emission-control systems. Nevertheless, the persistently high results obtained for BEVs and FCEVs indicate that the transition to renewable electricity and low-emission hydrogen does not eliminate the environmental burdens associated with the production of vehicle materials and components.
The results demonstrate the importance of controlling hazardous emissions throughout the material supply chain. Recommended measures include selecting low-emission metallurgical and refining processes, increasing the use of secondary metals, improving the traceability of battery and fuel-cell materials and applying effective filtration and containment systems in primary and secondary material production. Design for disassembly and selective separation of batteries, electronics, alloys and composite components can increase recovery yields while reducing contamination between material streams.
The environmental quality of recycled materials should therefore be evaluated not only through their recovery rate but also through the emissions generated during their production. Circular material management based on controlled, high-quality recovery processes can reduce dependence on primary resources and limit emissions associated with material extraction and processing. This integration of sustainable material selection, component design and end-of-life management is particularly important for electric and hydrogen vehicles intended to operate within renewable-energy-based transport systems.
Figure 10 presents the Ecological Scarcity 2021 weighting results for emissions to water associated with the vehicle-related material and component life-cycle stages of the analyzed C-segment passenger cars. The results are expressed in environmental impact points (UBP) calculated using policy-based eco-factors.
In the 2025 scenario, the results obtained under the landfill pathway range from approximately 2.82 × 10⁵ UBP for the gasoline ICEV to 8.23 × 10⁵ UBP for the BEV. The FCEV produces a similarly high result of 7.89 × 10⁵ UBP, followed by the PHEV with 6.62 × 10⁵ UBP. Conventional ICEVs show markedly lower values of approximately 2.82 × 10⁵–2.85 × 10⁵ UBP. The results therefore reveal a clear relationship between the material complexity of the powertrain and emissions associated with its material supply and processing chains.
The comparatively high results obtained for BEVs are consistent with their substantial inventories of battery materials, copper conductors, electronic components and electric-drive assemblies. Harmful emissions to water can arise during ore extraction, mine-water drainage, mineral concentration, refining, hydrometallurgical processing and the management of tailings and process residues. Potentially relevant emissions include chromium(VI), zinc, copper, nickel, cadmium and lead. In FCEVs, additional contributions may be associated with the production of fuel-cell catalysts, metallic stack components, power electronics and balance-of-plant equipment. The PHEV combines combustion and electric propulsion systems and therefore requires a comparatively diverse inventory of metal-bearing components. A process-level contribution analysis would be required to determine the individual metals and production stages responsible for the aggregated UBP results.
Recycling substantially reduces emissions to water for every analysed powertrain. In 2025, the reductions range from approximately 54.7% to 58.9% compared with landfilling. The largest absolute benefit is obtained for the BEV, for which recycling decreases the result by approximately 4.50 × 10⁵ UBP. The corresponding reductions amount to 4.39 × 10⁵ UBP for the FCEV and 3.90 × 10⁵ UBP for the PHEV. For conventional ICEVs, the absolute benefits are smaller because of their lower inventories of recoverable metal-bearing components, although the relative reductions remain greater than 55%.
The strong recycling benefit is primarily associated with avoiding part of the environmental burden generated by primary metal extraction, ore beneficiation, refining and metallurgical processing. Recycling also limits the disposal of batteries, electronic components, catalysts and other metal-bearing parts that could contribute to water pollution through landfill leachate or inadequately managed waste-treatment residues. High-yield recovery of nickel, cobalt, copper, manganese, steel alloys and other metal-bearing fractions is therefore particularly important for limiting water-related environmental pressures.
In the prospective 2050 scenario, the weighted results decrease to approximately 2.07 × 10⁵–6.93 × 10⁵ UBP for landfilling and 9.27 × 10⁴–3.14 × 10⁵ UBP for recycling. The BEV remains the highest-impact configuration, followed by the FCEV and PHEV. Recycling reduces the results by approximately 54.7–63.2%. The greatest absolute reduction is again obtained for the BEV and amounts to approximately 3.79 × 10⁵ UBP. The corresponding benefits reach 3.71 × 10⁵ UBP for the FCEV and 3.22 × 10⁵ UBP for the PHEV.
Between 2025 and 2050, the weighted results decrease for all analysed powertrain technologies. The reduction ranges from approximately 7.8% to 27.3% under the landfill pathway and from approximately 15.3% to 27.3% under the recycling pathway. These changes are consistent with the prospective assumptions concerning vehicle lightweighting, changes in material composition, cleaner material-production processes and improved recovery technologies. Nevertheless, BEVs and FCEVs continue to show higher results than conventional vehicles, indicating that recycling substantially reduces but does not completely eliminate the upstream water-related burdens associated with advanced materials and components.
The findings demonstrate the im-portance of controlling water emissions throughout both primary and secondary mate-rial-production chains. Recycling technologies for batteries, electronic components and fuel-cell systems should incorporate closed-loop process-water circulation, recovery of chemical reagents and effective treatment of wastewater. Depending on the composition of the wastewater, suitable treatment operations may include chemical precipitation, adsorption, ion exchange or membrane separation. Solid residues generated during these processes should be stabilised and managed in a manner that prevents subsequent leaching of hazardous substances.
Design for disassembly, accessible connections and selective separation of batteries, electronics, alloys and composite components can improve the purity of recovered material streams and reduce the intensity of subsequent chemical treatment. Material traceability and responsible sourcing are equally important because the water-related performance of a component depends on the environmental standards applied throughout its supply chain.
The results should not be interpreted as evidence that BEVs or FCEVs have a greater overall environmental impact than conventional vehicles. They isolate a specific material-related category in which advanced powertrains are particularly sensitive to the production and recovery of metal-bearing components. Combining renewable electricity or low-emission hydrogen with controlled material sourcing, secondary-metal use and water-efficient recycling is therefore necessary to reduce the complete environmental burden of future mobility systems.
Figure 11 presents the Ecological Scarcity 2021 weighting results for emissions to soil associated with the vehicle-related material and component life-cycle stages of the analysed C-segment passenger cars. The results are expressed in environ-mental impact points (UBP) calculated using policy-based eco-factors.
In the 2025 scenario, the results obtained under the landfill pathway range from 1.13 × 10⁵ UBP for the PHEV to 2.98 × 10⁵ UBP for the diesel ICEV. The gasoline ICEV reaches 2.81 × 10⁵ UBP, while the corresponding value for the CNG-powered ICEV is 2.10 × 10⁵ UBP. BEVs and FCEVs produce considerably lower results of approximately 1.14 × 10⁵ and 1.13 × 10⁵ UBP, respectively. Under the adopted life-cycle inventory, conventional powertrains therefore show higher weighted harmful emissions to soil than the electrified and hydrogen-powered configurations.
Potential sources of these emissions include mineral extraction, ore processing, metallurgical production, management of mining waste and tailings, deposition of industrial emissions, treatment of metal-containing process residues and disposal of vehicle components. Depending on the material supply chain, potentially relevant flows may include chromium(VI), zinc, copper, nickel, cadmium and lead. These substances may accumulate in soil, remain there for extended periods and subsequently enter plants, groundwater or food chains.
The higher results obtained for conventional vehicles indicate that this category is not governed solely by the presence of traction batteries, fuel-cell stacks or electronic components. Instead, it is sensitive to the complete material inventory and to the soil-emission factors assigned to the extraction, processing and end-of-life treatment of individual materials. Steel and alloy production, surface-treatment processes, polymer and elastomer manufacturing, catalysts, lubricants and other vehicle components may all contribute indirectly through their upstream supply chains. The ranking should therefore be interpreted as specific to the adopted inventory and Ecological Scarcity weighting factors.
Recycling provides a measurable but comparatively limited reduction in harmful emissions to soil. In 2025, the improvement ranges from approximately 2.1% for the PHEV to 4.7% for the CNG-powered ICEV. The reductions amount to approximately 3.7% for the gasoline ICEV, 3.8% for the diesel ICEV, 3.5% for the BEV and 3.5% for the FCEV. The greatest absolute benefit is obtained for the diesel ICEV and amounts to approximately 1.14 × 10⁴ UBP.
The relatively small difference between the landfill and recycling pathways indicates that much of the soil-related burden originates upstream, during raw-material extraction and primary material production. These emissions have already occurred before the vehicle reaches its end-of-life stage. Recycling reduces the demand for virgin materials and limits the disposal of metal-bearing components, but the corresponding credits are not sufficient to offset all emissions generated throughout the preceding material supply chain. Recycling processes may also generate metal-containing solid residues that require controlled treatment and stabilisation.
In the prospective 2050 scenario, the results increase to 1.27 × 10⁵–3.13 × 10⁵ UBP for landfilling and 1.24 × 10⁵–3.01 × 10⁵ UBP for recycling. The diesel ICEV remains the highest-impact configuration, followed by the gasoline and CNG-powered ICEVs. The results for the PHEV, BEV and FCEV remain substantially lower and are closely grouped within a range of approximately 1.27 × 10⁵–1.28 × 10⁵ UBP under the landfill pathway.
Between 2025 and 2050, emissions to soil increase for all powertrain technologies. The increase ranges from approximately 5% to 13% under the landfill pathway and from approximately 5% to 13.5% under the recycling pathway. The largest relative increases are observed for the electrified and hydrogen-powered configurations. This result demonstrates that reductions in vehicle mass, greenhouse gas emissions or cumulative energy demand do not necessarily lead to lower emissions in every toxicity-related category. Prospective material substitution may increase the contribution of materials whose extraction, refining or residue-management processes are associated with comparatively high soil-emission factors.
Reducing these impacts requires environmental control throughout both primary and secondary material-production chains. Relevant measures include responsible mineral sourcing, prevention of uncontrolled releases from mining and metallurgical residues, containment of tailings, stabilisation of metal-containing waste and monitoring of soil around extraction, production and recycling facilities. The selection of materials and surface treatments should also consider their potential soil-related emissions in addition to mechanical properties, mass, embodied energy and recyclability.
Design for disassembly, material identification and selective separation of batteries, electronic components, alloys, catalysts and coated parts can improve the purity of recovered fractions and reduce the formation of contaminated recycling residues. Circular material management should therefore be evaluated not only by the mass of materials recovered but also by the environmental performance of the processes used to produce secondary materials and manage hazardous residual fractions.
The results should not be interpreted as evidence that conventional, electric or hydrogen vehicles have a lower overall environmental impact solely on the basis of this category. They identify a specific soil-related burden that should be considered together with greenhouse gas emissions, cumulative energy demand, acidification, eutrophication and heavy-metal emissions to water. Such a multi-indicator approach is necessary to prevent environmental burden shifting during the development of sustainable materials and components for future mobility systems.
- 5.
- Greenhouse Gas Emissions from Fuel- and Energy-Supply Cycles
Figure 12 presents the IPCC 2021 characterisation results for greenhouse gas emissions associated with the fuel- and energy-supply cycles of the analysed C-segment passenger cars. The results are divided into well-to-tank (WTT) and tank-to-wheel (TTW) components. WTT includes the production, processing, transport and distribution of gasoline, diesel fuel, CNG, hydrogen and electricity. TTW represents direct greenhouse gas emissions arising during vehicle operation. These results complement the preceding material and component analyses but should not be interpreted independently as a complete vehicle life-cycle assessment.
In the 2025 reference scenario, the total WTT and TTW emissions range from 1.60 × 10⁴ kg CO2 eq for the BEV to 5.64 × 10⁴ kg CO2 eq for the gasoline ICEV. The diesel and CNG-powered ICEVs produce 4.62 × 10⁴ and 3.86 × 10⁴ kg CO2 eq, respectively. Their results are dominated by TTW emissions, which account for approximately 73–80% of the total fuel-cycle impact. This structure indicates that improvements in fuel-production processes alone cannot eliminate the climate burden of vehicles that continue to combust fossil fuels during operation.
The PHEV produces 2.31 × 10⁴ kg CO2 eq in 2025, of which approximately 63% is associated with the WTT stage. Its lower TTW result relative to conventional ICEVs reflects the partial replacement of gasoline use by electricity. However, the presence of both WTT and TTW emissions demonstrates that the climate performance of a PHEV depends strongly on the share of electric driving, the electricity-generation mix and the carbon intensity of the remaining liquid fuel.
BEVs and FCEVs have no direct TTW greenhouse gas emissions within the adopted model. Their operational-cycle results are therefore determined entirely by upstream electricity or hydrogen production. In 2025, the BEV produces 1.60 × 10⁴ kg CO2 eq, whereas the FCEV reaches 3.26 × 10⁴ kg CO2 eq. The higher FCEV result reflects the additional energy-conversion, hydrogen-production, compression, storage and distribution processes represented in the adopted pathway. This comparison demonstrates that the absence of direct vehicle emissions does not imply an emission-free energy cycle.
Under the prospective 2050 scenario, the total fuel- and energy-cycle emissions decrease for every powertrain. The results amount to 4.59 × 10⁴ kg CO2 eq for the gasoline ICEV, 3.55 × 10⁴ kg CO2 eq for the diesel ICEV and 3.06 × 10⁴ kg CO2 eq for the CNG-powered ICEV. The corresponding values decrease to 1.07 × 10⁴ kg CO2 eq for the PHEV, 2.67 × 10³ kg CO2 eq for the BEV and 1.31 × 10⁴ kg CO2 eq for the FCEV. Relative to 2025, these changes represent reductions of approximately 18.5–23.2% for conventional ICEVs, 53.7% for the PHEV, 83.3% for the BEV and 59.7% for the FCEV.
The strongest improvements are obtained under the Paris Agreement-aligned 2050 scenario defined in this study. Total emissions decrease to 3.26 × 10⁴ kg CO2 eq for the gasoline ICEV, 2.19 × 10⁴ kg CO2 eq for the diesel ICEV and 2.48 × 10⁴ kg CO2 eq for the CNG-powered ICEV. The corresponding results are substantially lower for the PHEV, FCEV and BEV and amount to 5.10 × 10³, 4.13 × 10³ and 4.86 × 10² kg CO2 eq, respectively.
Compared with 2025, implementation of the Paris Agreement-aligned pathway reduces total fuel- and energy-cycle emissions by approximately 42.2% for the gasoline ICEV, 52.6% for the diesel ICEV and 35.9% for the CNG-powered ICEV. Much greater reductions are obtained for the PHEV, BEV and FCEV and amount to approximately 77.9%, 97% and 87.3%, respectively. The BEV therefore exhibits the greatest sensitivity to electricity-system decarbonisation, while the FCEV result confirms the importance of selecting a low-emission hydrogen-production pathway.
The remaining TTW emissions of the ICEV and PHEV configurations limit their long-term reduction potential. Even in the Paris Agreement-aligned scenario, direct fuel-combustion emissions remain the dominant component for conventional vehicles. In contrast, the climate performance of BEVs and FCEVs becomes increasingly dependent on upstream energy production and supply. CNG should not be treated as inherently superior to diesel in every future pathway, as the ranking changes under the Paris Agreement-aligned assumptions and depends on the carbon intensity of the respective fuel chains.
The progressive reduction in WTT and TTW emissions changes the relative distribution of environmental burdens across the vehicle life cycle. As electricity and hydrogen production become less carbon-intensive, the production of traction batteries, fuel-cell stacks, high-pressure tanks, power electronics, electric machines and lightweight structural materials accounts for an increasing proportion of the remaining environmental impact. Consequently, the transition to renewable-energy-based transport cannot be based exclusively on the decarbonisation of energy carriers.
The results should therefore be interpreted together with the preceding analyses of material composition, cumulative energy demand, toxic emissions, resource-related effects and end-of-life management. Low-emission electricity and hydrogen must be combined with material-efficient component design, increased use of secondary raw materials, design for disassembly and high-quality recovery of battery, electronic and fuel-cell materials. This integrated approach connects renewable-energy deployment with sustainable material development and prevents the environmental burden from being transferred from vehicle operation to material production.
Figure 13 integrates greenhouse gas emissions associated with vehicle manufacturing (W), energy-carrier production and supply (WTT), and vehicle operation (TTW). In contrast to Figure 12, which considers only fuel- and energy-supply cycles, the present comparison includes the manufacturing-related burden of each powertrain configuration. The W stage comprises the production of vehicle materials and components and vehicle assembly within the adopted system boundaries.
In the 2025 scenario, the total greenhouse gas emissions range from 3.01 × 10⁴ kg CO2 eq for the BEV to 6.63 × 10⁴ kg CO2 eq for the gasoline ICEV. The corresponding results amount to 5.61 × 10⁴ kg CO2 eq for the diesel ICEV, 4.87 × 10⁴ kg CO2 eq for the CNG-powered ICEV, 3.53 × 10⁴ kg CO2 eq for the PHEV and 4.63 × 10⁴ kg CO2 eq for the FCEV. Despite exhibiting the highest manufacturing-related result of 1.41 × 10⁴ kg CO2 eq, the BEV achieves the lowest combined value because it produces no direct TTW emissions and its electricity-supply emissions are lower than the combined WTT and TTW emissions of conventional vehicles.
For the gasoline, diesel and CNG-powered ICEVs, TTW emissions account for approximately 60–64% of the total 2025 result. Vehicle manufacturing contributes approximately 15–21%, while the remaining share is associated with fuel production and supply. This structure demonstrates that improvements in material selection and manufacturing cannot fully compensate for the continued combustion of fossil fuels during vehicle operation. Reducing the climate impact of conventional powertrains therefore remains constrained by their direct use-phase emissions.
The PHEV exhibits a different distribution of impacts. In 2025, vehicle manufacturing accounts for approximately 34.5% of its total result, WTT processes for 41.3% and TTW emissions for 24.1%. The combined combustion and electric architecture decreases direct operational emissions relative to conventional ICEVs but requires additional battery, electric-drive and power-electronic components. Consequently, its performance depends simultaneously on the material intensity of the vehicle, the electricity-generation mix, the share of electric driving and the carbon intensity of gasoline production and combustion.
The BEV and FCEV have no direct TTW greenhouse gas emissions within the adopted model. In 2025, manufacturing represents approximately 46.8% of the BEV result, while electricity production and supply account for 53.2%. For the FCEV, approximately 70.3% of the total result is associated with hydrogen production and supply, whereas vehicle manufacturing contributes 29.7%. The high WTT share of the FCEV reflects the additional energy-conversion, hydrogen-production, compression, storage and distribution processes included in the adopted pathway.
Under the prospective 2050 scenario, total emissions decrease to 5.48 × 10⁴ kg CO2 eq for the gasoline ICEV, 4.43 × 10⁴ kg CO2 eq for the diesel ICEV and 3.95 × 10⁴ kg CO2 eq for the CNG-powered ICEV. Greater relative improvements are obtained for the PHEV, BEV and FCEV, for which the results decrease to 2.15 × 10⁴, 1.52 × 10⁴ and 2.53 × 10⁴ kg CO2 eq, respectively. Compared with 2025, these changes represent reductions of approximately 17.4–21.0% for conventional ICEVs, 39.1% for the PHEV, 49.7% for the BEV and 45.3% for the FCEV.
The Paris Agreement-aligned 2050 scenario produces the lowest results for every powertrain configuration. Total emissions decrease to 4.08 × 10⁴ kg CO₂ eq for the gasoline ICEV, 3.02 × 10⁴ kg CO2 eq for the diesel ICEV and 3.27 × 10⁴ kg CO₂ eq for the CNG-powered ICEV. The corresponding values are substantially lower for the PHEV, FCEV and BEV and amount to 1.47 × 10⁴, 1.51 × 10⁴ and 1.10 × 10⁴ kg CO2 eq, respectively. Relative to 2025, the reductions reach approximately 38.4% for the gasoline ICEV, 46.3% for the diesel ICEV, 32.9% for the CNG-powered ICEV, 58.4% for the PHEV, 63.5% for the BEV and 67.4% for the FCEV.
The inclusion of vehicle manufacturing modifies the ranking obtained from the fuel- and energy-cycle results alone. Under the Paris Agreement-aligned scenario, the FCEV has lower WTT and TTW emissions than the PHEV, as shown in Figure 12. However, after the manufacturing stage is included, its total result becomes slightly higher because of the material and production requirements of the fuel-cell stack, high-pressure hydrogen storage system and associated balance-of-plant components. This demonstrates that comparisons based exclusively on operational or energy-supply emissions may overlook important differences between vehicle material architectures.
The progressive decarbonisation of electricity and hydrogen production substantially increases the relative importance of the manufacturing stage. In the Paris Agreement-aligned scenario, manufacturing accounts for approximately 95.6% of the total BEV result, 72.6% of the FCEV result and 65.2% of the PHEV result. For conventional ICEVs, TTW emissions remain dominant and account for approximately 55–60% of the total. The environmental hotspot therefore shifts most clearly towards materials and components in electrified and hydrogen-powered vehicles.
This shift has direct implications for the design of future mobility systems. Further reductions in the climate impact of BEVs will increasingly depend on low-emission production and high-quality recycling of traction batteries, aluminium structures, copper conductors, electric machines and electronic components. For FCEVs, particular attention should be given to fuel-cell catalysts, metallic stack components and carbon-fibre-reinforced high-pressure tanks. In PHEVs, reducing the complexity and material duplication resulting from the coexistence of combustion and electric propulsion systems is also important.
The results demonstrate that renewable electricity and low-emission hydrogen should be implemented together with material-efficient design, increased use of secondary raw materials, cleaner manufacturing processes and design for disassembly. Decarbonising the energy carrier without reducing the embodied emissions of materials would leave a substantial proportion of the vehicle-related climate burden unresolved. Sustainable mobility therefore requires the simultaneous optimisation of powertrain architecture, material selection, component manufacturing, energy supply and post-consumer recovery.
4. Discussion
The first working hypothesis was supported. Under the landfill-oriented pathway, the vehicle-cycle impacts of BEVs, FCEVs and PHEVs were generally higher than those of conventional ICEVs because of their greater material and manufacturing intensity. However, when vehicle manufacturing was combined with fuel or electricity supply and vehicle operation, the BEV achieved the lowest total greenhouse gas emissions in the 2025, prospective 2050 and Paris Agreement-aligned 2050 scenarios. The two rankings describe different system boundaries and are therefore consistent. Similar relationships have been reported for conventional, battery-electric and fuel-cell vehicles [76,77,78]. In the present study, the BEV result was strongly influenced by the traction battery, electric drive and power electronics. Battery-cell production, electrode materials, current collectors and energy-intensive manufacturing operations have also been identified as major contributors in previous studies [79,80]. For FCEVs, important burdens were associated with the fuel-cell stack, balance-of-plant components and CFRP hydrogen-storage system [81,82]. The intermediate position of the PHEV resulted from the coexistence and partial material duplication of combustion and electric propulsion systems.
The second working hypothesis was also supported. Recycling reduced the global warming potential of the analysed vehicle systems by 9.5–25.2% and cumulative energy demand by 15.4–28.4%, with the greatest ReCiPe 2016 credits obtained for BEVs and FCEVs. These vehicles contain larger quantities of recoverable aluminium, copper, electronic and battery materials, fuel-cell components and high-performance composites. Previous studies similarly show that recycling can reduce the impacts of lithium-ion battery production, although the benefit depends on battery chemistry, process configuration, recovery efficiency and secondary-material quality [83,84,85]. Negative ReCiPe 2016 results represent substitution credits for avoided primary production, not an absence of impacts or actual negative emissions. The Resources damage area remained positive even under recycling-oriented pathways, indicating that material losses, contamination and quality degradation prevent complete substitution of primary resources. Changes in battery chemistry may also transfer demand between materials, for example from cobalt towards nickel [86]. Recycling performance should therefore be evaluated through recovery efficiency, purity and retained material functionality rather than recovered mass alone [87,88].
The third working hypothesis was confirmed because prospective lightweighting did not improve every environmental indicator uniformly. In the 2050 scenario, an approximately 20% reduction in vehicle mass was combined with greater use of AHSSs, aluminium alloys and CFRPs and lower use of conventional steel and cast iron. This reduced global warming potential and cumulative energy demand, but selected heavy-metal emissions to soil increased and ecosystem-related results did not decline consistently. Previous studies have likewise shown that replacing conventional steel with aluminium, AHSSs or polymer composites can increase manufacturing burdens despite reducing operational energy demand [89,90]. The balance depends on the substitution ratio, component geometry, propulsion system, lifetime mileage, production energy and secondary-material content. For BEVs, the operational benefit of mass reduction is comparatively smaller, particularly when low-carbon electricity is used [91]. Comparisons of AHSS- and CFRP-intensive structures also indicate that the preferred material depends on propulsion technology and the carbon intensity of production [92]. Recycled carbon fibres may improve composite performance environmentally, but their applicability depends on fibre length, alignment, surface condition and retained mechanical properties [93].
These results confirm that vehicle mass alone is insufficient for sustainable material selection. Equivalent strength, stiffness, impact resistance, fatigue life, corrosion resistance, thermal and fire behaviour, reparability and joining compatibility must be retained. Adhesive joints, mixed-metal connections, coatings and hybrid composite assemblies may reduce mass but impede dismantling and contaminate recovered fractions. Material selection should therefore be integrated with structural design, manufacturing, component accessibility and separation procedures.
The application of several impact-assessment methods revealed burden shifting that would be obscured by greenhouse gas emissions alone. The CNG vehicle showed the highest acidification result in 2025, while emissions to water were highest for BEVs and FCEVs and emissions to soil were higher for gasoline and diesel ICEVs under the adopted inventory. These results represent supply-chain emissions from raw-material extraction, metallurgical processing, component production and waste treatment, rather than direct releases during operation. Previous vehicle LCAs have similarly found that electrification can reduce climate impacts while increasing selected toxicity, ecotoxicity and mineral-resource indicators [78,94]. Battery-recycling impacts related to water use and freshwater toxicity also depend strongly on the process, chemical inputs, location, electricity supply and recovery efficiency [95]. Differences between ReCiPe 2016, IPCC 2021, CED, CML-IA and Ecological Scarcity 2021 consequently demonstrate that no powertrain has a universally favourable environmental ranking.
The fourth working hypothesis was strongly supported. Under the Paris Agreement-aligned 2050 scenario, manufacturing accounted for approximately 95.6% of total greenhouse gas emissions for the BEV, 72.6% for the FCEV and 65.2% for the PHEV, whereas direct TTW emissions remained dominant for conventional ICEVs. The BEV benefited most from electricity-system decarbonisation because it has no direct combustion emissions. The FCEV also benefited from low-emission hydrogen, although hydrogen production, compression, storage and distribution retained higher upstream burdens. Residual fuel consumption constrained the PHEV result. These findings are consistent with prospective assessments showing that the benefits of electrified vehicles increase as electricity and hydrogen become less carbon-intensive [76,81,97]. At the same time, decarbonisation increases the relative importance of batteries, electric machines, power electronics, aluminium structures, copper conductors, fuel-cell stacks and hydrogen-storage systems. Renewable electricity, cleaner manufacturing and secondary materials should therefore be applied throughout material and component production, not only during vehicle operation. The decarbonisation pathways modelled for electricity and hydrogen should also be interpreted in relation to the life cycles of generation infrastructure. Studies of wind and photovoltaic plants show that low direct operational emissions coexist with material- and energy-intensive production and post-consumer stages [97,98]. For wind systems, plant configuration and life-cycle stage influence the distribution of environmental burdens [99,100]. For photovoltaic systems, component-level assessments identify module manufacture and construction-material selection as important determinants of environmental impacts and recycling benefits [101,102].
Design for disassembly determines whether the modelled recycling benefits can be achieved industrially. Welded, bonded or inaccessible battery and powertrain connections increase dismantling time and may lead to shredding of complex assemblies. Battery design studies show that adhesives, welds, connectors and fastening systems affect process complexity and recovered-material purity [103]. Reversible connections, standardised interfaces, accessible fastening points and reliable material identification would facilitate the removal of batteries, power electronics and fuel-cell components before shredding. The same requirements apply to aluminium-steel joints, polymer composites and coated components.
The findings remain conditional on the study assumptions. The 2050 configuration is a prospective engineering scenario rather than a forecast of a specific vehicle. Future vehicle mass, material composition, battery chemistry, manufacturing efficiency, electricity supply and hydrogen production may differ from the adopted values. A common lifetime and mileage ensured functional comparability, but actual use, battery durability, component replacement and regional conditions vary. Recycling results also depend on recovery efficiencies, allocation, substitution and the primary processes assumed to be avoided. The landfill- and recycling-oriented pathways should therefore be interpreted as contrasting analytical conditions.
Future research should combine prospective LCA with uncertainty and sensitivity analyses of vehicle mass, battery capacity and lifetime, electricity and hydrogen pathways, recycling yields and secondary-material substitution. Component inventories should be linked with experimentally verified mechanical properties and manufacturing data for AHSSs, aluminium alloys, polymers and CFRPs. Alternative battery chemistries, recycling technologies, reuse and remanufacturing, fuel-cell catalyst recovery and treatment of CFRP pressure vessels should also be examined. For automotive remanufacturing, industrial feasibility also depends on the organisation of production flows under variable component condition, process losses and batch sizes [104,105]. Efficient intralogistics, including the application of autonomous mobile robots, may further support component and material flows in remanufacturing facilities [106]. Integrating environmental impacts with material criticality, technical performance, disassembly time and life-cycle cost would support technically feasible material decisions.
Renewable-energy-based mobility cannot be assessed independently of vehicle materials. Decarbonised electricity and hydrogen reduce operational emissions but increase the relative significance of material production and component manufacturing. The environmental potential of future C-segment passenger cars therefore depends on combining low-impact materials, structurally efficient design, cleaner manufacturing, durable components and high-quality closed-loop recovery.
5. Conclusions
This study demonstrates that the environmental performance of future C-segment passenger cars cannot be determined solely by powertrain efficiency or direct operational emissions. The prospective life-cycle assessment covering six powertrain technologies, alternative end-of-life pathways and the 2025–2050 time horizon revealed strong interdependence between vehicle material composition, component manufacturing, energy-carrier supply and post-consumer management.
Within the vehicle-related life-cycle stages, BEVs and FCEVs exhibited the highest environmental burdens under the landfill-oriented pathway. These results were primarily associated with the production of traction batteries, electric drives, power electronics, fuel-cell stacks and high-pressure hydrogen-storage systems. The result for the PHEV reflected the combined material requirements of combustion and electric propulsion architectures. However, when vehicle manufacturing, energy-carrier production and vehicle operation were assessed jointly, the BEV achieved the lowest total greenhouse gas emissions in all analysed time-horizon scenarios. A comparatively high manufacturing burden can therefore coexist with favourable total life-cycle performance when direct combustion emissions are eliminated and electricity production becomes progressively less carbon-intensive.
End-of-life management was identified as a decisive factor in the environmental performance of material-intensive powertrains. Recycling reduced global warming potential by 9.5–25.2% and cumulative energy demand by 15.4–28.4%. The largest ReCiPe 2016 credits were obtained for BEVs and FCEVs because of their greater inventories of recoverable aluminium, copper, battery materials, electronic components and fuel-cell system materials. Nevertheless, the Resources damage area remained positive in every recycling scenario. Recycling therefore limits primary-material demand but does not eliminate resource consumption, material losses or the need for additional primary inputs. Negative endpoint scores should be interpreted as credits for avoided primary production rather than as actual negative emissions.
The prospective 2050 material configuration combined an approximately 20% reduction in vehicle mass with increased use of advanced high-strength steel, aluminium alloys and carbon-fibre-reinforced polymers. This multi-material substitution contributed to lower greenhouse gas emissions and cumulative energy demand. However, it did not reduce every environmental indicator, and emissions to soil increased in the prospective scenario. Vehicle mass alone is consequently insufficient as a criterion for sustainable material selection. Environmental performance should be evaluated together with strength, stiffness, durability, crash resistance, joining compatibility, reparability, dismantlability and recyclability.
The Paris Agreement-aligned scenario demonstrated that the progressive decarbonisation of electricity and hydrogen production substantially increases the relative importance of materials and manufacturing. Manufacturing accounted for approximately 95.6% of total greenhouse gas emissions from the BEV, 72.6% from the FCEV and 65.2% from the PHEV. Further reductions in the environmental burdens of advanced powertrains will therefore increasingly depend on low-impact material production, increased secondary-material content, renewable energy use in component manufacturing and high-quality recovery of batteries, electrical systems, fuel-cell components and lightweight structural materials.
No single powertrain achieved the most favourable result in every environmental category. The observed differences between climate change, cumulative energy demand, acidification, eutrophication and heavy-metal emissions confirm the need for multi-indicator assessment to prevent environmental burden shifting. The development of renewable-energy-based transport should consequently integrate energy-system decarbonisation with material-efficient component design, cleaner manufacturing processes, design for disassembly and closed-loop recycling.
Future research should combine prospective LCA with uncertainty and sensitivity analyses, component-level mechanical validation and process-specific modelling of recycling technologies. Particular attention should be given to alternative battery chemistries, the recovery of fuel-cell and hydrogen-storage materials, the use of recycled carbon fibres and the influence of joining technologies on component dismantling and material-stream purity. Such an integrated approach can support the development of passenger cars whose low operational emissions are accompanied by technically feasible and environmentally favourable material solutions throughout the complete vehicle life cycle.
Author Contributions
Conceptualization, A.G., K.P., I.P., P.B-W. and P.L.; methodology, A.G., K.P., I.P., P.B-W. and P.L.; software, K.P. and I.P.; validation, A.G., K.P., I.P., P.B-W., P.L. and A.M.; formal analysis, A.G., K.P., I.P., P.B-W. and P.L.; investigation, A.G., K.P., I.P., P.B-W. and P.L.; resources, K.P. and I.P.; data curation, K.P. and I.P.; writing–original draft preparation, A.G., K.P., I.P., P.B-W. and P.L.; writing–review and editing, A.G., K.P., I.P., P.B-W., P.L. and A.M.; visualization, A.G., K.P., I.P. and P.L.; supervision A.G., K.P., I.P., P.B-W. and P.L.; project administration, A.G., K.P. All authors have read and agreed to the published version of the manuscript.
Funding
This research received no external funding.
Institutional Review Board Statement
Not applicable.
Informed Consent Statement
Not applicable.
Data Availability Statement
The original contributions presented in the study are included in the article. Further inquiries can be directed to the corresponding author.
Conflicts of Interest
The authors declare no conflicts of interest.
Abbreviations
The following abbreviations are used in this manuscript:
| LCA | Life Cycle Assessment |
| ICEV | Internal Combustion Engine Vehicles |
| PHEV | Petrol plug-in Hybrid Electric Vehicles |
| BEV | Battery Electric Vehicle |
| FCEV | Fuel Cell Electric Vehicles |
| CED | Cumulative Energy Demand |
| CML-IA | Centrum voor Milieukunde Leiden—Impact Assessment |
| WTT | Well-To-Tank |
| TTW | Tank-To-Wheel |
References
- Nordelöf, A.; Messagie, M.; Tillman, A.-M.; Ljunggren Söderman, M.; Van Mierlo, J. Environmental impacts of hybrid, plug-in hybrid, and battery electric vehicles: What can we learn from life cycle assessment? Int. J. Life Cycle Assess. 2014, 19, 1866–1890. [Google Scholar] [CrossRef]
- Onat, N.C.; Kucukvar, M.; Tatari, O. Conventional, hybrid, plug-in hybrid or electric vehicles? State-based comparative carbon and energy footprint analysis in the United States. Appl. Energy 2015, 150, 36–49. [Google Scholar] [CrossRef]
- Bicer, Y.; Dincer, I. Life cycle environmental impact assessments and comparisons of alternative fuels for clean vehicles. Resour. Conserv. Recycl. 2018, 132, 141–157. [Google Scholar] [CrossRef]
- Moro, A.; Lonza, L. Electricity carbon intensity in European Member States: Impacts on greenhouse gas emissions of electric vehicles. Transp. Res. Part D Transp. Environ. 2018, 64, 5–14. [Google Scholar] [CrossRef] [PubMed]
- Qiao, Q.; Zhao, F.; Liu, Z.; Jiang, S.; Hao, H. Cradle-to-gate greenhouse gas emissions of battery electric and internal combustion engine vehicles in China. Appl. Energy 2017, 204, 1399–1411. [Google Scholar] [CrossRef]
- Tucki, K.; Orynycz, O.; Wasiak, A.; Świć, A.; Mieszkalski, L.; Mruk, R.; Gola, A.; Słoma, J.; Botwińska, K.; Gawron, J. A Computer Tool Using OpenModelica for Modelling CO2 Emissions in Driving Tests. Energies 2022, 15, 995. [Google Scholar] [CrossRef]
- Piotrowska, K.; Piasecka, I.; Gola, A.; Kosicka, E. Assessment of the Impact of Selected Segments of Road Transport on the Natural Environment Using LCA Analysis. In Advances in Manufacturing IV: Volume 3—Quality Engineering: Digitalization, Sustainability and Industry Applications; Hamrol, A., Grabowska, M., Hinz, M., Eds.; Springer: Cham, Switzerland, 2024; pp. 223–236. [Google Scholar] [CrossRef]
- Koffler, C.; Rohde-Brandenburger, K. On the calculation of fuel savings through lightweight design in automotive life cycle assessments. Int. J. Life Cycle Assess. 2010, 15, 128–135. [Google Scholar] [CrossRef]
- Joost, W.J. Reducing vehicle weight and improving U.S. energy efficiency using integrated computational materials engineering. JOM 2012, 64, 1032–1038. [Google Scholar] [CrossRef]
- Miller, W.S.; Zhuang, L.; Bottema, J.; Wittebrood, A.J.; De Smet, P.; Haszler, A.; Vieregge, A. Recent development in aluminium alloys for the automotive industry. Mater. Sci. Eng. A 2000, 280, 37–49. [Google Scholar] [CrossRef]
- Kulekci, M.K. Magnesium and its alloys applications in automotive industry. Int. J. Adv. Manuf. Technol. 2008, 39, 851–865. [Google Scholar] [CrossRef]
- Tisza, M.; Czinege, I. Comparative study of the application of steels and aluminium in lightweight production of automotive parts. Int. J. Lightweight Mater. Manuf. 2018, 1, 229–238. [Google Scholar] [CrossRef]
- Serrenho, A.C.; Norman, J.B.; Allwood, J.M. The impact of reducing car weight on global emissions: The future fleet in Great Britain. Philos. Trans. R. Soc. A 2017, 375, 20160364. [Google Scholar] [CrossRef] [PubMed]
- Mayyas, A.; Qattawi, A.; Omar, M.; Shan, D. Design for sustainability in automotive industry: A comprehensive review. Renew. Sustain. Energy Rev. 2012, 16, 1845–1862. [Google Scholar] [CrossRef]
- Delogu, M.; Zanchi, L.; Dattilo, C.A.; Pierini, M. Innovative composites and hybrid materials for electric vehicles lightweight design in a sustainability perspective. Mater. Today Commun. 2017, 13, 192–209. [Google Scholar] [CrossRef]
- Relich, M.; Gola, A.; Jasiulewicz-Kaczmarek, M. Identifying Improvement Opportunities in Product Design for Reducing Energy Consumption. Energies 2022, 15, 9611. [Google Scholar] [CrossRef]
- Peters, J.F.; Baumann, M.; Zimmermann, B.; Braun, J.; Weil, M. The environmental impact of Li-ion batteries and the role of key parameters: A review. Renew. Sustain. Energy Rev. 2017, 67, 491–506. [Google Scholar] [CrossRef]
- Dai, Q.; Kelly, J.C.; Gaines, L.; Wang, M. Life cycle analysis of lithium-ion batteries for automotive applications. Batteries 2019, 5, 48. [Google Scholar] [CrossRef]
- Porzio, J.; Scown, C.D. Life-cycle assessment considerations for batteries and battery materials. Adv. Energy Mater. 2021, 11, 2100771. [Google Scholar] [CrossRef]
- Xu, C.; Dai, Q.; Gaines, L.; Hu, M.; Tukker, A.; Steubing, B. Future material demand for automotive lithium-based batteries. Commun. Mater. 2020, 1, 99. [Google Scholar] [CrossRef]
- Harper, G.; Sommerville, R.; Kendrick, E.; Driscoll, L.; Slater, P.; Stolkin, R.; Walton, A.; Christensen, P.; Heidrich, O.; Lambert, S.; et al. Recycling lithium-ion batteries from electric vehicles. Nature 2019, 575, 75–86. [Google Scholar] [CrossRef] [PubMed]
- Neumann, J.; Petranikova, M.; Meeus, M.; Gamarra, J.D.; Younesi, R.; Winter, M.; Nowak, S. Recycling of lithium-ion batteries: Current state of the art, circular economy, and next-generation recycling. Adv. Energy Mater. 2022, 12, 2102917. [Google Scholar] [CrossRef]
- Gaines, L. Lithium-ion battery recycling processes: Research towards a sustainable course. Sustain. Mater. Technol. 2018, 17, e00068. [Google Scholar] [CrossRef]
- Pehnt, M. Life-cycle assessment of fuel cell stacks. Int. J. Hydrogen Energy 2001, 26, 91–101. [Google Scholar] [CrossRef]
- Mori, D.; Hirose, K. Recent challenges of hydrogen storage technologies for fuel cell vehicles. Int. J. Hydrogen Energy 2009, 34, 4569–4574. [Google Scholar] [CrossRef]
- Ajanovic, A.; Haas, R. Economic and environmental prospects for battery electric- and fuel cell vehicles: A review. Fuel Cells 2019, 19, 515–529. [Google Scholar] [CrossRef]
- Oliveux, G.; Dandy, L.O.; Leeke, G.A. Current status of recycling of fibre-reinforced polymers: Review of technologies, reuse and resulting properties. Prog. Mater. Sci. 2015, 72, 61–99. [Google Scholar] [CrossRef]
- Vermeulen, I.; Van Caneghem, J.; Block, C.; Baeyens, J.; Vandecasteele, C. Automotive shredder residue: Reviewing its production from end-of-life vehicles and its recycling, energy or chemicals’ valorisation. J. Hazard. Mater. 2011, 190, 8–27. [Google Scholar] [CrossRef] [PubMed]
- Go, T.F.; Wahab, D.A.; Ab. Rahman, M.N.; Ramli, R.; Azhari, C.H. Disassemblability of end-of-life vehicle: A critical review of evaluation methods. J. Clean. Prod. 2011, 19, 1536–1546. [Google Scholar] [CrossRef]
- Sakai, S.; Yoshida, H.; Hiratsuka, J.; Vandecasteele, C.; Kohlmeyer, R.; Rotter, V.S.; Passarini, F.; Santini, A.; Peeler, M.; Li, J.; et al. An international comparative study of end-of-life vehicle recycling systems. J. Mater. Cycles Waste Manag. 2014, 16, 1–20. [Google Scholar] [CrossRef]
- Arvidsson, R.; Tillman, A.-M.; Sandén, B.A.; Janssen, M.; Nordelöf, A.; Kushnir, D.; Molander, S. Environmental assessment of emerging technologies: Recommendations for prospective LCA. J. Ind. Ecol. 2018, 22, 1286–1294. [Google Scholar] [CrossRef]
- Thonemann, N.; Schulte, A.; Maga, D. How to conduct prospective life cycle assessment for emerging technologies? A systematic review and methodological guidance. Sustainability 2020, 12, 1192. [Google Scholar] [CrossRef]
- Mendoza Beltran, A.; Cox, B.; Mutel, C.; van Vuuren, D.P.; Font Vivanco, D.; Deetman, S.; Edelenbosch, O.Y.; Guinée, J.; Tukker, A. When the background matters: Using scenarios from integrated assessment models in prospective life cycle assessment. J. Ind. Ecol. 2020, 24, 64–79. [Google Scholar] [CrossRef]
- Piotrowska, K.; Piasecka, I.; Opielak, M. Life cycle assessment of small passenger cars in the context of smart grid integration and sustainable power system development. Sustainability 2025, 17, 10788. [Google Scholar] [CrossRef]
- Piasecka, I.; Tomporowski, A.; Piotrowska, K. Environmental life cycle assessment of selected SUV passenger cars. Combust. Engines 2025, 203, 138–145. [Google Scholar] [CrossRef]
- Messagie, M.; Boureima, F.-S.; Coosemans, T.; Macharis, C.; Van Mierlo, J. A range-based vehicle life cycle assessment incorporating variability in the environmental assessment of different vehicle technologies and fuels. Energies 2014, 7, 1467–1482. [Google Scholar] [CrossRef]
- Bartolozzi, I.; Rizzi, F.; Frey, M. Comparison between hydrogen and electric vehicles by life cycle assessment: A case study in Tuscany, Italy. Appl. Energy 2013, 101, 103–111. [Google Scholar] [CrossRef]
- Tagliaferri, C.; Evangelisti, S.; Acconcia, F.; Domenech, T.; Ekins, P.; Barletta, D.; Lettieri, P. Life cycle assessment of future electric and hybrid vehicles: A cradle-to-grave systems engineering approach. Chem. Eng. Res. Des. 2016, 112, 298–309. [Google Scholar] [CrossRef]
- Goede, M.; Stehlin, M.; Rafflenbeul, L.; Kopp, G.; Beeh, E. Super Light Car: Lightweight construction thanks to a multi-material design and function integration. Eur. Transp. Res. Rev. 2009, 1, 5–10. [Google Scholar] [CrossRef]
- Taub, A.; De Moor, E.; Luo, A.; Matlock, D.K.; Speer, J.G.; Vaidya, U. Materials for automotive lightweighting. Annu. Rev. Mater. Res. 2019, 49, 327–359. [Google Scholar] [CrossRef]
- Hirsch, J. Aluminium in innovative light-weight car design. Mater. Trans. 2011, 52, 818–824. [Google Scholar] [CrossRef]
- Duflou, J.R.; De Moor, J.; Verpoest, I.; Dewulf, W. Environmental impact analysis of composite use in car manufacturing. CIRP Ann.—Manuf. Technol. 2009, 58, 9–12. [Google Scholar] [CrossRef]
- Nitta, N.; Wu, F.; Lee, J.T.; Yushin, G. Li-ion battery materials: Present and future. Mater. Today 2015, 18, 252–264. [Google Scholar] [CrossRef]
- Cusenza, M.A.; Bobba, S.; Ardente, F.; Cellura, M.; Di Persio, F. Energy and environmental assessment of a traction lithium-ion battery pack for plug-in hybrid electric vehicles. J. Clean. Prod. 2019, 215, 634–649. [Google Scholar] [CrossRef] [PubMed]
- Kallitsis, E.; Korre, A.; Kelsall, G.; Kupfersberger, M.; Nie, Z. Environmental life cycle assessment of the production in China of lithium-ion batteries with nickel-cobalt-manganese cathodes utilising novel electrode chemistries. J. Clean. Prod. 2020, 254, 120067. [Google Scholar] [CrossRef]
- Manthiram, A. A reflection on lithium-ion battery cathode chemistry. Nat. Commun. 2020, 11, 1550. [Google Scholar] [CrossRef] [PubMed]
- Raugei, M.; Winfield, P. Prospective LCA of the production and EoL recycling of a novel type of Li-ion battery for electric vehicles. J. Clean. Prod. 2019, 213, 926–932. [Google Scholar] [CrossRef]
- Mehta, V.; Cooper, J.S. Review and analysis of PEM fuel cell design and manufacturing. J. Power Sources 2003, 114, 32–53. [Google Scholar] [CrossRef]
- Hua, T.Q.; Ahluwalia, R.K.; Peng, J.-K.; Kromer, M.; Lasher, S.; McKenney, K.; Law, K.; Sinha, J. Technical assessment of compressed hydrogen storage tank systems for automotive applications. Int. J. Hydrog. Energy 2011, 36, 3037–3049. [Google Scholar] [CrossRef]
- Held, M.; Schücking, M. Utilization effects on battery electric vehicle life-cycle assessment: A case-driven analysis of two commercial mobility applications. Transp. Res. D Transp. Environ. 2019, 75, 87–105. [Google Scholar] [CrossRef]
- Piotrowska, K.; Piasecka, I.; Bałdowska-Witos, P.; Kruszelnicka, W.; Tomporowski, A. LCA as a tool for the environmental management of car tire manufacturing. Appl. Sci. 2020, 10, 7015. [Google Scholar] [CrossRef]
- Fontaras, G.; Zacharof, N.-G.; Ciuffo, B. Fuel consumption and CO₂ emissions from passenger cars in Europe: Laboratory versus real-world emissions. Prog. Energy Combust. Sci. 2017, 60, 97–131. [Google Scholar] [CrossRef]
- Santini, A.; Morselli, L.; Passarini, F.; Vassura, I.; Di Carlo, S.; Bonino, F. End-of-Life Vehicles management: Italian material and energy recovery efficiency. Waste Manag. 2011, 31, 489–494. [Google Scholar] [CrossRef] [PubMed]
- Soo, V.K.; Compston, P.; Doolan, M. Interaction between new car design and recycling impact on life cycle assessment. Proc. CIRP 2015, 29, 426–431. [Google Scholar] [CrossRef]
- Gaustad, G.; Olivetti, E.; Kirchain, R. Improving aluminum recycling: A survey of sorting and impurity removal technologies. Resour. Conserv. Recycl. 2012, 58, 79–87. [Google Scholar] [CrossRef]
- Nakamura, S.; Kondo, Y.; Kagawa, S.; Matsubae, K.; Nakajima, K.; Nagasaka, T. MaTrace: Tracing the fate of materials over time and across products in open-loop recycling. Environ. Sci. Technol. 2014, 48, 7207–7214. [Google Scholar] [CrossRef] [PubMed]
- Piasecka, I.; Tomporowski, A.; Piotrowska, K. Environmental analysis of post-use management of car tires. Przem. Chem. 2018, 97, 1649–1653. [Google Scholar] [CrossRef]
- ISO 14040:2006; Environmental Management, Life Cycle Assessment, Principles and Framework. International Organization for Standardization: Geneva, Switzerland, 2006. iso.org/standard/37456.html.
- ISO 14044:2006; Environmental Management, Life Cycle Assessment, Requirements and Guidelines. International Organization for Standardization: Geneva, Switzerland, 2006. iso.org/standard/38498.html.
- Finkbeiner, M.; Inaba, A.; Tan, R.B.H.; Christiansen, K.; Klüppel, H.-J. The new international standards for life cycle assessment: ISO 14040 and ISO 14044. Int. J. Life Cycle Assess. 2006, 11, 80–85. [Google Scholar] [CrossRef]
- Schrijvers, D.L.; Loubet, P.; Sonnemann, G. Critical review of guidelines against a systematic framework with regard to consistency on allocation procedures for recycling in LCA. Int. J. Life Cycle Assess. 2016, 21, 994–1008. [Google Scholar] [CrossRef]
- Wernet, G.; Bauer, C.; Steubing, B.; Reinhard, J.; Moreno-Ruiz, E.; Weidema, B. The ecoinvent database version 3 (part I): Overview and methodology. Int. J. Life Cycle Assess. 2016, 21, 1218–1230. [Google Scholar] [CrossRef]
- Sacchi, R.; Terlouw, T.; Siala, K.; Dirnaichner, A.; Bauer, C.; Cox, B.; Mutel, C.; Daioglou, V.; Luderer, G. PRospective EnvironMental Impact asSEment (premise): A streamlined approach to producing databases for prospective life cycle assessment using integrated assessment models. Renew. Sustain. Energy Rev. 2022, 160, 112311. [Google Scholar] [CrossRef]
- Huijbregts, M.A.J.; Steinmann, Z.J.N.; Elshout, P.M.F.; Stam, G.; Verones, F.; Vieira, M.D.M.; Zijp, M.; Hollander, A.; van Zelm, R. ReCiPe2016: A harmonised life cycle impact assessment method at midpoint and endpoint level. Int. J. Life Cycle Assess. 2017, 22, 138–147. [Google Scholar] [CrossRef]
- Leda, P.; Szala, G.; Piasecka, I. Assessment of the influence of the life cycle of solar power plant materials and components on ecosystem quality. Materials 2024, 17, 6028. [Google Scholar] [CrossRef] [PubMed]
- Zieger, V.; Lecompte, T.; Guihéneuf, S.; Guevel, Y.; Bazzana, M.; Gasser, T.; He, Y. Climate change metrics: Bridging IPCC AR6 updates and dynamic life cycle assessments. Earth Syst. Dyn. 2025, 16, 2003–2019. [Google Scholar] [CrossRef]
- Frischknecht, R.; Wyss, F.; Büsser Knöpfel, S.; Lützkendorf, T.; Balouktsi, M. Cumulative energy demand in LCA: The energy harvested approach. Int. J. Life Cycle Assess. 2015, 20, 957–969. [Google Scholar] [CrossRef]
- Leda, P.; Kruszelnicka, W.; Leda, A.; Piasecka, I.; Kłos, Z.; Tomporowski, A.; Flizikowski, J.; Opielak, M. Life cycle analysis of a photovoltaic power plant using the CED method. Energies 2023, 16, 8098. [Google Scholar] [CrossRef]
- Huijbregts, M.A.J.; Hellweg, S.; Frischknecht, R.; Hendriks, H.W.M.; Hungerbühler, K.; Hendriks, A.J. Cumulative energy demand as predictor for the environmental burden of commodity production. Environ. Sci. Technol. 2010, 44, 2189–2196. [Google Scholar] [CrossRef] [PubMed]
- Guinée, J.B.; Gorrée, M.; Heijungs, R.; Huppes, G.; Kleijn, R.; de Koning, A.; van Oers, L.; Wegener Sleeswijk, A.; Suh, S.; Udo de Haes, H.A.; de Bruijn, H.; van Duin, R.; Huijbregts, M.A.J. Handbook on Life Cycle Assessment: Operational Guide to the ISO Standards; Kluwer Academic Publishers: Dordrecht, The Netherlands, 2002. [Google Scholar] [CrossRef]
- Hauschild, M.Z.; Goedkoop, M.; Guinée, J.; Heijungs, R.; Huijbregts, M.; Jolliet, O.; Margni, M.; De Schryver, A.; Humbert, S.; Laurent, A.; Sala, S.; Pant, R. Identifying best existing practice for characterization modeling in life cycle impact assessment. Int. J. Life Cycle Assess. 2013, 18, 683–697. [Google Scholar] [CrossRef]
- Muhl, M.; Berger, M.; Finkbeiner, M. Distance-to-target weighting in LCA: A matter of perspective. Int. J. Life Cycle Assess. 2021, 26, 114–126. [Google Scholar] [CrossRef]
- Heijungs, R. Deconstructing and reconstructing the theoretical basis of the Ecological Scarcity Method. Sustainability 2023, 15, 16515. [Google Scholar] [CrossRef]
- Leda, P.; Idzikowski, A.; Piasecka, I.; Bałdowska-Witos, P.; Cierlicki, T.; Zawada, M. Management of environmental life cycle impact assessment of a photovoltaic power plant on the atmosphere, water, and soil environment. Energies 2023, 16, 4230. [Google Scholar] [CrossRef]
- Muhl, M.; Berger, M.; Finkbeiner, M. Development of eco-factors for the European Union based on the Ecological Scarcity Method. Int. J. Life Cycle Assess. 2019, 24, 1701–1714. [Google Scholar] [CrossRef]
- Bauer, C.; Hofer, J.; Althaus, H.-J.; Del Duce, A.; Simons, A. The environmental performance of current and future passenger vehicles: Life cycle assessment based on a novel scenario analysis framework. Appl. Energy 2015, 157, 871–883. [Google Scholar] [CrossRef]
- Cox, B.; Bauer, C.; Mendoza Beltran, A.; van Vuuren, D.P.; Mutel, C.L. Life cycle environmental and cost comparison of current and future passenger cars under different energy scenarios. Appl. Energy 2020, 269, 115021. [Google Scholar] [CrossRef]
- Hawkins, T.R.; Singh, B.; Majeau-Bettez, G.; Strømman, A.H. Comparative environmental life cycle assessment of conventional and electric vehicles. J. Ind. Ecol. 2013, 17, 53–64. [Google Scholar] [CrossRef]
- Ellingsen, L.A.-W.; Majeau-Bettez, G.; Singh, B.; Srivastava, A.K.; Valøen, L.O.; Strømman, A.H. Life cycle assessment of a lithium-ion battery vehicle pack. J. Ind. Ecol. 2014, 18, 113–124. [Google Scholar] [CrossRef]
- Degen, F.; Schütte, M. Life cycle assessment of the energy consumption and GHG emissions of state-of-the-art automotive battery cell production. J. Clean. Prod. 2022, 330, 129798. [Google Scholar] [CrossRef]
- Simons, A.; Bauer, C. A life-cycle perspective on automotive fuel cells. Appl. Energy 2015, 157, 884–896. [Google Scholar] [CrossRef]
- Miotti, M.; Hofer, J.; Bauer, C. Integrated environmental and economic assessment of current and future fuel cell vehicles. Int. J. Life Cycle Assess. 2017, 22, 94–110. [Google Scholar] [CrossRef]
- Dunn, J.B.; Gaines, L.; Kelly, J.C.; James, C.; Gallagher, K.G. The significance of Li-ion batteries in electric vehicle life-cycle energy and emissions and recycling’s role in its reduction. Energy Environ. Sci. 2015, 8, 158–168. [Google Scholar] [CrossRef]
- Ciez, R.E.; Whitacre, J.F. Examining different recycling processes for lithium-ion batteries. Nat. Sustain. 2019, 2, 148–156. [Google Scholar] [CrossRef]
- Mohr, M.; Peters, J.F.; Baumann, M.; Weil, M. Toward a cell-chemistry specific life cycle assessment of lithium-ion battery recycling processes. J. Ind. Ecol. 2020, 24, 1310–1322. [Google Scholar] [CrossRef]
- Baars, J.; Domenech, T.; Bleischwitz, R.; Melin, H.E.; Heidrich, O. Circular economy strategies for electric vehicle batteries reduce reliance on raw materials. Nat. Sustain. 2021, 4, 71–79. [Google Scholar] [CrossRef]
- Piasecka, I.; Bałdowska-Witos, P.; Piotrowska, K.; Tomporowski, A. Eco-energetical life cycle assessment of materials and components of photovoltaic power plant. Energies 2020, 13, 1385. [Google Scholar] [CrossRef]
- Leda, P.; Piasecka, I.; Leda, A.; Szala, G.; Tomporowski, A.; Walichnowska, P.; Bałdowska-Witos, P.; Kruszelnicka, W. Investigating and analyzing the influence of a solar power plant’s life cycle on the depletion of natural materials and mineral resources. Eng 2024, 5, 2695–2708. [Google Scholar] [CrossRef]
- Kelly, J.C.; Sullivan, J.L.; Burnham, A.; Elgowainy, A. Impacts of vehicle weight reduction via material substitution on life-cycle greenhouse gas emissions. Environ. Sci. Technol. 2015, 49, 12535–12542. [Google Scholar] [CrossRef] [PubMed]
- Modaresi, R.; Pauliuk, S.; Løvik, A.N.; Müller, D.B. Global carbon benefits of material substitution in passenger cars until 2050 and the impact on the steel and aluminum industries. Environ. Sci. Technol. 2014, 48, 10776–10784. [Google Scholar] [CrossRef] [PubMed]
- Kim, H.C.; Wallington, T.J. Life cycle assessment of vehicle lightweighting: A physics-based model to estimate use-phase fuel consumption of electrified vehicles. Environ. Sci. Technol. 2016, 50, 11226–11233. [Google Scholar] [CrossRef] [PubMed]
- Shanmugam, K.; Gadhamshetty, V.; Yadav, P.; Athanassiadis, D.; Tysklind, M.; Upadhyayula, V.K.K. Advanced high-strength steel and carbon fiber reinforced polymer composite body in white for passenger cars: Environmental performance and sustainable return on investment under different propulsion modes. ACS Sustain. Chem. Eng. 2019, 7, 4951–4963. [Google Scholar] [CrossRef]
- Meng, F.; McKechnie, J.; Turner, T.; Wong, K.H.; Pickering, S.J. Environmental aspects of use of recycled carbon fiber composites in automotive applications. Environ. Sci. Technol. 2017, 51, 12727–12736. [Google Scholar] [CrossRef] [PubMed]
- Tucki, K.; Mruk, R.; Orynycz, O.; Botwińska, K.; Gola, A.; Bączyk, A. Toxicity of Exhaust Fumes (CO, NOx) of the Compression-Ignition (Diesel) Engine with the Use of Simulation. Sustainability 2019, 11, 2188. [Google Scholar] [CrossRef]
- Hanna, F.; Somers, C.; Anctil, A. Life cycle assessment of lithium-ion battery recycling: Evaluating the impact of recycling methods and location. Environ. Sci. Technol. 2025, 59, 14432–14443. [Google Scholar] [CrossRef] [PubMed]
- Tucki, K.; Mruk, R.; Orynycz, O.; Wasiak, A.; Botwińska, K.; Gola, A. Simulation of the Operation of a Spark Ignition Engine Fueled with Various Biofuels and Its Contribution to Technology Management. Sustainability 2019, 11, 2799. [Google Scholar] [CrossRef]
- Piasecka, I.; Tomporowski, A. Analysis of environmental and energetical possibilities of sustainable development of wind and photovoltaic power plants. Probl. Sustain. Dev. 2018, 13, 125–130. ph.pollub.pl/index.php/preko/article/view/5020. [Google Scholar]
- Piotrowska, K.; Piasecka, I.; Kłos, Z.; Marczuk, A.; Kasner, R. Assessment of the life cycle of a wind and photovoltaic power plant in the context of sustainable development of energy systems. Materials 2022, 15, 7778. [Google Scholar] [CrossRef] [PubMed]
- Piasecka, I.; Tomporowski, A.; Flizikowski, J.; Kruszelnicka, W.; Kasner, R.; Mroziński, A. Life cycle analysis of ecological impacts of an offshore and a land-based wind power plant. Appl. Sci. 2019, 9, 231. [Google Scholar] [CrossRef]
- Sobaszek, Ł.; Piasecka, I.; Flizikowski, J.; Tomporowski, A.; Sokolovskij, E.; Bałdowska-Witos, P. Environmentally oriented analysis of benefits and expenditures in the life cycle of a wind power plant. Materials 2023, 16, 538. [Google Scholar] [CrossRef] [PubMed]
- Leda, P.; Piasecka, I.; Szala, G. Environmental life cycle assessment of the materials, components, and elements of a mono-Si photovoltaic power plant. Materials 2025, 18, 2748. [Google Scholar] [CrossRef] [PubMed]
- Piasecka, I.; Kłos, Z. An assessment of the environmental impact of construction materials of monocrystalline and perovskite photovoltaic power plants toward their sustainable development. Materials 2024, 17, 5787. [Google Scholar] [CrossRef] [PubMed]
- Scott, S.; Islam, Z.; Allen, J.; Yingnakorn, T.; Alflakian, A.; Hathaway, J.; Rastegarpanah, A.; Harper, G.D.J.; Kendrick, E.; Anderson, P.A.; Edge, J.; Lander, L.; Abbott, A.P. Designing lithium-ion batteries for recycle: The role of adhesives. Next Energy 2023, 1, 100023. [Google Scholar] [CrossRef]
- Litwin, P.; Gola, A.; Wójcik, Ł.; Cioch, M. Optimization of the Flow of Parts in the Process of Brake Caliper Regeneration Using the System Dynamics Method. Processes 2024, 12, 16. [Google Scholar] [CrossRef]
- Tucki, K.; Orynycz, O.A.; Świć, A.; Wasiak, A.; Mruk, R.; Gola, A. Analysis of the Possibility of Using Neural Networks to Monitor the Technical Efficiency of Diesel Engines During Operation. Adv. Sci. Technol. Res. J. 2023, 17, 1–15. [Google Scholar] [CrossRef] [PubMed]
- Pizoń, J.; Wójcik, Ł.; Gola, A.; Kański, Ł.; Nielsen, I. Autonomous Mobile Robots in Automotive Remanufacturing: A Case Study for Intra-Logistics Support. Adv. Sci. Technol. Res. J. 2024, 18, 213–230. [Google Scholar] [CrossRef] [PubMed]
Figure 1.
Simplified material composition of representative C-segment passenger cars in the 2025 reference and prospective 2050 scenarios. Own study based on literature analysis and data obtained from manufacturers.
Figure 1.
Simplified material composition of representative C-segment passenger cars in the 2025 reference and prospective 2050 scenarios. Own study based on literature analysis and data obtained from manufacturers.
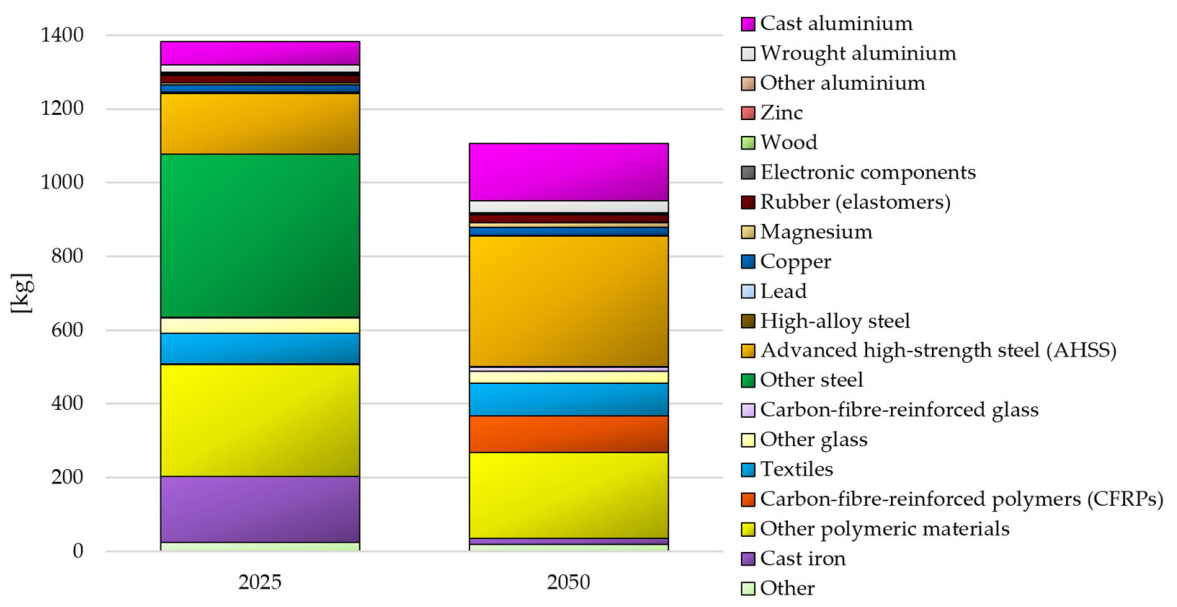
Figure 2.
Shares of the principal materials in representative C-segment passenger cars in the 2025 reference and prospective 2050 scenarios. Own study based on literature analysis and data obtained from manufacturers.
Figure 2.
Shares of the principal materials in representative C-segment passenger cars in the 2025 reference and prospective 2050 scenarios. Own study based on literature analysis and data obtained from manufacturers.
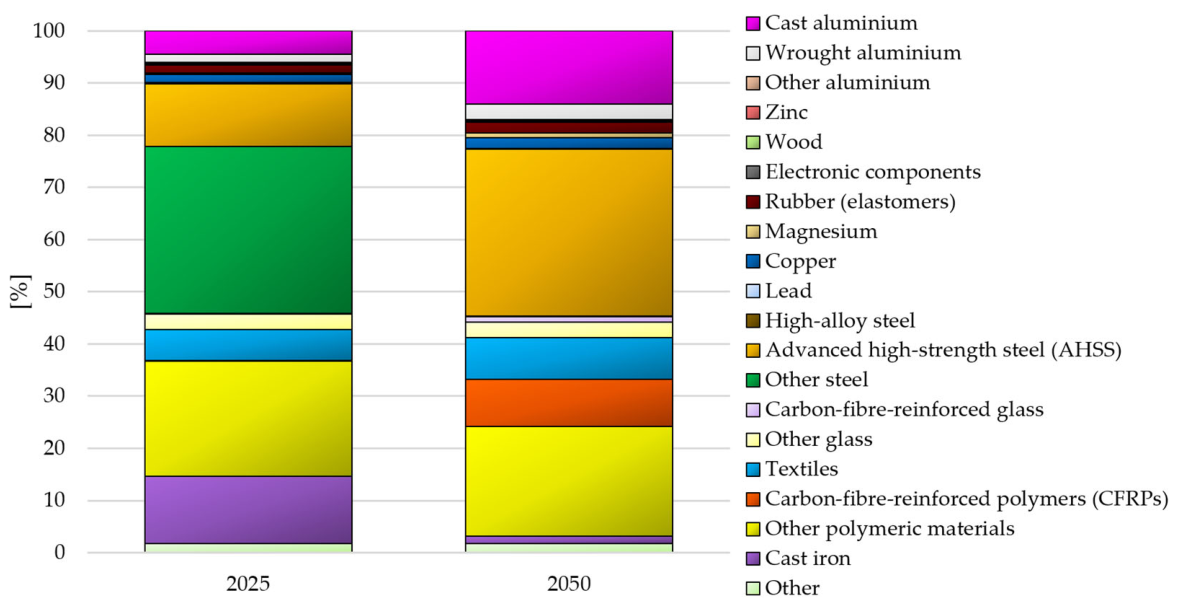
Figure 3.
Simplified material composition of the representative traction battery used in the C-segment battery electric vehicle inventory. Own study based on literature analysis and data obtained from manufacturers.
Figure 3.
Simplified material composition of the representative traction battery used in the C-segment battery electric vehicle inventory. Own study based on literature analysis and data obtained from manufacturers.
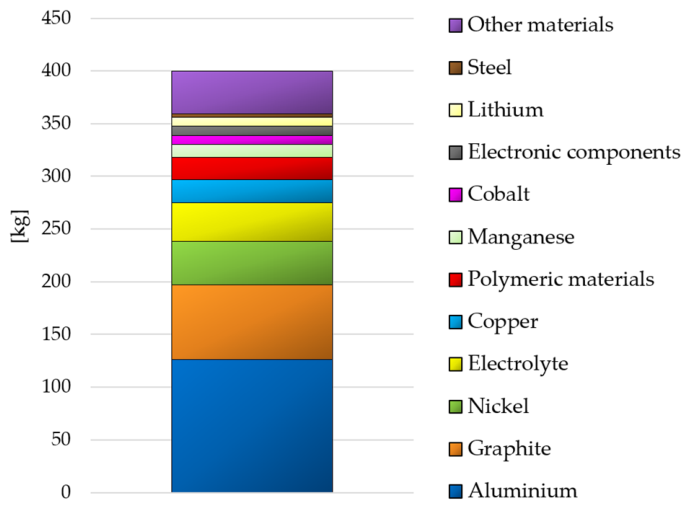
Figure 4.
Weighted ReCiPe 2016 endpoint results for the vehicle-related life-cycle stages of C-segment passenger cars with different powertrain technologies in the 2025 baseline and prospective 2050 scenarios, considering alternative end-of-life management pathways [unit: Pt].
Figure 4.
Weighted ReCiPe 2016 endpoint results for the vehicle-related life-cycle stages of C-segment passenger cars with different powertrain technologies in the 2025 baseline and prospective 2050 scenarios, considering alternative end-of-life management pathways [unit: Pt].
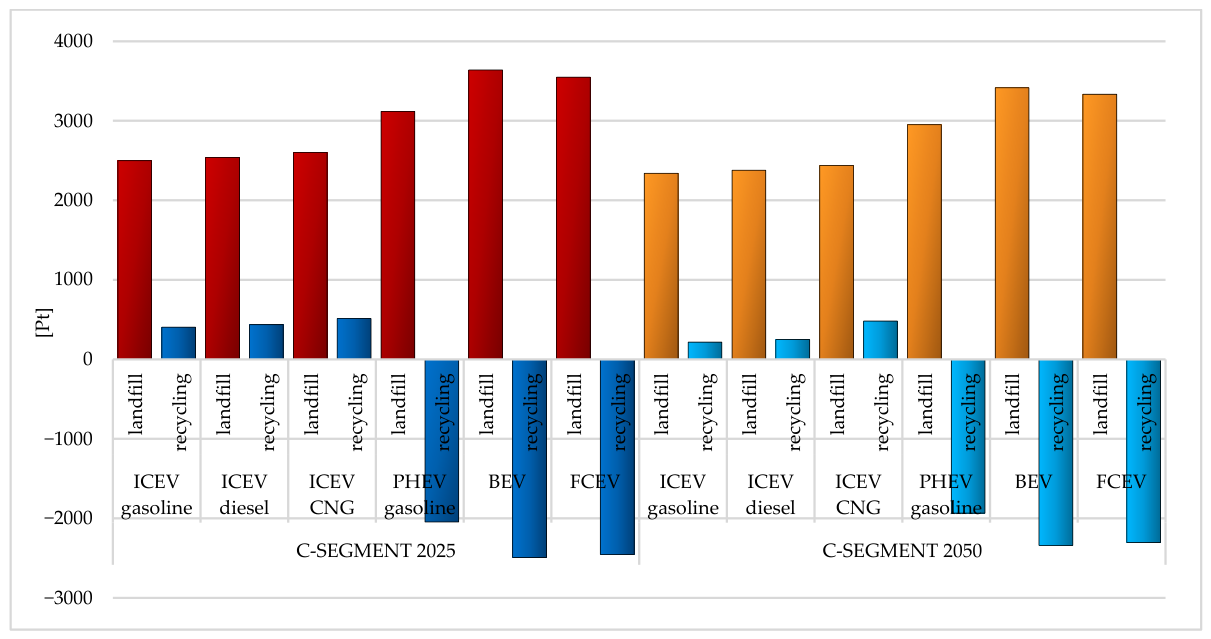
Figure 5.
IPCC 2021 characterisation results for the global warming potential associated with the vehicle-related material and component life-cycle stages of C-segment passenger cars with different powertrain technologies under the 2025 baseline and prospective 2050 scenarios, considering alternative landfill and recycling end-of-life pathways [unit: kg CO2 eq].
Figure 5.
IPCC 2021 characterisation results for the global warming potential associated with the vehicle-related material and component life-cycle stages of C-segment passenger cars with different powertrain technologies under the 2025 baseline and prospective 2050 scenarios, considering alternative landfill and recycling end-of-life pathways [unit: kg CO2 eq].
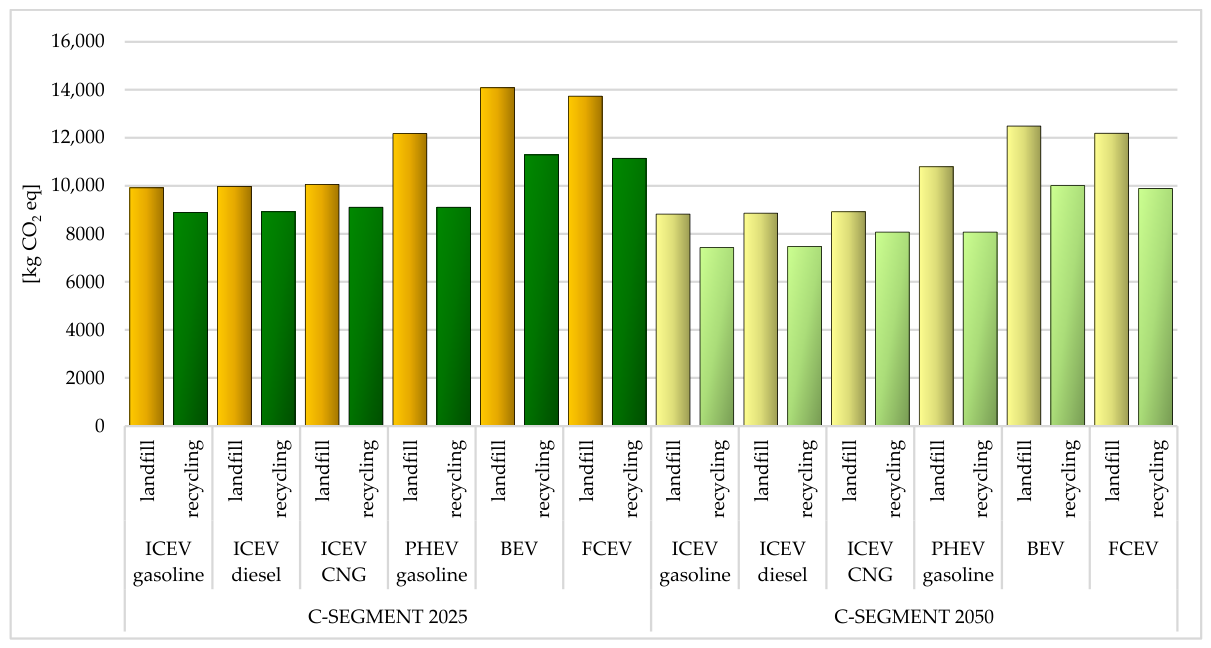
Figure 6.
Characterisation results for the total cumulative primary energy demand associated with the vehicle-related material and component life-cycle stages of C-segment passenger cars with different powertrain technologies under the 2025 reference and prospective 2050 scenarios, considering alternative landfilling and recycling end-of-life pathways [unit: MJ] (CED V1.11 method).
Figure 6.
Characterisation results for the total cumulative primary energy demand associated with the vehicle-related material and component life-cycle stages of C-segment passenger cars with different powertrain technologies under the 2025 reference and prospective 2050 scenarios, considering alternative landfilling and recycling end-of-life pathways [unit: MJ] (CED V1.11 method).
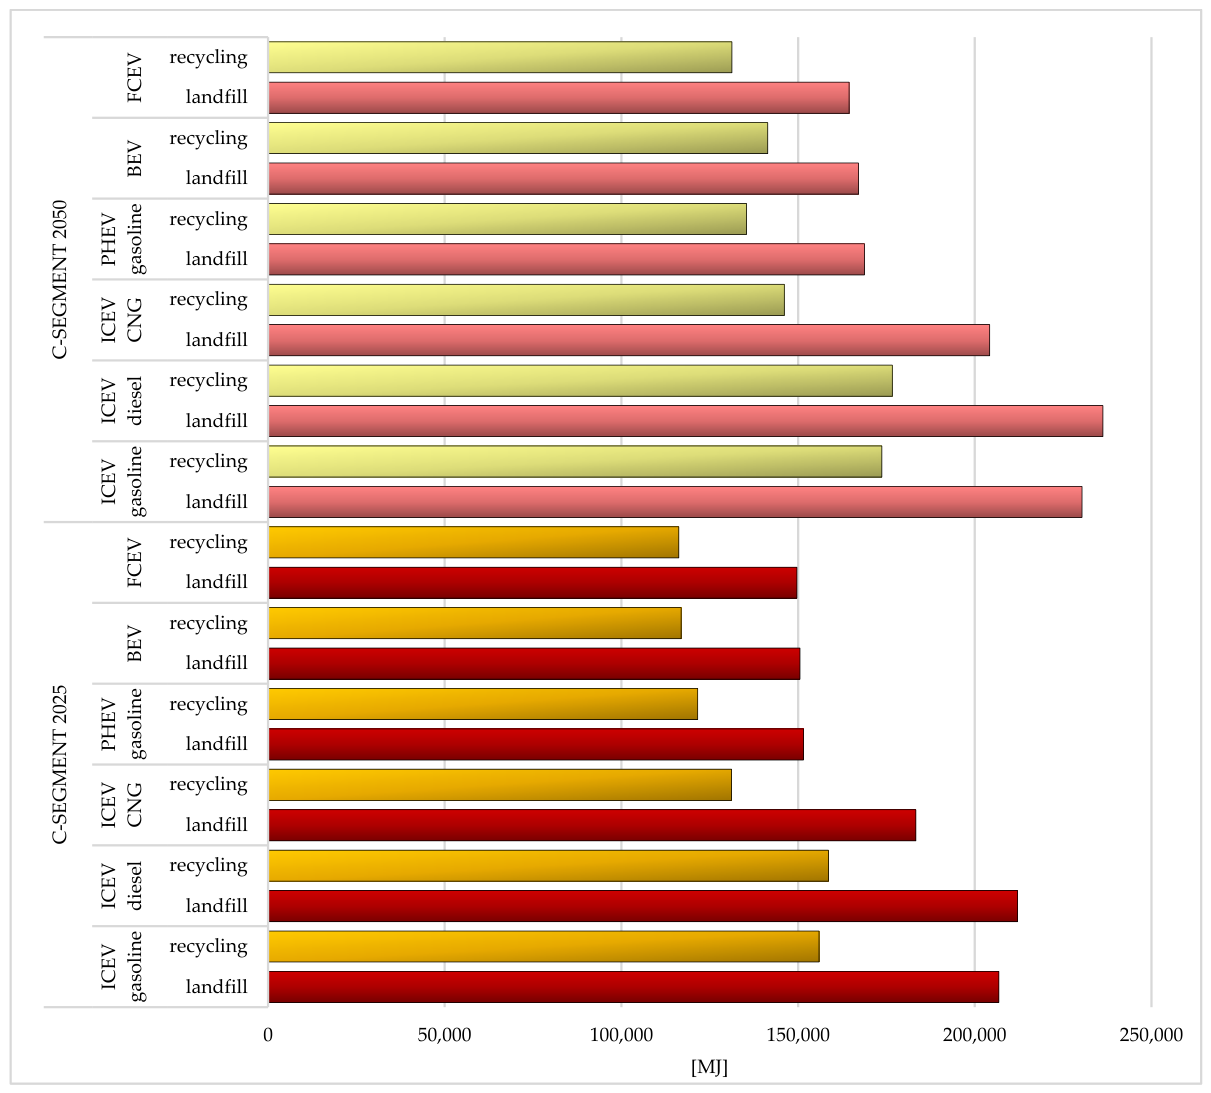
Figure 7.
CML-IA baseline characterisation results for the acidification potential associated with the vehicle-related material and component life-cycle stages of C-segment passenger cars with different powertrain technologies under the 2025 reference and prospective 2050 scenarios, considering alternative landfilling and recycling end-of-life pathways [unit: kg SO2 eq].
Figure 7.
CML-IA baseline characterisation results for the acidification potential associated with the vehicle-related material and component life-cycle stages of C-segment passenger cars with different powertrain technologies under the 2025 reference and prospective 2050 scenarios, considering alternative landfilling and recycling end-of-life pathways [unit: kg SO2 eq].
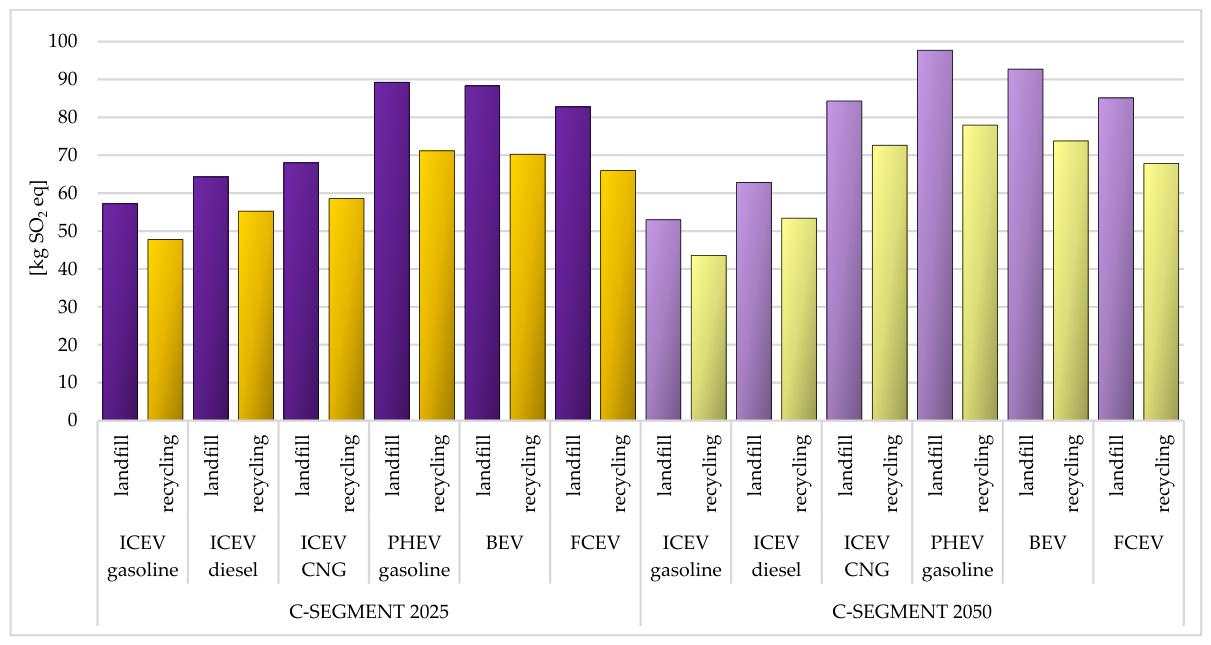
Figure 8.
CML-IA baseline characterisation results for the eutrophication potential associated with the vehicle-related material and component life-cycle stages of C-segment passenger cars with different powertrain technologies under the 2025 reference and prospective 2050 scenarios, considering alternative landfilling and recycling end-of-life pathways [unit: kg PO4 eq].
Figure 8.
CML-IA baseline characterisation results for the eutrophication potential associated with the vehicle-related material and component life-cycle stages of C-segment passenger cars with different powertrain technologies under the 2025 reference and prospective 2050 scenarios, considering alternative landfilling and recycling end-of-life pathways [unit: kg PO4 eq].
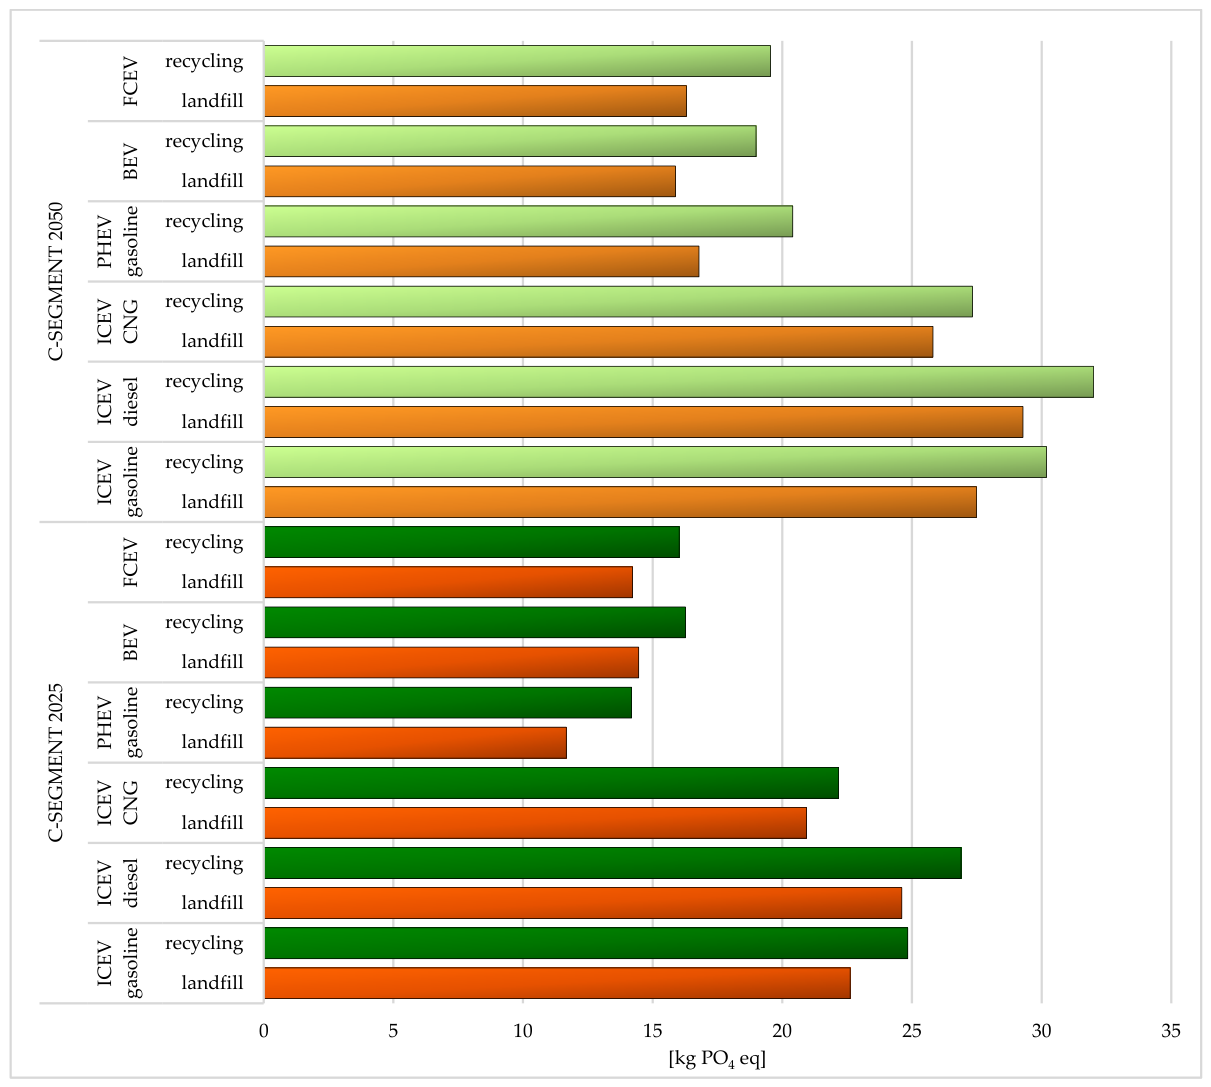
Figure 9.
Ecological Scarcity 2021 weighting results for air emissions associated with the vehicle-related material and component life-cycle stages of C-segment passenger cars with different powertrain technologies under the 2025 reference and prospective 2050 scenarios, considering alternative landfilling and recycling end-of-life pathways [unit: UBP].
Figure 9.
Ecological Scarcity 2021 weighting results for air emissions associated with the vehicle-related material and component life-cycle stages of C-segment passenger cars with different powertrain technologies under the 2025 reference and prospective 2050 scenarios, considering alternative landfilling and recycling end-of-life pathways [unit: UBP].
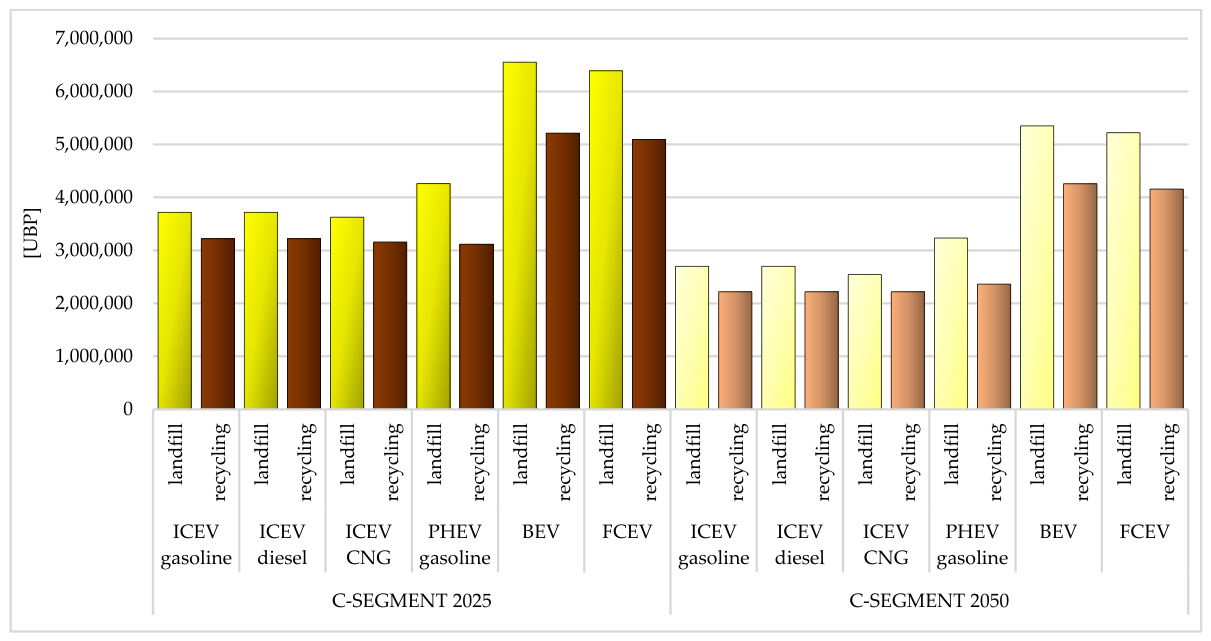
Figure 10.
Ecological Scarcity 2021 weighting results for emissions to water associated with the vehicle-related material and component life-cycle stages of C-segment passenger cars with different powertrain technologies under the 2025 reference and prospective 2050 scenarios, considering alternative landfilling and recycling end-of-life pathways [unit: UBP].
Figure 10.
Ecological Scarcity 2021 weighting results for emissions to water associated with the vehicle-related material and component life-cycle stages of C-segment passenger cars with different powertrain technologies under the 2025 reference and prospective 2050 scenarios, considering alternative landfilling and recycling end-of-life pathways [unit: UBP].
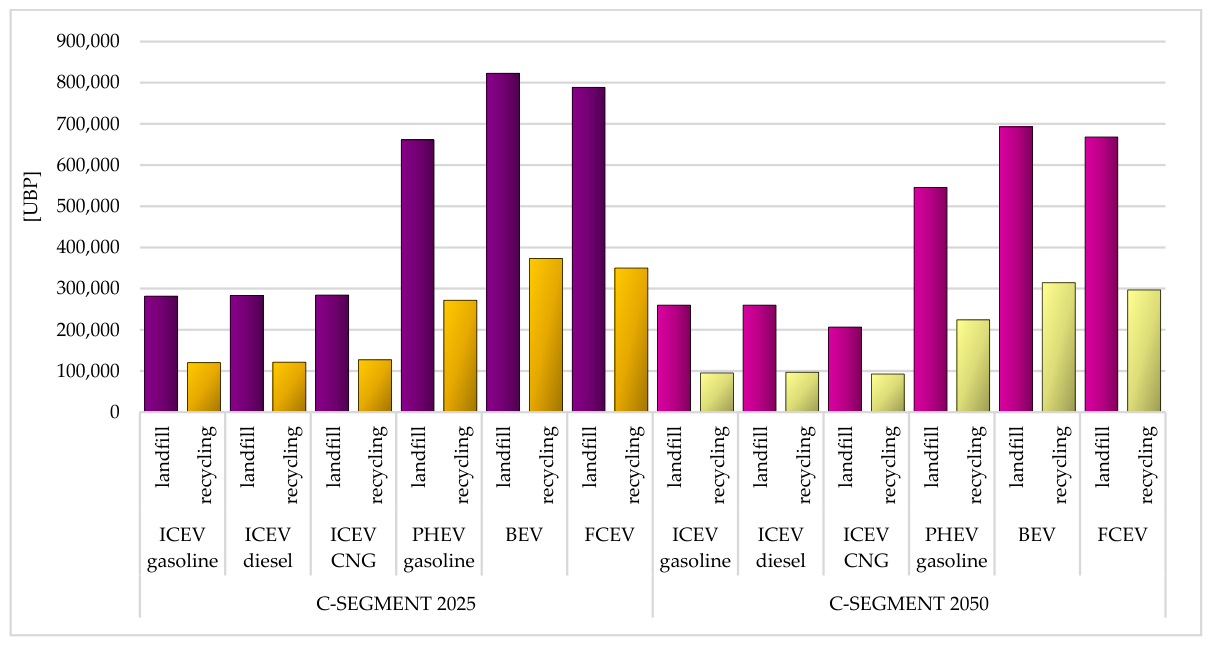
Figure 11.
Ecological Scarcity 2021 weighting results for emissions to soil associated with the vehicle-related material and component life-cycle stages of C-segment passenger cars with different powertrain technologies under the 2025 reference and prospective 2050 scenarios, considering alternative landfilling and recycling end-of-life pathways [unit: UBP].
Figure 11.
Ecological Scarcity 2021 weighting results for emissions to soil associated with the vehicle-related material and component life-cycle stages of C-segment passenger cars with different powertrain technologies under the 2025 reference and prospective 2050 scenarios, considering alternative landfilling and recycling end-of-life pathways [unit: UBP].
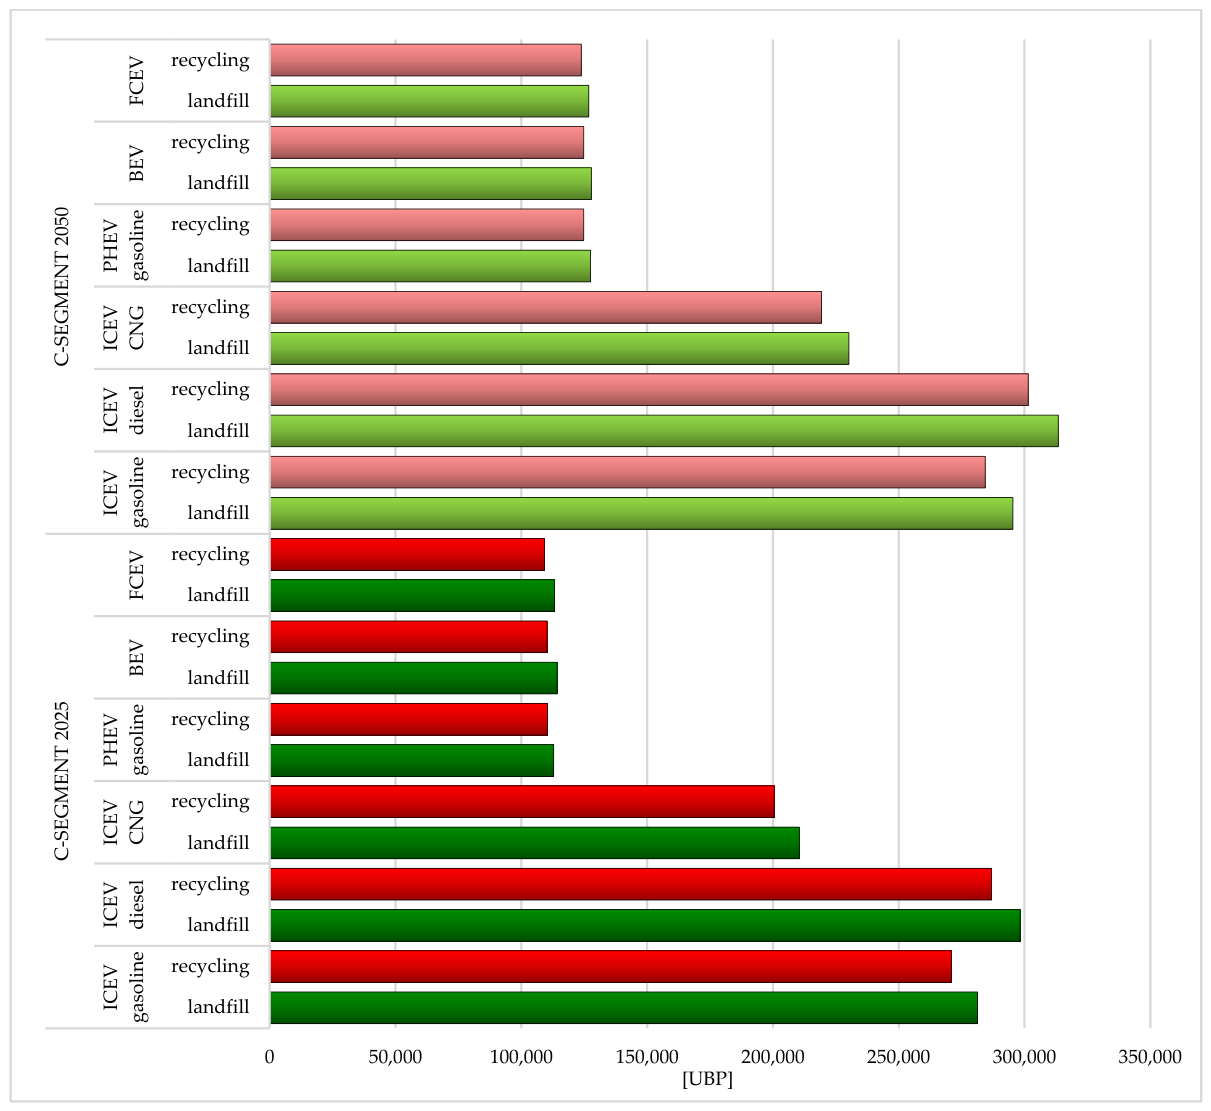
Figure 12.
IPCC 2021 characterisation results for well-to-tank (WTT) and tank-to-wheel (TTW) greenhouse gas emissions associated with the fuel- and energy-supply cycles of C-segment passenger cars with different powertrain technologies under the 2025 reference, prospective 2050 and Paris Agreement-aligned 2050 scenarios [unit: kg CO2 eq]. WTT includes energy-carrier production, processing and supply, whereas TTW includes direct greenhouse gas emissions during vehicle operation. The Paris Agreement-aligned scenario represents the decarbonisation pathway defined in this study.
Figure 12.
IPCC 2021 characterisation results for well-to-tank (WTT) and tank-to-wheel (TTW) greenhouse gas emissions associated with the fuel- and energy-supply cycles of C-segment passenger cars with different powertrain technologies under the 2025 reference, prospective 2050 and Paris Agreement-aligned 2050 scenarios [unit: kg CO2 eq]. WTT includes energy-carrier production, processing and supply, whereas TTW includes direct greenhouse gas emissions during vehicle operation. The Paris Agreement-aligned scenario represents the decarbonisation pathway defined in this study.
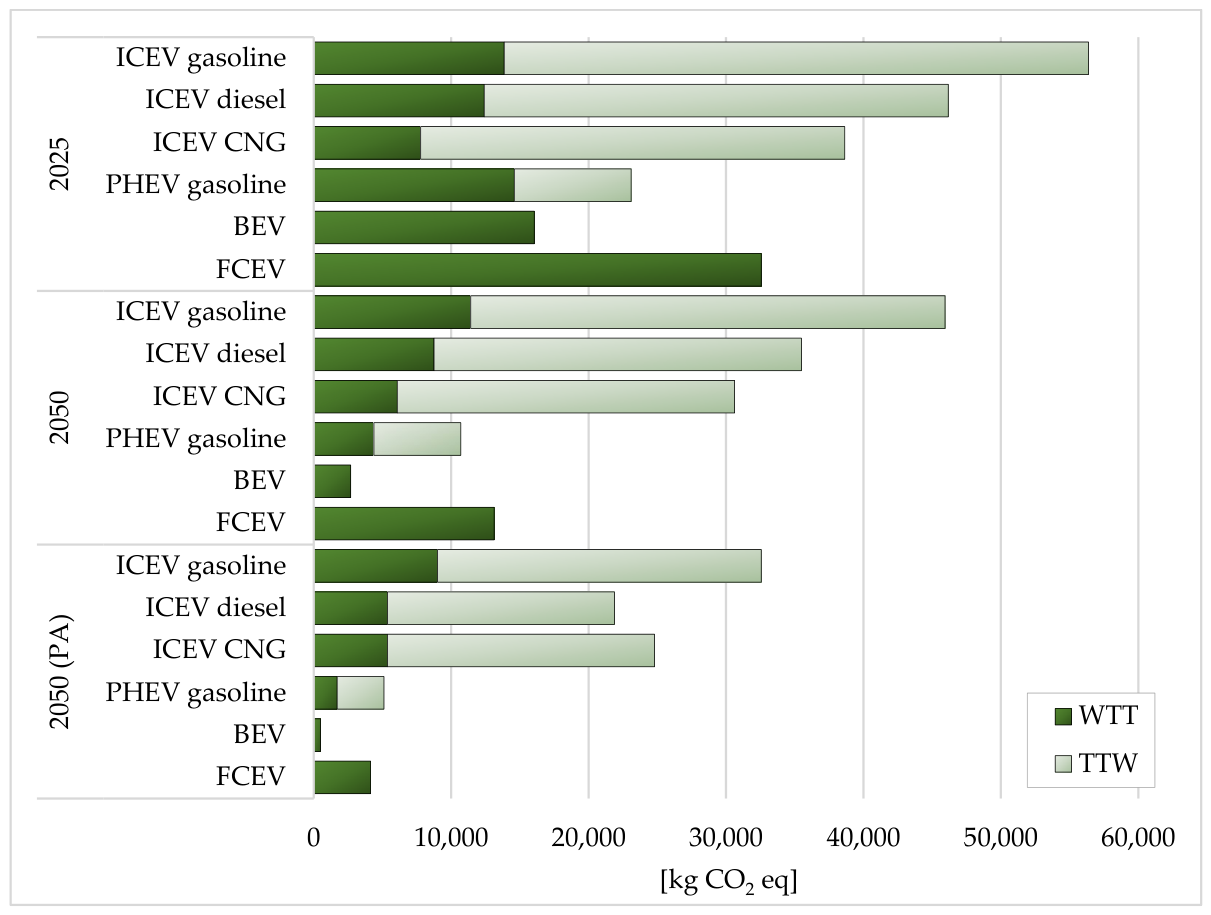
Figure 13.
IPCC 2021 characterisation results for greenhouse gas emissions associated with vehicle manufacturing (W), energy-carrier production and supply (WTT), and vehicle operation (TTW) for C-segment passenger cars with different powertrain technologies under the 2025 reference, prospective 2050 and Paris Agreement-aligned 2050 scenarios [unit: kg CO2 eq]. W includes the production of vehicle materials and components and vehicle assembly, WTT includes fuel, hydrogen or electricity production and supply, and TTW represents direct greenhouse gas emissions during vehicle operation. The 2050 PA scenario represents the Paris Agreement-aligned pathway defined in this study.
Figure 13.
IPCC 2021 characterisation results for greenhouse gas emissions associated with vehicle manufacturing (W), energy-carrier production and supply (WTT), and vehicle operation (TTW) for C-segment passenger cars with different powertrain technologies under the 2025 reference, prospective 2050 and Paris Agreement-aligned 2050 scenarios [unit: kg CO2 eq]. W includes the production of vehicle materials and components and vehicle assembly, WTT includes fuel, hydrogen or electricity production and supply, and TTW represents direct greenhouse gas emissions during vehicle operation. The 2050 PA scenario represents the Paris Agreement-aligned pathway defined in this study.
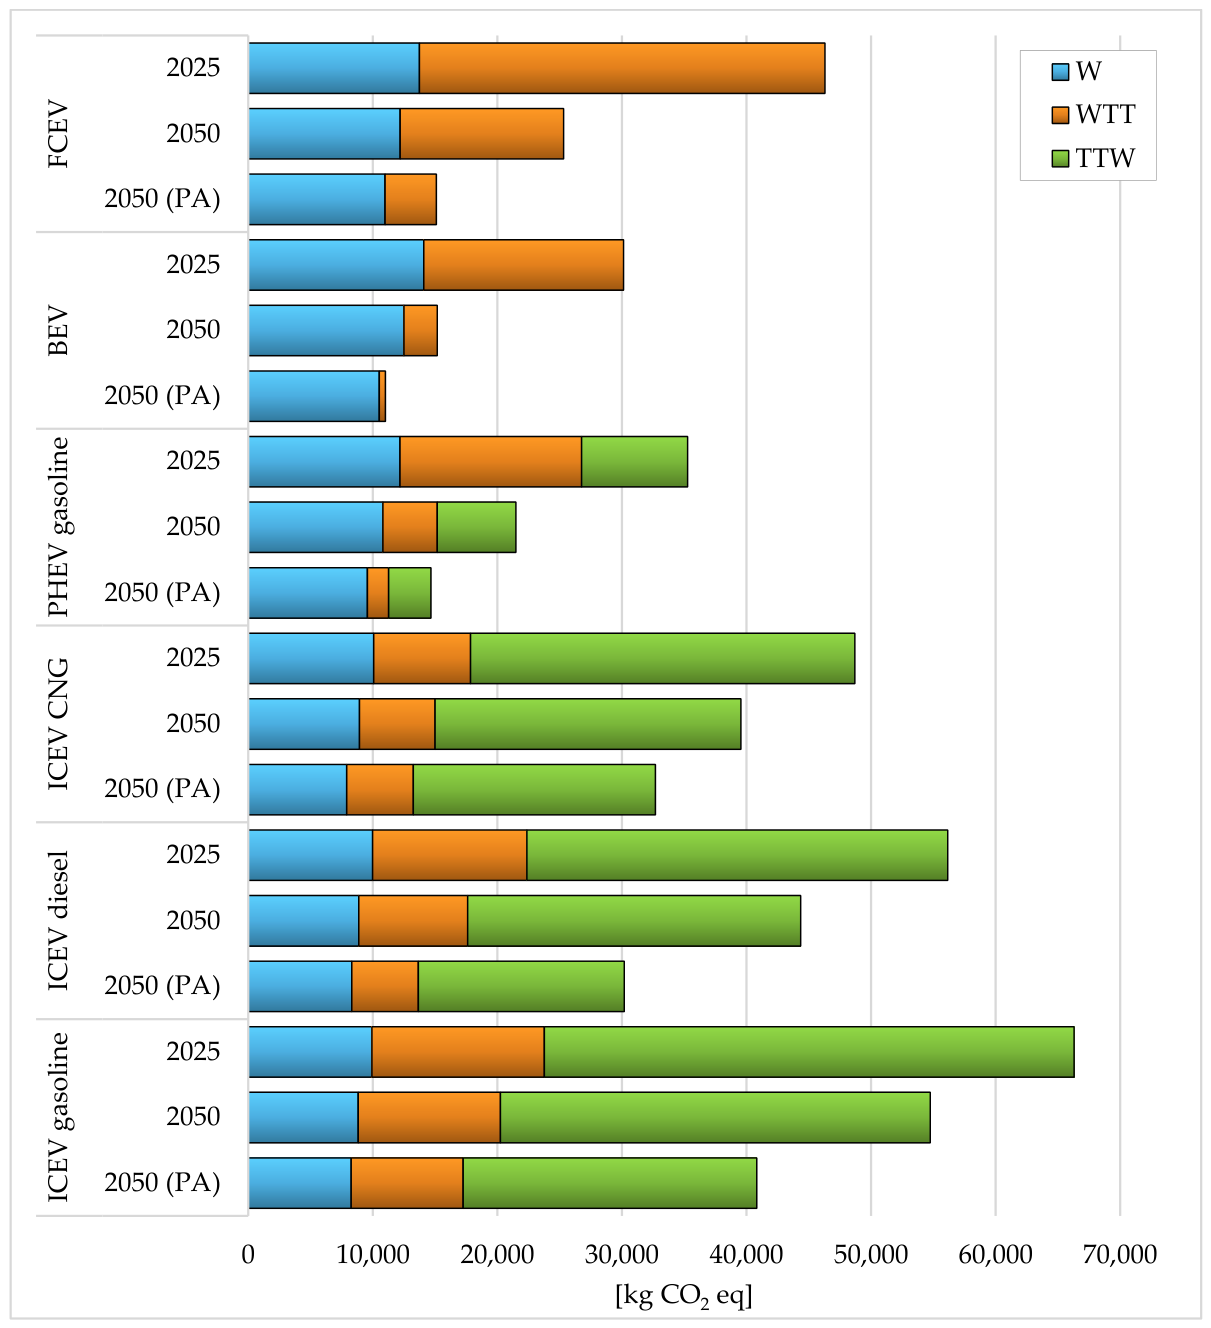

Table 1.
Weighted ReCiPe 2016 endpoint results for the vehicle-related life-cycle stages of C-segment passenger cars with different powertrain technologies in the 2025 baseline and prospective 2050 scenarios, disaggregated into the Human Health, Ecosystems and Resources damage areas and considering alternative end-of-life management pathways [unit: Pt].
Table 1.
Weighted ReCiPe 2016 endpoint results for the vehicle-related life-cycle stages of C-segment passenger cars with different powertrain technologies in the 2025 baseline and prospective 2050 scenarios, disaggregated into the Human Health, Ecosystems and Resources damage areas and considering alternative end-of-life management pathways [unit: Pt].
| C-segment passenger cars | Human Health | Ecosystems | Resources | TOTAL | ||
| 2025 |
ICEV (gasoline) |
landfill | 2.32 × 10³ | 1.70 × 10² | 7.04 × 100 | 2.50 × 10³ |
| recycling | 4.18 × 10² | –1.74 × 101 | 5.98 × 100 | 4.06 × 10² | ||
|
ICEV (diesel) |
landfill | 2.36 × 10³ | 1.71 × 10² | 7.06 × 100 | 2.54 × 10³ | |
| recycling | 4.48 × 10² | –1.68 × 101 | 6.02 × 100 | 4.36 × 10² | ||
|
ICEV (CNG) |
landfill | 2.42 × 10³ | 1.76 × 10² | 7.24 × 100 | 2.60 × 10³ | |
| recycling | 5.20 × 10² | –1.16 × 101 | 6.20 × 100 | 5.14 × 10² | ||
|
PHEV (gasoline) |
landfill | 2.92 × 10³ | 1.85 × 10² | 1.14 × 101 | 3.12 × 10³ | |
| recycling | –1.79 × 10³ | –2.69 × 10² | 9.01 × 100 | –2.04 × 10³ | ||
| BEV | landfill | 3.44 × 10³ | 1.94 × 10² | 1.53 × 101 | 3.64 × 10³ | |
| recycling | –2.15 × 10³ | –3.49 × 10² | 1.24 × 101 | –2.49 × 10³ | ||
| FCEV | landfill | 3.34 × 10³ | 1.89 × 10² | 1.56 × 101 | 3.55 × 10³ | |
| recycling | –2.12 × 10³ | –3.41 × 10² | 1.28 × 101 | –2.45 × 10³ | ||
| 2050 |
ICEV (gasoline) |
landfill | 2.18 × 10³ | 1.66 × 10² | 6.54 × 100 | 2.34 × 10³ |
| recycling | 2.34 × 10² | –2.24 × 101 | 5.46 × 100 | 2.18 × 10² | ||
|
ICEV (diesel) |
landfill | 2.20 × 10³ | 1.67 × 10² | 6.56 × 100 | 2.38 × 10³ | |
| recycling | 2.64 × 10² | –2.20 × 101 | 5.50 × 100 | 2.48 × 10² | ||
|
ICEV (CNG) |
landfill | 2.25 × 10³ | 1.78 × 10² | 3.99 × 100 | 2.44 × 10³ | |
| recycling | 4.83 × 10² | –1.18 × 101 | 3.42 × 100 | 4.82 × 10² | ||
|
PHEV (gasoline) |
landfill | 2.74 × 10³ | 1.92 × 10² | 7.62 × 100 | 2.95 × 10³ | |
| recycling | –1.68 × 10³ | –2.78 × 10² | 6.02 × 100 | –1.93 × 10³ | ||
| BEV | landfill | 3.21 × 10³ | 2.03 × 10² | 1.06 × 101 | 3.42 × 10³ | |
| recycling | –2.01 × 10³ | –3.66 × 10² | 8.53 × 100 | –2.34 × 10³ | ||
| FCEV | landfill | 3.11 × 10³ | 1.97 × 10² | 1.11 × 101 | 3.33 × 10³ | |
| recycling | –1.98 × 10³ | –3.56 × 10² | 9.03 × 100 | –2.30 × 10³ | ||
Disclaimer/Publisher’s Note: The statements, opinions and data contained in all publications are solely those of the individual author(s) and contributor(s) and not of MDPI and/or the editor(s). MDPI and/or the editor(s) disclaim responsibility for any injury to people or property resulting from any ideas, methods, instructions or products referred to in the content. |
© 2026 by the authors. Licensee MDPI, Basel, Switzerland. This article is an open access article distributed under the terms and conditions of the Creative Commons Attribution (CC BY) license (http://creativecommons.org/licenses/by/4.0/).
Copyright: This open access article is published under a Creative Commons CC BY 4.0 license, which permit the free download, distribution, and reuse, provided that the author and preprint are cited in any reuse.


