

Submitted:
01 August 2026
Posted:
04 August 2026
You are already at the latest version
Abstract
The Large Zarima-Mayday dam Reservoir Project, situated in the Tekeze River Basin in Northern Ethiopia, represents a critical water infrastructure initiative designed to support large-scale agricultural expansion specifically sugarcane cultivation and supply downstream environmental flows. Despite its total impoundment capacity of 3.6 BCM, steep valley morphology limits active usable storage to 785 MCM. However, a major strategic flaw in the project’s execution is the failure to implement standard design protocols that integrate reservoir filling in parallel with phased dam construction. Consequently, civil works reached full completion without initiating impoundment, transforming a multi-million-dollar asset into an idle structure facing a four-year filling bottleneck and severe capital lockup. This study evaluates post-construction reservoir operational policies and water supply reliability using the HEC-ResSim model across a 51-years historical hydrologic dataset (1968–2018). Simulation results reveal that under full land development (40,000 ha), the reservoir suffers severe irrigation water deficits in 51% of simulated months. Scaled development scenarios of 30,000 ha and 25,000 ha reduce monthly deficit frequencies to 15% and 11%, respectively. To mitigate such delays in future megaprojects and ensure operational sustainability, integrating dynamic rule curves, phasing impoundment concurrently with civil construction, and adopting high-efficiency micro-irrigation systems are strongly recommended.
Keywords:
Zarima-Mayday dam
; HEC-ResSim
; reservoir reliability
; Tekeze river basin
; impoundment scheduling
; construction management flaws
; capital optimization
1. Introduction
Water resource management in semi-arid and seasonal river basins presents significant operational challenges due to extreme temporal flow variability and inefficiencies [1,2]. In Ethiopia’s Tekeze River Basin, the River watershed experiences high seasonality, with over 53% of annual runoff concentrated during the peak monsoon months of July and August [3,4]. To harness this variable yield, the Zarema-Maymay Dam a massive 152 m high embankment dam was designed to store excess flood waters and release them continuously throughout the extended dry season (October–June) [5]. However, the execution of this project has been severely compromised by construction management failures and systemic deviations from standard hydraulic engineering protocols specifically, like many projects in Ethiopia the failure to implement parallel reservoir filling during the civil construction phase [2]. By delaying impoundment until after full structural completion rather than filling the reservoir incrementally alongside dam elevation milestones, every subsequent activity has been rendered time-critical [6,7]. This procedural flaw has drastically inflated overall project expenditure and created a massive economic bottleneck [8]. Despite being fully constructed, the multi-million-dollar infrastructure must now remain functionally idle for an estimated four years purely to await sequential reservoir filling before any agricultural or downstream benefits can be realized.
Proper operational planning which must now account for this four-year lockup of capital is vital to establish optimized reservoir rule curves and balance large-scale agricultural irrigation demands against mandatory environmental flows without causing critical pool drawdowns [9,10].
1.1. Location of the Study Area
Administratively, the Zarima-Mayday Dam project is situated along the border of the Wolkayite and Tselemti weredas within the Western Zone of the Tigray region. Geographically, the project footprint comprising the dam axis, reservoir, and command area lies within UTM Zone 37N, spanning between 1,451,548 m N to 1,562,033 m N and 321,244 m E to 394,095 m E. The dam axis is positioned downstream of the confluence of the Zarima and Dukuko river drainage basins, capturing a total catchment area of 2,133 km2 at the dam site. The Zarima River originates from the highland slopes of the Semien Mountains between Debark and Zarima, draining one of the nation’s highest rainfall zones where accumulated annual precipitation exceeds 2,000 mm [11,12]. Similarly, the Dukuko River emerges from elevated terrain in the western portion of the Semien Mountains, draining a watershed of approximately 1,200 km2 up to its confluence with the Zarima River [13]. Downstream of this convergence, the combined watercourse continues as the Zarima River, which serves as a major left-bank affluent of the Tekeze River [5,10]. The geographical context and regional layout of the project are illustrated in Figure 1.
2. Materials and Methods
2.1. Hydrometeorological Data Collection
Historical hydrometeorological data spanning 51 years (1968--2018) were collected to construct the baseline inflow series. Daily and monthly runoff data were obtained from the Ethiopian Ministry of Water and Energy (MoWE). Elevation-Area-Capacity (EAC) curves and physical dam specifications including the 952.00 m a.s.l. dam crest level (DCL), 946.40 m a.s.l. normal pool level (NPL), 937.75 m a.s.l. minimum operating level (MOL), and total capacity (3.64 BCM) with active storage (785 MCM) were compiled from project design reports.
2.2. HEC-ResSim Model Setup and Reservoir Simulation
Reservoir operations were simulated using the Hydrologic Engineering Center’s Reservoir System Simulation (HEC-ResSim) model [14]. The physical network was configured using the River main stream, Dokuko River tributary, and reservoir storage zones (Dead, Active, and Flood pools). The system was parameterized with seasonal crop water requirements for sugarcane irrigation across three development targets [15]. Full Scale: 40,000 ha (design benchmark), Medium Scale: 30,000 ha and Scaled Down: 25,000 ha.
Environmental flow requirements (EFR) were incorporated as downstream constraints based on hydrological index methods. Figure 2 shows HEC-ResSim Architecture & Network Topology.
To evaluate operational reliability and filling dynamics, the HEC-ResSim model was structured across three core computational modules, Watershed Setup, Reservoir Network, and Simulation Management [16]. The spatial schematic was parameterized using high-resolution DEM-derived shapefiles within a geo-referenced coordinate system [17]. Network Connectivity: The model integrates five critical junctions and three routing reaches. Headwater inflows enter via boundary junctions on the mainstem and Dokuko tributary. Hydrologic Stream Routing: Flow translation through channel reaches was modeled using the Muskingum method. The travel time parameter K was calculated via Kirpich’s formula using equation 1.
where L is the channel length (ft) and S is the mean watershed slope (ft/ft). The weighting factor X was set to 0.20 to account for moderate channel storage attenuation.
2.3. Physical Reservoir & Hydraulic Outlet Geometry
The Zarima-Mayday Dam storage characteristics were defined using the Elevation-Area-Capacity (EAC) relationship derived from surveying data: Storage Zones: Total storage is partitioned into four distinct operational pools: Inactive Pool: 2,859 MCM (78.5% of gross storage) below Minimum Operating Level (MOL = 937.75 m a.s.l.), Active Conservation Pool: 785 MCM (21.5% of gross storage) between MOL and Normal Pool Level (NPL = 946.40 m a.s.l.),Flood Control Pool: Storage between NPL and Dam Crest Level (DCL = 952.00 m a.s.l.). Hydraulic Control Structures: Spillway: Uncontrolled 30 m wide ogee-crest at 946.40 m a.s.l. discharging into a concrete-lined chute. Irrigation Outlet: Controlled intake located at 937.75 m a.s.l. designed for gravity delivery to downstream command areas.
2.4. Evaluation of Impoundment Phasing and Operational Reliability
To assess both civil engineering design gaps and operational performance, a dual-analytical framework was applied:
- Construction-Phase Impoundment Assessment: Evaluating the temporal gap created by non-parallel filling protocols during dam construction.
- The simulation operates under a mass-balance framework over a 51-year historical monthly inflow series (1968–2018) was evaluated using equation 2.
- Volumetric and Time-Based Reliability Analysis: Assessing monthly irrigation supply reliability (Relt) and volumetric deficit ratios (Dv) using equation 3 standard performance indices:
Figure 3 shows the overall integrated methodology and operational workflow of the study.
3. Results and Discussion
3.1. Baseline Inflow Dynamics and Storage Morphology Constraints
Analysis of the 51-year historical streamflow dataset (1968–2018) confirms severe unimodal seasonality in the River watershed, with over 52% of total annual runoff occurring during the monsoon months of July and August. While the Zarima-Mayday Dam possesses a gross storage capacity of 3.6 Bm³, the steep V-shaped valley topography severely restricts the active operational pool to 785 Mm³ (less than 22% of total capacity). This structural constraint is exacerbated by extreme hydroclimatic variability (Figure 4); peaking at 465-530 MCM/month during baseline conditions, followed by extended low-flow dry periods.
3.2. Construction Scheduling Flaws and Impoundment Bottlenecks
The operational efficiency and structural performance of the Zarima-Mayday Dam are governed by severe topographically induced storage asymmetries and pronounced intra-annual flow regimes. Elevation–Area–Capacity (EAC) evaluations and volumetric partitioning analyses (Figure 5) reveal that while the reservoir exhibits a substantial gross impoundment capacity of 3,644 MCM (3.644 BCM) at the Normal Pool Level (NPL= 946.40m a.s.l.), approximately 78.5\% (2,859 MCM) is allocated as inactive dead storage below the Minimum Operating Level (MOL = 937.78 m a.s.l.).
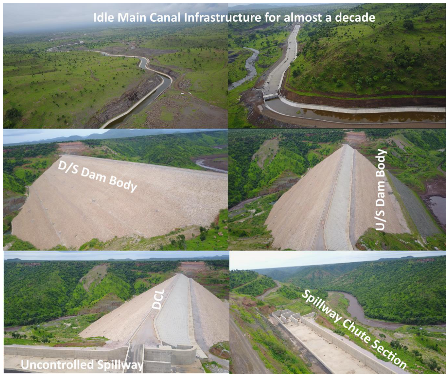
Standard hydraulic engineering protocols dictate that reservoir impoundment should occur incrementally alongside phased dam elevation milestones. In this project, civil works reached 100% completion without initiating staged filling as shown in Figure 6. Consequently, the completed 152 m dam structure must remain functionally unutilized for an estimated 4-year impoundment period purely to accumulate baseline operational storage, creating severe financial lockup as presented in appendix A.
Synthetic impoundment simulations under a multi-year dry hydrological sequence (Figure 7) demonstrate that reservoir water levels remain submerged within the inactive storage zone throughout a four-year initial filling phase. This prolonged failure to breach the intake threshold exposes the project to significant operational latency and asset idleness. To mitigate these risks and maximize asset utility, adaptive management strategies must integrate multi-purpose operational policies such as leveraging dead storage for sustainable inland aquaculture while dynamically optimizing live storage allocations to cushion against multi-year drought contingencies.
3.3. Reservoir Reliability and Agricultural Demand Scenarios
HEC-ResSim monthly model simulations across the 51-year hydrologic sequence reveal stark variations in water supply reliability. Under full land development (40,000 ha), the reservoir fails to meet combined agricultural demands and downstream Environmental Flow Requirements (EFR) in 50% of simulated months. Scaling down initial agricultural commissioning to 25,000 ha dramatically improves monthly reliability to 89%.
Simulation results across 612 operational months demonstrate a stark contrast in system performance depending on the command area scale as shown in Figure 8.
Under Scenario R-A (40,000 ha), developing the target area leads to an unsustainable failure rate of 50%. During severe dry years, high crop water requirements trigger excessive drawdowns that breach the minimum operating level (937.75 m a.s.l.), threatening ecological security. Scaling command land down to 25,000–30,000 ha (Scenarios R-B and R-C) substantially improves reliability to 85%–89%, restricting deficits primarily to late dry-season periods.
3.4. Evaluation of Adaptive Operational Strategies
The baseline HEC-ResSim simulations under the full 40,000 ha command area reveal an unsustainable monthly deficit frequency of 51%, primarily driven by the rigid, static operational rule curves currently envisioned and the reliance on traditional open-furrow surface irrigation [18]. To overcome the severe volumetric limitations of the active storage pool (785 MCM out of 3,644 MCM gross storage) [19], a dual-phase adaptation strategy combining Dynamic Rule Curves (DRC) and Agricultural Water-Demand Modernization (Micro-Irrigation) was modeled [17].
3.4.1. Dynamic Rule Curves (DRC) via Hydroclimatic Forecasting
Static operational rule curves force the reservoir to maintain fixed Target Water Levels (TWL) regardless of incoming seasonal climate signals [20]. In contrast, the integrated Dynamic Rule Curve (DRC) framework utilizes early-warning seasonal precipitation and streamflow forecasting triggers (evaluated at the start of the wet season in June) [19]. When an upcoming dry or below-normal hydrologic year is forecasted, the DRC dynamically elevates the target conservation rule curve during the late monsoon phase (August–September) and shifts release rules to hedge water allocations prior to the critical dry-season window (March–July. Figure 9: Simulated reservoir pool levels and operational rule curve dynamics under static baseline vs. DRC hydroclimatic forecasting.
Deficit Reduction: Implementation of DRC alone reduces severe dry-season deficit occurrences across the 51-year simulation record from 51% down to 35% under full land development, representing up to a 22% relative reduction in severe supply failures.
Storage Hedging Efficiency: By initiating controlled early delivery reductions (10–15% rationing) during low-inflow forecast years, the DRC prevents complete drawdown of the active pool, retaining a critical emergency reserve above the Minimum Operating Level (MOL = 937.75 m a.s.l.).
3.4.2. Demand-Side Modernization: Surface vs. High-Efficiency Micro-Irrigation
While DRC optimizes supply-side management [21], demand-side modernization yields transformative performance gains [22].The original design assumes standard surface (furrow) irrigation for sugarcane, characterized by low field application efficiency (ηa ≈ 50–55%) and substantial conveyance losses. Transitioning the command area to high-efficiency micro-irrigation (drip/sub-surface drip), operating at ηa ≥ 85–90%, drastically reduces volumetric diversion requirements per hectare [23]. Figure 10: Comparative monthly irrigation deficit frequency (%) across operational strategies.
3.4.3. Quantitative Synthesis of Adaptive Operational Policies
Key Analytical Justifications:
1. Compounding System Benefits: Neither supply-side optimization (DRC) nor demand-side management (micro-irrigation) alone reaches the target 90% water supply reliability threshold at full 40,000 ha development. However, their combination achieves a 94.6% volumetric reliability rate, making the original project scale viable without expanding physical dam capacity.
2. Mitigating Hydroclimatic Extremes: Under severe dry-year hydrologic sequences (where annual inflows collapse to ~50 MCM/month), the integrated strategy maintains essential downstream Environmental Flow Requirements (EFR) while preventing disastrous multi-year drawdowns into the 2,859 MCM dead storage pool.
4. Conclusions and Recommendations
4.1. Conclusions
This research executed a comprehensive hydrological and operational performance evaluation of the Zarima-Mayday Dam project within Ethiopia’s Tekeze River Basin using the HEC-ResSim modeling framework across a 51-year hydroclimatic dataset (1968–2018). The core conclusions derived from this study are as follows:
- Severe Topographically Induced Storage Asymmetry: Despite possessing an enormous gross storage capacity of 3.644 BCM at Normal Pool Level (946.40 m a.s.l.), steep V-shaped valley morphology severely restricts active operational storage to just 785 MCM (21.5% of gross capacity). A massive 78.5% (2,859 MCM) is locked below the Minimum Operating Level (MOL = 937.75 m a.s.l.) as inactive dead storage.
- Critical Construction Management and Scheduling Flaws: The project suffered a fundamental execution failure due to non-parallel impoundment scheduling [6]. Civil construction reached 100% completion without initiating phased staged filling [24]. Consequently, the completed 152 m high dam must remain functionally idle for an estimated 4-year impoundment bottleneck purely to submerge the inactive pool, resulting in severe capital lockup and lost agricultural production.
- Unviable Baseline Reliability at Full Scale: Under the original design command area (40,000 ha) using conventional surface irrigation and static rule curves, the system suffers an unsustainable 50% monthly supply failure rate (260 out of 516 simulated months), experiencing peak monthly shortages of 123.9 MCM and regularly exhausting active storage during dry-season periods (March–July).
- Operational Viability of Scaled Development: Scaling down initial agricultural commissioning to 30,000 ha or 25,000 ha dramatically improves supply reliability to 87% (13% deficit frequency) and 87% (13% deficit frequency), respectively, ensuring that reservoir drawdowns remain safely contained within the active conservation pool.
- Transformative Power of Integrated Adaptive Strategies: Combining Dynamic Rule Curves (DRC) driven by seasonal climate forecasts with high-efficiency drip/micro-irrigation lowers monthly deficit frequencies at full 40,000 ha development to 8%, boosting overall volumetric water reliability to 98%.
4.2. Recommendations
To rectify the identified design and operational vulnerabilities, optimize water usage, and establish actionable frameworks for future water infrastructure megaprojects, the following policy, technical, and operational recommendations are proposed:
4.2.1. Immediate Phased Agricultural Commissioning
Cap Initial Command Area to ≤ 25,000 ha: The Ministry of Irrigation and Lowland, and the Sugar Corporation should immediately scale back Phase-1 irrigation commissioning from 40,000 ha to 25,000. This aligns agricultural demand with the 785 MCM usable active pool constraints and guarantees an initial supply reliability of 95%. Phased Expansion Triggers: Expansion beyond 25,000 ha toward 40,000 ha must be strictly contingent upon the complete installation of modern micro-irrigation infrastructure and verified multi-year inflow trends [25].
4.2.2. Mandatory Adoption of High-Efficiency Micro-Irrigation
4.2.3. Transition to Hydroclimatic Dynamic Rule Curves (DRC)
Implement Forecast-Driven Operations: Replace the static operational rule curve with a Dynamic Rule Curve framework integrated into real-time hydroclimatic monitoring systems. Operators must utilize June monsoon forecast triggers to hedge reservoir releases early, preserving emergency storage reserves prior to low-inflow dry periods.
4.2.4. Multi-Purpose Utilization of Inactive Dead Storage
Commercial Inland Fisheries & Aquaculture: Capitalize on the vast, permanent 2,859 MCM dead storage pool by developing managed inland aquaculture and commercial fisheries, offsetting the economic losses incurred during the 4-year impoundment latency period [28].
4.2.5. Systemic Policy Reforms for Future Megaproject Execution
Enforce Parallel Impoundment Protocols: National dam engineering guidelines must explicitly mandate staged reservoir impoundment in parallel with dam elevation milestones during civil construction, eliminating multi-year asset idleness and post-construction financial lockup [29].
Ethics Statement
The authors confirm that this study was conducted in strict accordance with the academic, scientific, and professional ethical standards mandated by the publisher. This research is based entirely on non-experimental field assessments, numerical simulation modeling, and institutional engineering data records obtained from public water agencies. It does not involve human participants, animal testing, or clinical trials; consequently, specific institutional review board (IRB) approval was not required.
Declaration of Competing Interest
The authors declare that they have no known competing financial interests, professional conflicts, or personal relationships that could have influenced the work reported in this paper.
Data Availability
Data will be made available by the corresponding author upon reasonable request, subject to any applicable institutional restrictions and confidentiality requirements.
CRediT
Authorship Contribution Statement.
Mehari Gebreyohannes Hiben
Conceptualization, Methodology, Investigation, Formal Analysis, Data Curation, Writing Original Draft, Writing Review & Editing, Visualization, Validation, Project Administration.
Habtamu Itefa Geleta
Methodology, Investigation, Data Curation, Formal Analysis, Validation, Writing Review & Editing.
Abraha Adugna Ashenafi
Methodology, Investigation, Formal Analysis, Validation, Writing Review & Editing, Supervision.
Funding
The authors received no specific grant from any funding agency in the public, commercial, or not-for-profit sectors. The work was conducted independently as part of the authors’ professional and academic research activities.
Acknowledgments
he authors would like to express their gratitude to the Water and Energy Minister, Addis Ababa, Ethiopia, and the Ethiopian Sugar Corporation for providing access to technical project reports, hydrological records, and necessary engineering design data. We also thank the field technicians and local professionals who facilitated data collection and site inspections at the Zarema-Mayday dam.
Appendix A
References
- Mohammed, R.; Scholz, M. Adaptation strategy to mitigate the impact of climate change on water resources in arid and semi-arid regions: a case study. Water Resour. Manag. 2017, 31, 3557–3573. [Google Scholar] [CrossRef]
- Hiben, M.G.; Gebresilassie, A.T.; Ashenafi, A.A. Infrastructural Underperformance and Spillway Geotechnical Failure: A Forensic Investigation of the Gerebsegen Multi-Outlet Reservoir, Ethiopia., Preprints. 2026. [Google Scholar] [CrossRef]
- Zeleke, E.B.; Melesse, A.M.; Kidanewold, B.B. Assessment of climate and catchment control on drought propagation in the Tekeze River Basin, Ethiopia. Water 2022, 14, 1564. [Google Scholar] [CrossRef]
- Gebremicael, T.G.; Mohamed, Y.A.; Zaag, P. v.; Hagos, E.Y. Temporal and spatial changes of rainfall and streamflow in the Upper Tekezē–Atbara river basin, Ethiopia. Hydrol. Earth Syst. Sci. 2017, 21, 2127–2142. [Google Scholar] [CrossRef]
- Kebede, G.T. Analysis of Dam Breach Outflow and Inundation Mapping-The Case of Zarima-Mayday Dam; Addis Ababa Science and Technology University, 2020. [Google Scholar]
- Du, R.; Zhong, D.; Yu, J.; Tong, D.; Wu, B. Construction simulation for a core rockfill dam based on optimal construction stages and zones: Case study. J. Comput. Civ. Eng. 2016, 30, 05015002. [Google Scholar] [CrossRef]
- Bozorg-Haddad; Orouji, H.; Mohammad-Azari, S.; Loáiciga, H.A.; Mariño, M.A. Construction risk management of irrigation dams, J. Irrig. Drain. Eng. 2016, 142, 04016009. [Google Scholar] [CrossRef]
- Połomski, M.; Wiatkowski, M. Impounding reservoirs, benefits and risks: A review of environmental and technical aspects of construction and operation. Sustainability 2023, 15, 16020. [Google Scholar] [CrossRef]
- Zheng, X.; Zhang, L.; Yang, J.; Du, S.; Wu, S.; Luo, S. Technical challenges of safety emergency drawdown for high dam and large reservoir project. Water 2023, 15, 1538. [Google Scholar] [CrossRef]
- Hiben, M.G.; Ashenafi, A.A. Engineering Assessment of Gerusernay Embankment Dam: Hydrological, Geotechnical, and Construction Performance Analysis, Preprints. 2026. [Google Scholar] [CrossRef]
- Berhane; Hadgu, G.; Worku, W.; Abrha, B. Trends in extreme temperature and rainfall indices in the semi-arid areas of Western Tigray, Ethiopia. Environ. Syst. Res. 2020, 9, 1–20. [Google Scholar] [CrossRef]
- Hiben, M.G.; Awoke, A.G.; Ashenafi, A.D. Hydroclimatic Variability, Characterization, and Long Term Spacio-Temporal Trend Analysis of the Ghba River Subbasin, Ethiopia. 2022. [Google Scholar] [CrossRef]
- Zegeye, M.K.; Bekitie, K.T.; Hailu, D.N. Spatio-temporal variability and trends of hydroclimatic variables at Zarima Sub-Basin North Western Ethiopia. Environ. Syst. Res. 2022, 11 27. [Google Scholar] [CrossRef]
- Dash, S.S.; Sahoo, B.; Raghuwanshi, N.S. An integrated reservoir operation framework for enhanced water resources planning. Sci. Rep. 2023, 13, 21720. [Google Scholar] [CrossRef]
- Kim, J.; Read, L.; Johnson, L.E.; Gochis, D.; Cifelli, R.; Han, H. An experiment on reservoir representation schemes to improve hydrologic prediction: Coupling the national water model with the HEC-ResSim. Hydrol. Sci. J. 2020, 65, 1652–1666. [Google Scholar] [CrossRef]
- Dash, S.S.; Sahoo, B.; Raghuwanshi, N.S. An adaptive multi-objective reservoir operation scheme for improved supply-demand management. J. Hydrol. 2022, 615, 128718. [Google Scholar] [CrossRef]
- Chandel; Shankar, V.; Jaswal, S. Employing HEC-ResSim 3.1 for Reservoir Operation and Decision, Bound. Layer Flows Model. Comput. Appl. Laminar Turbul. Incompressible Compressible Flows 2023, 3. [Google Scholar]
- Meshkat, M.; Klipsch, J.D. Modeling interconnected reservoirs with HEC-ResSim, in: World Environ. In Water Resour. Congr. 2018; American Society of Civil Engineers: Reston, VA, 2018; pp. 233–243. [Google Scholar] [CrossRef]
- Bekele, D.M.; Ayana, M.T.; Mohammed, A.K.; Lohani, T.K.; Shabaz, M. Prophesying the stream flow and perpetrating the performance of Halele-Werabessa reservoirs of Ethiopia using HEC-HMS and HEC-ResSim. World J. Eng. 2021, 18, 692–700. [Google Scholar] [CrossRef]
- Wan, W.; Wang, Z.; Cheng, L.; Bai, Y.; Wang, W.; Wang, K. Integrating drought warning water level with analytical hedging for reservoir water supply operation. Water Resour. Res. 2025, 61, e2024WR038680. [Google Scholar] [CrossRef]
- Ilich, N. Dynamic reservoir rule curves—Their creation and utilization. J. Hydrol. X 2024, 22, 100166. [Google Scholar] [CrossRef]
- Uysal, G.; Şensoy, A.; Şorman, A.A.; Akgün, T.; Gezgin, T. Basin/Reservoir System Integration for Real Time Reservoir Operation, Water Resour. Manag. 2016, 30, 1653–1668. [Google Scholar] [CrossRef]
- Levidow, L.; Zaccaria, D.; Maia, R.; Vivas, E.; Todorovic, M.; Scardigno, A. Improving water-efficient irrigation: Prospects and difficulties of innovative practices. Agric. Water Manag. 2014, 146, 84–94. [Google Scholar] [CrossRef]
- He, S.; Guo, S.; Yin, J.; Liao, Z.; Li, H.; Liu, Z. A novel impoundment framework for a mega reservoir system in the upper Yangtze River basin. Appl. Energy 2022, 305, 117792. [Google Scholar] [CrossRef]
- Karmaoui; Moumane, A.; Elmotawakkil, A. Satellite-based monitoring of irrigation expansion in Morocco’s pre-Saharan zone: the Wadi Guir Basin case, Mediterr. In Geosci. Rev.; 2026. [Google Scholar] [CrossRef]
- Ramesh, P.; Kailasam, C.; Srinivasan, T. Performance of Sugarcane (Saccharum officinarum L.) Under Surface Drip, Sub Surface Drip (Biwall) and Furrow Methods of Irrigation. J. Agron. Crop Sci. 2008, 172, 237–241. [Google Scholar] [CrossRef]
- Namdarian, D.; Naseri, A.; Nasab, S.; Almani, M. Effect of Subsurface Drip and Furrow Irrigation System on Growth and Yield Indices in Sugarcane Cultivation. 2019. [Google Scholar] [CrossRef]
- Burnett, M.; Hanzen, C.; Whitehead, A.; O’Brien, G.; Downs, C. Potential for a commercial inland fishery or just another water storage facility at Spring Grove Dam, KwaZulu-Natal, South Africa? Afr. J. Aquat. Sci. 2024, 49, 145–158. [Google Scholar] [CrossRef] [PubMed]
- Nugraha, H.; Wulandari, D.; Suharyanto, S. Analysis of Initial Impoundment Using the F.J. Mock Flow Discharge Model at Pamukkulu Dam. TEKNIK 2025, 46, 144–153. [Google Scholar] [CrossRef]
Figure 1.
Study location area (Source: TWWSDSE).
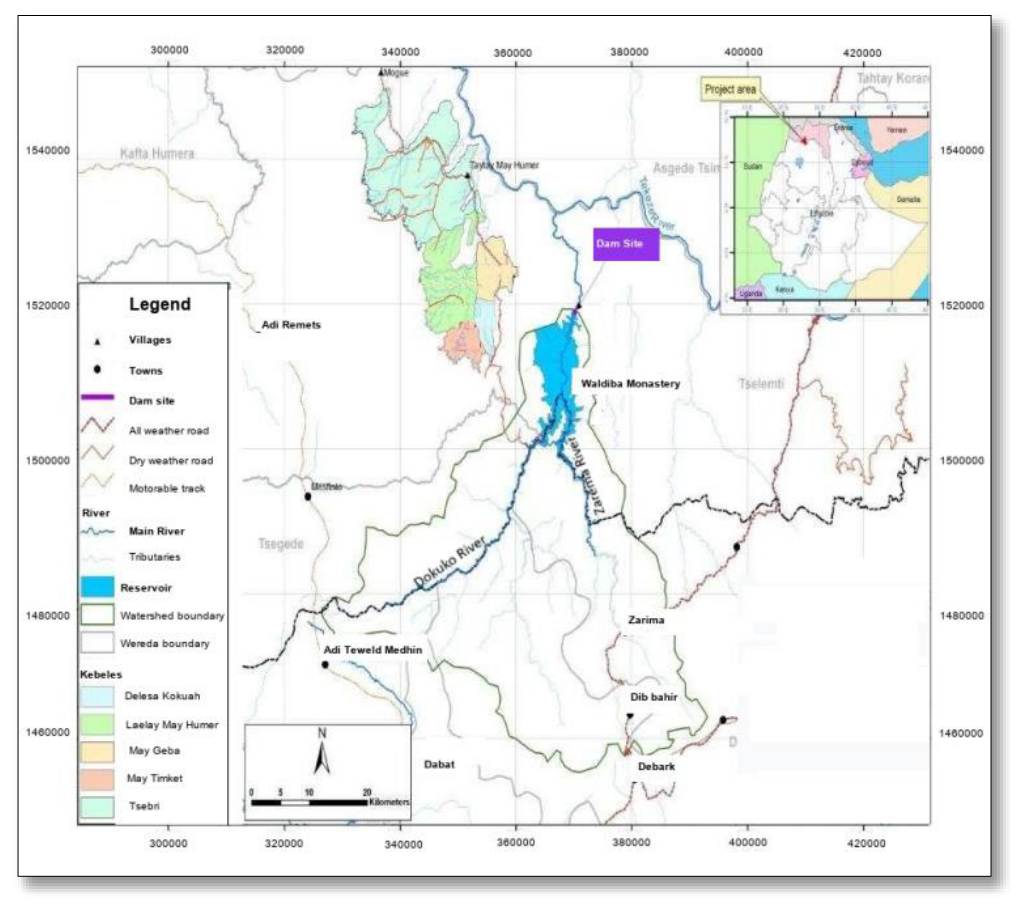
Figure 2.
HEC-ResSim Architecture & Network Topology.
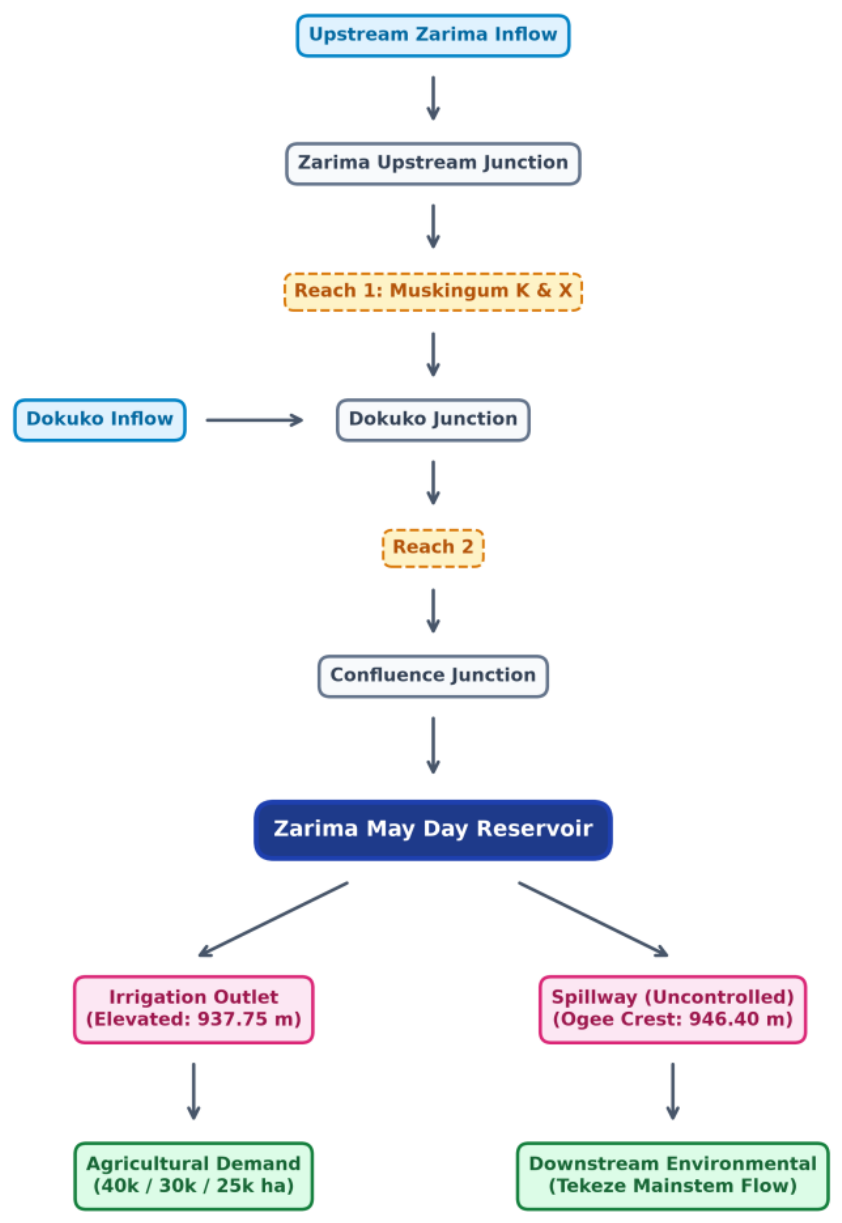
Figure 3.
Integrated methodology and Operational Workflow.
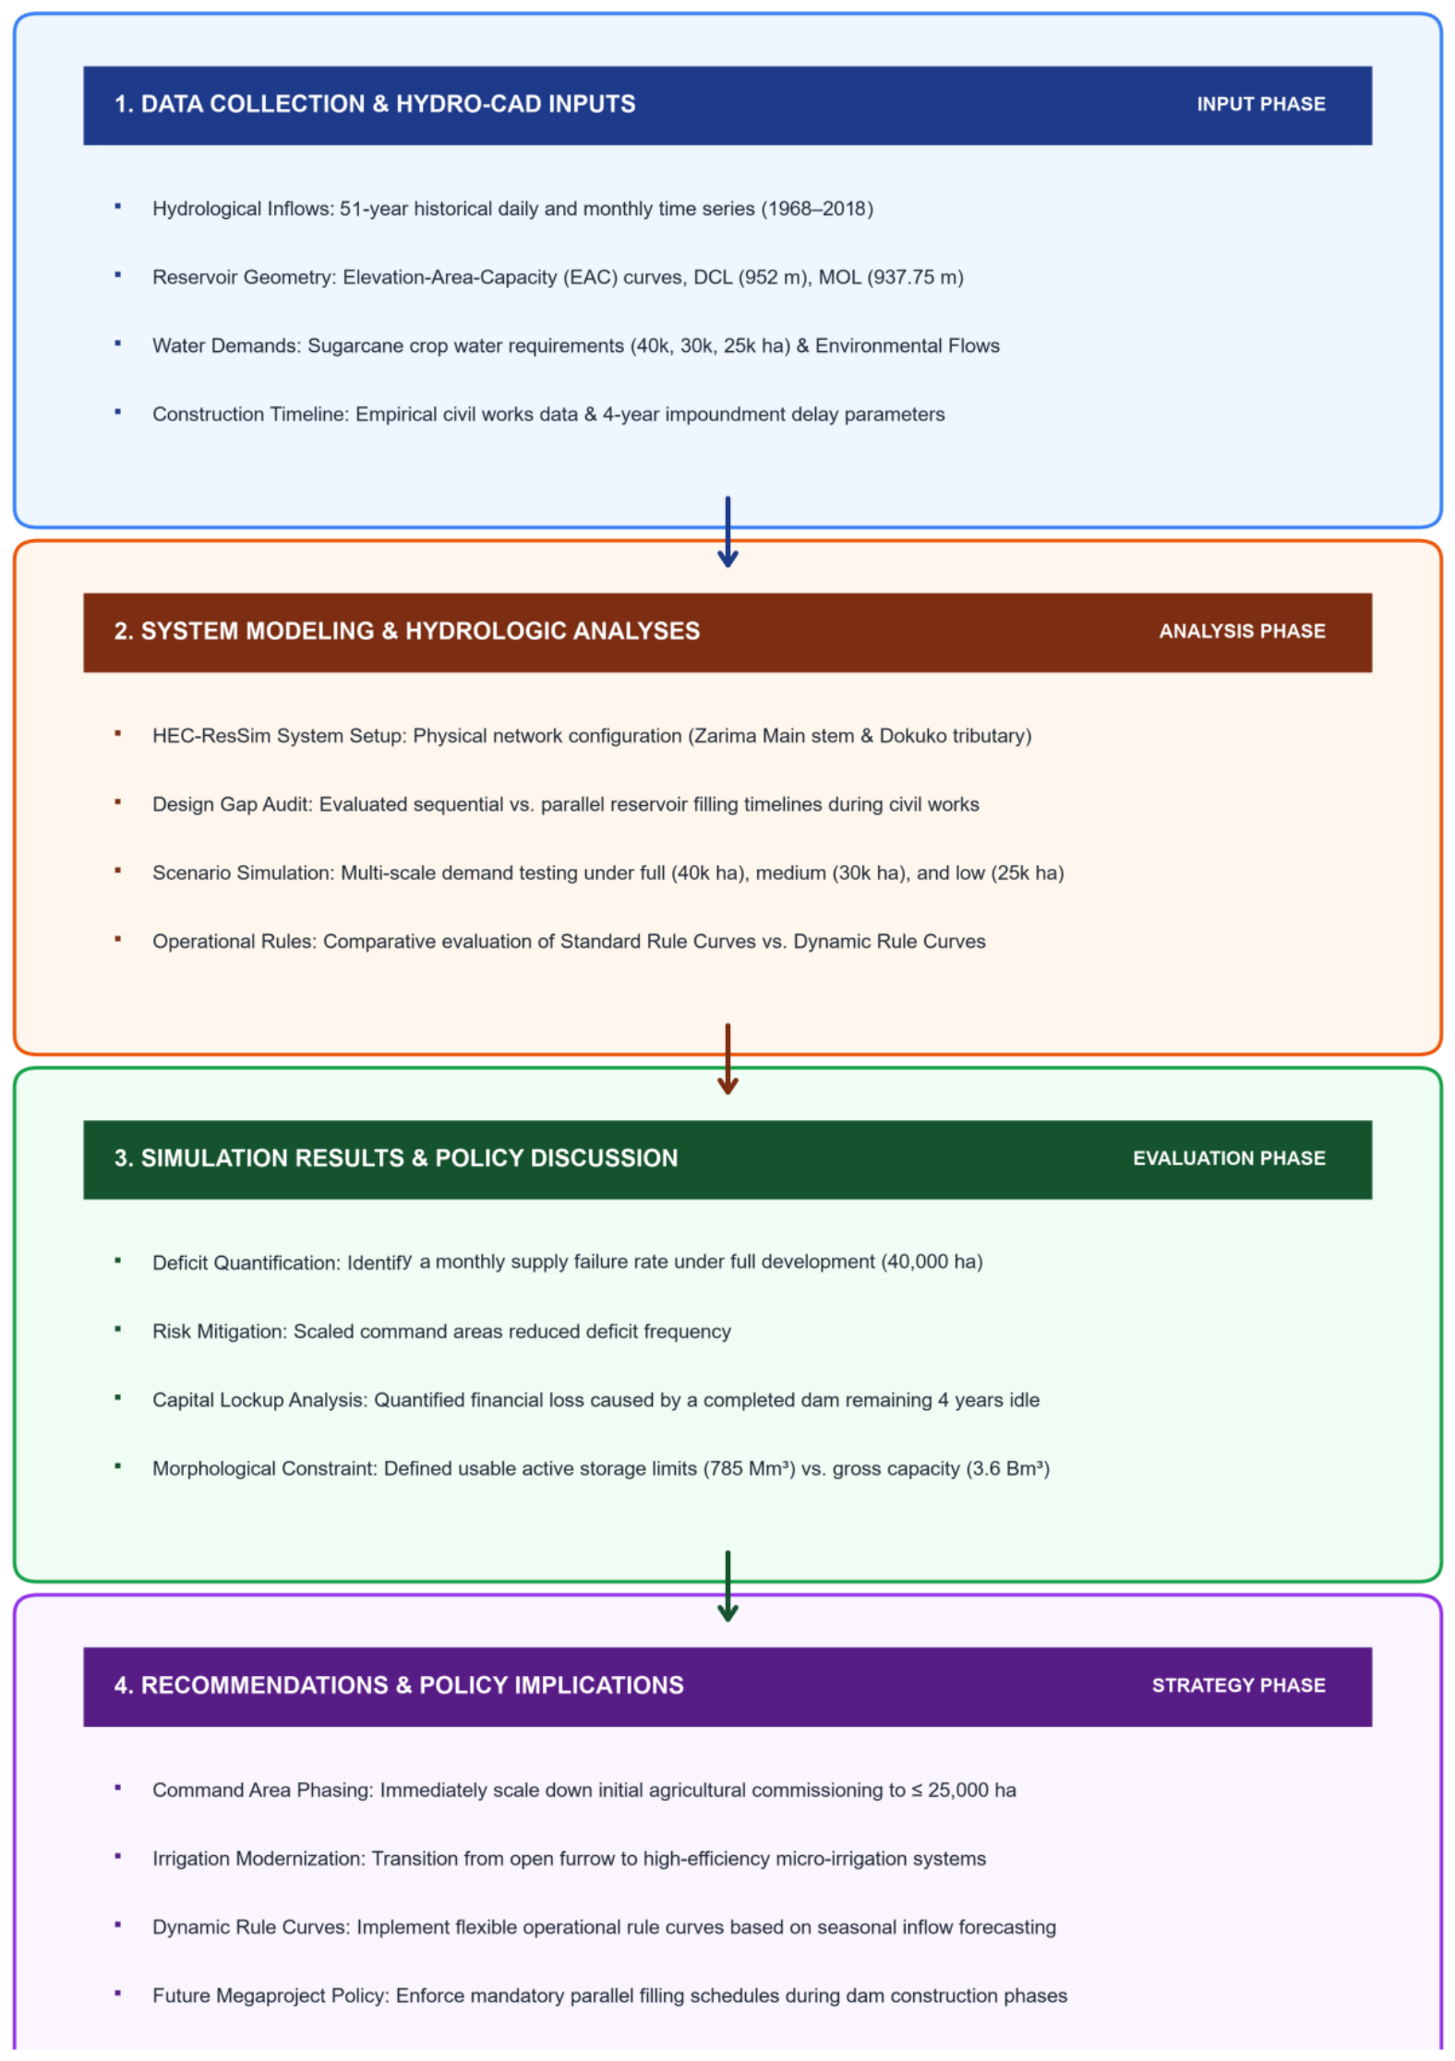
Figure 4.
Monthly inflow distribution normal verses drought hydrology.
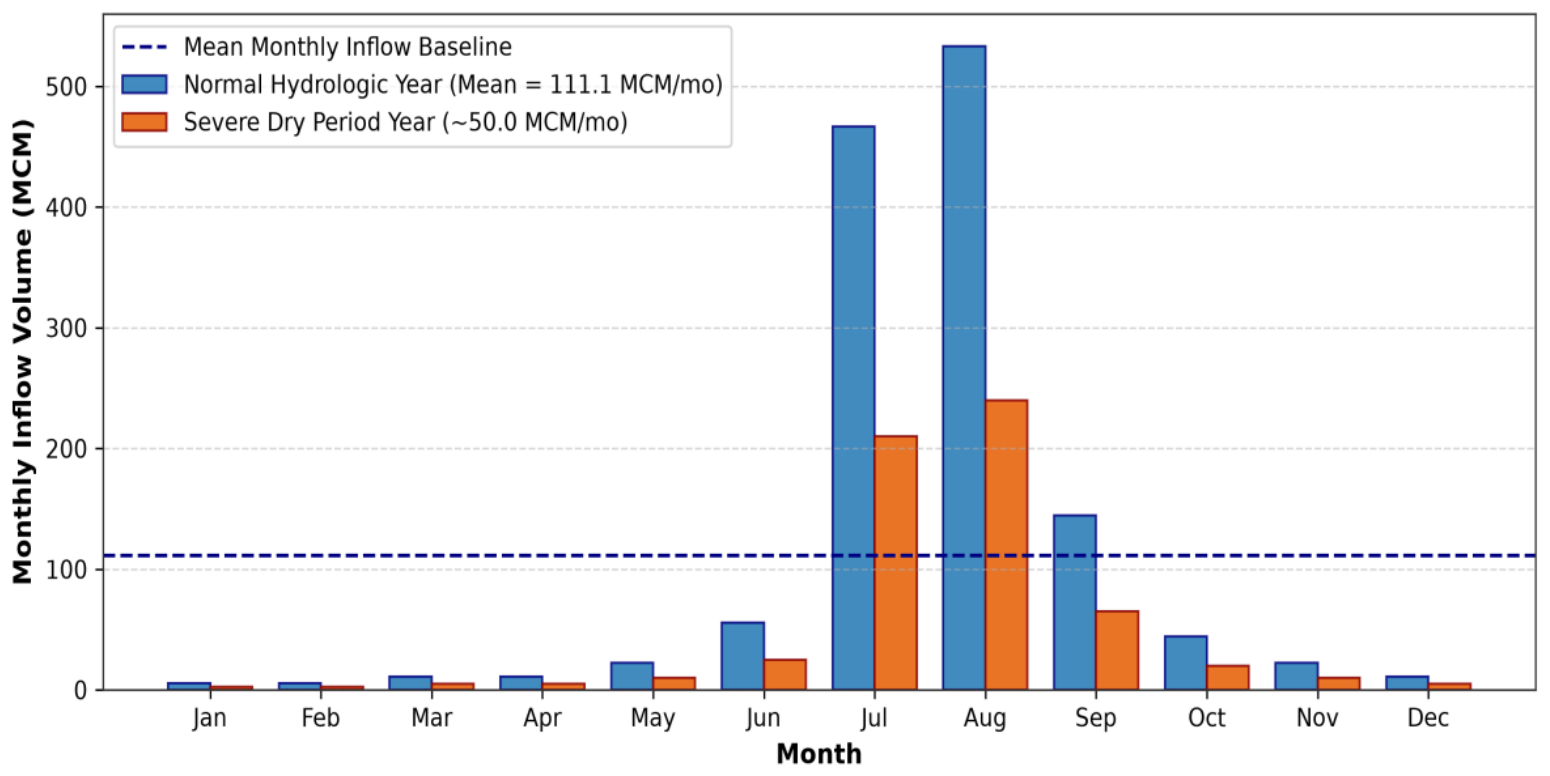
Figure 5.
Elevation–Area–Capacity (EAC) evaluations and volumetric partitioning analyses.
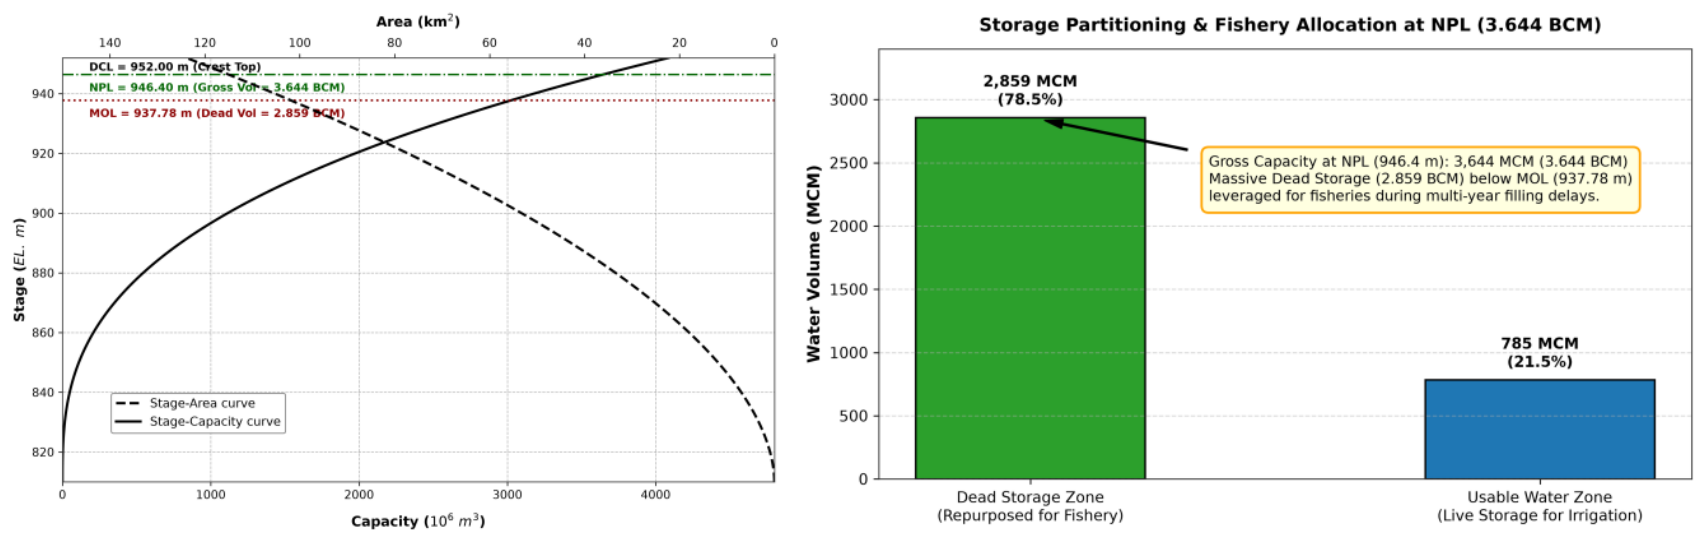
Figure 6.
Engineering cross-section profile of Zarima-Mayday Dam & Elevation Intake.
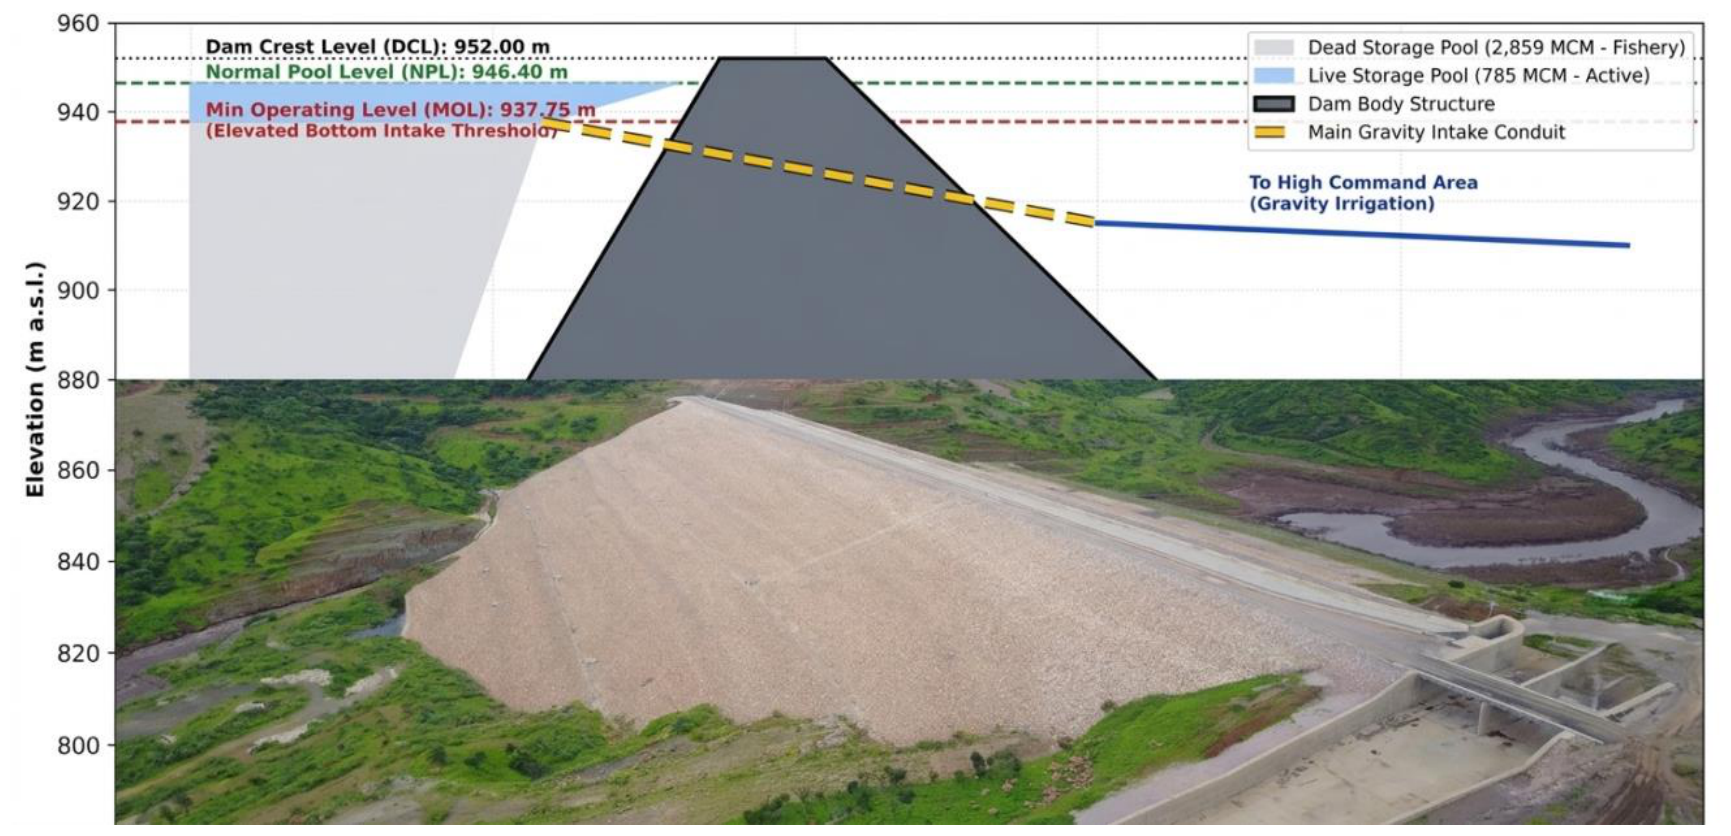
Figure 7.
4-Year dry period simulation and idle infrastructure.
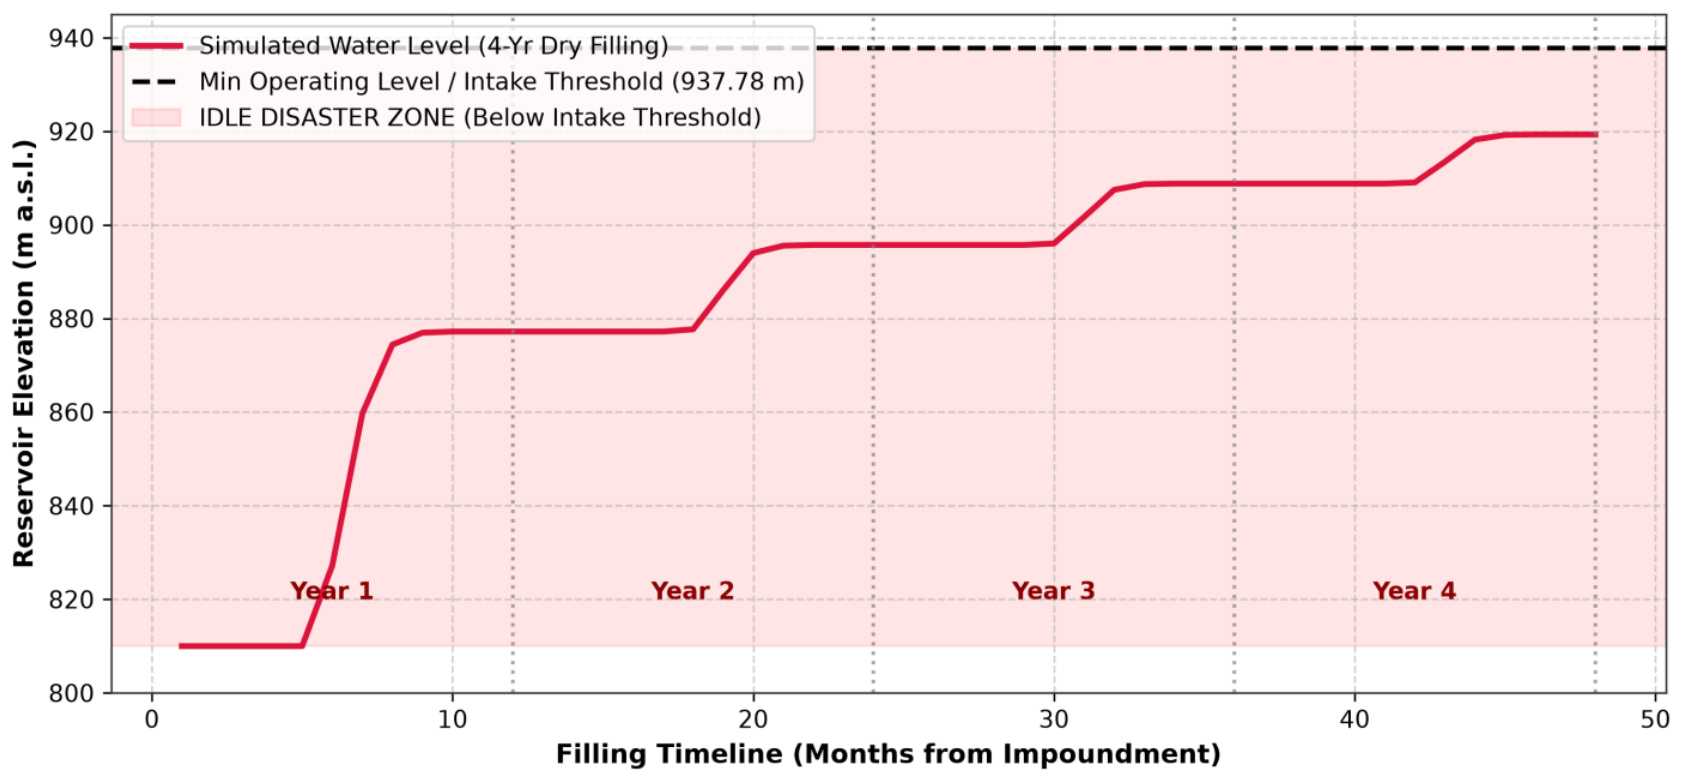
Figure 8.
Comparative Monthly Irrigation Deficit Frequency across Scenarios.
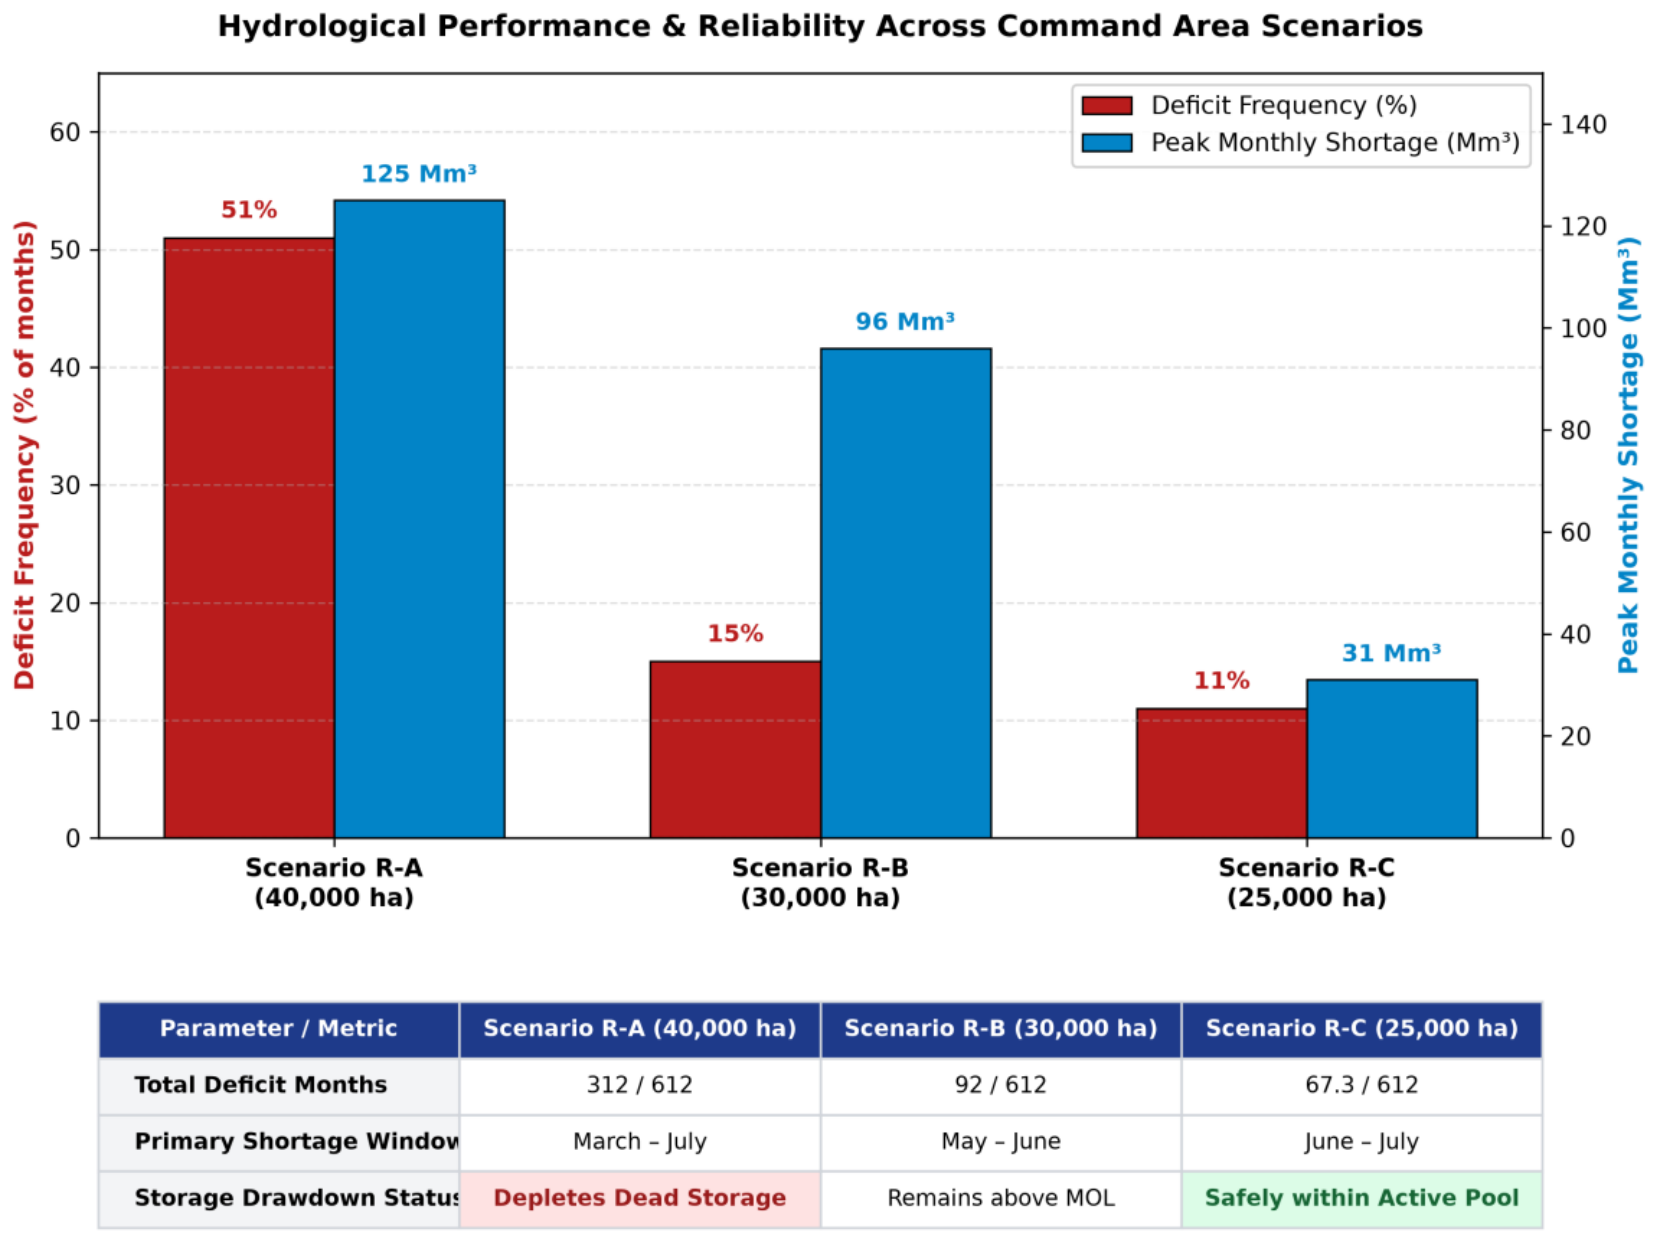
Figure 9.
Dynamic Rule Curve (DRC) Operations versus Balance.
Figure 10.
Comparative monthly irrigation deficit frequency across strategies.
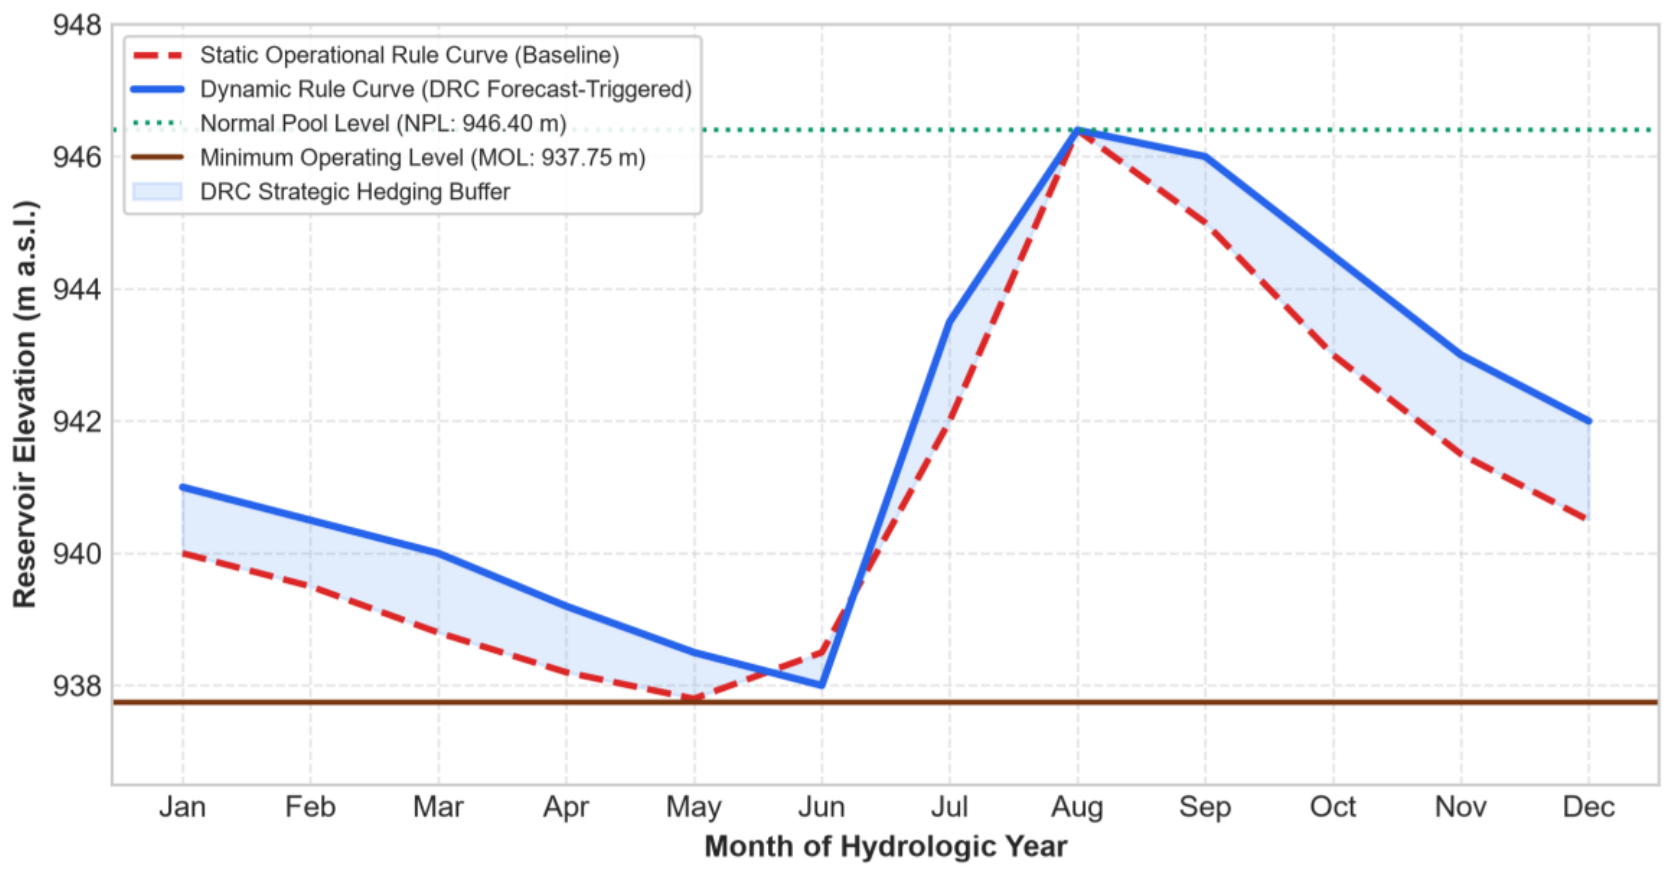
Figure 11.
Comparative performance evaluations of adaptive operational strategies.
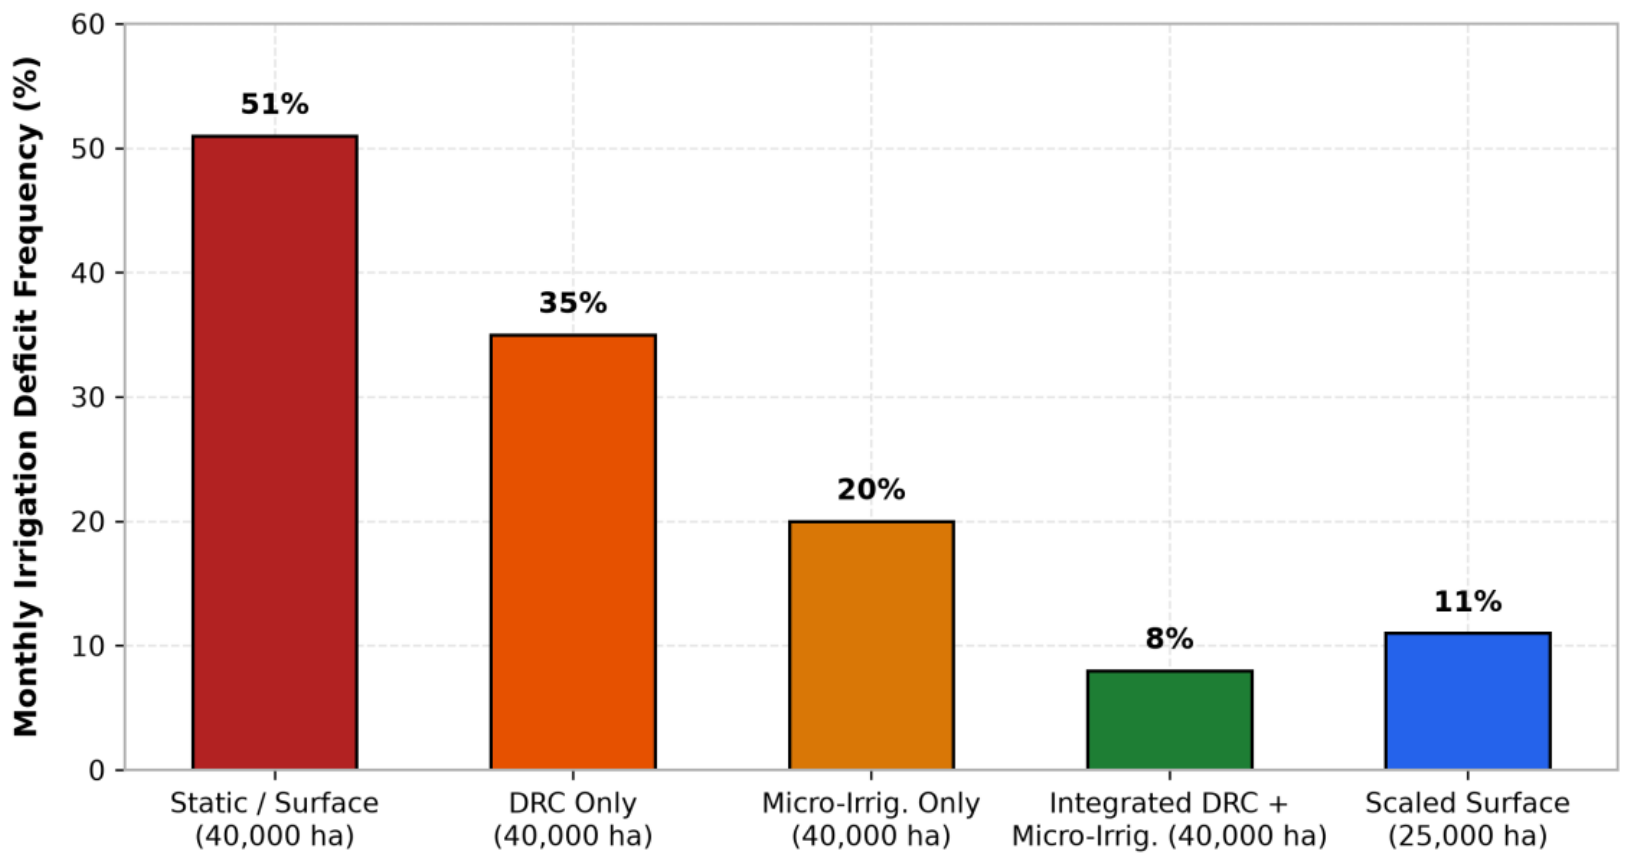

Table 1.
Quantitative Performance Synthesis of Adaptive Reservoir Strategies.
| Strategy Configuration | Command Area (ha) | Monthly Deficit Frequency (%) | Peak Monthly Shortage (Mm³) | Active Storage Vulnerability | Volumetric Reliability (Dv) |
|---|---|---|---|---|---|
| Baseline (Static + Surface) | 40,000 | 51% | 126 | Severe (Depletes Active & Inactive) | 63% |
| Option 1: DRC Only | 40,000 | 35% | 86 | Moderate (Frequent MOL breaches) | 72% |
| Option 2: Micro-Irrigation Only | 40,000 | 20% | 46 | Low (Maintains Storage > MOL) | 93% |
| Integrated Policy (DRC + Micro-Irrig.) | 40,000 | 8% | 18 | Minimal (Full Active Pool Cushion) | 98% |
| Scaled Baseline (Static + Surface) | 25,000 | 11% | 25 | Low (Remains above MOL) | 95% |
Disclaimer/Publisher’s Note: The statements, opinions and data contained in all publications are solely those of the individual author(s) and contributor(s) and not of MDPI and/or the editor(s). MDPI and/or the editor(s) disclaim responsibility for any injury to people or property resulting from any ideas, methods, instructions or products referred to in the content. |
© 2026 by the authors. Licensee MDPI, Basel, Switzerland. This article is an open access article distributed under the terms and conditions of the Creative Commons Attribution (CC BY) license (http://creativecommons.org/licenses/by/4.0/).
Copyright: This open access article is published under a Creative Commons CC BY 4.0 license, which permit the free download, distribution, and reuse, provided that the author and preprint are cited in any reuse.


