
Submitted:
31 July 2026
Posted:
04 August 2026
You are already at the latest version
Abstract
Traditional calcium (Ca²⁺) imaging analysis often overlooks the non-stationary temporal complexity inherent in retinal circuits, reducing dynamic signals to static descriptors. In this study, we implement a transformative framework integrating continuous wavelet analysis with unsupervised machine learning to decode the rhythmic functional signatures of retinal neurons and Müller glial cells (MGCs) across avian and human models. We identify distinct operational subpopulations for neuronal and glial clusters that serve as the fundamental building blocks for retinal light processing in terms of Ca²⁺ mobilization under physiological conditions after blue light stimulation.Our results reveal a stark operational dichotomy dictated by cluster-specific kinetic regimes. Retinal neurons function as high-fidelity "digital" processors, exhibiting immediate phase-resetting and transitioning from a stochastic basal state into a centralized pacemaker hierarchy led by a stable homeostatic core. In contrast, Müller glial cells emerge as "analog" metabolic integrators, maintaining a decentralized autonomous mosaic. This glial network utilizes its kinetic heterogeneity to process the light stimulus across staggered temporal windows. We propose that this glial response is driven by a regulatory mechanism involving intrinsic opsin-dependent cascades (Opn3/Opn5). Notably, the first-time characterization of human-specific ultra-slow rhythms (>100 s) in the human MIO-M1 cell line highlights an increased kinetic complexity in the human model. These findings establish that retinal identity is fundamentally rhythmic and cluster-dependent, providing a novel benchmark for understanding how the healthy retina maintains functional integrity through calibrated network strategies.
Keywords:
Müller glial cells
; calcium dynamics
; retinal cells
; light responses
1. Introduction
The vertebrate retina is a highly specialized, laminated structure of the central nervous system capable of processing complex visual and non-visual photic information [1]. This vertical circuit is organized into three distinct cellular layers: the Outer Nuclear Layer (ONL), containing classical rod and cone photoreceptors; the Inner Nuclear Layer (INL), comprising interneurons (bipolar, horizontal, and amacrine cells) alongside the cell bodies of radial Müller glial cells (MGCs); and the Ganglion Cell Layer (GCL), populated by retinal ganglion cells (RGCs) and displaced amacrine cells [1] . For decades, retinal phototransduction was assumed to follow a strict hierarchical flow initiated exclusively by rod and cone hyperpolarization in the ONL. However, contemporary neurobiology has fundamentally rewritten this paradigm by establishing that the inner retina possesses autonomous light-sensing capabilities by non-visual opsins expression. In the vertebrate inner retina, light detection within the blue and ultraviolet spectrum is governed by an integrated network of specialized photodetectors as melanopsin (Opn4), encephalopsin (Opn3) and neuropsin (Opn5) [1].
In both intrinsically photosensitive RGCs (ipRGCs) and developing horizontal cells, light-driven activation of Opn4 initiates a depolarizing signaling cascade coupled to a Gq/PLC/IP3 pathway [2,3,4,5]. This biochemical sequence triggers intracellular Ca2+ mobilization and the opening of membrane transient receptor potential canonical (TRPC) channels [2,5,6]. Beyond this rhabdomeric-type scheme, certain mammalian ipRGC subtypes also utilize ciliary-like mechanisms mediated by cyclic nucleotide-gated channels [7]. The coexistence of these parallel pathways underscores a profound deep operational heterogeneity in inner retinal photodetectors [1].
The structural and cellular complexity of the inner retinal non-visual photodetector matrix is significantly amplified by the complementary, heterochronic expression of Opn3 [8,9,10] and Opn5 [11,12]. While Opn3 functions primarily within the blue range of the visible spectrum [8], Opn5 acts as an evolutionarily conserved, ultraviolet (UV)-sensitive bistable photopigment coupled to Gi/o-protein signaling pathways [13,14]. In mammalian and avian retinas, both opsins exhibit an overlapping topographical distribution, mapping extensively throughout the GCL, the INL, and plexiform plexuses from early embryogenesis (E7–E10) into maturity [9,14,15]. Crucially, this non-visual opsin framework is not confined to neuronal lineages; it extends directly to glial cells. Primary cultures of avian MGC and the immortalized human MGC line MIO-M1, natively co-express Opn3 and Opn5 proteins [9,16]. In these macroglial systems, photic activation of Opn3 and Opn5 induces multi-scale biochemical shifts driven by de novo protein synthesis, downstream modulation of cyclic adenosine monophosphate (cAMP), and G-protein-mediated release of intracellular Ca2+ from internal endoplasmic reticulum stores [9,17]. Rather than driving uniform excitatory responses, the parallel operation of these non-visual opsins promotes long-lasting, highly heterogeneous intracellular Ca2+ dynamics. This specialized molecular arrangement empowers macroglial populations to generate multifaceted metabolic and kinetic states, structurally separating their temporal signaling languages from classical, fast neuronal circuits.
In this context, retinal neurons are characterized by fast variations in Ca2+ activity, operating on rapid timescales. Conversely, Müller glial cells (MGCs) operate within a slow dynamic regime, generating complex, non-linear Ca2+ signals that evolve over timescales ranging from seconds to minutes. A core challenge in experimental characterization is the strong phenotypic heterogeneity inherent in these Ca2+ behaviors [16,17,18]. In neuronal and MGCs primary cultures, phenotypic heterogeneity and light environmental variations manifest as complex shifts in Ca2+ trace morphology rather than uniform changes in mean amplitude. For this reason, improved culture clusterization can be achieved following kinetic parameters such as oscillation duration, frequency, and the fraction of active cells triggering independent events, rather than relying on a single summary value. [19,20].
To resolve the non-stationary complexities of inner retinal Ca2+ dynamics, an analytical framework capable of extracting time-varying features is essential. Biological Ca2+ signaling is inherently non-stationary; live-cell imaging recordings frequently present decaying amplitude envelopes, photobleaching artifacts, and non-linear baseline shifts that mathematically confound traditional frequency-domain operations, such as the Fast Fourier Transform (FFT) [21]. Classical algorithms routinely collapse multi-scale temporal recordings into static mean values, effectively masking critical, localized signaling alterations. Conversely, the continuous wavelet transform (CWT) framework provides exceptional time-frequency localization tailored for dynamic biological time-series [21]. By mapping individual cellular trajectories, this wavelet-based approach isolates high-resolution features of instantaneous amplitude, period, and phase. When coupled with downstream unsupervised machine learning, the extraction of these time-resolved wavelet ridges yields a robust analytical pipeline to quantify cellular functional heterogeneity and map the underlying topologic logic of neuro-glial networks.
In this study, we leveraged the computational platform pyBOAT to systematically characterize inner retinal Ca2+ dynamics triggered by blue light stimulation recorded by Ca2+ imaging via confocal laser scanning microscopy [21]. By deploying an unsupervised hierarchical clustering model fed directly with time-resolved features extracted via continuous wavelet transform (CWT) analysis, we achieved a rigorous mathematical classification of distinct cellular sub-populations. This wavelet-based pipeline, coupled with advanced directional phase-coupling network modeling, allowed us to directly contrast the kinetic signatures of embryonic chicken retinal neurons, primary chicken MGCs cultures, and the human-derived MGC line MIO-M1. We hypothesized that the differential expression and distinct signaling cascades of novel non-visual opsins within the inner retina dictate cell-type-specific temporal architectures. Our findings uncover a structured, directed hierarchical topology in developing neuronal circuits, quantify an unprecedented degree of functional mosaicism and rhythmic acceleration in primary macroglia, and identify critical evolutionary and model-specific variations stating how these retinal populations translate non-visual photodetection into functional calcium signatures.
2. Results
2.1. Comparative Symmetrical Assessment of Neuro-Glial Architectures
2.1.1. Embryonic Chicken Retinal Neurons
- Rhythmic Identity and Temporal Calcium Dynamics
Unsupervised Uniform Manifold Approximation and Projection (UMAP) embedding coupled with agglomerative hierarchical clustering resolved the embryonic chicken retinal neuron landscape (N=194) into four functionally segregated operational clusters (Figure 1A). The numerical distribution identifies Cluster 0 (40.7%) as the dominant subpopulation, flanked by Cluster 1 and Cluster 2 (18.0% each) followed by Cluster 3 (23.2%) (Figure 1B). The population exhibits a functional divergence threshold at a strict linkage distance of approximately 35 (Figure 1C).
- Operational Clusters and Multi-Phasic Kinetics in Embryonic Retinal Neurons
The integration of continuous temporal signals (Figure 1D), period-over-time trajectories (Figure 1E and Figure 2A), and time-domain amplitude curves (Figure S1B) reveals that embryonic chicken retinal neurons (N=194) operate through highly responsive, Ca2+ multi-phasic kinetics.
- ○
- Cluster 0: This subpopulation serves as the primary metabolic and rhythmic stabilizer of the circuit, representing 40.7% of the total population. It exhibited the most stable oscillatory profile, with negligible period variance across all experimental phases and no significant changes during either the early post-stimulus window or the late recovery phase (p>0.05; Figure 2A). This homeostatic stability is confirmed by a steady period trajectory constrained at a ∼40 s baseline, lower spectral power, and a recovery delta near zero (Figure 1E and Figure 2A). Its amplitude profile is characterized by a stable, moderate-intensity oscillation (∼0.24–0.28 AU) preserved uniformly throughout the entire recording timeline, while its wavelet spectrogram demonstrates a consistent low-frequency spectral band (Figure S1B,E).
- ○
- Cluster 1: This cohort maintains a baseline-like periodicity immediately following the light pulse but manifests a pronounced, delayed period contraction during the late recovery phase (p<0.05; Figure 2A). This late-onset kinetic acceleration is highlighted by a significantly negative recovery delta in the parametric fingerprints (Figure 2C). In the time domain, Cluster 1 is distinguished by a progressive increase in rhythmic amplitude, which reaches its maximum peak (∼0.30 AU) precisely during the late recovery phase, suggesting its role in sustained circuit recalibration (Figure S1B).
- ○
- Cluster 2: Operating as a high-sensitivity sensor, this cohort displays a marked period elongation immediately upon blue light exposure, driving its continuous period curve to a sharp, transient peak of ∼70 s post-stimulus (p<0.001). This acute kinetic deceleration is validated by an elevated activation ratio in the parametric violin plots (Figure 2C). In the time domain, Cluster 2 exhibits high-frequency, synchronized amplitude bursts immediately following the light pulse, subsequently stabilizing at a lower regime (∼0.22–0.26 AU) (Figure S1B).
- ○
- Cluster 3: This subpopulation defines the circuit’s primary energy response, characterized by high baseline power and a highly volatile period trajectory. It exhibits a massive absolute energy response following stimulation, as evidenced by its dominant and highly significant Early Power Activation (p<0.001; Figure 2C). Its amplitude dynamics reveal a massive energetic envelope with a broad high-intensity peak (∼0.32 AU) that decays slowly (Figure S1B). Group-specific wavelet spectrograms confirm a broad, high-energy spectral expansion securely confined within the Cone of Influence (COI), ensuring the technical integrity of these photic responses (Figure S1E).
- Functional Logic and Network Organization
The inter-cluster violin plots delineate the specific kinetic signatures that define neuronal functional identity within the circuit (Figure 2A). Cluster 3 emerges as the primary energetic responder, exhibiting a significantly higher Early Activation Power signature compared to the stable backbone of Cluster 0 (p<0.001). This energetic shift is complemented by the specialized kinetic roles of Cluster 2, which shows the highest Activation Ratio due to its acute light-induced period elongation, and Cluster 1, which is distinguished by a significantly negative Recovery Delta reflecting its late-stage rhythmic acceleration. These discrete parametric profiles confirm that the neuronal network utilizes task-specific subpopulations to partition immediate photic energy processing from long-term homeostatic recalibration.
- Collective Coordination and Directed Interaction Architecture
The neuronal network organization is defined by an instantaneous transition from basal stochastic independence to a rigid, centralized directed hierarchy (Figure 2D). Modeling the underlying directed architecture (ΔΦ) revealed that in the dark basal state, neurons behave as independent uncoupled oscillators (p>0.05), showing no evidence of stable organized interactions (Figure S1D). The photic pulse triggers a highly coordinated phase-resetting event: in the early post-stimulus phase, a clear directed cascade emerges where Cluster 1 leads Cluster 0 (ΔΦ=0.77; p=0.0005), which simultaneously leads Cluster 3 (ΔΦ=1.23; p=0.0005), while Cluster 3 establishes leadership over Cluster 2 (ΔΦ=0.91; p=0.011). By the Late recovery phase, the circuit undergoes a structural reorganization into a consolidated pacemaker topology. In this stage, Cluster 0 solidifies its role as the master pacemaker, establishing powerful directed leadership over both Cluster 1 (ΔΦ=0.68; p<0.001) and Cluster 2 (ΔΦ=0.69; p<0.001) (Figure 2D and Figure S1D). This centralized processing logic is corroborated by the cluster-specific Internal Synchronization trajectories (R), where internal coherence across most clusters rises from low basal levels (R≤0.30) to sustained peaks approaching R≈0.5–0.6 in the late phase (Figure 2B). This significant rise in coherence matches the temporal window of pacemaker consolidation, suggesting that light stimulation forces individual stochastic neural nodes into highly locked, collective phase channels to maintain circuit-wide rhythmic integrity.
- Technical Validation and Wavelet Resolution
Refined feature importance analysis, which identified cv_freq_basal and mean_period_late as the primary discriminators of neuronal functional identity (Figure S1A). The architectural integrity of the neuronal model was verified through peak Silhouette scores at N=4 validated via Silhouette and Davies-Bouldin indices (Figure S1C). Finally, cluster-specific wavelet spectrograms (Figure S1E) confirm that all significant power concentrations are securely confined within the Cone of Influence (COI). The faster neuronal oscillations (∼40 s) allow for a broader spectral visibility within the recording window, ensuring that the detected phase-resetting and pacemaker transitions represent true biological synchronization events rather than spectral artifacts
2.1.2. Primary Chicken Müller Glial Cells (MGCs)
- Rhythmic Identity and Temporal Calcium Dynamics
Unsupervised UMAP embedding and hierarchical clustering mapped the primary chicken MGCs landscape (N=260) into three functionally distinct operational clusters (Figure 3A). The population distribution identifies the homeostatic core Cluster 0 (39.2%), the specialized late-reactor cluster 1 (20.8%) and Cluster 2 as dominant (40.0%) (Figure 3B).The chicken MGCs exhibit a significantly higher degree of functional heterogeneity compared to neurons, resolving their divergence at a linkage distance threshold exceeding 60 (AU) (Figure 3C). The integration of continuous temporal signals (Figure 3D), period-over-time trajectories (Figure 3E), and time-domain amplitude curves (Figure S2B) reveals that chicken MGCs utilize an “analog” integration strategy defined by a unique glial tendency to accelerate rhythmic output following photic stimulation.
- ○
- Cluster 0: This subpopulation anchors the network’s stability, maintaining a consistent period trajectory near ~75 s (Figure 3E and Figure 4A). While it serves as the stable core, it is not immune to photic energy; statistical analysis reveals a significant transient period shift during the early post-stimulus window (p=0.008; Wilcoxon Signed-Rank Test) before returning to a non-significant baseline in the late recovery phase (p>0.05). Its amplitude profile exhibits a slow-rising trend that peaks at the stimulus window (~0.375 AU) before a gradual decay, reflecting its role as a homeostatic buffer (Figure S2B).
- ○
- Cluster 1: This sub-population is distinguished by a unique, progressive rhythmic reconfiguration. Following the light pulse, it undergoes a significant period elongation in the early phase, followed by a sustained acceleration. This long-term kinetic shift is confirmed by highly significant period changes in both early (p<0.001) and late (p=0.001) phases (Figure 4A). In the time domain, Cluster 1 exhibits a “spike-and-plateau” amplitude singularity: it is characterized by an extreme initial amplitude spike (peaking >2.5 AU) immediately upon stimulation, which rapidly decays into a sustained, high-intensity plateau (~0.5 AU) that persists throughout the recovery phase.
- ○
- Cluster 2: Functioning as the primary kinetic responder, this subpopulation demonstrates a significant and statistically robust period contraction from a basal ~70 s down to ~30 s in the late phase (Figure 3E and Figure 4A). This acceleration is highly significant for both the early (p=0.042) and late recovery segments (p<0.0001). Its amplitude profile is highly dynamic, showing a defined peak (~0.33 AU) that directly coincides with its maximum rhythmic acceleration, marking this cluster as the key node for rapid glial adaptation to light stimulus (Figure S2B).
- Functional Logic and Network Organization
Inter-cluster violin plots quantify the distinct functional fingerprints that define the operational roles within the primary macroglial network (Figure 4C). Cluster 0 maintains the highest Early activation Power (p<0.001), establishing the robust metabolic foundation that anchors the circuit’s immediate response to photic energy. In contrast, Cluster 1 is distinguished by its specialized role in sustained, long-term metabolic integration; this subpopulation exhibits a unique Activation Ratio and a significantly high Recovery Delta period (p<0.001 vs. Cluster 2), reflecting a profound rhythmic reconfiguration that persists throughout the recovery phase. Cluster 2 serves as the circuit’s primary dynamic responder, characterized by its extreme kinetic flexibility. Although its initial energetic signature is nearly equivalent to that of Cluster 0, Cluster 2 is uniquely defined by its wide functional range for acceleration. This subpopulation drives the network’s most marked rhythmic shifts, undergoing a rapid period contraction that shifts its oscillatory output from a slow basal state toward a highly accelerated regime post-stimulus. These discrete parametric profiles confirm that the macroglial circuit partitions light-processing tasks into specialized metabolic and kinetic windows
- Collective Coordination and Directed Interaction Architecture in Primary MGCs
The macroglial network organization is fundamentally decentralized, operating as an autonomous mosaic that avoids the rigid leadership structures typical of neuronal circuits. By Modeling the underlying architecture of the directed network using the Phase Difference (ΔΦ) between clusters, no signs of stable, organized interactions were observed under dark basal conditions, due to an insufficient number of simultaneously active segments a state consistent with the dispersed organization of primary MGCs in vitro (Figure 4C and Figure S2D). Following the blue light pulse, the glial population did not transition into a persistent centralized pacemaker topology, but rather into a state of transient synchronization followed by differential recovery. In the early post-stimulus phase, a loose and decentralized coupling structure emerged where Cluster 2 acted as a weak, transient leader, directing both Cluster 0 (ΔΦ=0.35;p<0.001) and Cluster 1 (ΔΦ=0.78;p<0.001) (Figure 4D). The transition to the Late recovery phase reveals a critical divergence in network integration: while the initial hierarchy dissolves, Cluster 1 undergoes a directed recovery driven by the homeostatic core. In this segment, Cluster 0 establishes a significant residual leadership over Cluster 1 (ΔΦ=0.84;p<0.05), effectively “pulling” this subpopulation back into a coordinated phase regime (Figure 4C, right). In contrast, Cluster 2 fails to maintain collective coherence and becomes functionally decoupled from the core; the absence of directed information from Cluster 0 (p>0.05) suggests that these active sensor nodes return to an autonomous, uncoupled state. This decentralized logic is further corroborated by the cluster-specific Internal Synchronization trajectories (R), where internal coherence remains in a low-to-moderate regime (typically R<0.5), contrasting with the sharp phase compression of neurons (Figure 2B and Figure 4B). This suggests that Müller cells utilize local rhythmic integration as a protective mechanism to staggered metabolic demands.
- Technical Note on Wavelet Resolution and COI: The “slow transient” nature of these glial rhythms (periods of 75–90 s) within a 250 s recording window results in a more restrictive COI compared to neuronal models. This characteristic suggests that MGCs operate in a regime of ultra-slow calcium dynamics, where the analysis of wavelet ridges is essential to distinguish real biological oscillations from technical drift (Figure S2C).
- Technical Validation
Clustering architecture was validated at N=3 was verified through silhouette score and Davies-Bouldin indices (Figure S2C) using refined feature importance, which identified cv_freq_basal and cv_period_basal as the primary discriminators of glial identity (Figure S2A). The technical integrity of these multi-scale rhythms is corroborated by wavelet spectrograms (Figure S2E), confirming that the detected period contractions and elongated recovery phases are securely confined within the COI.
2.1.3. Human Müller Cell Line (MIO-M1)
- Rhythmic Identity and Temporal Calcium Dynamics
Sorting the cohorts by numerical density identifies Cluster 0 as the primary stable pool (36.9%), the inert Cluster 1 (20.5%), followed by the reactive Cluster 2 (26.7%), and the highly energetic Cluster 3 (15.9%) (Figure 5A). The UMAP feature space reveals a highly distinct demarcation for the human-derived immortalized Müller cell line (N=195), which partitions into four clear functional subpopulations (Figure 5B). The agglomerative tree resolves these boundaries at an extended hierarchical linkage distance of approximately 60, reflecting substantial kinetic heterogeneity (Figure 5C). The integration of continuous temporal signals (Figure 5D), period-over-time trajectories (Figure 5E and Figure 6A), and time-domain average amplitude curves (Figure S3B) reveals that human MIO-M1 cells utilize a sophisticated kinetic strategy defined by the capacity to sustain ultra-slow biological rhythms (>100 s).
- ○
- Cluster 0: This variant serves as the primary metabolic stabilizer of the network. It exhibits a significant transient period sensitivity immediately following the light pulse—tracking a brief period elongation (p<0.001) before executing a mathematically precise homeostatic reversal to baseline during the late recovery phase (Figure 5E and Figure 6A). Its amplitude profile is characterized by a stable, moderate-intensity regime (∼0.22–0.28 AU), ensuring a consistent calcium flux that supports baseline retinal physiology (Figure S3B).
- ○
- Cluster 1 : Functioning as a highly stable, inert reservoir, this population maintains a steady rhythmic baseline and remains statistically unchanged across all experimental phases (p>0.05; Figure 6A). Beyond its temporal stability, its amplitude dynamics reveal a gradual, sustained sigmoidal rise peaking near ∼0.34 AU, suggesting it acts as a long-term metabolic effector that stores and slowly releases signaling potential to maintain network tone (Figure S3B).
- ○
- Cluster 2 : This cohort displays severe and persistent period alterations across both the early post-stimulus and late recovery windows (p<0.001; Figure 6A). The continuous wavelet spectrogram reveals a persistent gain of power anchored in ultra-slow frequency bands, indicating a chronic shift in rhythmic identity induced by photic stress (Figure S3E). In the time domain, Cluster 2 is distinguished by an acute early amplitude spike (∼0.31 AU) followed by a rapid, exponential decay, a signature of rapid energy expenditure typical of “active sensor” nodes (Figure S3B).
- ○
- Cluster 3: Defining the extreme reactive profile of the human model, this subpopulation exhibits an absolute extreme early activation power signature (>34), significantly outperforming all other clusters (p<0.001; Figure 6A). Most notably, its amplitude curve reveals a high-intensity envelope peaking at ∼0.45 AU the highest intensity recorded in the study which coincides with its stable basal period of ∼110 s (Figure 5D and Figure 6A). The subsequent precipitous period contraction down to ∼40 s (p<0.001) confirms a late-onset dynamic reconfiguration, positioning Cluster 3 as the primary hub for managing extreme energetic demands and long-term adaptation.
- Functional Logic and Network Organization
The inter-cluster violin plots delineate a “functional fingerprint” characterized by extreme power signatures and specialized integration modes within the human glial network (Figure 6C). Cluster 3 emerges as the primary energetic responder, exhibiting an extreme Early Power (>34) that significantly outperforms all other subpopulations (p<0.001). This dominant energetic state is corroborated by the Activation and Recovery Delta metrics, which confirm that Cluster 3 drives the network’s most intense metabolic and rhythmic reconfigurations following the photic stimulus (Figure 6C). These discrete parametric profiles suggest that the MIO-M1 model utilizes highly specialized clusters to manage extreme energetic demands, potentially reflecting the increased functional complexity of human macroglia.
- Collective Coordination and Directed Interaction Architecture
The MIO-M1 network organization transitions from a disorganized basal state into a high-fidelity synchronized circuit characterized by complex, multi-hub interactions (Figure 6D). Prior to stimulation, modeling of the directed architecture (ΔΦ) revealed a system of largely uncoupled oscillators. Photic activation forces an immediate transition into a highly directed network: in the Early post-stimulus phase, leadership is dominated by Cluster 2, which exerts powerful directed control over Cluster 3 (ΔΦ=1.32; p<0.001) (Figure 6D and D). By the Late recovery phase, the network undergoes a sophisticated reorganization where Cluster 1 emerges as the central node of the hierarchy. In this stage, Cluster 1 establishes significant directed leadership over both Cluster 0 (ΔΦ=0.86) and Cluster 3 (ΔΦ=0.56), while Cluster 0 maintains secondary leadership over Cluster 2 (ΔΦ=0.81; p<0.001) (Figure 6D and D). This complex late-stage topology is corroborated by the Internal Synchronization trajectories (R), where MIO-M1 cells exhibit robust internal synchronization with coherence peaks reaching 0.6–0.8 for Clusters 0 and 1 (Figure 6B). This level of high-fidelity phase-locking is significantly higher than that observed in primary chicken MGCs, suggesting that the human cell line operates within a more integrated signaling framework, utilizing its clusters as calibrated temporal anchors to manage photic information .
- Technical Validation and Wavelet Resolution
The architectural integrity of the MIO-M1 model was verified through silhouette and Davies-Bouldin indices confirming the robustness of this four-cluster architecture (Figure S3A) and refined feature importance analysis, which identified cv_freq_basal, mean_period_basal, and mean_power_early as the primary discriminators of human glial identity (Figure S3A). The technical validity of the ultra-slow rhythms and subsequent period contractions is confirmed by cluster-specific wavelet spectrograms (Figure S3C), which demonstrate that all significant power concentrations are securely confined within the COI. This ensures that the extracted human-specific periodicities (>100 s) represent true physiological oscillations rather than spectral artifacts, validating the use of extended recording times to capture the full kinetic range of the human macroglial network.
2.2. Figures, Tables and Schemes
3. Discussion
3.1. Rhythmic Architecture and Functional Heterogeneity of the Vertebrate Retina
The implementation of continuous wavelet analysis [21] provides a robust analytical methodology for deciphering the functional landscape of the retina in response to light or other stimulation conditions. By transitioning from traditional peak-counting to time-resolved frequency and phase analysis, our study establishes that retinal functional identity is fundamentally dictated by rhythmic signatures. Our results demonstrate that neurons and MGCs deploy distinct temporal strategies to encode photic information and maintain circuit stability thereby forming an operative network with differential oscillatory behaviors and timing.
3.2. Kinetic Divergence: Fast Neuronal Resetting vs. Slow Glial Integration
Our findings reveal a fundamental divergence in the non-stationary oscillatory regimes of neurons and MGCs. Chicken neuronal populations operate within a relatively fast rhythmic window, with periods constrained between 20 and 100 seconds, characterized by immediate, high-fidelity phase-resetting upon light stimulation (Figure 1E). This aligns with the paradigm established, where neurons exhibit fast variations in Ca2+ activity linked to spike onset, whereas macroglia produce slowly varying signals (Figure 3E and Figure 5E) [22]. Indeed, MGCs exhibit a decentralized and autonomous kinetic profile. While Cluster 0 of primary chicken MGCs maintain a stable homeostatic core near ~75 s (Figure 3E), Cluster 3 of human MIO-M1 line expansion into ultra-slow rhythms exceeding 100 s (Figure 5E) highlights a specialized macroglial capacity for integrating signals across prolonged temporal windows. This ultra-slow resolution was technically supported by extended recording times (>600 s), which allowed us to mathematically mitigate the COI [21], ensuring that detected rhythms represent real biological oscillations rather than technical drift.
Unlike neurons, which fire in coordinated population waves, glial activation manifests as a mosaic of isolated clusters of activity. This granular pattern suggests that primary MGCs do not function as a synchronized syncytium but maintain autonomous kinetic trajectories. Thus, the glial circuit processes blue light through independent, staggered time windows rather than a unified collective response
3.3. Intrinsic Photosensitivity and Functional Heterogeneity Rhythmic Coding and the Dual-Mode Regulation of Müller Glial Dynamics
The rhythmic fingerprints identified in our study specifically the Cluster 2 in chicken MGCs (Figure 4C) as well in MIO-M1 cells, and the “ultra-slow”, Cluster 3, in human MIO-M1 (Figure 6C) likely emerge from two distinct but non-exclusive regulatory pathways: an intrinsic opsin-dependent phototransduction cascade) and an extrinsic, neuron-driven purinergic signaling circuit [17].
A pivotal finding of this study is the high degree of functional heterogeneity within the glia population, which challenges the classical view of MGCs as a uniform homeostatic syncytium [17]. In primary chicken MGCs, we identified a tripartite response mosaic (Figure 3A), mirroring previous reports of distinct subpopulations ranging from high-responders to non-responsive cells despite ubiquitous opsin expression [9,23]. The identification of Cluster 2 an ‘Active Sensor’ (Figure 3E) characterized by a profound light-induced period contraction (from 70 s to 30 s) likely reflects the maximum kinetic velocity of this autonomous internal-store mobilization..
Our evidence of sustained, high-power rhythmic responses aligns with the discovery that Müller glia cells possess intrinsic photosensitivity. Chicken MGCs express non-visual opsins Opn3 and Opn5, which upon activation, trigger long-lasting increases in cytosolic Ca2+ [1,9,23]. This intrinsic pathway is characterized by calcium release from internal stores (endoplasmic reticulum) via the PLC-IP3 pathway, producing oscillations that can persist for up to 4 minutes post-stimulus [23].
The transition from a 3 clusters architecture in avian models to a 4 clusters specialization in the human MIO-M1 line (Figure 5A) reveals a significant gain in kinetic complexity through an evolutionary conserved process, however the MIO-M1 is an immortalized cell line, so it may exhibit physiological differences compared to primary culture models. This operational divergence is highlighted by the emergence of an ‘ultra-slow’ (Cluster 3), a subpopulation exhibiting extreme Early activation Power (>34, Figure 6C) and ultra-slow biological periods exceeding 100 s (Figure 5C). Notably, the detection of these long-cycle oscillations was made possible by our strategic extension of the temporal axis (>600 s), which effectively mitigated the interference of the Cone of Influence (COI) [21]. This enhanced technical resolution, coupled with the broader opsin repertoire identified in human MGCs including OPN1SW and OPN4 [16] suggests that human MGCs possess a specialized rhythmic toolkit for metabolic integration or long-term biological processes in the retina [24].
3.4. Species-Specific Divergence and Model Limitations
The initial evidence suggesting that intrinsic glial photosensitivity could be considered a specialized trait of the avian retina driven by Opn3 and Opn5 expression is being fundamentally redefined by emerging mammalian evidence [1]. While earlier rodent studies often failed to detect glial light responses under standard imaging conditions, recent high-resolution recordings have confirmed that mammalian MGCs function as direct light-sensing cells [16].
It is critical to contextualize these findings within the broader vertebrate paradigm, as significant interspecies differences exist between avian and mammalian models. Much of the classical evidence for purely neuron-driven glial responses originates from rodent studies (mouse and rat), where light-evoked glial Ca2+ rises are often subtle or absent under standard imaging conditions [25]. In contrast, the avian retina displays a more robust and widespread intrinsic glial photosensitivity, characterized by spontaneous waves and intense direct photo-activation in ~60% of the population [9,23]. A previous report demonstrated that mouse MGCs exhibit robust light-induced calcium increases, which are coupled to the surrounding macroglial network through potassium-dependent signaling [26]. These findings reveal that MGCs act as primary sensors that siphon and release potassium at focal association sites, thereby modulating the membrane potential of retinal astrocytes and coordinating circuit-wide excitability.
This discovery provides a critical biological bridge between our primary avian MC clusters and the specialized human MIO-M1 signatures. The existence of direct light-evoked signaling in murine models supports the hypothesis that the “Active Sensor” (Cluster 2) fingerprints identified in chicken model and the ultra-slow subpopulation (Cluster 3) profiles in human glia represent a conserved vertebrate rhythmic toolkit. Consequently, the human MGCs circuit does not merely react to neuronal drive; it likely utilizes an ancestral, dual-mode regulatory framework combining intrinsic opsin-driven Ca2+ mobilization from internal stores with extrinsic potassium-mediated coupling to maintain homeostatic resilience under physiological photic stimulation [23].
While immortalized lines can exhibit clonal alignment, MIO-M1 cells express an exceptionally wide array of opsins including OPN1SW and OPN4 and maintain robust cytosolic responses that mirror both the fast kinetics of neuronal drive and the slow, high-power integration of intrinsic stores [16,23]. The functional specialization of the human MIO-M1 (Cluster 2) is likely underpinned by the robust expression of the blue opsin OPN4, which serves as a critical intrinsic mediator of high-power, slow-scale Ca2+ rhythms and suggests that human glia may bridge these two paradigms. Unlike canonical visual pigments, OPN4 is a G-protein-coupled photopigment that specifically engages the endogenous Gαq-PLC-β signaling pathway, leading to IP3-dependent Ca2+ mobilization from internal endoplasmic reticulum stores [1,27]. The ultra-slow rhythmic signatures detected in MIO-M1 cells characterized by periods exceeding 100 s and extreme activation ratios (Figure 5C and Figure 6A) mirror the characteristic slow kinetics and extended temporal integration frame of melanopsin-driven signaling, which allows for sustained cellular excitability even after the cessation of the photic stimulus [27]. The emergence of the ultra-slow (Cluster 3) in the human MIO-M1 line (Figure 6A) suggests that human glia may bridge these two paradigms.
3.5. Functional Synergy
Our identification of discrete clusters based on the Recovery Delta and cv_freq_basal (Figure S1A) suggests that these Ca2+ rhythms serve as functional codes. A pioneer work demonstrated that embryonic neurons use wavelet-defined frequencies to decode specific intracellular Ca2+ patterns into cAMP transients; specifically, adenylyl cyclase (AC) and phosphodiesterase (PDE) kinetics are tuned to recognize ‘triplets’ of spikes, which are then translated into cAMP increases to modulate gene expression [28].
However, our model identifies a significant regulatory layer beyond this intracellular crosstalk. Our results suggest that these rhythmic fingerprints also function as a mechanism for intercellular coordination. The neuronal directed interaction map (Figure 2D) shows that light stimulation recruits a clear hierarchy where Cluster 1 leads Cluster 0 (ΔΦ=0.77,p<0.05). This precise phase-ordering indicates that the retina utilizes rhythmic codes not only to translate internal signals, but to force individual stochastic neural nodes into collective phase channels. This transition from cellular autonomy to a directed functional hierarchy ensures that specific rhythmic bursts are correctly synchronized across the network, likely optimizing the homeostatic adaptation required for circuit-wide resilience. Therefore, these rhythmic fingerprints represent more than descriptive metrics; they constitute the operational language that organizes the functional architecture of the retina.
We propose that the retina utilizes this dual-mode system to diversify its response to blue light. While neurons utilize fast Ca2+ rhythms to decode stimulus frequency into immediate cAMP-mediated gene regulation [28], the Müller glial mosaic acts as a multiscale integrator. The intrinsic pathway ensures local, autonomous metabolic adaptation, while the neuronal-driven extrinsic pathway allows the glial network to synchronize with the functional state of the global circuit. The low-to-moderate Internal Synchronization (R) observed in chicken MGCs (Figure 4B) confirms that these mechanisms do not merge into a unified wave but instead maintain a “mosaic of autonomy,” optimizing the retinal response across independent kinetic windows. Notably, this ‘mosaic of autonomy’ is not a fixed glial trait but a tunable strategy, as evidenced by the transition to high-fidelity synchronization observed in the human MIO-M1 model (Figure 6B), suggesting that higher vertebrate models may require more centralized coordination for metabolic resilience.
4. Materials and Methods
4.1. Primary Cultures of chicken Müller Glial and Retinal Neuron Cells
Primary cultures of Müller glial and retina neuron cells were purified from neural retinas of day 8 embryonic (E8) chicks dissected in ice-cold Tyrode’s buffer without Ca2+ or 2+g²⁺, containing 25 mM glucose, as previously described 13,106. In summary, the cells were treated with papain (P3125 Sigma-Aldrich) for 25 min at 37 °C and with deoxyribonuclease I (18047-019 Invitrogen), and were rinsed with 10% fetal bovine serum (FBS) and half Dulbecco’s Modified Eagle Medium (DMEM). After dissociation, to perform MGCs culture the cells in suspension were seeded into 60mm Petri dishes and cultured in DMEM supplemented with 10% for at least one week; the cultures were then passaged using trypsin into a 8-well Lab-Tek recording chamber (NuncTM, NY, United States) and allowed to grow for another week in DMEM supplemented with 10% FBS. While preparing the neuron cells culture, the cell suspension were seeded in an 8-well Lab-Tek recording chamber containing “Super N” medium; DMEM supplemented with B27 (Life Technologies, Invitrogen, GIBCO; dilution: 1/50 vol/vol) and 4 μM forskolin (Caiman) for three days. The MGCs and neuron cultures were maintained at 37 °C under a constant flow of air and 52 CO₂ in a humid atmosphere.
4.2. Human MIO-M1 Cell Culture
The human Müller cell line MIO-M1 [16,29] was cultured in 24-well plates (Biologix) on circular coverslips 12 mm in diameter, with 15,000 cells seeded per well, using modified DMEM supplemented with 10% FBS and penicillin/streptomycin, the cultures were maintained in 5% CO2 at 37 °C during 2 days for calcium recording.
4.3. Calcium Imaging by Fluorescence Microscopy
Primary cultures of MGCs and neurons were grown in an 8-well Lab-Tek recording chamber (NuncTM, NY, United States) in DMEM+SFB 10% and Super N medium respectively, while de coverslips with growing MIO-M1 cells were mounted in a 12mm 3D printed chamber designed by GOATLAB [30], an open source repository for research equipment. On the day of the experiment, MGCs were incubated with 0.1% of pluronic acid F-127 and the Ca2+ indicator dye Calcium Orange AM 5 μM (Invitrogen–Molecular Probes) and Fluo-4 AM was used for the neurons and MIO-M1 cultures, both in DMEM for 20 min at 37 °C, under darkness condition. The fluorescence imaging technique was performed by using the Ca2+ sensitive indicator calcium orange-AM excited at 543 nm and 495 nm for Fluo-4 AM with a laser coupled to a confocal microscope (Olympus FluoView-1000). The emitted fluorescence was captured every 2 s, using a PlanApo N 60 × Uplan SApo oil-immersion objective (NA: 1.42; Olympus). The 12 bit 4 × 4 binned fluorescence images for each photo were used to quantify fluorescence levels in the cells using ImageJ; the mean fluorescence intensity in each cell was background-corrected by subtracting the mean fluorescence of an area with no cells (only cells showing positive fluorescence pre-stimuli were considered for the analysis). The mean intensity of individual cells was measured in each captured image series. Changes in fluorescence levels were quantified as the ratio between each relative intensity level measured after a blue light stimulus of 68 μW/cm2 for 20 s (F) and the mean of intensities of serial pictures before stimulation (Fo), the same measurements were quantified in the background to correct F/Fo for each cell, as described in [5].
4.4. Computational Analysis and Functional Clustering
4.4.1. Signal Processing and Wavelet-Based Time-Frequency Analysis
To capture the non-stationary rhythmic features of intracellular Ca2+ oscillations, raw time-series data of F/F0 were processed using the pyBOAT framework [21]. Signals were first subjected to optimal detrending via a sinc-filter (brick-wall filter) in the frequency domain to remove non-linear trends without introducing spectral ripples or biasing the power spectrum. Time-frequency analysis was performed using the Continuous Wavelet Transform (CWT) with a Morlet wavelet basis, reaching an optimal compromise between time and frequency localization. To isolate meaningful biological rhythms from edge artifacts, all wavelet-derived metrics were strictly confined within the essential Cone of Influence (COI). Instantaneous rhythmic parameters, including period, amplitude, and phase, were extracted along the maximum power ridge of the wavelet scalogram.
4.4.2. Feature Engineering and the Spectral Fingerprint Metrics
A custom Feature Engineer transformer was utilized to compress the multi-scale CWT data into a specialized multi-parametric phenotype known as the Spectral Fingerprint. Metrics were quantified across three experimental segments: Basal (pre-stimulus), Early Post-Stimulus (initial response), and Late Post-Stimulus (recovery/adaptation).
- Early Power: The mean squared spectral power immediately following stimulus onset, quantifying total activation energy. Elevated values reflect a highly synchronized, high-amplitude recruitment of cellular machinery, typically associated with massive mobilization of intracellular stores.
- Activation Ratio: The ratio of Power Early /Power Basal, identifying active photic enhancement versus refractory states. Values strictly exceeding unity (>1) demonstrate active photic enhancement of cellular rhythms, whereas values ≤1 highlight a refractory state or stimulus-induced rhythmic suppression. Crucially, cells with high basal energy reservoirs can exhibit lower activation ratios due to baseline saturation despite maintaining massive absolute post-stimulus power.
- Recovery Delta: The net change in biological period (Period Late −Period Basal ), where negative values denote post-stimulus rhythmic acceleration. A positive delta (Δ>0) indicates an elongation of the oscillatory period during recovery, indicating a deceleration of the intracellular pacemaker. Conversely, a negative delta (Δ<0) indicates period contraction, revealing post-stimulus rhythmic acceleration or an accelerated homeostatic adaptation.
- Kinetic Variability: Measured through the Coefficient of Variation (CV) of both frequency and period to assess oscillatory stability.
4.4.3. Unsupervised Clustering and Model Architecture
Functional subpopulations were identified via an integrated machine learning pipeline. The engineered feature matrix was standardized and projected into a low-dimensional manifold using Uniform Manifold Approximation and Projection (UMAP) to optimize the separation of distinct functional phenotypes. Subsequently, Agglomerative Hierarchical Clustering with Ward’s linkage was applied to the UMAP coordinates. The optimal number of clusters (k) was determined by maximizing the Silhouette Score and minimizing the Davies-Bouldin Index.
4.4.4. Supervised Validation and Feature Importance
To validate the robustness of the identified clusters, a Random Forest (RF) Classifier was trained to predict cluster labels using the original feature set. The model employed a regularization and pruning strategy (max depth of 5, minimum 15 samples per leaf) to prevent overfitting and enhance generalization. Validation reports for the model variants (Neurons, MGCs, and MIO-M1) demonstrated high classification fidelity, with test accuracies ranging from 0.87 to 0.89. Post-pruning analysis identified the most discriminatory features, confirming that late-stage rhythmic parameters were critical for defining functional glial and neuronal identities.
4.4.5. Network Dynamics and Statistical Framework
Collective coordination was modeled using Internal Synchronization Trajectories (R), where R→1 denotes high angular coherence and R→0 indicates stochastic cellular autonomy. Inter-cluster hierarchy was inferred through Directed Phase-Coupling Networks based on the phase difference (ΔΦ) between cluster pairs.
- Intra-cluster dynamics: Evaluated using the Wilcoxon Signed-Rank Test for paired temporal segments. Inter-cluster comparisons: Performed via ANOVA followed by Tukey’s Honestly Significant Difference (HSD) post-hoc test.
- Phase Coupling: The directionality of interaction was determined using a One-Sample Wilcoxon Test against a null hypothesis of zero median phase difference. A minimum sample size of N=6 was required for all statistical validations
5. Conclusions
This study demonstrates that retinal functional identity is fundamentally dictated by multi-scale rhythmic signatures. By integrating wavelet analysis with machine learning, we have moved beyond static cellular descriptions to reveal a time-resolved “rhythmic language” that orchestrates retinal processing under blue light stimulation.
Our findings establish a clear operational dichotomy: while neurons act as high-fidelity “digital” processors through rapid phase-resetting and hierarchical coupling, MGCs emerge as “analog” metabolic integrators. This glial network operates as a decentralized autonomous mosaic, utilizing a dual-mode regulatory mechanism intrinsic opsin-driven cascades and extrinsic neuronal modulation to filter photic information across independent kinetic windows. Furthermore, the first-time resolution of human-specific ultra-slow rhythms (>100 s) proves that human macroglia possess a specialized rhythmic toolkit for maintaining homeostatic resilience.
Ultimately, these “functional fingerprints” define the healthy operational state of the inner retina. Establishing this rhythmic framework provides a transformative paradigm for retinal physiology, offering a sensitive benchmark to detect subtle functional and heterogeneous cell populations responding to light that could be associated with a number of diverse physiological retinal activities.
Supplementary Materials
The following supporting information can be downloaded at: https://www.mdpi.com/article/doi/s1, Figure S1, S2, and S3.
Author Contributions
Conceptualization, M.N.R. and N.A.M.; methodology, M.N.R. and N.A.M.; software, M.N.R.; formal analysis, M.N.R.; investigation, M.N.R. and N.A.M.; writing—original draft preparation, M.N.R.; writing—review and editing, M.N.R., N.A.M. and M.E.G.; funding acquisition, M.N.R., N.A.M. and M.E.G. All authors have read and agreed to the published version of the manuscript.
Funding
This work was supported by the Agencia Nacional de Promoción Científica y Técnica (FONCyT, and PICT 2016 No. 187, PICT 2020 No. 0613 and PICT 2020 01201), the Consejo Nacional de Investigaciones Científicas y Tecnológicas de la República Argentina (CONICET) (PIP 2014), Mabel Yudi Grant 2026 and the Secretaría de Ciencia y Tecnología de la Universidad Nacional de Córdoba (SeCyT-UNC).
Institutional Review Board Statement
All experiments were performed in accordance with the Use of Animals in Ophthalmic and Vision Research of ARVO, approved by the local animal care committee (School of Chemistry, National University of Córdoba; RD-2025-1475-E-UNC-DEC#FCQ) and CICUAL (Institutional Committee for the Care and Use of Experimental Animals). CIQUIBIC-CONICET, Facultad de Ciencias Químicas, Universidad Nacional de Córdoba, 5000 Córdoba, Argentina. Departamento de Química Biológica “Ranwel Caputto”, Facultad de Ciencias Químicas, Universidad Nacional de Córdoba, 5000 Córdoba, Argentina.
Data Availability Statement
The datasets generated and analyzed during the current study, along with the processing scripts and the WAVE-CLUST model developed for this analysis, are publicly available in the GitHub repository at https://github.com/maxirios27/WAVE_CLUST.git.
Conflicts of Interest
The authors declare no conflicts of interest. The funders had no role in the design of the study; in the collection, analyses, or interpretation of data; in the writing of the manuscript; or in the decision to publish the results.
Acknowledgments
We thank Dr. Cecilia Sanchez for providing the MIO-M1 cell line; the support staff Fabricio Navarro, Rosa Andrada, and Laura Argarañas for the care of the avian facility for the procurement of fertile eggs; Tech. Gabriela Schachner and Dr. Natalia Soledad Baez for their assistance in cell culture; the members of CEMINCO (Centro de Micro y Nanoscopía de Córdoba), Dr. Cecilia Sampedro, Dr. Gonzalo Quassolo, Dr. Carlos Mas, and Dr. Pilar Crespo for technical assistance in microscopy; Eng. Marcelo Pino for his help in the design of irradiators for light stimulation; Dr. Daniela F. Bussolino and Dr. Vanina Torres Demichelis from the Central Facility for Media and Solutions (FACEMES) for the preparation of buffers, culture media, and sterile solutions; and Biologist Alan Medina Arellano (Universidad Nacional Autónoma de México, UNAM) for reading and providing critical feedback on the manuscript.
Abbreviations
| Ca2+ | Calcium |
| CWT | Continuous Wavelet Transform |
| GCL | Ganglion Cell Layer |
| INL | Inner Nuclear Layer |
| RGCs | Retinal ganglion cells |
| MGCs | Müller glial cells |
| ONL | Outer Nuclear Layer |
| Opn | Opsin |
| PLC | Phospholipase C |
| UMAP | Uniform Manifold Approximation and Projection |
| UV | Ultraviolet |
| COI | Cone of Influence |
References
- Guido, M. E. «Non-visual Opsins and Novel Photo-Detectors in the Vertebrate Inner Retina Mediate Light Responses Within the Blue Spectrum Region». Cell. Mol. Neurobiol. 2022, vol. 42(n.o 1), 59–83. [Google Scholar] [CrossRef] [PubMed]
- Contin, M. A.; Verra, D. M.; Guido, y M. E. An invertebrate-like phototransduction cascade mediates light detection in the chicken retinal ganglion cells. FASEB J. Off. Publ. Fed. Am. Soc. Exp. Biol. 2006, vol. 20(n.o 14), 2648–2650. [Google Scholar] [CrossRef] [PubMed]
- Guido, M. E. «Inner retinal circadian clocks and non-visual photoreceptors: novel players in the circadian system». Prog. Neurobiol. 2010, vol. 92(n.o 4), 484–504. [Google Scholar] [CrossRef] [PubMed]
- Díaz, N. M.; Morera, L. P.; Guido, M. E. Melanopsin and the Non-visual Photochemistry in the Inner Retina of Vertebrates. Photochem. Photobiol. 2016, vol. 92(n.o 1), 29–44. [Google Scholar] [CrossRef] [PubMed]
- Morera, L. P.; Díaz, N. M.; Guido, y M. E. Horizontal cells expressing melanopsin x are novel photoreceptors in the avian inner retina. Proc. Natl. Acad. Sci. U. S. A. 2016, vol. 113(n.o 46), 13215–13220. [Google Scholar] [CrossRef] [PubMed]
- Yarfitz, S.; Hurley, J. B. Transduction mechanisms of vertebrate and invertebrate photoreceptors. J. Biol. Chem. 1994, vol. 269(n.o 20), 14329–14332. [Google Scholar] [CrossRef]
- Contreras, E.; Nobleman, A. P.; Robinson, P. R.; Schmidt, T. M. Melanopsin phototransduction: beyond canonical cascades. J. Exp. Biol. 2021, vol. 224(n.o 23), jeb226522. [Google Scholar] [CrossRef] [PubMed]
- Halford, S. «Characterization of a Novel Human Opsin Gene with Wide Tissue Expression and Identification of Embedded and Flanking Genes on Chromosome 1q43». Genomics 2001, vol. 72(n.o 2), 203–208. [Google Scholar] [CrossRef] [PubMed]
- Rios, M. N.; Marchese, N. A.; Guido, y M. E. Expression of Non-visual Opsins Opn3 and Opn5 in the Developing Inner Retinal Cells of Birds. Light-Responses in Müller Glial Cells. Front. Cell. Neurosci. 2019, vol. 13, 376. [Google Scholar] [CrossRef] [PubMed]
- Kato, M. «Two Opsin 3-Related Proteins in the Chicken Retina and Brain: A TMT-Type Opsin 3 Is a Blue-Light Sensor in Retinal Horizontal Cells, Hypothalamus, and Cerebellum». PLoS ONE 2016, vol. 11(n.o 11), e0163925. [Google Scholar] [CrossRef] [PubMed]
- Tarttelin, E. E.; Bellingham, J.; Hankins, M. W.; Foster, R. G.; Lucas, y R. J. Neuropsin (Opn5): a novel opsin identified in mammalian neural tissue. FEBS Lett. 2003, vol. 554(n.o 3), 410–416. [Google Scholar] [CrossRef] [PubMed]
- Yamashita, T. «Evolution of Mammalian Opn5 as a Specialized UV-absorbing Pigment by a Single Amino Acid Mutation*». J. Biol. Chem. 2014, vol. 289(n.o 7), 3991–4000. [Google Scholar] [CrossRef] [PubMed]
- Sugiyama, T.; Suzuki, H.; Takahashi, y T. Light-induced rapid Ca2+ response and MAPK phosphorylation in the cells heterologously expressing human OPN5. Sci. Rep. 2014, vol. 4(n.o 1), 5352. [Google Scholar] [CrossRef] [PubMed]
- Yamashita, T.; Ohuchi, H.; Tomonari, S.; Ikeda, K.; Sakai, K.; Shichida, y Y. Opn5 is a UV-sensitive bistable pigment that couples with Gi subtype of G protein. Proc. Natl. Acad. Sci. 2010, vol. 107(n.o 51), 22084–22089. [Google Scholar] [CrossRef] [PubMed]
- Nieto, P. S.; Valdez, D. J.; Acosta-Rodríguez, V. A.; Guido, M. E. Expression of novel opsins and intrinsic light responses in the mammalian retinal ganglion cell line RGC-5. Presence of OPN5 in the rat retina. PLoS ONE 2011, vol. 6(n.o 10), e26417. [Google Scholar] [CrossRef] [PubMed]
- Hollborn, M. «The human Müller cell line MIO-M1 expresses opsins». Mol. Vis. 2011, vol. 17, 2738–2750. [Google Scholar]
- Marchese, N. A.; Ríos, M. N.; Guido, y M. E. Müller glial cell photosensitivity: A novel function bringing higher complexity to vertebrate retinal physiology. J. Photochem. Photobiol. 2023, vol. 13, 100162. [Google Scholar] [CrossRef]
- Grosche. «The Proteome of Native Adult Müller Glial Cells From Murine Retina*». Mol. Cell. Proteom. 2016, vol. 15(n.o 2), 462–480. [Google Scholar] [CrossRef] [PubMed]
- Morita, M.; Nakane, A.; Fujii, Y.; Maekawa, S.; Kudo, y Y. High Cell Density Upregulates Calcium Oscillation by Increasing Calcium Store Content via Basal Mitogen-Activated Protein Kinase Activity. PLoS ONE 2015, vol. 10(n.o 9), e0137610. [Google Scholar] [CrossRef] [PubMed]
- Ozden; Lee, H. M.; Sullivan, M. R.; Wang, y S. S.-H. Identification and Clustering of Event Patterns From In Vivo Multiphoton Optical Recordings of Neuronal Ensembles. J. Neurophysiol. 2008, vol. 100(n.o 1), 495–503. [Google Scholar] [CrossRef] [PubMed]
- Mönke, G.; Sorgenfrei, F. A.; Schmal, C.; Granada, A. E. Optimal time frequency analysis for biological data - pyBOAT. In bioRxiv; 2020. [Google Scholar] [CrossRef]
- El, Y. B.; Kanner, S.; Barzilai, A.; Hanein, y Y. Activity changes in neuron-astrocyte networks in culture under the effect of norepinephrine. PLoS ONE 2018, vol. 13(n.o 10), e0203761. [Google Scholar] [CrossRef] [PubMed]
- Marchese, N. A.; Ríos, M. N.; Guido, M. E. The Intrinsic Blue Light Responses of Avian Müller Glial Cells Imply Calcium Release from Internal Stores. ASN Neuro 2022, vol. 14, 17590914221076698. [Google Scholar] [CrossRef] [PubMed]
- Biesecker, R. «Glial Cell Calcium Signaling Mediates Capillary Regulation of Blood Flow in the Retina». J. Neurosci. 2016, vol. 36(n.o 36), 9435–9445. [Google Scholar] [CrossRef] [PubMed]
- Zariwala, H. A. «A Cre-Dependent GCaMP3 Reporter Mouse for Neuronal Imaging In Vivo». J. Neurosci. 2012, vol. 32(n.o 9), 3131–3141. [Google Scholar] [CrossRef] [PubMed]
- Holden, M.; Boal, A. M.; Wareham, L. K.; Calkins, D. J. Potassium-Dependent Coupling of Retinal Astrocyte Light Response to Müller Glia. Glia 2024, vol. 73(n.o 7), 1520–1534. [Google Scholar] [CrossRef] [PubMed]
- Mederos, S. «Melanopsin for precise optogenetic activation of astrocyte-neuron networks». Glia 2019, vol. 67(n.o 5), 915–934. [Google Scholar] [CrossRef] [PubMed]
- Gorbunova, Y. V.; Spitzer, N. C. Dynamic interactions of cyclic AMP transients and spontaneous Ca2+ spikes. Nature 2002, vol. 418(n.o 6893), 93–96. [Google Scholar] [CrossRef] [PubMed]
- Limb, G. A.; Salt, T. E.; Munro, P. M. G.; Moss, S. E.; Khaw, y P. T. In Vitro Characterization of a Spontaneously Immortalized Human Müller Cell Line (MIO-M1). Invest. Ophthalmol. Vis. Sci. 2002, vol. 43(n.o 3), 864–869. [Google Scholar]
- GOATLAB. GoatLabDIY’s Thingiverse Profile. Thingiverse. Available online: https://www.thingiverse.com/GoatLabDIY.
Figure 1.
Population Landscape (A). Unsupervised UMAP embedding resolves the embryonic chicken retinal
neuron population (N=194) into four functionally segregated operational clusters. (B) Cell Distribution.
Numerical distribution of the neural circuit identifies Cluster 0 (40.7%) as the dominant subpopulation, followed
by the energetic Cluster 3 (23.2%), and flanked by Clusters 1 and 2 (18.0% each). (C) Agglomerative hierarchical
clustering utilizing Ward’s minimum variance method validates this functional divergence, establishing a clear
threshold at a linkage distance of approximately 35 AU. (D) Temporal Signals Average Ca2+ signals demonstrate
an instantaneous and highly coordinated response upon application of a 20-second blue light pulse (blue dashed
line). (E) Kinetic Trajectories. Continuous period-over-time trajectories reveal a population-wide phase-resetting
event. Biological periods remain constrained within a ~20–100 s regime, where Cluster 0 serves as the rhythmic
stabilizer at ~40 s, while Cluster 1 executes a significant delayed period contraction during recovery (p=0.002) and Cluster 2 shows acute photic deceleration. Gray shaded areas represent the Cone of Influence (COI)
estimated via pyBOAT, demarcating the mathematically secure regions for periodicity extraction.
Figure 1.
Population Landscape (A). Unsupervised UMAP embedding resolves the embryonic chicken retinal
neuron population (N=194) into four functionally segregated operational clusters. (B) Cell Distribution.
Numerical distribution of the neural circuit identifies Cluster 0 (40.7%) as the dominant subpopulation, followed
by the energetic Cluster 3 (23.2%), and flanked by Clusters 1 and 2 (18.0% each). (C) Agglomerative hierarchical
clustering utilizing Ward’s minimum variance method validates this functional divergence, establishing a clear
threshold at a linkage distance of approximately 35 AU. (D) Temporal Signals Average Ca2+ signals demonstrate
an instantaneous and highly coordinated response upon application of a 20-second blue light pulse (blue dashed
line). (E) Kinetic Trajectories. Continuous period-over-time trajectories reveal a population-wide phase-resetting
event. Biological periods remain constrained within a ~20–100 s regime, where Cluster 0 serves as the rhythmic
stabilizer at ~40 s, while Cluster 1 executes a significant delayed period contraction during recovery (p=0.002) and Cluster 2 shows acute photic deceleration. Gray shaded areas represent the Cone of Influence (COI)
estimated via pyBOAT, demarcating the mathematically secure regions for periodicity extraction.
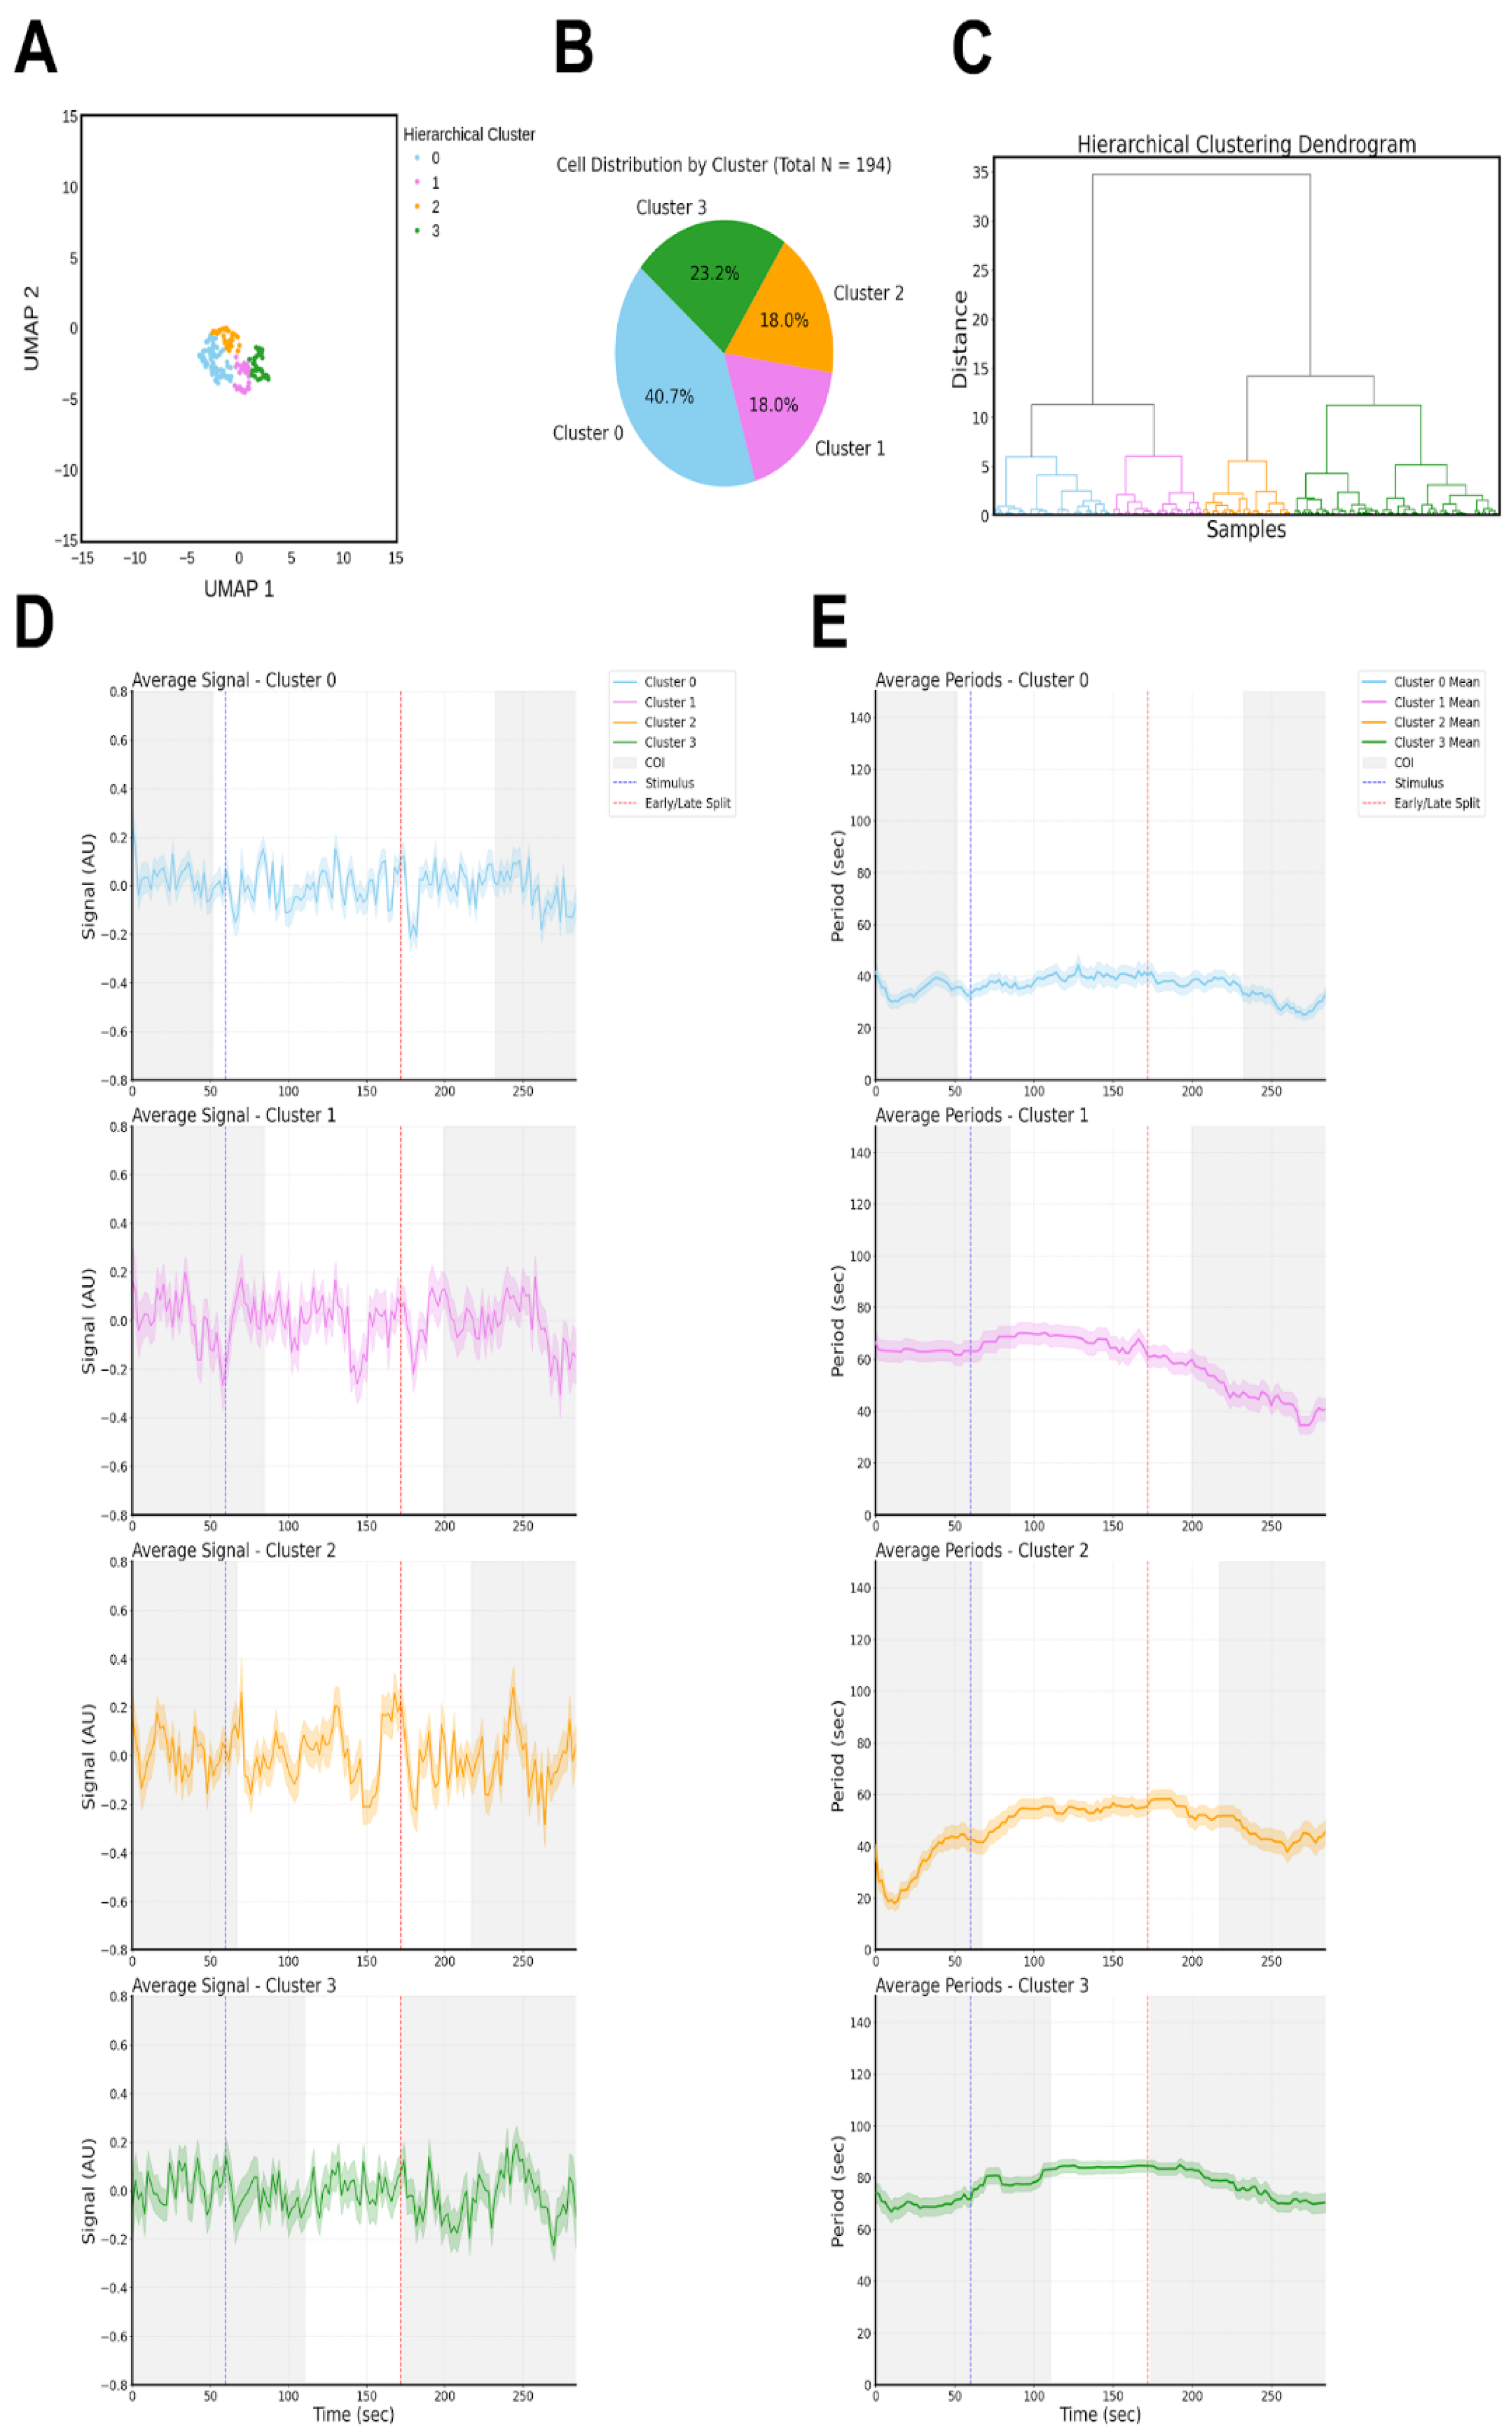
Figure 2.
Intra-cluster period variation analysis (A) utilizes violin plots to compare biological period distributions across the dark Basal state and post-stimulus phases (Early and Late) for each operational group. Statistical validation identifies Cluster 0 as the primary rhythmic stabilizer, maintaining consistent periodicity across all segments (p>0.05), while Cluster 2 (active sensor) executes an acute period elongation immediately following the 20-second blue light pulse (p<0.001) and Cluster 1 (late reactor) manifests a significant, delayed period contraction during the late recovery phase (p<0.01). Internal synchronization trajectories (B) show that prior to stimulation, angular coherence remains low (R≤0.30); however, upon photic activation, the population experiences a coordinated rise in coherence, with Cluster 1 and Cluster 0 establishing sustained peaks approaching R≈0.5–0.6 in the late recovery phase.Functional logic analysis via inter-cluster violin plots (C) identifies the distinct parametric fingerprints that define specialized operational roles. Statistical comparisons identify Cluster 3 as the primary energetic responder, exhibiting significantly higher Early Activation Power compared to Cluster 0 (p<0.001), while the Activation Ratio and Recovery Delta metrics corroborate the profound kinetic reconfigurations occurring in Clusters 3 and 2. The underlying directed network architecture (D) defines the emergence of a light-induced functional hierarchy derived from Delta-Phase (ΔΦ) analysis. In the dark Basal state, inter-cluster interactions are non-significant (p>0.05) and phase differences are statistically centered around zero. Photic activation establishes an instantaneous directed cascade in the Early phase, where Cluster 1 leads Cluster 0 (ΔΦ=0.77;p<0.05), which simultaneously leads Cluster 3 (ΔΦ=1.23;p<0.01), followed by a late reorganization where Cluster 0 solidifies its role as the master pacemaker, directing both Cluster 1 and Cluster 2 (p<0.01). Gray shaded areas represent the essential Cone of Influence (eCOI) estimated via pyBOAT, demarcating the mathematically secure regions where spectral edge artifacts are strictly excluded.
Figure 2.
Intra-cluster period variation analysis (A) utilizes violin plots to compare biological period distributions across the dark Basal state and post-stimulus phases (Early and Late) for each operational group. Statistical validation identifies Cluster 0 as the primary rhythmic stabilizer, maintaining consistent periodicity across all segments (p>0.05), while Cluster 2 (active sensor) executes an acute period elongation immediately following the 20-second blue light pulse (p<0.001) and Cluster 1 (late reactor) manifests a significant, delayed period contraction during the late recovery phase (p<0.01). Internal synchronization trajectories (B) show that prior to stimulation, angular coherence remains low (R≤0.30); however, upon photic activation, the population experiences a coordinated rise in coherence, with Cluster 1 and Cluster 0 establishing sustained peaks approaching R≈0.5–0.6 in the late recovery phase.Functional logic analysis via inter-cluster violin plots (C) identifies the distinct parametric fingerprints that define specialized operational roles. Statistical comparisons identify Cluster 3 as the primary energetic responder, exhibiting significantly higher Early Activation Power compared to Cluster 0 (p<0.001), while the Activation Ratio and Recovery Delta metrics corroborate the profound kinetic reconfigurations occurring in Clusters 3 and 2. The underlying directed network architecture (D) defines the emergence of a light-induced functional hierarchy derived from Delta-Phase (ΔΦ) analysis. In the dark Basal state, inter-cluster interactions are non-significant (p>0.05) and phase differences are statistically centered around zero. Photic activation establishes an instantaneous directed cascade in the Early phase, where Cluster 1 leads Cluster 0 (ΔΦ=0.77;p<0.05), which simultaneously leads Cluster 3 (ΔΦ=1.23;p<0.01), followed by a late reorganization where Cluster 0 solidifies its role as the master pacemaker, directing both Cluster 1 and Cluster 2 (p<0.01). Gray shaded areas represent the essential Cone of Influence (eCOI) estimated via pyBOAT, demarcating the mathematically secure regions where spectral edge artifacts are strictly excluded.
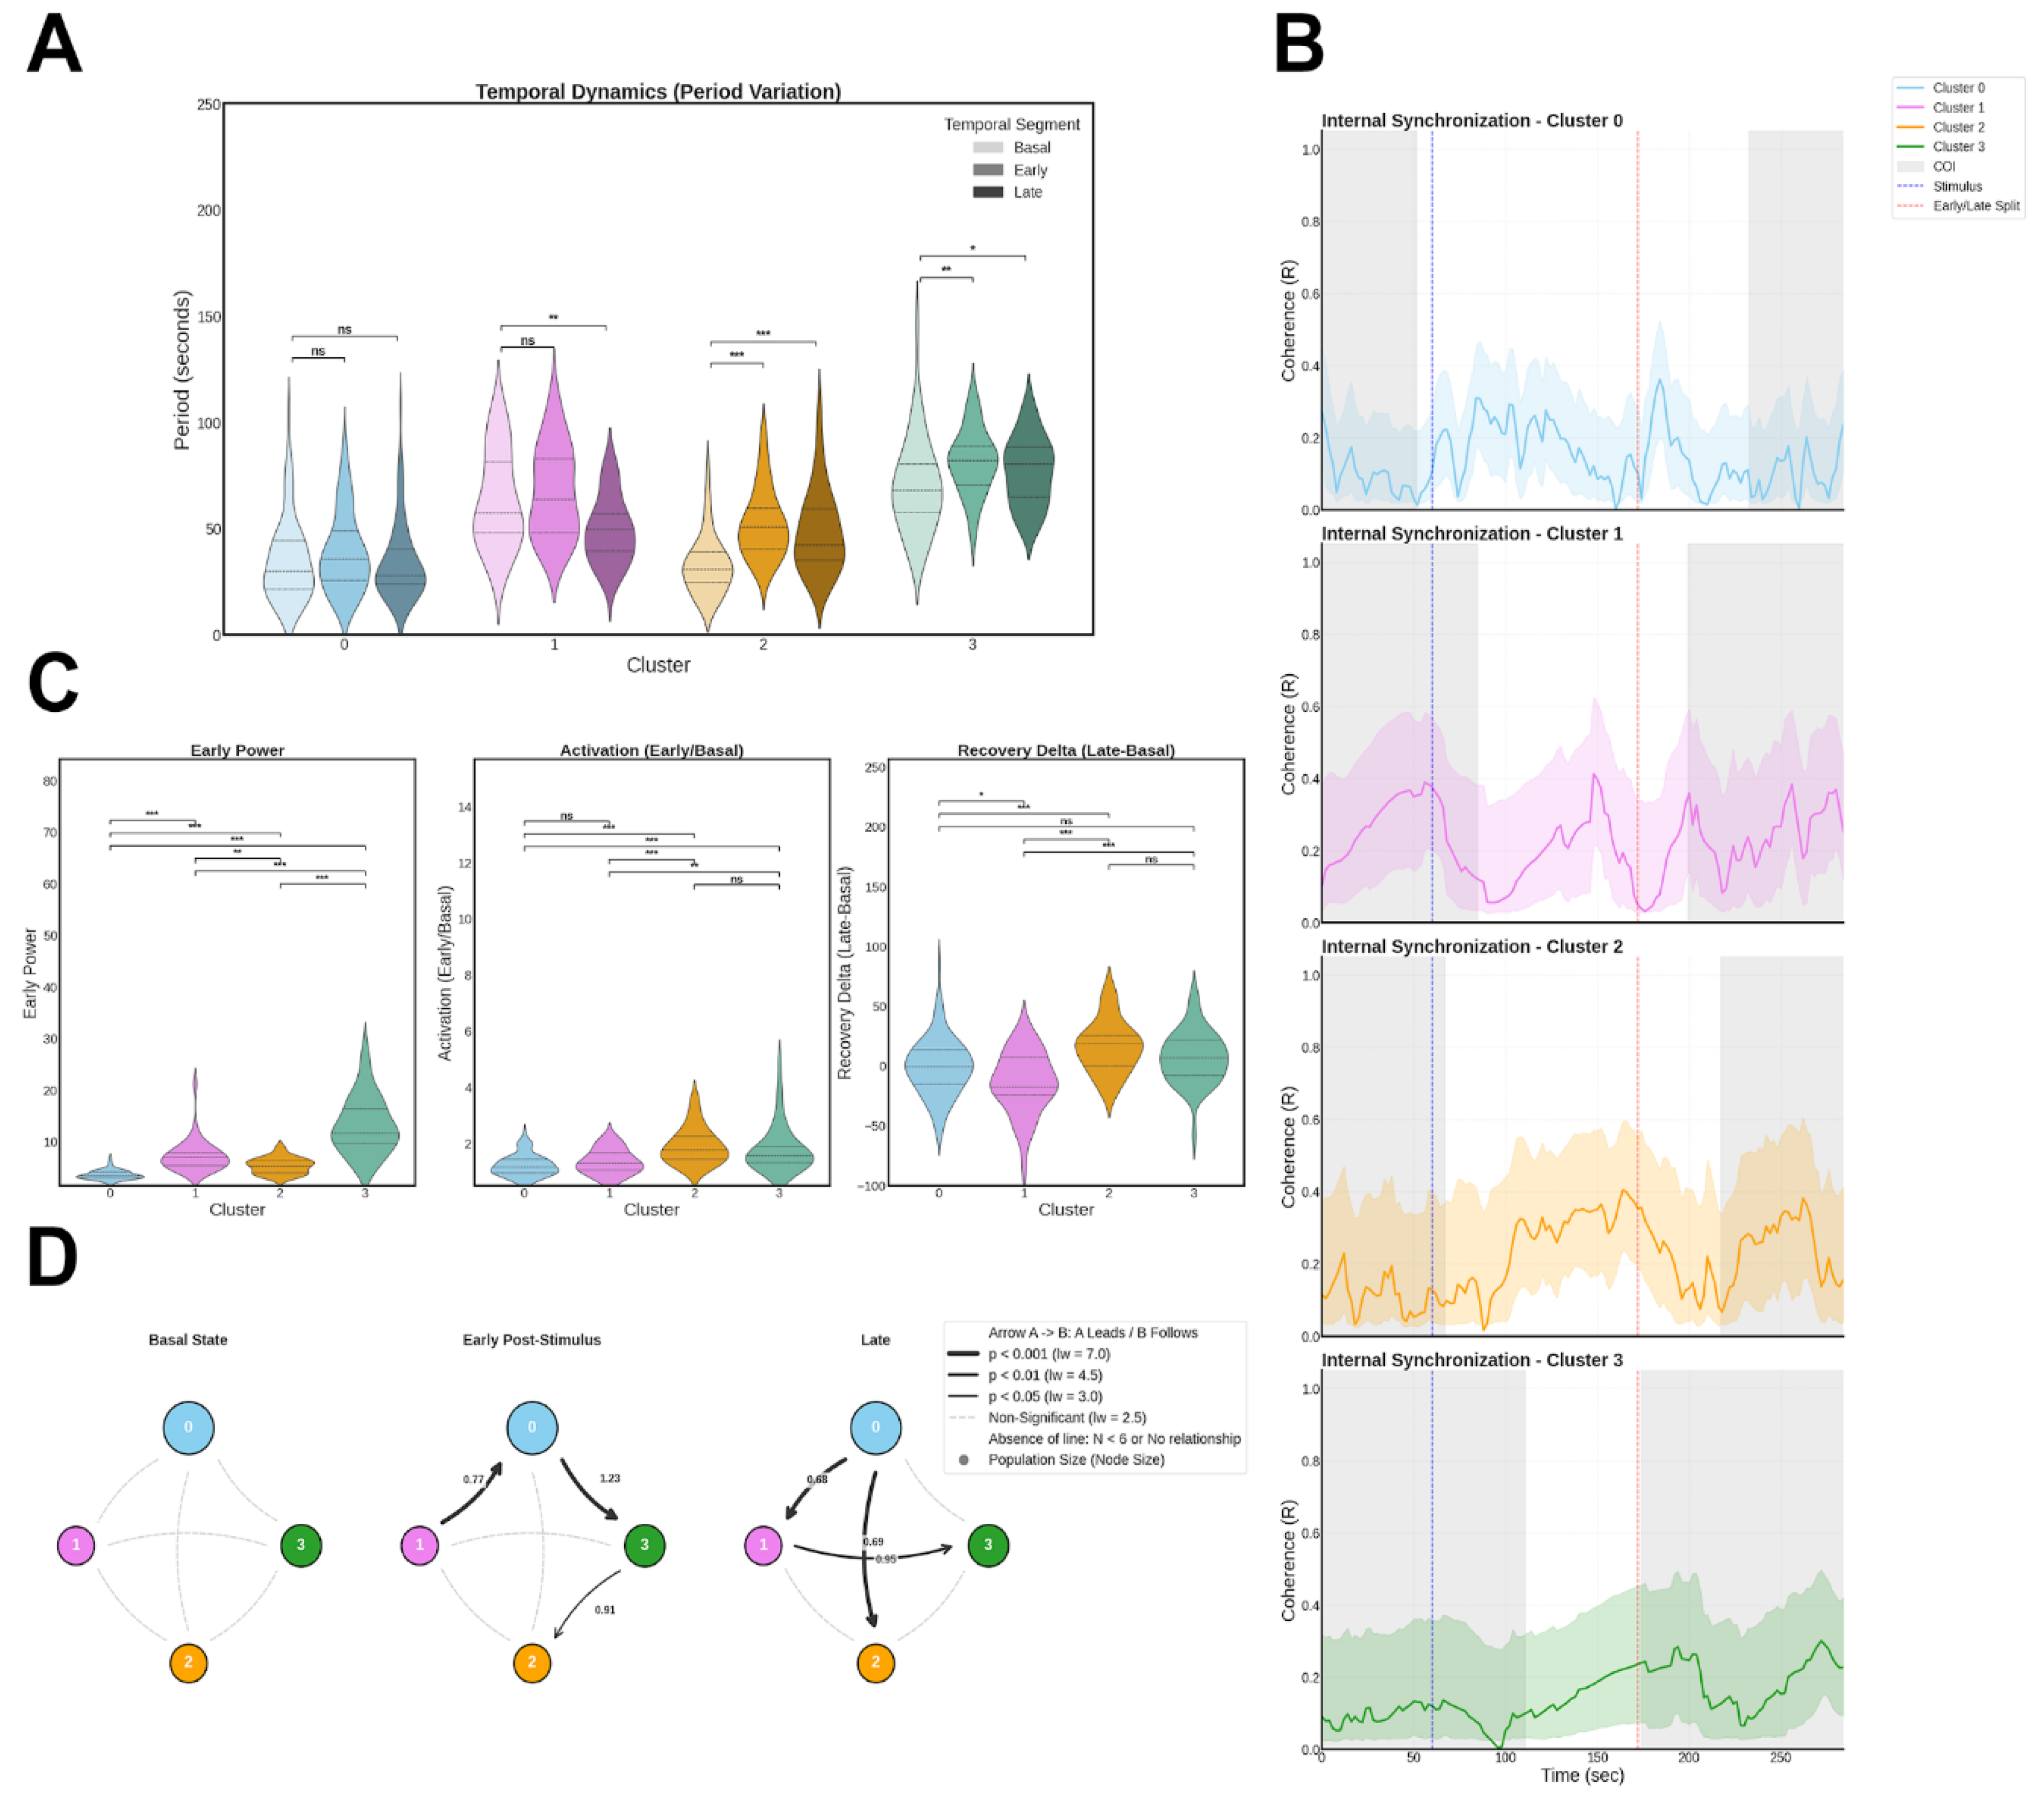
Figure 3.
(A) Unsupervised UMAP embedding resolves the primary chicken MC population (N=260) into three functionally distinct operational clusters. (B) Cell Distribution. The macroglial circuit distribution is led by the active sensor Cluster 2 (40.0%) and the homeostatic backbone Cluster 0 (39.2%), with Cluster 1 (20.8%) representing a specialized reactor subpopulation. (C) Hierarchical Organization. Agglomerative clustering validates this functional divergence at a linkage distance threshold exceeding 60 AU, reflecting a high degree of functional heterogeneity. (D) Temporal Signals. Average Ca2+ signals highlight an “analog” integration strategy defined by a progressive increase in rhythmic intensity following the 20-second blue light stimulus. (E) Kinetic Trajectories. Continuous period-over-time curves demonstrate a general macroglial tendency to accelerate rhythmic output post-stimulus. Notably, Cluster 2 executes a significant and robust period contraction from a basal regime of ~70 s down to ~30 s during the late recovery phase, while Cluster 0 maintains rhythmic stability near ~75 s. Gray shaded areas represent the Cone of Influence (COI) estimated via pyBOAT.
Figure 3.
(A) Unsupervised UMAP embedding resolves the primary chicken MC population (N=260) into three functionally distinct operational clusters. (B) Cell Distribution. The macroglial circuit distribution is led by the active sensor Cluster 2 (40.0%) and the homeostatic backbone Cluster 0 (39.2%), with Cluster 1 (20.8%) representing a specialized reactor subpopulation. (C) Hierarchical Organization. Agglomerative clustering validates this functional divergence at a linkage distance threshold exceeding 60 AU, reflecting a high degree of functional heterogeneity. (D) Temporal Signals. Average Ca2+ signals highlight an “analog” integration strategy defined by a progressive increase in rhythmic intensity following the 20-second blue light stimulus. (E) Kinetic Trajectories. Continuous period-over-time curves demonstrate a general macroglial tendency to accelerate rhythmic output post-stimulus. Notably, Cluster 2 executes a significant and robust period contraction from a basal regime of ~70 s down to ~30 s during the late recovery phase, while Cluster 0 maintains rhythmic stability near ~75 s. Gray shaded areas represent the Cone of Influence (COI) estimated via pyBOAT.
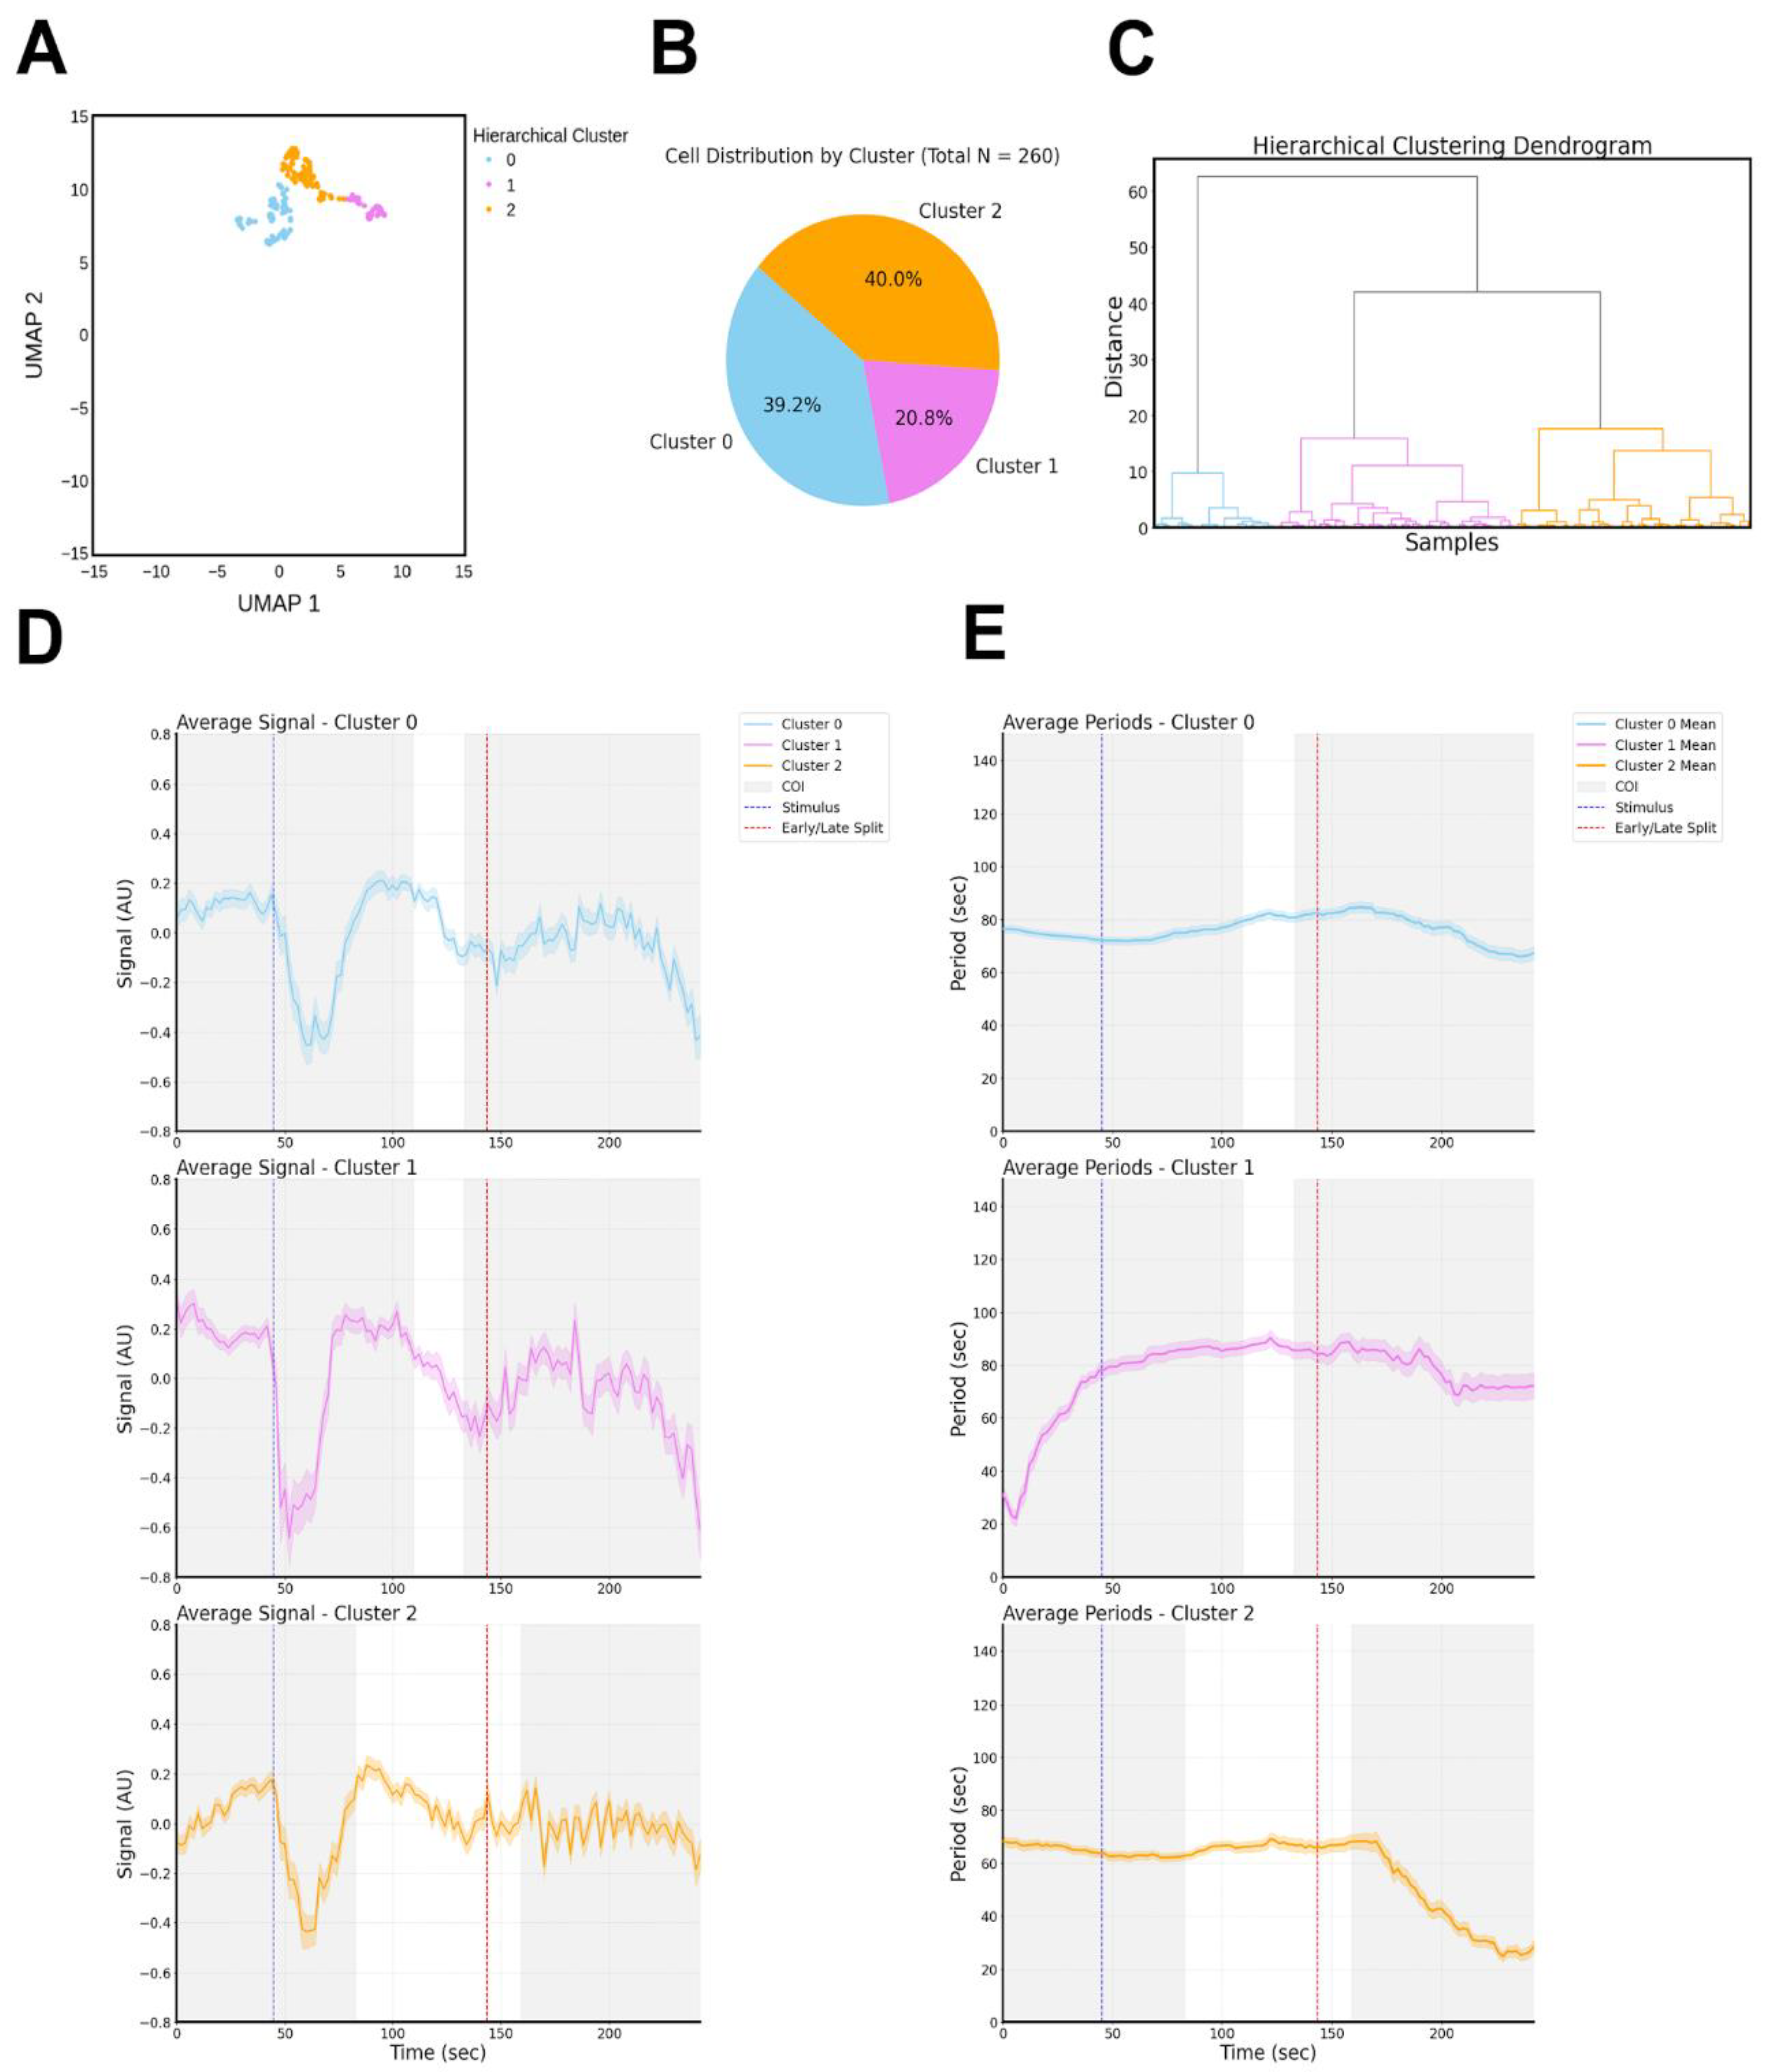
Figure 4.
Intra-cluster period variation analysis (A) utilizes violin plots to compare biological period distributions across the dark Basal state and post-stimulus phases (Early and Late) for each operational group (N=260). Statistical validation identifies Cluster 2 (active sensor) as the primary kinetic responder, executing a significant period contraction from a basal regime of ∼70 s down to ∼30 s during the late recovery phase (p<0.0001), while Cluster 0 anchors network stability with a consistent period near ∼75 s. Internal synchronization trajectories (B) demonstrate that primary MGCs operate within a low-to-moderate angular coherence regime, with R-values typically remaining below 0.5, reflecting a decentralized and autonomous macroglial mosaic.Functional logic analysis via inter-cluster violin plots (C) identifies the distinct parametric fingerprints that define specialized operational roles. Statistical comparisons identify Cluster 0 as maintaining the highest Early Activation Power (p<0.001), while Cluster 1 is distinguished by a significantly high Recovery Delta period (p<0.001 vs. Cluster 2), reflecting a profound and sustained rhythmic reconfiguration. The underlying directed network architecture (D) maps the transition from basal autonomy to light-induced transient coordination. In the dark Basal state, the network lacks an organized hierarchy. Photic activation establishes a weak coupling structure in the Early phase, where Cluster 2 acts as a transient leader, directing both Cluster 0 (ΔΦ=0.35;p<0.001) and Cluster 1 (ΔΦ=0.78;p<0.001). By the Late phase, this hierarchy largely dissolves, leaving only a residual directed leadership of Cluster 0 over Cluster 1 (ΔΦ=0.84;p<0.05), pulling this subpopulation back into a coordinated regime while Cluster 2 returns to an uncoupled autonomous state.
Figure 4.
Intra-cluster period variation analysis (A) utilizes violin plots to compare biological period distributions across the dark Basal state and post-stimulus phases (Early and Late) for each operational group (N=260). Statistical validation identifies Cluster 2 (active sensor) as the primary kinetic responder, executing a significant period contraction from a basal regime of ∼70 s down to ∼30 s during the late recovery phase (p<0.0001), while Cluster 0 anchors network stability with a consistent period near ∼75 s. Internal synchronization trajectories (B) demonstrate that primary MGCs operate within a low-to-moderate angular coherence regime, with R-values typically remaining below 0.5, reflecting a decentralized and autonomous macroglial mosaic.Functional logic analysis via inter-cluster violin plots (C) identifies the distinct parametric fingerprints that define specialized operational roles. Statistical comparisons identify Cluster 0 as maintaining the highest Early Activation Power (p<0.001), while Cluster 1 is distinguished by a significantly high Recovery Delta period (p<0.001 vs. Cluster 2), reflecting a profound and sustained rhythmic reconfiguration. The underlying directed network architecture (D) maps the transition from basal autonomy to light-induced transient coordination. In the dark Basal state, the network lacks an organized hierarchy. Photic activation establishes a weak coupling structure in the Early phase, where Cluster 2 acts as a transient leader, directing both Cluster 0 (ΔΦ=0.35;p<0.001) and Cluster 1 (ΔΦ=0.78;p<0.001). By the Late phase, this hierarchy largely dissolves, leaving only a residual directed leadership of Cluster 0 over Cluster 1 (ΔΦ=0.84;p<0.05), pulling this subpopulation back into a coordinated regime while Cluster 2 returns to an uncoupled autonomous state.
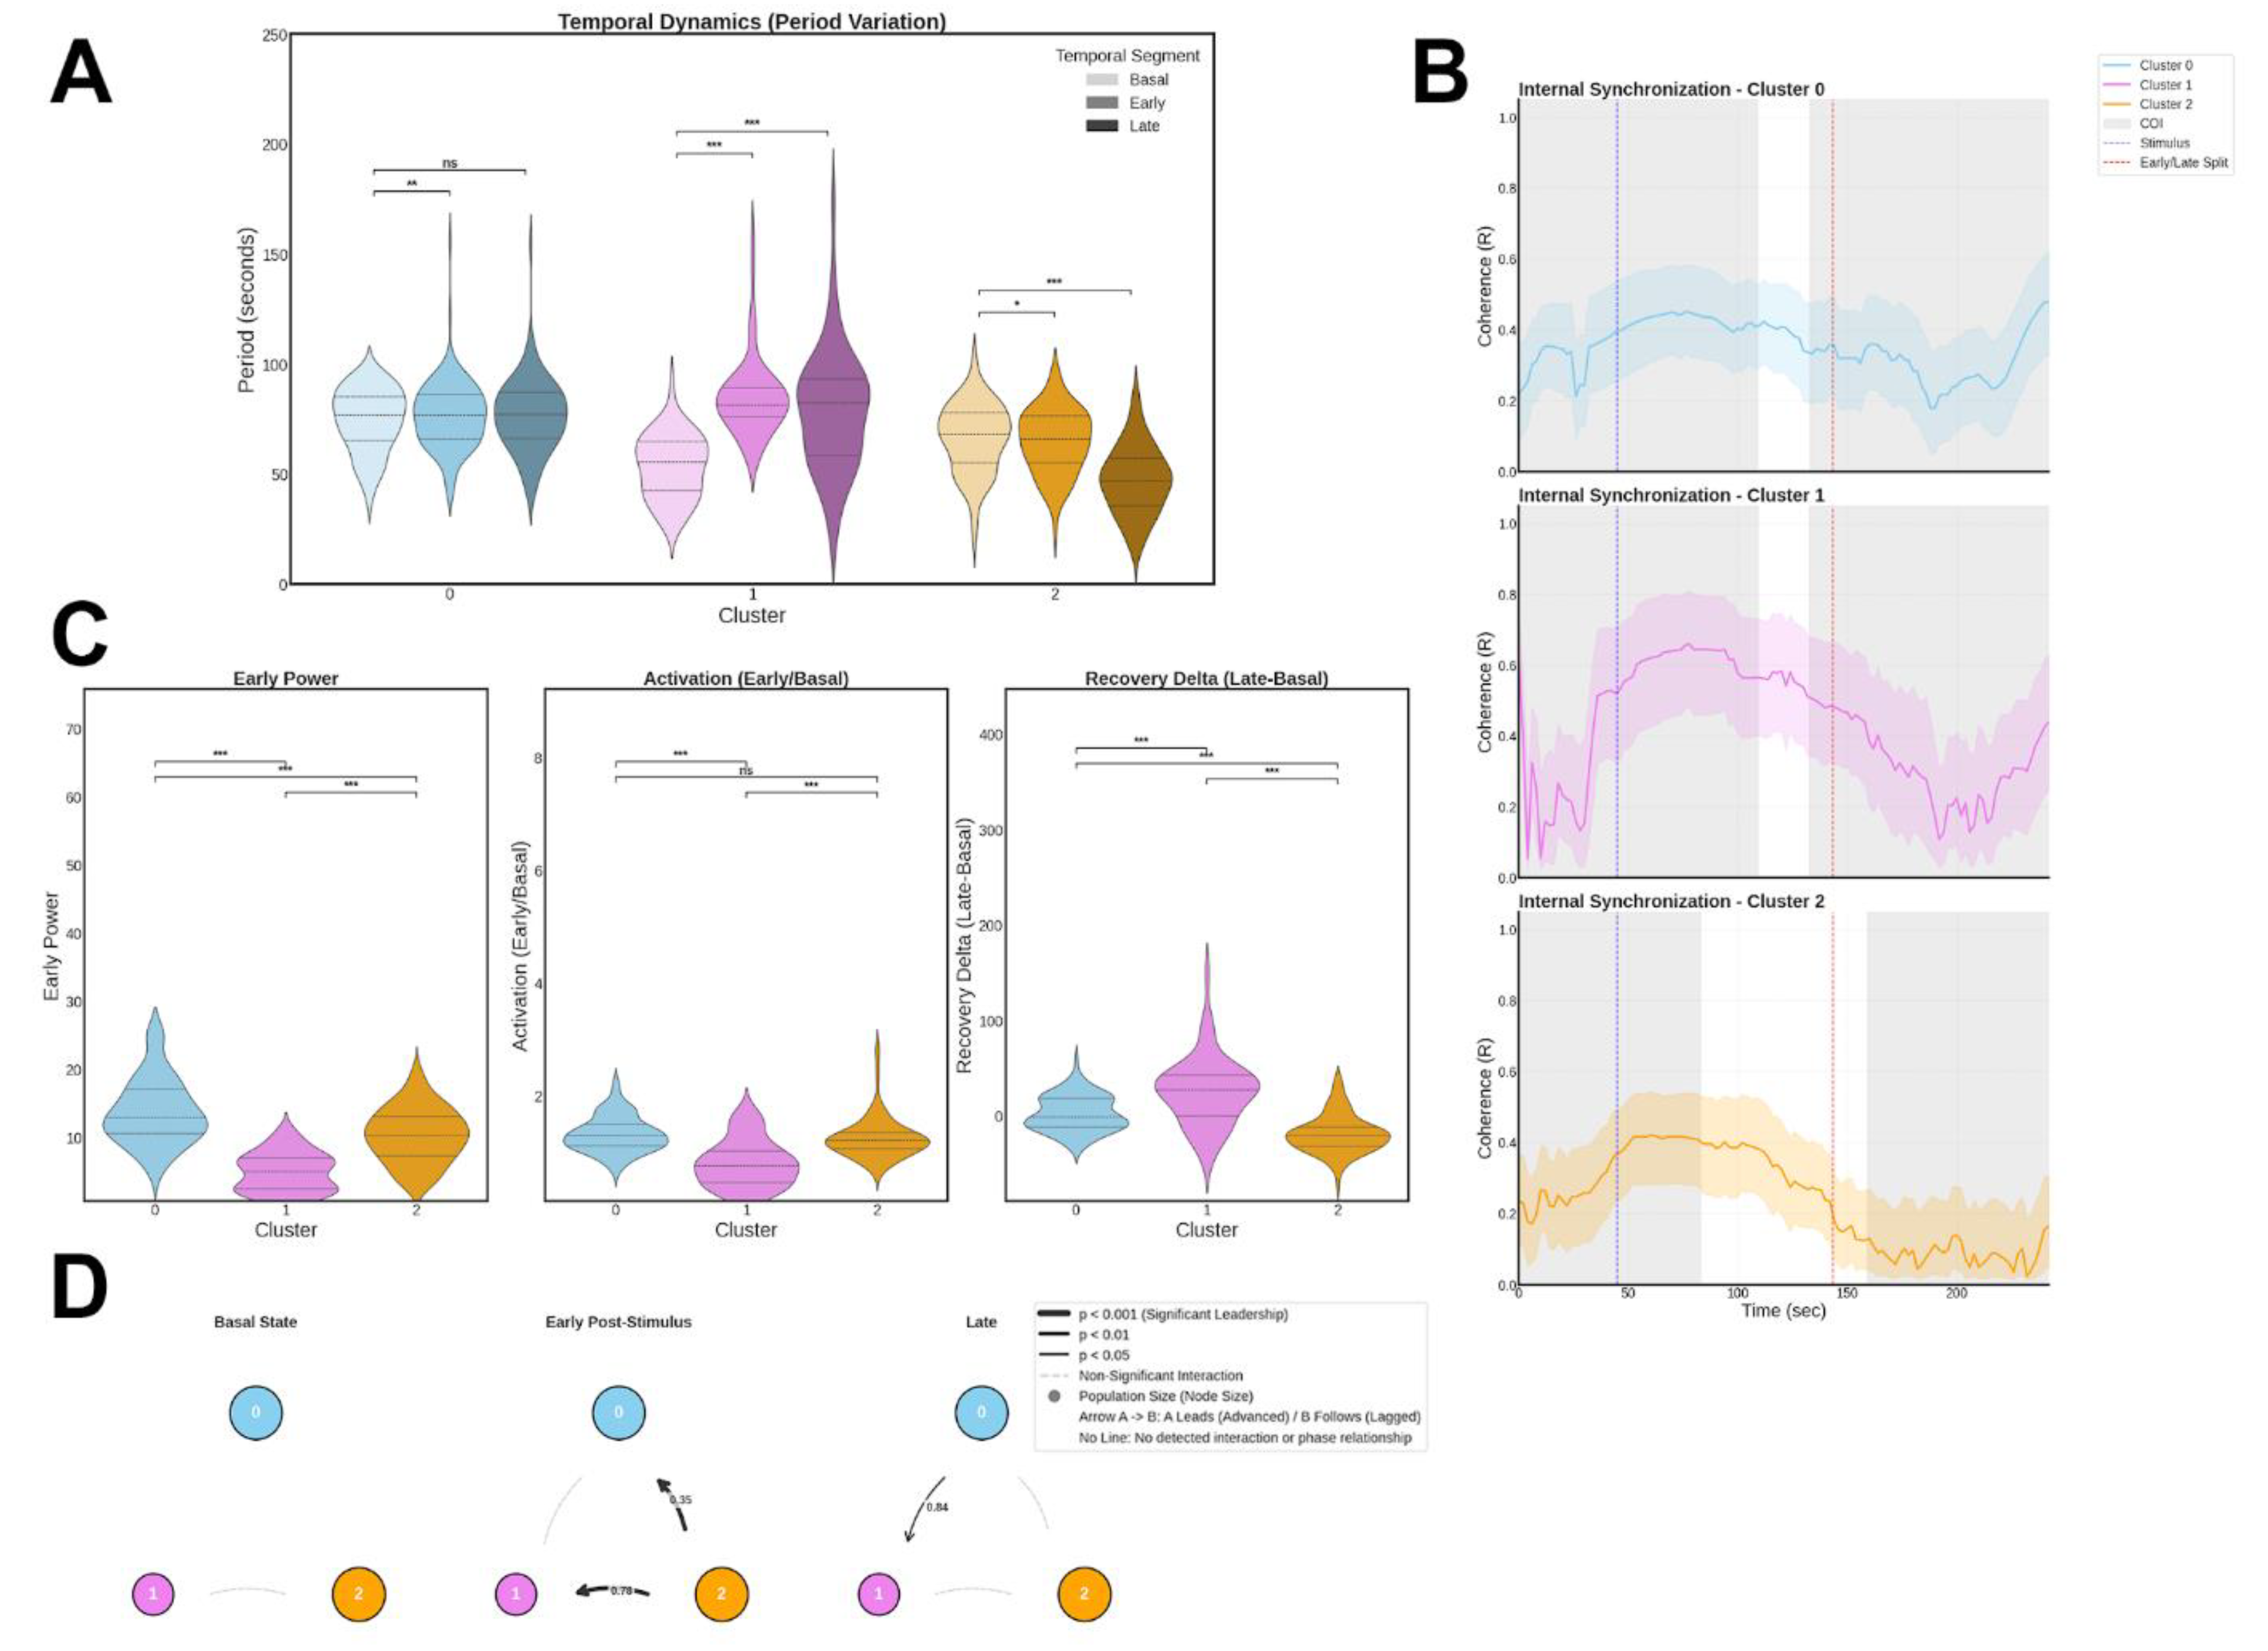
Figure 5.
(A) Population Landscape. Unsupervised UMAP projection resolves the human-derived MIO-M1 population (N=195) into four clear functional subpopulations. (B) Cell Distribution. The numerical distribution of the human glial circuit is led by Cluster 0 (36.9%), followed by Cluster 2 (26.7%), Cluster 1 (20.5%), and the specialized Cluster 3 (15.9%). Panel (C) Hierarchical Organization. Agglomerative tree resolves functional boundaries at an extended hierarchical linkage distance of approximately 60 AU. (D) Temporal Signals. Average signals reveal sophisticated kinetic strategies with extended temporal recording axes (>500 s) required to capture high-intensity envelopes, particularly the “Super-Reactor” profile of Cluster 3. (E) Kinetic Trajectories. Period-over-time curves uncover human-specific ultra-slow rhythms (>100 s). Most notably, Cluster 3 maintains a stable basal periodicity of ~110 s before executing a precipitous late-onset period contraction down to ~40 s after t=450 s (p=0.000003), while Cluster 0 tracks a precise homeostatic reversal to baseline following a transient shift. Gray shaded areas represent the Cone of Influence (COI) estimated via pyBOAT, ensuring the technical integrity of these human-specific periodicities.
Figure 5.
(A) Population Landscape. Unsupervised UMAP projection resolves the human-derived MIO-M1 population (N=195) into four clear functional subpopulations. (B) Cell Distribution. The numerical distribution of the human glial circuit is led by Cluster 0 (36.9%), followed by Cluster 2 (26.7%), Cluster 1 (20.5%), and the specialized Cluster 3 (15.9%). Panel (C) Hierarchical Organization. Agglomerative tree resolves functional boundaries at an extended hierarchical linkage distance of approximately 60 AU. (D) Temporal Signals. Average signals reveal sophisticated kinetic strategies with extended temporal recording axes (>500 s) required to capture high-intensity envelopes, particularly the “Super-Reactor” profile of Cluster 3. (E) Kinetic Trajectories. Period-over-time curves uncover human-specific ultra-slow rhythms (>100 s). Most notably, Cluster 3 maintains a stable basal periodicity of ~110 s before executing a precipitous late-onset period contraction down to ~40 s after t=450 s (p=0.000003), while Cluster 0 tracks a precise homeostatic reversal to baseline following a transient shift. Gray shaded areas represent the Cone of Influence (COI) estimated via pyBOAT, ensuring the technical integrity of these human-specific periodicities.
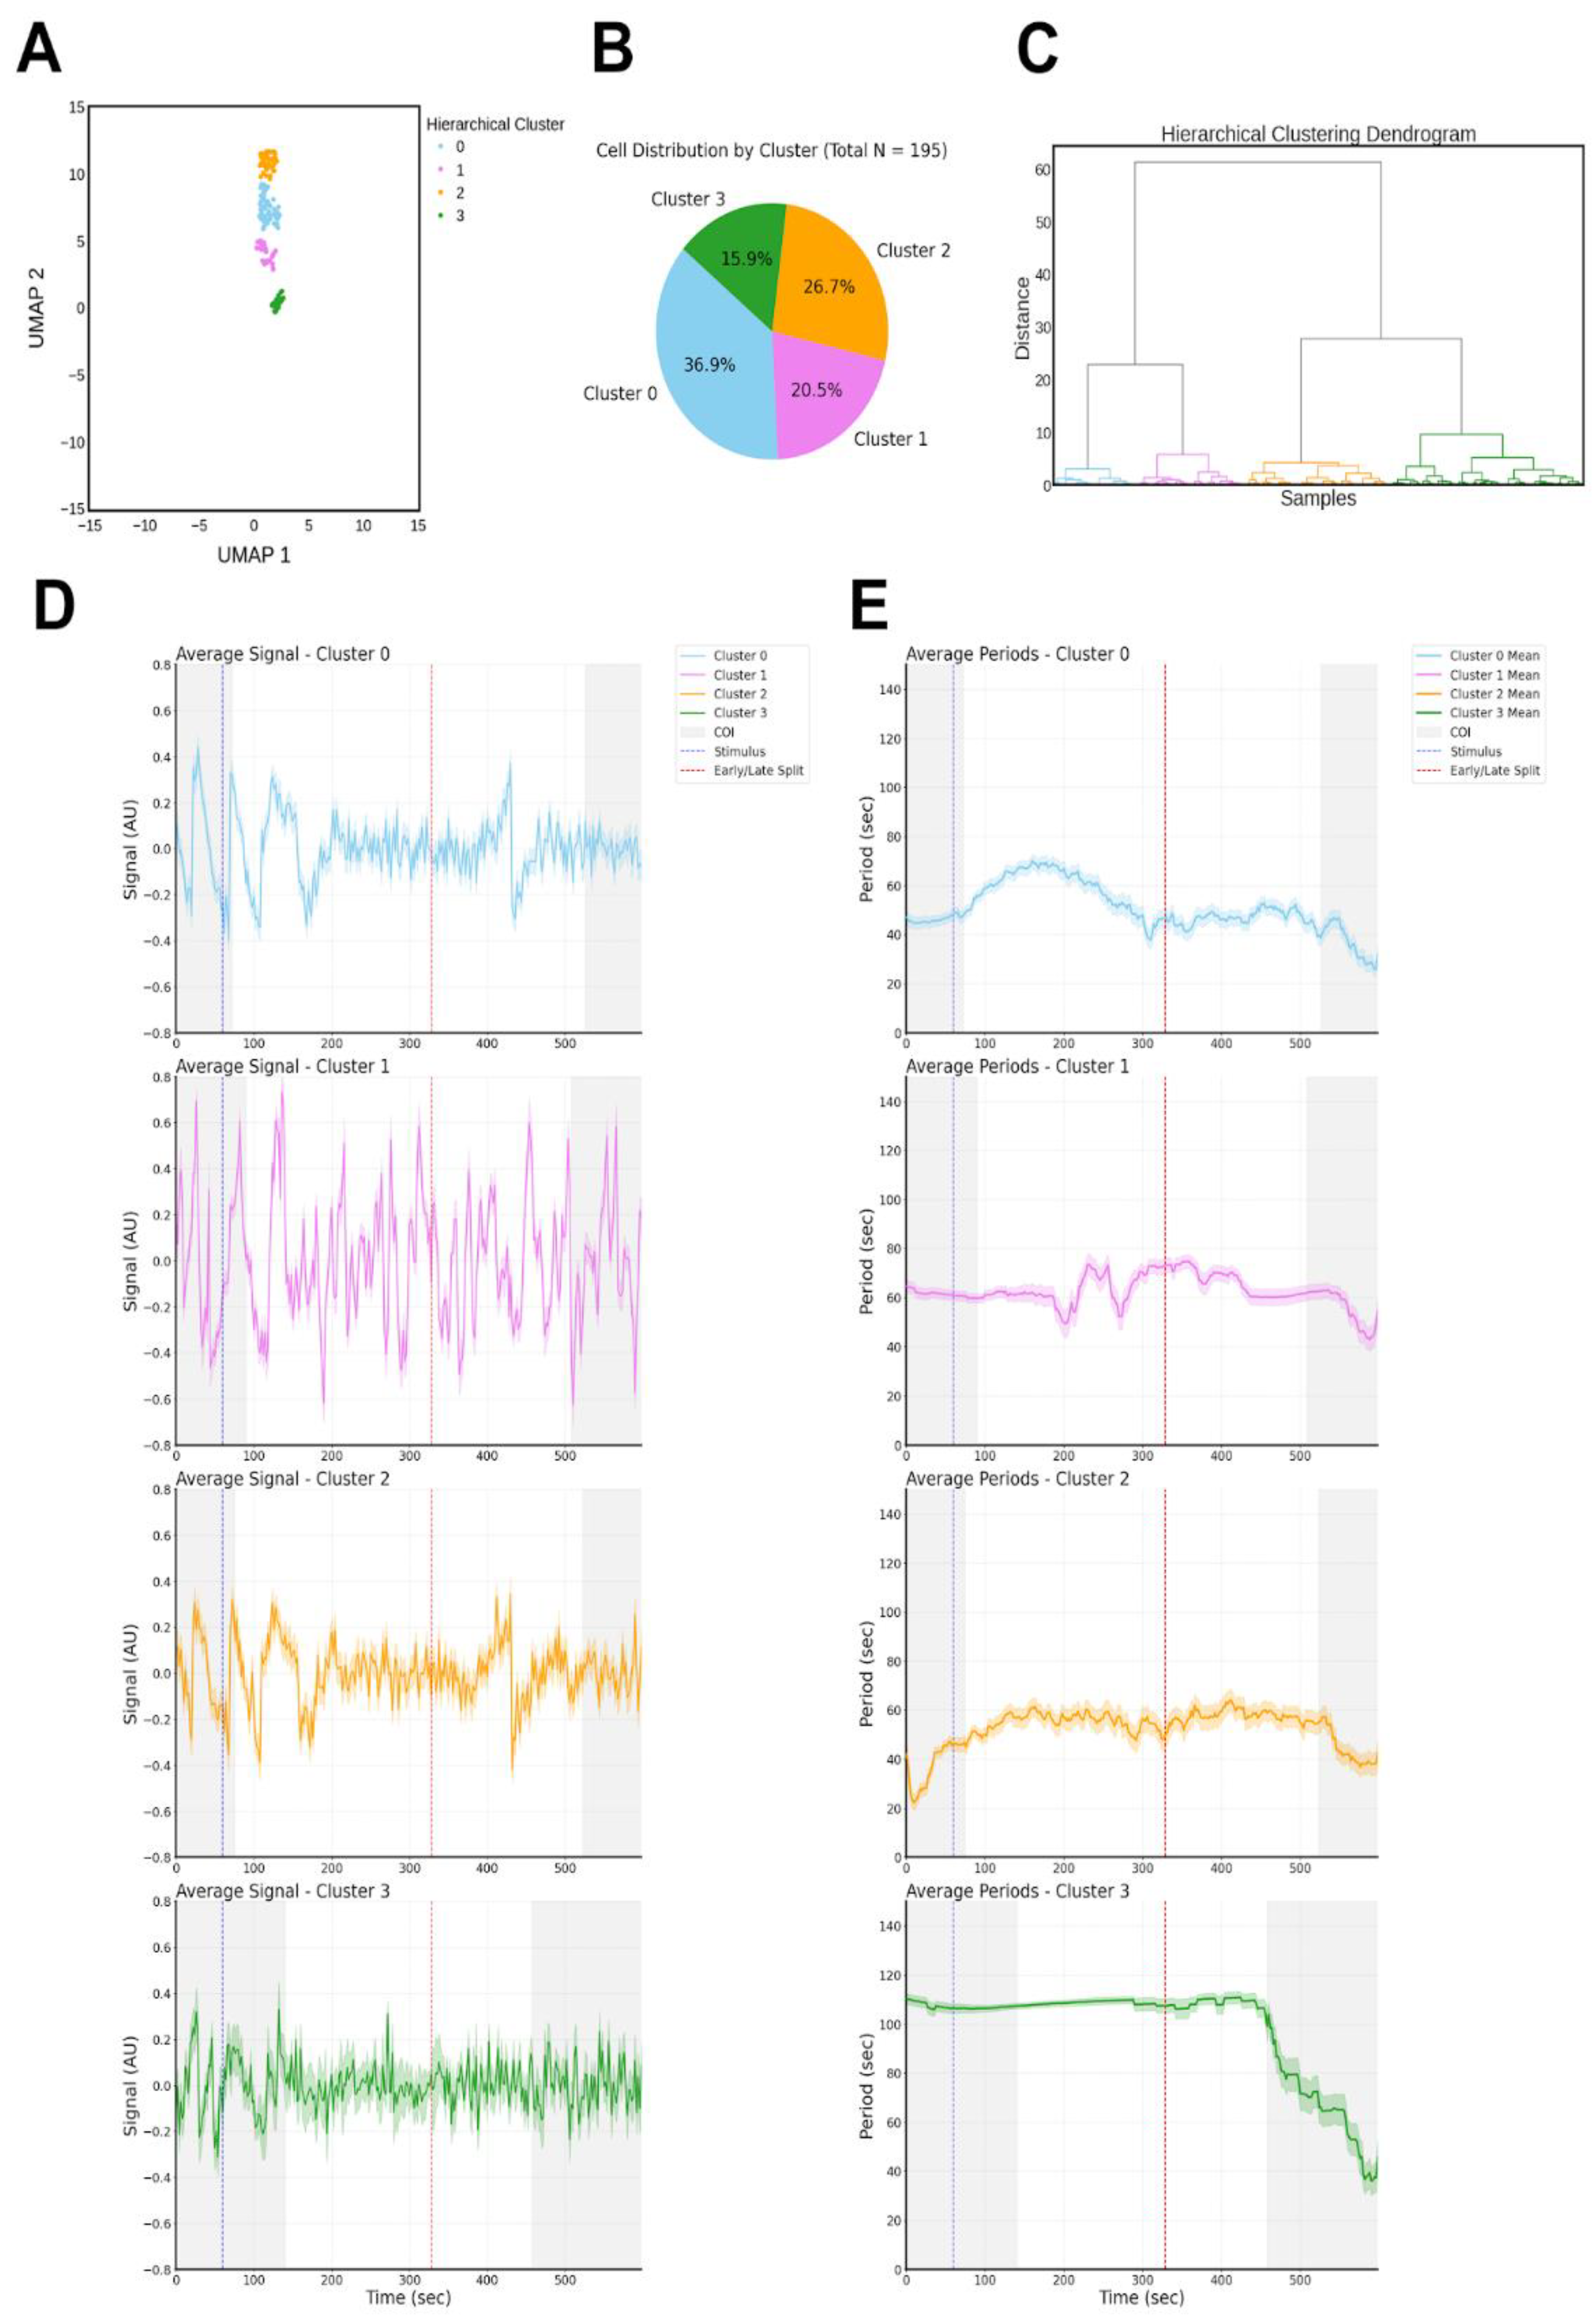
Figure 6.
Intra-cluster period variation analysis (A) violin plots compare the period distributions across the basal state and post-stimulus phases (early and late) for each cluster. Statistical validation identifies Cluster 2 as exhibiting severe and persistent period alterations across both post-stimulus windows (p<0.001), while Cluster 3 is characterized by a stable basal periodicity (∼110 s) followed by a precipitous late-onset period contraction down to ∼40 s (p<0.001). Internal synchronization trajectories (B) reveal that MIO-M1 cells operate within a highly integrated framework, with angular coherence (R) reaching sustained peaks of 0.6–0.8 for Clusters 0 and 1 during both early and late response phases, representing a level of high-fidelity phase-locking significantly higher than that of primary models. Functional logic analysis via inter-cluster violin plots (C) identifies the distinct parametric fingerprints that define specialized operational roles. Cluster 3 emerges as the circuit’s primary energetic responder, exhibiting an extreme Early Activation Power signature (>34) that significantly outperforms all other subpopulations (p<0.001). This dominant metabolic recruitment is corroborated by the Activation Ratio and Recovery Delta metrics, confirming that Cluster 3 executes the most profound kinetic reconfigurations following the photic stimulus. The underlying directed network architecture (D) maps the transition from a disorganized basal state into a sophisticated, multi-hub functional hierarchy derived from Delta-Phase (ΔΦ) analysis. In the dark Basal state, the circuit consists of largely uncoupled oscillators (p>0.05). Upon photic activation, the Early post-stimulus phase is dominated by a directed cascade where the active sensor Cluster 2 exerts powerful leadership over Cluster 3 (ΔΦ=1.32;p<0.001). By the Late recovery phase, the circuit undergoes structural reorganization where Cluster 1 emerges as the central node, establishing significant directed leadership over both the pacemaker core Cluster 0 (ΔΦ=0.86) and the energy reactor Cluster 3 (ΔΦ=0.56), while Cluster 0 maintains secondary leadership over Cluster 2 (ΔΦ=0.81;p<0.001). In these maps, arrow direction indicates temporal leadership and line width reflects statistical significance. Gray shaded areas represent the Cone of Influence (COI) estimated via pyBOAT, ensuring that network metrics are derived from mathematically secure biological oscillations.
Figure 6.
Intra-cluster period variation analysis (A) violin plots compare the period distributions across the basal state and post-stimulus phases (early and late) for each cluster. Statistical validation identifies Cluster 2 as exhibiting severe and persistent period alterations across both post-stimulus windows (p<0.001), while Cluster 3 is characterized by a stable basal periodicity (∼110 s) followed by a precipitous late-onset period contraction down to ∼40 s (p<0.001). Internal synchronization trajectories (B) reveal that MIO-M1 cells operate within a highly integrated framework, with angular coherence (R) reaching sustained peaks of 0.6–0.8 for Clusters 0 and 1 during both early and late response phases, representing a level of high-fidelity phase-locking significantly higher than that of primary models. Functional logic analysis via inter-cluster violin plots (C) identifies the distinct parametric fingerprints that define specialized operational roles. Cluster 3 emerges as the circuit’s primary energetic responder, exhibiting an extreme Early Activation Power signature (>34) that significantly outperforms all other subpopulations (p<0.001). This dominant metabolic recruitment is corroborated by the Activation Ratio and Recovery Delta metrics, confirming that Cluster 3 executes the most profound kinetic reconfigurations following the photic stimulus. The underlying directed network architecture (D) maps the transition from a disorganized basal state into a sophisticated, multi-hub functional hierarchy derived from Delta-Phase (ΔΦ) analysis. In the dark Basal state, the circuit consists of largely uncoupled oscillators (p>0.05). Upon photic activation, the Early post-stimulus phase is dominated by a directed cascade where the active sensor Cluster 2 exerts powerful leadership over Cluster 3 (ΔΦ=1.32;p<0.001). By the Late recovery phase, the circuit undergoes structural reorganization where Cluster 1 emerges as the central node, establishing significant directed leadership over both the pacemaker core Cluster 0 (ΔΦ=0.86) and the energy reactor Cluster 3 (ΔΦ=0.56), while Cluster 0 maintains secondary leadership over Cluster 2 (ΔΦ=0.81;p<0.001). In these maps, arrow direction indicates temporal leadership and line width reflects statistical significance. Gray shaded areas represent the Cone of Influence (COI) estimated via pyBOAT, ensuring that network metrics are derived from mathematically secure biological oscillations.
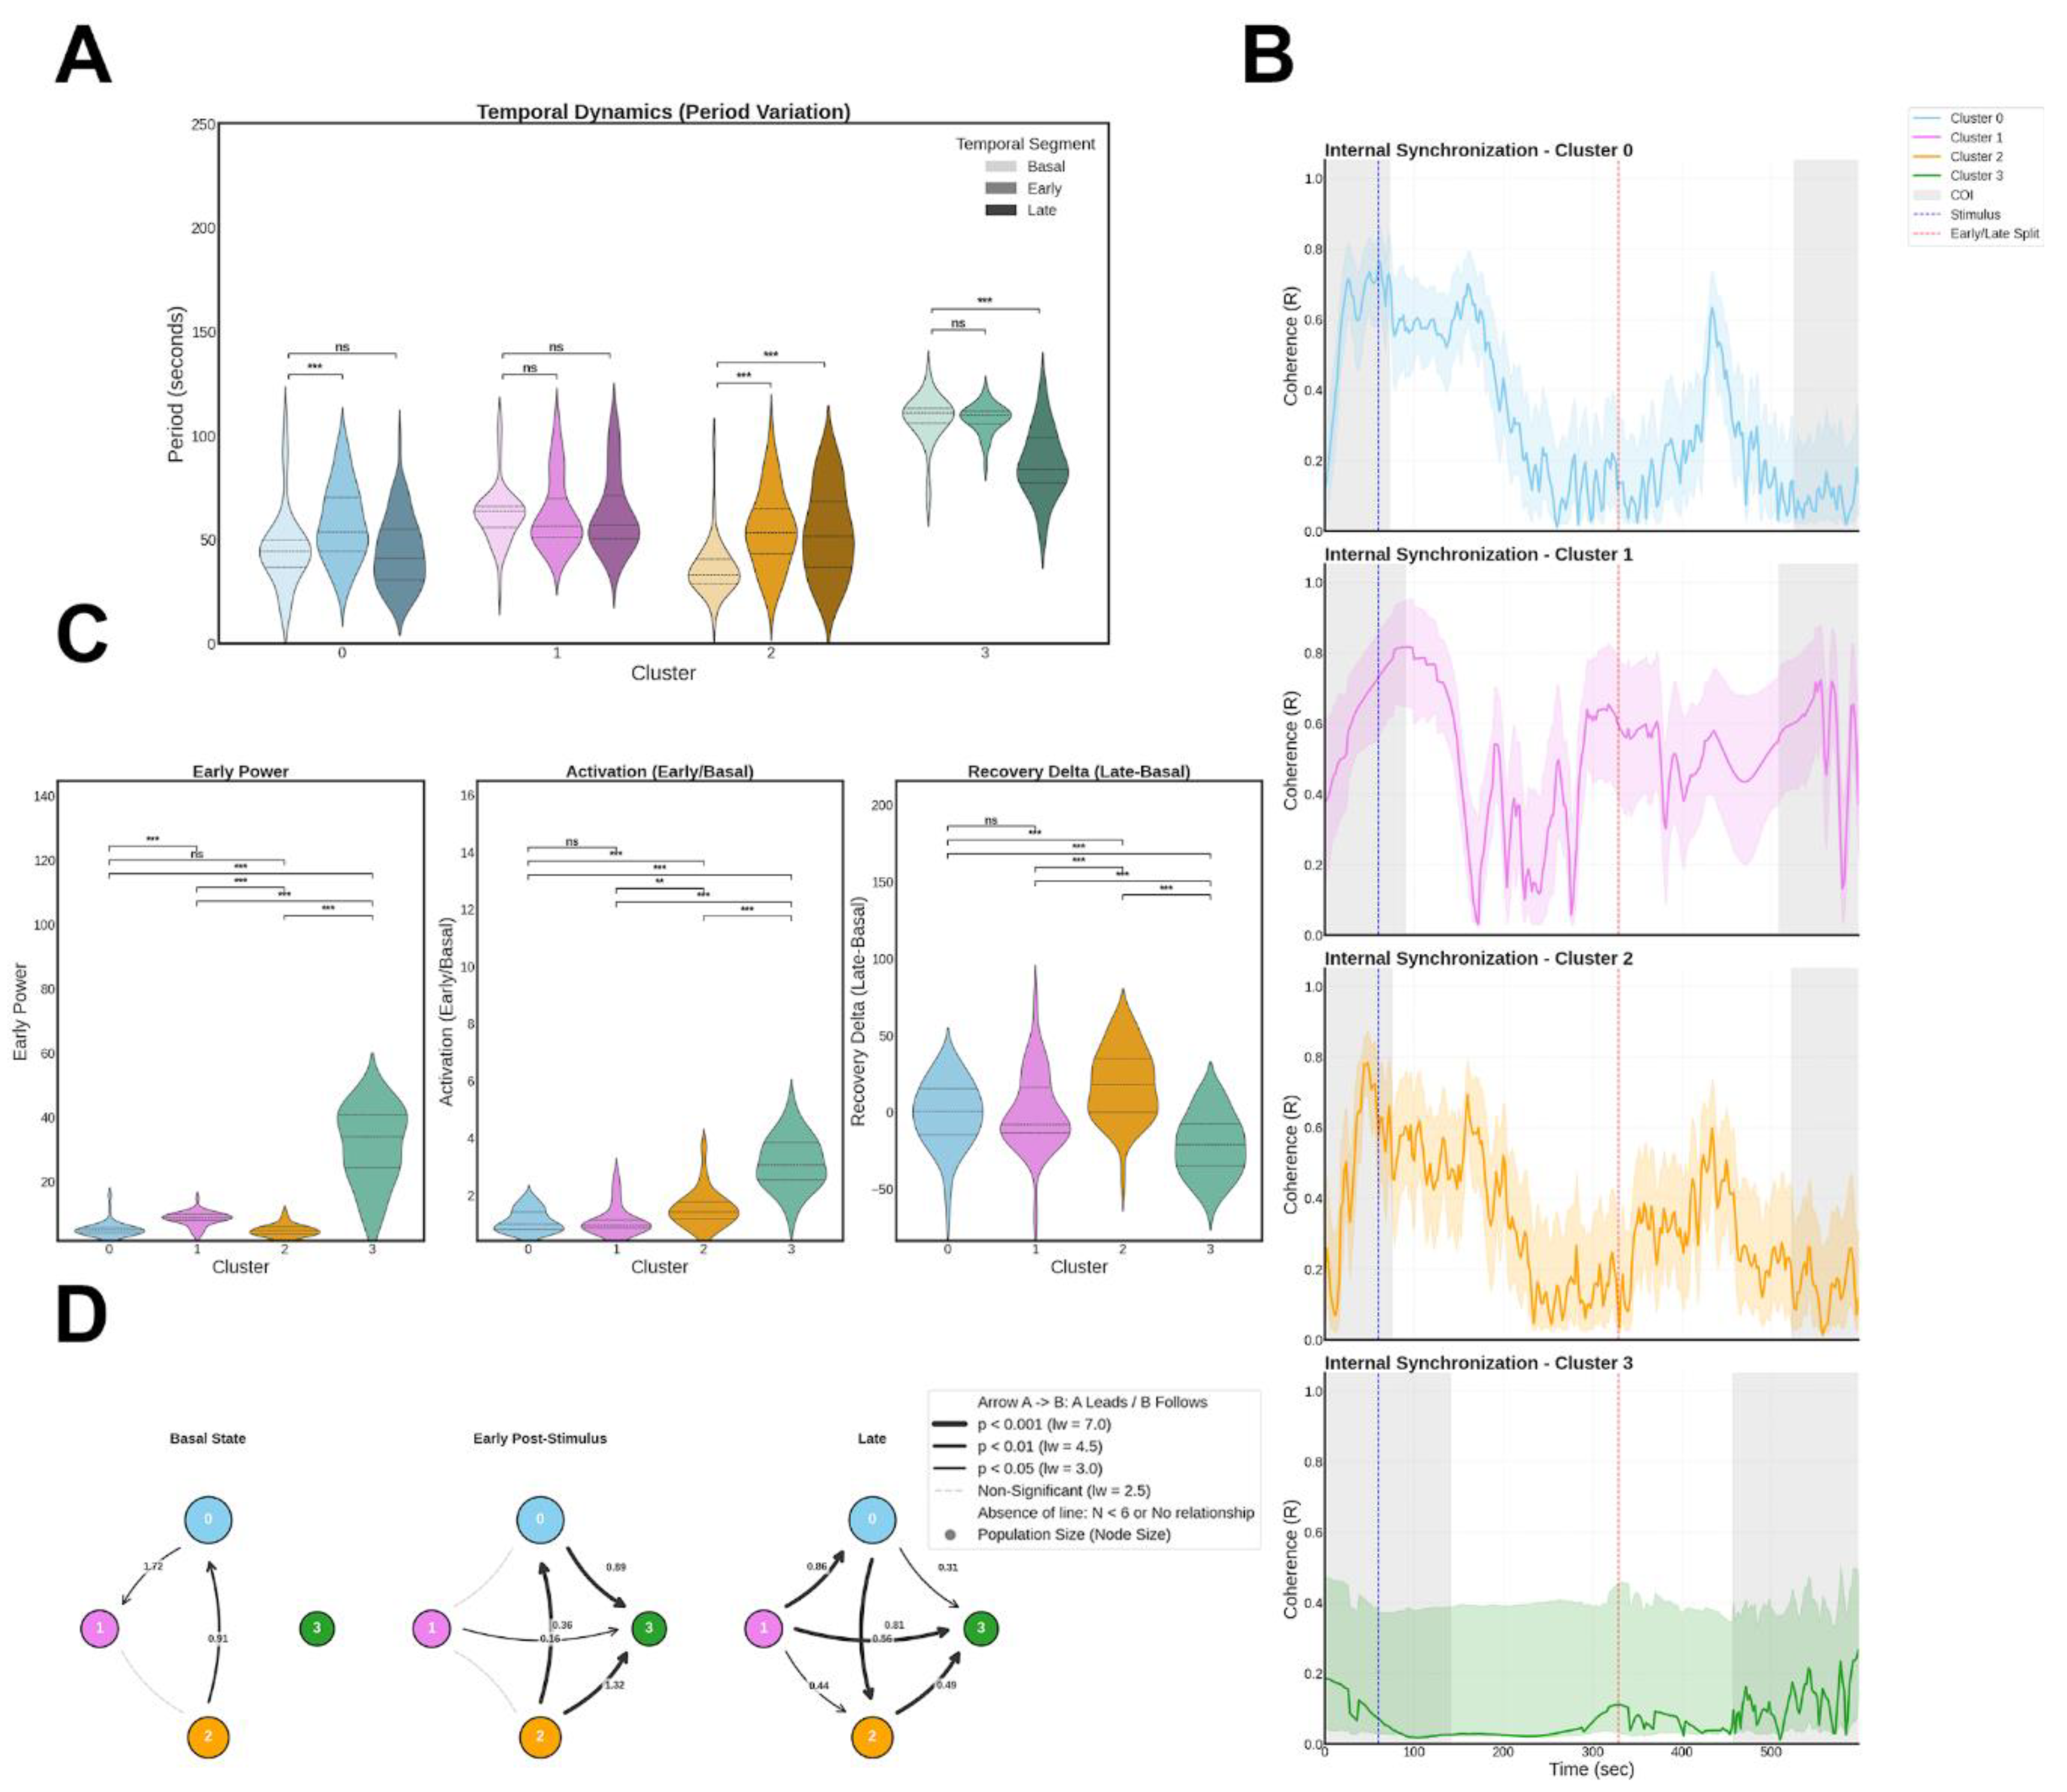
Disclaimer/Publisher’s Note: The statements, opinions and data contained in all publications are solely those of the individual author(s) and contributor(s) and not of MDPI and/or the editor(s). MDPI and/or the editor(s) disclaim responsibility for any injury to people or property resulting from any ideas, methods, instructions or products referred to in the content. |
© 2026 by the authors. Licensee MDPI, Basel, Switzerland. This article is an open access article distributed under the terms and conditions of the Creative Commons Attribution (CC BY) license (http://creativecommons.org/licenses/by/4.0/).
Copyright: This open access article is published under a Creative Commons CC BY 4.0 license, which permit the free download, distribution, and reuse, provided that the author and preprint are cited in any reuse.


