

Submitted:
01 August 2026
Posted:
04 August 2026
You are already at the latest version
Abstract
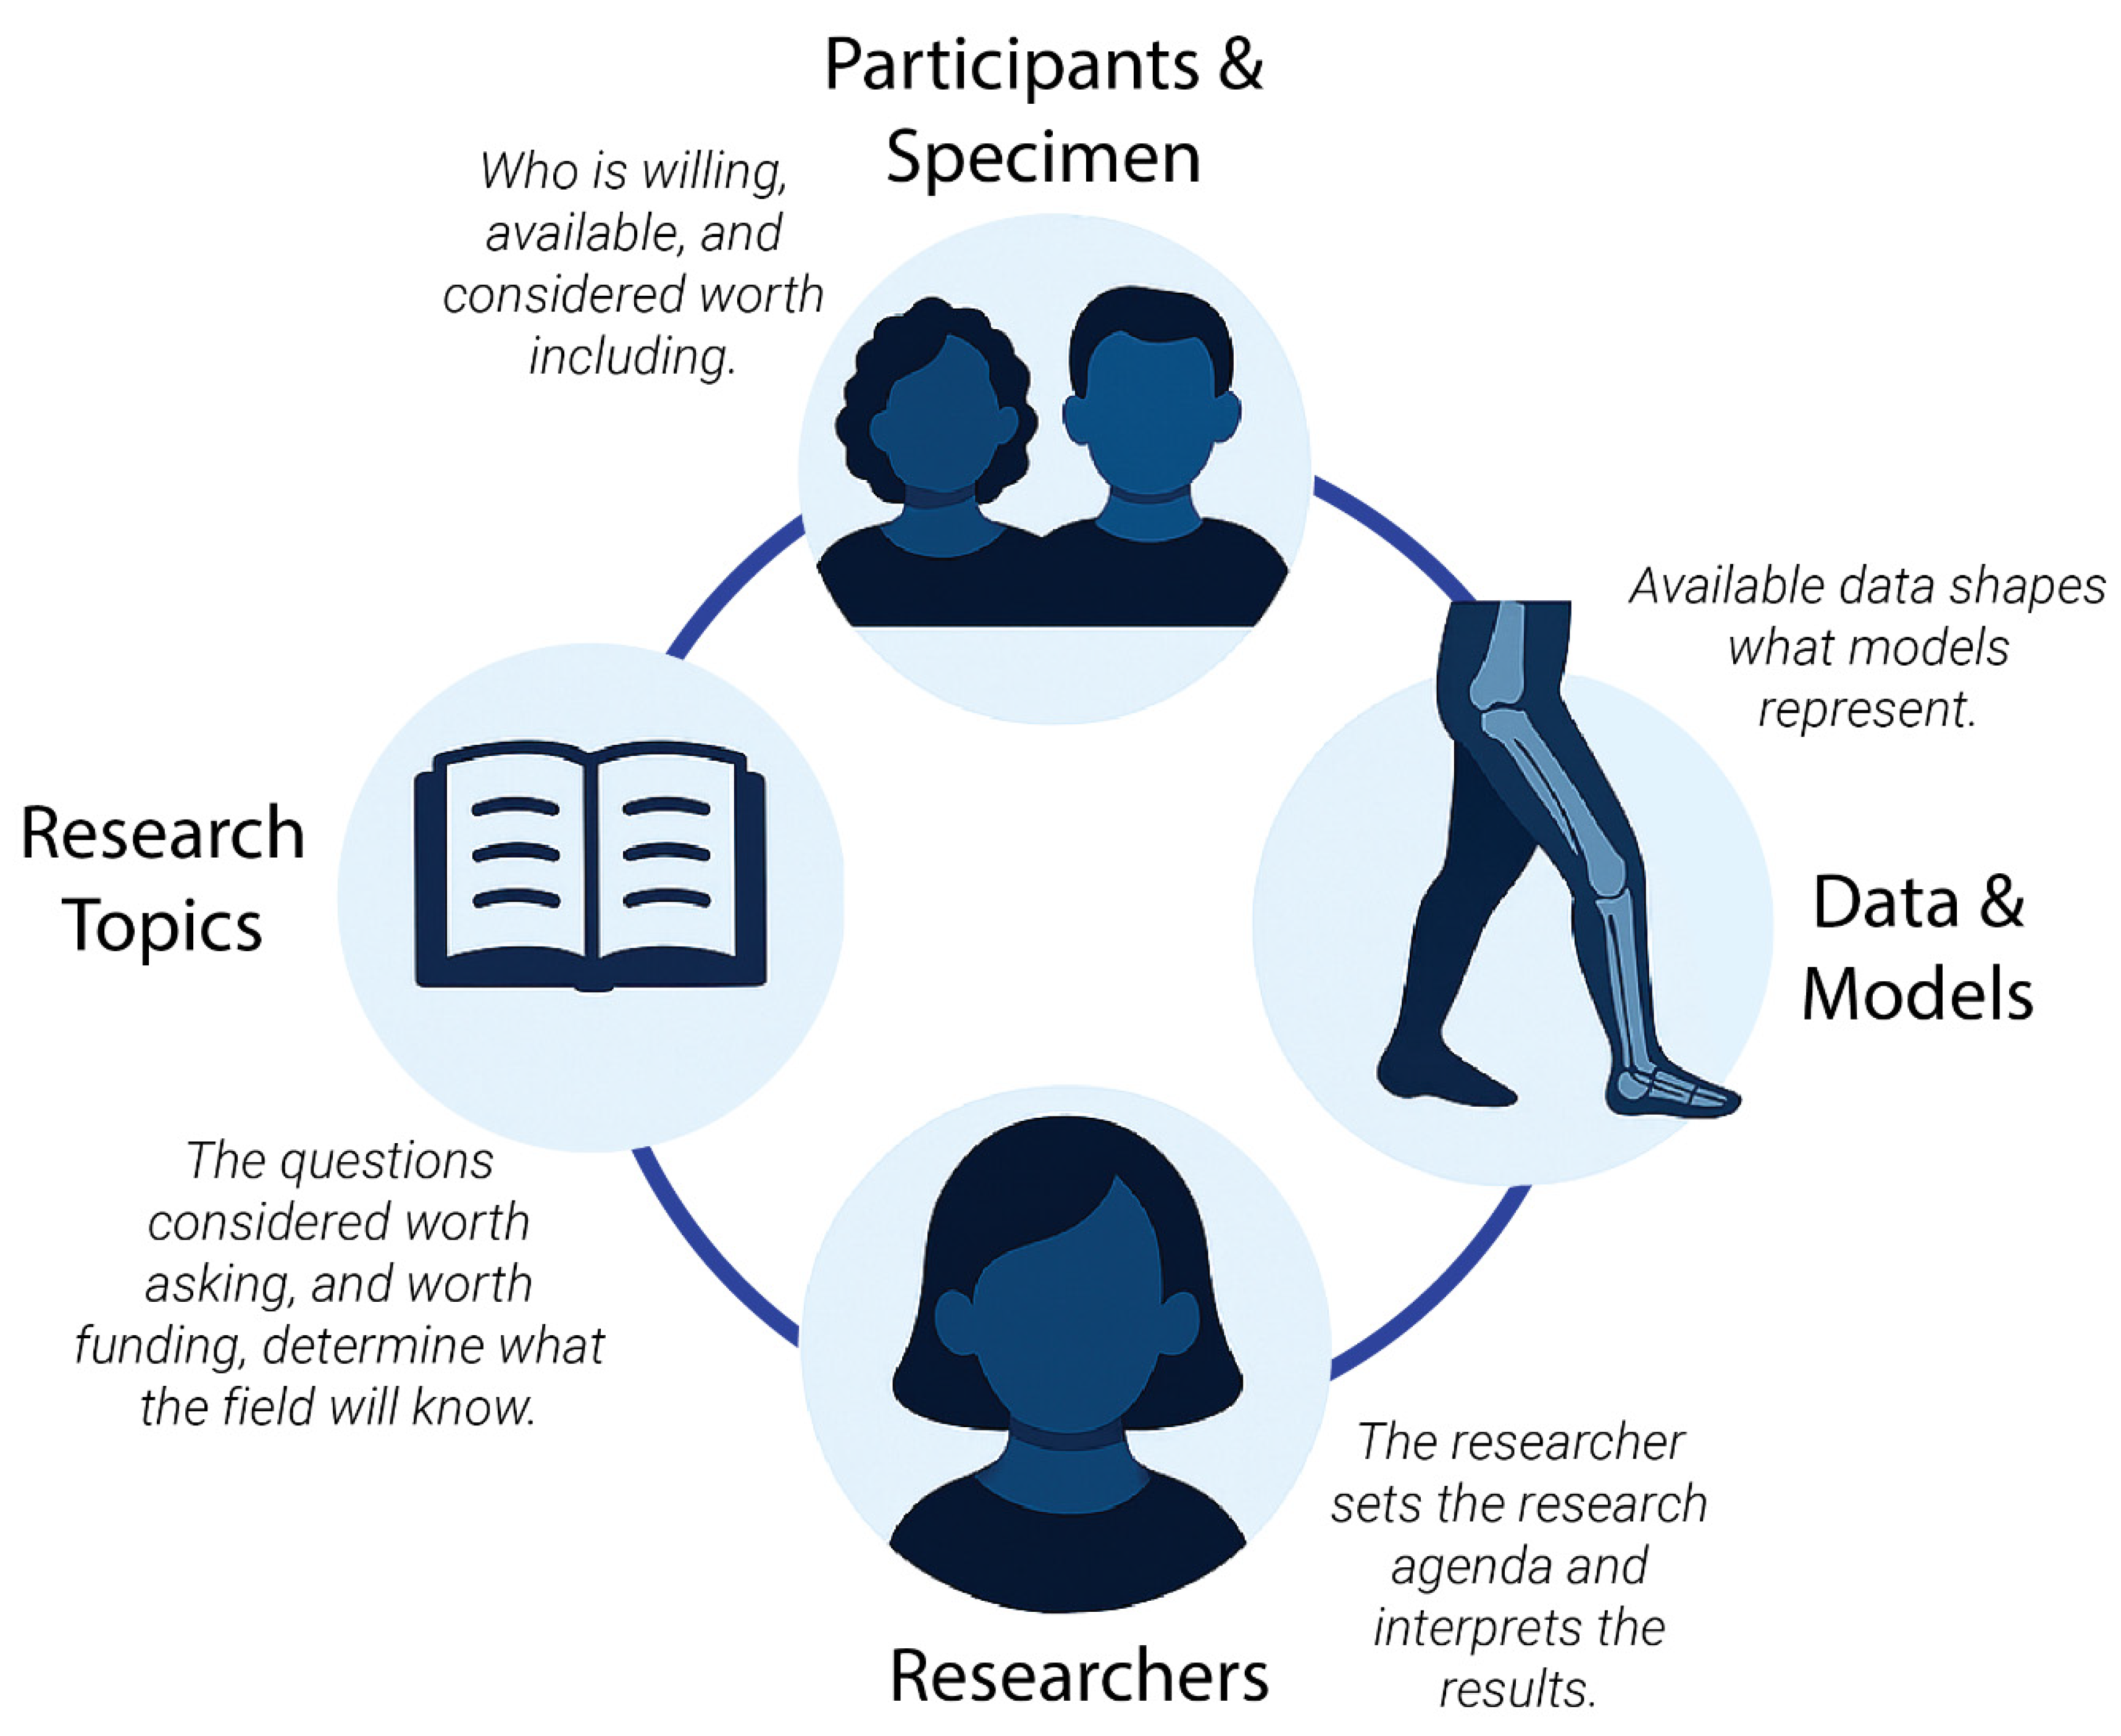
Biomechanics is a research area in which we explore the human body with tools from mathematics and physics. We create models of the human body to study its function, limitations, and performance, and to develop technologies that replace or support its components. The human is inherently intertwined with our research focus. But the human is not just our topic of research, not just something captured in our models and data. We, as researchers, are equally entangled with what we study. We follow our intuition, our experiences, and our knowledge to steer research in particular directions. We choose which topics to pursue, which people to recruit into our teams, which participants to include or which specimens to select, and how to interpret and report what that research produces. In this article, we look at the biomechanics field through four perspectives on where humans are involved: the participants and specimens, the data and models, the researchers, and the research topics. These four perspectives form an interconnected cycle, bias in any one of them propagates through the others. Throughout, our focus is on sex and gender differences within these four perspectives. We therefore begin with a brief exploration of what sex and gender mean, and why the distinction matters for biomechanics research.
Keywords:
biomechanics
; bias
; sex
; gender
Figure 1.
The four perspectives through which bias can enter biomechanics research, forming an interconnected cycle: the researcher, whose background and assumptions shape decisions; the research topic, which reflects what questions are considered worth asking; the participants and specimen, who determine whose bodies the resulting models are built on; and the data, which carries forward the consequences of all three. Bias in any one of these elements propagates through the others.
Figure 1.
The four perspectives through which bias can enter biomechanics research, forming an interconnected cycle: the researcher, whose background and assumptions shape decisions; the research topic, which reflects what questions are considered worth asking; the participants and specimen, who determine whose bodies the resulting models are built on; and the data, which carries forward the consequences of all three. Bias in any one of these elements propagates through the others.
1. Sex and Gender
We will use the terms gender and sex. The difference between these terms is, especially for the field of biomechanics critical. Sex is often referred to as the biological categorization of male, female, and intersex bodies, based on chromosomes, gonads, hormones, and reproductive anatomy. Gender is the social construct of the roles, norms, and expectations a society attaches to being a man, woman, or another gender, including how someone identifies themselves, and how they are identified and treated by others [1]. As we will see, neither category is as clear-cut as this definition suggests. But the distinction itself is already useful.
Consider a biomechanical example. Through the 18th and 19th centuries, tight-lacing corsets were a dominant fashion practice for women in Western Europe and North America. Long-term tight-lacing reshaped the rib cage from the outside in. Skeletal studies of corseted women from this period show ribs bent inward at the front, sometimes overlapping vertebrae in the lower spine [2]. The mechanical consequences extended well beyond the skeleton: the same compression that deformed the ribs also displaced internal organs, restricted lung capacity, and impaired digestion (Figure 2). If we look only at the skeleton without its context, we might wrongly attribute this deformation to female sex. But the cause was not being biologically female. The cause was the gendered expectation that women, specifically, should wear a corset. Someone’s sex was unrelated to the deformation; what mattered was whether they were subject to this gendered norm. This shows that gender can have a direct influence on biomechanics and that gender differences can vary across culture and time.
Sex, just as gender, isn’t binary. To give an example close to our biomechanics field: sports is an arena where this becomes very clear [3]. Since the early 20th century, sports governing bodies have tried to police who is allowed to compete in the female category: invasive physical examinations in the 1930s, mandatory chromosome testing for every female Olympic athlete between 1968 and 1999, and current regulations that require some women to lower their natural testosterone before they can compete [4,5,6]. These practices share one assumption: that sex can be settled with a single test. Biology says otherwise. Sex is expressed across multiple levels: chromosomes, gonads, hormones, secondary sex characteristics, and these do not always align in the same direction (Figure 3). People with differences of sex development do not fit neatly into either typical category. This emphasizes that strict binary categories are artificial [4].
Even though sex and gender do not fit into a uniform or binary category, musculoskeletal disorders show sex and gender differences; For example, knee and hip osteoarthritis are more prevalent in older women [7], while herniated discs are more common in men. Certain sports injuries follow the same pattern; anterior cruciate ligament (ACL) tears and patellar dislocation occur more than twice as frequently in young women, whereas men are more prone to hamstring injuries [8,9]. And of course there are also hormone-specific concerns related to movement, such as when it is safe to return to sports after pregnancy and how the menstrual cycle or menopause affect musculoskeletal properties [10,11,12]. Recognizing and accounting for sex differences in the physiological system and gender differences in the use of that system is therefore important for the field of biomechanics. To effectively understand and account for these differences, we must be intentional and inclusive of diverse participants and specimens in our research
2. Human Behind the Model: Participants and Specimens
In 2025, we conducted a literature review of all articles published in the Journal of Biomechanics in the preceding year, 2024 [13]. The motivation came from a recurring pattern noticed while serving as an associate editor for the journal: many manuscripts generalized findings from single-sex or single-gender studies, most often male-only studies, to the population as a whole. This pattern raised a direct question: does an unconscious bias still persist in biomechanics, positioning males as the default in human research?
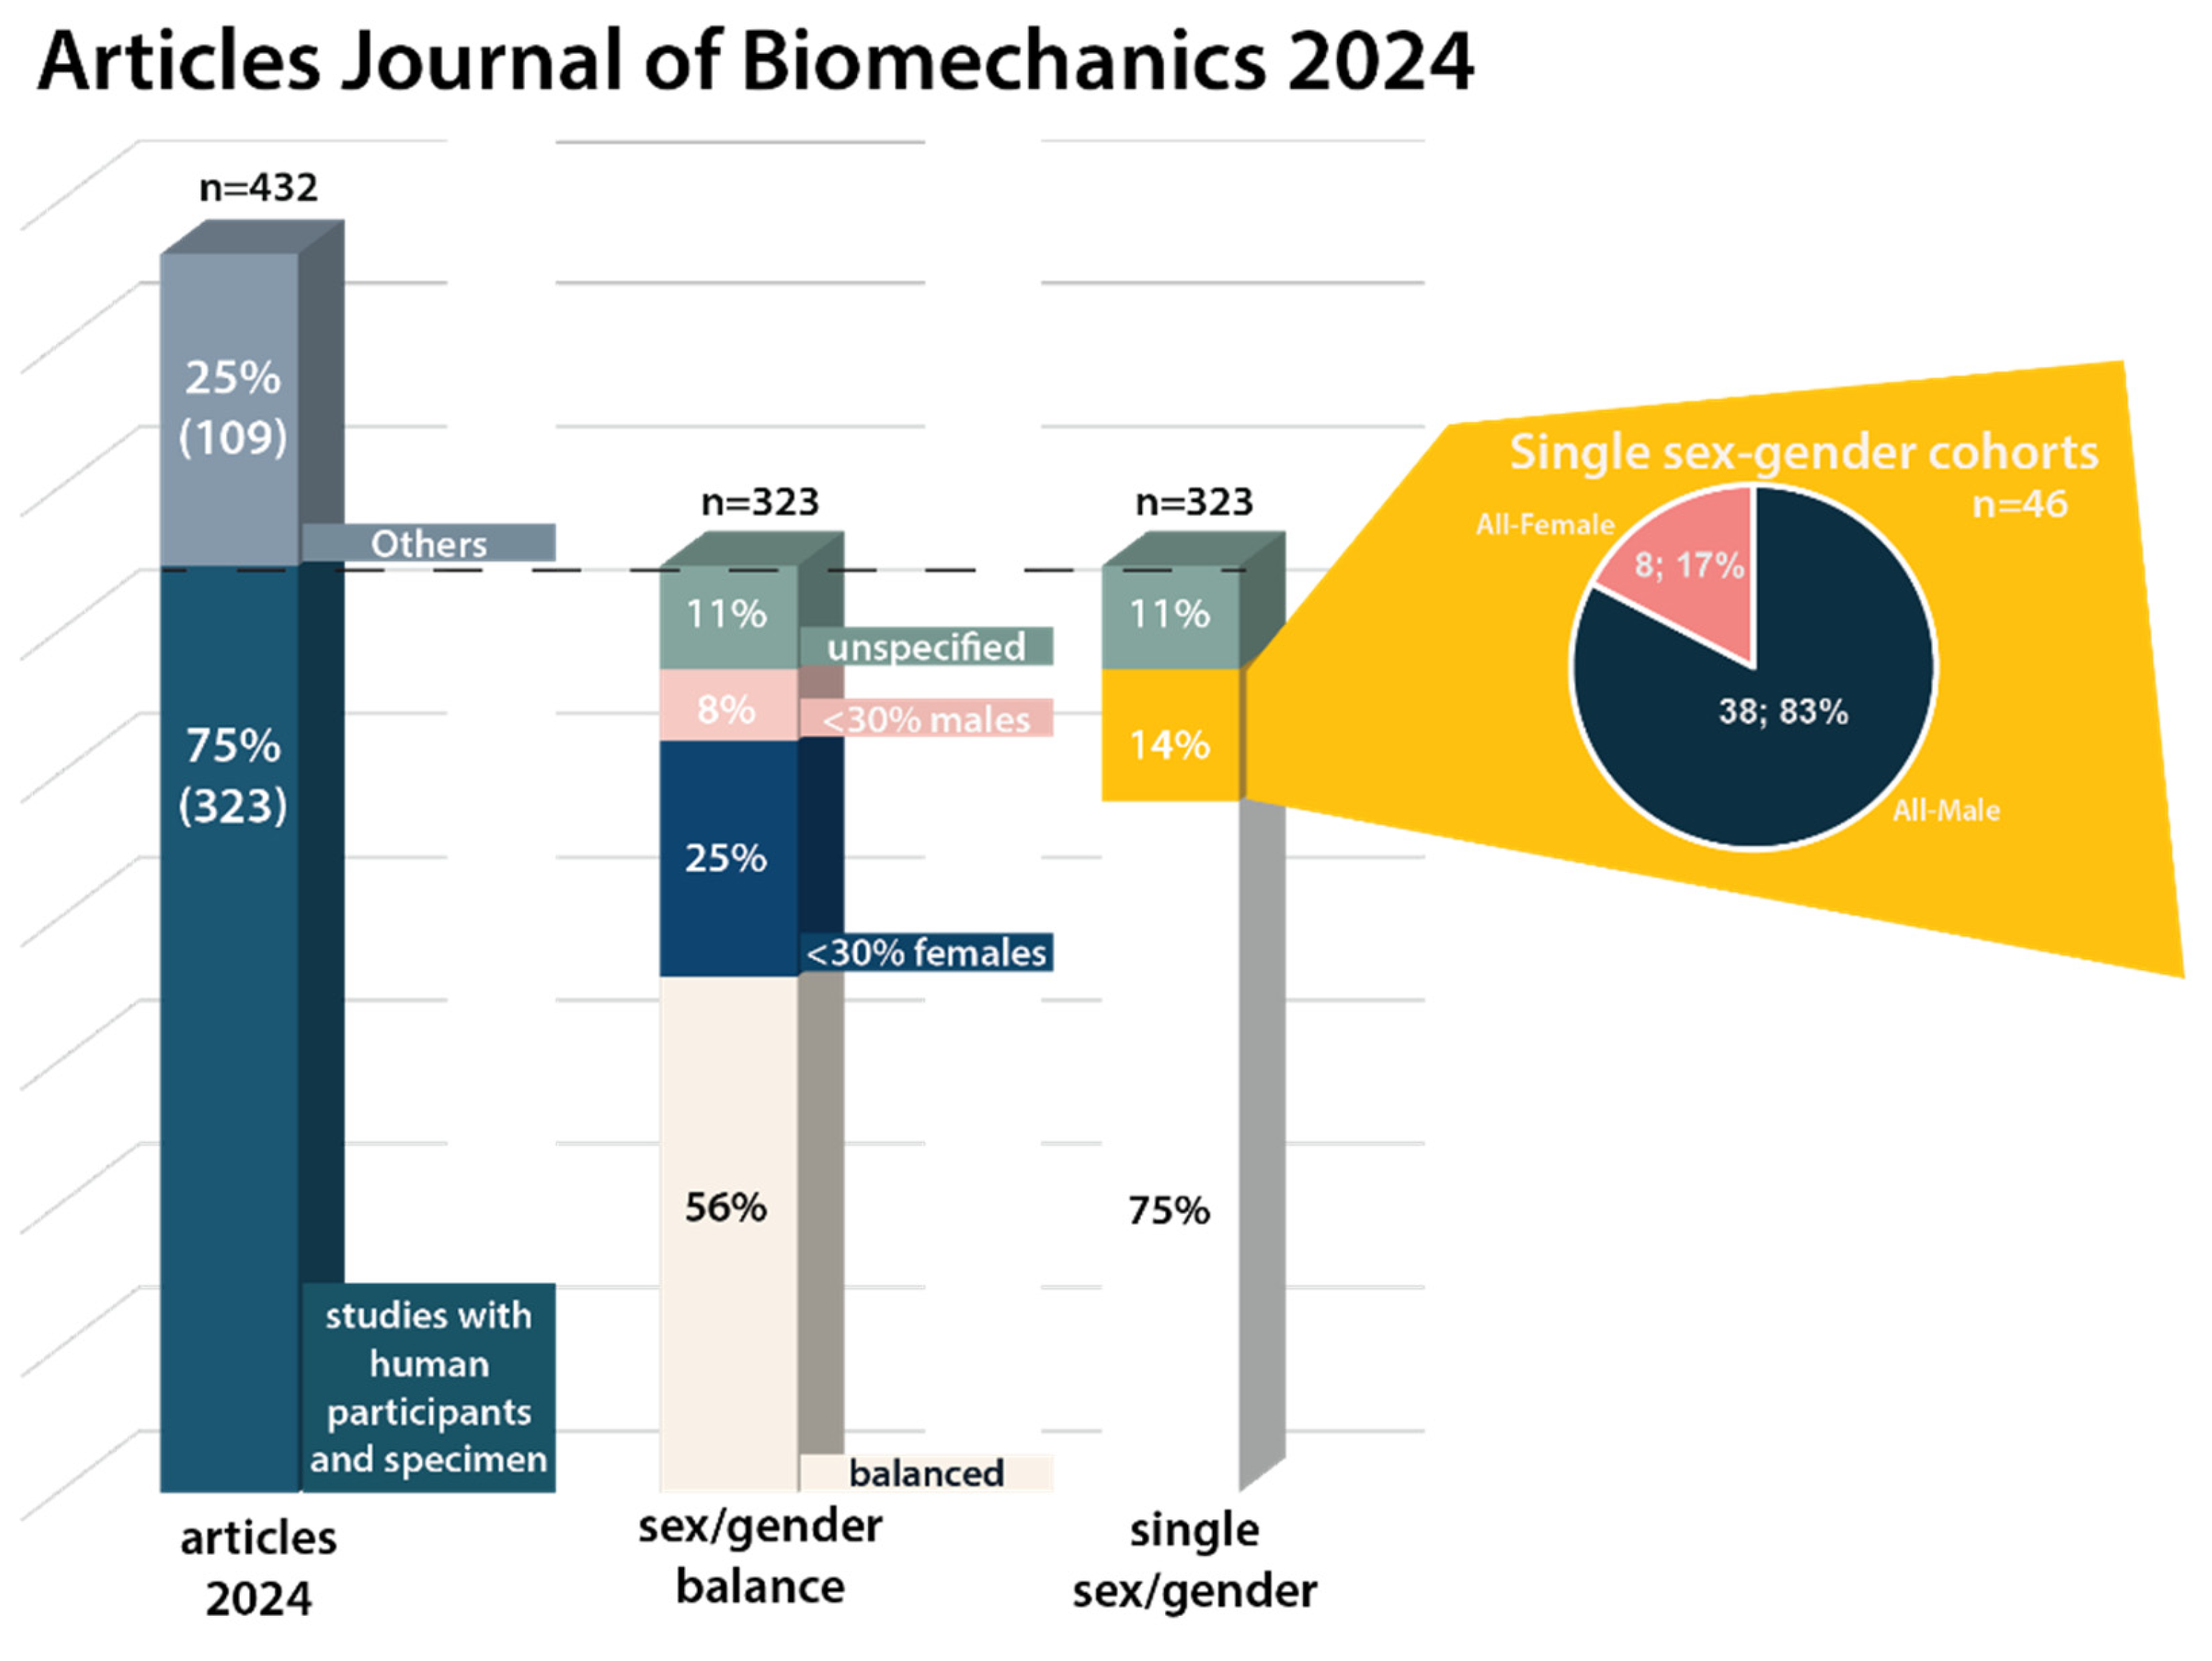
All 432 articles published in the journal that year were reviewed. Of these, 75% (N = 323) involved human participants or specimens and were analyzed for their gender/sex composition: how many participants were male, how many were female, and whether single-sex or single-gender studies gave a clear scientific rationale for that focus. Because most articles did not distinguish sex from gender explicitly, the combined term gender/sex was used throughout, without intending to collapse the distinction covered earlier in this article. In 11% of studies, gender/sex was not specified at all; intersex and nonbinary individuals did not appear in any article reviewed.
The results showed a clear and persistent imbalance. One in three studies (N = 107) were severely imbalanced, with fewer than 30% representation of either sex. That imbalance was not symmetric: studies with too few female participants outnumbered those with too few male participants by a factor of three (Figure 4). Overall, 14% (N = 46) of all 2024 publications with human participants and specimens studied only one gender/sex, and male-only studies outnumbered female-only studies almost fivefold (38 versus 8). The more telling pattern, though, was not the imbalance itself but the asymmetry in how it was reported. Female-only studies were transparent almost without exception, naming their focus in the title or abstract and providing a clear rationale. Male-only studies showed the opposite: only a handful named their focus up front, and most offered no justification at all for excluding women. Where reasons were given, they tended toward convenience, easier access to male participants, fewer cultural or logistical barriers in the lab, rather than a rationale tied to the research question itself.
A closer look at first authorship reveals two asymmetries. Female-only studies were almost always led by women (7 out of 8), while male-only studies had a mix of male and female first authors, with 32% female first authors. Female researchers are more likely to include female participants, but the reverse does not hold: having women on a research team does not automatically produce more inclusive study designs. Closing the gap requires more than diversity in who does the research; it requires conscious attention to who is included. This pattern is not new: earlier analyses of biomechanics conference abstracts found the same skew years before [14,15].
We named this pattern biasmechanics, not to assign blame to individual authors, but to give it a label researchers, reviewers, and editors could recognize and act on. Imbalance itself is not always a problem; there are legitimate reasons to study a single sex or gender, for instance when a condition predominantly affects one group, like pregnancy. The problem is the silence around exclusions that lack such a reason, and the asymmetry in which group is expected to explain its choices at all. Left unexamined, this quietly makes male data the unspoken default that the rest of the field gets measured against. The same convenience argument, taken seriously, would also have to acknowledge that geopolitical or cultural barriers to including women in a study are a logistical challenge to be solved, not a justification for exclusion: access to research as a participant is recognized internationally as a basic right [16,17], and treating it as optional sends a message researchers should be reluctant to send.
From this analysis, three concrete practices were put forward as a call for action. I) A sex or gender can only be excluded from a study with a clear scientific justification stated in the introduction and methods. II) The discussion and limitations sections should explicitly address how that exclusion affects the validity and generalizability of the findings. III) And titles and abstracts of single-sex or single-gender studies should say so plainly, so readers do not have to search for it.
Whether these recommendations have made a change is only partly answerable so far. By the time of writing, the Journal of Biomechanics author guidelines had added a dedicated section on reporting sex- and gender-based analyses, asking authors to integrate such analyses where relevant, to address sex/gender dimensions or declare them a limitation, and to state explicitly which definitions they used, pointing them toward the SAGER guidelines as a framework [1]. This is not an isolated move: SAGER itself dates to 2016, and biomedical journals adopted sex/gender reporting policies quickly after. Engineering, computer science, and orthopaedics-adjacent fields have been slower, biomechanics is still catching up to where medicine already stands. Notably, the imbalance we found is not unique to Journal of Biomechanics: a comparable analysis across six sport and exercise science journals from 2014–2020 found that 31% of studies were male-only and only 6% were female-only, a ratio close to our own [18], and a 1996–2021 review of vascular exercise physiology research found the same asymmetry in transparency we did, with male-only studies far less likely than female-only studies to report their sex composition in the title (27% vs. 78%) or justify their exclusion criteria (15% vs. 55%) [19]. A change in guidelines is not the same as a change in practice. Whether authors are responding to these guidelines in performing research studies is a question that only repeated, systematic analysis will answer [20].
The data collected from participants and specimens feeds directly into our biomechanical models and simulations. If the people and specimens we measure are not representative, what are our models based on? The next part of this article zooms in on musculoskeletal modelling specifically - not because bias is confined to it, but because it offers concrete, well-documented examples of how participant bias propagates into model parameters. The same questions apply equally to other subdomains of biomechanical simulation, the human behind the model is just as relevant there.
3. Human Behind the Model: Data and Models
Musculoskeletal models have historically been developed in three separate categories: lower extremity, upper extremity, and trunk models, built independently of one another on separate datasets. The skeleton, or rigid body model, dictates joint centres, joint axes, and muscle origins and insertions. Most generic models are still built on a single skeleton that is linearly scaled to an individual.
Widely used upper extremity models illustrate the issue with this approach. Even though they draw on post-mortem measurements from a mixed-sex group of seven specimens, the foundational bone geometry for the entire model derives exclusively from one of those seven: a male specimen [21]. The widely used lower extremity models follow the same pattern. The generic models [22,23,24,25] combine muscle parameters from mixed-sex datasets [26,27,28,29,30,31], and derive their bone geometry from male anatomical specimens [24,32]. one model derives both its bone geometry and its muscle parameters from a single male skeleton [32,33].
The trunk is a partial exception; based on a systematic review we conducted in 2026, to examine the demographic characteristics of the anatomical source data underlying the opensource cervical spine models, lumbar spine models, and spine muscle models (1974-2025, 81 included studies), we found a marked underrepresentation of female participants — only one in five subjects in the reviewed literature were female — and limited geographical diversity, with no source data originating from Africa or South America. Separate male and female thoracolumbar models do exist, with muscle cross-sectional area and position fitted to sex-specific cohorts. Still, the underlying bone geometry in the widely used version was built from a single male CT scan, with the female model derived by scaling that same skeleton rather than starting from female anatomy [34].
In essence, this approach assumes that women are simply smaller men which possibly compromises the accuracy of models particularly for females. The pelvis seemed a natural place to test how much this assumption matters. The pelvic architecture is one of the most sexually dimorphic bony structures in the human body, and crucially, that dimorphism cannot be explained by body size alone: even after accounting for overall size differences, the shape of the pelvis differs systematically between sexes in ways that are independent of how tall or heavy a person is [35]. We compared muscle moment arms generated by conventionally scaling the most downloaded generic model [25] against moment arms generated using each participant’s own bone geometry. To isolate the effect of geometry, muscle attachment points were kept identical between the two approaches, any difference in moment arms could therefore be attributed to bone geometry alone, not to different assumptions about where muscles attach.
We morphed the pelvis and femur geometry of 15 healthy adults (8 women, 7 men; mean age 29 ± 4 years) to match each person’s own MRI-derived anatomy, and compared the resulting muscle moment arms against those from the conventionally scaled version of the same generic model, across the full range of motion of each hip joint. We used MSK-Morph, an open-source framework we had recently released that morphs any existing OpenSim generic model onto a provided skeletal shape [36]. Conventional scaling systematically distorted the pelvis. Across all 15 participants, the distance between the anterior superior iliac spines (inter-ASIS, the front bony landmarks of the pelvis) was overestimated by 54.4 ± 20.5 mm on average, and the distance between the posterior superior iliac spines (inter-PSIS, the back landmarks) was underestimated by 7.6 ± 11.5 mm. Both distortions were larger in the women than in the men: inter-ASIS, 61.8 ± 14.6 mm in women vs. 46.0 ± 23.0 mm in men, not statistically significant; inter-PSIS underestimation was 13.8 ± 10.6 mm in women versus 0.6 ± 7.9 mm in men, a more than twentyfold significant difference.
This geometric distortion propagated directly into muscle function. Across all muscle-joint combinations examined, maximum absolute difference between morphed and linearly scaled moment arms went up to 53.0 mm (interquartile range: 3.3–12.9 mm). The largest discrepancy was in the gluteus maximus: its third compartment had a mean maximum difference of 35.9 ± 14.7 mm during hip adduction-abduction. Averaged across all muscles, the maximum moment arm error was significantly larger in women (10.8 ± 1.4 mm) than in men (7.9 ± 1.5 mm; p = 0.004) — a difference of roughly 37%. For the gluteus maximus in adduction-abduction specifically, the gap was more than twice as large: 48.0 ± 4.2 mm in women versus 22.1 ± 9.4 mm in men, a difference of over 100%. The model was not failing both sexes equally. It was failing women more, and by a margin large enough to matter for any simulation built on top of it.
Figure 5.
Overlay of a linearly scaled generic musculoskeletal model (yellow) and a subject-specific morphed model (blue) for a participant, shown for the pelvis and femur. The systematic misalignment between the two models illustrates how conventional scaling from a generic male template fails to capture female pelvic geometry, with discrepancies largest at the pelvis and proximal femur.
Figure 5.
Overlay of a linearly scaled generic musculoskeletal model (yellow) and a subject-specific morphed model (blue) for a participant, shown for the pelvis and femur. The systematic misalignment between the two models illustrates how conventional scaling from a generic male template fails to capture female pelvic geometry, with discrepancies largest at the pelvis and proximal femur.
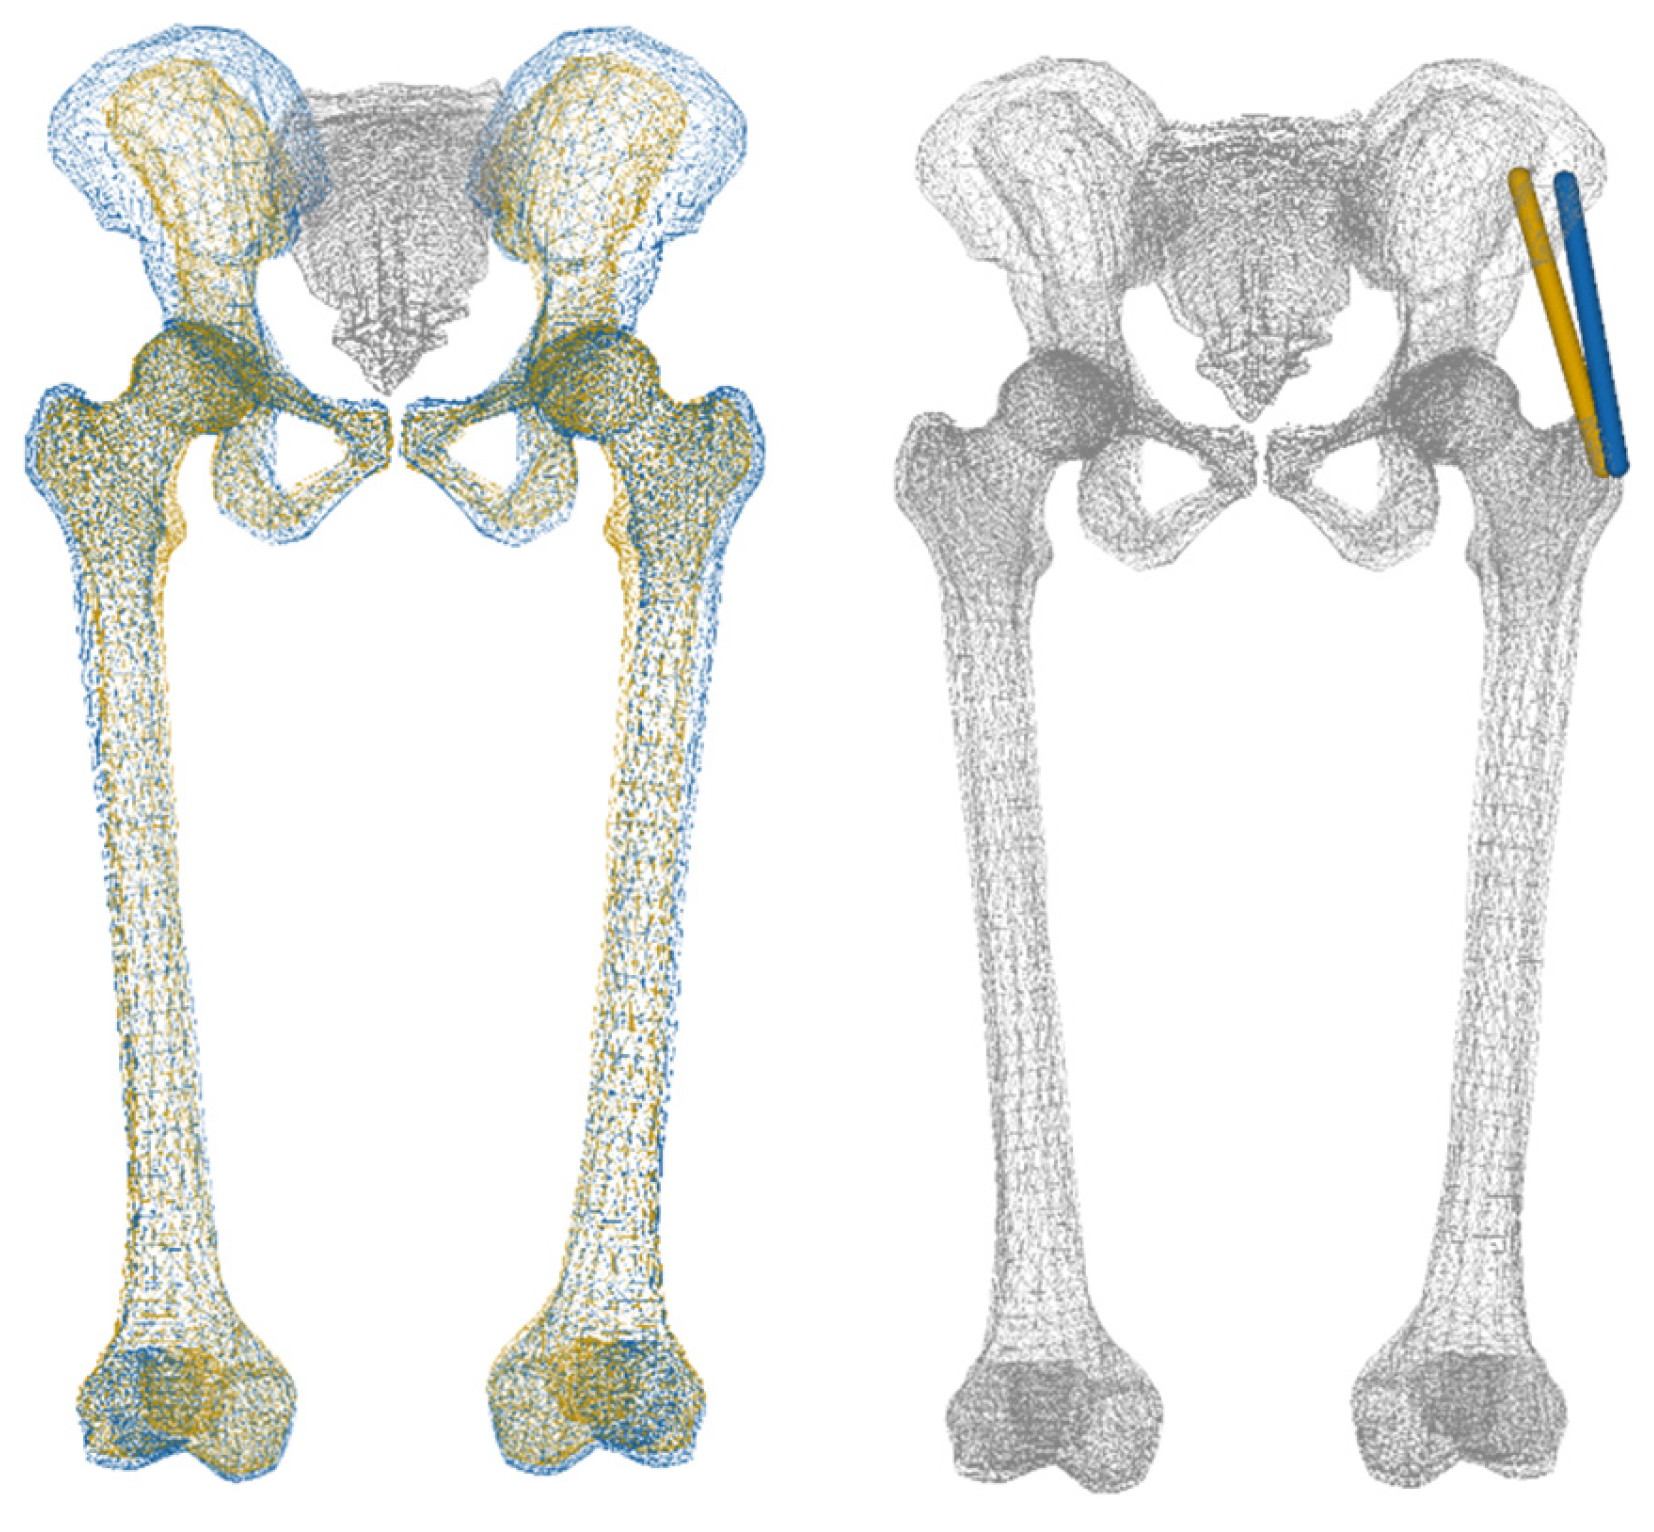
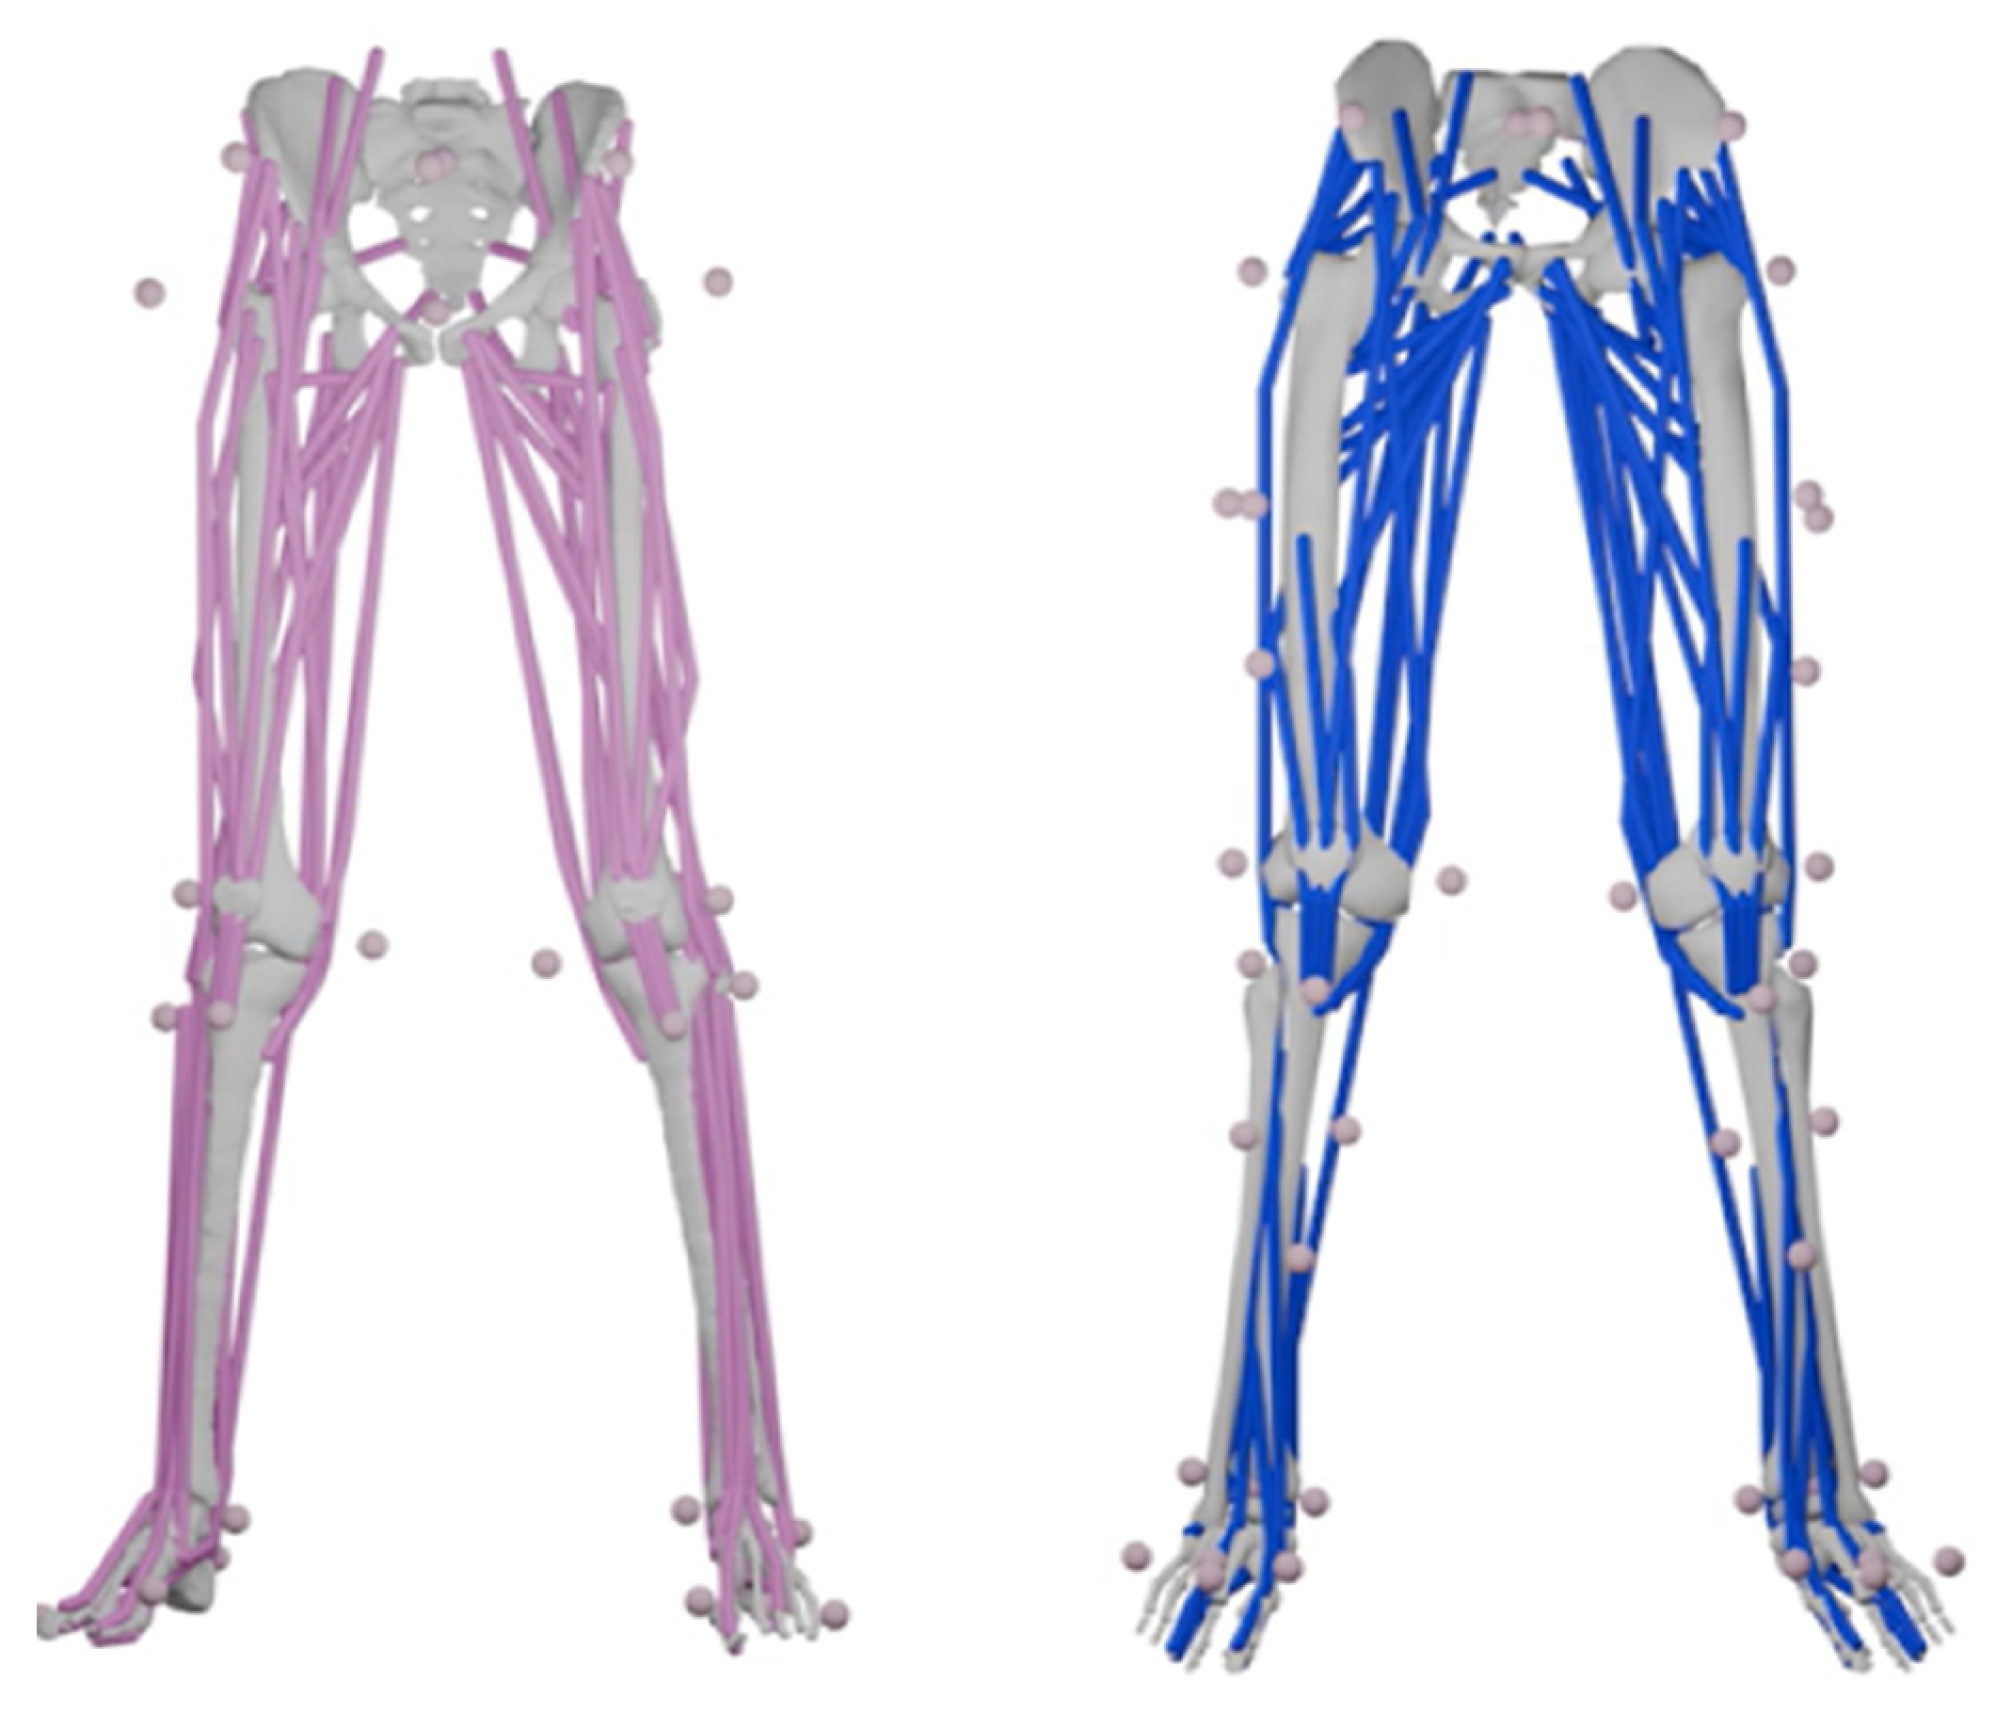
These results, together with a follow-up analysis in which each individual model was linearly scaled to each of the others, showed that even at the group level and before any individual personalization, accounting for sex-typical pelvic geometry would measurably improve model accuracy for women. Some of this gap is already being closed. At our own institution, a project was completed to build a female-based musculoskeletal model of the lower extremity from the ground up, rather than scaling a male one [37] (Figure 6). A subject-specific modeling study of the hip adductors [38] reached a complementary conclusion: local geometric features, such as the distance from the hip joint centre to a muscle’s attachment site, explain moment arm variation far better than whole-body measures like height or mass, and that this local geometry captures much of what differs between sexes. The necessity of accounting for local geometry was further demonstrated by an independent MRI-based study showing that geometric differences between generic-scaled and subject-specific models are substantial even in healthy adults, with joint contact force estimates differing meaningfully between the two approaches [39]. The tools to apply such personalization are also becoming more accessible. MSK- Morph [36,40], the open-source morphing framework used in our own study, is publicly available, and similar pipelines are emerging across the field [39].These are not yet field-wide shifts, but the foundation is being laid: the methods exist, the sex-specific errors are now quantified, and open-source pipelines are making sex-specific modeling feasible at a scale that was not realistic even a few years ago. With the tools now available, using sex-specific models for female movement should become the standard.
Figure 6.
Comparison of female-specific lower-extremity musculoskeletal model built from the ground up (left, pink) versus a linearly scaled version of the generic model applied to the same female individual (right, blue) [25]. Differences in muscle path geometry are visible throughout the lower limb, and are most pronounced at the hip, where pelvic morphology differs most substantially between sexes. The female-specific model was developed by [37].
Figure 6.
Comparison of female-specific lower-extremity musculoskeletal model built from the ground up (left, pink) versus a linearly scaled version of the generic model applied to the same female individual (right, blue) [25]. Differences in muscle path geometry are visible throughout the lower limb, and are most pronounced at the hip, where pelvic morphology differs most substantially between sexes. The female-specific model was developed by [37].
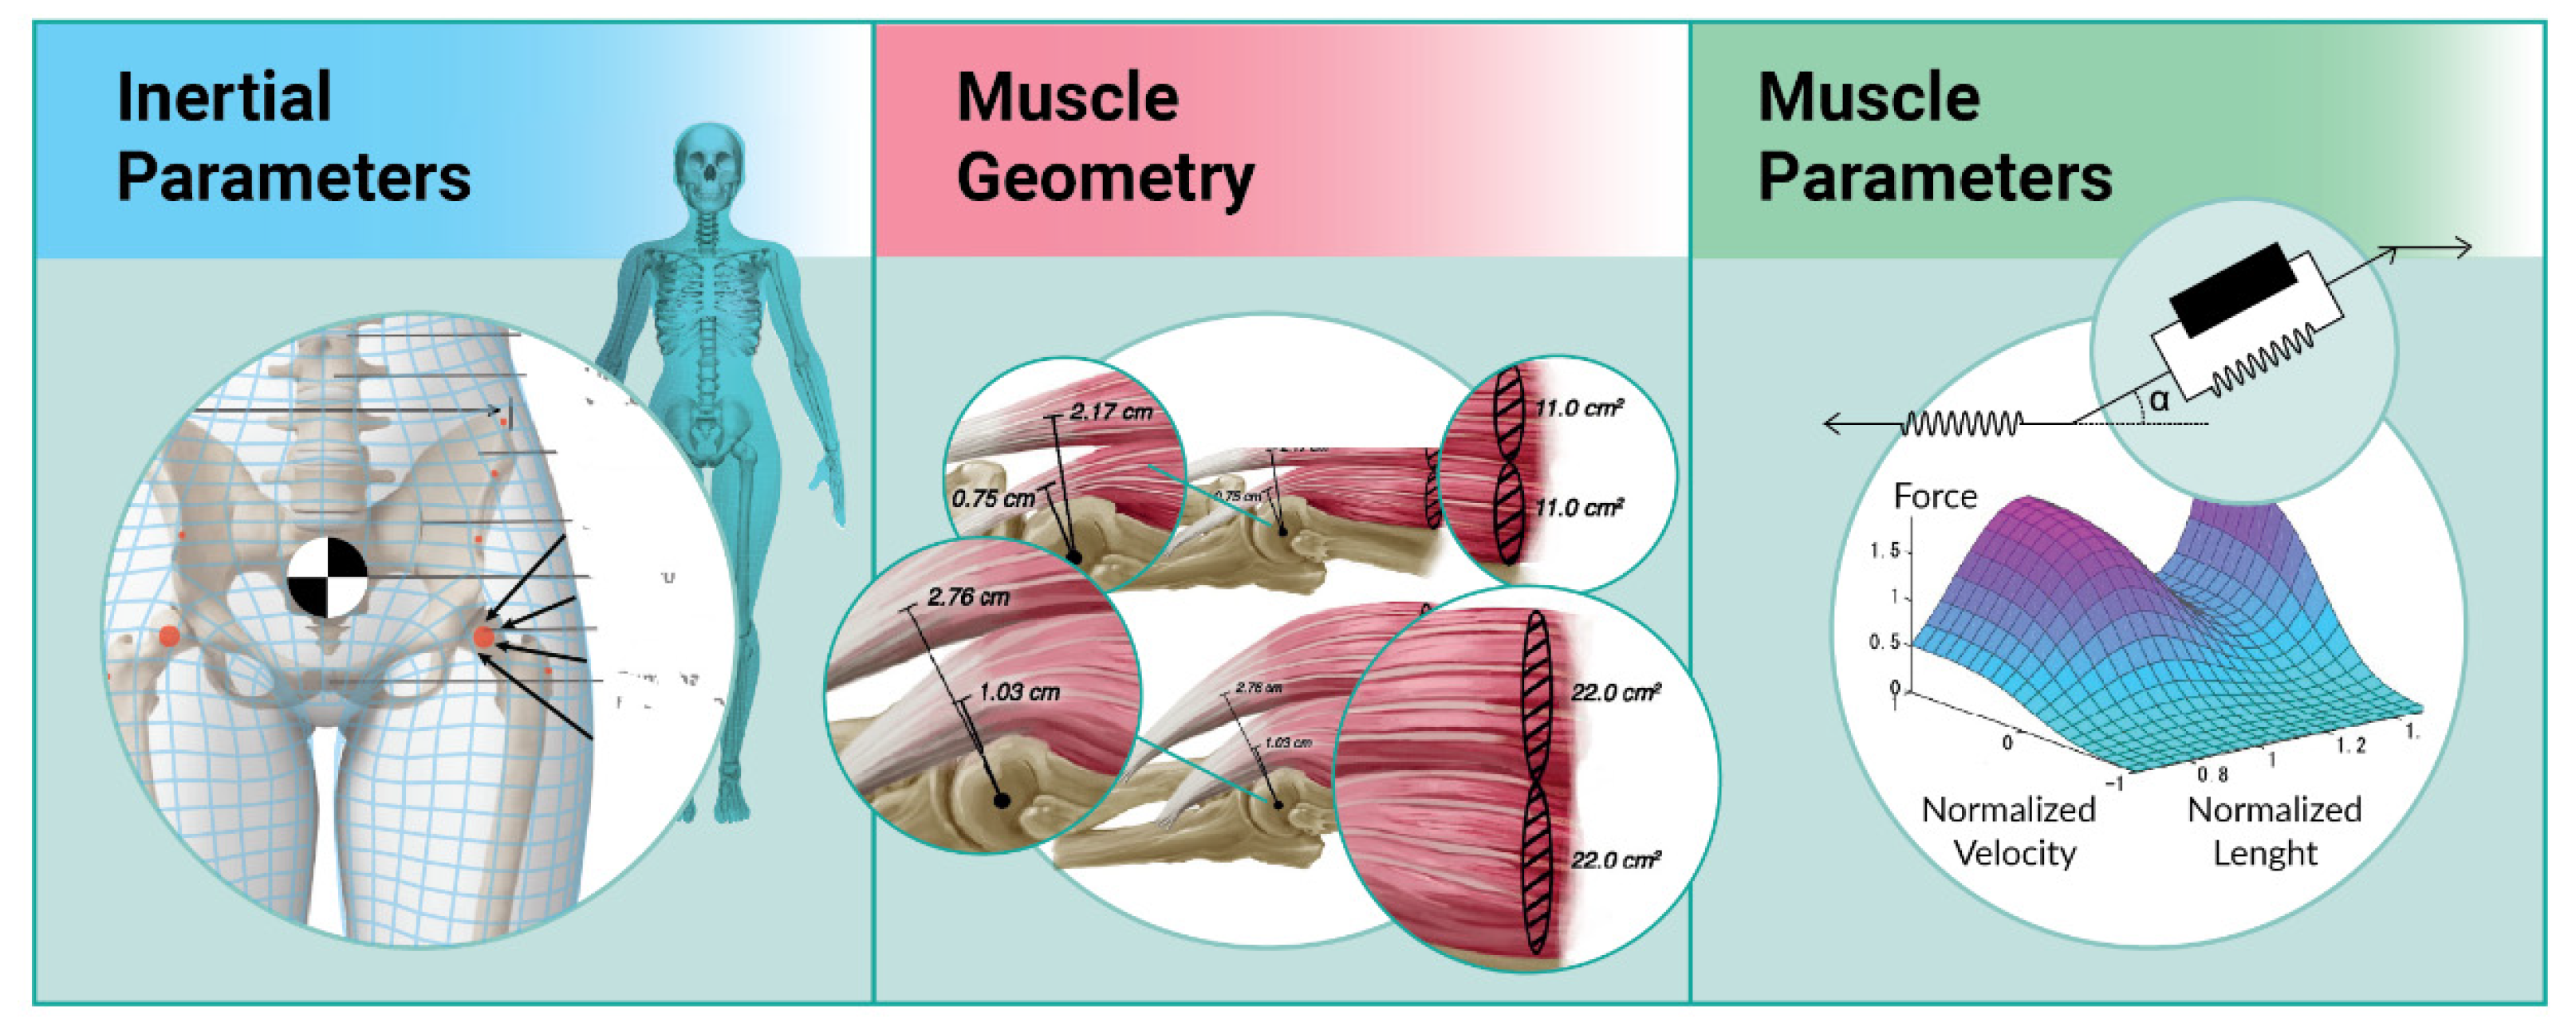
And yet geometry alone will not be enough (Figure 7). Even in models built from a person’s own bone geometry rather than inherited from a generic male template, sex still improved model fit as an independent factor after accounting for local anatomy [38]. The skeleton, in other words, does not tell the whole story, we also need to evaluate sex differences in muscle parameters (Figure 7).
Figure 7.
The three levels at which a musculoskeletal model can be personalized. Left: inertial parameters, including segment masses, mass distribution, and the skeletal geometry that determines joint centres and axes. Middle: muscle geometry, including the origin and insertion points that define where muscles attach to bone and the paths they follow, which directly determine moment arms. Right: muscle parameters, including the Hill-type model variables that govern how a muscle produces force as a function of its length and contraction velocity, represented here by the force-length-velocity surface. Generic models typically personalize only the first level through linear scaling; the second and third remain fixed to population averages.
Figure 7.
The three levels at which a musculoskeletal model can be personalized. Left: inertial parameters, including segment masses, mass distribution, and the skeletal geometry that determines joint centres and axes. Middle: muscle geometry, including the origin and insertion points that define where muscles attach to bone and the paths they follow, which directly determine moment arms. Right: muscle parameters, including the Hill-type model variables that govern how a muscle produces force as a function of its length and contraction velocity, represented here by the force-length-velocity surface. Generic models typically personalize only the first level through linear scaling; the second and third remain fixed to population averages.
The pelvis was a natural place to look for sex differences in the skeleton, given how conspicuously it differs between sexes in ways that go beyond body size. The same logic applies to muscle force. Sex differences in muscle strength are considered well known [41]. In musculoskeletal models, maximum isometric force is the peak contractile force a fully activated muscle can generate at its optimal fiber length and zero contraction velocity. In conventional open-source generic models these forces are not rescaled at all. Maximum isometric forces are only adjusted when a simulation proves too weak to complete a task, and even then the adjustment is a uniform amplification rather than a selective redistribution across muscles.
What is important for simulation behaviour in inverse simulations, where measured movement is used to estimate the muscle forces that produced it, is usually not the absolute force values but their ratios across muscles. Because the human body has more muscles than strictly necessary to produce any given movement, there is no unique solution to how forces are distributed. The mathematical solvers used in open-source musculoskeletal software resolve this redundancy by minimizing muscle activation across the whole system [42] and in doing so preferentially recruit muscles with higher maximum isometric forces. If those ratios do not reflect the person being simulated, this optimization will systematically assign forces to the wrong muscles. This raises a direct question: are the force ratios currently built into generic models valid across sexes?
In 2024, we conducted a systematic literature review of lower-limb muscle mass and physiological cross-sectional area (PCSA), and compared the results to the most downloaded OpenSim lower-limb models [43]. Searching Scopus, PubMed, and Google Scholar between April 2023 and July 2024, we identified 879 candidate papers, of which 57 reported usable, sex- and age-specific muscle data. The oldest dataset dated back to 1884; the most recent drew on modern MRI and diffusion tensor imaging. Because full-leg PCSA data were too sparse to compare reliably by sex, we used relative muscle mass (%Mm, each muscle’s share of total leg mass), on the assumption that muscle density does not vary meaningfully between healthy individuals. We then compared this pooled dataset against the muscle parameters used in five of the most widely cited open-source lower-limb models [23,25,33,44,45,46]. Two findings stood out.
First, relative muscle mass distribution differed by sex. Accounting for men’s greater absolute muscle mass, men carried significantly more relative mass in the rectus femoris (5.5% vs. 4.9%, p = 0.028) and semimembranosus (6.0% vs. 5.2%, p = 0.026), both central to knee extension and flexion. Women, in turn, carried significantly more relative mass around the pelvis and ankle: about a fifth more in the gluteus maximus (26.0% vs. 21.7%, p = 0.031) and nearly a third more in the gluteus medius (12.6% vs. 9.7%, p = 0.015), plus significantly more in the tibialis anterior (3.7% vs. 3.2%, p = 0.006), tibialis posterior (2.7% vs. 2.3%, p = 0.038), and extensor digitorum longus (1.9% vs. 1.6%, p = 0.032). A comparable pattern emerged by age: younger adults carried significantly more relative mass in the rectus femoris and gastrocnemius, while older adults carried significantly more in the gluteus medius. It is worth noting that relative muscle mass distribution is not fixed. Physical training, sport specialization, and occupational loading all influence how mass is distributed across the musculature [47]. This means that from a sex/gender perspective, the distributions we report can be attributed to either sex (hormonal differences) and/or gender (behaviour), and probably report a general population rather than a specific active group.
Second, when the five generic models were mapped onto this experimental distribution, none captured the female distribution accurately. The two models that were the most internally consistent of the five, both tracked the male distribution best [25,32]. One sat consistently between the male and female means, closer to a compromise than a fit for either [22]. The least consistent two models fluctuated muscle by muscle, in places falling outside the experimental range entirely, for either sex [23,24]. The more telling pattern, though, was not that the models disagreed with the data, but that where they did agree, they agreed mostly with men. With the field’s most-used models built this way, female-specific simulation results are likely to be systematically less accurate than male ones.
A large-scale MRI study published the same year [41] offers a complementary view from a different direction. Rather than cataloguing post-mortem specimens, it measured muscle volumes and peak isometric torques directly in 103 living participants (55 women, 48 men) using MRI and dynamometry in the same cohort. The key finding was that muscle volume was a strong predictor of torque production across the hip, knee, and ankle, but that sex remained a significant independent factor, particularly for hip extension and adduction: even after accounting for volume, women and men differed in how much torque a given volume of muscle produced within the system. The sex difference in the torque-volume relationship at the hip could reflect the moment arm differences we discussed before, it could reflect differences in how male and female muscles produce force, or both. That second possibility, that the force-producing capacity of the muscle itself differs between sexes in ways that current models do not capture, is mostly related to possible sex differences in the muscle model parameters.
The parameters underlying the Hill-type muscle model, the most commonly-used muscle parameterization in musculoskeletal models, are currently not adjusted for sex differences. From experimental biology and physiological measurements, evidence is accumulating that sex differences exist not only in muscle mass, volume, and muscle thickness, with males having more of each [41,48,49], but also in pennation angle for some muscles [48]. In contrast, both in vivo and ex vivo measurements find no significant difference in fascicle length or normalized fiber length between males and females, even after correcting for body height [48,49]. This finding is meaningful for modelling, suggesting that (optimal) fiber length should not be scaled with segment height and mass, as is currently standard practice in generic musculoskeletal models. The underlying cause of the existing sex differences in muscle architecture may partly relate to differences in muscle fiber type composition between sexes [50,51], but this remains to be further investigated.
Sex also cannot be decoupled from age [52,53]. As established in the opening section of this article, hormones are one of the defining dimensions of biological sex, and they change substantially across the lifespan. Testosterone promotes muscle mass accrual, while oestrogen, whose levels decline sharply with the onset of menopause, typically between 45 and 55 years of age, plays a protective role in musculoskeletal tissue maintenance [10,54]. Menopause represents a permanent hormonal shift with measurable mechanical consequences: as ovarian oestrogen production declines, muscle mass is lost, collagen turnover decreases, tendon properties change, and cartilage degeneration accelerates [54]. At a shorter timescale, hormones fluctuate throughout the monthly cycle in naturally menstruating women, or are regulated by hormonal contraception. A large body of research has investigated passive and active joint stiffness across the menstrual cycle, with mixed results. Where significant differences are found, they consistently point in one direction: joint laxity, particularly at the knee joint, increases around the pre-ovulatory phase, linked to oestrogen peaks (e.g. [55,56,57]). A plausible biochemical mechanism underlies the laxity findings: high oestrogen levels around ovulation can inhibit lysyl oxidase, the enzyme responsible for collagen cross-linking in ligament tissue, directly reducing connective tissue stiffness [10,58].
Taken together, a substantial body of research demonstrates that skeletal geometry, muscle architecture, and tissue mechanical properties all differ between sexes, yet these differences remain largely absent from musculoskeletal models. Naming these gaps is a first step; closing them is the work now underway. These findings raise a question that the research alone cannot answer: why did it take so long to notice? To understand this blind spot, we must look away from the models and toward the people who built them, and the people who did not.
4. The Human Behind the Model: Researchers & Research Topics
In her book Why Trust Science, Naomi Oreskes puts it well: “Much of what we identify as science are social practices and procedures of adjudication designed to ensure or at least attempt to increase the odds that the process of review and correction are sufficiently robust as to lead to empirically reliable results” [59]. We do not have a single empirical scientific method. In the field of biomechanics we conduct both experimental and modelling studies, and we do not consider one inherently more reliable or scientifically sound than the other. In the setup as well as in the interpretation of the data, we draw on our own worldview and experience. Science isn’t objective, and this is a good thing. Our consciousness and moral judgment shape what we choose to study, how we treat our participants and specimens, and what we consider an acceptable risk or trade-off. A purely objective science, stripped of human judgment, would also be stripped of the ethical reflection that keeps research humane and accountable. However, accepting this means we need to strive for a scientific community that can, as a group, deliver reliable results. Diversity serves this epistemic goal.
Most scientific fields are not gender-balanced, and the biomechanics research community is no exception, the imbalance shows up in measurable ways beyond simple headcounts. A fifty-year analysis of authorship in the Journal of Biomechanics documented persistent patterns in who leads these studies, with women representing just 5.5% of authors in 1970 and still only 26.5% by 2020, and female last authorship, the traditional marker of senior leadership, showing the least relative and absolute growth of all author positions [60]. Women in STEM receive fewer citations than men for comparable work, a gap that has been growing rather than shrinking as fields diversify [61,62].
A homogeneous research community does not just risk producing skewed data, it risks leaving entire questions unasked. To look for patterns of this within biomechanics, consider a condition that would require a female-only participant pool and ask how much biomechanics has studied it. This condition affects an estimated 240 million people every year [63]. Roughly 40% of the population will experience it at some point in their life. In 60 to 75% of cases, it leads to measurable biomechanical complications [64]. In 10 to 20% of cases, those complications become severe. The condition is pregnancy.
We focus on pregnancy not because it is uniquely neglected, but because a scoping review makes that neglect measurable [65]. Among all seventeen UN Sustainable Development Goals, the target to reduce maternal mortality has fallen further behind than any other, and biomechanical complications are recognized as a major driver of that failure [65]. During vaginal delivery, the pelvic floor muscles are stretched to more than 2.5 times their resting length in under two hours, strains that exceed the threshold above which muscle injury is thought to occur, and that have no equivalent anywhere else in the body [66]. The long-term consequences are common: up to half of all women over 50 experience at least one pelvic floor disorder, with childbirth as a primary contributing factor [66]. Despite this, that scoping review searching for empirical biomechanical studies of pregnant or labouring women found only 87 in the entire history of the field, not one of which measured a woman actually in labour. For comparison, the Journal of Biomechanics alone has published more than 16,000 articles since its founding in 1968. Against that backdrop, 87 empirical studies on a condition affecting half the population is a striking disproportion.
Whether this neglect traces back to who sets research priorities is not something we can prove; correlation is not causation. What we can say is that who does the research and what gets studied are not independent of each other. Both our own analysis and a fifty-year survey of the Journal of Biomechanics found that female authors were significantly more likely than male authors to produce studies with female-only participants [13,60]. This association is not a causal mechanism, but it is a pattern, that suggests that a more diverse research community would make different choices about who and what to study.
Several initiatives have formed directly in response to the lack of diversity in the research community. To address the gender gap, the International Women in Biomechanics was founded in 2020 by two postdoctoral researchers working independently on opposite sides of the world. This organization now connects over 700 biomechanists across 33 countries and became an affiliate society of the International Society of Biomechanics in 2023 [67]. Broadening this push for representation, the Black Biomechanists Association [68] and Latinx in Biomechanics organization operate alongside it. Further upstream National Biomechanics Day brings biomechanics demonstrations directly into schools to give young people early exposure to the field, with dedicated programs that include specific outreach to girls [69,70].
These initiatives matter because the pipeline problem and the topic problem are not separate. The people who enter the field shape the questions it asks. The people who stay shape whether the gaps get closed.
5. The Human Behind the Model
Every dataset and model has a sample behind it, and every sample reflects who was willing, available, or considered worth measuring. Every research agenda has people setting it, and those people bring their own histories and blind spots. None of this makes biomechanics less rigorous. It makes rigor harder to achieve, and far more important to keep working toward, deliberately, as a community, rather than by default. The human behind the model is not a flaw to engineer away. It is the reason diversity in whom we study, what we study, and who does the studying, is not a courtesy extended to underrepresented groups, but a condition for the science itself to be trustworthy.
References
- Heidari, S.; Babor, T. F.; De Castro, P.; Tort, S.; Curno, M. Sex and gender equity in research: rationale for the SAGER guidelines and recommended use. Res. Integr. Peer Rev. 2016, vol. 1(no. 1), 2. [Google Scholar]
- Gibson, R. Effects of long term corseting on the female skeleton: A preliminary morphological examination. Nexus Can. Stud. J. Anthropol. 2015, vol. 23(no. 2), 45–60. [Google Scholar]
- Eveleth, R.; Llinas Goodman, O.; Kamel, M.; Pollak, L.; Thompson, J. Timeline: 100+ years of history of sex testing in women’s sports. Tested [Interactive online timeline]. Available online: https://www.tested-podcast.com/timeline/.
- Rehmann-Sutter, C.; Hiort, O.; Krämer, U. M.; Malich, L.; Spielmann, M. Is sex still binary? Med. Genet. 2023, vol. 35(no. 3), 173–180. [Google Scholar]
- Simpson, J. L.; et al. Gender verification in the Olympics. JAMA 2000, vol. 284(no. 12), 1568–1569. [Google Scholar] [CrossRef] [PubMed]
- Pieper, L. Sex testing: gender policing in Women’s sports; University of Illinois Press, 2016. [Google Scholar]
- O’Connor, M. I. Sex differences in osteoarthritis of the hip and knee. JAAOS-J. Am. Acad. Orthop. Surg. 2007, vol. 15, S22–S25. [Google Scholar] [CrossRef]
- Lin, C. Y.; Casey, E.; Herman, D. C.; Katz, N.; Tenforde, A. S. Sex differences in common sports injuries. PM&R 2018, vol. 10(no. 10), 1073–1082. [Google Scholar] [CrossRef] [PubMed]
- O’Sullivan, L.; Tanaka, M. J. Sex-based differences in hamstring injury risk factors. J. Womens Sport Med. 2021, 1(1), 20–9. [Google Scholar]
- Chidi-Ogbolu, N.; Baar, K. Effect of estrogen on musculoskeletal performance and injury risk. Front. Physiol. 2019, vol. 9, 1834. [Google Scholar]
- Kissow, J.; Jacobsen, K. J.; Gunnarsson, T. P.; Jessen, S.; Hostrup, M. Effects of follicular and luteal phase-based menstrual cycle resistance training on muscle strength and mass. Sports Med. 2022, vol. 52(no. 12), 2813–2819. [Google Scholar] [CrossRef] [PubMed]
- McNulty, K. L.; et al. The effects of menstrual cycle phase on exercise performance in eumenorrheic women: a systematic review and meta-analysis. Sports Med. 2020, vol. 50, 1813–1827. [Google Scholar]
- van der Kruk, E. BIASMECHANICS: Does an unconscious bias still persist in biomechanics, positioning males as the default in human research? A meta-analysis on the Journal of Biomechanics 2024 publications. J. Biomech. 2025, 112560. [Google Scholar] [CrossRef] [PubMed]
- Bach, S.; Morrow, M. M.; Zhao, K. D.; Hughes, R. E. Sex distribution of study samples reported in American Society of Biomechanics annual meeting abstracts. PLoS ONE 2015, vol. 10(no. 3), e0118797. [Google Scholar]
- Sebastian, F.; Vargas, A. I.; Clarin, J.; Hurgoi, A.; Amini, R. Meta Data Analysis of Sex Distribution of Study Samples Reported in Summer Biomechanics, Bioengineering, and Biotransport Annual Conference Abstracts. J. Biomech. Eng. 2024, vol. 146(no. 6). [Google Scholar]
- U. Nations. G. Assembly. Universal declaration of human rights; Department of State, United States of America, 1949; vol. 3381. [Google Scholar]
- T. O. CEDAW, O. N. B. O. F. S. A. HUMAN, and T. C. ORGANISATIONS’NETWORK SAHRINGON, “United Nations Convention on the Elimination of All Forms of Discrimination Against Women,” 1995.
- Cowley, E. S.; Olenick, A. A.; McNulty, K. L.; Ross, E. Z. ‘Invisible sportswomen’: the sex data gap in sport and exercise science research. Women Sport Phys. Act. J. 2021, vol. 29(no. 2), 146–151. [Google Scholar]
- Lew, L. A.; Williams, J. S.; Stone, J. C.; Au, A. K. W.; Pyke, K. E.; MacDonald, M. J. Examination of sex-specific participant inclusion in exercise physiology endothelial function research: a systematic review. Front. Sports Act. Living 2022, vol. 4, 860356. [Google Scholar]
- Monnerat, M.; Blaker, C.; Choisne, J.; Clarke, E. C. Sex Bias in International Society of Biomechanics Conference Abstract Submissions: Patterns Across Cohorts, Countries, and Contexts. In Countries, and Contexts.
- Van der Helm, F. C. T.; Veeger, H. E. J.; Pronk, G. M.; Van der Woude, L. H. V.; Rozendal, R. H. Geometry parameters for musculoskeletal modelling of the shoulder system. J. Biomech. 1992, vol. 25(no. 2), 129–144. [Google Scholar] [CrossRef] [PubMed]
- Arnold, E. M.; Ward, S. R.; Lieber, R. L.; Delp, S. L. A model of the lower limb for analysis of human movement. Ann. Biomed. Eng. 2010, vol. 38, 269–279. [Google Scholar]
- OpenSim Confluence, Gait 2392 and 2354 Models. Available online: https://opensimconfluence.atlassian.net/wiki/spaces/OpenSim/pages/53086215/Gait+2392+and+2354+Models.
- Delp, S. L.; Loan, J. P.; Hoy, M. G.; Zajac, F. E.; Topp, E. L.; Rosen, J. M. An interactive graphics-based model of the lower extremity to study orthopaedic surgical procedures. IEEE Trans. Biomed. Eng. 1990, vol. 37(no. 8), 757–767. [Google Scholar] [CrossRef] [PubMed]
- Rajagopal; Dembia, C. L.; DeMers, M. S.; Delp, D. D.; Hicks, J. L.; Delp, S. L. Full body musculoskeletal model for muscle-driven simulation of human gait. IEEE Trans. Biomed. Eng. 2016, vol. 63(no. 10), 2068–2079. [Google Scholar] [CrossRef] [PubMed]
- Anderson, F. C.; Pandy, M. G. A dynamic optimization solution for vertical jumping in three dimensions. Comput. Methods Biomech. Biomed. Engin. 1999, vol. 2(no. 3), 201–231. [Google Scholar] [CrossRef] [PubMed]
- Friederich, J. A.; Brand, R. A. Muscle fiber architecture in the human lower limb. J. Biomech. 1990, vol. 23(no. 1), 91–95. [Google Scholar] [CrossRef] [PubMed]
- Handsfield, G. G.; Meyer, C. H.; Hart, J. M.; Abel, M. F.; Blemker, S. S. Relationships of 35 lower limb muscles to height and body mass quantified using MRI. J. Biomech. 2014, vol. 47(no. 3), 631–638. [Google Scholar] [CrossRef] [PubMed]
- Ward, S. R.; Eng, C. M.; Smallwood, L. H.; Lieber, R. L. Are Current Measurements of Lower Extremity Muscle Architecture Accurate? Clin. Orthop. Relat. Res. 2009, vol. 467(no. 4), 1074–1082. [Google Scholar] [CrossRef] [PubMed]
- Wickiewicz, T. L.; Roy, R. R.; Powell, P. L.; Edgerton, V. R. Muscle Architecture of the Human Lower Limb. Clin. Orthop. Relat. Res. 1983, vol. 179, 275. Available online: https://journals.lww.com/clinorthop/Abstract/1983/10000/Muscle_Architecture_of_the_Human_Lower_Limb.42.aspx.
- Yamaguchi, G. T.; Zajac, F. E. A planar model of the knee joint to characterize the knee extensor mechanism. J. Biomech. 1989, vol. 22(no. 1), 1–10. [Google Scholar] [CrossRef] [PubMed]
- Horsman, M. D. K. The Twente lower extremity model. Consistent dynamic simulation of the human locomotor apparatus. Dec 2007. Available online: https://research.utwente.nl/en/publications/the-twente-lower-extremity-model-consistent-dynamic-simulation-of.
- Modenese, L.; Phillips, A. T. M.; Bull, A. M. J. An open source lower limb model: Hip joint validation. J. Biomech. 2011, vol. 44(no. 12), 2185–2193. [Google Scholar] [CrossRef] [PubMed]
- Bruno, G.; Burkhart, K.; Allaire, B.; Anderson, D. E.; Bouxsein, M. L. Spinal loading patterns from biomechanical modeling explain the high incidence of vertebral fractures in the thoracolumbar region. J. Bone Mineral. Res. 2017, vol. 32(no. 6), 1282–1290. [Google Scholar]
- Leong. Sexual dimorphism of the pelvic architecture: a struggling response to destructive and parsimonious forces by natural & mate selection. McGill J. Med. MJM 2006, vol. 9(no. 1), 61. [Google Scholar]
- Cueto Fernandez, J.; van de Steeg-Henzen, C.; Schouten, A. C.; Seth, A.; van der Kruk, E. MSK-Morph: An automated framework to systematically morph landmark-defined musculoskeletal models into subject-specific bone geometries. Preprint 2026. [Google Scholar]
- Gouka, Y.; Cueto Fernandez, J.; van der Kruk, E. “YONI — Female-based Musculoskeletal Model of the Lower Extremity,” 2026. Available online: https://github.com/BODIES-Lab-TU-Delft/YONI-MSK-Model.git (accessed on 29 April 2026).
- Steininger, K. M.; McCain, E. M.; Shea, B. S.; Luk, A.; Blemker, S. S. Sex-specific, subject-specific modeling reveals anatomical drivers of hip adductor moment arms. J. Biomech. 2026, 113309. [Google Scholar] [CrossRef] [PubMed]
- Stansfield, E.; Koller, W.; Gonçalves, B.; Kainz, H. Do we need medical imaging-informed musculoskeletal models for simulations in healthy adults? A new workflow based on magnetic resonance imaging highlights the importance of personalized geometry. PLoS Comput. Biol. 2026, vol. 22(no. 3), e1014073. [Google Scholar]
- Kewley, A.; Seth, A. OpenSim Creator. 2024.
- Garcia, M. E.; et al. Large-Scale Study of the Hip, Knee, and Ankle Reveals Sex and Angle-Dependent Muscle Volume and Torque Scaling Relationships. Knee, and Ankle Reveals Sex and Angle-Dependent Muscle Volume and Torque Scaling Relationships. [CrossRef]
- Seth, et al. OpenSim: Simulating musculoskeletal dynamics and neuromuscular control to study human and animal movement. PLoS Comput. Biol. 2018, vol. 14(no. 7), e1006223. [Google Scholar]
- Maarleveld, R.; Veeger, H. E. J.; van der Helm, F. C. T.; Son, R. L.; van der Kruk, E. What the %PCSA? Addressing Diversity in Lower-Limb Musculoskeletal Models: Age- and Sex-related Differences in PCSA and Muscle Mass; 2024. [Google Scholar]
- Delp, S. L.; Loan, J. P.; Hoy, M. G.; Zajac, F. E.; Topp, E. L.; Rosen, J. M. An interactive graphics-based model of the lower extremity to study orthopaedic surgical procedures. IEEE Trans. Biomed. Eng. 1990, vol. 37(no. 8), 757–767. [Google Scholar] [CrossRef] [PubMed]
- Arnold, E. M.; Ward, S. R.; Lieber, R. L.; Delp, S. L. A model of the lower limb for analysis of human movement. Ann. Biomed. Eng. 2010, vol. 38, 269–279. [Google Scholar] [CrossRef] [PubMed]
- Klein Horsman, M. D.; Koopman, H. F. J. M.; van der Helm, F. C. T.; Prosé, L. P.; Veeger, H. E. J. Morphological muscle and joint parameters for musculoskeletal modelling of the lower extremity. Clin. Biomech. 2007, vol. 22(no. 2), 239–247. [Google Scholar] [CrossRef] [PubMed]
- Kuenze, M.; Blemker, S. S.; Hart, J. M. Quadriceps function relates to muscle size following ACL reconstruction. J. Orthop. Res. 2016, vol. 34(no. 9), 1656–1662. [Google Scholar] [CrossRef] [PubMed]
- Martin-Rodriguez, S.; Gonzalez-Henriquez, J. J.; Diaz-Conde, J. C.; Calbet, J. A. L.; Sanchis-Moysi, J. The relationship between muscle thickness and pennation angle is mediated by fascicle length in the muscles of the lower extremities. Sci. Rep. 2024, vol. 14(no. 1), 14847. [Google Scholar] [CrossRef] [PubMed]
- Son, J.; Ward, S. R.; Lieber, R. L. Scaling relationships between human leg muscle architectural properties and body size. J. Exp. Biol. 2024, vol. 227(no. 6), jeb246567. [Google Scholar] [CrossRef] [PubMed]
- Staron, R. S.; et al. Fiber type composition of the vastus lateralis muscle of young men and women. J. Histochem. Cytochem. 2000, vol. 48(no. 5), 623–629. [Google Scholar] [CrossRef] [PubMed]
- James, J. J.; et al. Sex differences in human skeletal muscle fiber types and the influence of age, physical activity, and muscle group: A systematic review and meta-analysis. Physiol. Rep. 2025, vol. 13(no. 21), e70616. [Google Scholar] [CrossRef] [PubMed]
- van der Kruk, E.; Silverman, A. K.; Koizia, L.; Reilly, P.; Fertleman, M.; Bull, A. M. J. Age-related compensation: Neuromusculoskeletal capacity, reserve & movement objectives. J. Biomech. 2021, vol. 122, 110385. [Google Scholar] [CrossRef] [PubMed]
- van Der Kruk, E.; Silverman, A. K.; Reilly, P.; Bull, A. M. J. Compensation due to age-related decline in sit-to-stand and sit-to-walk. J. Biomech. 2021, vol. 122, 110411. [Google Scholar] [CrossRef] [PubMed]
- Wright, V. J.; Schwartzman, J. D.; Itinoche, R.; Wittstein, J. The musculoskeletal syndrome of menopause. Climacteric 2024, vol. 27(no. 5), 466–472. [Google Scholar] [CrossRef] [PubMed]
- Shultz, S. J.; Sander, T. C.; Kirk, S. E.; Perrin, D. H. Sex differences in knee joint laxity change across the female menstrual cycle. J. Sports Med. Phys. Fit. 2005, vol. 45(no. 4), 594. [Google Scholar]
- Lee, H.; Petrofsky, J. S.; Daher, N.; Berk, L.; Laymon, M.; Khowailed, I. A. Anterior cruciate ligament elasticity and force for flexion during the menstrual cycle. Med. Sci. Monit. 2013, vol. 19, 1080. [Google Scholar] [CrossRef] [PubMed]
- Park, S.-K.; Stefanyshyn, D. J.; Loitz-Ramage, B.; Hart, D. A.; Ronsky, J. L. Changing hormone levels during the menstrual cycle affect knee laxity and stiffness in healthy female subjects. Am. J. Sports Med. 2009, vol. 37(no. 3), 588–598. [Google Scholar] [CrossRef] [PubMed]
- Lee, A.; Lee-Barthel, A.; Marquino, L.; Sandoval, N.; Marcotte, G. R.; Baar, K. Estrogen inhibits lysyl oxidase and decreases mechanical function in engineered ligaments. J. Appl. Physiol. 2015, vol. 118(no. 10), 1250–1257. [Google Scholar] [CrossRef] [PubMed]
- Oreskes, N. Why trust science? 2021.
- Wasiak, M.; Challis, J. H. Trends in gender representation of women as authors and participants over five decades of the journal of biomechanics. J. Biomech. 2025, 113027. [Google Scholar] [CrossRef] [PubMed]
- Huang, J.; Gates, A. J.; Sinatra, R.; Barabási, A.-L. Historical comparison of gender inequality in scientific careers across countries and disciplines. Proc. Natl. Acad. Sci. 2020, vol. 117(no. 9), 4609–4616. [Google Scholar] [CrossRef] [PubMed]
- Dworkin, J. D.; Linn, K. A.; Teich, E. G.; Zurn, P.; Shinohara, R. T.; Bassett, D. S. The extent and drivers of gender imbalance in neuroscience reference lists. Nat. Neurosci. 2020, vol. 23(no. 8), 918–926. [Google Scholar] [CrossRef] [PubMed]
- United Nations Population Fund. State of World Population 2022: Seeing the Unseen — The Case for Action in the Neglected Crisis of Unintended Pregnancy. 2022. [Google Scholar]
- Wu, W.-H.; et al. Pregnancy-related pelvic girdle pain (PPP), I: Terminology, clinical presentation, and prevalence. Eur. Spine J. 2004, vol. 13(no. 7), 575–589. [Google Scholar] [CrossRef] [PubMed]
- Topalidou; Haworth, L.; Jassat, R.; Hawcroft-Hurst, M. What do we actually know about the biomechanics of pregnancy and labour? A systematic scoping review. PLoS ONE 2025, vol. 20(no. 12), e0337595. [Google Scholar]
- Harte, K.; Lennon, A. “Biomechanics of childbirth,” in Sports Medicine and the Pelvic Floor; Elsevier, 2026; pp. 69–97. [Google Scholar]
- Ebrahimi, et al. International Women in Biomechanics: Promoting, supporting, and sustaining the careers of women in biomechanics. J. Biomech. 2023, vol. 146, 111419. [Google Scholar] [CrossRef] [PubMed]
- Bell; Seymore, K.; Breen, S.; McCullough, M. Empowering Black scientists in STEM: early success of the Black Biomechanists Association. Biomed. Eng. Educ. 2022, vol. 2(no. 2), 113. [Google Scholar] [CrossRef] [PubMed]
- Dick, T. J. M.; et al. A 100-day mentoring program leads to positive shifts in girls’ perceptions and attitudes towards biomechanics and related STEM disciplines. J. Biomech. 2024, vol. 173, 112244. [Google Scholar] [CrossRef] [PubMed]
- Kirk, M. M.; Mattock, J. P. M.; Forsyth, J. R.; Coltman, C. E.; Steele, J. R. Increasing women’s participation in biomechanics through National Biomechanics Day events. J. Biomech. 2023, vol. 147, 111433. [Google Scholar] [CrossRef] [PubMed]
Figure 2.
A Dutch dress reform pamphlet, likely from the late 19th or early 20th century, depicting the internal consequences of tight-lacing. The four upper panels show progressive displacement of the skeleton and internal organs under corset compression; the lower illustration contrasts an uncorseted figure with a fashionably corseted woman accompanied by a skeleton, a direct comment on the health costs of the practice. The caption reads: “That all garments which compress the body are harmful, as they impede the functioning of the lungs, the heart, the blood vessels and all organs in the body cavities, must be specially noted. Therefore, away with the corset and all other constricting garments.” This image was produced as part of the rational dress reform movement, a widespread campaign in Western Europe and North America that used anatomical and biomechanical arguments to challenge gendered fashion norms. Source: acquired from a Haarlem bookshop as wall chart; original publication unknown.
Figure 2.
A Dutch dress reform pamphlet, likely from the late 19th or early 20th century, depicting the internal consequences of tight-lacing. The four upper panels show progressive displacement of the skeleton and internal organs under corset compression; the lower illustration contrasts an uncorseted figure with a fashionably corseted woman accompanied by a skeleton, a direct comment on the health costs of the practice. The caption reads: “That all garments which compress the body are harmful, as they impede the functioning of the lungs, the heart, the blood vessels and all organs in the body cavities, must be specially noted. Therefore, away with the corset and all other constricting garments.” This image was produced as part of the rational dress reform movement, a widespread campaign in Western Europe and North America that used anatomical and biomechanical arguments to challenge gendered fashion norms. Source: acquired from a Haarlem bookshop as wall chart; original publication unknown.
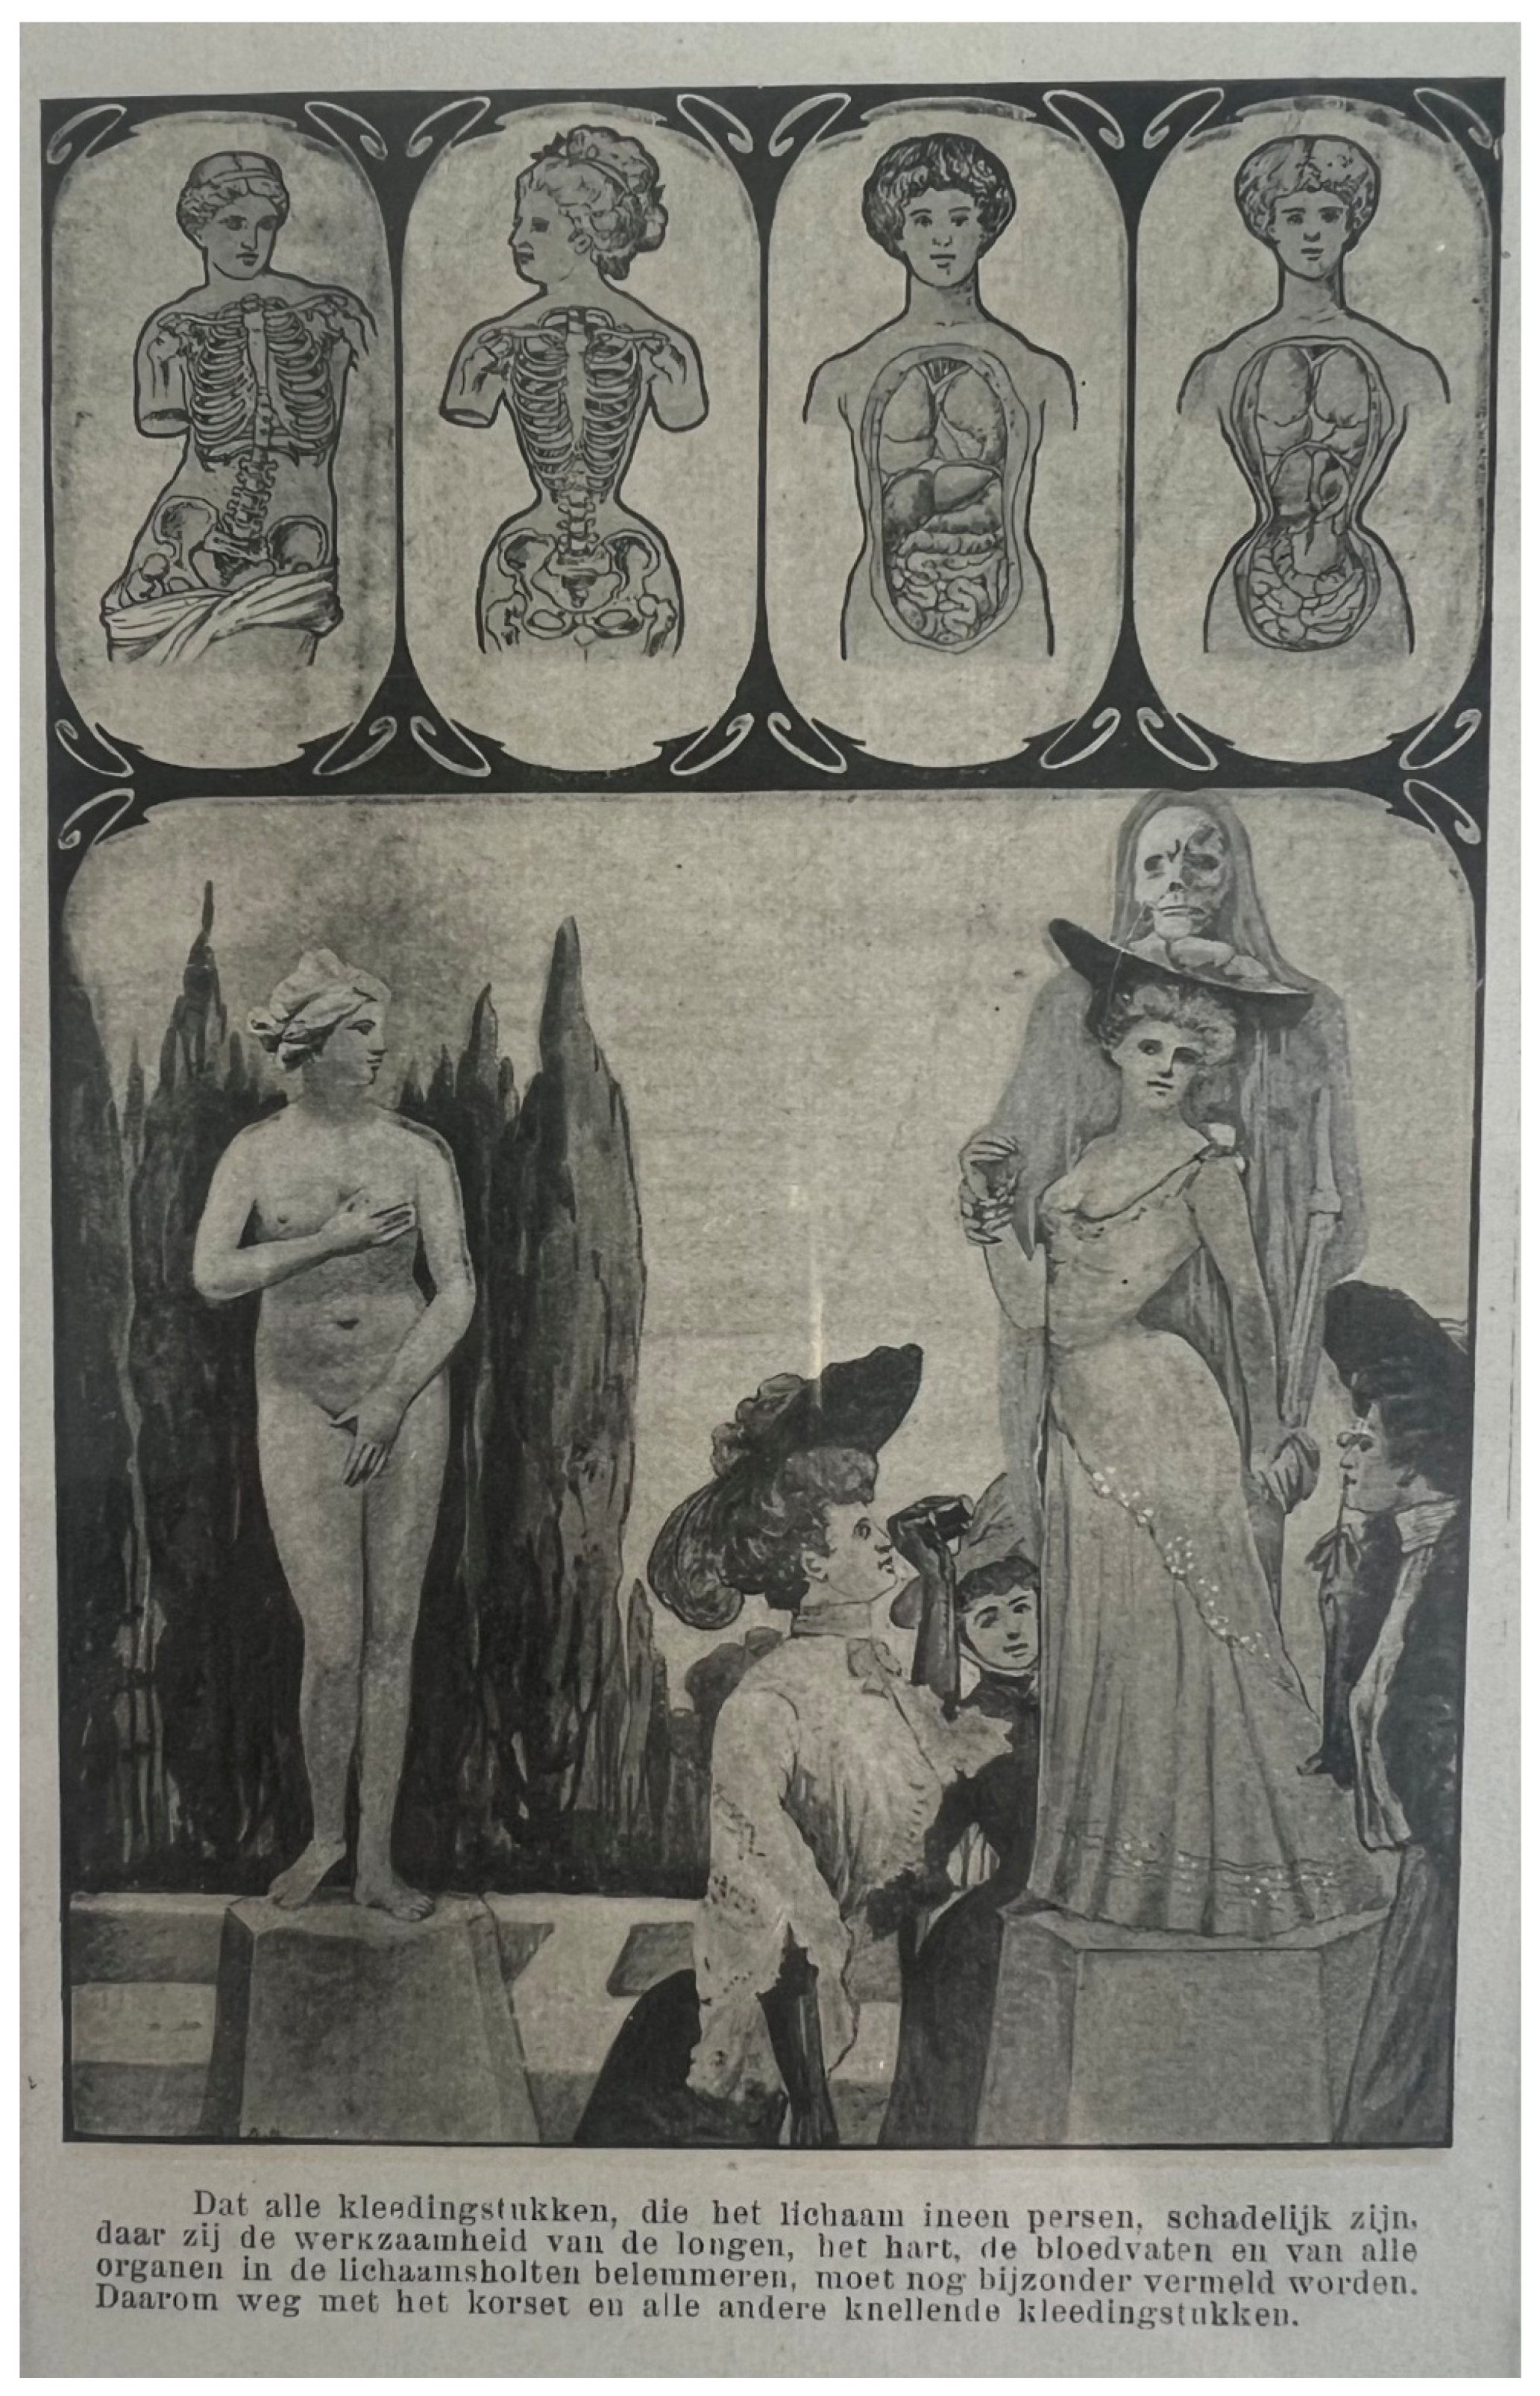
Figure 3.
The biological dimensions of sex do not sort neatly into two categories. Chromosomes, gonads, genitals, and hormones each vary independently across a spectrum, and their combinations do not always align. Conditions of sex development (DSDs) occur at multiple points along each dimension. Hormone levels are not static either: testosterone dominates in typical males throughout their reproductive years, while typical females show the reverse pattern during their reproductive years, followed by a sharp decline in oestradiol after menopause. This is a schematic, indicative visualization rather than a plot of measured data, intended to illustrate the general pattern rather than precise hormone concentrations. Adapted from [4].
Figure 3.
The biological dimensions of sex do not sort neatly into two categories. Chromosomes, gonads, genitals, and hormones each vary independently across a spectrum, and their combinations do not always align. Conditions of sex development (DSDs) occur at multiple points along each dimension. Hormone levels are not static either: testosterone dominates in typical males throughout their reproductive years, while typical females show the reverse pattern during their reproductive years, followed by a sharp decline in oestradiol after menopause. This is a schematic, indicative visualization rather than a plot of measured data, intended to illustrate the general pattern rather than precise hormone concentrations. Adapted from [4].
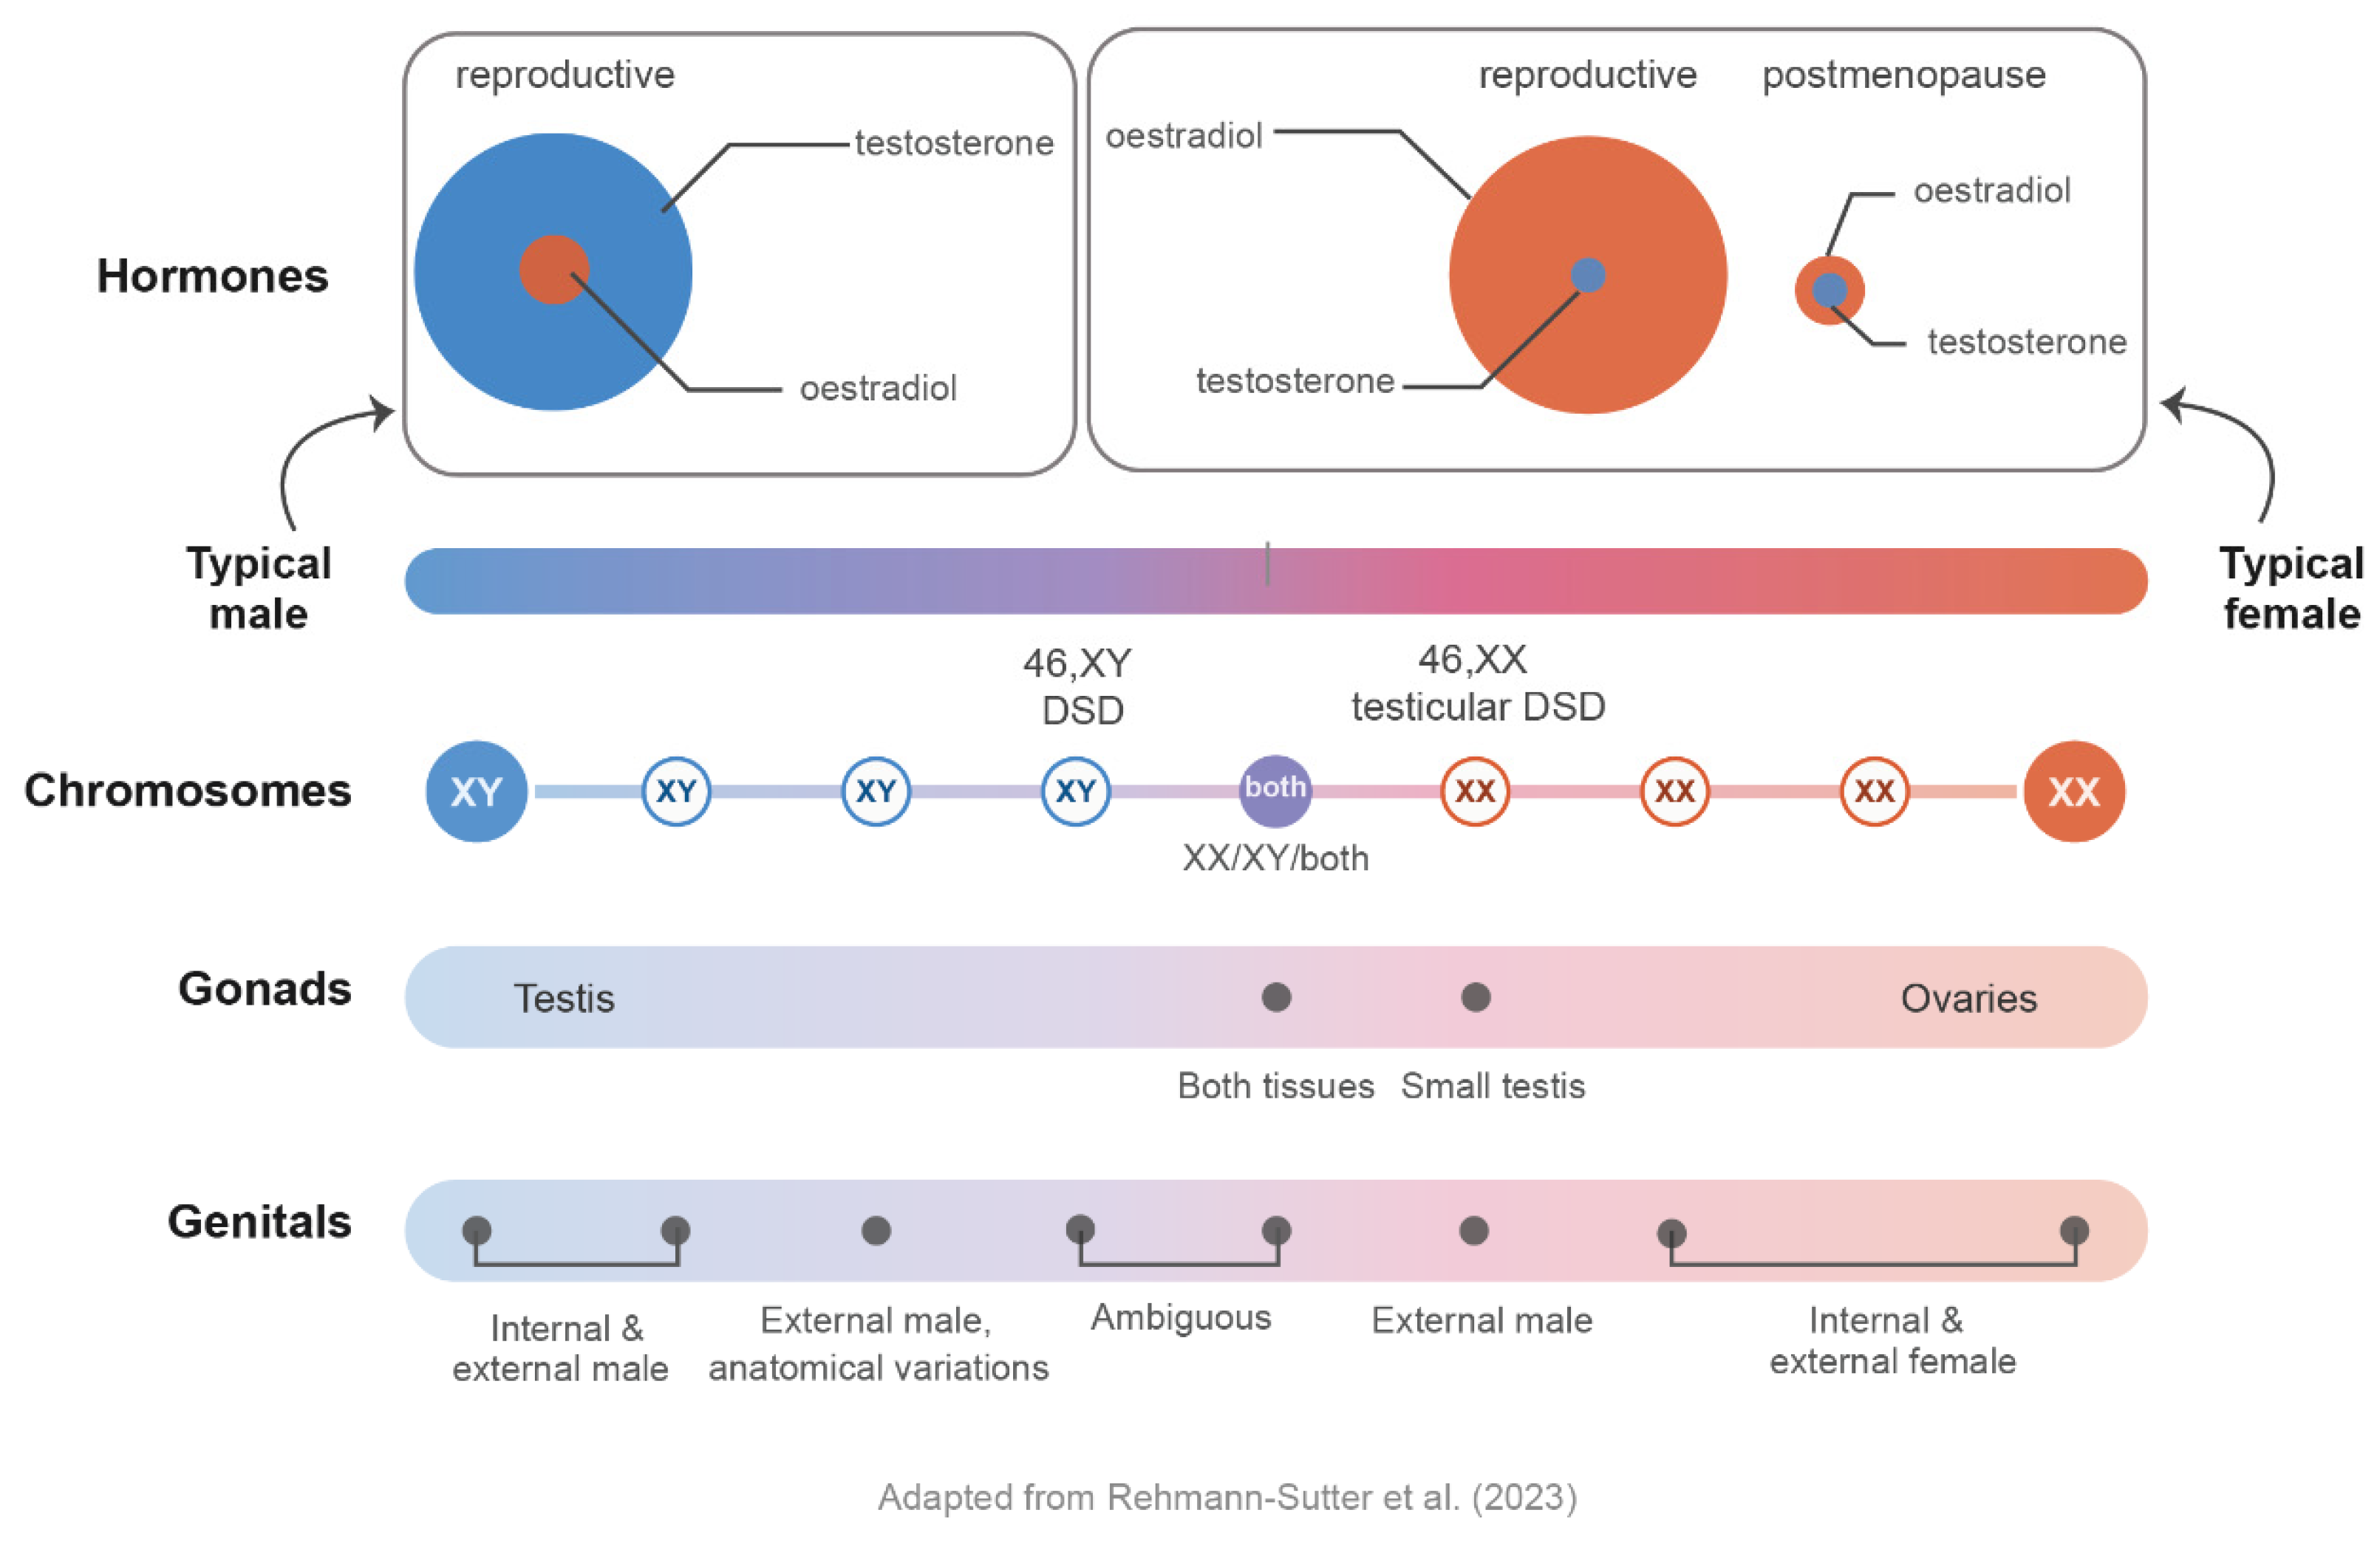
Figure 4.
Sex and gender representation in Journal of Biomechanics 2024 publications. Of the 432 articles published that year, 323 (75%) included human participants or specimens. Of those, 56% used balanced mixed-sex cohorts, while 25% included fewer than 30% female participants and 8% fewer than 30% male participants; 11% did not report participant sex or gender at all. Among the 46 studies using single-sex cohorts, 83% studied only men and 17% only women. Adapted from [13].
Figure 4.
Sex and gender representation in Journal of Biomechanics 2024 publications. Of the 432 articles published that year, 323 (75%) included human participants or specimens. Of those, 56% used balanced mixed-sex cohorts, while 25% included fewer than 30% female participants and 8% fewer than 30% male participants; 11% did not report participant sex or gender at all. Among the 46 studies using single-sex cohorts, 83% studied only men and 17% only women. Adapted from [13].
Disclaimer/Publisher’s Note: The statements, opinions and data contained in all publications are solely those of the individual author(s) and contributor(s) and not of MDPI and/or the editor(s). MDPI and/or the editor(s) disclaim responsibility for any injury to people or property resulting from any ideas, methods, instructions or products referred to in the content. |
© 2026 by the author. Licensee MDPI, Basel, Switzerland. This article is an open access article distributed under the terms and conditions of the Creative Commons Attribution (CC BY) license.
Copyright: This open access article is published under a Creative Commons CC BY 4.0 license, which permit the free download, distribution, and reuse, provided that the author and preprint are cited in any reuse.


