

Submitted:
30 July 2026
Posted:
03 August 2026
You are already at the latest version
Abstract
This study presents a field-based energy and economic comparison between the 2020 Hyundai Kona battery electric vehicle (BEV) and the 2008 Toyota Corolla internal combustion engine (ICE) vehicle under real driving conditions at the University of Nigeria, Nsukka (UNN). The study addresses the absence of empirically measured EV performance data under Nigerian driving conditions, the unquantified impact of air conditioning (AC) on EV range in tropical climates, and the uncharacterized daily charging capacity of solar EV charging stations in Nigerian university settings. For an identical 8 km round trip, the Hyundai Kona EV consumed approximately 1.024 kWh without AC and 1.056 kWh with AC, compared to 7.78 kWh for the Corolla, a ratio of approximately 7.6:1 in favor of the EV. Corresponding trip costs were 230.4 and 237.6 Naira for the EV versus 1,750.5 Naira for the Corolla. Two empirical linear models were developed relating EV state of charge to drivable range (y = 5.57x − 45) and charging time (y = −6.44x + 647). Effective real-world range was estimated at 396.9 km without AC and 348.1 km with AC, from a 500 km dashboard indication. The NADDC solar station (19.9 kW array, 95 kWh battery bank) was found capable of sustainably supporting one full Kona EV charge daily. These findings provide empirical evidence supporting EV adoption and solar charging infrastructure planning in Nigeria and similar developing-country contexts.
Keywords:
electric vehicle
; Hyundai Kona
; Toyota Corolla
; energy analysis
; economic analysis
; solar EV charging
; Nigeria
; developing countries
1. Introduction
The global transportation sector remains one of the most significant contributors to anthropogenic greenhouse gas (GHG) emissions, with direct transport emissions reaching 8.7 GtCO2-equivalent in 2019 and road vehicles accounting for approximately 70% of direct transport emissions [1]. The environmental and public health consequences of continued fossil fuel dependence, ranging from urban air pollution to accelerating climate change, have placed the energy transition in transportation at the centre of global policy discourse [2]. Against this backdrop, electric vehicles (EVs) have emerged as one of the most promising and scalable pathways toward cleaner, more energy-efficient mobility. This offers the dual benefit of reducing tailpipe emissions and, when charged from renewable sources, substantially lowers life-cycle carbon footprints compared to conventional internal combustion engine (ICE) vehicles [3].
The historical development of EVs stretches back to the late nineteenth century, but it is only in the past two decades that advances in battery technology, power electronics, and charging infrastructure have enabled EVs to become commercially viable at scale [4]. A comprehensive review of EV technologies and how the advances in electric drivetrains, battery chemistry, and power electronics have progressively closed the performance gap between EVs and conventional vehicles, establishes the technical foundation for mass-market electrification [5]. The energy disruption triangle framework positions EVs within a broader tripartite transformation of how energy is generated, stored, and consumed, a perspective that remains highly relevant as solar charging infrastructure is integrated with EV deployment [6]. Vascan and Szabó [4] further show that, despite the early promise of electric mobility in the late nineteenth century, the dominance of the ICE vehicle for most of the twentieth century was shaped by the economics of petroleum rather than any inherent technical superiority. Global EV sales have since grown exponentially, from approximately 206,000 units in 2013 to over 10.5 million in 2022, representing 55% year-on-year growth, with the Asia-Pacific region accounting for approximately 63% of sales, Europe 26%, and the Americas 11% [7], and further to 17.1 million in 2024, a 25% year-on-year increase [7]. This growth has been driven by a convergence of declining battery costs, increasingly stringent vehicle emissions regulations, and sustained government incentive programmes across major markets. This is so to the extent that the European Union has committed to banning the sale of new non-zero-emission passenger cars by 2035, with analogous regulatory transitions being adopted across multiple regions worldwide [3,8].
Despite this global momentum, the EV transition remains deeply uneven: Africa and the Middle East together accounted for less than 1% of global EV light-duty vehicle sales in 2022 [7], a disparity that reflects structural differences in purchasing power, infrastructure readiness, and policy support rather than consumer preference alone. Nigeria, the continent’s most populous nation and third largest economy, remains at the early stages of EV adoption. The transportation sector accounts for more than 70% of Nigeria’s energy consumption and has been the major consumer of fossil fuels over the past two decades [9]. The structural dependence on petroleum not only contributes to GHG emissions but also exposes households and institutions to the economic volatility of global fuel prices, a challenge that intensified significantly following the removal of the fuel subsidy in 2023. Studies have shown that the absence of government support, cost concerns, insufficient and unreliable charging infrastructure, present significant obstacles to EV adoption in Nigeria [10]. This is compounded by the fact that new EVs are priced substantially higher than the imported used petrol vehicles that dominate the market, placing brand-new EV ownership out of reach for most Nigerian consumers [11]. A feasibility assessment has projected that, without substantial reductions in EV purchase prices and a concurrent expansion of charging networks, widespread adoption by 2030 remains highly unlikely under current market conditions [12]. The deployment of solar-powered EV charging infrastructure, such as the National Automotive Design and Development Council (NADDC) stations at Nigerian universities, represents an important early institutional response to this challenge.
The energy efficiency advantage of EVs over ICE vehicles is well established in the literature, though its magnitude varies considerably with driving conditions, ambient environment, vehicle specifications, and auxiliary load usage. Real-world driving data have shown that hybrid EVs reduce fuel consumption factors by 39.3% on freeways and 58.0% on arterial roads compared to ICE vehicles, with the efficiency advantage varying seasonally [13]. This is particularly pronounced in urban and campus driving environments where stop-and-go traffic maximises the contribution of regenerative braking to energy recovery, precisely the conditions replicated in the present study. A critical factor in EV energy consumption in tropical environments such as Nigeria is the energy demand of auxiliary systems, most importantly the air conditioning (AC) system. Many studies consistently identify AC as one of the largest sources of variation in EV energy consumption and effective range, with both hot and cold ambient temperatures imposing additional thermal management loads on the battery system [14,15]. However, empirical data on the specific impact of AC usage on EV range under West African ambient conditions, where AC is a near-permanent rather than seasonal operational necessity, remains absent from the published literature. It is also notable that manufacturer-quoted range figures, derived from standardised laboratory test cycles, often overstate real-world performance. Studies have reported that real-world EV ranges deviate below official estimates by 15–25% depending on driving style, load, terrain, and climate [14], a discrepancy that carries particular consequences for range anxiety among early adopters in developing countries with limited charging infrastructure.
The economic case for EVs relative to ICE vehicles is most rigorously assessed through total cost of ownership (TCO) analysis, which accounts for the full lifecycle of vehicle expenses, including acquisition cost, energy cost, maintenance, insurance, depreciation, and end-of-life considerations. A systematic review of TCO have revealed that EVs typically carry a higher upfront purchase price. However, their lower operating costs, particularly energy and maintenance expenditures, can offset this gap. Combined with supportive fiscal policies such as purchase subsidies and tax waivers, EVs can become economically competitive with, or even superior to, ICE vehicles over a typical ownership period. These outcomes vary substantially across countries due to differences in local fuel and electricity prices, tax structures, and available incentives [16]. Rehman and Morsi [17] provide a directly relevant analytical template, comparing per-kilometre energy and maintenance costs between conventional and plug-in battery EVs in Canada. This is to determine the minimum ownership period and the gasoline price threshold at which EVs become economically preferable, an approach particularly pertinent to Nigeria, where volatile fuel prices following the 2023 subsidy removal have materially altered the economic calculus between EVs and ICE vehicles.
The integration of solar photovoltaic (PV) systems with EV charging infrastructure presents a particularly compelling solution for developing economies where grid reliability is low and renewable solar resources are abundant. A technical and economic optimisation study assessed renewable energy-based EV charging stations across six geographically and climatically diverse sites in Nigeria. It found that PV/wind/battery hybrid configurations offer the most favourable economic metrics among all configurations tested. The best-performing system, located in Sokoto, achieved a levelised electricity cost of USD 0.211/kWh and a net present cost of USD 547,717. These results affirm the technical viability of off-grid solar EV charging across Nigeria’s diverse climatic zones [9]. At the station level, however, whether the daily solar energy generation capacity of a given installation, such as the 19.9 kW array at the NADDC UNN facility, can sustainably support the full daily charging of an EV with a usable battery capacity of approximately 64–67 kWh, requiring approximately 9.5 hours of Level 2 charging from a minimum charge level, has not been quantitatively assessed in any published study.
Taken together, this body of literature reveals a critical gap: notwithstanding the growing global literature on EVs, empirically grounded, field-measured data on EV energy performance and economic viability under real-world driving conditions in developing countries, and in Nigeria specifically, remain scarce. Most existing EV-versus-ICE comparative studies draw on simulation models, manufacturer specifications, or datasets collected in high-income-country environments, where ambient temperatures, road conditions, driving behaviour patterns, and energy pricing structures differ substantially from those encountered in West Africa [17]. Consequently, key performance parameters such as actual drivable range, energy consumption per kilometre, the impact of auxiliary loads under tropical conditions, and real per-kilometre operating costs remain poorly quantified for the Nigerian context. A further gap exists at the infrastructure level. Solar-powered EV charging stations are increasingly being commissioned at Nigerian institutions. However, there is limited quantitative evidence on whether the daily energy generation capacity of such stations is sufficient to meet the actual charging demands of specific EV models in regular use. As a result, infrastructure planning and investment decisions currently rest on assumptions rather than empirical data. Addressing these gaps is essential not only for informing potential EV adopters and fleet operators in Nigeria, but also for guiding policymakers, infrastructure planners, and researchers working toward evidence-based sustainable transportation transitions in sub-Saharan Africa.
Motivated by these gaps, this study aims to provide an empirically grounded, field-based energy and economic comparison between a battery EV and an ICE vehicle under real Nigerian driving conditions, using the Hyundai Kona EV and Toyota Corolla as representative test platforms at the University of Nigeria, Nsukka (UNN). The study also characterizes the daily charging capacity of the NADDC solar EV charging station relative to the Hyundai Kona’s charging requirements. Achieving this aim entailed measuring and comparing real-world energy consumption and trip cost for an identical route under varying air-conditioning use, developing and validating empirical models relating EV state of charge to drivable range and charging time, and evaluating whether the solar station’s daily generation capacity is sufficient to sustainably support regular EV charging. In doing so, the study provides one of the first empirically measured, field-based EV-versus-ICE comparisons for the Nigerian and sub-Saharan African context, together with practically useful range- and charging-time-estimation models and an evidence base for solar EV charging infrastructure planning.
2. Materials and Methods
2.1. Overview of Experimental Design
This study employed a field-based experimental approach to measure and compare the real-world energy consumption of two vehicles, a 2020 Hyundai Kona battery electric vehicle (BEV) and a 2008 Toyota Corolla ICE vehicle, under controlled, identical driving conditions. The experiment was conducted at the University of Nigeria, Nsukka (UNN) campus, using the National Automotive Design and Development Council (NADDC) solar EV charging station as the starting point for all test drives. The experimental design was structured into three primary components: (i) EV charging rate characterisation, (ii) EV discharging rate characterisation under varied auxiliary load conditions, and (iii) ICE vehicle fuel consumption measurement. Data collected from these three components were subsequently subjected to energy and economic analysis. All driving experiments were conducted on the same day under consistent ambient conditions to minimise the influence of external variables such as weather and traffic on the results.
2.2. Vehicle Specifications
The key technical specifications of both test vehicles are summarised in Table 1.
The Hyundai Kona EV, chosen as the primary EV test platform, is a 5-seat compact SUV equipped with a 64 kWh lithium-ion battery pack and powered by a 150 kW front-mounted electric motor. The Toyota Corolla 2008 model, a widely used vehicle representative of the existing ICE vehicle fleet in Nigeria, is equipped with a 1.8L four-cylinder DOHC engine and a 50-litre fuel tank. The Corolla was selected for this experiment on the basis of its availability at the test site and its representativeness of the common mid-range ICE vehicle in the Nigerian market.
2.3. Experimental Site and Route Description
All driving experiments were conducted on a defined route between the NADDC solar EV charging station, located within the UNN campus, and the University’s main gate at Nru junction, a one-way distance of approximately 4 km. The round trip covering both directions of this route therefore constitutes a total distance of approximately 8 km per trial. The route traverses the internal road network of the UNN campus, characterised by a mix of paved road surfaces, moderate gradients, and typical campus traffic patterns including pedestrian crossings and speed-reduction zones. Distance along the route was measured using the Map Runner mobile application, and driving time was recorded using a mobile phone stopwatch at specified intervals. Each test vehicle carried three passengers, with an average individual weight of approximately 63 kg.
2.4. EV Charging Rate Data Collection
To characterise the charging behaviour of the Hyundai Kona EV, data were recorded directly from the vehicle’s onboard dashboard display during multiple Level 2 charging sessions at the NADDC solar EV charging station, operating at a rated charging power of 7.1 kW. The following parameters were recorded at irregular intervals during each charging session: (i) current battery state of charge (%), (ii) estimated remaining time to reach full charge (h:mm), and (iii) total projected drivable range at the current charge level (km). Six data points were collected across the charging cycle, spanning a state-of-charge range from 70% to 99%. These data were used to derive empirical linear relationships between state of charge and both projected range and time to full charge, as detailed in Section 3.
2.5. EV Discharging Rate Data Collection
The discharging characteristics of the Hyundai Kona EV were assessed across four separate driving trips along the defined experimental route. Two trips were conducted with the vehicle’s air conditioning (AC) system activated at low fan intensity, and two trips were conducted with the AC system fully deactivated. This paired experimental structure allowed for the direct quantification of AC-induced energy consumption and its effect on effective driving range under the prevailing ambient conditions. During each trip, data were recorded from the EV dashboard and the Map Runner application at intervals of approximately three to five minutes. The following parameters were captured at each interval: (i) actual distance covered since the start of the trip (km), as measured by Map Runner; (ii) remaining projected drivable range displayed on the EV dashboard (km); and (iii) cumulative total distance covered by the vehicle from its lifetime origin (km), as shown on the dashboard odometer.
2.6. Toyota Corolla Fuel Consumption Measurement
Fuel consumption for the Toyota Corolla ICE vehicle was measured using a volumetric approach. The vehicle’s fuel tank was filled to capacity prior to the commencement of the driving experiments. Following the completion of each round trip of approximately 8 km, the fuel tank was refilled using a calibrated graduated measuring cylinder to determine the precise volume of fuel consumed per trip. This value was subsequently converted to energy equivalents in megajoules (MJ) and kilowatt-hours (kWh) for direct comparison with the EV energy consumption data. The Toyota Corolla was driven with the AC system turned off for all trips, consistent with the AC-off baseline condition of the EV trials, to ensure comparable driving conditions.
2.7. Solar EV Charging Station Specifications
The NADDC solar EV charging station at UNN is an independent off-grid photovoltaic (PV) system comprising a solar array with a combined installed capacity of 19.9 kW. Under optimal irradiance conditions, with approximately 6 peak sunlight hours per day, consistent with the solar resource available in Enugu State, southeastern Nigeria, the station is capable of generating a maximum daily energy output of 119.4 kWh. The station incorporates a battery storage bank with a nominal capacity of 95 kWh. However, accounting for the recommended depth of discharge (DOD) limit of approximately 80%, which constrains usable battery capacity to approximately 76 kWh, and factoring in realistic system efficiency losses including panel efficiency, inverter losses, wiring losses, and temperature derating (estimated collectively at 75–80%), the effective energy available for storage per day is reduced accordingly. Under these practical operating conditions, the battery bank reaches its usable charge capacity within approximately 4 hours of peak solar generation. The specifications of the solar charging station are summarised in Table 2 and the pictures of the different component of the charging station are shown in Figure 1.
2.8. Economic Analysis Framework
The economic comparison between the two vehicles was based on the per-trip energy cost expressed in Nigerian Naira. For the Hyundai Kona EV, the energy consumed per trip in kWh was derived from the discharging rate analysis and multiplied by the prevailing electricity tariff at the charging station of 225 Naira per kWh to obtain the trip cost in Naira. For the Toyota Corolla, the volume of fuel consumed per trip was converted to energy in kWh and costed using the prevailing petrol pump price in Nsukka at the time of the experiment. A scenario analysis was also conducted to project the energy cost implications over longer trip distances representative of common intercity routes in Enugu State.
2.9. Data Analysis Approach
Collected data were analysed using statistical linear regression techniques to identify and quantify relationships between key parameters. Specifically, linear regression was applied to: (i) establish the relationship between EV state of charge (%) and projected drivable range (km); (ii) establish the relationship between EV state of charge (%) and remaining charging time (minutes); and (iii) quantify the range expenditure rate across each of the four driving trips. All energy values were expressed in both kilowatt-hours (kWh) and megajoules (MJ) to facilitate cross-vehicle comparison, with unit conversion performed using the standard factor of 1 kWh = 3.6 MJ. The energy content of petrol was taken as 32 MJ/litre, representing the Lower Heating Value (LHV) of Premium Motor Spirit (PMS) as used in Nigeria.
3. Results
3.1. Energy Analysis of the Hyundai Kona EV During Charging
Data were collected from the Hyundai Kona EV dashboard at irregular intervals during multiple Level 2 charging sessions at the NADDC solar EV charging station, operating at a rated charging power of 7.1 kW. The recorded parameters, state of charge (%), projected drivable range (km), and remaining time to full charge (minutes), are presented in Table 3.
Statistical regression analysis of the data in Table 3 revealed a strong linear relationship between the state of charge (%) and the projected drivable range (km), represented by the equation:
where y is the projected drivable range in kilometres and x is the state of charge expressed as a percentage. The slope coefficient of 5.57 indicates that for every 1% increase in state of charge, the projected drivable range increases by a corresponding 5.57 km. To illustrate: at x = 70%, y = 5.57(70) − 45 = 344.9 km, closely matching the observed value of 347 km; and at x = 99%, y = 5.57(99) − 45 = 506.4 km, closely matching the observed value of 506 km. At x = 100%, the model projects a range of 512 km, broadly consistent with the manufacturer’s rated WLTP range of approximately 415–505 km, with the marginal overestimate attributable to the optimistic nature of dashboard range projections under controlled charging conditions. This relationship is illustrated graphically in Figure 2.
y = 5.57x − 45
Similarly, a linear relationship was identified between state of charge (%) and remaining time to full charge (minutes), expressed as:
where y is the remaining charging time in minutes and x is the state of charge percentage. The negative slope coefficient (−6.44) confirms the expected inverse relationship, as the battery state of charge increases, the time remaining to reach full charge decreases at a constant rate of 6.44 minutes per percentage point gained. This behaviour is consistent with the constant-current charging characteristics of Level 2 AC chargers. This relationship is shown in Figure 3.
y = −6.44x + 647
From the Hyundai Kona EV manual, a complete Level 2 charge from minimum to 100% requires approximately 9 hours and 35 minutes (9.5833 hours). The total energy consumed during a full charge cycle is therefore:
Total Energy = 7.1 kW × 9.6 h = 68.16 kWh
This value is consistent with the vehicle’s rated usable battery capacity of 64 kWh, with the difference of approximately 4.16 kWh accounting for charging losses including heat dissipation, inverter inefficiency, and battery management system overhead, typically estimated at 5–10% for Level 2 AC charging systems.
3.2. Energy Analysis of the Hyundai Kona EV During Discharging
The discharging behaviour of the Hyundai Kona EV was characterised across four driving trips. Table 4, Table 5, Table 6 and Table 7 present the data recorded during each trip.
A key observation made prior to commencing the driving experiments was that upon entering the vehicle without activating any electrical devices, the dashboard displayed a projected range of approximately 313 km. However, upon activating the AC system at low fan intensity, this value immediately decreased to 297 km, a reduction of 16 km, before the vehicle had moved. This confirms that climate control systems impose an immediate and measurable energy demand on the EV battery system, detectable even before driving commences, consistent with findings in the literature identifying auxiliary climate loads as one of the most significant determinants of real-world EV range reduction [14,15]. Figure 4, Figure 5, and Figure 6 show the EV dashboard during charging, discharging, and the Toyota Corolla dashboard during the experiment, respectively.
To quantify the range expenditure rate for each trip, a parameter Y’ was defined as the difference between the dashboard-projected range at the start of the trip and the dashboard-projected range at the ith measurement interval:
Y’i = Range at trip start − Range displayed at interval i
Linear regression of Y’ against actual distance covered at each interval yielded the following relationships for each trip:
First Trip with AC: Y’i = 1.5x + 1
First Trip without AC: Y’i = 1.6x + 1.6
Second Trip with AC: Y’i = 1.298x + 1.773
Second Trip without AC: Y’i = 0.926x + 1.1
The slope coefficients in Equations (5)–(8) represent the range expenditure rate, the rate at which the dashboard-projected range decreases per actual kilometre driven. A slope greater than 1.0 indicates that the dashboard range decreases faster than actual distance covered, confirming that the vehicle’s real-world achievable range is consistently less than the dashboard projection, consistent with findings across multiple EV field studies [14].
The average range expenditure rates were computed as follows:
Without AC: (1.6 + 0.926) ÷ 2 = 1.263 km of dashboard range per real km driven
With AC: (1.5 + 1.298) ÷ 2 = 1.399 km of dashboard range per real km driven
The variability between trips, from 1.6 to 0.926 without AC and from 1.5 to 1.298 with AC, is attributable to differences in driving style, speed profile, traffic conditions, and regenerative braking contribution. The higher variability in AC-off trips (range: 0.674) compared to AC-on trips (range: 0.202) suggests that when AC is active, it dominates energy consumption and masks the influence of other variable factors, producing a more consistent expenditure rate.
A complementary aggregate analysis revealed that on average, for every real kilometre driven, the dashboard-projected range decreased by approximately 1.2 km across all trips. Using this aggregate discharge factor and the dashboard-indicated full charge range of 505 km, the actual achievable ranges are estimated as:
where 13 km represents the immediate dashboard range reduction upon activating the AC at low intensity before driving. For scenario planning purposes, where the dashboard-indicated range at full charge of 500 km is used as the reference, the effective distances accounting for the average trip-specific expenditure rates are:
Actual Range without AC = 505 ÷ 1.2 = 420 km
Actual Range with AC (low mode) = (505 − 13) ÷ 1.2 = 492 ÷ 1.2 = 410 km
Effective Range without AC = 500 ÷ 1.263 = 396.9 km
Effective Range with AC (low mode) = (500 − 13) ÷ 1.399 = 487 ÷ 1.399 = 348.1 km
The analysis of all discharging trips further reveals that the energy discharge rate of the EV is influenced by a combination of factors including ambient temperature, vehicle weight, driving style, regenerative braking, activated electrical devices and components, and electrical power losses, consistent with observations in the broader EV energy consumption literature [5,14].
3.3. Toyota Corolla Experiment and Fuel Consumption Analysis
The Toyota Corolla ICE vehicle was subjected to the same 8 km round-trip route as the Hyundai Kona EV. Table 8 presents the complete data recorded during the four Toyota Corolla driving trips.
From Table 8, each one-way trip from the NADDC charging station to the University main gate at Nru junction took approximately 6–7 minutes at moderate driving speeds. The maximum speed recorded across the four trips ranged from 72 km/h to 100 km/h, reflecting typical campus road driving conditions with speed variations due to traffic, pedestrian crossings, and speed-reduction zones.
Fuel consumption was measured volumetrically by refilling the fuel tank with a calibrated graduated measuring cylinder after each trip, yielding a consistent measured consumption of 0.875 litres per round trip across all four trips. It is noted as a measurement limitation that all four trips recorded an identical fuel consumption value despite being driven at varying maximum speeds ranging from 72 to 100 km/h. This uniformity most likely reflects the resolution limitations of the graduated measuring cylinder, which may not have been sufficiently precise to detect small inter-trip variations in fuel consumption. Future experiments should employ higher-precision volumetric or gravimetric fuel measurement instruments to capture trip-to-trip variability more accurately. Nevertheless, the value of 0.875 litres per trip is retained as the best available measurement for this analysis.
The energy content of petrol was taken as 32 MJ/litre, representing the Lower Heating Value (LHV) of Premium Motor Spirit (PMS) as used in Nigeria. The LHV is the appropriate value for ICE vehicle energy analysis since water produced during combustion exits as vapour and its latent heat of condensation is not recovered by the engine. This value is consistent with the established LHV range of 32–34 MJ/litre for petrol, with 32 MJ/litre representing the lower bound applicable to standard 87-octane PMS [18].
Energy consumed by Corolla per round trip = 0.875 L × 32 MJ/L = 28 MJ
Converting to kWh = 28 MJ ÷ 3.6 = 7.78 kWh
3.4. Energy Consumption Comparison
The energy consumption of the Hyundai Kona EV was derived from the vehicle’s rated battery capacity and the dashboard-indicated energy efficiency at the observed full charge range. For the AC-off condition:
Energy per km = 65 kWh ÷ 506 km = 0.128 kWh/km
Energy consumed per 8 km trip = 0.128 kWh/km × 8 km = 1.024 kWh
Energy in MJ = 1.024 kWh × 3.6 MJ/kWh = 3.69 MJ
For the AC-on condition, the 13 km immediate reduction in projected range upon AC activation was used to adjust the effective energy consumption rate:
Energy per km = 65 kWh ÷ (506 − 13) km = 65 ÷ 493 = 0.132 kWh/km
Energy consumed per 8 km trip = 0.132 kWh/km × 8 km = 1.056 kWh
Energy in MJ = 1.056 kWh × 3.6 MJ/kWh = 3.80 MJ
The energy consumption comparison across all three driving conditions is summarised in Table 9.
The results demonstrate a stark energy efficiency advantage for the Hyundai Kona EV over the Toyota Corolla under identical driving conditions. The Corolla consumed approximately 7.6 times more energy per trip than the EV without AC and approximately 7.4 times more energy than the EV with AC at low intensity. This ratio exceeds the average efficiency advantage reported in global literature for mixed driving cycles, which is consistent with the campus driving conditions of this experiment, stop-and-go driving at moderate speeds maximises the benefit of regenerative braking in the EV while most severely penalising the thermodynamic inefficiency of the ICE vehicle. These findings directly corroborate the energy efficiency advantages of EVs over ICE vehicles documented in prior literature for comparable urban driving conditions [13,17].
3.5. Economic Analysis
The economic comparison between the two vehicles was conducted by converting the measured energy consumption per trip into monetary cost in Nigerian Naira, using the prevailing electricity tariff of 225 Naira per kWh at the NADDC charging station.
Cost for Hyundai Kona EV without AC = 1.024 kWh × 225 Naira/kWh = 230.4 Naira
Cost for Hyundai Kona EV with AC (low) = 1.056 kWh × 225 Naira/kWh = 237.6 Naira
Cost for Toyota Corolla = 7.78 kWh × 225 Naira/kWh = 1,750.5 Naira

Table 10.
Economic Comparison — Hyundai Kona EV vs. Toyota Corolla per 8 km Round Trip.
| Vehicle | Condition | Energy (kWh) | Cost (Naira) | Cost per km (Naira/km) |
| Hyundai Kona EV | AC Off | 1.024 | 230.4 | 28.8 |
| Hyundai Kona EV | AC On (Low) | 1.056 | 237.6 | 29.7 |
| Toyota Corolla ICE | AC Off | 7.78 | 1,750.5 | 218.8 |
The economic disparity between the two vehicles is substantial. The Toyota Corolla incurs a per-trip energy cost approximately 7.6 times higher than the Hyundai Kona EV without AC and approximately 7.4 times higher than the EV with AC at low intensity. On a per-kilometre basis, the Corolla costs approximately 218.8 Naira/km compared to 28.8–29.7 Naira/km for the EV, a difference of approximately 190 Naira per kilometre. This finding is particularly significant in the Nigerian context following the removal of the fuel subsidy in 2023, which has caused petrol prices to rise substantially and further widened the operating cost gap between EV and ICE vehicles. The economic case for EV adoption in Nigeria on a per-kilometre running cost basis is therefore compelling, consistent with TCO studies that have identified operating cost differentials as the primary long-term economic argument for EV adoption in developing economies [16,17].
3.6. Scenario Analysis: Extended Trip Planning
To contextualise the findings for practical trip planning, a scenario analysis was conducted for the Nsukka–Enugu round trip of approximately 126 km (63 km one way). The dashboard range consumed per round trip was calculated by multiplying the round trip distance by the average range expenditure rate derived in Section 3.2:
Dashboard range consumed per round trip without AC = 126 km × 1.263 = 159 km
Dashboard range consumed per round trip with AC = 126 km × 1.399 = 176 km
Starting from a full dashboard range of 500 km without AC: after the 1st round trip, 341 km remains; after the 2nd round trip, 182 km remains; after the 3rd round trip, only 23 km remains, dangerously below the manufacturer’s recommended minimum of 20% charge (approximately 101 km dashboard range) and therefore practically unsafe. Starting from a dashboard range of 487 km with AC active (500 − 13 km immediate AC deduction): after the 1st round trip, 311 km remains; after the 2nd round trip, 135 km remains; the 3rd round trip cannot be completed.
Applying the manufacturer’s recommended minimum battery constraint (20% ≈ 101 km dashboard range):
Without AC: usable range = 500 − 101 = 399 km; complete trips = 399 ÷ 159 = 2.51 → 2 safe trips; range after 2 trips = 500 − (2 x 159) = 182 km.
With AC: usable range = 487 − 101 = 386 km; complete trips = 386 ÷ 176 = 2.19 → 2 safe trips; range after 2 trips = 487 − (2 x 176) = 135 km.
In both cases, the 399 km and 386 km usable-range figures are only used to determine how many round trips can safely be completed before the battery drops below the recommended 20% minimum. Once that number of trips (2, in both cases) is established, the actual dashboard range remaining is recalculated from the original full starting range (500 km or 487 km), not from the usable-range figure, since the usable-range figure was only a planning ceiling and not the vehicle’s actual state of charge.
The state of charge corresponding to the remaining dashboard range after 2 trips is estimated by rearranging Equation (1) as:
x = (y + 45) ÷ 5.57
Without AC (182 km remaining): x = (182 + 45) ÷ 5.57 = 40.8% ≈ 41%; charging time to full = −6.44(41) + 647 = 383 minutes ≈ 6.4 hours.
With AC (135 km remaining): x = (135 + 45) ÷ 5.57 = 32.3% ≈ 32%; charging time to full = −6.44(32) + 647 = 441 minutes ≈ 7.35 hours.
These results are summarised in Table 11.
The scenario analysis reveals that under both AC-on and AC-off conditions, a safely usable full charge of the Hyundai Kona EV supports 2 complete Nsukka–Enugu round trips before the battery must be recharged to maintain the recommended minimum charge level. The AC load compounds across trips, resulting in approximately 58 minutes longer recharging time after equivalent trips with AC compared to without (441 vs. 383 minutes).
3.7. Solar EV Charging Station Capacity Assessment
The sustainability of the NADDC solar EV charging station at UNN is evaluated by comparing its daily energy generation capacity against the charging requirements of the Hyundai Kona EV. Under optimal conditions with approximately 6 peak sunlight hours per day, the maximum theoretical daily energy generation is:
Maximum Daily Energy = 19.9 kW × 6 h = 119.4 kWh
After accounting for system efficiency losses estimated at 75%, the effective daily energy available is:
Effective Daily Energy = 119.4 kWh × 0.75 = 89.55 kWh
Since the effective daily energy of 89.55 kWh exceeds the 68.16 kWh required for a full Kona EV charge (Equation 3), the solar station is capable of sustainably supporting one full Hyundai Kona EV charge per day, with a residual energy margin of:
Residual Energy = 89.55 − 68.16 = 21.39 kWh
This residual margin of 21.39 kWh is insufficient to support a second full EV charge, confirming that the NADDC solar station at UNN can sustainably serve only one Hyundai Kona EV per day under typical operating conditions. Institutions operating multiple EVs of this class from this solar station would need to implement alternating daily charging schedules or invest in expanded solar array capacity and additional battery storage to support simultaneous or daily multi-vehicle charging. This finding underscores a fundamental capacity constraint of the current off-grid solar EV charging infrastructure at UNN and provides a quantitative basis for planning future infrastructure scale-up at similar facilities across Nigeria [9].
4. Discussion
The results of this study confirm and, in several respects, exceed the energy and economic advantages of battery electric vehicles over internal combustion engine vehicles reported in the broader literature. Whereas real-world driving studies of hybrid EVs have reported fuel-consumption reductions of 39.3% on freeways and 58.0% on arterial roads relative to ICE vehicles [13], the present field trial found the fully electric Hyundai Kona to consume approximately 7.6 times less energy per trip than the Toyota Corolla, an advantage considerably larger than that reported for hybrid drivetrains. This difference is consistent with expectations: unlike hybrids, a full BEV eliminates thermodynamic combustion losses entirely, and the stop-and-go character of the campus test route maximised the contribution of regenerative braking to energy recovery while simultaneously penalising the part-load inefficiency of the ICE powertrain. The findings therefore reinforce, under Nigerian conditions for the first time, the general proposition established in high-income-country studies that urban and campus-type driving cycles are where the EV efficiency advantage is most pronounced [5,13].
The observed effect of air conditioning on EV range corroborates the literature identifying auxiliary climate loads as one of the most significant determinants of real-world EV range reduction in tropical and warm-climate settings [14,15]. The immediate 16 km reduction in dashboard-projected range upon AC activation, before the vehicle had moved, illustrates that this load is not merely incremental but an instantaneous and measurable drain, a phenomenon with particular relevance to Nigeria and similar West African contexts where AC use is a near-constant operational necessity rather than a seasonal one. More broadly, the gap between the manufacturer’s rated range (approximately 415–505 km, WLTP) and the effective real-world ranges estimated in this study (396.9 km without AC and 348.1 km with AC) falls within, and toward the upper end of, the 15–25% real-world range deviation from official estimates previously documented in the literature [14]. This reinforces the practical importance of field-validated range figures, rather than manufacturer specifications alone, for trip planning and range-anxiety mitigation among EV users in developing-country settings.
The economic findings extend the total-cost-of-ownership literature by providing an operating-cost data point specific to the Nigerian post-subsidy fuel-price environment. The observed per-kilometre cost differential of approximately 190 Naira in favour of the EV is consistent with, and considerably sharper than, the operating-cost advantages that TCO studies have identified as the primary long-term economic argument for EV adoption [16,17]. This sharper differential reflects the compounding effect of Nigeria’s 2023 fuel subsidy removal on ICE running costs, a country-specific factor that TCO studies conducted in high-income markets do not capture. However, this operating-cost advantage should be interpreted alongside, rather than as a substitute for, the acquisition-cost barrier previously documented for the Nigerian market, where new EVs remain priced well above the used petrol vehicles that dominate consumer choice [11,12]. The results therefore suggest that the economic case for EV adoption in Nigeria is strongest for high-utilisation users, such as institutional or ride-hailing fleets, for whom operating-cost savings can offset the purchase-price premium over a comparatively short period, echoing the ownership-period threshold logic identified by Rehman and Morsi [17] in a different national context.
The solar charging capacity assessment situates this study’s findings within the literature on off-grid renewable EV charging infrastructure in Nigeria. Prior work has established the technical and economic viability of PV-based charging stations across Nigeria’s diverse climatic zones [9], but had not quantified whether a station’s daily generation capacity is matched to the actual charging demand of a specific EV model in regular use. The present finding, that the 19.9 kW NADDC station at UNN can sustainably support only one full Hyundai Kona charge per day, with a residual margin of just 21.39 kWh, translates the general viability demonstrated in the prior literature into a concrete operational constraint. This has an important implication for infrastructure planning: institutions or fleet operators intending to deploy multiple EVs against a single station of this scale should not assume proportional scaling of daily throughput, and would instead need alternating charging schedules, an expanded solar array, or supplementary battery storage or grid interconnection to serve additional vehicles.
Taken together, these findings provide some of the first empirically grounded evidence that the energy-efficiency and operating-cost advantages of EVs, well documented in high-income-country contexts, hold, and in some respects are amplified, under real Nigerian driving and pricing conditions. This lends empirical weight to the broader policy case for EV adoption in sub-Saharan Africa, where EV penetration remains below 1% of light-duty vehicle sales [7], by showing that the barrier to adoption is unlikely to be the running-cost economics of EV ownership itself, but rather the upfront acquisition cost and the pace of charging-infrastructure deployment, consistent with the structural barriers identified in the wider adoption literature [10,11,12]. The results also underscore that solar-powered charging infrastructure, while a technically sound response to Nigeria’s grid-reliability challenges, requires deliberate capacity planning matched to expected vehicle numbers rather than being assumed to scale automatically with EV uptake.
These findings should nonetheless be interpreted in light of the study’s single-day, single-vehicle-pair design, and several directions for future research follow directly from this. Multi-seasonal replication would clarify how ambient temperature and solar irradiance variability affect both EV energy consumption and station generation capacity; higher-precision fuel-flow measurement would improve the resolution of ICE consumption estimates; and an expanded sample of EV and ICE models across different price points, together with an assessment of road-gradient effects and a full lifecycle cost analysis, would strengthen the generalisability of the economic conclusions drawn here. These and related priorities for future work are detailed further in Section 5.2.
5. Conclusions, Recommendations, and Future Work
5.1. Conclusions
This study presented an empirically grounded, field-based energy and economic comparison between the 2020 Hyundai Kona battery electric vehicle and the 2008 Toyota Corolla internal combustion engine vehicle, conducted under real driving conditions at the University of Nigeria, Nsukka. The following specific conclusions are drawn:
- (i)
- Energy Efficiency Advantage of the EV is Substantial: For an identical 8 km round-trip route, the Hyundai Kona EV consumed approximately 1.024 kWh without AC and 1.056 kWh with AC, compared to 7.78 kWh for the Toyota Corolla, an energy consumption ratio of approximately 7.6:1 in favour of the EV. This ratio exceeds efficiency advantages reported in comparable real-world driving studies, consistent with the regenerative braking advantage in campus stop-and-go driving conditions.
- (ii)
- Air Conditioning Imposes a Measurable and Practically Significant Energy Penalty: Activation of the AC system at low intensity caused an immediate 13 km reduction in dashboard-projected range before driving commenced. The average range expenditure rate increased from 1.263 km/km without AC to 1.399 km/km with AC, an increase of approximately 10.8%. Over a full charge cycle, this translates to an effective achievable range of approximately 396.9 km without AC and 348.1 km with AC, a reduction of approximately 48.8 km attributable solely to AC usage at low intensity.
- (iii)
- The Economic Case for EV Adoption is Compelling on a Per-Kilometre Basis: The per-trip energy cost of the Hyundai Kona EV was approximately 230.4 Naira without AC and 237.6 Naira with AC, compared to approximately 1,750.5 Naira for the Toyota Corolla. On a per-kilometre basis, the EV costs 28.8–29.7 Naira/km compared to 218.8 Naira/km for the ICE vehicle, a saving of approximately 190 Naira per kilometre.
- (iv)
- Empirical Linear Models Successfully Characterise EV Charging and Discharging Behaviour: Two empirical linear models were developed and validated: y = 5.57x − 45 relating state of charge (%) to projected drivable range (km), and y = −6.44x + 647 relating state of charge (%) to remaining charging time (minutes). These models provide practical planning tools for EV users and fleet operators.
- (v)
- The NADDC Solar EV Charging Station Can Sustainably Support One Full EV Charge Per Day: The station generates an effective daily energy of approximately 89.55 kWh after efficiency losses, sufficient to support one full Hyundai Kona EV charge requiring approximately 68.16 kWh, with a residual margin of approximately 21.39 kWh insufficient for a second full charge.
5.2. Limitations of the Study
The limitations of this study are acknowledged. First, the experiment was conducted over a short route of approximately 8 km under a specific set of ambient conditions on a single day, which limits the generalisability of the results across seasons and longer trip profiles. Second, only one EV model and one ICE vehicle model were tested, and findings may not generalise to other vehicle types. Third, the charging data were collected across a limited state-of-charge range (70–99%), constraining the validated range of the linear charging models.
5.3. Recommendations and Future Work
Based on the findings and limitations of this study, the following recommendations are made:
- (i)
- For EV Users and Fleet Operators in Nigeria: EV users operating the Hyundai Kona in tropical conditions should anticipate an effective driving range of approximately 397 km without AC and 348 km with AC at low intensity. For planning intercity trips such as the Nsukka–Enugu route (126 km round trip), a maximum of 2 safe round trips per full charge is recommended when observing the manufacturer’s minimum battery level of 20%. AC should be used judiciously on longer trips to maximise range.
- (ii)
- For Solar EV Charging Infrastructure Planning: Given that the NADDC solar station at UNN can sustainably support only one full Hyundai Kona EV charge per day, institutions planning to operate multiple EVs from a similar solar facility should expand the solar array capacity to at least approximately 35–40 kW installed capacity, or supplement the solar system with grid interconnection or additional battery storage to enable multi-vehicle daily charging.
- (iii)
- For Future Research: Future studies should: (a) conduct experiments across multiple seasons to capture the effect of varying ambient temperature and solar irradiance; (b) employ precision gravimetric or electronic fuel flow measurement for ICE vehicle fuel consumption; (c) expand the vehicle sample to include multiple EV and ICE models at different price points; (d) evaluate the impact of road gradient and surface quality on EV energy consumption under Nigerian road conditions; and (e) conduct a full lifecycle cost analysis incorporating vehicle acquisition cost, battery replacement, maintenance, insurance, and depreciation.
- (iv)
- For Policymakers: The results provide empirical evidence supporting the economic and energy efficiency case for EV adoption in Nigeria. Policymakers should consider: (a) establishing preferential electricity tariffs for EV charging at public and institutional solar charging stations; (b) developing import duty waivers or local assembly incentives for affordable EV models to reduce the acquisition cost barrier; and (c) expanding the NADDC solar EV charging station programme to additional public institutions, using the capacity assessment methodology demonstrated in this study as a standard framework for station sizing and planning.
Author Contributions
Conceptualization, O.A and Author 2.; methodology, O.A and Author 3; formal analysis, O. A and Author 3; investigation, O.A and Author 3; writing — original draft preparation, O.A and Author 3; writing — review and editing, O.A and Author 3.; supervision, O.A and Author 2. All authors have read and agreed to the published version of the manuscript.
Funding
This publication was funded by the Department of Electrical and Smart Systems Engineering, College of Science, Engineering and Technology, University of South Africa (UNISA).
Data Availability Statement
The data that support the findings of this study are available from the corresponding author upon reasonable request.
Conflicts of Interest
The authors declare no conflict of interest.
Acknowledgments
The authors acknowledge the Department of Electrical and Smart Systems Engineering, College of Science, Engineering and Technology, University of South Africa (UNISA), for funding this publication.
References
- IPCC. Climate Change 2022: Mitigation of Climate Change. Contribution of Working Group III to the Sixth Assessment Report of the Intergovernmental Panel on Climate Change; Chapter 10: Transport; Cambridge University Press: Cambridge, UK, 2022; Available online: https://www.ipcc.ch/report/ar6/wg3/chapter/chapter-10/ (accessed on 1 June 2025).
- Akujor, C.E.; Uzowuru, E.E.; Abubakar, S.S.; Amakom, C.M. Decarbonisation of the Transport Sector in Nigeria. Environ. Health Insights 2022, 16, 1–8. [Google Scholar] [CrossRef] [PubMed]
- European Commission. Regulation (EU) 2023/851 of the European Parliament and of the Council on CO2 Emission Standards for New Passenger Cars and New Light Commercial Vehicles; Official Journal of the European Union: Brussels, Belgium, 2023. [Google Scholar]
- Vascan, I.; Szabó, L. A Brief History of Electric Vehicles. J. Comput. Sci. Control Syst. 2022, 15, 19–26. [Google Scholar]
- Kathiresh, M.; Kanagachidambaresan, G.R.; Williamson, S.S. (Eds.) E-Mobility: A New Era in Automotive Technology. In EAI/Springer Innovations in Communication and Computing; Springer International Publishing: Cham, Switzerland, 2022. [Google Scholar] [CrossRef]
- Fessler, D.C. The Energy Disruption Triangle: Three Sectors That Will Change How We Generate, Use, and Store Energy, 1st ed.; Wiley: Hoboken, NJ, USA, 2019. [Google Scholar] [CrossRef]
- International Energy Agency (IEA). Global EV Data Explorer; IEA: Paris, France, 2024; Available online: https://www.iea.org/data-and-statistics/data-tools/global-ev-data-explorer (accessed on 1 June 2025).
- BloombergNEF. Electric Vehicle Outlook 2024; BloombergNEF: New York, NY, USA, 2024; Available online: https://about.bnef.com/electric-vehicle-outlook/ (accessed on 1 June 2025).
- Oladigbolu, J.O.; Mujeeb, A.; Imam, A.A.; Rushdi, A.M. Design, Technical and Economic Optimization of Renewable Energy-Based Electric Vehicle Charging Stations in Africa: The Case of Nigeria. Energies 2023, 16, 397. [Google Scholar] [CrossRef]
- Ajao, Q.; Sadeeq, L.; Sadiq, O.O. Drivers of Electric Vehicle Adoption in Nigeria: An Extended UTAUT Framework Approach. Afr. J. Environ. Sci. Renew. Energy 2024, 16, 229–251. [Google Scholar] [CrossRef]
- Bawa, A.; Nwohu, M.N. Investigating the Penetration Rate of Electric Vehicle in Developing Countries: Nigeria as a Case Study. In Proceedings of the International MultiConference of Engineers and Computer Scientists (IMECS) 2023, Hong Kong, China, 5–7 July 2023; pp. 105–109, ISSN 2078-0966. [Google Scholar]
- Ajao, Q.M.; Sadeeq, L. An Approximate Feasibility Assessment of Electric Vehicles Adoption in Nigeria: Forecast 2030. arXiv. 2023. Available online: https://arxiv.org/abs/2305.17844 (accessed on 1 June 2025).
- Zhang, Y.; Fan, P.; Lu, H.; Song, G. Fuel Consumption of Hybrid Electric Vehicles Under Real-World Road and Temperature Conditions. Transp. Res. Part D. Transp. Environ. 2025, 142, 104691. [Google Scholar] [CrossRef]
- Castillo-Calderón, J.; Larrodé-Pellicer, E. Energy Consumption Prediction in Battery Electric Vehicles: A Systematic Literature Review. Energies 2026, 19, 371. [Google Scholar] [CrossRef]
- US Department of Energy. Fuel Economy Guide: Driving Habits and Fuel Economy. Office of Energy Efficiency and Renewable Energy: Washington, DC, USA, 2023. Available online: https://www.fueleconomy.gov/feg/driveHabits.jsp (accessed on 29 September 2023).
- de Albuquerque Felizola Romeral, P.A.; Zancul, E. Total Cost of Ownership of Electric Vehicles: A Synthesis of Critical Factors. J. Eng. 2025, 2025, e70113. [Google Scholar] [CrossRef]
- Rehman, M.M.; Morsi, W.G. Comparative Economic Analysis of Conventional and Plug-in Battery Electric Vehicles in Canada. In Proceedings of the 2022 IEEE Electrical Power and Energy Conference (EPEC), Victoria, BC, Canada, 5–7 December 2022; pp. 218–223. [Google Scholar] [CrossRef]
- The Engineering ToolBox. Fossil vs. Alternative Fuels—Energy Content. 2003. Available online: https://www.engineeringtoolbox.com/fossil-fuels-energy-content-d_1298.html (accessed on 1 June 2025).
Figure 1.
The NADDC at UNN Charging Station component including the battery bank, solar arrays, and inverter section.
Figure 1.
The NADDC at UNN Charging Station component including the battery bank, solar arrays, and inverter section.
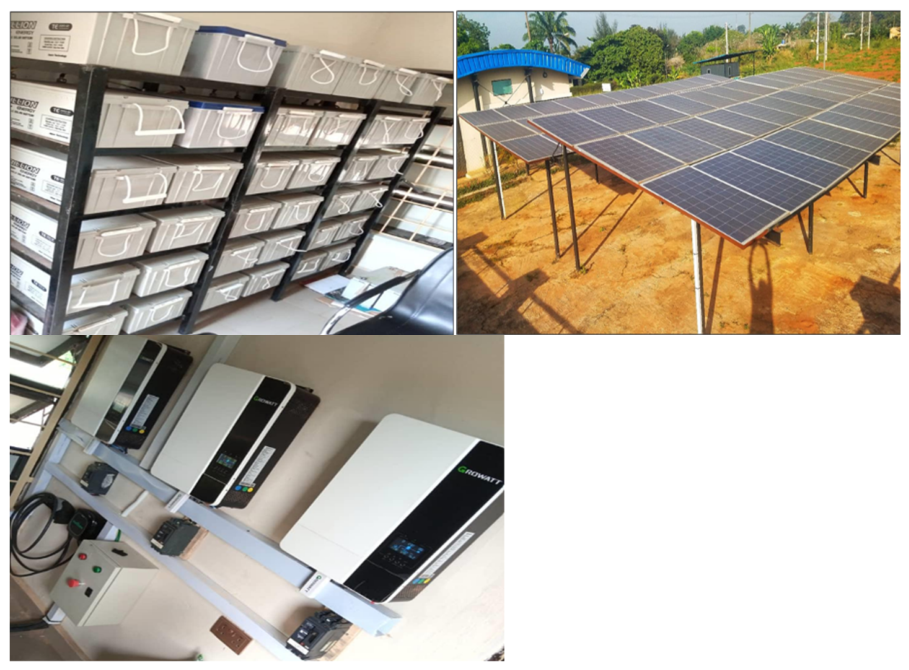
Figure 2.
Relationship between state of charge (%) and projected drivable range (km). Data points from Table 3; linear regression: y = 5.57x − 45.
Figure 2.
Relationship between state of charge (%) and projected drivable range (km). Data points from Table 3; linear regression: y = 5.57x − 45.
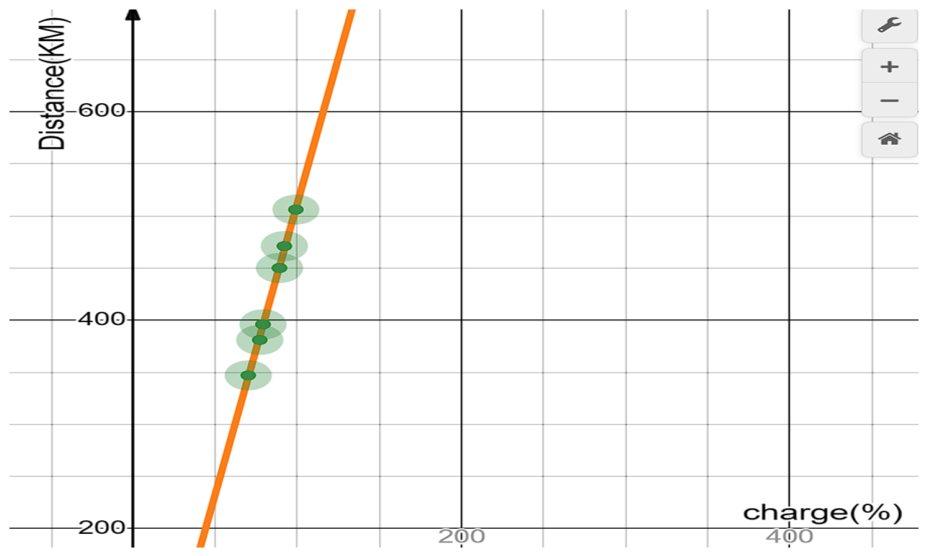
Figure 3.
Relationship between state of charge (%) and remaining time to full charge (min). Linear regression: y = −6.44x + 647.
Figure 3.
Relationship between state of charge (%) and remaining time to full charge (min). Linear regression: y = −6.44x + 647.
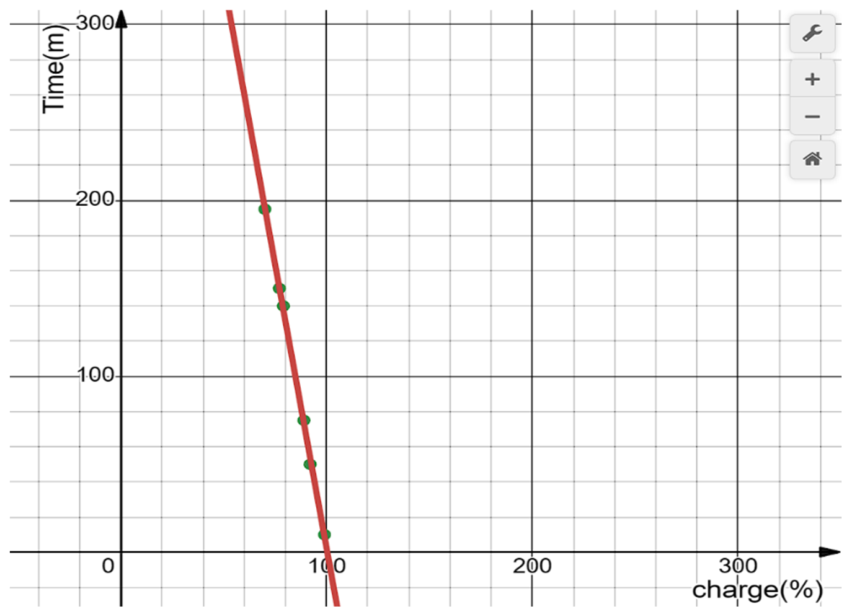
Figure 4.
Dashboard of the Hyundai Kona EV during charging at the NADDC solar EV charging station.
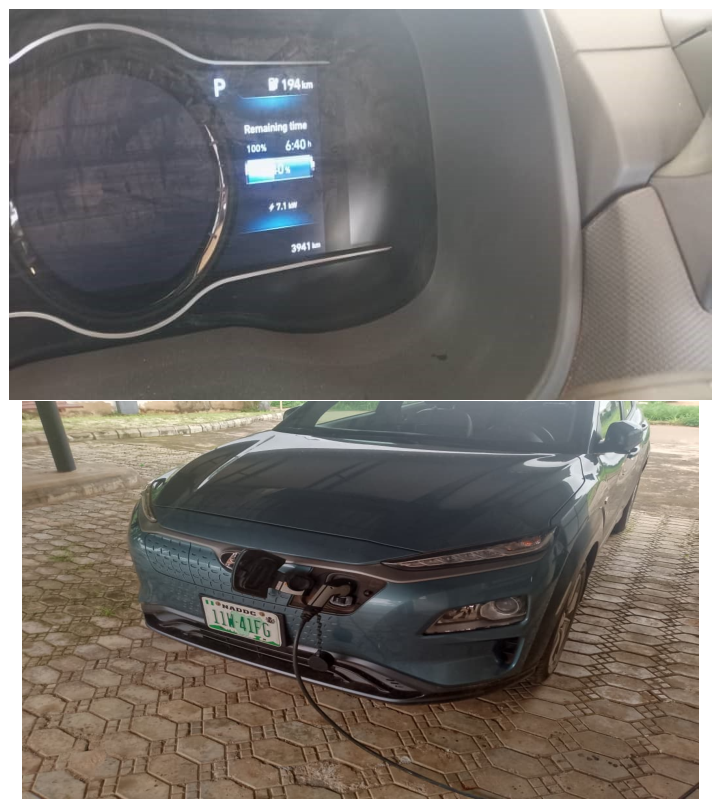
Figure 5.
Dashboard data recorded during EV discharging experiment.
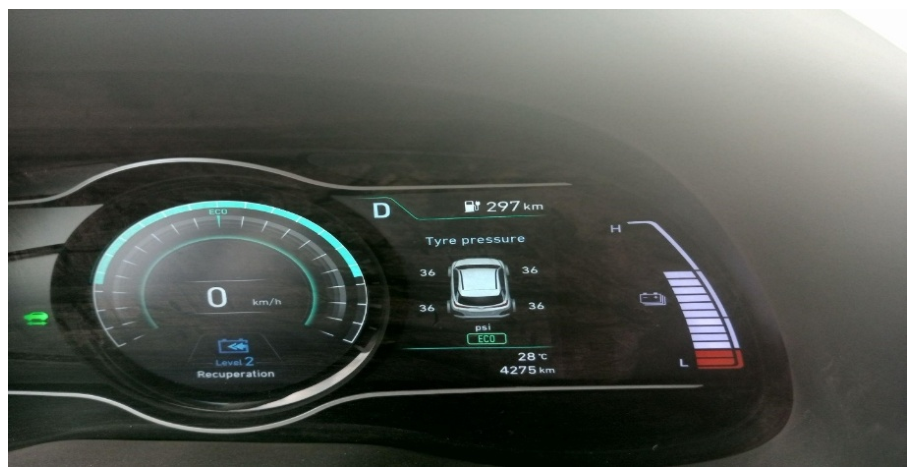
Figure 6.
Toyota Corolla dashboard during the driving experiment.
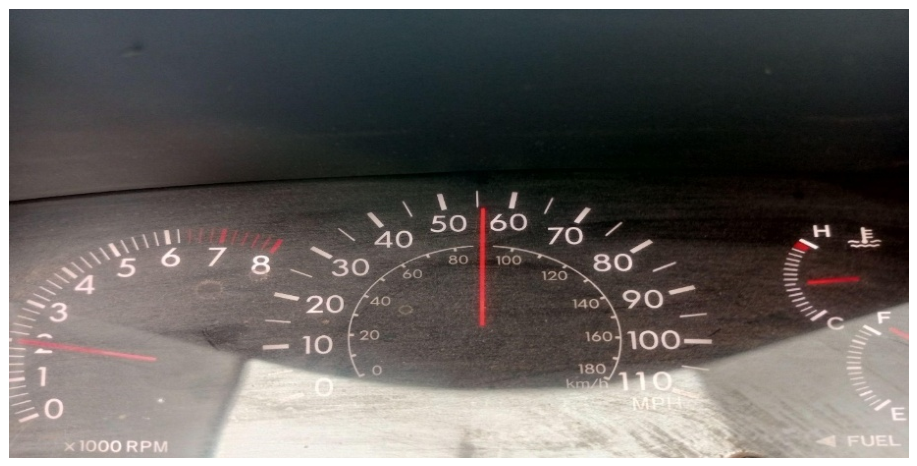
Table 1.
Technical Specifications of Test Vehicles.
| Parameter | Hyundai Kona EV (2020) | Toyota Corolla (2008) |
| Powertrain Type | Battery Electric (BEV) | Internal Combustion Engine (ICE) |
| Engine/Motor | 150 kW Electric Motor | 1.8L I4 DOHC, 94 kW |
| Battery/Fuel Capacity | 64 kWh (Li-ion, 356 V) | 50 L fuel tank |
| Drivetrain | Front-Wheel Drive (FWD) | Front-Wheel Drive (FWD) |
| Curb Weight | 1,710 kg | 1,145 kg |
| Passenger Capacity | 5 | 5 |
| Rated Range (Official) | ~415 km (WLTP) | N/A |
| Level 2 Charging Time (0–100%) | ~9.5 hours at 7.1 kW | N/A |
| Fuel Economy (City) | N/A | ~28 MPG |
| Top Speed | 167 km/h | ~180 km/h |
Table 2.
NADDC Solar EV Charging Station Specifications.
| Parameter | Value |
| Solar Array Installed Capacity | 19.9 kW |
| Peak Sunlight Hours (Daily) | ~6 hours |
| Maximum Daily Energy Output (Theoretical) | 119.4 kWh |
| Battery Storage Capacity (Nominal) | 95 kWh |
| Usable Battery Capacity (at 80% DOD) | ~76 kWh |
| Battery Full Charge Time (at 80% DOD, 75% system efficiency) | ~4 hours |
| EV Charging Output | Level 2 AC, 7.1 kW |
Table 3.
EV Charging Data as Observed from Dashboard.
| S/N | Charging Rate (kW) | Total Distance Coverable (km) | Time to Full Charge (h:mm) | State of Charge (%) |
| 1 | 7.1 | 347 | 03:15 | 70 |
| 2 | 7.1 | 381 | 02:30 | 77 |
| 3 | 7.1 | 396 | 02:20 | 79 |
| 4 | 7.1 | 450 | 01:15 | 89 |
| 5 | 7.1 | 471 | 00:50 | 92 |
| 6 | 7.1 | 506 | 00:10 | 99 |
Table 4.
EV Driving Test with AC — First Trip.
| Time | Interval (min) | Range Remaining (km) | Distance Covered (km) | Total from Origin (km) |
| 8:31 am | 0 | 276 | 0 | 4267 |
| 8:36 am | 5 | 267 | 3.69 | 4270 |
| 8:41 am | 5 | 263 | 3.97 | 4274 |
| 8:42 am | 1 | 263 | 0.29 | 4275 |
Table 5.
EV Driving Test without AC — First Trip.
| Time | Interval (min) | Range Remaining (km) | Distance Covered (km) | Total from Origin (km) |
| 8:44 am | 0 | 297 | 0 | 4275 |
| 8:47 am | 3 | 289 | 2.68 | 4277 |
| 8:50 am | 3 | 287 | 1.91 | 4279 |
| 8:53 am | 3 | 283 | 2.86 | 4282 |
| 8:54 am | 1 | 283 | 0.71 | 4283 |
Table 6.
EV Driving Test with AC — Second Trip.
| Time | Interval (min) | Range Remaining (km) | Distance Covered (km) | Total from Origin (km) |
| 8:57 am | 0 | 239 | 0 | 4285 |
| 9:00 am | 3 | 233 | 2.16 | 4287 |
| 9:03 am | 3 | 230 | 2.20 | 4290 |
| 9:06 am | 3 | 228 | 2.70 | 4291 |
| 9:07 am | 1 | 228 | 1.03 | 4293 |
Table 7.
EV Driving Test without AC — Second Trip.
| Time | Interval (min) | Range Remaining (km) | Distance Covered (km) | Total from Origin (km) |
| 9:09 am | 0 | 271 | 0 | 4291 |
| 9:12 am | 3 | 268 | 1.80 | 4293 |
| 9:15 am | 3 | 264 | 2.60 | 4295 |
| 9:18 am | 3 | 263 | 2.40 | 4298 |
| 9:20 am | 2 | 264 | 1.25 | 4299 |
Table 8.
Data for Toyota Corolla Experiment.
| Trip No | Start Time (am) | Arrive Gate (am) | End Time (am) | Max Speed (km/h) | Fuel Volume (L) |
| 1 | 10:09 | 10:16 | 10:21 | 100 | 0.875 |
| 2 | 10:22 | 10:28 | 10:33 | 90 | 0.875 |
| 3 | 10:33 | 10:39 | 10:44 | 72 | 0.875 |
| 4 | 10:44 | 10:49 | 10:54 | 92 | 0.875 |
Table 9.
Energy Consumption Comparison — Hyundai Kona EV vs. Toyota Corolla.
| Vehicle | Condition | Energy/Trip (kWh) | Energy/Trip (MJ) | Energy/km (kWh/km) |
| Hyundai Kona EV | AC Off | 1.024 | 3.69 | 0.128 |
| Hyundai Kona EV | AC On (Low) | 1.056 | 3.80 | 0.132 |
| Toyota Corolla ICE | AC Off | 7.78 | 28.00 | 0.973 |
Table 11.
Scenario Analysis Summary — Nsukka–Enugu Round Trip (126 km).
| Parameter | Without AC | With AC (Low) |
| Round trip distance | 126 km | 126 km |
| Starting dashboard range | 500 km | 487 km |
| Dashboard consumed per round trip | 159 km | 176 km |
| Max trips (no battery constraint) | 3 trips (23 km left — unsafe) | 2 trips (135 km left) |
| Safe complete trips (20% DOD) | 2 trips | 2 trips |
| Dashboard range after 2 safe trips | 182 km | 135 km |
| State of charge after 2 trips | ~41% | ~32% |
| Charging time back to full | ~383 min (6.4 hrs) | ~441 min (7.35 hrs) |
Disclaimer/Publisher’s Note: The statements, opinions and data contained in all publications are solely those of the individual author(s) and contributor(s) and not of MDPI and/or the editor(s). MDPI and/or the editor(s) disclaim responsibility for any injury to people or property resulting from any ideas, methods, instructions or products referred to in the content. |
© 2026 by the authors. Licensee MDPI, Basel, Switzerland. This article is an open access article distributed under the terms and conditions of the Creative Commons Attribution (CC BY) license.
Copyright: This open access article is published under a Creative Commons CC BY 4.0 license, which permit the free download, distribution, and reuse, provided that the author and preprint are cited in any reuse.