

Submitted:
31 July 2026
Posted:
03 August 2026
You are already at the latest version
Abstract
This paper presents an acoustic emission (AE) based Identification of Active Anomalies (IAA) system that integrates signal clustering, image recognition, and machine learning to monitor the structural condition of a highway overpass located near a major urban agglomeration. The monitoring results provide a reliable foundation for assessing structural health and implementing automated load (traffic) control, which is essential to ensure safe operations. AE signals recorded under service loads undergo multi-parametric analysis using pattern recognition techniques and are assigned to specific classes corresponding to active anomalies within the material or structure. Each class is linked to a distinct structural hazard level, ranging from safe operation to a critical loss of structural safety. Corresponding traffic control measures, including vehicle speed and weight restrictions, are dynamically introduced to maintain operational safety. The proposed methodology was experimentally validated on an A2 highway overpass, a vital component of the Łódź transport hub that facilitates north-south and east-west transit in Poland. The IAA system functions as a proactive diagnostic tool for infrastructure management agencies, preventing sudden, unforeseen structural failures. Ultimately, it enables the efficient and safe operation of a Smart City while optimization-driven funds are rationally allocated for road infrastructure maintenance.
Keywords:
SHM
; acoustic emission
; destructive processes
; durability
; pattern recognition
; smart city
Introduction
The integration of transportation infrastructure into the paradigm of modern Smart Cities requires dynamic, intelligent management systems to satisfy evolving economic and social demands [1]. Within sustainable urban development, smart structural design places immense focus on ecological and structurally resilient systems [2], thereby driving a transition toward robust civil infrastructure [3]. Modern asset management requires continuous structural health monitoring (SHM) frameworks capable of operating seamlessly under variable and dynamic environmental conditions [4]. Effective diagnostics and maintenance optimization of highway bridges are critical to preventing catastrophic failures [5]. Traditional, visual bridge inspection techniques suffer from severe limitations, such as human error and a lack of real-time diagnostic capabilities [6]. Moreover, the inherent subjectivity in conventional infrastructure management calls for immediate automation [7]. Unexpected bridge closures in urban transport hubs lead to severe economic, social, and environmental consequences [8], making proactive maintenance strategies mandatory to extend the service life of aging concrete structures [9].
To address these challenges, comprehensive SHM principles have been established to replace reactive repairs with predictive maintenance [10]. Modern SHM relies heavily on data-driven methods for reliable structural diagnosis [11]. The deployment of advanced Internet of Things (IoT) architectures enables persistent monitoring of smart city structures [12]. Concurrently, wireless sensor networks are widely implemented for real-time bridge evaluation [13], often supported by high-precision fiber optic sensors embedded within vulnerable elements [14]. This technological paradigm marks a crucial evolution from conventional reactive maintenance to high-utility predictive engineering [15].
Among non-destructive testing (NDT) options, acoustic emission (AE) stands out as an exceptionally effective diagnostic tool for civil engineering applications [16]. Unlike static testing methods, AE monitoring allows for the continuous tracking of concrete structures under real service loads [17]. It offers distinct diagnostic advantages over traditional vibration-based monitoring by focusing on active damage nucleation rather than global structural shifts [18]. In prestressed and reinforced concrete elements, AE parameters are uniquely capable of identifying active microscopic damage mechanisms [19]. This includes the precise, early-stage detection of sudden wire breaks in internal prestressed bridge strands [20]. However, the real-world deployment of AE sensors encounters major challenges due to environmental and operational noise variability [21]. Overcoming these ambient disturbances requires robust noise mitigation and signal filtering strategies during operational bridge testing [22].
Artificial intelligence and machine learning (ML) paradigms have revolutionized automated data interpretation in SHM [23,24]. Unsupervised clustering techniques, such as Self-Organizing Maps (SOM), are heavily utilized for concrete damage classification based on multi-parametric AE features [25]. Signal processing is further enhanced through Principal Component Analysis (PCA) for data denoising [26], alongside advanced multi-parametric wave feature extraction methods [27,28]. Recent breakthroughs in deep learning have introduced Deep Convolutional Neural Networks (CNNs) for the automated classification of acoustic emission sources [29]. Time-series AE datasets are increasingly processed using Long Short-Term Memory (LSTM) networks to account for temporal dependencies [30]. Furthermore, deep multimodal learning strategies offer new perspectives for cross-validating structural data [31]. AI-driven systems now facilitate automated damage quantification [32], as well as fault localization and severe hazard assessment in complex cable-stayed structures [33]. This theoretical and practical foundation directly underlies the development of the Identification of Active Anomalies (IAA) system, which leverages AE to secure critical infrastructure [34]. The IAA system represents a comprehensive, field-tested realization of automated, continuous monitoring designed explicitly for the complex operational profiles of cable-stayed concrete bridges [35]. Furthermore, recent advancements in the structural health monitoring paradigm have increasingly focused on the integration of physics-informed neural networks (PINNs) [36] and digital twin frameworks to handle the massive data streams generated by operational infrastructure [37]. Modern smart city networks leverage these hybrid architectures to correlate acoustic emission indices with real-time weigh-in-motion (WIM) traffic data, providing a holistic view of structural capacity. By incorporating these cutting-edge deep multimodal architectures, contemporary SHM platforms can better differentiate between harmless environmental variations and structural anomalies [38]. Developed between 2023 and 2025 under the RID II governmental research project, the IAA method allows in-service measurements. It provides objective assessments, paving the way for a more efficient and reliable bridge monitoring system.
IAA - Identification of Active Anomalies System
Basics
The mechanical loading of materials causes deformation, leading to destructive processes that generate detectable acoustic emission (AE) waves. These elastic waves result from the rapid release of stored strain energy due to micro-damage, such as crack growth and dislocation movement. Various parameters—including hit count, peak amplitude, duration, rise time, signal energy, signal strength, and counts-to-peak—describe these AE waves. Advanced analysis of these parameters enables their classification into groups corresponding to specific destructive processes. A reference database for cable-stayed and prestressed concrete elements, integrated within the IAA method, was developed from comprehensive laboratory and in-situ tests, with signal designations and classes outlined in Table 1.
During monitoring, AE signals are recorded by a dedicated processor and automatically compared to the pre-established reference database. Through pattern recognition, these signals are classified into anomaly categories, aiding in the assessment of the structural element's condition. The reference databases were created using material samples and specialized destructive tests, and they were subsequently validated during in-situ operations. Statistical signal analysis was conducted using NOESIS v.12.0 software, employing both Unsupervised and Supervised Pattern Recognition systems to develop the analytical "black box" core for the IAA system. Structural damage criteria were established based on the analysis of these destructive process classes, as crack propagation significantly impacts structural service life (Table 2).
In assessing the degree of structural degradation, the codification of damage severity levels is of paramount importance. In conventional bridge management, visual inspection represents the classical approach, with its qualitative findings quantified through numerical codes.
These inspection results are compiled into standardized tables, which serve as the decision-making baseline for asset managers. To align acoustic emission (AE) monitoring outputs with this traditional paradigm, two comprehensive reference frameworks have been developed. These frameworks enable AE data to be presented in a manner highly compatible with classical inspections and expert assessments, utilizing two distinct metrics: damage extent and structural sensitivity. Both metrics employ a standardized 6-degree evaluation scale.
The assessment of damage extent relies on spatial (zone) localization coupled with the classification of AE signals within those discrete zones. Specifically, the damage extent is quantified by the percentage distribution of zones exhibiting specific AE signal classes. In accordance with the established codification system, the respective damage and sensitivity states are detailed in Table 3 and Table 4.
To enhance the reliability of this metric, historical monitoring data and the empirical expertise of the research team are heavily utilized. The codification of both damage extent and structural sensitivity must be executed in strict accordance with the guidelines outlined in the reference tables below, and subsequently integrated with the holistic assessments of all structural elements obtained via traditional methods.
To effectively evaluate the health condition of prestressed or reinforced concrete beams under service loads, a dual-metric codification framework based on damage extent and structural sensitivity is implemented. This approach bridges the gap between discrete AE data and classical bridge management diagnostics. The damage extent within the beam is quantified through structural zoning and spatial source localization. By dividing the beam into finite, monitored zones, the cumulative AE activity is isolated and analyzed. The extent of degradation is mathematically evaluated as the percentage ratio of active zones exhibiting critical AE signal classes relative to the total monitored volume of the beam. This metric, codified in Table 3, characterizes the geometric and physical propagation of active anomalies across the structural member. Historical operational data and continuous background noise filtering are leveraged to ensure that early-stage micro-crack propagation (Classes 1–3) is distinctly differentiated from macro-structural defects (Classes 4–6). Concurrently, the impact of these localized defects on the global load-bearing capacity is evaluated using the structural sensitivity matrix detailed in Table 4. This sensitivity assessment defines how specific acoustic events—such as grout-aggregate debonding, concrete crushing, or internal prestressed wire fractures—affect the immediate and long-term structural integrity of the beam. The degradation scale ranges from a pristine, as-built state (Code 5) to global functional failure or collapse (Code 0). By combining the spatial coverage of the damage (Table 3) with its severity and load-bearing impact (Table 4), asset managers can generate a multi-dimensional structural risk profile. For instance, a beam exhibiting severe defects (Table 3, Code D) restricted to a non-critical localized zone may possess a lower risk index than a beam with minor but widespread wire breaks (Table 4, Code 1) clustered near critical high-bending-moment regions. This unified framework enables automated, data-driven load and traffic control adjustments, shifting infrastructure maintenance from reactive intervention to high-utility predictive engineering.
Tests and the Results of the IAA System Application for Viaduct Condition Assessment
Selected structural elements of the WA252 road viaduct on the left carriageway of the A1 highway (km 302+952.10 to 303+117.80) were investigated. This structure accommodates a large animal ecological corridor and spans the "L" class communal road No. 106309E (Moskwa–Plichtów) under the A1 highway. Six-span continuous slab-girder structures, each featuring three main prestressed concrete girders, are utilized for both traffic directions. The girders are 1.34 m high, with a minimum width of 0.8 m and a spacing of 6 m. The deck slab has a minimum thickness of 0.28 m. The abutments are massive, reinforced concrete structures, separated at the median strip, with wings parallel to the longitudinal axis of the structure, founded on soil reinforced with Deep Soil Mixing (DSM) columns. Intermediate supports consist of reinforced concrete piers, each comprising three 1.2 × 1.2 m rectangular columns founded on piles with 3.30 × 2.70 m pile caps connected by beams.
A general view of the structure is shown in Figure 1. The central beam of the left (eastbound) carriageway was investigated in the areas above supports No. 2 (km 302+979.35) and No. 6 (km 303+090.55), with support numbering conforming to the design documentation of the viaduct. The locations of the investigated areas and the arrangement of the AE sensors are shown schematically in Figure 2 and Figure 3. The investigations included measuring AE signals generated by the physical processes associated with the structural behavior under both regular traffic loads and proof tests. A 24-channel SAMOS acoustic emission processor equipped with appropriate cabling and VS-30 flat-response sensors (operating in the 20–120 kHz range) was used for the tests. Sixteen sensors were linearly arranged along the bottom of the beams with a spacing of 200 cm.
This distance proved sufficient to register all relevant AE signals from the investigated beams. A view of the monitored beams with the arranged sensors is displayed in Figure 4. During the investigation, the linear location method was applied. Before and after the measurement, sensor calibration was performed by generating a standard Hsu-Nielsen wave source. The signal amplitude for the sensors ranged from 98 to 99 dB. To ensure the geometric precision of the linear source location along the 200 cm sensor spans, the average longitudinal wave velocity within the prestressed concrete matrix was determined experimentally. Based on the automated travel-time calibration executed via repeated Hsu-Nielsen pencil-lead breaks, the wave velocity was calculated to be approximately 3,950 m/s. This calibration value accounts for the high density of the concrete and the presence of internal reinforcement, enabling the IAA system to locate active anomalies with a spatial resolution of ±5 cm, which is sufficient for mapping crack formations in specific measurement zones. The measurements were taken during the regular operation of the structure as well as during a proof load test (Figure 5).
The measurements were taken during the regular operation of the structure as well as during a proof load test (Figure 5).
Results
An analysis of the signal power plots versus location (Figure 6) for beam No. 2 reveals that under normal daily traffic, a high volume of Class 3 and Class 4 signals is recorded. These signals appear across all measurement zones, reaching values from 2.30e+06 to 1.40e+07 pVs for Class 3, and from 1.40e+07 to 3.90e+07 pVs for Class 4. According to Table 2, these correspond to signals representing low and elevated hazard levels for the operational viaduct.
Evaluating the impact of the detected defects on the structural technical condition of the tested viaduct element—using their spatial extent (Table 3) and the Codification matrix for the impact of defects on structural technical condition (Table 4) — it should be noted that Class 3 and 4 signals indicate the active behavior of existing cracks with opening widths up to 0.1 mm. Conversely, Class 1 and 2 signals indicate the presence of microcracks at the cement paste-aggregate interface, reaching values up to 1.20e+06 pVs for Class 1 and from 1.20e+06 to 2.30e+06 pVs for Class 2. These Class 1 to 4 signals encompass the entire surface area of the evaluated element. Although they exhibit no immediate impact on the load-bearing capacity of the tested viaduct, they systematically reduce its overall durability. It is also noteworthy that Class 3 and 4 signals appear sporadically in zones 3 and 4, where the tendon trajectory transitions from the upper to the lower position; consequently, the bending moment values in these regions are low.
The absence of continuous monitoring—at least every 6 months using the IAA method—could eventually necessitate decommissioning the structure for extensive repairs, such as crack injection or structural strengthening. Such an intervention would significantly disrupt traffic around the Łódź agglomeration as well as along the critical north-south transport corridor of Poland.
Measurement of AE Signals - The Beam Above Support No. 2 (KM 302+979.35) – Under Regular Traffic
To verify whether the recorded signals for beam No. 2 and their corresponding degradation processes are continuous or incidental under normal traffic loads, a follow-up measurement was conducted after 6 months. This evaluation was performed under a static proof load corresponding to 50%–60% of the effects induced by the nominal characteristic traffic load, in compliance with national technical guidelines and the ordinance of the General Director for National Roads and Motorways (recommendation WR-23). The results are presented below.
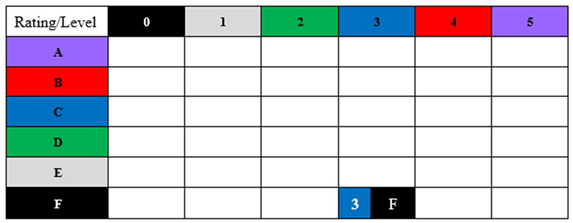

Table V.
Assessment of beam damage extent and structural vulnerability.
Measurement of AE Signals - The Beam Above Support No. 2 (KM 302+979.35) – Under Proof Load
Comparing the plots in Figure 6 and Figure 7, it is evident that the acoustic emission process under the static proof load is less intense (Figure 7), with Class 3 and 4 signals appearing in small quantities in only 4 zones. Their highest concentration occurs in zone 4, where their count was conversely the lowest under normal traffic conditions. This phenomenon confirms the hypothesis that dynamic loads originating from regular traffic play a dominant role in inducing and driving crack behavior. In the remaining zones, which cover 75% of the beam's surface area, only Class 1 and 2 signals were recorded. This validates the premise that the currently identified defects reduce structural durability but do not compromise the load-bearing capacity. Consequently, establishing routine inspection testing via the IAA method every 6 months is highly justified. To confirm these observed correlations, a second measurement was conducted on a beam exhibiting crack morphology located within the support zone and on the pier (Figure 5b).
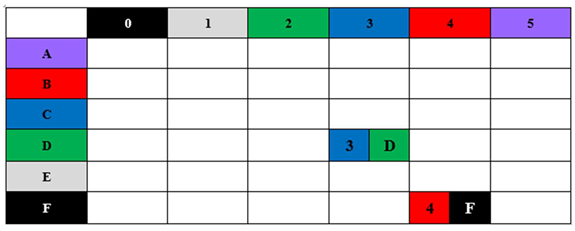
Table 6.
Assessment of beam damage extent and structural vulnerability.
Measurement of AE Signals of the Beam Above Support No. 6 (KM 303+117.80) – Under Regular Traffic
An analysis of the signal power plots versus location (Figure 8) for beam No. 6 shows that under normal daily traffic, a high volume of Class 3 and 4 signals is registered across all measurement zones. These reach values up to 1.40e+07 pVs for Class 3 and up to 9.00e+07 pVs for Class 4. According to Table 2, these signify low and elevated hazard levels for the operational viaduct. Assessing the impact of the detected defects on the structural technical condition of the tested element using their spatial extent (Table 3) and the Codification matrix (Table 4), it can be concluded that Class 3 and 4 signals indicate the active behavior of existing cracks with opening widths up to 0.1 mm. Comparing Figure 5b and Figure 8, the highest concentration of these signals is visible in the near-support zone and above the pier, with Class 4 values reaching up to 1.30e+08 pVs.
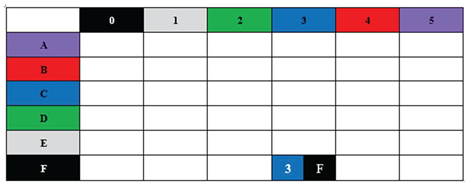
Table 7.
Assessment of beam damage extent and structural vulnerability.
The Class 1 to 4 signals cover the entire surface area of the tested element, indicating no immediate impact on the load-bearing capacity of the viaduct while reducing its long-term durability. Notably, Class 3 and 4 signals emerge in zones 1, 3, 15, and 16, where the tendon trajectory transitions from the upper to the lower position (where bending moments are low but shear forces peak), as well as in zones 7, 9, and 11–13, where the bending moment reaches its maximum values. This beam exhibits distinct degradation mechanisms compared to the previous one. As with beam No. 2, a follow-up measurement was carried out after a 6-month operational period under a static proof load corresponding to 50%–60% of the effects of the nominal characteristic traffic load. The results are presented below.
Measurement of AE Signals of the Beam Above Support No. 6 (KM 303+117.80) – Under Proof Load
Comparing the plots in Figure 8 and Figure 9, it is evident that the failure process under the static proof load differs significantly; critical Class 5 signals emerge (Figure 9), indicating cracks with opening widths exceeding 0.3 mm and the initiation of concrete-to-reinforcement slippage (bond loss). The structural member can be divided into two distinct regions: the first covering 85% and the second covering 15% of the total beam surface area. The larger region features Class 1–5 signals. Class 4 and 5 signals indicate an elevated hazard level for durability, though they do not actively affect the current load-bearing capacity. Their highest concentration appears in zone 1, which corresponds to the section directly above the pier and within the near-support zone. In the second region, spanning 15% of the beam surface area, only Class 1–3 signals were recorded, representing minor defects that impact neither the durability nor the load-bearing capacity of the viaduct.
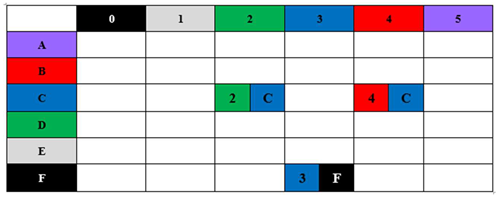
Table 8.
Assessment of beam damage extent and structural vulnerability.
The IAA system effectively supports the structural health monitoring of various bridge typologies, including prestressed concrete and cable-supported structures, thereby facilitating data-driven decision-making regarding durability and load-bearing capacity. Acoustic sensors are strategically deployed to monitor critical structural elements either continuously or during peak traffic hours. The registration of Class 4–6 signals triggers automated traffic control measures, such as reductions in vehicle speed and weight limits. In the event of Class 7 signaling, only light vehicles weighing under 3.5 tonnes are permitted on the structure, whereas Class 8 signaling mandates an immediate, total closure to traffic. For Class 7 and 8 signaling, an expert structural appraisal and additional non-destructive testing (NDT) using complementary methods must be commissioned on an emergency basis to verify the precise technical condition.
To date, this methodology has been successfully applied to assess the structural health of over 180 bridge structures, as well as to monitor structural safety during the passage of oversized, heavy-load vehicles.
IAA System for Automatic Identification of Active Anomalies to Ensure Safe Bridge Operation
The IAA system (Figure 10) features a modular architecture comprising several interconnected operational components:
- ➢
- Module M1-contains historical investigation data, past inspection records, and structural documentation.
- ➢
- Module M2-incorporates numerical calculations and structural simulations of the current asset, explicitly highlighting heavily stressed or critically vulnerable areas.
Acoustic emission (AE) sensors (1–5) are permanently mounted on the investigated structural elements and linked directly to the AE signal analysis module (Module M3), which automatically identifies the specific type and spatial location of ongoing anomalies (Classes 1–8). Subsequently, Module M3 relays this destructive process data to (Module M4) for comprehensive hazard analysis, and concurrently to (Module M6) for administrator signaling.
Within Module M4, the cumulative data is evaluated to quantify the immediate structural hazard level. This evaluation determines the necessity for operational load restrictions—such as limiting vehicle speed and maximum weight—and dynamically defines the subsequent measurement intervals. Supplementary environmental modules can be seamlessly integrated into the framework to monitor ambient conditions like temperature, relative humidity, and structural vibrations.
The operational decisions derived from these multi-parametric readings are transferred to (Module M5) (allowable load levels), which is responsible for displaying real-time traffic restrictions via automated stoplights and electronic no-entry signage.
Simultaneously, (Module M6) displays the real-time hazard levels and corresponding operational restriction messages on a dedicated control monitor. Ultimately, these modules operate in synergy to guarantee global structural safety through continuous health monitoring and rapid, data-driven decision-making (Table 9).
In the evaluated operational scenario, the monitoring framework is activated for a duration of one hour at predefined intervals (e.g., every two hours), executing measurements in a continuous loop. The official registration of a specific destructive process is triggered only upon the tenth consecutive recording of signals belonging to that particular class within a single measurement interval. The operational threshold of ten consecutive acoustic emission (AE) hits within a single measurement interval was established empirically based on statistical analysis of ambient and environmental noise.
During peak traffic hours, highway overpasses are subjected to intensive non-destructive acoustic phenomena, such as tire-pavement interaction, aerodynamic pressure waves, and structural joint movement. A single-hit or low-count trigger would result in a high rate of false-positive alarms within the smart city monitoring network. By implementing a mandatory accumulation threshold of ten verified signals within the same class, the IAA system filtering algorithm effectively suppresses transient operational noise while retaining a highly sensitive and reliable response to active, localized micro-damage propagation.
Discussion
- Identification of structural defects: Defects originating from both static and dynamic loading conditions were clearly observed and characterized within the analyzed bridge beams.
- Analysis of support-zone cracking: Visible cracks identified in the near-support areas are likely attributable to historical prestressing inaccuracies; however, follow-up monitoring confirmed no further increase in crack opening width. While these cracks do not currently compromise the structural load-bearing capacity, they pose a long-term risk of reinforcement corrosion. Consequently, targeted epoxy resin injection is highly recommended.
- Crack initiation and propagation mechanisms: During structural testing under both regular traffic and proof loads, the exact locations of crack initiation and the vectors of their propagation were successfully mapped. Currently, these cracks exhibit opening widths within the range of 0 to 0.1 mm, posing no immediate threat to the load-bearing capacity or structural durability. Nevertheless, due to the identified execution defects in the concrete matrix (such as micro-voids and insufficient compaction/vibration) combined with high dynamic impacts from transit traffic, it is strongly recommended to conduct routine AE testing at least twice a year (specifically in April and September) to monitor crack accumulation and propagation intensity.
- Load-dependent structural response: Notable crack propagation was recorded above support No. 2 primarily under dynamic traffic loads, whereas the beam section over support No. 6 exhibited active crack propagation predominantly during static proof load testing.
- Distinct degradation mechanisms in Beam No. 6: The emergence of critical Class 5 signals in Beam No. 6 under static proof loading reveals a fundamentally different structural degradation mechanism than that observed in Beam No. 2. This distinct behavior is directly correlated with the spatial boundary conditions and stress states of the respective sections. Beam No. 6 was monitored within the near-support zone and directly above the pier, where the structural element experiences a complex stress field characterized by peak negative bending moments combined with maximum vertical shear forces. The registration of Class 5 events strongly implies that the combination of these high shear stresses and micro-fissure coalescences has triggered a localized loss of bond (concrete-to-reinforcement slippage). This underscores the necessity of zone-specific risk assessment within the IAA framework, as identical load increments can induce nominal micro-cracking in mid-span regions but accelerate severe structural bond degradation in high-shear support zones.
- Validation of the NDT methodology: The high precision achieved in localizing anomalies and identifying micro-destructive mechanisms validates the suitability and efficacy of the AE-based method for the structural health monitoring of operational bridge infrastructure.
- Utility of the reference database: The integration of a validated signal reference database allows for an objective evaluation of the micro-mechanical phenomena occurring inside the concrete elements, successfully differentiating between active crack growth, stable crack behavior under service loads, and ongoing corrosion processes.
Summary
This paper demonstrates the practical suitability and high efficacy of the Acoustic Emission (AE) method for characterizing ongoing destructive processes —including micro-damage accumulation—under real-world operational service loads. The proposed monitoring framework provides infrastructure managers with comprehensive control, enabling a rapid response to newly emerging destructive processes while objectively quantifying both the structural susceptibility to damage and the total geometric extent of the degradation. By bridging the gap between discrete micro-acoustic data and macro-structural management, this system effectively supports the long-term maintenance of resilient transportation infrastructure, a core requirement of the modern Smart City paradigm. Ultimately, ensuring the efficiency, reliability, and safety of the transport network serves as a vital catalyst for regional economic growth and sustainable social development.
Author Contributions
Conceptualization, Aleksandra Krampikowska; Methodology, Aleksandra Krampikowska; Software, Aleksandra Krampikowska and Grzegorz Świt; Validation, Aleksandra Krampikowska and Grzegorz Świt; Formal analysis, Aleksandra Krampikowska and Grzegorz Świt; Investigation, Aleksandra Krampikowska and Grzegorz Świt; Resources, Aleksandra Krampikowska; Data curation, Aleksandra Krampikowska; Writing – original draft, Aleksandra Krampikowska; Writing – review & editing, Aleksandra Krampikowska and Grzegorz Świt; Visualization, Aleksandra Krampikowska and Grzegorz Świt; Supervision, Aleksandra Krampikowska and Grzegorz Świt; Project administration, Aleksandra Krampikowska; Funding acquisition, Aleksandra Krampikowska. All authors have read and agreed to the published version of the manuscript.
Funding
The project is supported by the program of the National Centre for Research and Development under the name: “"Diagnostics of prestressed and tension road engineering structures, including the selection of monitoring systems" Acronym: DiagSC., co-financing agreement number: RID2/0002/2022. Project co-financed by the National Centre for Research and Development and the General Directorate for National Roads and Motorways as part of the Joint Undertaking entitled Development of Road Innovations - RID.
Institutional Review Board Statement
Not applicable.
Informed Consent Statement
Not applicable.
Data Availability Statement
The data presented in this study are available on request from the corresponding author.
Conflicts of Interest
The authors declare no conflict of interest.
References
- Soumaya, F.; Garti, M. O.; Jabir, A.; Fouad, J. Smart Urban Logistics and Tube-Based Freight Systems: A Review of Technological Integration and Implementation Barriers. Smart Cities 2026, 9(3), 52. [Google Scholar] [CrossRef]
- Alhassan, M.; Alkhawaldeh, A.; Nour Betoush, N.; Ansam Sawalha, A.; Amaireh, L.; Onaizi, A. Harmonizing smart technologies with building resilience and sustainable built environment systems. Results Eng. 2024, 22, 102158. [Google Scholar] [CrossRef]
- David Rehak, D.; Hromada, M. Resilient Smart City Infrastructure, Encyclopedia of Smart and Green Cities; Eslamian, S., Eslamian, F. A., Eds.; Springer Nature Singapore, Singapore, 2026. [Google Scholar] [CrossRef]
- Hasani, H.; Freddi, F. Condition-aware AI framework for automated structural health monitoring. Autom. Constr. 2026, 183, 106748. [Google Scholar] [CrossRef]
- Liu, G.; Sun, R.; Li, Q.; Kun Yan, K. Optimization of multi-stage bridge maintenance strategies based on sequential decision-making. J. Chongqing Univ. 2026, 49(1), 60–69. [Google Scholar] [CrossRef]
- Shengyi Wang, S.; El-Gohary, N. Automated free-form bridge inspection image interpretation using adaptive CNN, transformer feature fusion, and contrastive learning. Autom. Constr. 2026, 186, 106860. [Google Scholar] [CrossRef]
- Mateus, B. C.; Martins, A.; Antunes Rodrigues, J. C.; Torres Farinha, J.; Abril Armindo, V. Artificial intelligence in asset management: redefining efficiency and predicting failures. Prod. Manuf. Res. 2026, 14(1). [Google Scholar] [CrossRef]
- Goodchild, A.; Dalla Chiara, G.; Goulianou, N.; Güneş, S. Understanding and Mitigating Freight-Related Impacts from the West Seattle Bridge Closure, Urban Freight Lab; SUPPLY CHAIN TRANSPORTATION & LOGISTICS CENTER, University of Washington, 2021; Available online: https://www.urbanfreightlab.com/wp-content/uploads/2023/04/UFL-W-Sea-Bridge.pdf.
- Whitmore, D. Extending the Service Life of Existing Concrete Structures to Last Beyond 100 Years. MATEC Web Conf. 2022, 364. [Google Scholar] [CrossRef]
- Farrar, C. R.; Worden, K. An Introduction to Structural Health Monitoring. In New Trends in Vibration Based Structural Health Monitoring; Deraemaeker, A., Worden, K., Eds.; Springer Nature, Polish Consortium ICM University of Warsaw, 2010; Volume 520, pp. 1–17. Available online: https://link.springer.com/book/10.1007/978-3-7091-0399-9.
- Dias Júnior, L. T.; Piazzaroli Finotti, R.; de Souza Barbosa, F.; Abrahão Cury, A. The Trajectory of Data-Driven Structural Health Monitoring: A Review from Traditional Methods to Deep Learning and Future Trends for Civil Infrastructures. CMES-Comput. Model. Eng. Sci. 2026, 146(2). [Google Scholar] [CrossRef]
- Omrany, H.; Al Obaidi, K. M.; Hossain, M.; Alduais, N. A. M.; Al Duais, H. S.; Ghaffarianhoseini, A. IoT-enabled smart cities: a hybrid systematic analysis of key research areas, challenges, and recommendations for future direction. Discov. Cities 2024, 1(2). [Google Scholar] [CrossRef]
- Chen, G.; Shi, W.; Yu, L.; Huang, J.; Wei, J.; Wang, J. Wireless Sensor Placement Optimization for Bridge Health Monitoring: A Critical Review. Buildings 2024, 14(3), 856. [Google Scholar] [CrossRef]
- Mahmood, Y.; Yasir, N.; Quenette, K.; Badin, G.; Huang, Y.; Xu, L. Fiber-Optic Sensor-Based Structural Health Monitoring with Machine Learning: A Task-Oriented and Cross-Domain Review. Sensors 2026, 26(9), 2641. [Google Scholar] [CrossRef] [PubMed]
- Qiu, S.; Malik, M.; Ehsan, H.; Wang, W.; Wang, J.; Cheng, R.; Wei, W.; Zaheer, Q. Trends and perspectives in structural health monitoring through edge computing: A review with zero-shot natural language processing categorization. J. Railw. Sci. Technol. 1(2). [CrossRef]
- Grosse, C. U.; Ohtsu, M. Acoustic Emission Testing: Basics for Research and Applications in Civil Engineering; Springer Nature, 2008. [Google Scholar] [CrossRef]
- Zhang, F. Using acoustic emission monitoring to assess the reliability of existing concrete structures: a case study. In Proceedings of the fib Symposium 2025, Antibes, France, 2025. [Google Scholar]
- Wilk-Jakubowski, J. L.; Pawlik, L.; Frej, D.; Wilk-Jakubowski, G. The Evolution of Machine Learning in Vibration and Acoustics: A Decade of Innovation (2015–2024). Appl. Sci. 2025, 15(12), 6549. [Google Scholar] [CrossRef]
- D’Angela, D.; Magliulo, G. Acoustic emission testing of prestressed RC bridge girders: methodology, results, and dataset. Mater. Struct. 2026, 59, 85. Available online: https://link.springer.com/article/10.1617/s11527-026-02973-1. [CrossRef]
- Pirskawetz, S. M.; Schmidt, S. Detection of wire breaks in prestressed concrete bridges by Acoustic Emission analysis. Dev. Built Environ. 2023, 14, 100151. [Google Scholar] [CrossRef]
- Keshmiry, A.; Hassani, S.; Mousavi, M.; Dackermann, U. Effects of Environmental and Operational Conditions on Structural Health Monitoring and Non-Destructive Testing: A Systematic Review. Buildings 2023, 13(4), 918. [Google Scholar] [CrossRef]
- Wang, S.; Wang, W.; Yan, D.; Liu, X.; Deng, Y.; Huo, Y.; Hua, X. Noise-robust acoustic emission source localization in reinforced concrete structures using a novel deep learning framework with skip connections. Mech. Syst. Signal Process. 2025, 240, 113387. [Google Scholar] [CrossRef]
- Bao, Y.; Sun, H.; Xu, Y.; Guan, X.; Pan, Q.; Liu, D. Recent advances in structural health diagnosis: a machine learning perspective. Adv. Bridge Eng. 2025, 6, 7. [Google Scholar] [CrossRef]
- Kurcjusz, M.; Raj Das, R. Advances in structural engineering through artificial intelligence: methods, challenges and opportunities. Acta Sci. Pol. Archit. 24. [CrossRef]
- Qin, X.; Huang, F.; Yujia Wen, Y.; Li, C.; Zhang, Y.; Shen, W. Acoustic emission-based interpretable unsupervised clustering for damage pattern recognition in steel-concrete hybrid structures. Case Stud. Constr. Mater. 2026, 24, e05983. [Google Scholar] [CrossRef]
- Yu, A.; Liu, X.; Fu, F.; Chen, X.; Zhang, Y. Acoustic Emission Signal Denoising of Bridge Structures using SOM Neural Network Machine Learning. J. Perform. Constr. Facil. 2023, 37(1), 04022066. [Google Scholar] [CrossRef]
- Laon, P.; Pourbunthidkul, S.; Rattan, P.; Sahavisit, T.; Suwansin, W.; Wichittrakarn, P.; Phasukkit, P.; Houngkamhang, N. Multi-Entropy Feature Extraction With LSTM Networks for Acoustic Emission-Based Railway Crack Localization. IEEE Access 2026, 14. [Google Scholar] [CrossRef]
- Lide Fang, L.; Sun, J.; Zheng, M.; Zeng, Q.; Dong, F.; Feng, Y. Application of Wavelet Exponential Window Denoising and Dynamic Uncertainty in Acoustic Emission. Metrol. Meas. Syst. 2024, 31(4). [Google Scholar] [CrossRef]
- Sikdar, S.; Liu, D.; Kundu, A. Acoustic emission data based deep learning approach for classification and detection of damage-sources in a composite panel. Compos. Part B Eng. 2022, 228, 109450. [Google Scholar] [CrossRef]
- Cui, J.; Lv, Ch.; Qu, X.; Du, J.; Wang, H. Development of an intelligent CNN-LSTM-attention model for acoustic emission-based fracture detection and structural health monitoring in marine steel structures. Ocean Eng. 2025, 339(1), 122002. [Google Scholar] [CrossRef]
- Jiang, G.-F.; Zhou, N.; Wang, S.-M.; Ni, Y.-Q. A deep multimodal learning perspective for railway structural health monitoring: A comprehensive review. Results Eng. 2026, 25, 111903. [Google Scholar] [CrossRef]
- Nguyen, T. Q.; Phan-Vu, P.; Nguyen, P. T. AI-based damage detection in prestressed concrete beams: a vision-integrated deep learning framework for crack localization and severity classification. Adv. Bridge Eng. 2026, 7, 6. [Google Scholar] [CrossRef]
- Santos-Vila, I.; Soto, R.; Vega, E.; Crawford, B.; Peña, A. Damage Detection on Real Bridges Using Machine Learning Techniques: A Systematic Review. Appl. Sci. 2025, 15(16), 8884. [Google Scholar] [CrossRef]
- Świt, G.; Ulewicz, M.; Pała, R.; Adamczak-Bugno, A.; Lipiec, S.; Krampikowska, A.; Dzioba, I. Innovative acoustic emission method for monitoring the quality and integrity of ferritic steel gas pipelines. Prod. Eng. Arch. 2024, 30(2). [Google Scholar] [CrossRef]
- Krampikowska, A.; Świt, G. Acoustic Emission-Based Decision Support for Bridge Safety in Smart Cities. Proceedings The 15th International Workshop on Structural Health Monitoring (IWSHM), Stanford University, USA, September 9-11, 2025; Available online: https://www.dpi-proceedings.com/index.php/shm2025/article/viewFile/37336/35910.
- Thawon, I.; Vo, D.; Bui, T. Q.; Rattanamongkhonkun, K.; Chamroon, Ch.; Tippayawong, N.; Mona, Y.; Wanison, R.; Suttakul, P. A. Physics-Informed Neural Networks: Current Progress and Challenges in Computational Solid and Structural Mechanics. CMES-Comput. Model. Eng. Sci. 2026, 146(2). [Google Scholar] [CrossRef]
- Pham, T. A. A. From data to decisions: A digital twin–driven framework for intelligent and sustainable infrastructure systems. Sustain. Cities Soc. Adv. 2026, 2(2), 100061. [Google Scholar] [CrossRef]
- Dribi, D.; Essaaidi, M.; Merabet, G. H.; Qadir, J.; Benhaddou, D. Real-Time Traffic Management in Smart Cities: A Systematic Literature Review of Application Paradigms, Control Architectures, and Implementation Barriers. Appl. Sci. 2026, 16(12), 6241. [Google Scholar] [CrossRef]
Figure 1.
General view of the viaduct in Plichtow [35].
Figure 1.
General view of the viaduct in Plichtow [35].
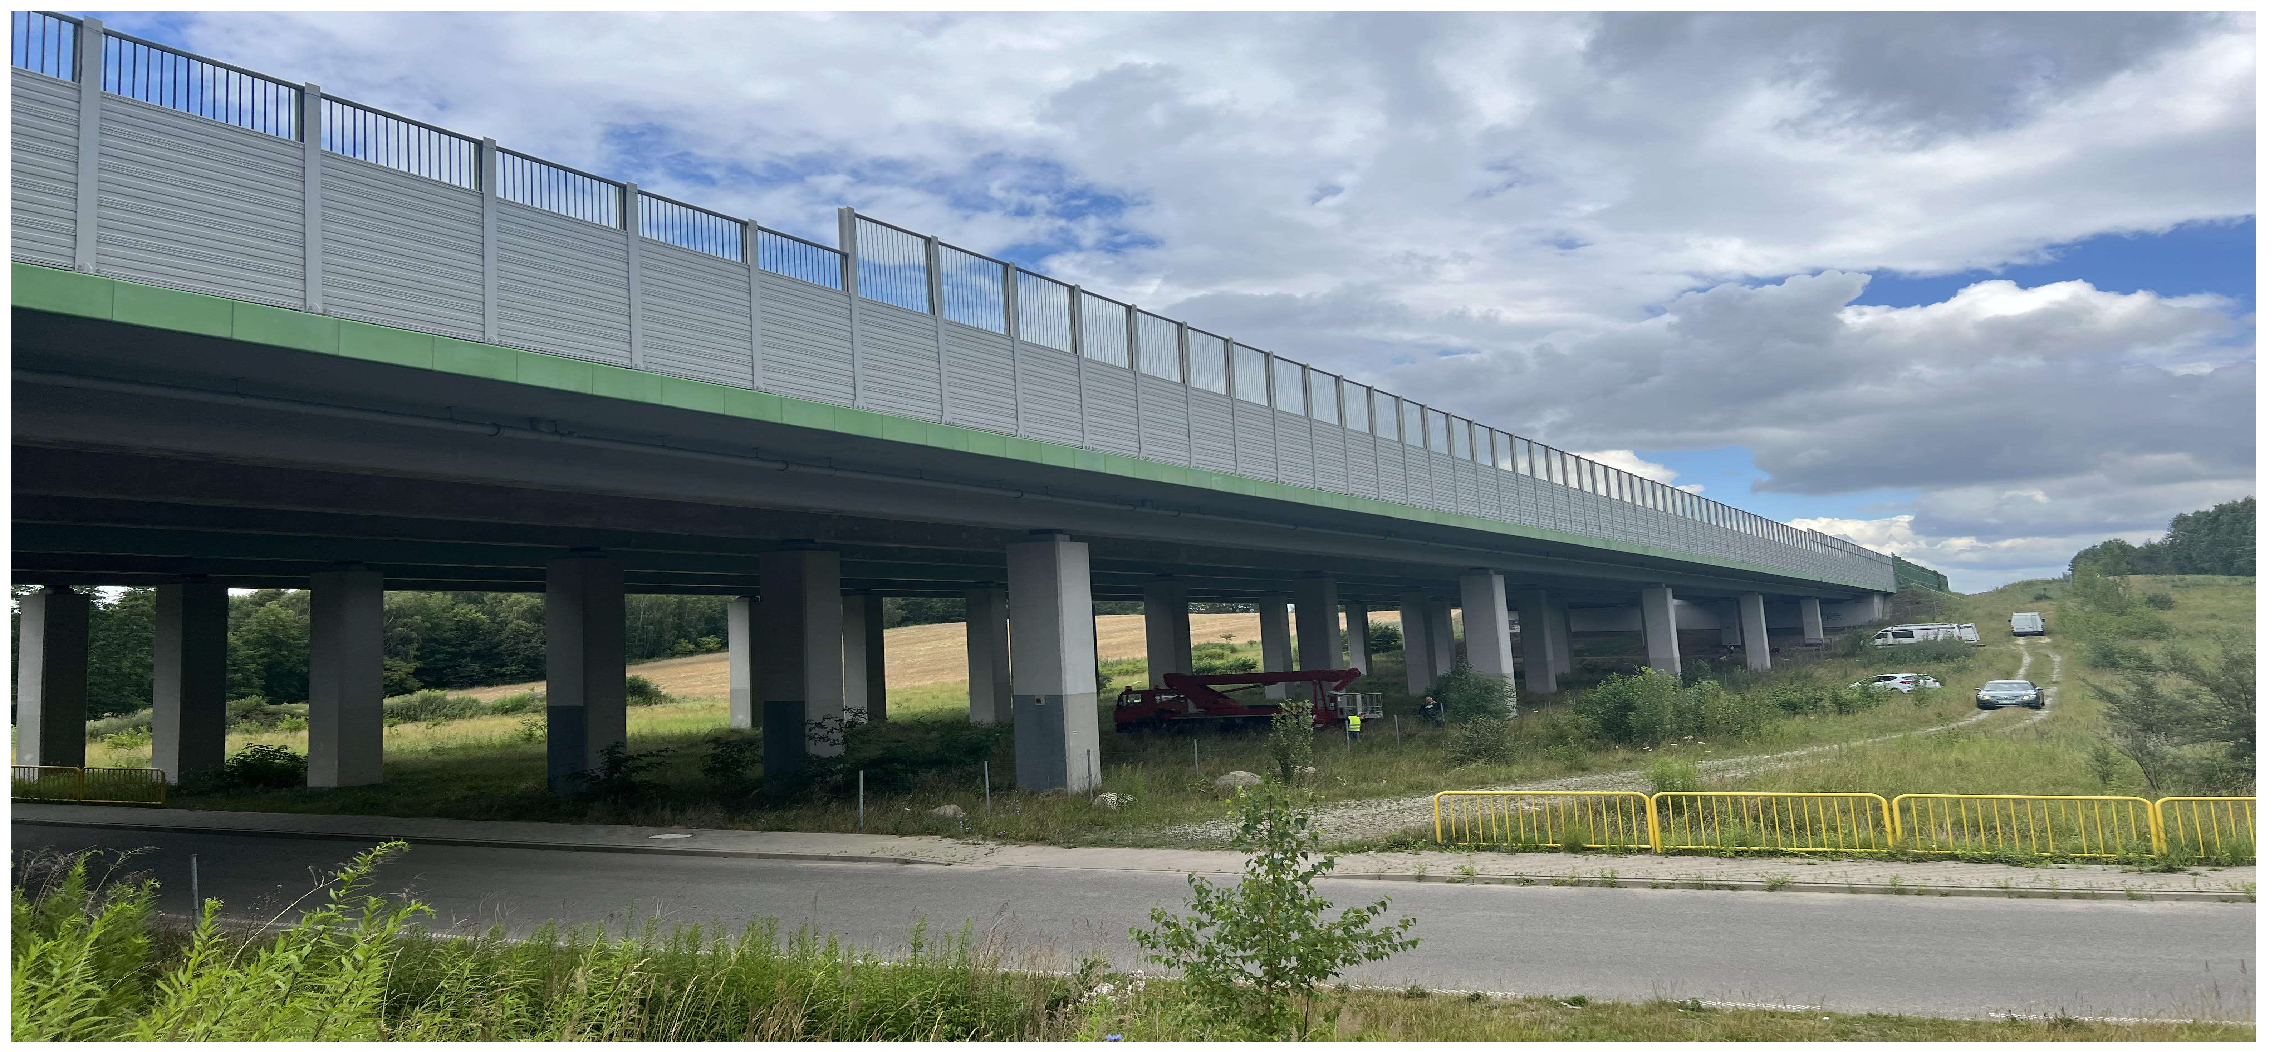
Figure 2.
Arrangement of AE sensors on the beam above support No. 2 [35].
Figure 2.
Arrangement of AE sensors on the beam above support No. 2 [35].
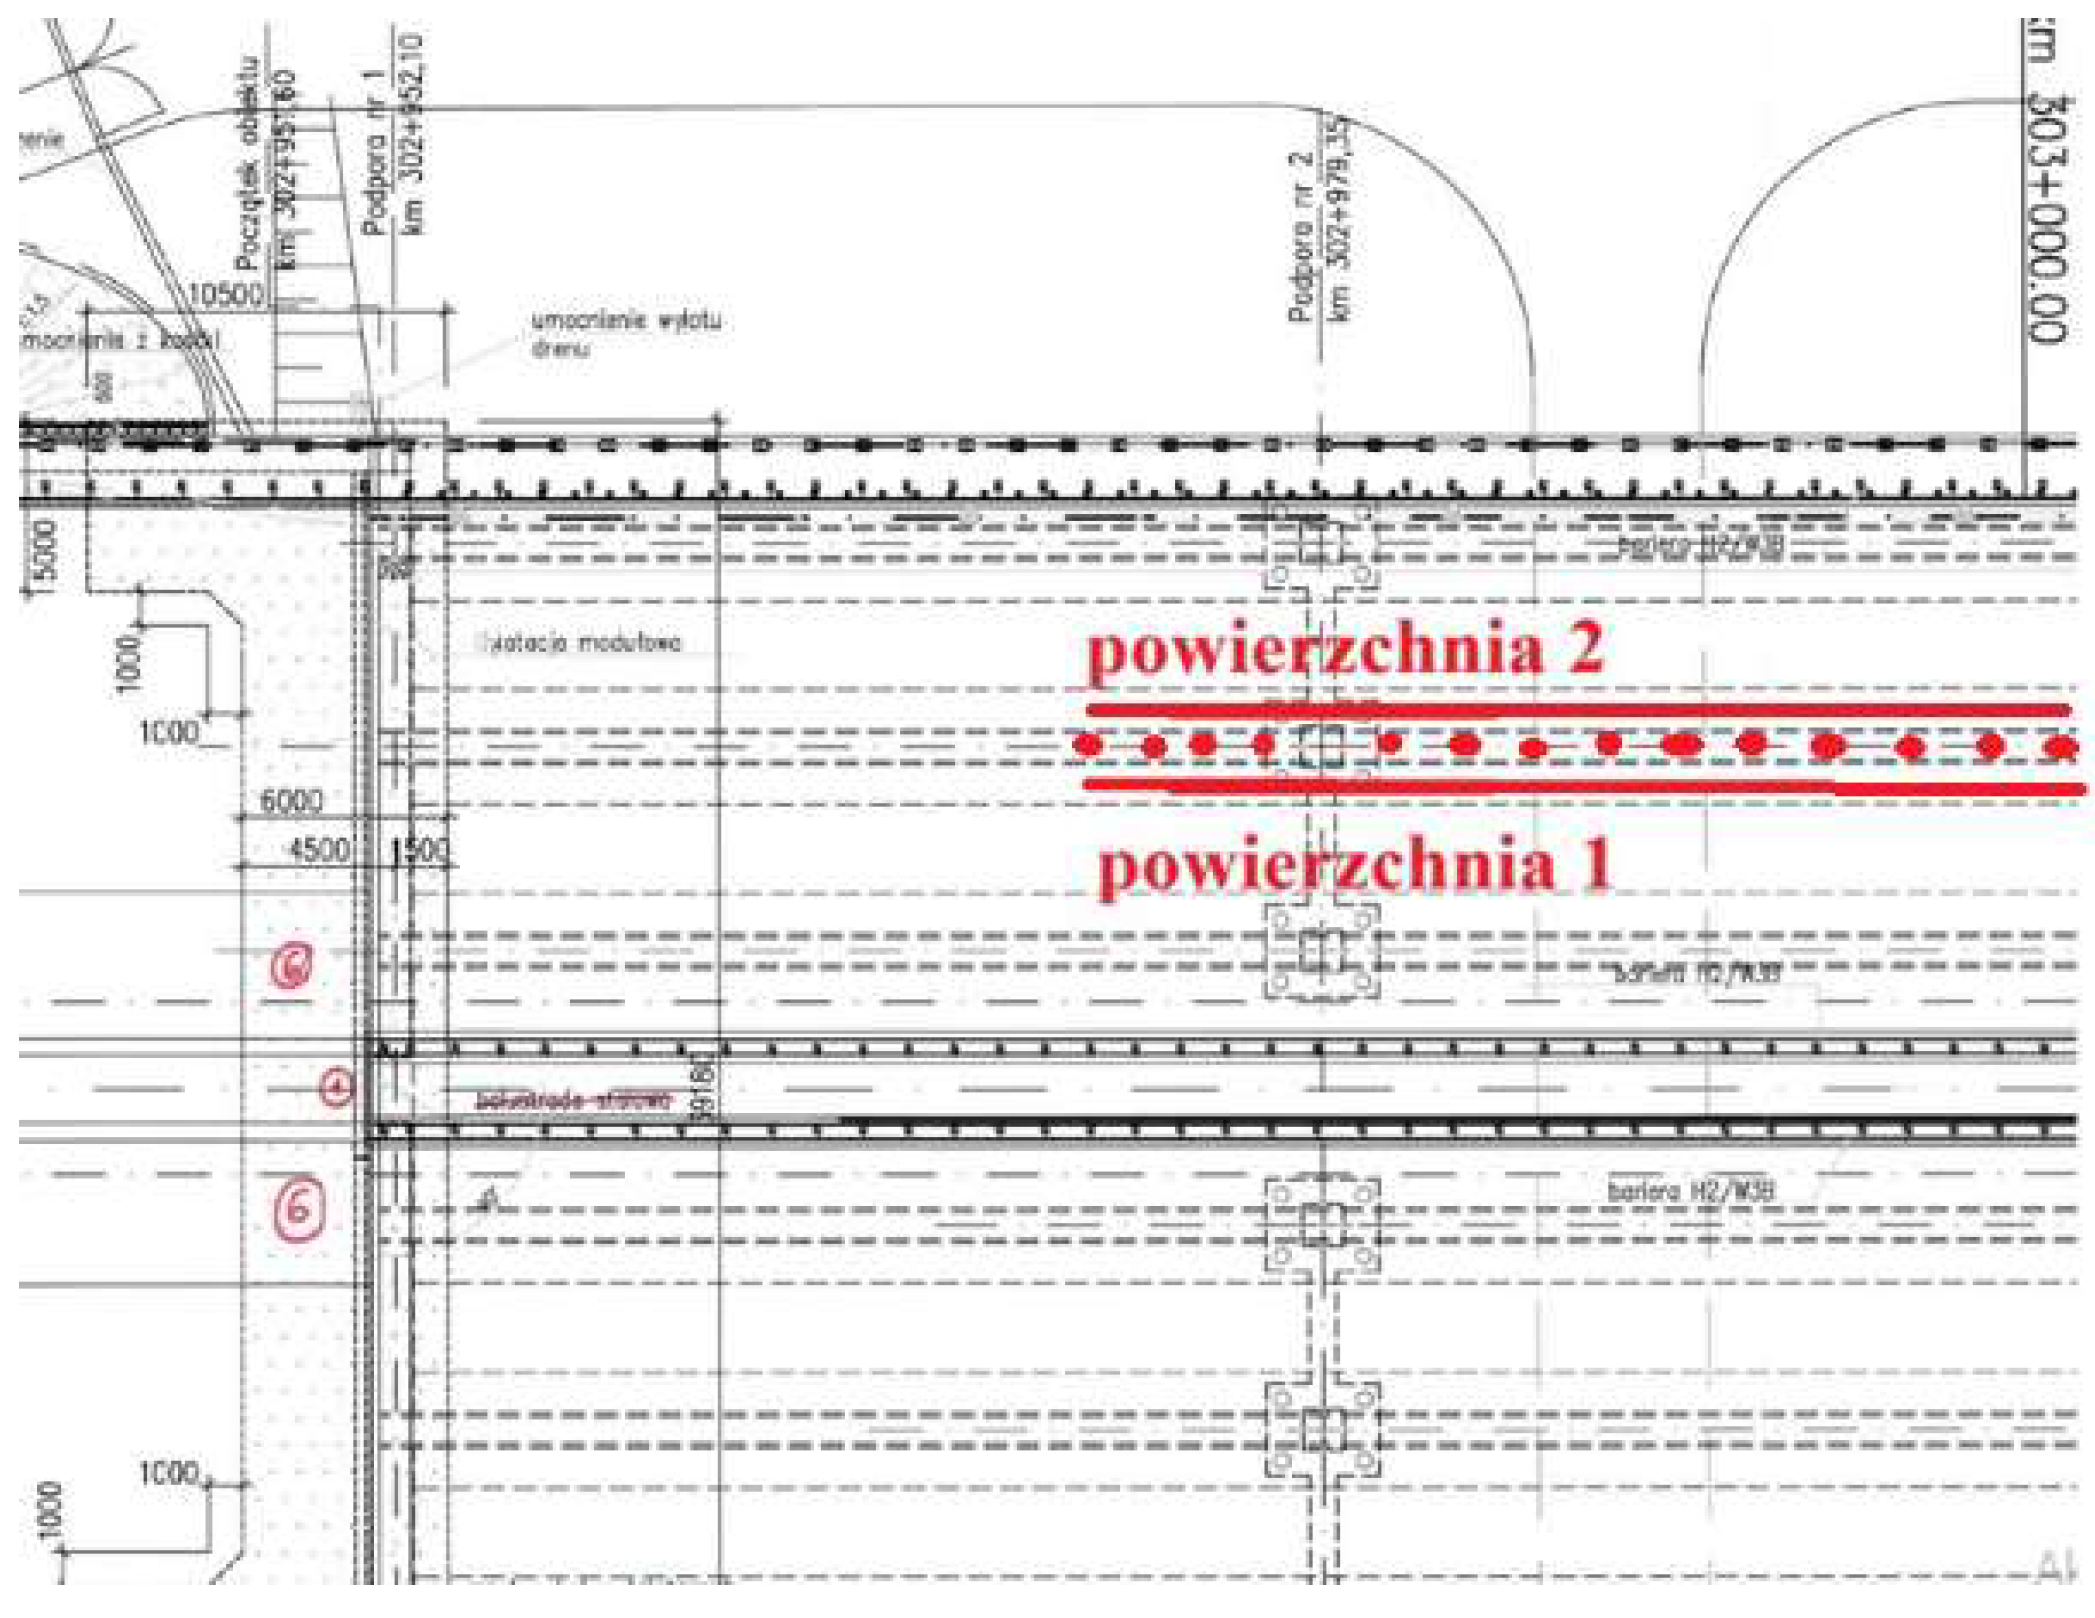
Figure 3.
Arrangement of AE sensors on the beam above support No. 6 [35].
Figure 3.
Arrangement of AE sensors on the beam above support No. 6 [35].
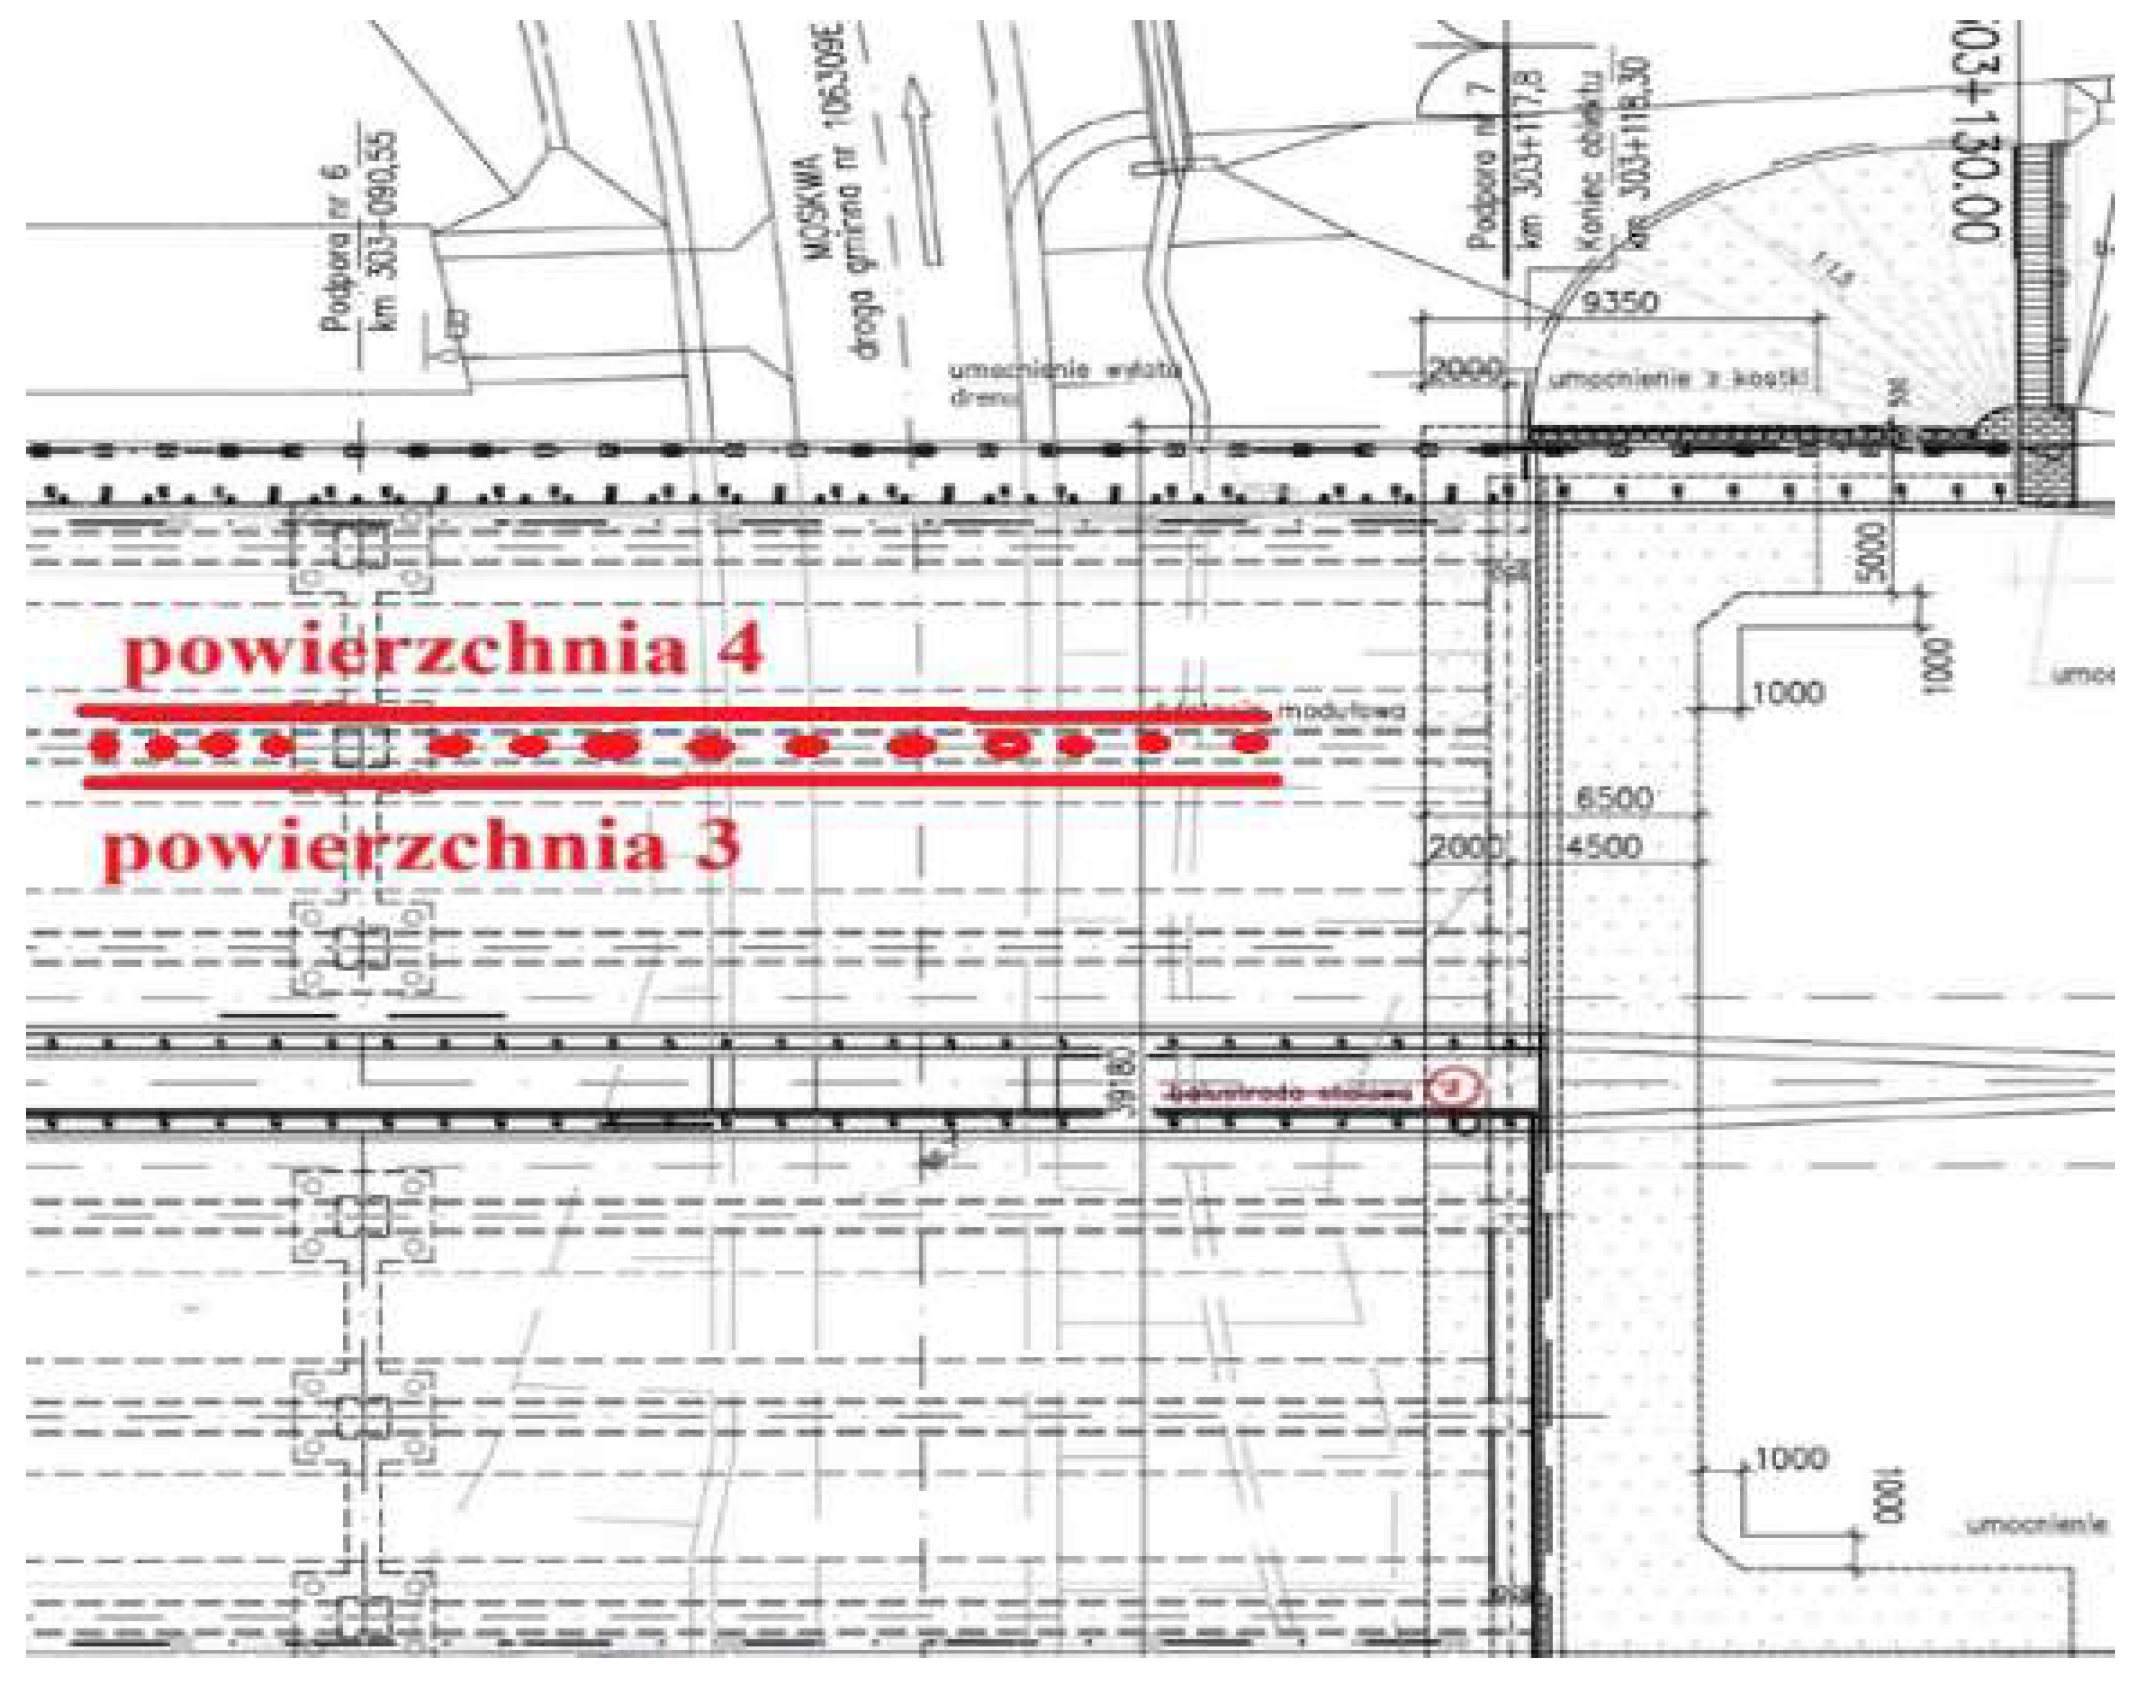
Figure 4.
24-channel AE measurement system with cabling and VS-30 sensors installed on selected elements of the viaduct – a) beam No. 2, b) beam No. 6 [35].
Figure 4.
24-channel AE measurement system with cabling and VS-30 sensors installed on selected elements of the viaduct – a) beam No. 2, b) beam No. 6 [35].
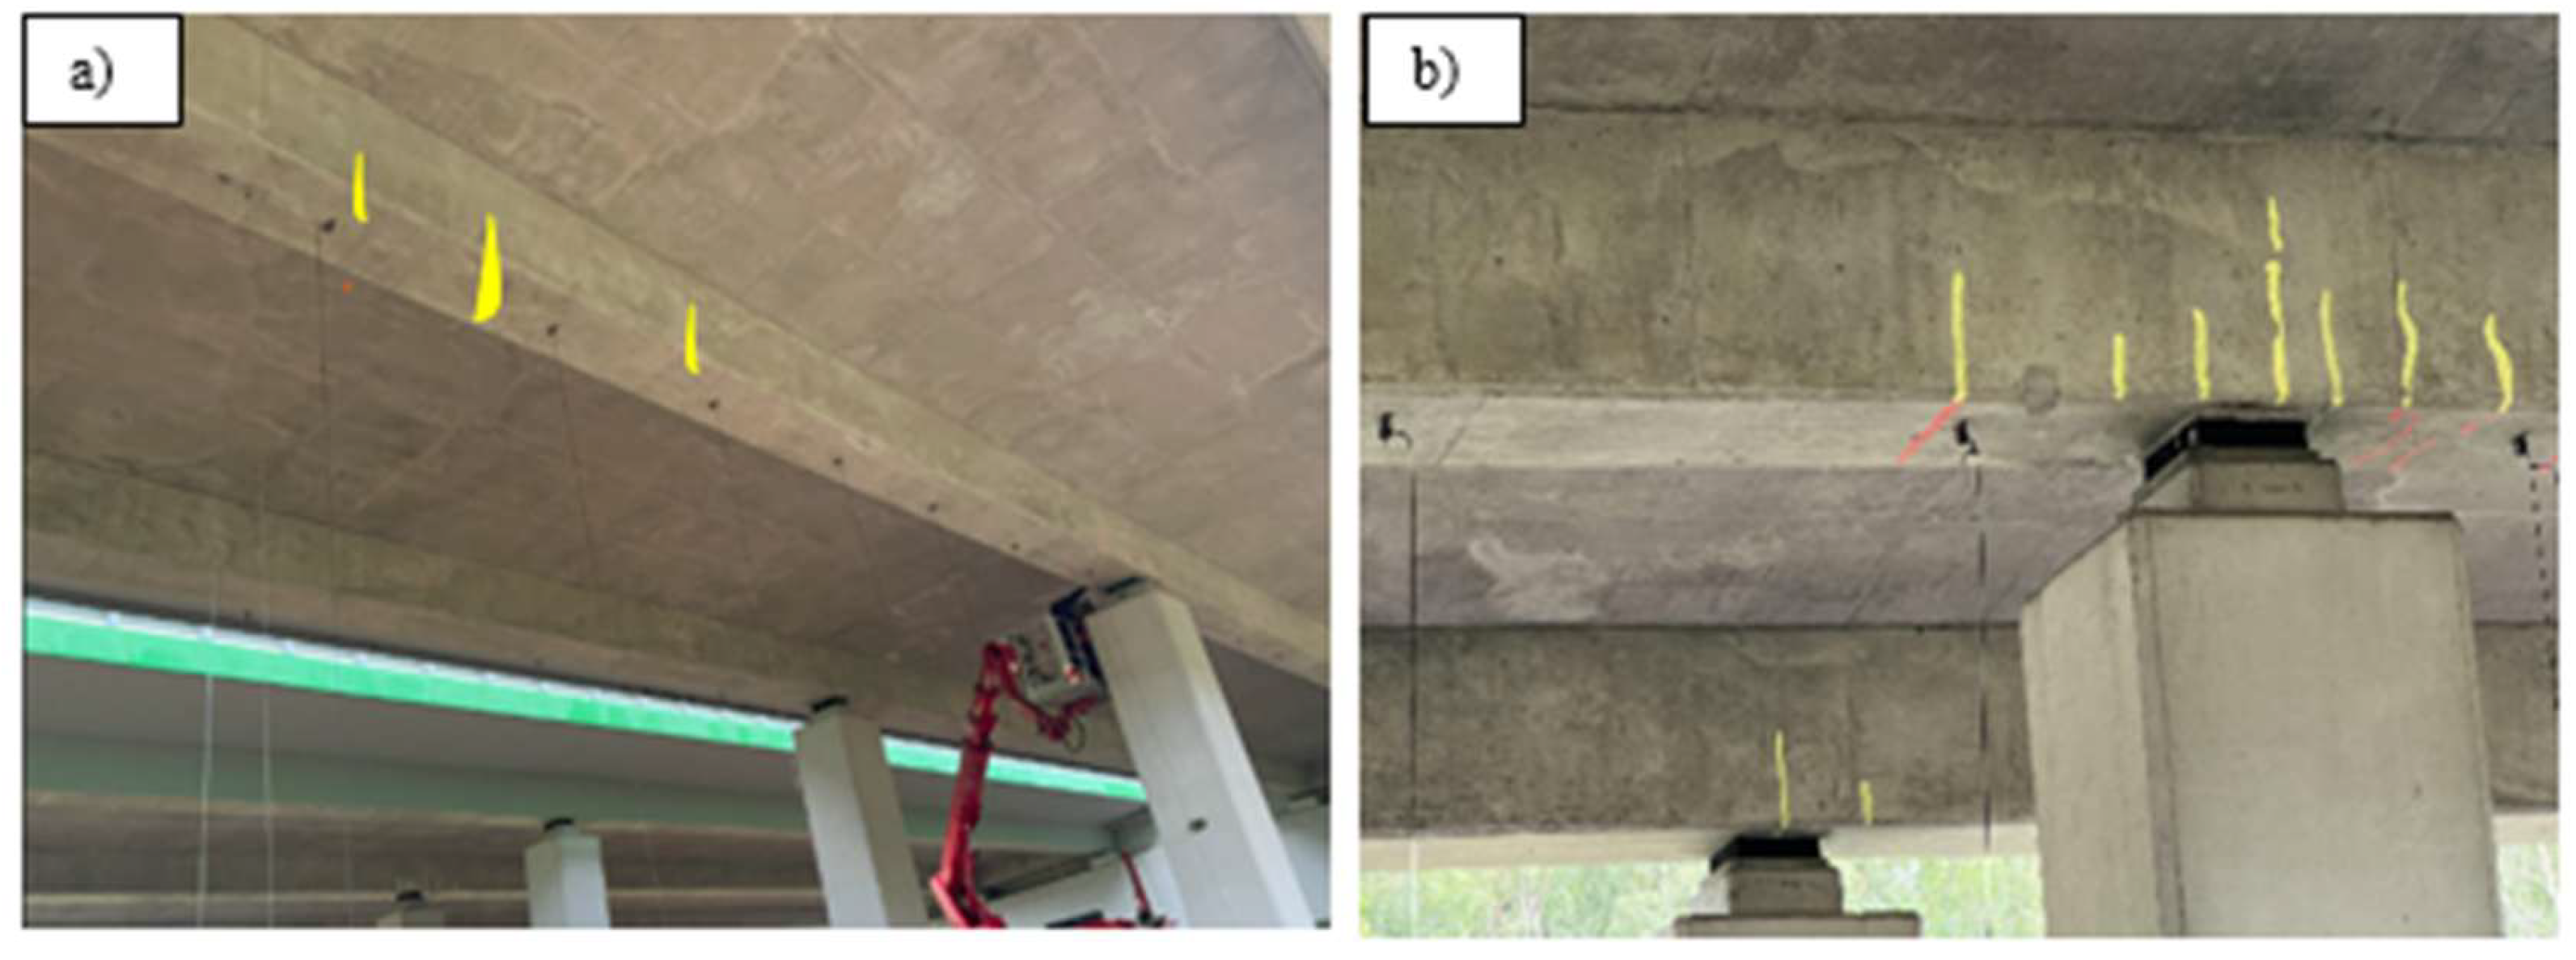
Figure 5.
View of the structure under load – a) traffic load, b) proof load testing [35].
Figure 5.
View of the structure under load – a) traffic load, b) proof load testing [35].
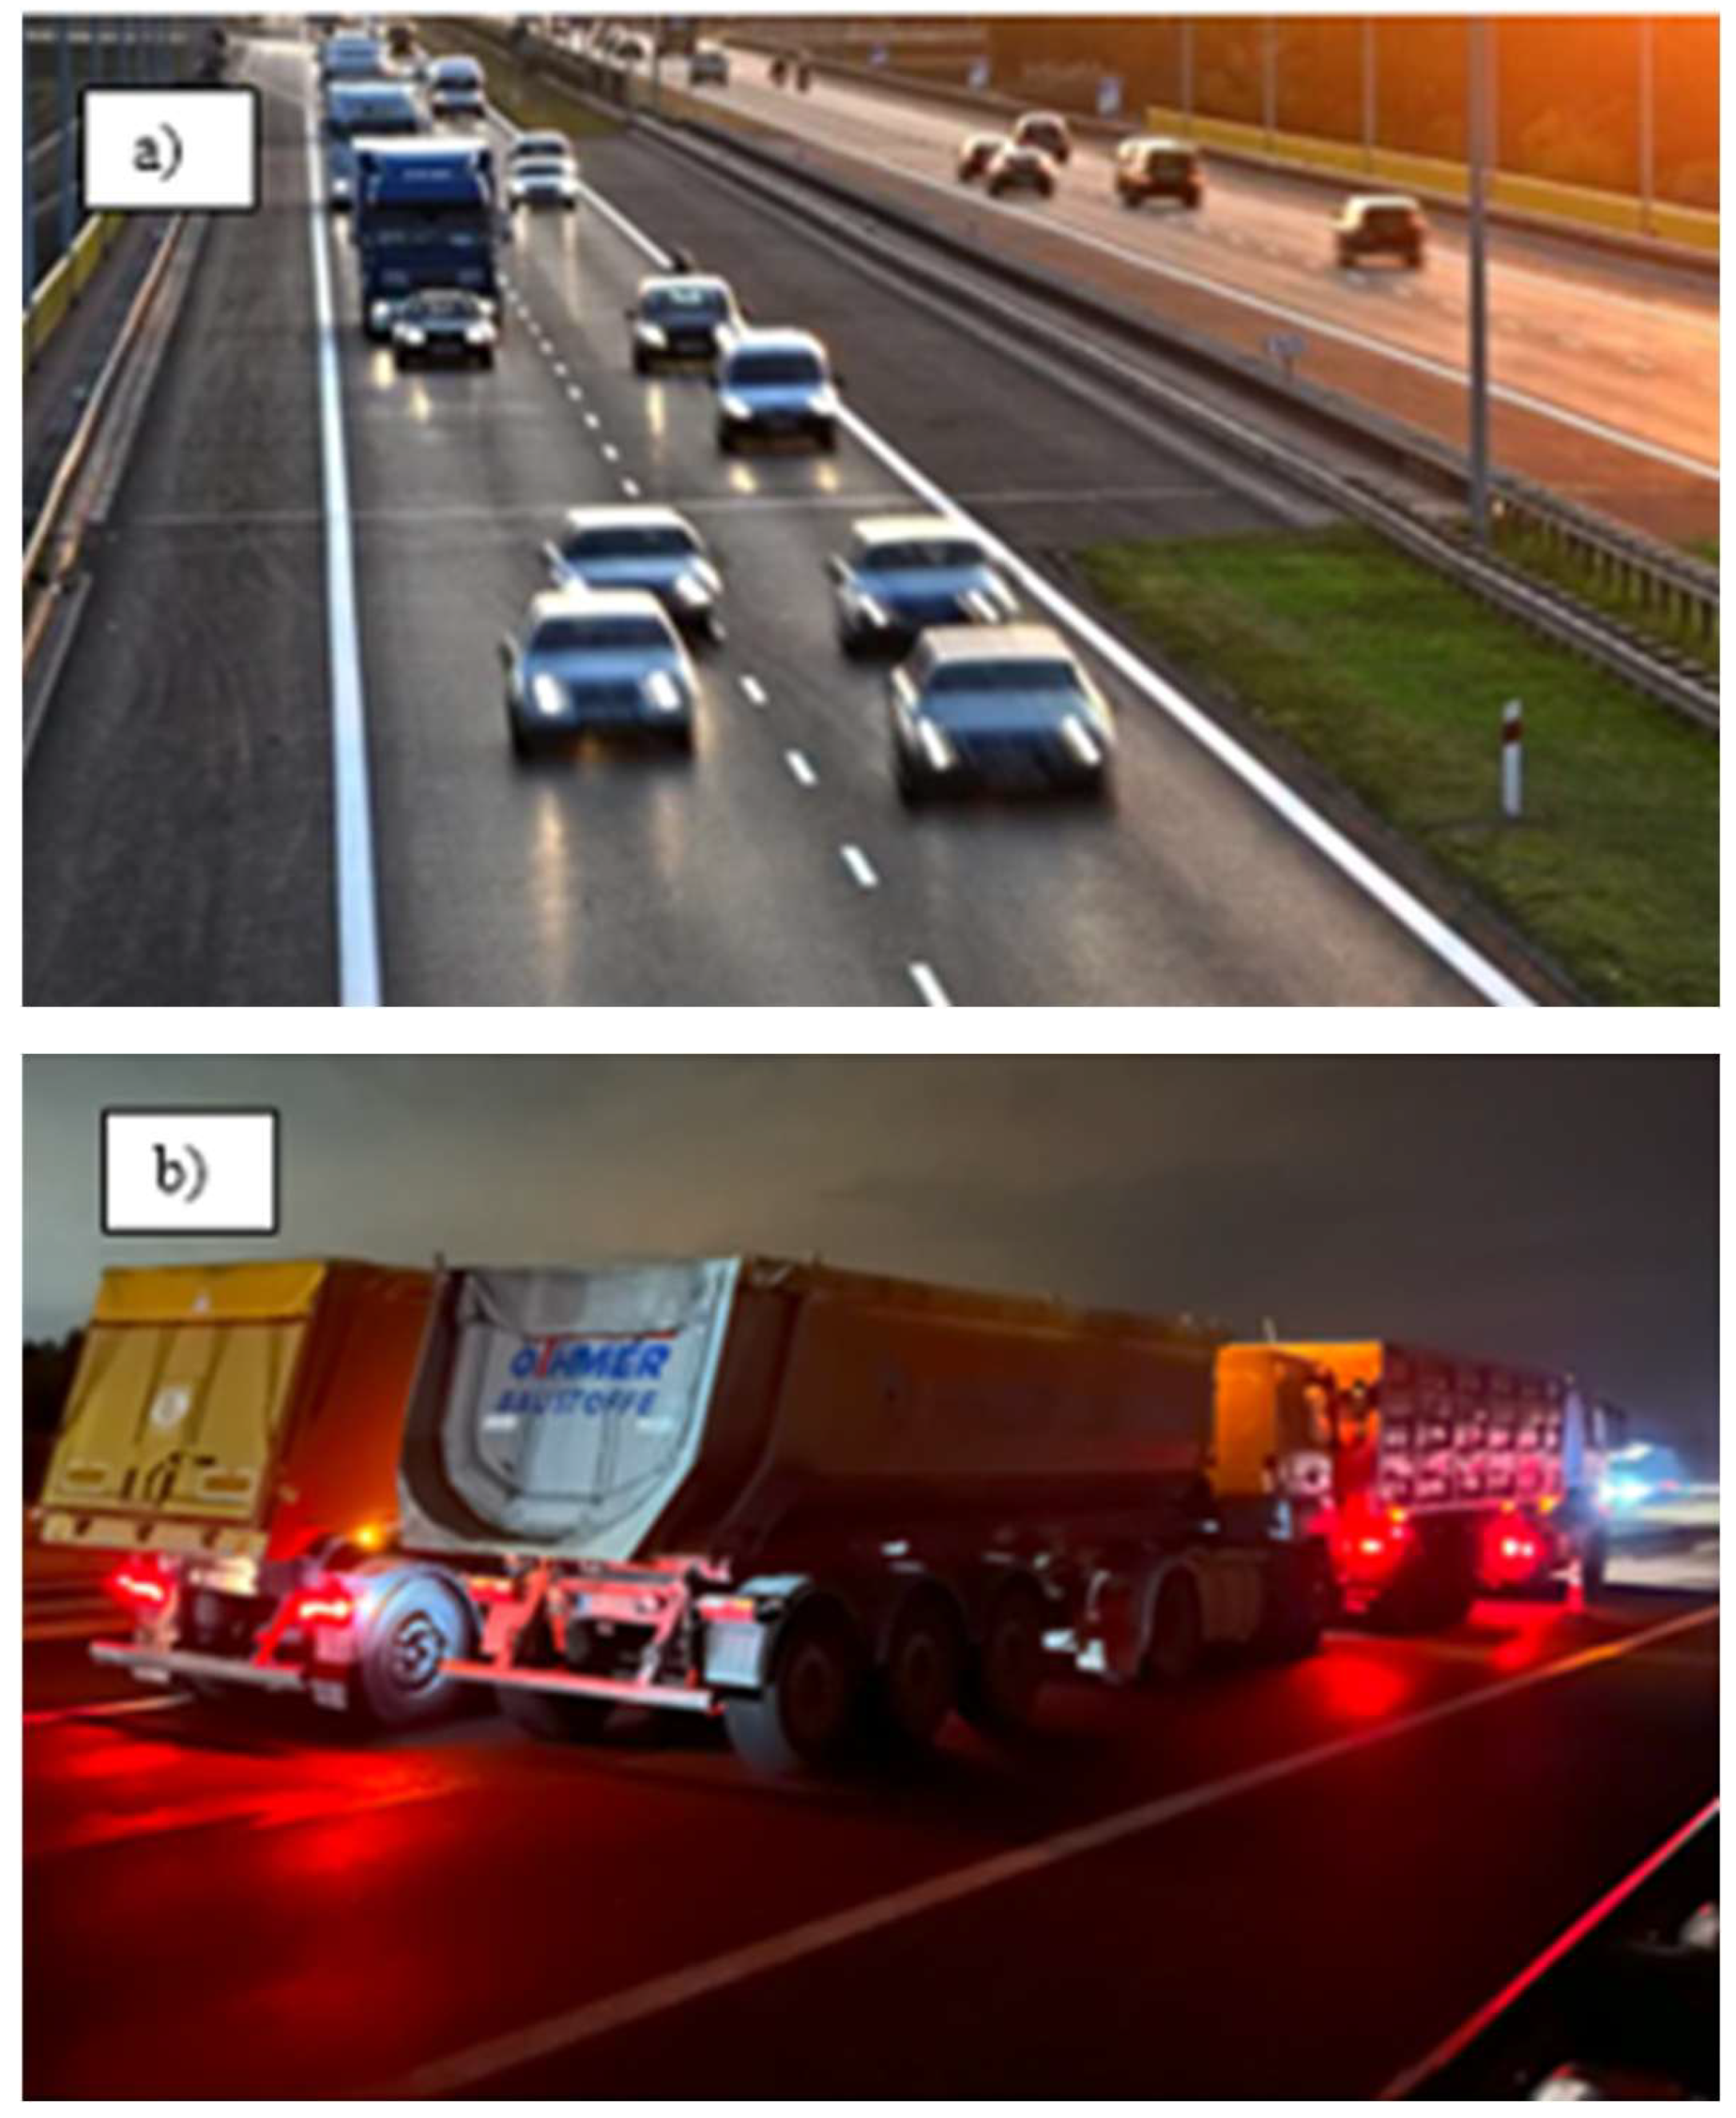
Figure 6.
Scatter plot of signal strength as a function of location (beam length) [35].
Figure 6.
Scatter plot of signal strength as a function of location (beam length) [35].
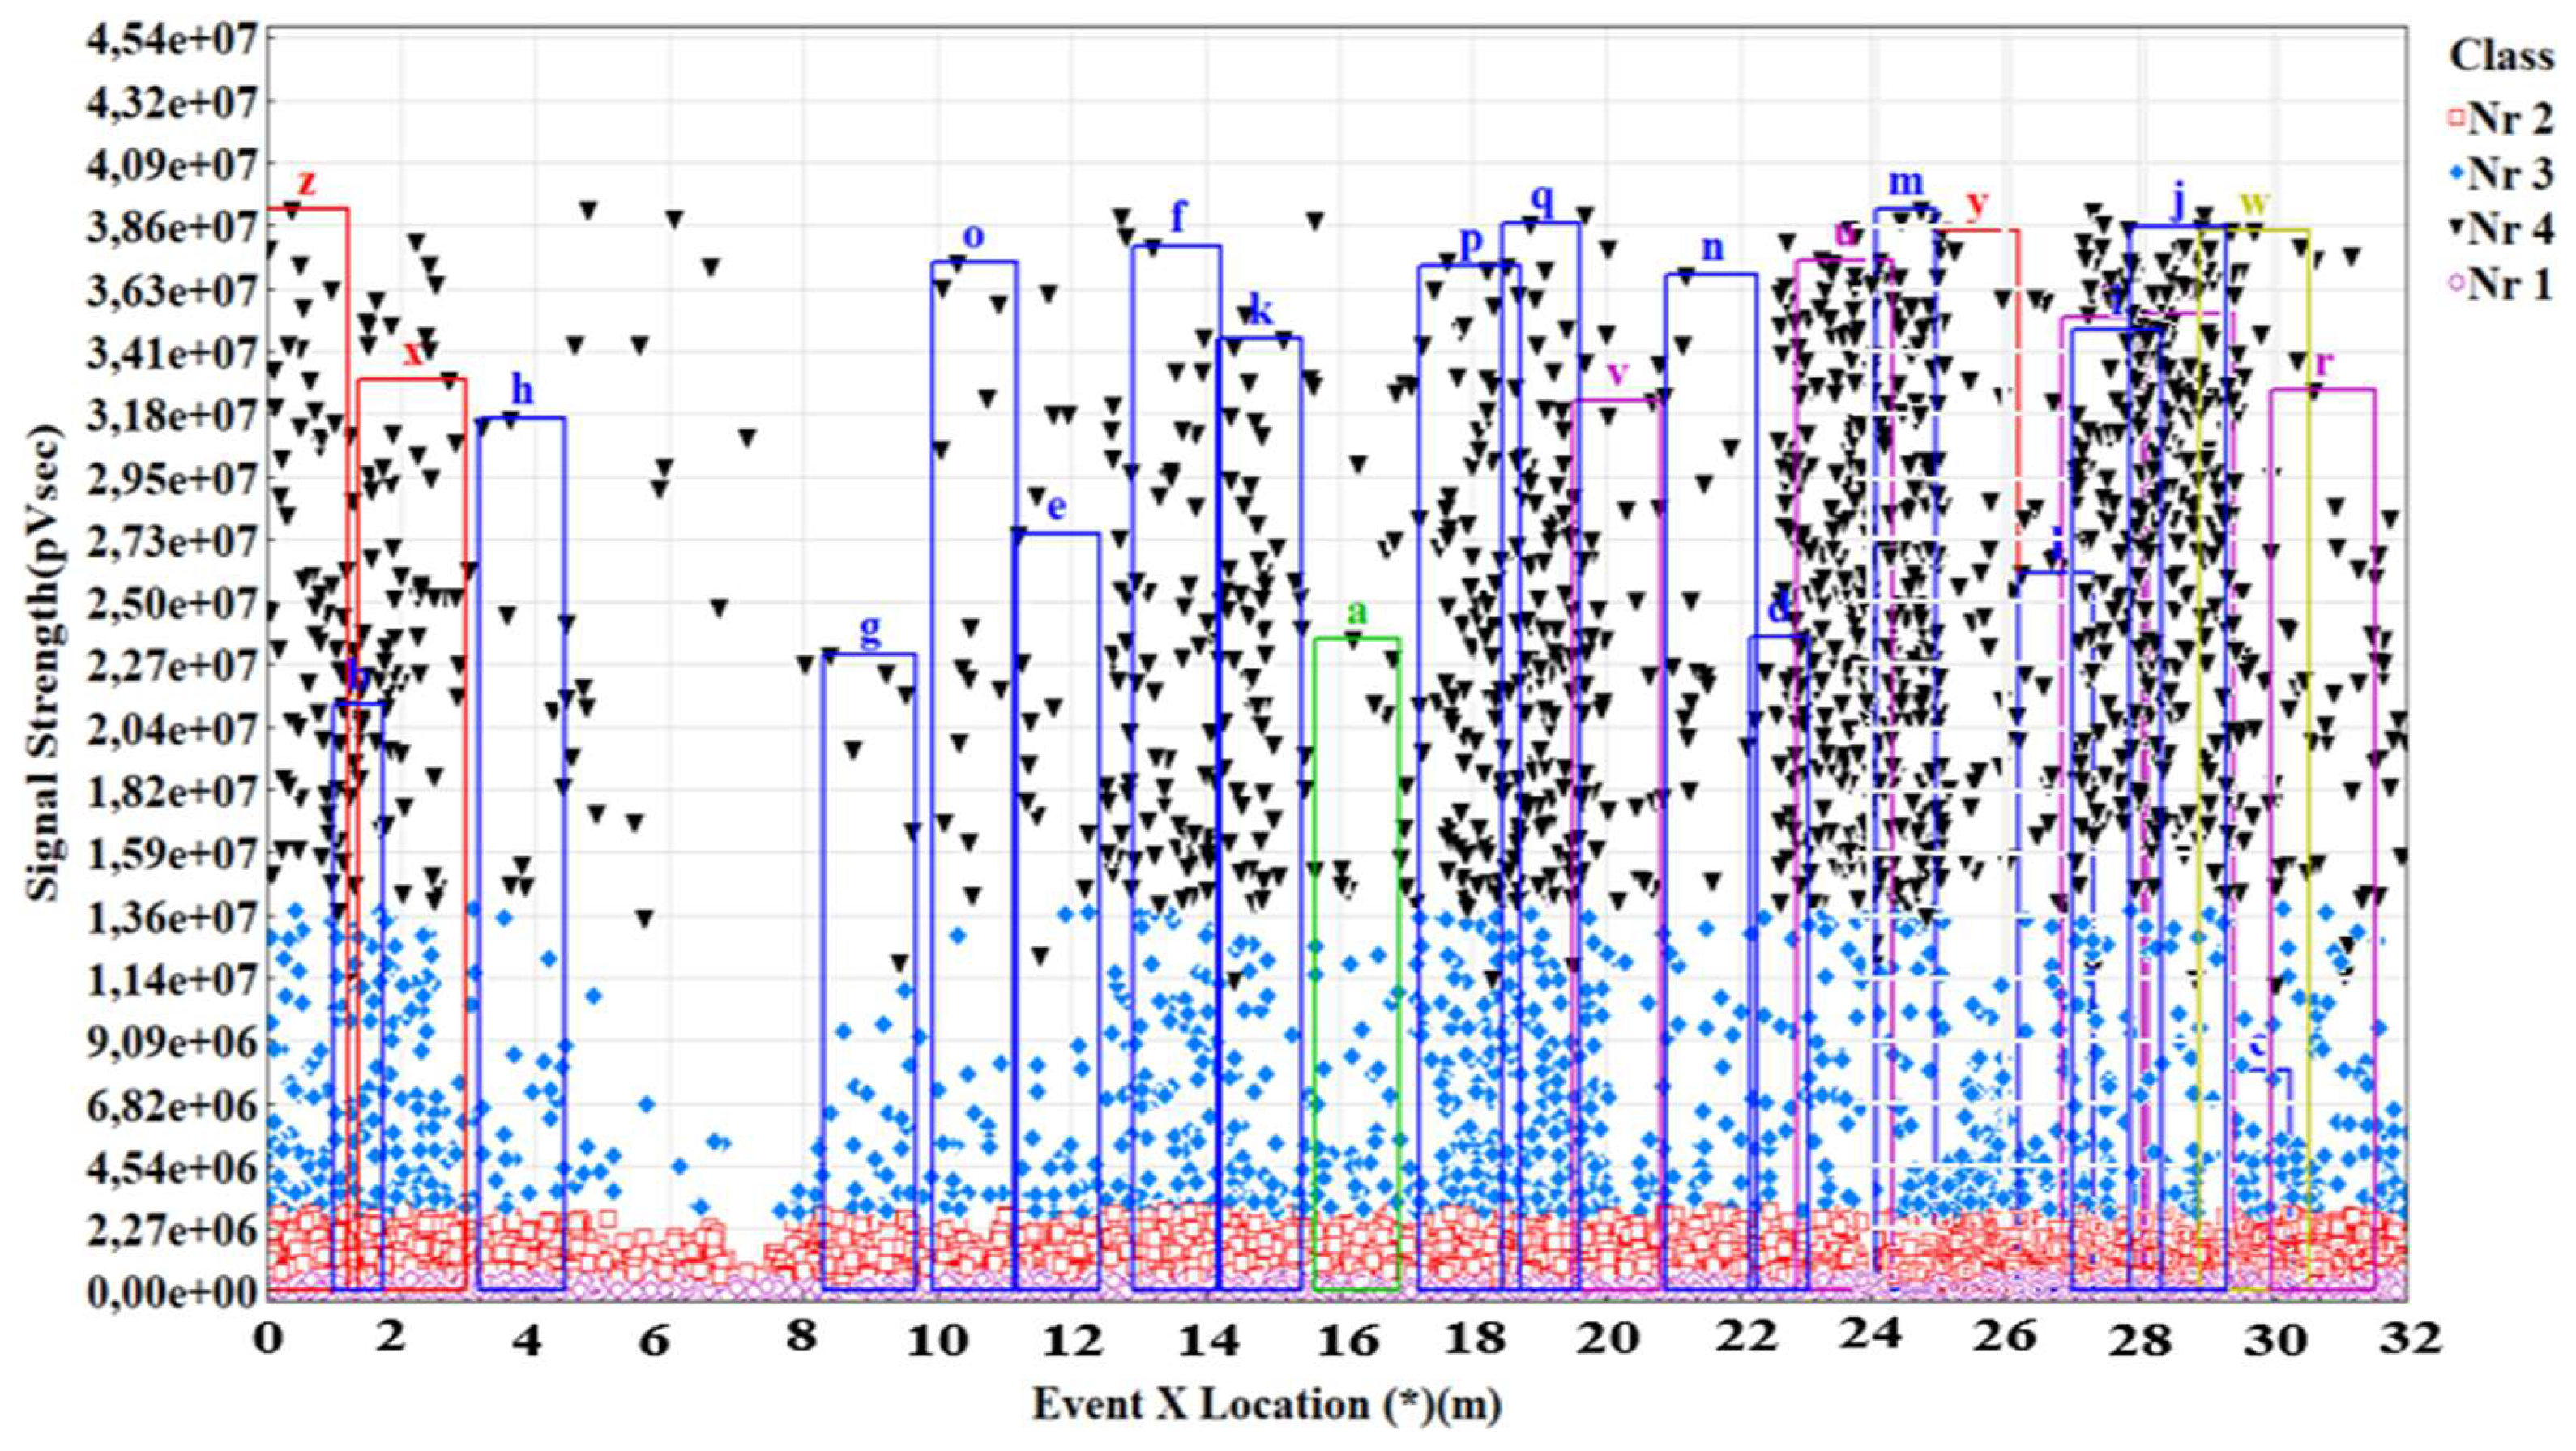
Figure 7.
Scatter plot of signal strength as a function of location (beam length).
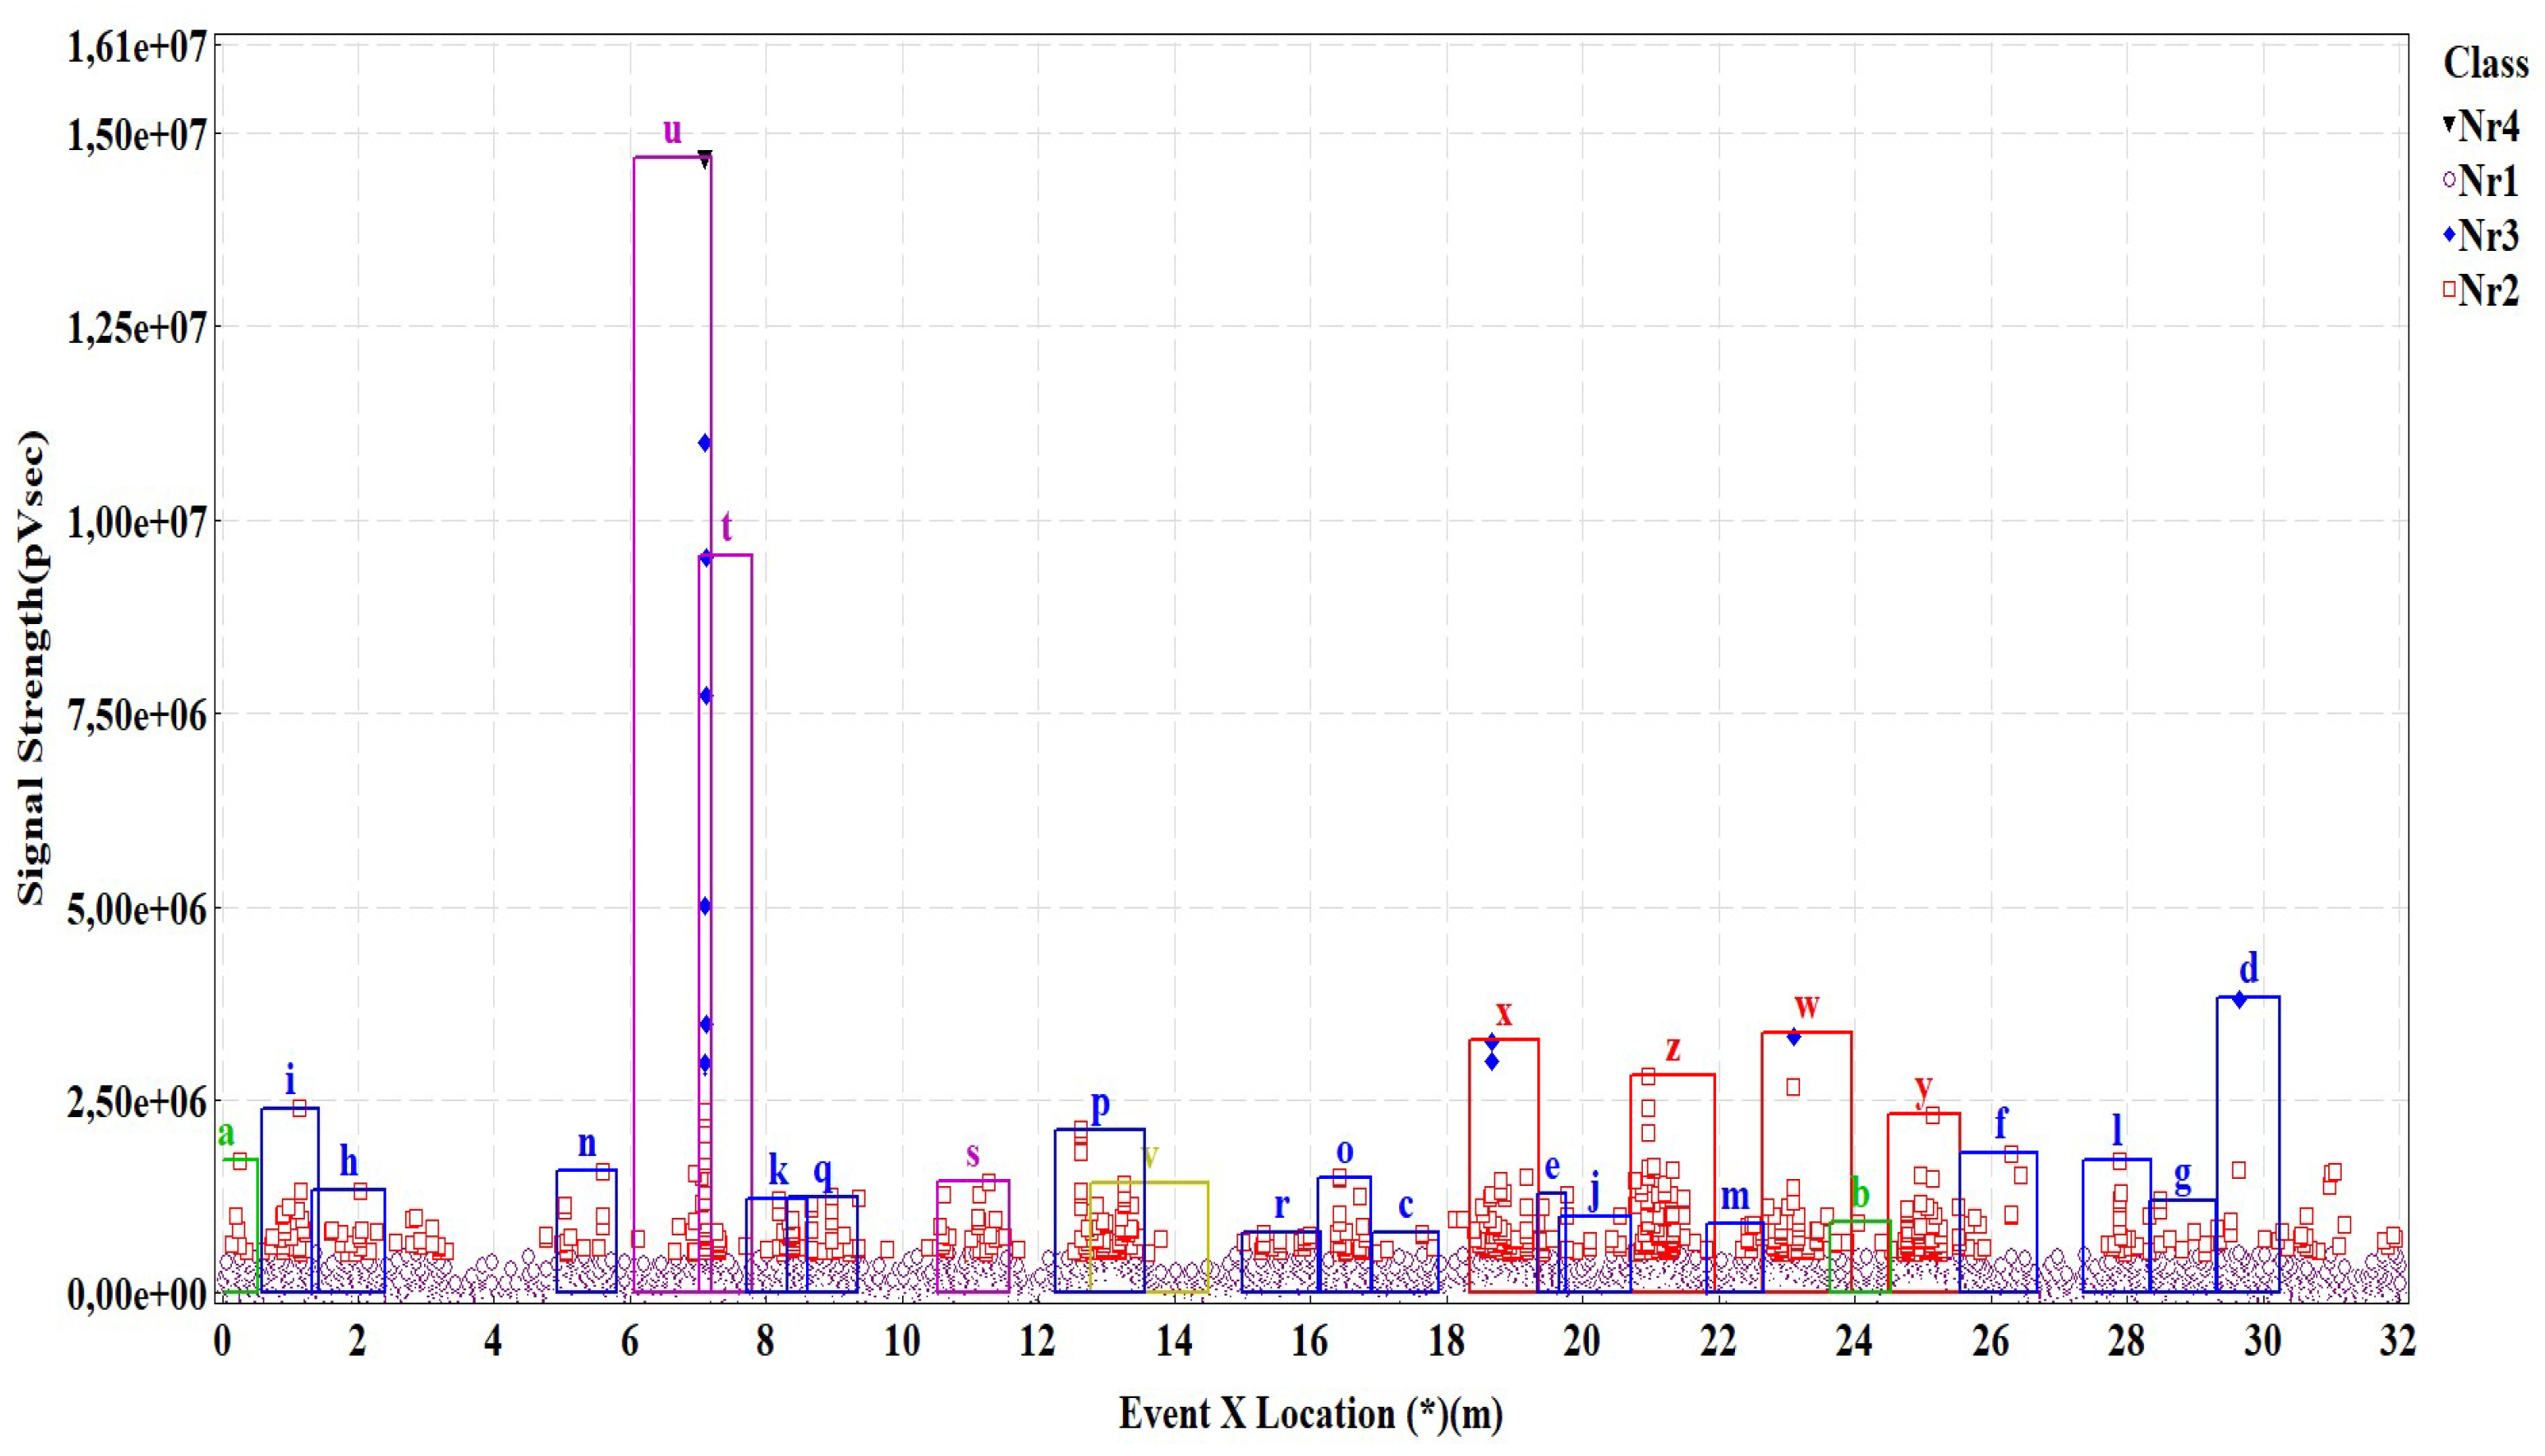
Figure 8.
Scatter plot of signal strength as a function of location (beam length).
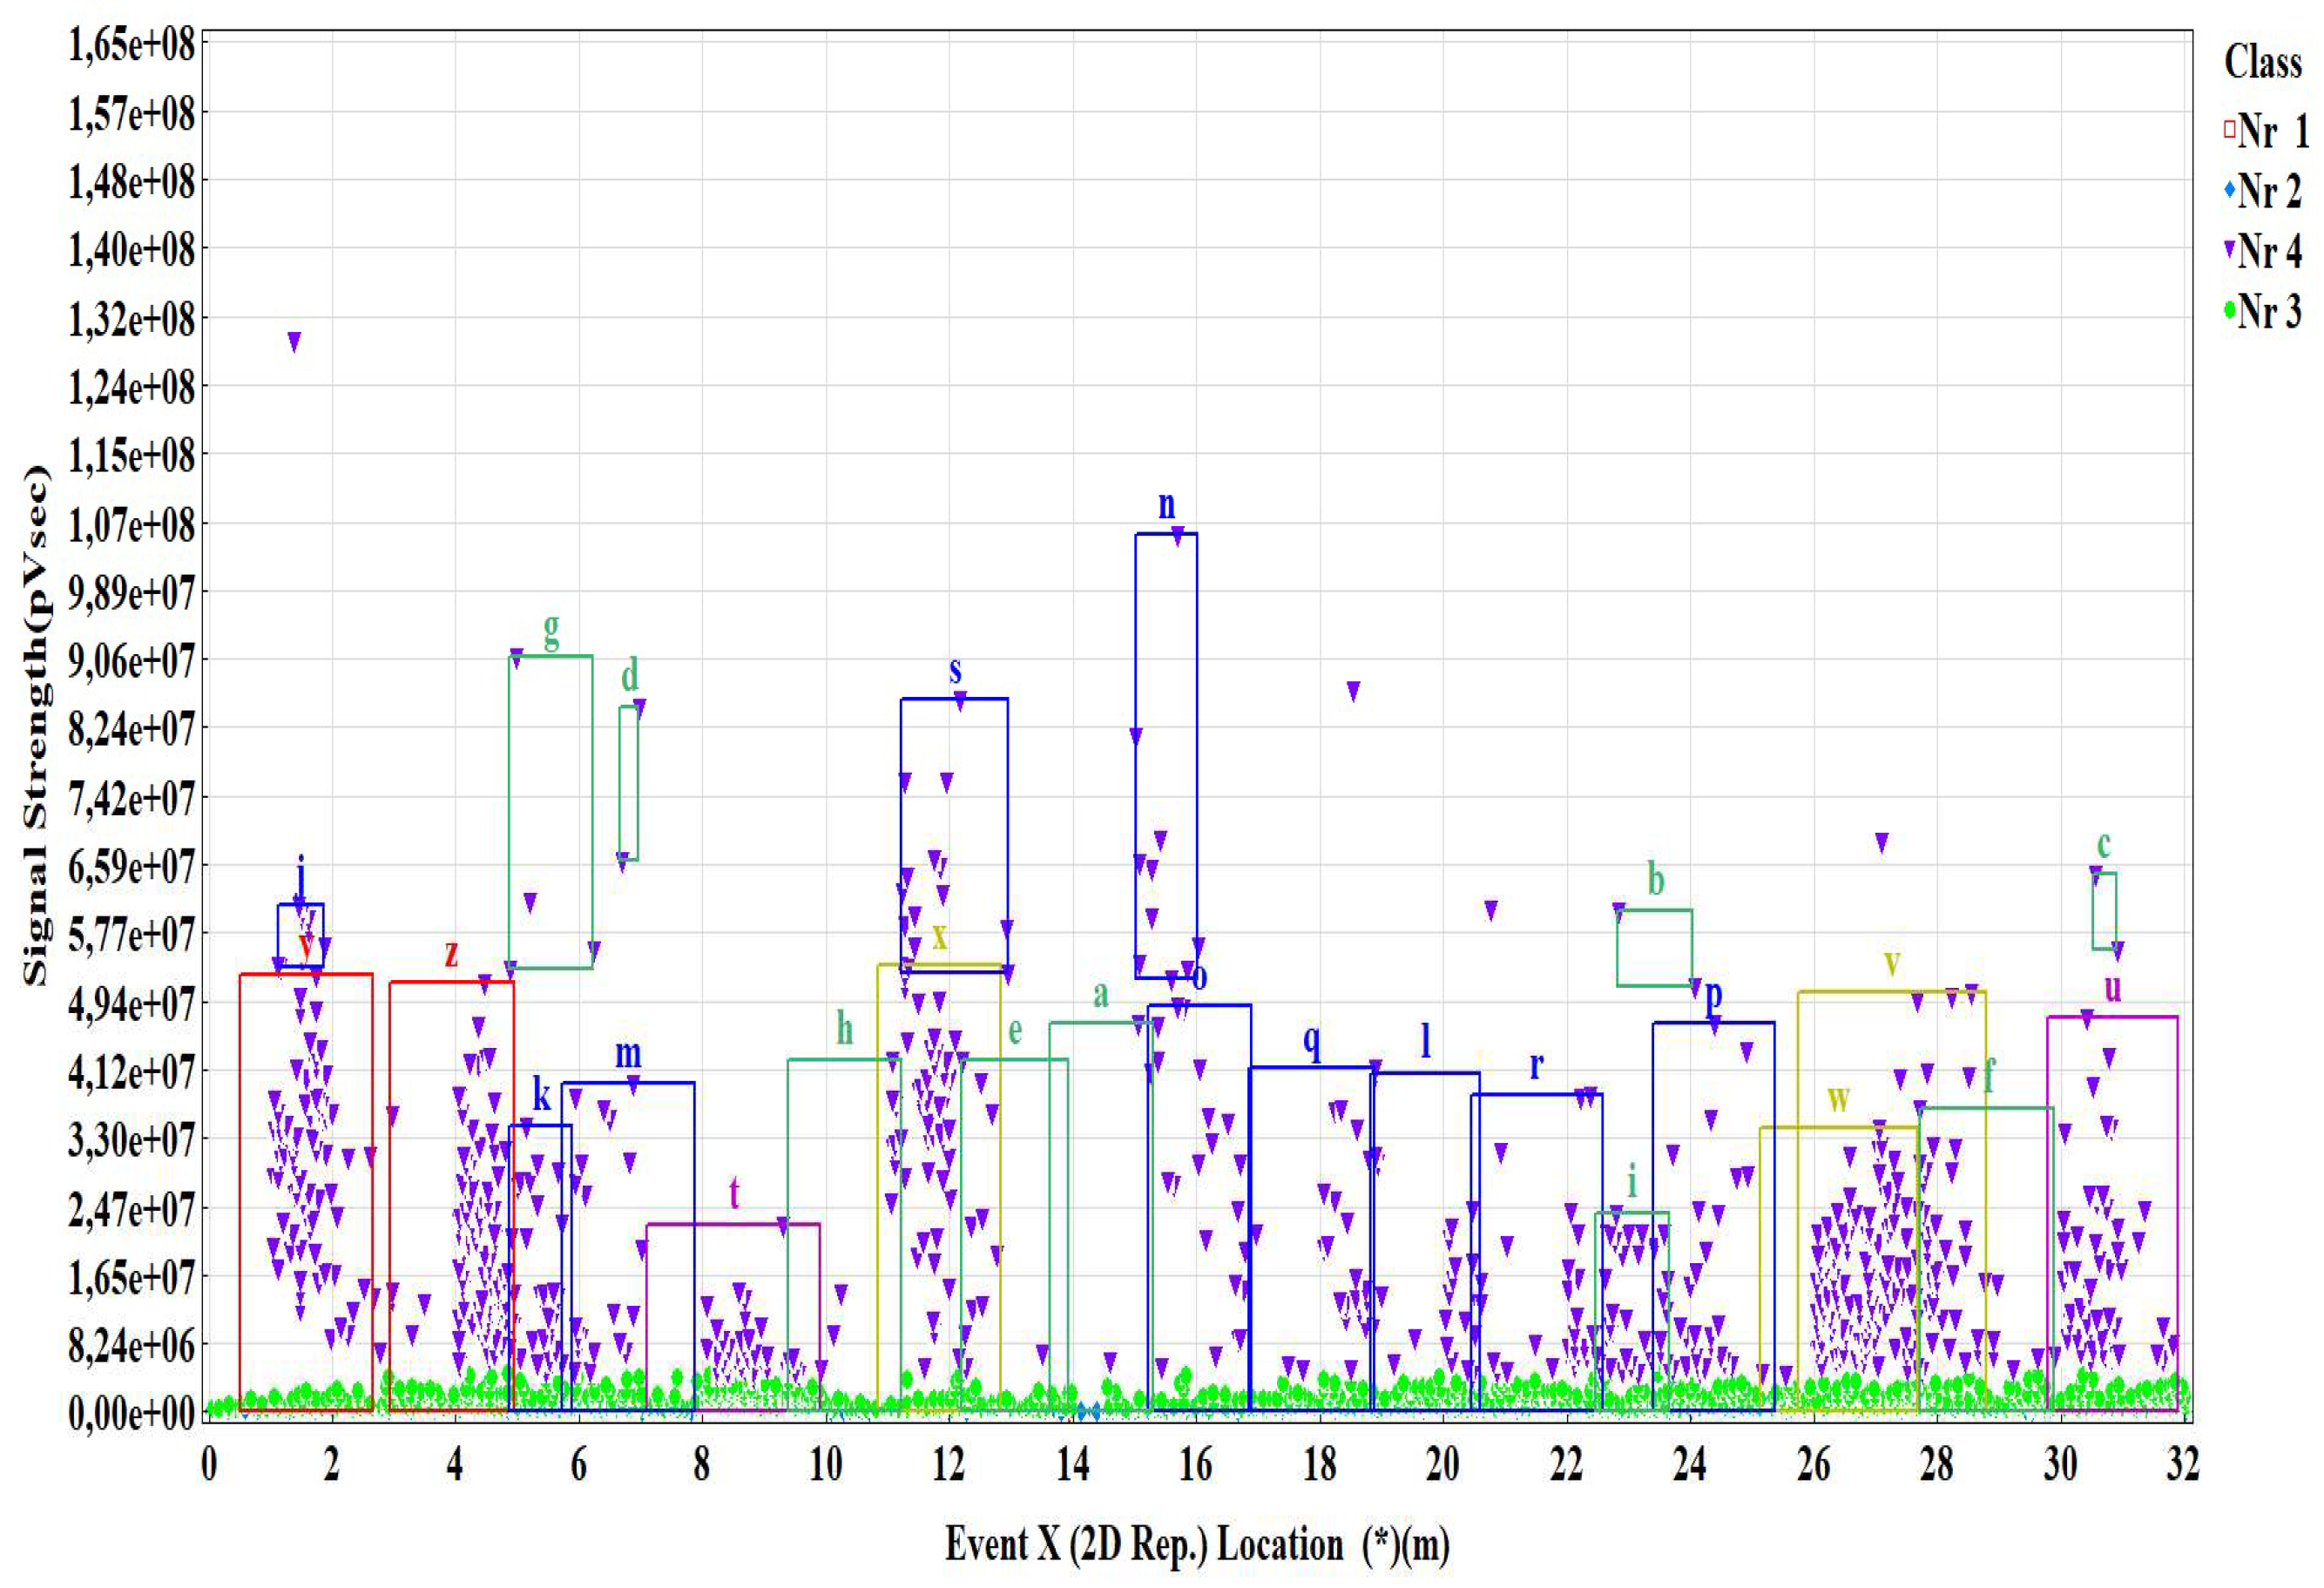
Figure 9.
Scatter plot of signal strength as a function of location (beam length) [35].
Figure 9.
Scatter plot of signal strength as a function of location (beam length) [35].
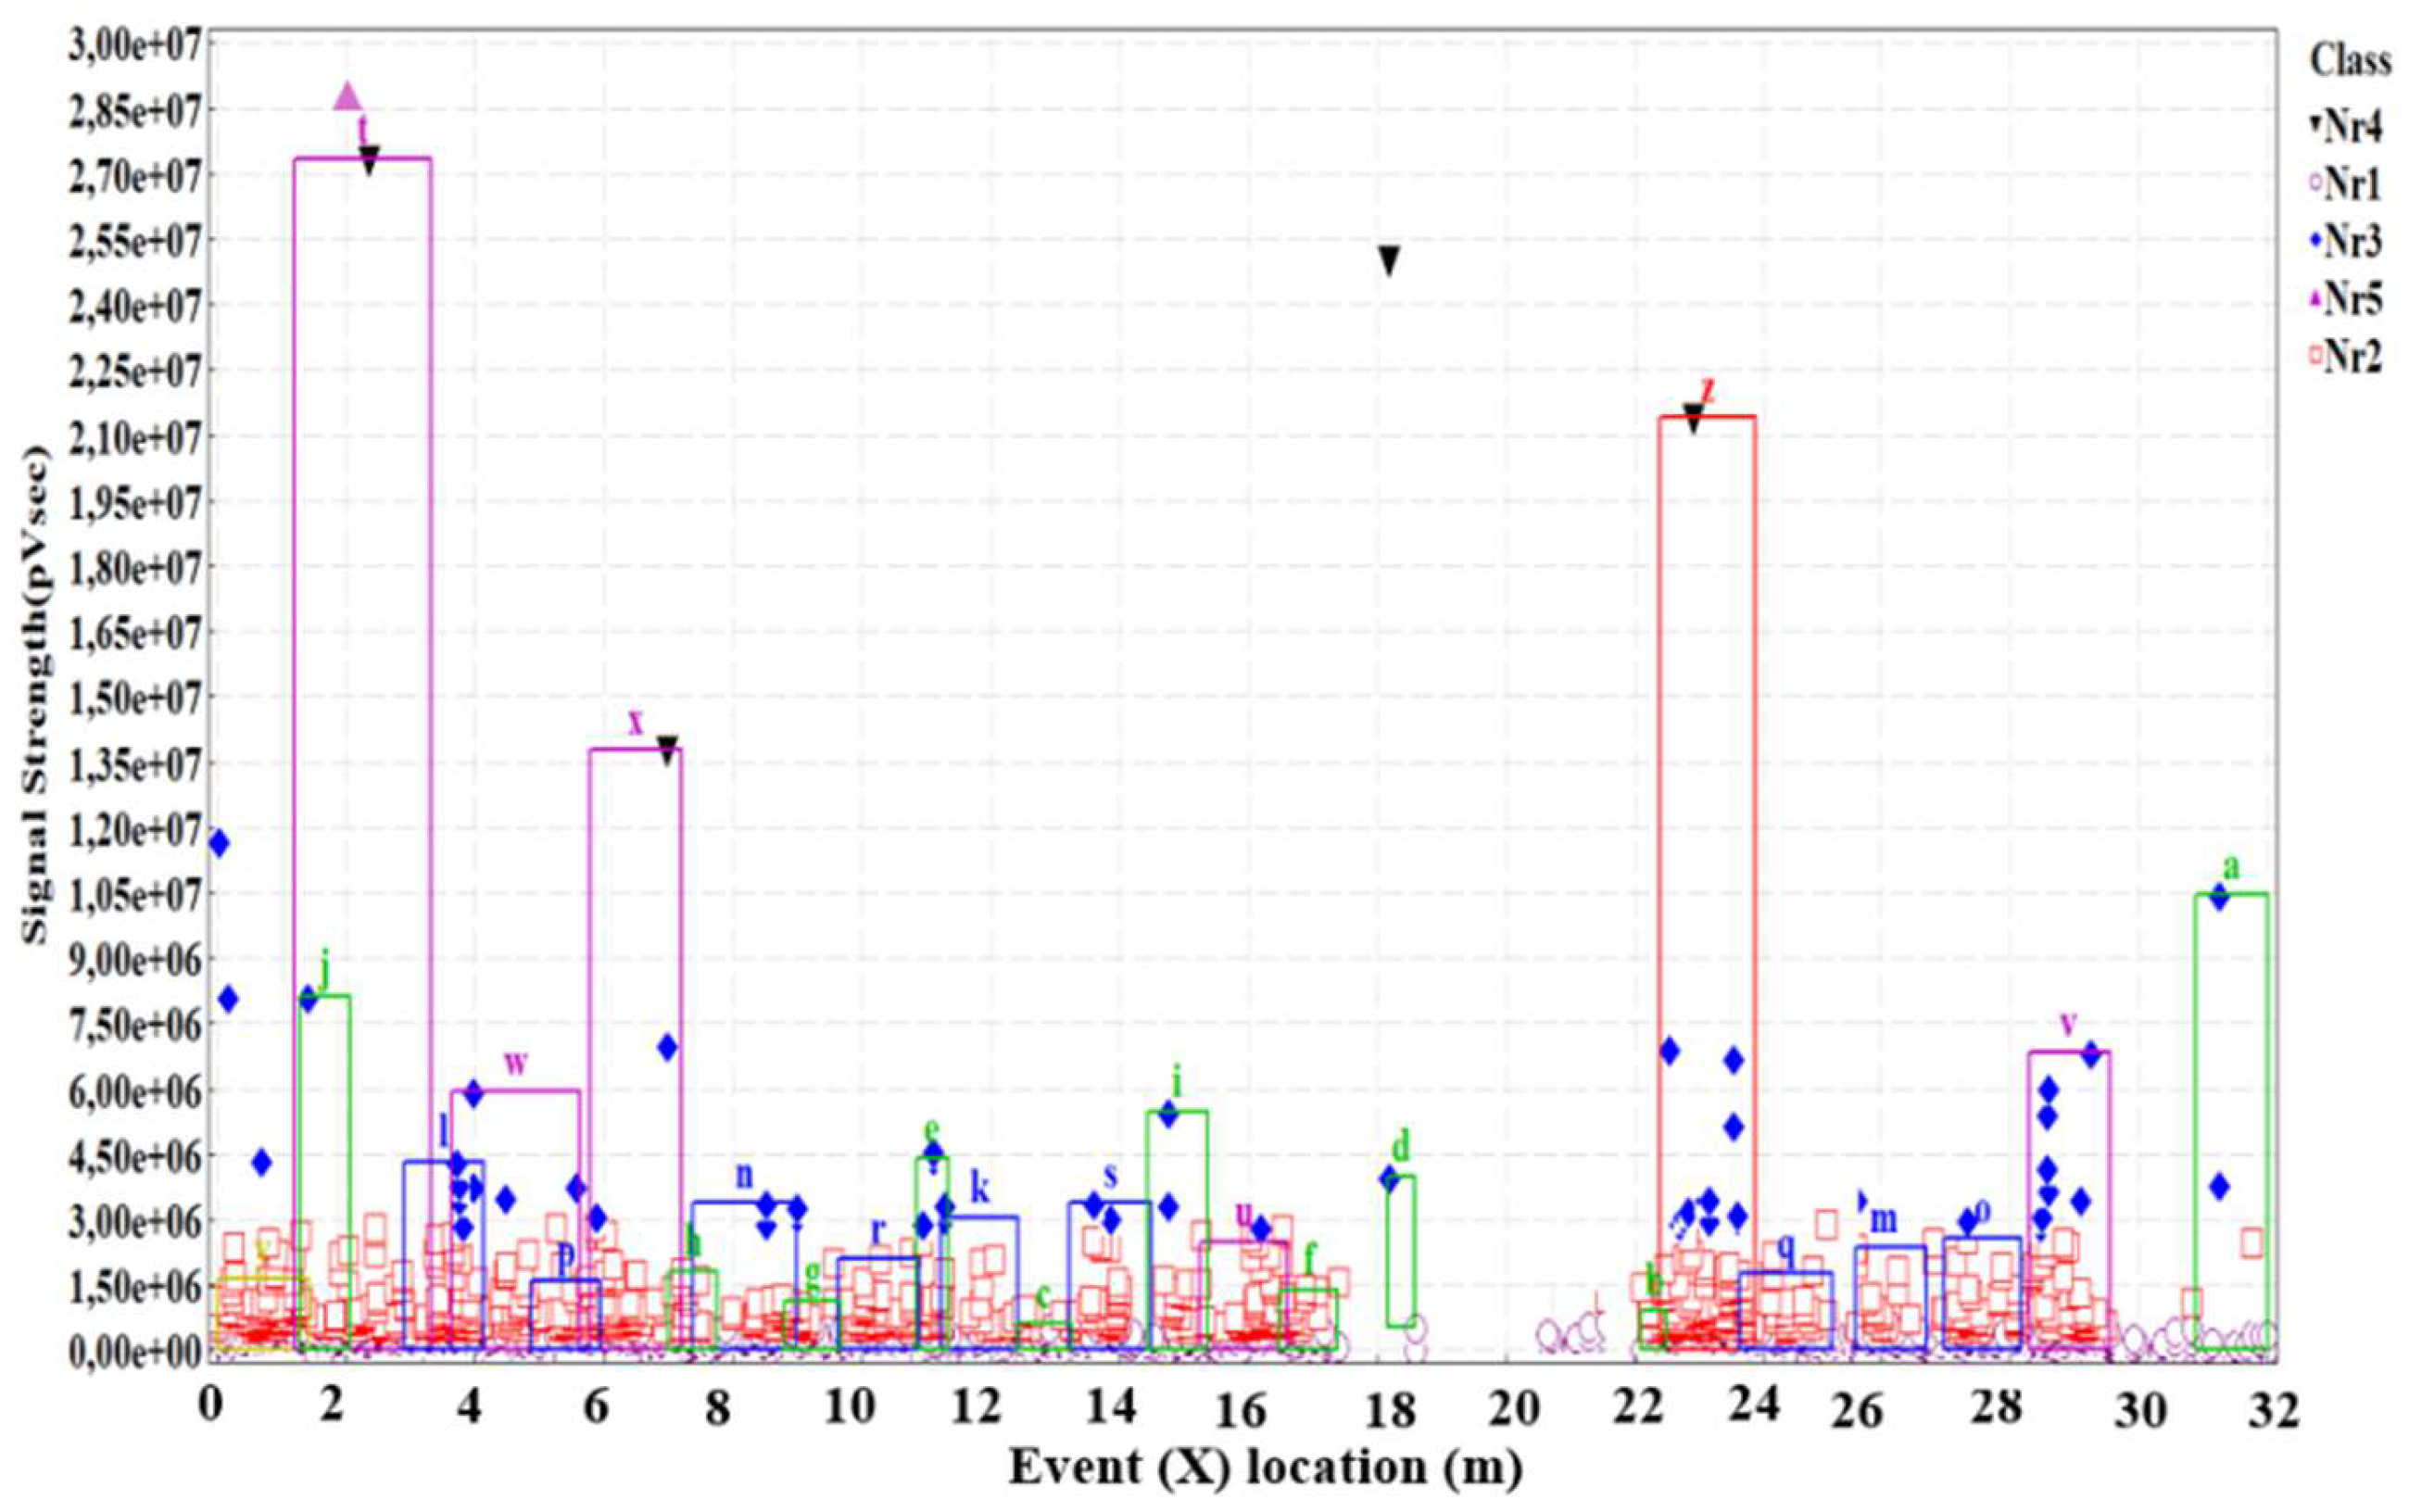
Figure 10.
Block diagram of the IAA system operation [35].
Figure 10.
Block diagram of the IAA system operation [35].
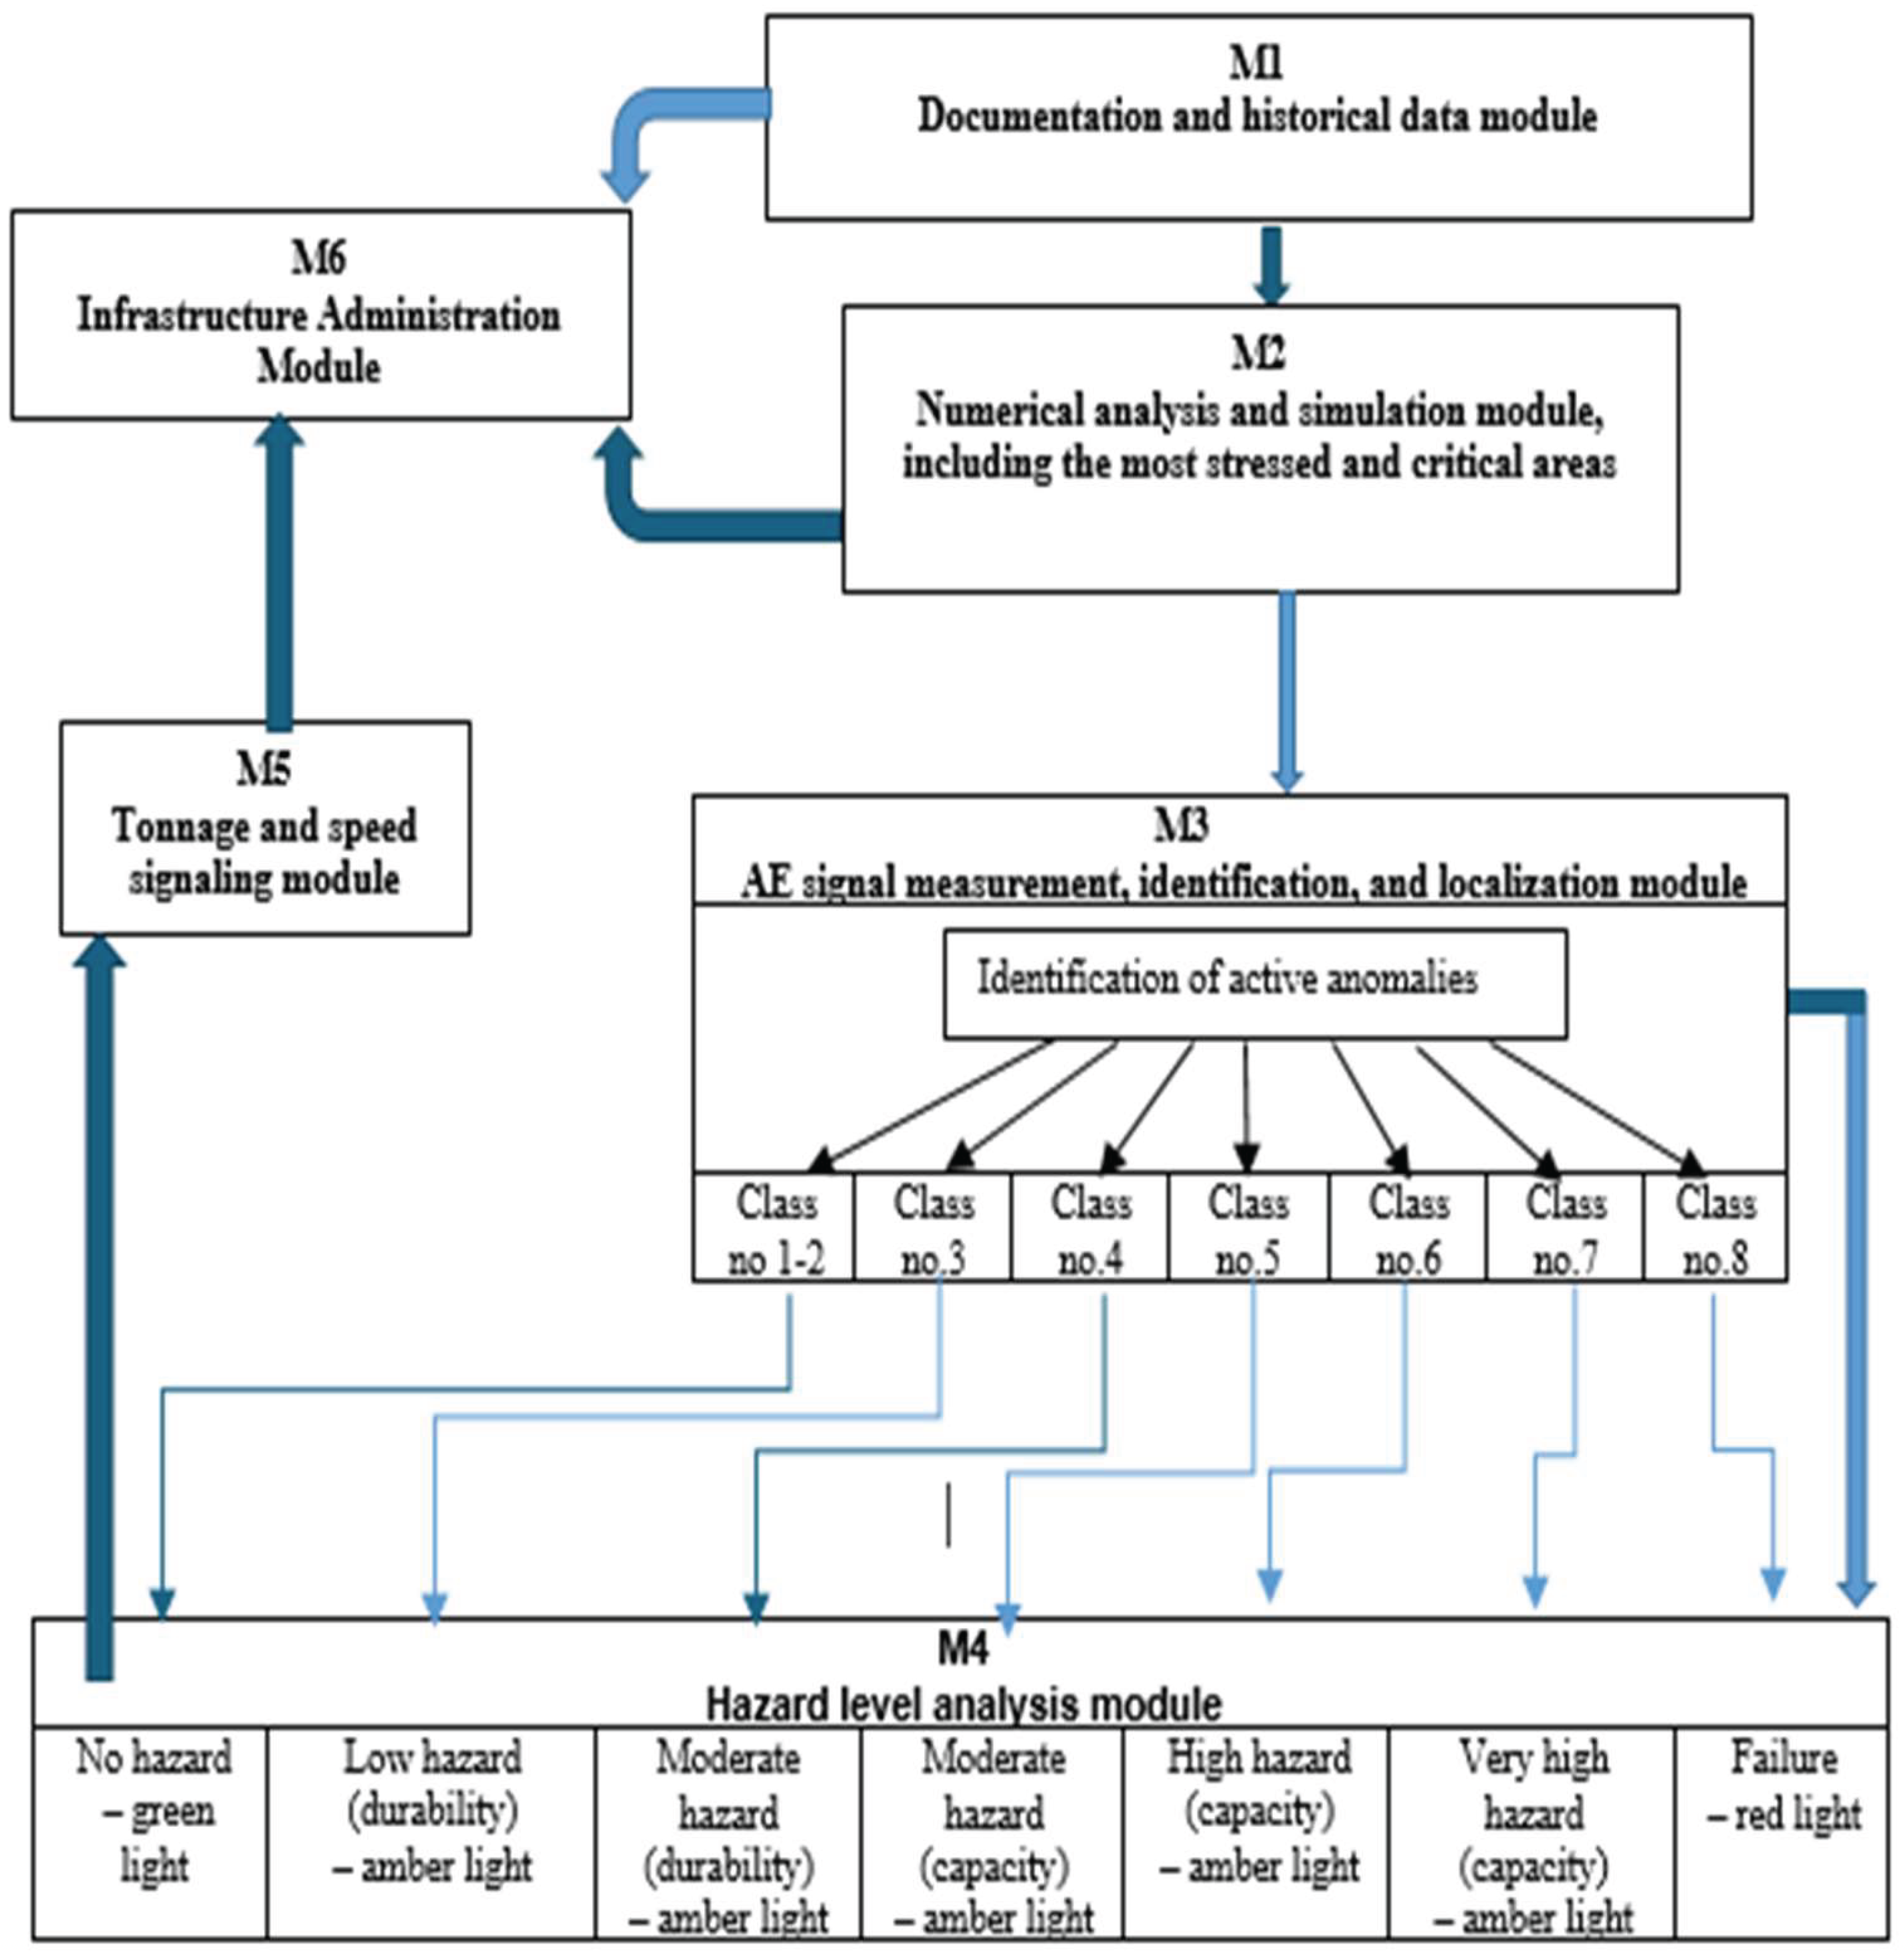
Table 1.
AE SIGNAL CLASSES, SYMBOLS, AND CODES [35].
Table 1.
AE SIGNAL CLASSES, SYMBOLS, AND CODES [35].
| Symbols |  |
 |
 |
 |
 |
 |
 |
 |
| Classes | No. 1 | No. 2 | No. 3 | No. 4 | No. 5 | No. 6 | No. 7 | No. 8 |
| Degree of danger | 5 | 4 | 3 | 3 | 2 | 2 | 1 | 0 |
Class No. 1 Initiation of micro-cracking in the grout. Class No. 2 Initiation of micro-cracking at the grout-aggregate interface and development of microcracks. Class No. 3 Initiation of micro-cracks on the component surface. Class No. 4 Growth of cracks. Class No. 5 Loss of adhesion in the crack vicinity and prestressing cable corrosion. Class No. 6 Buckling of compression bars. Class No. 7 Crushing of compressed concrete. Class No. 8 Fracture of prestressing strand/cable or rupture of reinforcing bar.
Table 2.
Destructive processes, corresponding signal classes, and assigned hazard levels [35].
Table 2.
Destructive processes, corresponding signal classes, and assigned hazard levels [35].
| Signal class | Destructive process | Hazard level |
| Class No. 1 | Initiation of micro-cracking in the grout | No hazard |
| Class No. 2 | Initiation of micro-cracking at the grout-aggregate interface and development of micro-cracks | No hazard |
| Class No. 3 | Initiation of micro-cracks on the element surface | Low hazard |
| Class No. 4 | Growth of cracks | Moderate hazard (durability) |
| Class No. 5 | Loss of adhesion in the crack vicinity | Moderate hazard (load capacity) |
| Class No. 6 | Buckling of compression bars | High hazard (load capacity) |
| Class No. 7 | Crushing of compressed concrete | Very high hazard |
| Class No. 8 | Prestressing strand/cable fracture or reinforcing bar rupture. | Failure/crash |
Table 3.
Damage extent codification matrix.
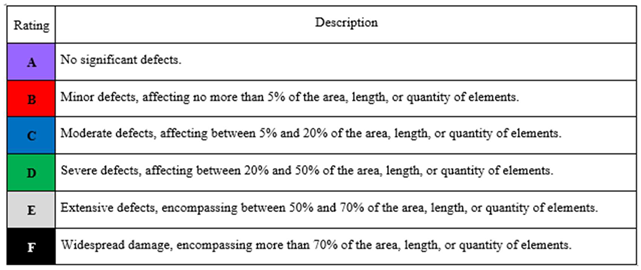
Table 4.
Codification matrix for the impact of defects on structural technical condition.
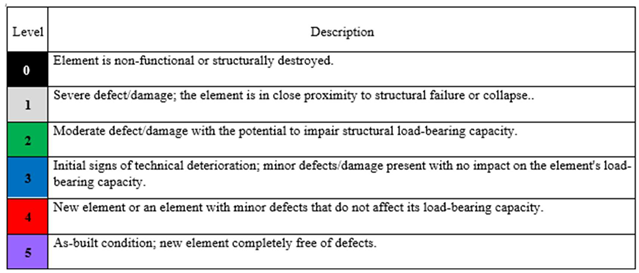
Table 9.
Information transmitted to the operational safety module M5 and the administrator registration and signaling module M6 [35].
Table 9.
Information transmitted to the operational safety module M5 and the administrator registration and signaling module M6 [35].
| Signal class | Hazard level | Information for the permissible load level signaling module – M5 | Information for the structure administrator registration and signaling module – M6 |
| class 1 | None | No information – green light | No information |
| class 2 | None | No information – green light | No information |
| class 3 | Low (durability) |
No information – amber light |
Warning Crack formation in zone X….. |
| class 4 | Moderate (durability) |
Limit the permissible speed to 50 km/h for vehicles exceeding 12 t – amber light |
Durability hazard Crack formation in zone X…. the permissible speed to 50 km/h for vehicles with a weight exceeding 12 t |
| class 5 | Moderate (load capacity) |
Limit the permissible load capacity of the structure to 10 t – amber light |
Load-bearing capacity hazard Loss of reinforcement bond in zone X ... the permissible speed to 50 km/h for vehicles with a weight exceeding 12 t... Limit the permissible load capacity of the structure to 10 t |
| class 6 | High (load capacity) |
Limit the permissible load capacity of the structure to 20 t – amber light |
Load-bearing capacity hazard Plastic deformation of compressed concrete in zone X ... limit the permissible speed for vehicles with a weight exceeding 12 t to 50 km/h. Limit the permissible load capacity of the structure to 20 t |
| class 7 | Very high (load capacity), |
Limit the permissible load capacity of the structure to 3.5 t + public transport – amber light |
Load-bearing capacity hazard. Plastic deformation of compressed concrete in zone X ... limit the permissible speed to 40 km/h. Limit the permissible load capacity of the structure to 3.5 t |
| class 8 | Failure or catastrophe | Closure of the structure to traffic – red light | Failure of the structure |
Disclaimer/Publisher’s Note: The statements, opinions and data contained in all publications are solely those of the individual author(s) and contributor(s) and not of MDPI and/or the editor(s). MDPI and/or the editor(s) disclaim responsibility for any injury to people or property resulting from any ideas, methods, instructions or products referred to in the content. |
© 2026 by the authors. Licensee MDPI, Basel, Switzerland. This article is an open access article distributed under the terms and conditions of the Creative Commons Attribution (CC BY) license (http://creativecommons.org/licenses/by/4.0/).
Copyright: This open access article is published under a Creative Commons CC BY 4.0 license, which permit the free download, distribution, and reuse, provided that the author and preprint are cited in any reuse.


