
Submitted:
31 July 2026
Posted:
03 August 2026
You are already at the latest version
Abstract
Recent industry reporting indicates that meantime to exploit has become negative in several observed datasets, implying that exploitation may occur before patch availability for some classes of vulnerabilities. Adversarial use of artificial intelligence (AI) is a documented accelerant of this trend. This paper addresses the operational problem that follows in healthcare cybersecurity: the volume and velocity of vulnerability disclosure exceed human analytic capacity, which leads practitioners to under-prioritize, or defer entirely, individual Common Vulnerabilities and Exposures (CVEs) at precisely the moment their risk is rising. Adopting the design science research paradigm of Hevner et al. [8], the study develops and evaluates a purposeful information technology artifact intended to resolve this problem within a mid-sized United States healthcare system. The artifact is a three-application automated CVE intelligence, prioritization, and remediation-tracking pipeline implemented in Microsoft Azure Logic Apps, integrating the National Vulnerability Database (NVD), the CISA Known Exploited Vulnerabilities (KEV) catalog, the Microsoft Security Response Center (MSRC) CVRF API, Microsoft Defender, Claroty xDome, Microsoft Security Copilot, and ServiceNow, and operationalizing the four risk factors codified in CISA Binding Operational Directive (BOD) 26-04. In naturalistic operation across three CISA Weekly Vulnerability Summary bulletins, the artifact processed 5,216 unique CVE references and reduced them to 534 environment-relevant findings, an 89.8 percent exposure-first reduction, before expensive per-CVE enrichment and ticketing. Findings indicate that governed automation demonstrably increases CVE coverage, reduces low-value enrichment volume, and creates an auditable prioritization record. Because no controlled before-and-after time-and-motion study was conducted and no independent ground-truth severity labels were collected, remediation-speed and analyst-productivity outcomes remain future validation targets rather than demonstrated results.
Keywords:
CVE automation
; vulnerability management
; exploit prediction
; design science research
; Binding Operational Directive 26-04
; healthcare cybersecurity
; security orchestration
; artificial intelligence
1. Introduction
Vulnerability management, defined as the identification, prioritization, and remediation of Common Vulnerabilities and Exposures (CVEs), has become a frontline patient-safety function in healthcare rather than a routine hygiene task. Healthcare data constitute among the most sensitive categories of personal information, and the sector is a persistent target because compromise threatens both confidentiality and the continuity of clinical care [1,2]. The attack surface is expanding at the same time, because medical devices, operational technology, and clinical information systems are now densely interconnected [3].
Two structural forces strain this function. First, the scale of vulnerability disclosure has industrialized. The public CVE program published 48,185 new vulnerabilities in 2025, a 20.6 percent increase over the 39,962 published in 2024, which had itself risen sharply over 2023 [4]. Second, the interval between disclosure and exploitation, which is the operational slack that patch management programs were engineered to fill, has effectively collapsed. Multiple analyses attribute this shift in part to adversarial use of artificial intelligence (AI) [5,6].
Regulators have responded. On June 10, 2026, the Cybersecurity and Infrastructure Security Agency (CISA) issued Binding Operational Directive (BOD) 26-04, which warns that adversary use of AI may further narrow the time defenders have between patch release and possible exploitation. The directive replaces flat, severity-based deadlines with a risk-tiered remediation model and supersedes both BOD 19-02 and BOD 22-01 [7].
This paper reports a design science research study conducted within a mid-sized United States healthcare system. Following the paradigm articulated by Hevner et al. [8], the study defines an operational problem, grounds that problem in peer-reviewed literature and federal policy, develops a purposeful information technology artifact to address it, and evaluates the artifact against a documented baseline. The artifact is an automated CVE ingestion, enrichment, prioritization, and remediation-tracking pipeline designed and implemented by the author.
1.1. Purpose and Research Questions
The purpose of the study is to design and evaluate an automated artifact that restores defensible, risk-based CVE prioritization under conditions of AI-accelerated disclosure and exploitation. Two research questions guide the work.
- Research Question 1. How does adversarial and industrialized use of AI alter the volume, velocity, and exploitation timeline of disclosed CVEs, and what operational failure mode does this create for human-driven vulnerability management in healthcare?
- Research Question 2. Can an automated ingestion and prioritization artifact, aligned to the CISA BOD 26-04 risk model, meaningfully reduce manual analytic burden while preserving defensible prioritization?
1.2. Significance
The study contributes a documented, production-oriented artifact to literature that remains, by recent systematic accounts, fragmented and largely task-specific [9,10]. It also connects a technical intervention to the human dimension of security compliance, drawing on the author’s doctoral finding that practitioner self-efficacy and cognitive workload materially affect security outcomes, a relationship documented across the security operations literature [11,12].
1.3. Contributions
This study makes three contributions.
- It frames AI-accelerated CVE disclosure and exploitation as a specific vulnerability-management failure mode in healthcare, in which deferral becomes the rational analyst response to advisory volume that exceeds analytic capacity.
- It presents an instantiated design science artifact that operationalizes the four CISA BOD 26-04 risk factors using Microsoft Azure Logic Apps integrated with NVD, the CISA KEV catalog, MSRC, Microsoft Defender, Claroty xDome, Microsoft Security Copilot, SharePoint, and ServiceNow, and documents its logic in sufficient detail to be reproduced.
- It evaluates the artifact on production advisory traffic and against a documented manual lookup baseline, showing that the artifact demonstrably increases CVE coverage, reduces low-value enrichment volume, and creates an auditable prioritization record, while specifying the conditions under which that prioritization remains defensible. Remediation-speed and analyst-productivity outcomes are framed as future validation targets rather than as demonstrated results.
2. Materials and Methods
This section situates the study in the relevant literature (Section 2.1), defines the terminology used throughout (Section 2.2), states the problem the artifact addresses (Section 2.3), describes the research design (Section 2.4), and documents the designed artifact itself in sufficient detail to be reproduced (Section 2.5).
2.1. Background and Related Literature
This review synthesizes seven streams of scholarly and authoritative reporting relevant to the problem and the artifact: the industrialization of CVE disclosure; AI as an offensive accelerant; the weaponization of AI for vulnerability exploitation; the limitations of severity-based prioritization and the rise of data-driven exploit prediction; security orchestration and automation; AI-enabled threat assessment in healthcare; and the regulatory and human-factors context.
2.1.1. The Industrialization and Volume of CVE Disclosure
The raw quantity of disclosed vulnerabilities has grown faster than remediation capacity. Beyond the 2025 total of 48,185 published CVEs, the cumulative catalog since 1999 passed 308,000 entries, and December 2025 alone accounted for more than 11 percent of the year total [4]. Empirical work confirms that organizations can typically remediate only a small fraction of open vulnerabilities each month regardless of size or maturity [13]. Systematic reviews note that this surge has produced a fragmented research landscape and a persistent gap between the volume of disclosure and the maturity of prioritization practice [9,14]. Figure 1 presents the disclosure trajectory.
2.1.2. Artificial Intelligence as an Offensive Accelerant
A growing body of work documents the role of AI in compressing the disclosure-to-exploitation window. Longitudinal analysis by Mandiant found mean time to exploit falling from 63 days in the 2018 and 2019 period to 32 days in the 2021 and 2022 period, and then to 5 days in 2023 [5]. Multiple independent analyses — Mandiant’s M-Trends, the Verizon Data Breach Investigations Report, CrowdStrike’s Global Threat Report, and Google’s Threat Intelligence Group — converge on a collapse of the disclosure-to-exploitation interval, with Mandiant placing the current mean time to exploit at an estimated negative seven days, which means that exploitation is routinely occurring before a patch is released [6,15]. Figure 2 presents this trend.
This timeline evidence is descriptive. Section 4 examines the mechanism behind it.
2.1.3. The Weaponization of Artificial Intelligence for Vulnerability Exploitation
A distinct and rapidly maturing body of peer-reviewed work examines whether generative AI materially lowers the cost of turning a disclosed vulnerability into a working exploit. This question matters for the present study because the four risk factors of BOD 26-04 include exploit automation, and any prioritization scheme that treats automatability as static will systematically misprice risk if the underlying capability is improving.
Hilario et al. [16], in the International Journal of Information Security, provides a detailed empirical study of generative AI applied across the five stages of penetration testing. Working against a controlled vulnerable target, they report that the model supplied usable options and suggestions at each stage, and they characterize the resulting capability as genuinely dual use: the same assistance that compresses a legitimate assessment also compresses an illegitimate one. Ferrag et al. [17], in a comprehensive review published in Internet of Things and Cyber-Physical Systems, survey LLM applications across the security lifecycle and catalog both the defensive uses and the offensive misuse vectors, concluding that capability and vulnerability are advancing together.
Subsequent work moves from assistance toward autonomy. Ginige et al. [18], in the proceedings of the IEEE International Conference on Trust, Security and Privacy in Computing and Communications, present an LLM agent framework for automated penetration testing and evaluate it against conventional tooling. Benson and Panchev [19], in the ESORICS 2025 workshop proceedings, extend LLM assistance into the post-exploitation phases of the cyber kill chain, which is significant because post-exploitation technical impact is itself a BOD 26-04 risk factor. Earlier reinforcement-learning approaches to the same problem, such as the GAIL-PT framework of Chen et al. [20] in Computers and Security, establish that automated offensive tooling predates the current generation of language models; what has changed is the breadth of tasks a general-purpose model can attempt without task-specific training.
Two recent studies address exploit generation directly. In emerging preprint evidence, Jin et al. [21] presents a systematic evaluation of LLM cooperativeness and proficiency in automated exploit generation, distinguishing between a model’s willingness to assist and its technical capability to do so. Peng et al. [22], published in the proceedings of the Annual Meeting of the Association for Computational Linguistics, demonstrates a modular framework that raised exploit completion rates on a capture-the-flag benchmark from 26.3 percent to 57.9 percent. A widely circulated preprint by Fang et al. [23] reports that a single agent exploited a majority of a small benchmark of one-day CVEs when supplied with the public CVE description, while the same agent failed almost entirely without it. That result has not been peer reviewed and its benchmark is small, so it is cited here as an indication of direction rather than as settled evidence.
Three conclusions follow for the present study. First, the disclosure text itself is an input to exploitation, which means that publication of a CVE now confers a measurable advantage on the attacker as well as the defender. Second, exploit automatability is a moving property rather than a fixed attribute of vulnerability, so a prioritization system must re-evaluate it against current exploitation evidence rather than assess it once during ingestion. Third, because the marginal cost of attempting exploitation is falling, the defensive advantage shifts from patching speed alone toward knowing quickly and reliably which vulnerabilities are present in the environment. These conclusions substantiate the premise of Research Question 1 and directly motivate the exposure-first design described in Section 2.5.6.
2.1.4. The Limits of Severity Scoring and the Rise of Data-Driven Prediction
Scholars have long held that severity scores alone are insufficient for prioritization. Jacobs et al. [24], introducing EPSS in Digital Threats: Research and Practice, demonstrate that remediation prioritization has relied predominantly on a mixture of subjective expert opinion and severity scores, and that a data-driven model of exploitation probability materially outperforms CVSS-based triage. Le et al. [25], in a comprehensive ACM Computing Surveys review of data-driven software vulnerability assessment and prioritization, and Mohammed and Jaaz [10] both conclude that CVSS alone does not capture real-world exploitation likelihood or operational impact, and that contextual scoring is required to close the gap. This literature directly informs the decision within the artifact to weight exploitability and environmental exposure over raw CVSS.
2.1.5. Security Orchestration, Automation, and Response
The proposition that automation reduces analyst toil and meantime to respond is well supported. Aljahdali and Alsulami [26] implement and evaluate a SOAR system for a security operations center and report that automating repetitive use cases, including vulnerability management, allows analysts to concentrate on analysis and decision-making. More recent work integrates LLMs into orchestration to move from rigid playbooks toward adaptive, AI-generated workflows while retaining human validation [27]. These findings frame the artifact as an instance of domain-specific orchestration and motivate its human-in-the-loop review design.
2.1.6. AI-Enabled Threat Assessment and Vulnerability Prediction in Healthcare
Healthcare-specific scholars establish both the necessity and the feasibility of AI-assisted vulnerability analysis. In preprint work, Heinl et al. [2] describes an AI-enabled platform that gathers externally observable security information, analyzes it, and returns a risk score to support investment decisions, which anticipates the enrichment and scoring pattern that the present artifact operationalizes. Islam et al. [3] combine ontology axioms with machine learning models, including linear regression, decision trees, and random forests, to predict vulnerability exploitability in healthcare supply chain services. Their results show that ontological framing improves both the understanding of the correlation between the healthcare and security domains and the accuracy of prediction. Beddies et al. [1] argue that AI-driven vulnerability analysis is a necessary condition for secure healthcare information technology infrastructure. Collectively, this stream frames AI as simultaneously the accelerant of the threat and a required component of the defense.
2.1.7. Regulatory and Human-Factors Context
BOD 26-04 provides the authoritative risk model against which the artifact is designed. It evaluates each vulnerability across four factors: asset exposure, KEV status, exploit automation, and post-exploitation technical impact. Vulnerabilities that satisfy all four conditions must be remediated within three days and must also receive forensic triage to establish whether the affected system was compromised before the patch was applied [7,28]. The directive further introduces an accountability obligation, because agencies must document and justify prioritization decisions. This shifts programmatic metrics away from counts of patched vulnerabilities and toward reductions in high-risk exposure [13,28]. Although binding only on federal civilian executive branch agencies, CISA has explicitly encouraged all partners to adopt similar measures [29].
On the human dimension, the security operations literature establishes that practitioner cognitive load is itself a control failure mode. Tariq et al. [12], in an ACM Computing Surveys review of alert fatigue, find that sustained exposure to high-volume, low-signal work desensitizes analysts and measurably degrades triage effectiveness, and that automation, augmentation, and human-AI collaboration are the three viable mitigation strategies. Jalalvand et al. [30] reach a parallel conclusion for alert prioritization specifically, and Nobles [11] frames stress, burnout, and security fatigue as a human factors problem rather than an individual failing. Interpreted through the self-efficacy theory of Bandura [31], reducing low-judgment cognitive load is therefore not merely an efficiency goal but a plausible mechanism for improving compliance outcomes.
2.1.8. Why Healthcare Changes the Prioritization Problem
The failure mode described above is not merely a larger version of the generic vulnerability-management problem; the clinical environment changes what “high risk” means and therefore what a prioritization artifact must optimize. Five characteristics distinguish the healthcare setting and directly shape the artifact’s design.
- Clinical uptime as a security impact dimension. Availability of clinical systems is itself a safety-relevant property, so an exploit that degrades or halts a care-delivery system can carry consequences that a confidentiality-centric severity model does not capture. The artifact therefore treats uptime and patient-safety consequences as scoring inputs rather than as afterthoughts.
- Medical device and IoMT exposure as a nontraditional asset class. Infusion pumps, imaging systems, and other Internet of Medical Things (IoMT) and operational technology (OT) assets are frequently unmanaged, long-lived, and invisible to standard endpoint telemetry, which is why the artifact establishes exposure from Claroty xDome device data in addition to Microsoft Defender rather than from the advisory alone.
- Patching constraints in clinical environments. Clinical devices often cannot be patched on the vendor’s schedule because of validation requirements, uptime windows, and vendor-controlled firmware, so prioritization must account for the reality that remediation may be slow or externally gated, elevating the value of accurate, early identification and of documented, defensible deferral.
- A single clinical device can outweigh many standard endpoints. Because a compromised clinical OT device can affect care delivery directly, the scoring rubric establishes a high minimum whenever even one to five clinical OT devices are affected, reflecting the judgment that one affected clinical asset may matter more than a large count of standard workstations.
- Remediation execution lies outside the artifact boundary. The artifact identifies, prioritizes, and documents; patch deployment and change control are performed by separate clinical-engineering and IT teams under their own constraints. This boundary is deliberate and is why the study reports displaced discovery-and-triage effort rather than remediation outcomes or patient-safety results, neither of which is claimed here.
These characteristics motivate the exposure-first, telemetry-grounded design of the artifact and explain why an advisory-only or CVSS-only triage is a poor fit for healthcare. They do not, however, license any claim about improved patient outcomes, which would require clinical measurement outside the scope of this study.
2.2. Definitions and Key Terminology
The following definitions govern usage throughout this paper. Where a term is defined by an authoritative body, that source is cited.
Advanced Hunting. A query interface within Microsoft Defender that permits structured queries against endpoint and identity telemetry. In this study it is the mechanism by which the artifact determines whether an organization possesses an affected and exposed asset.
Artifact. In design science research, a purposeful information technology construct, model, method, or instantiation created to address an identified organizational problem [8]. In this paper the artifact is the instantiated three-application Logic Apps pipeline.
Asset Exposure. The first BOD 26-04 risk factor, which asks whether a vulnerable asset is publicly accessible from the internet [7].
Automated Exploit Generation (AEG). The synthesis of a working exploit for a known vulnerability by automated means. Contemporary AEG research evaluates whether large language models can perform this synthesis without task-specific training [21,22].
Binding Operational Directive (BOD). A compulsory direction issued by CISA to federal executive branch departments and agencies for the purpose of safeguarding federal information and information systems, authorized under 44 U.S.C. 3552(b)(1) and 3553(b)(2) [7].
Common Vulnerabilities and Exposures (CVE). A publicly assigned identifier for a specific, publicly disclosed cybersecurity vulnerability, issued in the form CVE-YYYY-NNNNN by a CVE Numbering Authority under the CVE Program.
Common Vulnerability Reporting Framework (CVRF). A structured, machine-readable format for security advisories. The artifact consumes the Microsoft Security Response Center CVRF application programming interface to map CVEs to Microsoft knowledge base (KB) update articles.
Common Vulnerability Scoring System (CVSS). An open framework that produces a numeric severity score for vulnerability from base, temporal, and environmental metrics. CVSS measures intrinsic severity and does not measure the probability of real-world exploitation [24].
Design Science Research (DSR). A research paradigm in which knowledge and understanding of a problem domain and its solution are achieved through the building and application of a designed artifact [8].
Exploit Automation. The third BOD 26-04 risk factor, which asks whether exploitation of a vulnerability can be reliably automated at scale rather than requiring bespoke, manual attacker effort [7].
Exploit Prediction Scoring System (EPSS). A data-driven model that estimates the probability that a given vulnerability will be exploited in the wild within a defined forward window, developed as an empirical alternative to severity-only triage [24].
Known Exploited Vulnerabilities (KEV) Catalog. The authoritative CISA catalog of vulnerabilities for which reliable evidence of active exploitation exists. KEV status is the second BOD 26-04 risk factor [7].
Logic App. A workflow defined in Microsoft Azure Logic Apps, expressed as a JavaScript Object Notation (JSON) document containing a trigger and an ordered set of actions that invoke connectors and application programming interfaces.
Mean Time to Exploit (MTTE). The average interval between the public availability of a vulnerability and the first confirmed exploitation of that vulnerability in the wild. A negative value indicates that exploitation typically begins before a patch is released [6].
National Vulnerability Database (NVD). The United States government repository of standards-based vulnerability management data maintained by the National Institute of Standards and Technology, which enriches CVE records with CVSS vectors, weakness classifications, and product identifiers.
Post-Exploitation Technical Impact. The fourth BOD 26-04 risk factor, which characterizes the level of control an adversary gains after successful exploitation [7].
Security Orchestration, Automation, and Response (SOAR). A platform that coordinates security tooling, executes defined playbooks, and automates repetitive analyst tasks to reduce mean time to respond [26].
Alert Fatigue. The desensitization and degraded triage performance results from sustained exposure to high-volume, low-signal security work [12].
Self-Efficacy. An individual’s belief in their capability to organize and execute the courses of action required to manage prospective situations [31]. In this study it provides the theoretical link between analyst cognitive load and security policy compliance.
Service Level Agreement (SLA) Aging. The elapsed time a tracked vulnerability record has remained open relative to its assigned remediation deadline. The artifact reports aged 15-, 30-, 60-, 90-, and 120 or more-day buckets.
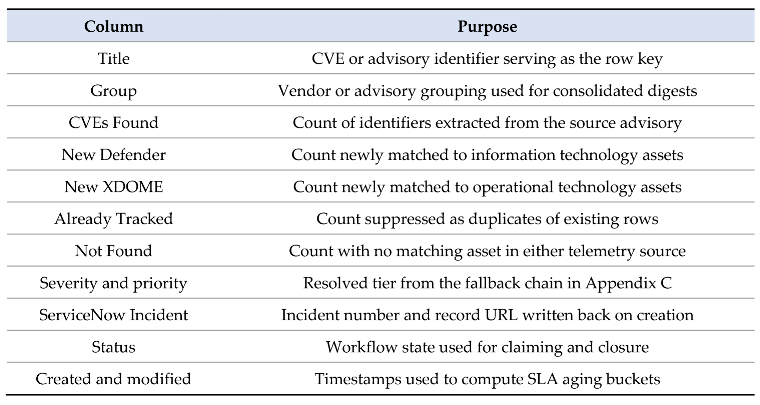
Tracker. The Microsoft SharePoint list serves as the shared system of record for the three Logic Apps and as the evidentiary audit trail for prioritization and deferral decisions.
2.3. Problem Statement
Synthesizing literature, the problem this study addresses can be stated formally as follows: artificial intelligence is accelerating the disclosure, enrichment, and exploitation of software vulnerabilities faster than human-driven vulnerability management can respond, which causes practitioners to under-prioritize individual CVEs even as both aggregate and individual risk rise.
The problem has an empirical dimension and a cognitive dimension. Empirically, disclosure volume rose by 20.6 percent in the most recent full year measured, while mean time to exploit has fallen below zero relative to patch availability [4,5,6]. Cognitively, when advisory throughput exceeds analytic capacity, deferral becomes the rational coping response. Low-context CVEs are skimmed, batched bulletins go unworked, and severity is judged by CVSS briefly rather than by contextual exploitability. This is precisely the failure mode that BOD 26-04 and the exploit prediction literature were formulated to correct [7,24,25].
Within the study site, this problem was concrete and measurable. At a documented baseline of three minutes per manual CVE lookup, a single CISA Weekly Vulnerability Summary containing approximately 1,000 CVE references would require roughly 50 hours of analyst effort, which is more than one analyst’s entire work week devoted to a single email. Consequently, such bulletins were going substantially unworked prior to the intervention, which left a defensible-prioritization gap that the artifact was designed to close.
2.4. Research Design and Methodology
2.4.1. Research Paradigm
The study follows the design science research paradigm, which seeks to extend organizational capability by creating and evaluating purposeful information technology artifacts, and in which knowledge and understanding of a problem domain and its solution are achieved in the building and application of the designed artifact [8]. This paradigm is appropriate because the contribution is an instantiated artifact addressing a defined organizational problem rather than a behavioral hypothesis test. The work is organized around the seven guidelines of Hevner et al. [8], summarized in Table 1.
2.4.2. Artifact Development Approach
The artifact was developed iteratively within the study site’s production Microsoft 365 and Azure tenant. Requirements were derived from the documented advisory workload and from the four BOD 26-04 risk factors. Development proceeded through successive versioned builds, each addressing a specific deficiency identified during use, most notably the run-duration limits encountered when processing weekly-scale bulletins. This iterative build-and-evaluate cycle is consistent with the characterization of design as a search process offered by Hevner et al. [8].
2.4.3. Study Setting and System Boundary
The study site is a mid-sized health system operating a Microsoft 365 and Azure tenant, Microsoft Defender for endpoint and identity telemetry, Claroty xDome for medical device and operational technology visibility, and ServiceNow for incident management. The system boundary of the artifact begins at the security mailbox that receives vendor, Health-ISAC, and CISA advisories, and ends at the tracker record, the ServiceNow incident, and the monthly management report. Patch deployment, change control, and remediation execution lie outside the boundary and are performed by separate teams and tooling. This boundary matters for interpreting the evaluation: the artifact displaces discovery and triage effort, not remediation effort.
2.4.4. Artifact Requirements
Requirements were derived from two sources: the documented advisory workload at the study site, and the four risk factors codified in BOD 26-04. Table 2 traces each requirement to its origin, to the design feature that satisfies it, and to the research question it supports.
2.4.5. Data Sources and Evaluation Method
The artifact ingests authoritative feeds, specifically NVD, the CISA KEV catalog, the MSRC CVRF application programming interface, the Microsoft Update Catalog, Microsoft Defender Advanced Hunting, and Claroty xDome. It records outputs in a SharePoint tracker list that serves as the operational dataset for the study. Evaluation employed analytical estimation: a documented manual baseline of three minutes per CVE lookup was applied across representative advisory volumes to quantify the manual burden that the artifact displaces. This descriptive, artifact-centric evaluation is a recognized design science strategy [8], and its limitations are addressed in Section 4.1. Because the study analyzes system telemetry and public vulnerability data rather than human subjects, it did not require human-subjects review.
2.4.6. Evaluation Measures
The evaluation reports one primary measure and a set of secondary measures. The primary measure is analytical. The secondary measures are properties of the workflow definition that can be verified by inspection of the exported artifact and are reported here as design characteristics rather than as observed run statistics.
- Primary measure: estimated manual lookup hours displaced, calculated as the count of CVE references multiplied by the documented per-CVE manual lookup baseline.
- Secondary measure: proportion of the workflow that is gated on confirmed environmental exposure, established by inspection of action ordering.
- Secondary measure: existence of a terminating fallback path such that no CVE can exit the workflow without an assigned severity.
- Secondary measure: presence of deduplication and row-claiming controls that prevent duplicate tracker rows and duplicate incidents.
- Secondary measure: presence of incident identifier writeback linking each tracker row to its ServiceNow record.
Measures that would require operational run history, including observed runtime, the number of CVEs skipped by the exposure-first gate in each bulletin, the proportion resolved by fallback rather than by Security Copilot, and post-automation analyst review time, are not reported. They are specified here so that a subsequent measurement study can collect them directly.
2.4.7. Ethics and Data Governance
The study analyzes public vulnerability data and system telemetry. No patient data and no individual employee performance data are collected, analyzed, or reported. Because the study does not involve human subjects, it did not require institutional review board review. Workflow excerpts reproduced in the appendices have been sanitized: tenant identifiers, internal hostnames, mailbox and list identifiers, service account names, and credential parameters are withheld because publishing them would disclose internal security architecture without contributing to reproducibility.
2.5. The Designed Artifact
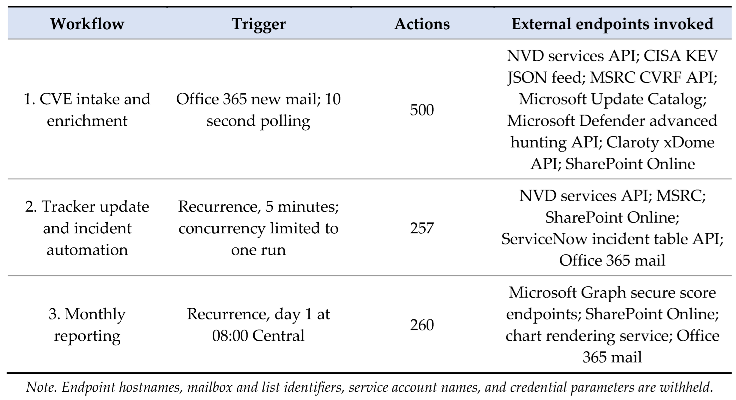
The artifact is an automated CVE intelligence, prioritization, and remediation-tracking pipeline implemented as three cooperating Microsoft Azure Logic Apps. The three applications share a common SharePoint tracker, and a common connector set spanning Office 365, SharePoint Online, Microsoft Security Copilot, Microsoft Graph and Defender, Claroty xDome, ServiceNow, NVD, CISA, and MSRC. The three-application decomposition separates event-driven intake, batched tracker maintenance and ticketing, and heavier monthly reporting. This keeps each workflow within Logic App action count and run duration limits, and it prevents a slow run in one application from blocking the others. Figure 3 presents the architecture.

Table 3.
Components of the designed artifact.
| Logic App | Trigger | Function |
|---|---|---|
| 1. CVE intake and enrichment | Office 365 new mail, 10 second polling | Parses each advisory email; extracts and normalizes CVE, KB, and CISA references; enriches against KEV, NVD, MSRC, Defender, and xDome; scores risk with Security Copilot; writes tracker records. 500 top-level actions; 577 total actions when nested scopes, loops, and conditions are counted. |
| 2. Tracker update and incident automation | Recurrence, 5 minutes, single instance | Re-validates unclaimed rows against NVD and KEV; builds consolidated digest emails per analyst group; opens ServiceNow incidents; claims rows to prevent reprocessing. 257 workflow actions. |
| 3. Monthly reporting | Scheduled, first day of month, 08:00 Central | Computes SLA aging buckets of 15, 30, 60, 90, and 120 or more days; pulls Microsoft Secure Score history and control-level detail; renders charts; emails a consolidated report. 260 workflow actions. |
Note. Compiled from the exported workflow definitions. Action counts include actions nested within scopes, conditions, and loops.
2.5.1. CVE Extraction from Unstructured Advisories
Advisory emails are unstructured, because CVE references may appear as plain text, inside hyperlinks, or only on a linked page. Logic App 1 therefore decomposes each message into hyperlink targets, raw uniform resource locators, and plain-text uniform resource locators; fetches each distinct linked page so that references behind generic link text are captured; decodes and normalizes the combined markup; canonicalizes Unicode dash and separator variants to the CVE-YYYY-NNNNN form; and then tokenizes and de-duplicates the result. This extraction layer is the precondition for automated handling of weekly-scale bulletins.
2.5.2. Multi-Source Enrichment
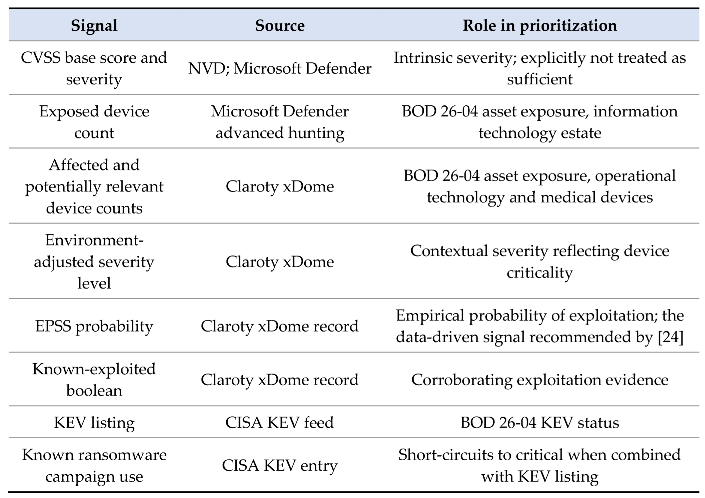
Rather than relying on a single feed, Logic App 1 runs four pipelines over a shared bulk pre-fetch: an individual-CVE pipeline, a CISA Weekly pipeline organized by vendor group, a Health-ISAC pipeline, and a cross-cutting MSRC KB-mapping pipeline. Each CVE is cross-checked against the CISA KEV feed, NVD for the CVSS vector and exploitability data, the MSRC CVRF application programming interface, Defender Advanced Hunting for internet-facing exposure, and Claroty xDome for operational technology exposure. The xDome record also supplies an Exploit Prediction Scoring System (EPSS) probability, a known-exploited Boolean, and an environment-adjusted severity level, each of which is carried forward into the scoring prompt. The artifact therefore consumes an empirical exploitation-probability signal alongside CVSS, which is the practice recommended by Jacobs et al. [24]. Environmental exposure is therefore established from the organization’s own asset telemetry rather than inferred from the advisory, which is consistent with the emphasis in the exploit prediction literature on contextual signals over static severity [24,25].
2.5.3. Healthcare-Contextual Scoring: The Actual Mechanism
Rationale. A common and fair objection to large language model (LLM)-assisted prioritization is that the scoring step is opaque and therefore unauditable. In this artifact it is not. The scoring step is a fully specified, version-controlled prompt whose inputs are deterministic feed values, whose output schema is fixed, and whose result is post-processed by deterministic code with hard safety overrides. This subsection documents the mechanism from the exported workflow so that a reader can reproduce and audit it.
2.5.3.1. The prompt is assembled from three fixed components
Each CVE prompt is the concatenation of an input-data block, a risk-evaluation-model block, and an output-format block. The model is not asked to infer from an unbounded advisory narrative; it receives a structured prompt assembled from source-attributed fields.
Component 1 — input-data block. Populated per CVE from the enrichment feeds, this block instructs the model not to rely on CVSS alone and supplies the CVE identifier, CVSS score, Microsoft severity, total exposed devices from Defender, workstation and server counts, affected software, Claroty xDome operational-technology and Internet of Medical Things (OT/IoMT) device counts, the xDome adjusted severity, the xDome known-exploited flag, the EPSS score, CISA KEV listing, known ransomware-campaign use, source context, and the CVE classification as operating-system-level or application-level.
Component 2 — risk-evaluation-model block. This block supplies organizational context (approximately 30,000 devices and 15,000 users, with multifactor authentication enforced for roughly 99 percent of users) and an explicit five-factor rubric so that scoring is consistent across runs. The rubric treats CVSS only as a baseline starting point; increases severity when KEV, ransomware linkage, or an xDome known-exploited flag is present, and mandates Critical when all three coincide; adjusts for exposure and blast radius, with fewer than 50 affected devices reducing severity, 50 to 500 neutral, more than 500 increasing it, and any 1 to 5 clinical OT devices establishing a High minimum on patient-safety grounds; reduces severity where compensating controls such as segmentation apply, noting that OT is typically unmanaged; and increases severity for identity systems, clinical servers, and medical equipment.
Component 3 — output-format block. This block forces a parseable, citation-free schema and encodes the non-negotiable safety rules. The model must return plain text in four labeled sections; CVE type, an email briefing, a one-word severity adjustment (Critical, High, Medium, or Low) with a one-to-two-sentence justification, and a recommended priority (Immediate, 24 to 48 hours; Urgent, 72 hours to 7 days; or Standard patch cycle). The hard rules state that known ransomware used together with CISA KEV listing must yield Critical, that an xDome known-exploited flag must yield Critical, and that KEV listing alone is a strong signal but does not by itself mandate Critical.
2.5.3.2. The model output is not trusted blindly
A deterministic expression resolves the final severity. The language model influences the outcome only in the middle of a chain that begins and ends with rule-based logic.
- Hard override first. If a CVE is both known-ransomware-linked and KEV-listed, or if the xDome known-exploited flag is set, the record is classified Critical regardless of model output.
- Parse the model. Otherwise, the workflow reads the token immediately following the severity-adjustment label and maps it too Critical, High, Medium, or Low.
- Fallback chain. If the model returned no usable token, the value coalesces to the Defender base severity, then to the Claroty xDome adjusted-severity level, and finally to a terminal default of High.
- Floor. Tracker severity is binarized to Critical when the resolved value is Critical and to High otherwise, so findings are never silently downgraded below High.
Auditability guarantee. Because the KEV, ransomware, and xDome flags are pulled from authoritative feeds and applied as code, an auditor can reconstruct any severity decision from the tracker record without re-invoking the model. The model adjusts within guardrails; it cannot breach them. This directly answers the question of why the Security Copilot step should be trusted: for the highest-risk classes, the artifact does not rely on the model at all. The design also reflects the recommendation in the literature to combine AI-based scoring with human-interpretable, auditable logic [10,27].
The CISA weekly group prompt uses the same rubric but returns strict JavaScript Object Notation with rating, summary, action, and recommendation fields, which is schema-validated before a tracker row is written; a second point of determinism.
2.5.4. Batched Ticketing and Audit-Ready Tracking
Logic App 2 batches work on a five-minute cadence rather than ticketing each item as it arrives. This prevents notification storms and duplicate ServiceNow incidents, and it writes each incident uniform resource locator back to the tracker to maintain a closed evidentiary record. Single-instance concurrency control, combined with a claim step that marks rows as processed, ensures that overlapping runs cannot act on the same rows twice. A separate deduplication pass filters previously recorded evidence rows before new incidents are opened. This design supports the BOD 26-04 obligation to document and justify prioritization and deferral decisions [28].
One limitation is visible at this layer and is reported here rather than deferred to the limitations section. The ServiceNow incident payload currently sets urgency and impact to a fixed default value for every incident, so the computed risk tier propagates to the tracker and to the monthly report but not to the ticket record itself. Risk-driven urgency and impact mapping is identified as planned work in Section 4.1.
2.5.5. Monthly Reporting and Secure Score Integration
Logic App 3 executes on the first day of each month and produces a consolidated management report. It computes SLA aging buckets, retrieves Microsoft Secure Score history and control-level and profile-level detail through the Microsoft Graph application programming interface, identifies the largest month-over-month control increases and decreases, compares the organization against published data for comparable seat counts, and renders the results as charts within an emailed report. This converts the tracker from an operational queue into a governance instrument.
2.5.6. Performance Engineering for Weekly-Scale Volume
Naive processing of bulletins containing one thousand CVEs produced multi-hour runtimes. The artifact was iteratively refactored in the version 43 performance build, which reduced redundant MSRC lookup loops, consolidated read-and-move operations, and, most consequentially, reordered the workflow so that scope and KB lookups occur only for CVEs that affect the environment. Exposure is therefore evaluated before expensive per-CVE enrichment. This optimization instantiates the BOD 26-04 principle of concentrating effort on the vulnerabilities that matter to the organization [7].
Table 4.
Operationalization of the four BOD 26-04 risk factors within the artifact.
| BOD 26-04 risk factor | Operationalization in the artifact |
|---|---|
| Asset exposure | Established through Microsoft Defender Advanced Hunting and the Claroty xDome device list, reflecting whether the organization holds exposed, affected assets. |
| KEV status | Live check against the CISA KEV feed at ingestion. KEV listing combined with known ransomware association drives automatic critical classification. |
| Exploit automation | Derived from NVD CVSS exploitability data and from Security Copilot output that weights real-world exploitability. |
| Post-exploitation technical impact | Derived from the NVD impact metrics and from Security Copilot assessment of patient-safety and uptime consequence. |
| Resulting priority and timeline | Combined signals drive the tracker severity and priority fields and the SLA aging buckets reported monthly. ServiceNow urgency and impact are currently set to a fixed default and are not yet risk-driven (see Section 4.1). |
Note. Risk factors are defined in [7]. Operationalization is compiled from the exported workflow definitions. The current implementation operationalizes the four BOD 26-04 decision inputs but does not yet encode CISA’s exact remediation-deadline matrix as a tracker field.
2.5.7. Mapping to Research Questions
Table 5 states which evidence bears on each research question, and which element of the artifact carries it.
3. Results
Evaluation design. Consistent with design-science evaluation practice, this study reports a naturalistic, ex post evaluation of the deployed artifact operating on live production advisory traffic between May and July 2026 [32], in addition to the analytical baseline. Two classes of evidence are presented: the observed processing volumes and the exposure-first reduction they produced, and the analytical workload displaced, now reported with an explicit sensitivity range rather than a single point estimate.
3.1. Observed Processing Volume and the Exposure-First Funnel
Across the three full CISA Weekly Vulnerability Summary bulletins processed in the observation window, the pipeline ingested 5,216 unique CVE references and, using internal Defender and Claroty xDome telemetry, reduced them to 534 environment-relevant findings before expensive per-CVE enrichment and ticketing. This is the exposure-first optimization measured on real data rather than asserted analytically.
Table 6.
Observed exposure-first reduction on production CISA Weekly bulletins.
| Bulletin | Total CVEs | Affecting us | % filtered | Groups affecting |
|---|---|---|---|---|
| Week of Jun 8, 2026 | 1,783 | 391 | 78.1% | 34 |
| Week of Jun 22, 2026 | 1,918 | 53 | 97.2% | 9 |
| Week of Jul 6, 2026 | 1,515 | 90 | 94.1% | 11 |
| Aggregate | 5,216 | 534 | 89.8% | 54 |
Note. “Affecting us” denotes a CVE present with active exposure confirmed in Defender or xDome. The mean per-bulletin filtering rate is 89.8 percent, and the median is 94.1 percent. The widespread, from 78.1 to 97.2 percent, is itself a finding: the proportion of a bulletin that is environmentally relevant varies week to week, which is precisely why a static, advisory-only triage misallocates effort. Data are drawn from the CVE_Summary run history.
3.2. Analytical Workload Displaced, With Sensitivity Analysis
The manual-lookup baseline is retained but is now reported as a range; two, three, and five minutes per CVE, so the estimate does not rest on a single unvalidated constant. At the documented three-minute rate, the three bulletins alone represent roughly 261 analyst-hours, or approximately 32.6 eight-hour analyst-days, of displaced discovery-and-triage effort.
Table 7.
Estimated manual lookup burden displaced, by bulletin and per-CVE assumption.
| Bulletin (Total CVEs) | At 2 min | At 3 min | At 5 min |
|---|---|---|---|
| Jun 8 (1,783) | 59.4 h | 89.2 h | 148.6 h |
| Jun 22 (1,918) | 63.9 h | 95.9 h | 159.8 h |
| Jul 6 (1,515) | 50.5 h | 75.8 h | 126.2 h |
Note. Lookup only (NVD, KEV, and duplicate check); excludes triage, ticketing, and communication. Even the conservative two-minute assumption places a single weekly bulletin above one analyst workweek, confirming the baseline claim is robust to the assumed constant. The wall-clock time-saved banners in the automated emails, for example “3 day(s) 23 hr.” for the 1,918-CVE bulletin, are consistent with the three-minute figure computed over a 24-hour day.
3.3. What the Artifact Demonstrably Changed
- Coverage that previously did not exist. Bulletins of 1,500 to 1,900 CVEs are now fully parsed, exposure-checked, scored, and tracked every week; before deployment these were only partially reviewed or went unworked.
- Every finding reaches the record with a defensible severity. No CVE exits without an assigned tier, so deferral is a documented decision rather than an unrecorded omission, the accountability posture that BOD 26-04 requires.
- Analyst effort shifted to judgment. The 534 relevant findings, not the 5,216 raw references, are what analysts review, an 89.8 percent reduction in items requiring human attention.
Honest statement of limits. These are operational-throughput and analytical-displacement results. They do not yet constitute a measured productivity gain, because no controlled before-and-after time-and-motion study was conducted and no independent ground-truth severity labels were collected. Section 3.4 and Section 4.1 specify the studies that would close this gap.
3.4. Descriptive Statistical Treatment and Confirmatory Validation Protocol
This section adds the quantitative treatment reviewers expect. It has two parts: statistics computable from the data already in hand, and a pre-registered protocol for a confirmatory study.
3.4.1. Descriptive statistics on the exposure-first funnel
Treating each processed bulletin as an observation, the environment-relevance rate (affecting divided by total) had a mean of 10.2 percent and ranged from 2.8 to 21.9 percent across the three large bulletins; equivalently, the filtering rate had a mean of 89.8 percent and a median of 94.1 percent. The dispersion motivates reporting per-bulletin rates rather than a single headline number and supports a variance-based argument: because relevance is non-stationary week to week, capacity planning cannot assume a fixed workload.
3.4.2. Reliability and reproducibility
The run history contains naturally occurring repeated evaluations of the same CVE, which permit a first, small sample look at output stability. In the observed duplicate runs, the free-text rationale varied, and one telemetry-derived device count drifted (CVE-2024-2511 showed 317 versus 320 OT/IoMT devices across two runs minutes apart due to updated logic), yet the decision-relevant categorical outputs, the severity tier and the recommended-priority tier, were identical. The Adobe Acrobat Reader group likewise held a stable High and patch within 30 days classification across three separate runs while the prose wording changed.
Table 8.
Output stability across naturally occurring repeated evaluations of the same item.
| Repeated item | Runs | Field drift observed | Severity stable? | Priority stable? |
|---|---|---|---|---|
| CVE-2024-2511 | 2 | OT/IoMT device count drifted 317 to 320 with updated logic | Yes | Yes |
| Adobe Acrobat Reader group | 3 | Free-text rationale prose varied | Yes | Yes |
This is preliminary descriptive evidence only, not proof of model reliability. The samples are small, the repeated evaluations arose naturally rather than by design, and telemetry drift is a real confound; a pre-registered reproducibility study is specified in Section 3.4.3.
Interpretation. This is the empirical justification for the design in Section 2.5.3.2: the artifact commits only the categorical fields to the record and regenerates prose freely, so non-determinism is confined to explanatory text rather than to the auditable decision. It should be read as a limitation-bounded strength, not overstated as proof of reliability, because the sample is small and telemetry drift is a real confound.
3.4.3. Prospective Confirmatory Validation Protocol
To convert the current analytical evaluation into inferential evidence, the following study is specified so that a reviewer can see the measurement is designed rather than hand waved.
- Copilot–analyst agreement (primary construct-validity test). Draw a stratified random sample of at least 150 processed CVEs, stratified by KEV status and by IT versus OT exposure. Two senior analysts independently assign a severity tier blind to the model output, and the model tier serves as the third rater. Report Cohen’s kappa [34] for each analyst-versus-model pair and Gwet’s AC1 [35], which is robust to the prevalence skew expected because most findings floor at High, interpreted against the benchmarks of Landis and Koch [33]. The target is kappa of at least 0.61 (substantial).
- Safety-override correctness. For all KEV-listed and ransomware-linked items, test whether the deterministic override produced the analyst-confirmed Critical label using McNemar’s test on the discordant pairs; the design goal is zero false de-escalations.
- Workload displacement. Time a matched set of advisories under manual and automated handling and compare per-CVE analyst-touch time with the Wilcoxon signed-rank test [36], reporting the median difference with a 95 percent bootstrap confidence interval and a matched-pairs effect size. This replaces the analytical estimate with a measured one.
- Sample-size and power notes. For the agreement study, a sample of 150 with an expected kappa of 0.70 against a null of 0.40 yields power above 0.90 at an alpha of 0.05 under standard kappa power approximations; this is stated explicitly so reviewers can check adequacy.
Table 9.
Mapping statistical tests to research questions and validity threats.
| Test or statistic | What it establishes | Addresses |
|---|---|---|
| Cohen’s kappa / Gwet’s AC1 | Model–analyst severity agreement | Construct validity (RQ2) |
| McNemar | Override never de-escalates a true Critical | Safety / internal validity |
| Wilcoxon signed rank | Measured per-CVE time reduction | RQ2 effect size |
| Bulletin-level variance | Non-stationary relevance rate | External validity / planning |
Note. Descriptive statistics are computed from the observation-window run history; the confirmatory tests are specified as designed future work (see Section 4.1).
4. Discussion
The findings support a coherent thesis that is consistent with the reviewed literature: the same force intensifying the threat, namely AI-accelerated disclosure and exploitation, can be met with governed, AI-assisted automation on the defensive side [5,6,21]. BOD 26-04 supplies authoritative diagnosis and a risk-based prescription [7]. The exploit prediction and prioritization literature supplies the rationale for weighting exploitability and context over raw severity [10,24,25]. SOAR literature supplies evidence that automation reallocates analyst effort toward judgment [26,27].
Two design decisions merit emphasis as direct responses to the failure mode described in Section 2.3. First, the deterministic fallback chain guarantees that no CVE is silently dropped when an AI service is unavailable or its output is ambiguous, which addresses a known reliability concern in AI-driven security tooling [10]. Second, the exposure-first optimization encodes the BOD 26-04 philosophy computationally by concentrating analytic effort on vulnerabilities that affect the organization [7]. Read against the alert fatigue literature, the removal of low-judgment toil preserves analyst attention and self-efficacy for the high-judgment decisions that most influence security outcomes [12,31].
Design Principles and Transferable Design Knowledge
Beyond the instantiated artifact itself, this study contributes three transferable design principles for vulnerability-management systems operating under conditions of AI-accelerated disclosure and exploitation. First, exposure-first processing should precede expensive enrichment and analysis whenever advisory volume exceeds human analytic capacity. The observed reduction from 5,216 unique CVE references to 534 environment-relevant findings demonstrates that organizational exposure is a more effective workload discriminator than advisory content alone and allows scarce analytical resources to be concentrated on vulnerabilities that affect the environment.
Second, AI-assisted prioritization should be bound by deterministic controls rather than trusted as an authoritative decision-maker. In the artifact, Security Copilot operates within explicit scoring rules, structured inputs, deterministic fallback logic, and hard safety overrides for known-exploited and ransomware-linked vulnerabilities. This design preserves auditability, supports reproducibility, and reduces the risk that non-deterministic model behavior can silently alter high-consequence security decisions.
Third, healthcare vulnerability prioritization should incorporate operational and clinical context as primary risk determinants rather than downstream implementation considerations. The inclusion of OT and IoMT exposure, clinical-system criticality, patient-safety implications, and healthcare-specific remediation constraints reflects the reality that vulnerability severity cannot be evaluated solely through intrinsic technical characteristics such as CVSS. Effective prioritization requires integrating empirical exploitation indicators, environmental exposure, and mission impact into a single decision framework aligned with contemporary risk-based vulnerability management practices.
Collectively, these principles suggest that future vulnerability-management architectures should emphasize contextual exposure assessment, governed human-AI collaboration, and mission-specific risk modeling. While the implementation described in this study is situated within a healthcare environment, the principles themselves are intended to be transferable to other sectors facing similar challenges of volume of vulnerability, constrained analyst capacity, and increasingly compressed exploitation timelines.
Taken together, these principles express a single design theory: risk-based vulnerability management in high-volume environments should prioritize environmental exposure before enrichment, constrain AI recommendations within auditable rule structures, and incorporate mission-specific contextual risk signals before allocating remediation effort.
4.1. Validity, Limitations, and Future Work
4.1.1. Construct Validity
The primary measure is manual lookup time, which represents discovery and triage burden only. It does not measure remediation effort, patch testing, change control, or communication overhead, all of which lie outside the system boundary defined in Section 2.4.3. A reader should therefore not interpret displaced lookup hours as total vulnerability-management savings.
4.1.2. Internal Validity
The evaluation combines naturalistic production-run observation with analytical workload estimation. It is not experimental because no controlled before-and-after time-and-motion study was conducted. The per-CVE baseline is a documented site estimate rather than an instrumented measurement, and no controlled before-and-after comparison was conducted. Any observed improvement is also confounded with the specific tooling in place at the study site, because exposure determination depends on the coverage and accuracy of Defender and Claroty xDome.
4.1.3. External Validity
The study reflects a single organizational setting with a particular vendor stack. Organizations without equivalent endpoint and operational technology telemetry could not implement the exposure-first optimization as described, which is the design feature that makes weekly-scale processing tractable. The architecture is portable in principle; the specific performance claim is not.
4.1.4. Reliability
Outputs depend on upstream feed availability and on the non-deterministic behavior of a large language model. The deterministic fallback chain constrains this variability by guaranteeing that every CVE resolves to a severity, but it does not guarantee that repeated runs on the same input produces identical scoring rationales. Reported action counts and workflow ordering are reproducible because they are read directly from the exported definitions.
4.1.5. Known Gaps and Future Work
Several limitations bound the study. The evaluation is analytical rather than experimental, because the time-savings figures derive from a documented per-CVE baseline rather than from a controlled before-and-after measurement. A formal time-and-motion study would strengthen the evidence [8]. The scoring layer depends on upstream feed quality and on Security Copilot output; although the deterministic fallback mitigates AI failure, it does not eliminate the risk of mis-categorization, a limitation consistent with broader findings on AI vulnerability tooling [9,14]. The artifact currently expresses priority as tiers rather than as the exact day-count matrix of BOD 26-04, and the computed tier does not yet propagate to the ServiceNow urgency and impact fields. Finally, the study reflects a single organizational setting, which limits generalizability.
Planned future work addresses these limitations. Five items are prioritized.
- Map computed risk to ServiceNow urgency and impact, which are currently set to a fixed default, so that the ticket record carries the same priority as the tracker.
- Codify the CISA day-count matrix as an explicit remediation-deadline field, so that SLA aging maps one-to-one to published timelines.
- Implement ServiceNow note synchronization and state-driven tracker closure.
- Add patch-compliance verification drawn from Altiris and Microsoft Configuration Manager.
- Introduce evidence-based automatic closures to complete the remediation lifecycle.
In addition, a multi-site evaluation and a controlled measurement study would test external validity and quantify effect size.
5. Conclusions
Artificial intelligence has measurably compressed the interval between vulnerability disclosure and exploitation, and industrialized disclosure now routinely exceeds human analytic capacity. Under these conditions, practitioners predictably underprioritize individual CVEs. Following the design science research paradigm, this study developed and evaluated an automated CVE ingestion, enrichment, prioritization, and tracking artifact aligned to the CISA BOD 26-04 risk model. Analytical evaluation indicates that the artifact displaces a manual burden that had become intractable, on the order of 50 analyst hours for a single weekly bulletin, while retaining an auditable prioritization rationale through deterministic safeguards and multi-source enrichment. The evidence is analytical rather than experimental, and the effect size remains to be measured. Grounded in federal policy, in peer-reviewed literature on exploit prediction, orchestration, and healthcare security, and in the author’s doctoral research on cybersecurity self-efficacy, the study demonstrates that governed automation can convert the force accelerating the threat into a durable defensive advantage.
6. Patents
No patent filings related to this artifact are referenced in the source materials provided.
Supplementary Materials
The following supporting information can be downloaded at the website of this
paper posted on Preprints.org. The source materials include the exported Logic Apps workflow definitions (CVE_v43_XDOME_DeviceList_CISA_perf.json,TRACKER_UPDATEv13_SharepointCopy.json, Monthly_report_w_secureScoreWORKING.json). If this manuscript is going to a journal or repository, decide whether sanitized versions of these files should be deposited alongside it (e.g., institutional repository, GitHub, OSF) and supply the link here in the form: “The following supporting information can be downloaded at: [URL], File S1: title; File S2: title.” If they are not for public release — consistent with the Data Availability Statement below — state that here instead.
Author Contributions
Conceptualization, methodology, software, validation, formal analysis, investigation, resources, data curation, writing—original draft preparation, writing—review and editing, visualization, supervision, and project administration, C.L.A. As sole author, C.L.A. performed all listed roles. The author has read and agreed to the published version of the manuscript.
Funding
This research received no specific grant from any funding agency in the public, commercial, or not-for-profit sectors.
Institutional Review Board Statement
The study analyzes public vulnerability data and system telemetry and does not involve human subjects; institutional review board approval was therefore not required.
Informed Consent Statement
Not applicable — no individual patient or human-subject data is reported in this manuscript.
Data Availability Statement
The public vulnerability sources cited (NVD, CISA KEV, MSRC CVRF) are available from their respective publishers. Workflow definitions and operational telemetry from the study site are not publicly released, because they would disclose internal security architecture. Sanitized structural summaries sufficient to reproduce the design are provided in Appendices A through G.
Acknowledgments
During the preparation of this manuscript, the author used AI-assisted writing tools for editing, reorganization, grammar review, clarity improvements, formatting, and structural refinement of the literature review and methodology sections. The author reviewed, verified, and edited all AI-assisted output and takes full responsibility for the content of this publication. Microsoft Security Copilot was not used to generate the findings, analysis, or conclusions reported in this paper; rather, it is a component of the evaluated artifact, described in Section 2.5. No AI-generated images, figures, charts, or graphical content are included in this manuscript; Figures 1 and 2 were generated from the data in Appendices H and I, and all architecture and workflow descriptions were derived from the author’s own implementation and exported workflow artifacts.
Conflicts of Interest
The author declares no conflicts of interest. The artifact described was developed by the author in the course of employment. No vendor named in this paper (Microsoft, Claroty, ServiceNow, or others) provided funding, review, or editorial input toward this manuscript. The author alone was responsible for the study design, data collection, analysis, interpretation, manuscript preparation, and decision to publish.
Abbreviations
The following abbreviations are used in this manuscript:
| Abbreviation | Full term |
| AEG | Automated Exploit Generation |
| AI | Artificial Intelligence |
| BOD | Binding Operational Directive |
| CISA | Cybersecurity and Infrastructure Security Agency |
| CVE | Common Vulnerabilities and Exposures |
| CVRF | Common Vulnerability Reporting Framework |
| CVSS | Common Vulnerability Scoring System |
| DSR | Design Science Research |
| EPSS | Exploit Prediction Scoring System |
| HIPAA | Health Insurance Portability and Accountability Act |
| KEV | Known Exploited Vulnerabilities (catalog) |
| KB | Knowledge Base |
| MSRC | Microsoft Security Response Center |
| MTTE | Mean Time to Exploit |
| NVD | National Vulnerability Database |
| SLA | Service Level Agreement |
| SOAR | Security Orchestration, Automation, and Response |
Appendix A. Workflow Structure Summary
Counts are enumerated from the exported workflow definitions and include actions nested within scopes, conditions, and loops. Connector endpoints are given by service rather than by tenant-specific address.
Appendix B. CVE Extraction Sequence
Logic App 1 applies the following ordered transformation to each inbound advisory. The sequence is reproduced structurally rather than verbatim.
- Ignore messages generated by the workflow itself, to prevent recursion.
- Capture the raw message body; extract hyperlink targets, bare URLs, and plain-text URLs; merge, filter, and de-duplicate the resulting URL set.
- Fetch each distinct linked page, so that identifiers reachable only behind generic link text are captured.
- Decode HTML entities; strip markup by splitting on tag delimiters and rejoining the residual text; normalize whitespace.
- Canonicalize Unicode dash variants and three separator forms to the CVE-YYYY-NNNNN pattern.
- Tokenize the normalized text, clean each token, filter to CVE-form tokens, and de-duplicate.
- Branch by advisory type: individual CVE, CISA Weekly Summary grouped by vendor, or Health-ISAC bulletin, each over a shared bulk pre-fetch.
Appendix C. Scoring and Deterministic Fallback
The following pseudocode reproduces the severity resolution logic. Three properties are notable: the KEV-plus-ransomware condition short-circuits the AI call entirely; the chain terminates in a fixed default so that no CVE can exit without a severity; and every downstream action is configured to run after success, failure, timeout, or skip of the Security Copilot step, so an AI outage degrades the rationale rather than halting the pipeline.
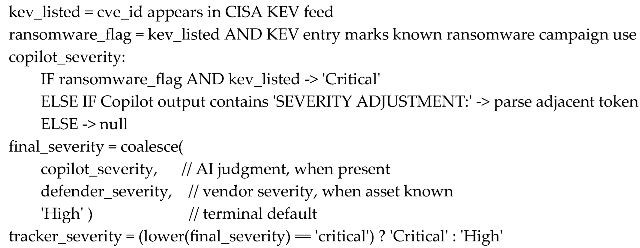
Note. The terminal default is deliberately set to a high rather than a low value, so that a scoring failure produces an over-escalation that a human will see, rather than an under-escalation that would pass unnoticed.
Appendix D. Signals Supplied to the Scoring Step
The prompt constructed for each CVE assembles the following fields and instructs the model not to rely on CVSS alone.
Appendix E. Tracker Schema
The SharePoint tracker is the shared system of record for all three workflows and the evidentiary basis for prioritization and deferral decisions. Reporting-facing columns are listed below; internal column identifiers are withheld.
Appendix F. Evaluation Calculation
The primary measure is computed as follows.
displaced_hours = cve_reference_count x manual_lookup_minutes_per_cve / 60
manual_lookup_minutes_per_cve = 3 // documented site baseline
40 CVEs -> 2 hours (routine daily volume)
500 CVEs -> 25 hours (typical CISA Weekly Summary)
1,000 CVEs -> 50 hours (larger CISA Weekly Summary)
Note. The baseline covers lookup only. It excludes triage, ticketing, communication, and remediation. The calculation estimates displaced effort under the counterfactual that every reference would otherwise be looked up manually; in practice, bulletins at the upper volumes were going unworked, which is the failure mode the artifact was built to address.
Appendix G. Operational Dataset Construction
The operational results in Section 3 are drawn from the artifact’s production run history rather than from a purpose-built experiment. This appendix documents how that dataset was constructed so that the figures in Table 6 and Table 7 can be interpreted and audited.
- Observation window. The dataset covers the deployed artifact operating on live production advisory traffic between May and July 2026. The three complete CISA Weekly Vulnerability Summary bulletins processed end to end are the weeks of June 8, June 22, and July 6, 2026.
- Inclusion criteria. A record was included only if it originated from one of the three complete CISA Weekly Summary bulletins processed within the window and completed the full extract-enrich-score-track path. Partial runs, test runs, and bulletins processed outside the window were excluded.
- Run identifiers. Each included bulletin corresponds to a distinct Logic App run recorded in the CVE_Summary run history. Runs are referenced by sanitized labels (the bulletin week) rather than by tenant-specific run identifiers.
- Deduplication rule. CVE references were canonicalized to the CVE-YYYY-NNNNN form (Appendix B) and de-duplicated within each bulletin on the canonical identifier. A CVE appearing in more than one weekly bulletin is counted once per bulletin, because each bulletin is treated as an independent processing event.
- Definition of a unique CVE reference. One canonical CVE identifier extracted from a bulletin after normalization and within-bulletin de-duplication. The aggregate figure of 5,216 is the sum of the three per-bulletin unique-reference counts (1,783 + 1,918 + 1,515).
- Definition of an environment-relevant finding. A CVE matched to at least one asset with active exposure confirmed in Microsoft Defender Advanced Hunting or Claroty xDome at the time of processing. The aggregate of 534 is the sum of the three per-bulletin relevant-finding counts (391 + 53 + 90).
- Timing of telemetry evaluation. Defender and xDome exposure were evaluated at ingestion time, which is also why a small count drift can occur between repeated evaluations (Section 3.4.2).
- Vendor-group records versus individual CVE records. Group records are a reporting convenience and are not counted as CVEs; the CVE counts and the group counts are maintained as separate fields in the tracker (Appendix E).
- Frozen versus dynamic dataset. The per-bulletin counts reported in Section 3 are a frozen snapshot of the run history for the three processed bulletins; the production tracker itself remains a live, dynamic system of record.
Appendix H. Data Note for Figure 1
Annual volume of published CVEs, 2019 through 2025. This note gives every value plotted in Figure 1, the source of each value, and the arithmetic behind each figure derived.
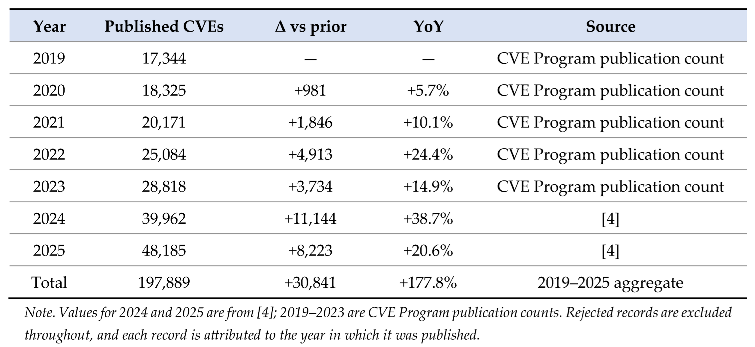
How the figures are derived. Year-over-year growth is (current year − prior year) ÷ prior year. Headline 2024 → 2025 increase: (48,185 − 39,962) ÷ 39,962 ≈ 20.6%. Total growth 2019 → 2025: (48,185 − 17,344) ÷ 17,344 ≈ 177.8%, i.e., 2025 volume is about 2.78× the 2019 level. Compound annual growth rate over six steps: (48,185 ÷ 17,344) ^(1/6) − 1 ≈ 18.6%. Seven-year total published records: 197,889.
Appendix I. Data Note for Figure 2
Estimated mean time to exploit (MTTE), 2018 through 2025. This note gives every value plotted in Figure 2, its basis, and the interpretation of the trend.
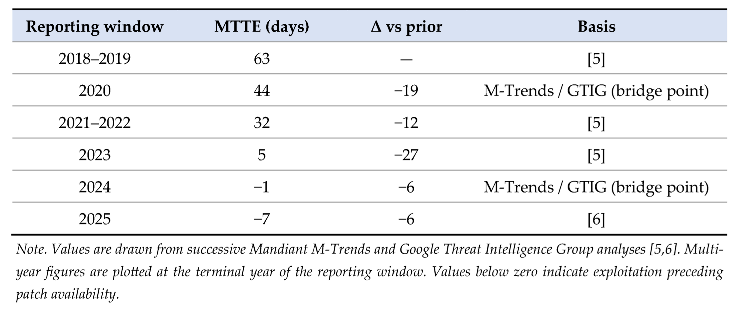
How to read the trend. MTTE falls from 63 days (2018–2019) to −7 days (2025), a drop of 70 days across the series (roughly 11–12 days per year). The series passes through zero between 2023 (+5) and 2024 (−1); from that point, average exploitation precedes patch availability. Because the series changes sign, a percentage change is undefined across the crossing, so the decline is reported in absolute days.
References
- Beddies, C.; Eylert, B.; Kubica, S. The necessity of secure IT infrastructures in healthcare through AI vulnerability analysis. In Mechanisms and Machine Science; Springer: Cham, Switzerland, 2024; Vol. 162, pp. 298–310. [Google Scholar] [CrossRef]
- Heinl, P.; Patapovas, A.; Pilgermann, M. Towards AI-enabled cyber threat assessment in the health sector. arXiv 2024, arXiv:2409.12765. [Google Scholar] [CrossRef]
- Islam, S.; Abba, A.; Ismail, U.; Mouratidis, H.; Papastergiou, S. Vulnerability prediction for secure healthcare supply chain service delivery. Integr. Comput.-Aided Eng. 2022, 29, 389–409. [Google Scholar] [CrossRef]
- Gamblin, J. 2025 CVE Data Review. 2026. Available online: https://jerrygamblin.com/2026/01/01/2025-cve-data-review/ (accessed on 25 July 2026).
- Charrier, C.; Weiner, R. How Low Can You Go? An Analysis of 2023 Time-to-Exploit Trends; Mandiant, Google Cloud: 15 October 2024. Available online: https://cloud.google.com/blog/topics/threat-intelligence/time-to-exploit-trends-2023 (accessed on 25 July 2026).
- Mandiant. M-Trends 2026: Data, Insights, and Strategies from the Frontlines; Google Cloud, 2026. Available online: https://cloud.google.com/blog/topics/threat-intelligence/m-trends-2026 (accessed on 25 July 2026).
- Cybersecurity and Infrastructure Security Agency. Binding Operational Directive 26-04: Prioritizing Security Updates Based on Risk; U.S. Department of Homeland Security, 2026. Available online: https://www.cisa.gov/news-events/directives/bod-26-04-prioritizing-security-updates-based-risk (accessed on 25 July 2026).
- Hevner, A.R.; March, S.T.; Park, J.; Ram, S. Design science in information systems research. MIS Q. 2004, 28, 75–105. [Google Scholar] [CrossRef]
- Malkawi, M.; Alhajj, R. AI-powered vulnerability detection and patch management in cybersecurity: A systematic review of techniques, challenges, and emerging trends. Mach. Learn. Knowl. Extr. 2026, 8, 19. [Google Scholar] [CrossRef]
- Mohammed, M.Q.; Jaaz, Z.A. A comprehensive review of predictive vulnerability prioritization using AI. Int. J. Comput. Electron. Asp. Eng. 2026, 7, 27–44. [Google Scholar] [CrossRef]
- Nobles, C. Stress, burnout, and security fatigue in cybersecurity: A human factors problem. HOLISTICA J. Bus. Public Adm. 2022, 13, 49–72. [Google Scholar] [CrossRef]
- Tariq, S.; Baruwal Chhetri, M.; Nepal, S.; Paris, C. Alert fatigue in security operations centres: Research challenges and opportunities. ACM Comput. Surv. 2025, 57, 224. [Google Scholar] [CrossRef]
- Huber, R. CISA BOD 26-04: Frequently Asked Questions About the New Risk-Based Patching Directive. Tenable, 11 June 2026. Available online: https://www.tenable.com/blog/cisa-bod-26-04-FAQ-vulnerability-remediation-impact (accessed on 25 July 2026).
- Kaniewski, S.; Schmidt, F.; Enzweiler, M.; Menth, M.; Heer, T. A systematic literature review on detecting software vulnerabilities with large language models. arXiv 2025, arXiv:2507.22659. [Google Scholar] [CrossRef]
- Verizon. 2026 Data Breach Investigations Report; Verizon Business, 2026. [Google Scholar]
- Hilario, E.; Azam, S.; Sundaram, J.; Imran Mohammed, K.; Shanmugam, B. Generative AI for pentesting: The good, the bad, the ugly. Int. J. Inf. Secur. 2024, 23, 2075–2097. [Google Scholar] [CrossRef]
- Ferrag, M.A.; Alwahedi, F.; Battah, A.; Cherif, B.; Mechri, A.; Tihanyi, N.; Bisztray, T.; Debbah, M. Generative AI in cybersecurity: A comprehensive review of LLM applications and vulnerabilities. Internet Things Cyber-Phys. Syst. 2025, 5, 1–46. [Google Scholar] [CrossRef]
- Ginige, Y.; Niroshan, A.; Jain, S.; Seneviratne, S. AutoPenTester: An LLM agent-based framework for automated penetration testing. In Proceedings of the 24th IEEE International Conference on Trust, Security and Privacy in Computing and Communications; IEEE, 2025; pp. 163–174. [Google Scholar]
- Benson, D.; Panchev, C. Leveraging large language models in post-exploitation: Navigating the cyber kill chain with AI-driven tactics. In Computer Security: ESORICS 2025 International Workshops; Lecture Notes in Computer Science; Laborde, R., et al., Eds.; Springer, 2026; Vol. 16233. [Google Scholar] [CrossRef]
- Chen, J.; Hu, S.; Zheng, H.; Xing, C.; Zhang, G. GAIL-PT: An intelligent penetration testing framework with generative adversarial imitation learning. Comput. Secur. 2023, 126, 103055. [Google Scholar] [CrossRef]
- Jin, D.; Fu, Q.; Li, Y. Good news for script kiddies? Evaluating large language models for automated exploit generation. arXiv 2025, arXiv:2505.01065. [Google Scholar] [CrossRef]
- Peng, W.; Ye, L.; Du, X.; Zhang, H.; Zhan, D.; Zhang, Y.; Guo, Y.; Zhang, C. PwnGPT: Automatic exploit generation based on large language models. In Proceedings of the 63rd Annual Meeting of the Association for Computational Linguistics; ACL, 2025; pp. 11–29. Available online: https://aclanthology.org/2025.acl-long.562/.
- Fang, R.; Bindu, R.; Gupta, A.; Kang, D. LLM agents can autonomously exploit one-day vulnerabilities. arXiv 2024, arXiv:2404.08144. [Google Scholar] [CrossRef]
- Jacobs, J.; Romanosky, S.; Edwards, B.; Adjerid, I.; Roytman, M. Exploit Prediction Scoring System (EPSS). Digit. Threat. Res. Pract. 2021, 2, 20. [Google Scholar] [CrossRef]
- Le, T.H.M.; Chen, H.; Babar, M.A. A survey on data-driven software vulnerability assessment and prioritization. ACM Comput. Surv. 2023, 55, 100. [Google Scholar] [CrossRef]
- Aljahdali, A.O.; Alsulami, R. Streamlining threat response and automating critical use cases with security orchestration, automation and response (SOAR). J. Digit. Secur. Forensics 2025, 2, 36–57. [Google Scholar] [CrossRef]
- Ismail; Kurnia, R.; Brata, Z.A.; Nelistiani, G.A.; Heo, S.; Kim, H.; Kim, H. Toward robust security orchestration and automated response in security operations centers with a hyper-automation approach using agentic artificial intelligence. Information 2025, 16, 365. [Google Scholar] [CrossRef]
- Cybersecurity and Infrastructure Security Agency. BOD 26-04: Implementation Guidance for Prioritizing Security Updates Based on Risk; U.S. Department of Homeland Security, 2026. Available online: https://www.cisa.gov/news-events/directives/bod-26-04-implementation-guidance-prioritizing-security-updates-based-risk (accessed on 25 July 2026).
- Cybersecurity and Infrastructure Security Agency. CISA Issues New Directive Improving How Federal Agencies Prioritize the Mitigation of Cyber Vulnerabilities [Press release]; U.S. Department of Homeland Security, 10 June 2026. [Google Scholar]
- Jalalvand, F.; Baruwal Chhetri, M.; Nepal, S.; Paris, C. Alert prioritisation in security operations centres: A systematic survey on criteria and methods. ACM Comput. Surv. 2025, 57, 156. [Google Scholar] [CrossRef]
- Bandura, A. Self-Efficacy: The Exercise of Control; W. H. Freeman: New York, NY, USA, 1997. [Google Scholar]
- Venable, J.; Pries-Heje, J.; Baskerville, R. FEDS: A framework for evaluation in design science research. Eur. J. Inf. Syst. 2016, 25, 77–89. [Google Scholar] [CrossRef]
- Landis, J.R.; Koch, G.G. The measurement of observer agreement for categorical data. Biometrics 1977, 33, 159–174. [Google Scholar] [CrossRef]
- Cohen, J. A coefficient of agreement for nominal scales. Educ. Psychol. Meas. 1960, 20, 37–46. [Google Scholar] [CrossRef]
- Gwet, K.L. Computing inter-rater reliability and its variance in the presence of high agreement. Br. J. Math. Stat. Psychol. 2008, 61, 29–48. [Google Scholar] [CrossRef] [PubMed]
- Wilcoxon, F. Individual comparisons by ranking methods. Biom. Bull. 1945, 1, 80–83. [Google Scholar] [CrossRef]
Figure 1.
Annual volume of published CVEs, 2019 through 2025. Data sheet: Appendix H. Note. Values for 2024 and 2025 are from [4]; earlier years are drawn from CVE Program publication counts for the corresponding year. Counts exclude rejected records.
Figure 1.
Annual volume of published CVEs, 2019 through 2025. Data sheet: Appendix H. Note. Values for 2024 and 2025 are from [4]; earlier years are drawn from CVE Program publication counts for the corresponding year. Counts exclude rejected records.
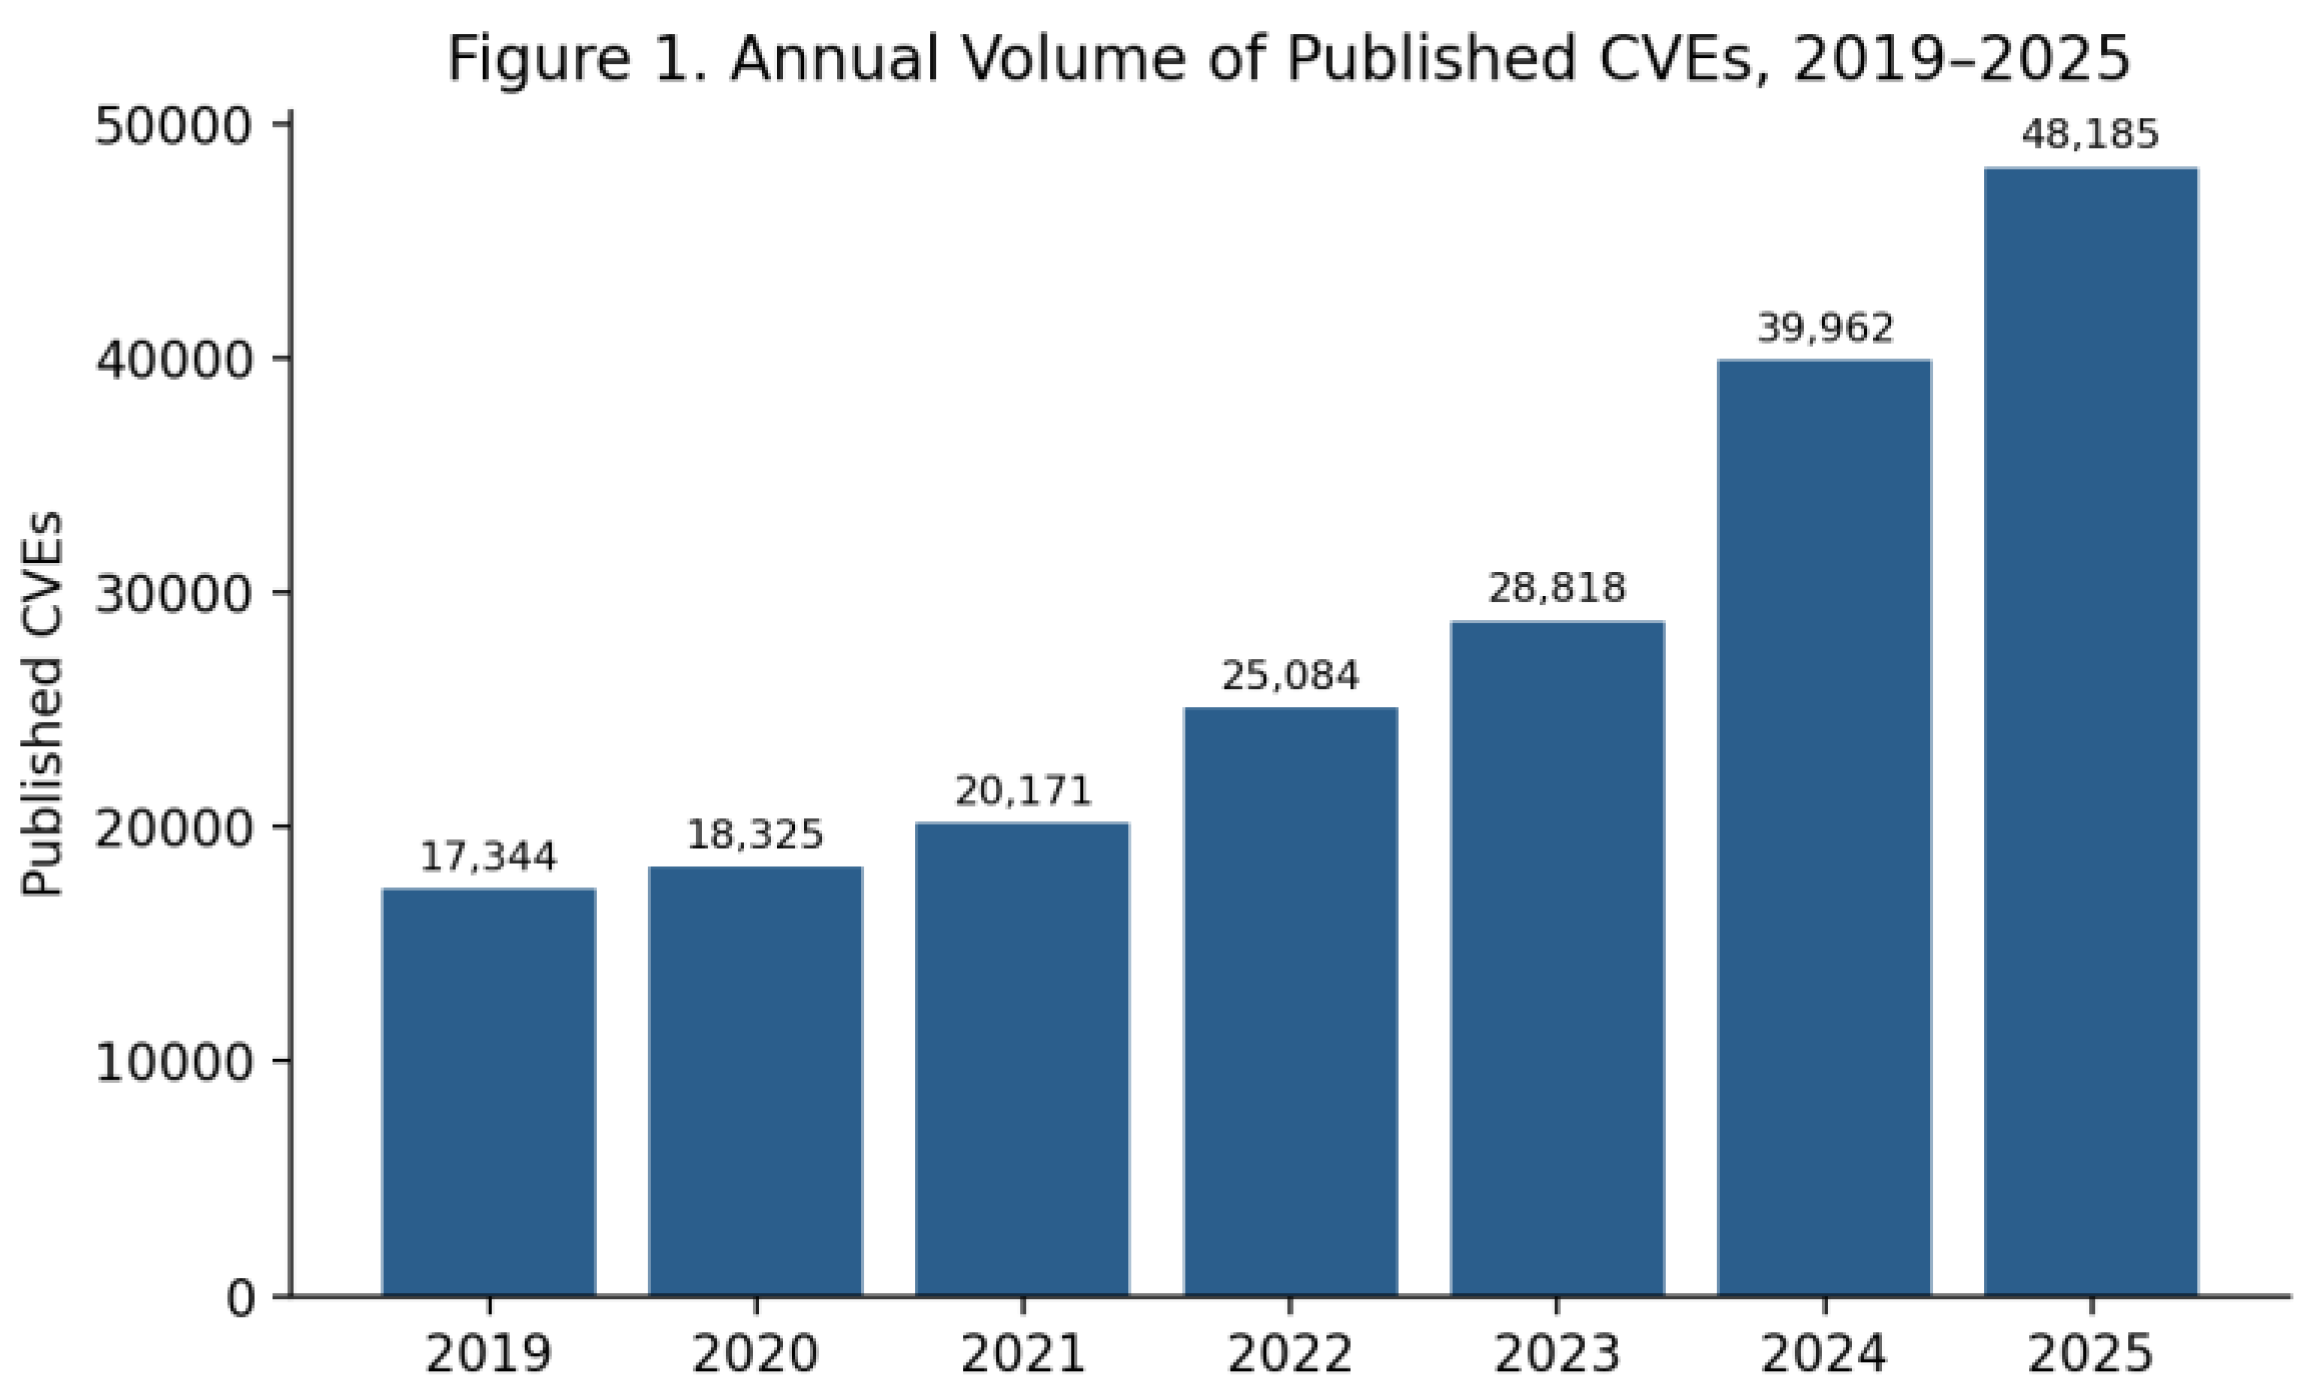
Figure 2.
Estimated mean time to exploit, 2018 through 2025. Data sheet: Appendix I. Note. Values are drawn from successive Mandiant M-Trends and Google Threat Intelligence Group analyses [5,6]. Multi-year figures are plotted at the terminal year of the reporting window. Values below zero indicate exploitation preceding patch availability.
Figure 2.
Estimated mean time to exploit, 2018 through 2025. Data sheet: Appendix I. Note. Values are drawn from successive Mandiant M-Trends and Google Threat Intelligence Group analyses [5,6]. Multi-year figures are plotted at the terminal year of the reporting window. Values below zero indicate exploitation preceding patch availability.
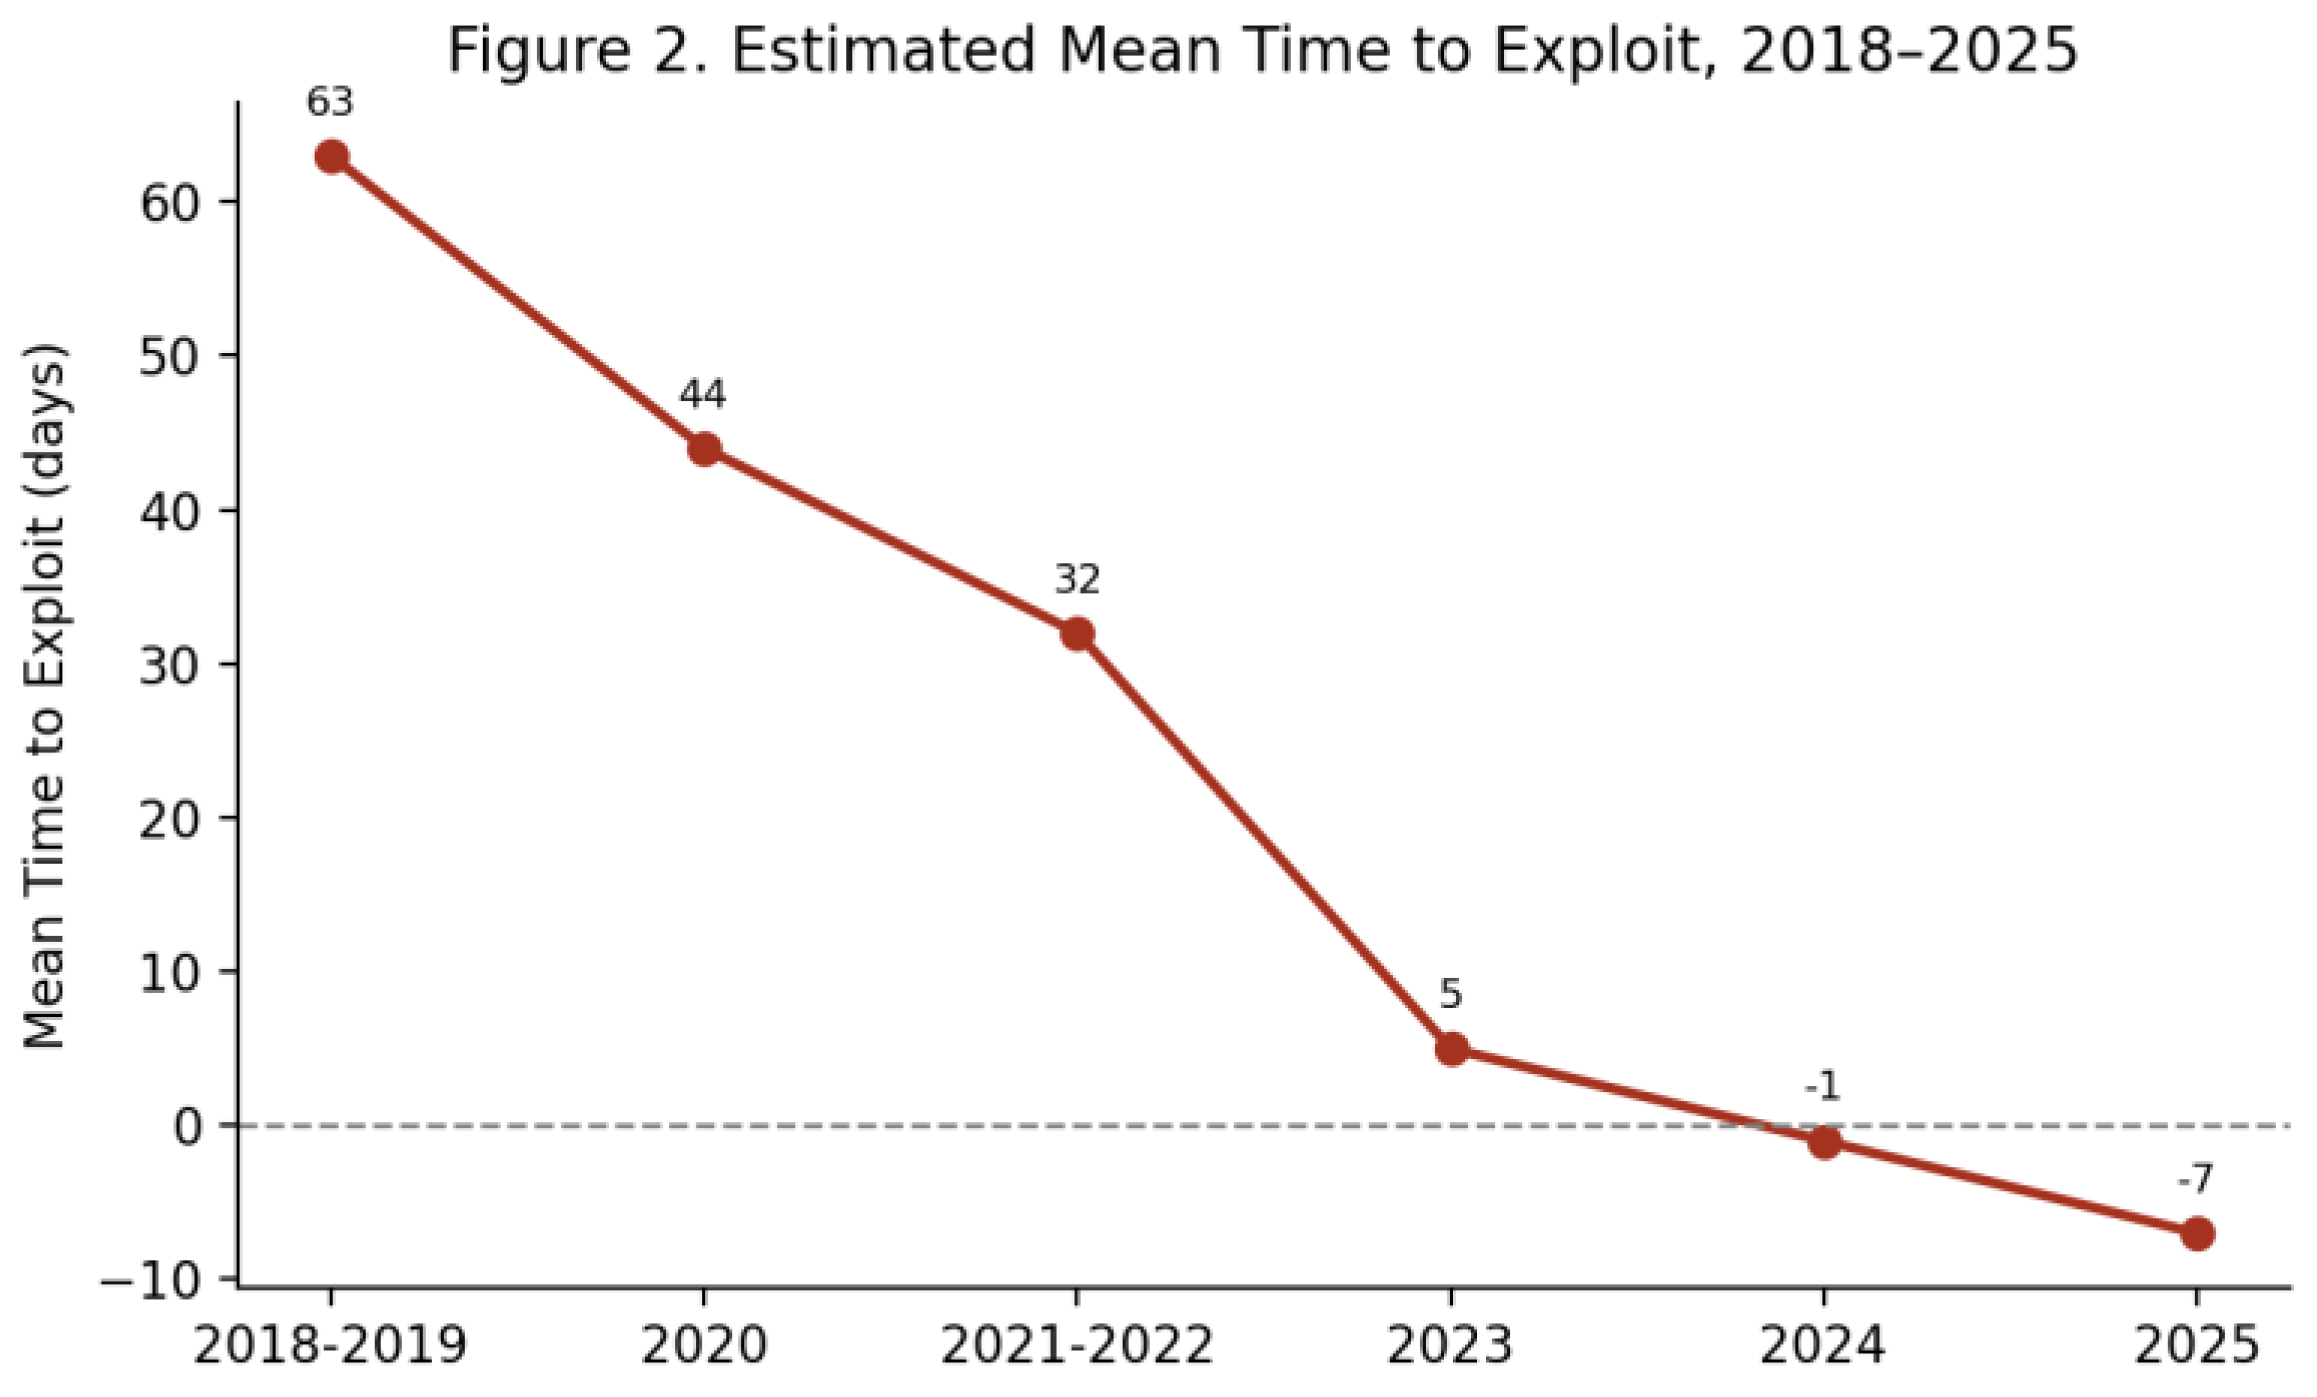
Figure 3.
Architecture of the three-application automated CVE pipeline. Note. Action counts are enumerated directly from the exported Logic App workflow definitions, including actions nested within scopes, conditions, and loops.
Figure 3.
Architecture of the three-application automated CVE pipeline. Note. Action counts are enumerated directly from the exported Logic App workflow definitions, including actions nested within scopes, conditions, and loops.
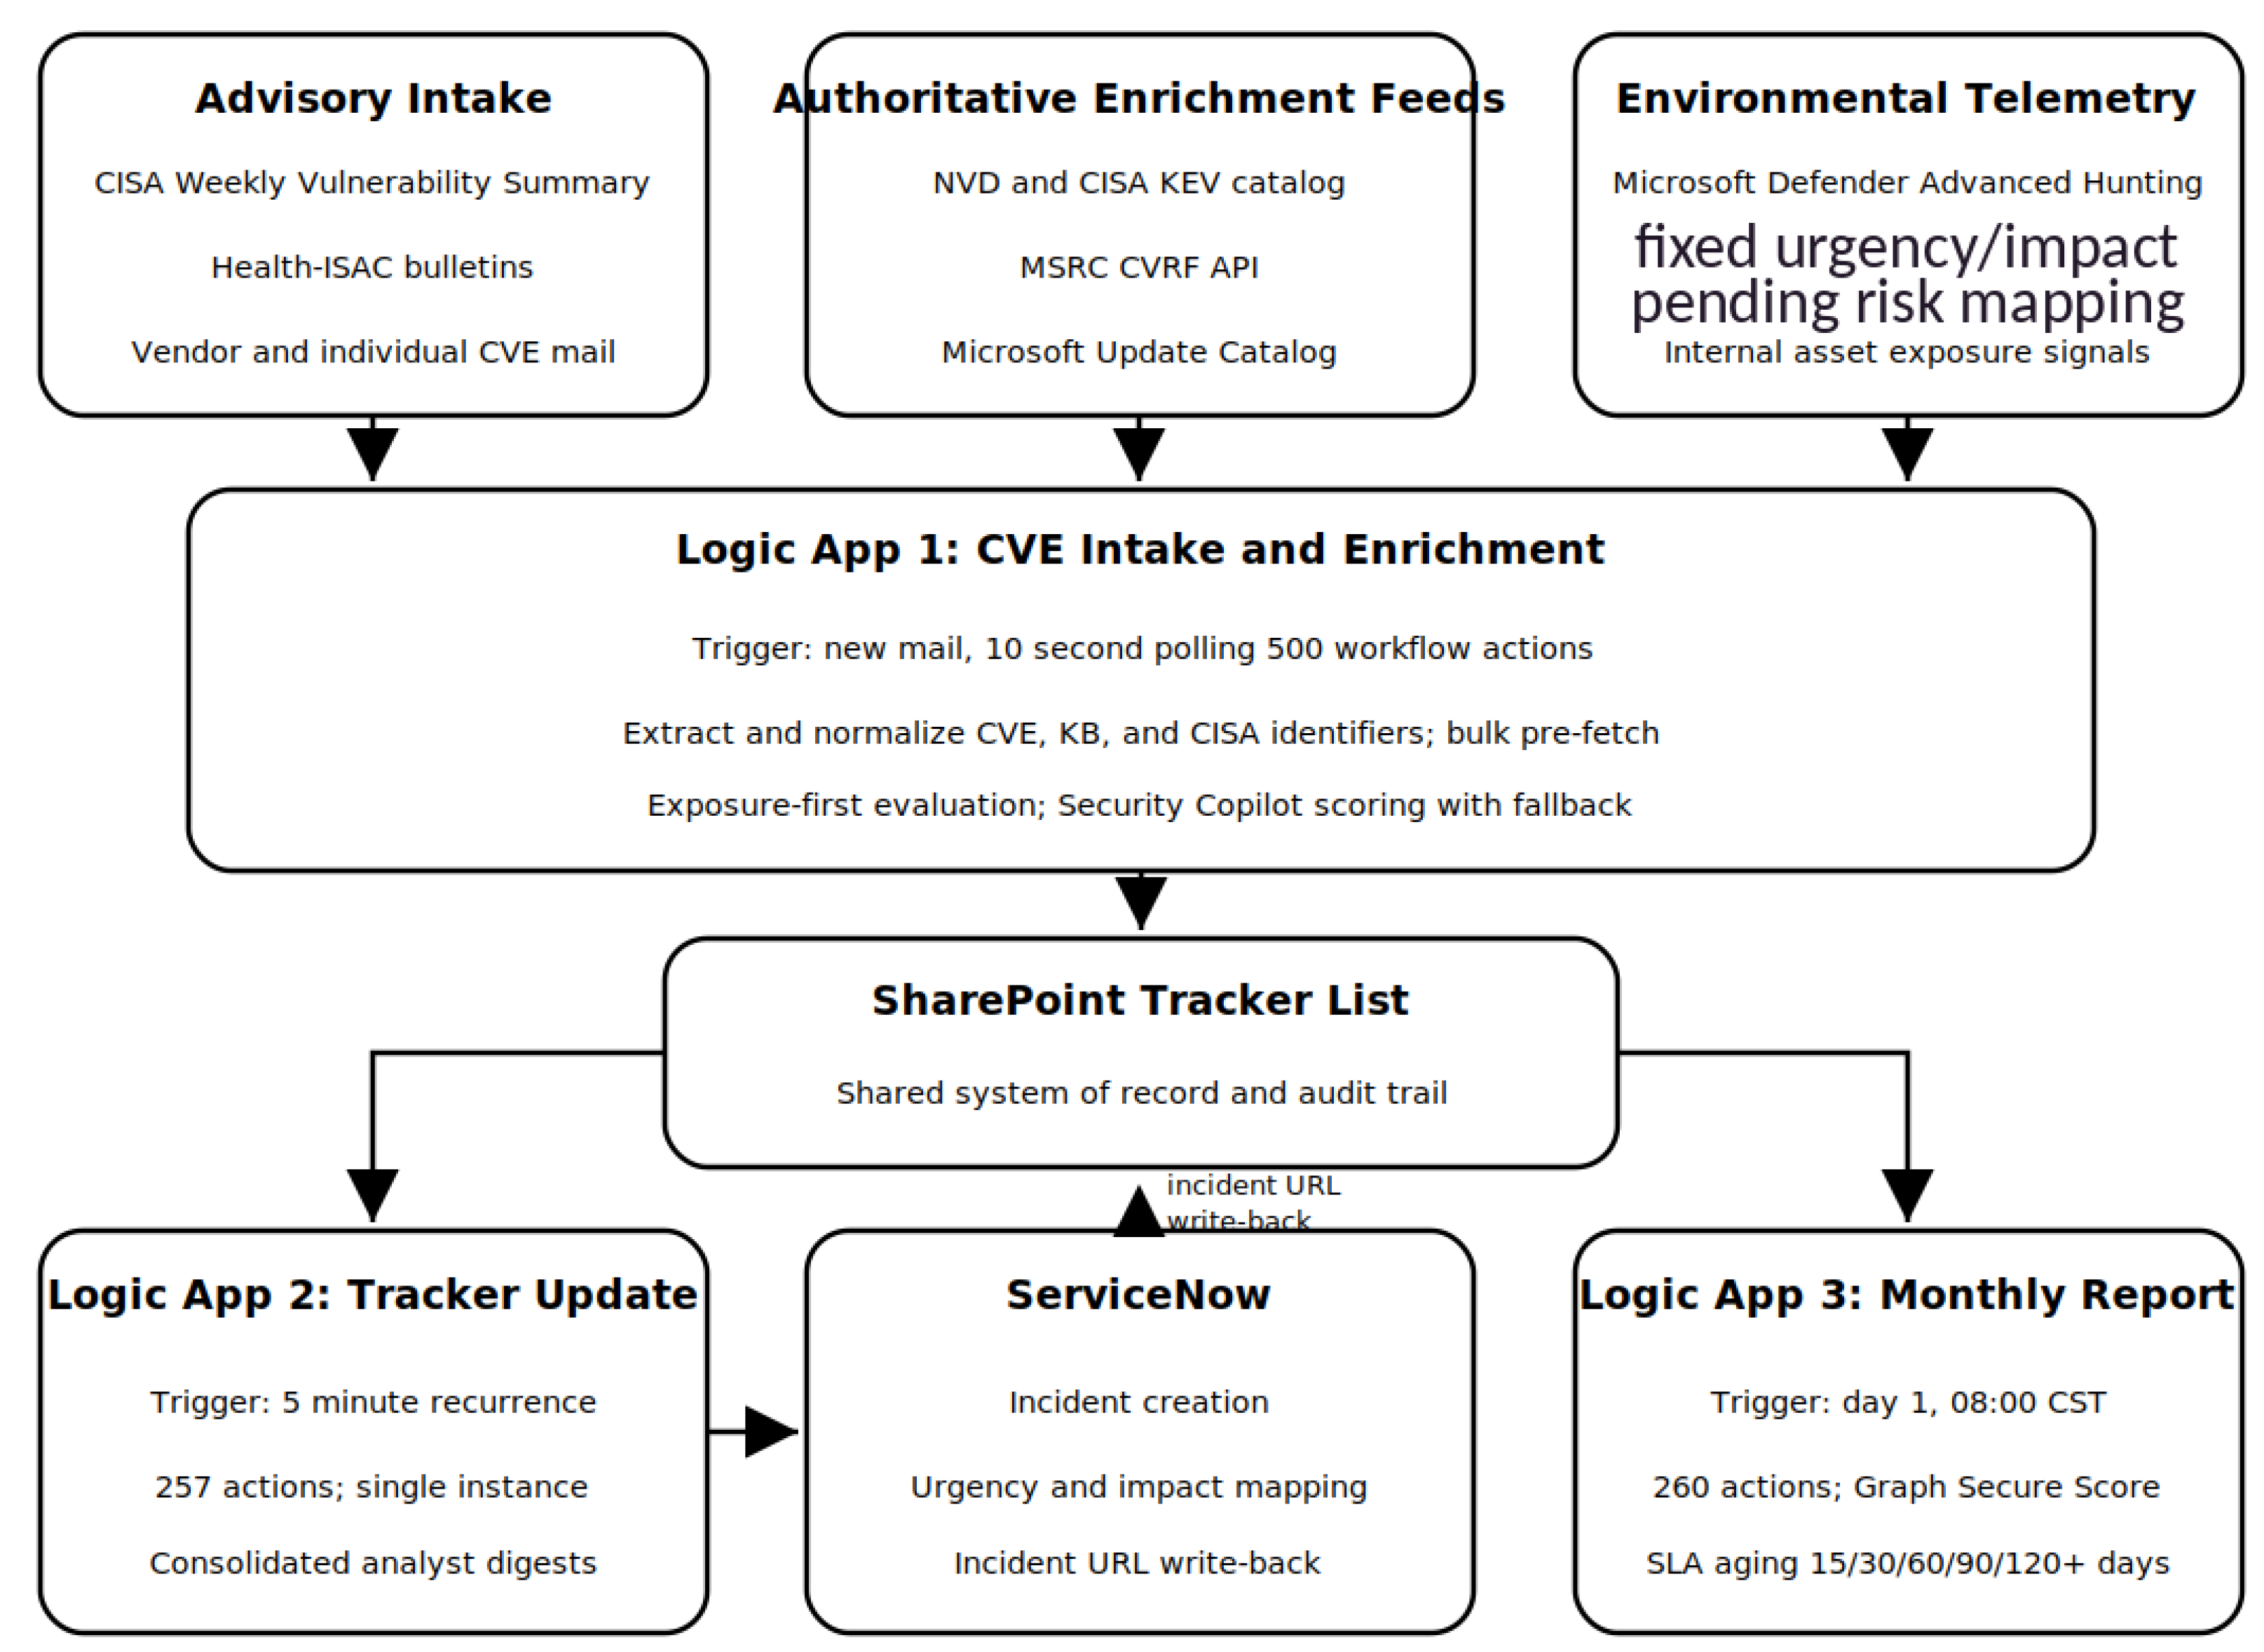
Table 1.
Mapping the study to the design science research guidelines of Hevner et al. [8].
Table 1.
Mapping the study to the design science research guidelines of Hevner et al. [8].
| Design science guideline | How this study addresses it |
|---|---|
| Design as an artifact | A three-application Azure Logic Apps pipeline for CVE ingestion, enrichment, prioritization, and tracking (Section 2.5). |
| Problem relevance | An AI-accelerated, volume-driven prioritization gap in healthcare vulnerability management (Section 2.3). |
| Design evaluation | Analytical evaluation against a documented baseline of three minutes per CVE lookup (Section 3). |
| Research contributions | A replicable artifact instantiation and its explicit alignment to the BOD 26-04 risk model (Sections 2.5 through 4). |
| Research rigor | Grounding in peer-reviewed prioritization, orchestration, and healthcare security literature (Section 2.1). |
| Design as a search process | Iterative refactoring for scale, including the exposure-first optimization introduced on the weekly path (Section 2.5.6). |
| Communication of research | This white paper, structured for both technical and managerial audiences. |
Table 2.
Traceability from problem to requirement to design feature.
| Requirement | Source | Design feature | Supports |
|---|---|---|---|
| Identify CVE references in unstructured advisories | Advisory workload | Logic App 1 decomposes the message into hyperlinks, raw and plain-text URLs, fetches linked pages, normalizes Unicode separators, then tokenizes and de-duplicates | RQ2 |
| Determine whether a CVE affects the environment | BOD 26-04 asset exposure | Defender Advanced Hunting and Claroty xDome device queries establish exposure from internal telemetry rather than from the advisory | RQ2 |
| Avoid spending enrichment cycles on non-affecting CVEs | Weekly-scale runtime limits | Exposure-first ordering; scope and KB lookups execute only for CVEs with confirmed affected assets | RQ2 |
| Weight real-world exploitability over intrinsic severity | Exploit prediction literature; BOD 26-04 exploit automation | KEV status, EPSS probability, and NVD exploitability are supplied to Security Copilot with an explicit instruction not to rely on CVSS alone | RQ1, RQ2 |
| Resolve every CVE as a priority even when AI is unavailable | Reliability concerns in AI security tooling | Deterministic fallback chain with a terminal default; downstream actions execute after success, failure, timeout, or skip | RQ2 |
| Preserve an audit trail for prioritization and deferral | BOD 26-04 documentation obligation | SharePoint tracker as system of record, incident URL write-back, row claiming, deduplication, and SLA aging in the monthly report | RQ2 |
Table 5.
Artifact-to-research-question traceability.
| Question | Evidence used | Artifact element | Finding |
|---|---|---|---|
| RQ1 | Published CVE volume; mean time to exploit; peer-reviewed work on AI exploit generation; alert fatigue literature | Problem framing and the decision to treat exploit automatability as a changing rather than fixed property | AI and industrialized disclosure together produce a workload and prioritization failure mode, not merely a larger queue |
| RQ2 | Documented manual lookup baseline; workflow action counts and ordering; task reallocation; BOD 26-04 factor mapping | Logic Apps 1 through 3, the tracker, exposure-first ordering, Copilot scoring with deterministic fallback | The artifact displaces lookup effort and retains a documented prioritization rationale, with the ticketing gap noted in Section 4.1 |
Note. Findings for RQ2 rest on analytical estimation and on inspection of the workflow definition. They do not rest on measured before-and-after productivity data.
Disclaimer/Publisher’s Note: The statements, opinions and data contained in all publications are solely those of the individual author(s) and contributor(s) and not of MDPI and/or the editor(s). MDPI and/or the editor(s) disclaim responsibility for any injury to people or property resulting from any ideas, methods, instructions or products referred to in the content. |
© 2026 by the authors. Licensee MDPI, Basel, Switzerland. This article is an open access article distributed under the terms and conditions of the Creative Commons Attribution (CC BY) license (http://creativecommons.org/licenses/by/4.0/).
Copyright: This open access article is published under a Creative Commons CC BY 4.0 license, which permit the free download, distribution, and reuse, provided that the author and preprint are cited in any reuse.