Preprint
Article

This version is not peer-reviewed.

Papillary Thyroid Carcinoma with Terminal Immune Exhaustion Phenotype Correlates with Increased Risk of Lymph Node Metastasis: A Combined Flow Cytometry and TCGA Validation Study

  † These authors contributed equally to this work

Submitted:

30 July 2026

Posted:

31 July 2026

You are already at the latest version

Abstract

Background: Papillary thyroid carcinoma (PTC) is the most common thyroid malignancy, with lymph node metastasis (LNM) being a key predictor of recurrence and poor prognosis. Preoperative detection of LNM remains challenging due to the limitations of imaging modalities, leading to inadequate surgical resection in 20-30% of patients. While immune checkpoint molecules have been implicated in PTC progression, the heterogeneity of CD8+ T cell exhaustion subsets and their specific association with LNM remain poorly defined. Herein, we aimed to characterize the distinct immune landscape of PTC prone to LNM, with a focus on terminal immune exhaustion, to improve risk stratification and therapeutic strategies. Methods: Fresh PTC tissues from 40 patients (22 LNM-positive, 18 LNM-negative) were analyzed by flow cytometry (FCM) to quantify immune cell subsets, inflammatory cytokines, and chemokines. Immunohistochemistry (IHC) validated CD45+ immune cell infiltration. Transcriptomic and clinical data from 448 PTC patients in The Cancer Genome Atlas (TCGA-PTC) cohort were used for bioinformatic validation, including Gene Set Variation Analysis (GSVA) of terminal exhaustion gene signatures. Results: LNM-positive PTC exhibited a unique inflammatory milieu with significantly elevated IL-6, IL-1ra, CCL5, and IL-9 levels (all p<0.05) in tumor interstitial fluid. FCM analysis revealed that LNM-positive PTC had increased infiltration of total CD45+ immune cells, CD3+ T cells, and CD3+CD8+ T cells (all p<0.05). Critically, terminally exhausted PD-1hiTIM-3+ CD8+ T cells were significantly enriched in LNM-positive PTC (p=0.022) and positively correlated with extrathyroidal extension (p=0.044). Additionally, LNM risk was associated with increased CD4+ regulatory T (Treg) cell frequency (p=0.023) and elevated CTLA-4 expression on CD4+ T cells (p=0.047). In TCGA-PTC validation, the terminal exhaustion gene signature was predominantly enriched in LNM-positive (p<0.0001) and advanced-stage PTC (p<0.001), and strongly correlated with BRAF V600E mutation (p<0.0001)—the most common oncogenic driver in aggressive PTC. Conclusion: Our findings identify a terminal immune exhaustion phenotype (characterized by PD-1hiTIM-3+ CD8+ T cells and Treg enrichment) as a key feature of LNM-prone PTC. This phenotype is conserved across clinical samples and TCGA datasets, linking BRAF V600E mutation to immune suppression and metastatic potential. These insights provide a novel immune-based biomarker for LNM risk stratification and support the potential of combining anti-PD-1/TIM-3 therapy with BRAF inhibitors for high-risk PTC.

Keywords: 
;  ;  ;  

1. Introduction

Thyroid cancer incidence has increased globally by ~5% annually over the past decades, with PTC accounting for 80-90% of cases [1,2]. While PTC generally has a favorable prognosis, LNM occurs in 30-50% of patients and is associated with a 2- to 3-fold higher recurrence rate and reduced disease-free survival [3,4]. Ultrasound and computed tomography (CT) have limited sensitivity for detecting occult LNM, leading to understaging and incomplete lymph node dissection [5,6]. Thus, identifying reliable biomarkers for LNM risk is crucial to optimize surgical planning and reduce recurrence.
The tumor microenvironment (TME) plays a pivotal role in PTC progression, with immune cell infiltration being a key determinant of metastatic potential [7]. CD8+ cytotoxic T cells are critical for antitumor immunity, but persistent antigen stimulation drives their differentiation into exhausted subsets characterized by impaired cytotoxicity and overexpression of checkpoint molecules [8]. Recent studies highlight the heterogeneity of exhausted CD8+ T cells: stem-like PD-1intTCF1+ cells retain proliferative potential and responsiveness to immunotherapy, while terminally exhausted PD-1hiTIM-3+ cells are functionally irreparable and associated with poor outcomes in solid tumors [9,10]. However, in PTC, most studies have focused on total PD-1+ CD8+ T cells without distinguishing exhaustion subsets [11,12], and their specific role in LNM remains unclear.
Regulatory T (Treg) cells, defined by CD4+CD25hiCD127loFOXP3+ expression, suppress effector T cell function and promote immune evasion [13]. Previous reports show increased Treg infiltration in PTC, but their correlation with LNM and crosstalk with exhausted CD8+ T cells are not fully elucidated [14,15]. Additionally, BRAF V600E mutation—present in 40-60% of PTC—drives tumor proliferation and is associated with aggressive features [16]. Emerging evidence suggests that BRAF V600E may modulate the TME by upregulating immune checkpoint molecules [12,17], but its link to terminal immune exhaustion and LNM is unproven.
In this study, we integrated FCM, IHC, cytokine profiling, and TCGA transcriptomic analysis to characterize the immune landscape of LNM-prone PTC. We hypothesized that terminal immune exhaustion (PD-1hiTIM-3+ CD8+ T cells) and Treg enrichment constitute a distinct phenotype driving LNM. Our findings provide novel insights into the immunopathogenesis of PTC metastasis and identify potential biomarkers for risk stratification and targeted immunotherapy.

2. Materials and Methods

2.1. Patients and Study Design

This retrospective study was conducted at the National Cancer Center/Cancer Hospital, Chinese Academy of Medical Sciences. Consecutive treatment-naive PTC patients who underwent partial/total thyroidectomy and lymph node dissection between June 2023 and August 2023 were enrolled. Inclusion criteria: (1) histopathologically confirmed PTC; (2) no prior head and neck surgery/radiotherapy; (3) no distant metastasis or other malignancies; (4) complete clinical and follow-up data. Exclusion criteria: (1) preoperative immunotherapy/chemotherapy; (2) inadequate tissue samples for FCM/IHC. All patients underwent central lymph node dissection, and therapeutic lateral lymph node dissection was performed for patients with cytologically confirmed lateral LNM (NCCN Guidelines for Thyroid Carcinoma, 2023). LNM was defined by histopathological examination, and TNM staging followed the AJCC 8th edition. This study was approved by the ethics committee of the Cancer Hospital of Chinese Academy of Medical Sciences (reference number: NCC2016ST-23). Informed consent was obtained from all participants.

2.2. Flow Cytometry (FCM)

Tumor tissues were collected after the tumors were surgically removed and soaked into a DMEM medium containing 2% fetal bovine. Within 30 minutes after tissue collection, the single cell suspension of each independent tumor tissue was prepared by using a tissue digestion solution containing collagenase IV as we reported previously [18]. The cells were stained with fluorochrome-conjugated antibodies (CD45, CD3, CD8, CD25, CD127,PD-1,TIM-3 and CTLA-4) with a standard laboratory protocol as we reported previously [19]. Data were acquired in LSR-II (BD, CA, USA) and analyzed with Flowjo software (Tree Star, OR, USA). Antibodies used are provided in Supplementary Table S1.

2.3. Immunohistochemistry (IHC)

Standard laboratory protocols are used for immunohistochemistry staining as we reported previously [18]. The paraffin-embedded issues were cut into 4μm sections. The slides were incubated with the primary antibody to human CD45 (clone 4E9B2, Proteintech) at 4°C overnight, and were visualized by DAB stain system (Zhongshan Jinqiao, Beijing). Slides were scanned with Aperio ScanScope software (Aperio Technologies). The primary antibody was omitted for the negative controls. Three representatives randomly chosen fields at 200× magnification per core were used for positive cells evaluation. The cell counts were recorded as cells/mm2, and the average value was adopted.

2.4. Cytokine and Chemokine Quantification

Tumor interstitial fluid was prepared and total protein were measured as we reported previously [19]. Cytokines and chemokines (IL-6, IL-1ra, CCL5, IL-9, IL-10, IL-8) were quantified by Luminex Multi-factor Detection Platform, following the manufacturer’s protocol (M500KCAF0Y, BIO-RAD) on the instrument of X-200, Luminex, USA. The levels of specified inflammatory cytokines or chemokines were calculated based on the total protein of interstitial fluid.

2.5. Bioinformatic Analysis

Transcriptomic (RNA-seq) and clinical data for 448 PTC patients (TCGA-PTC) were downloaded from the Genomic Data Commons (GDC) Portal(https://portal.gdc.cancer.gov/) in June 2023. A terminal exhaustion gene signature was constructed based on previously validated markers: PDCD1 (PD-1), HAVCR2 (TIM-3), CD8A, GZMA, PRF1, TIGIT, LAG3, and TOX. Gene Set Variation Analysis (GSVA) scores were calculated using the GSVA R package (v1.46.0) to quantify signature enrichment. BRAF mutation data were extracted from TCGA mutation annotations, with V600E as the primary variant of interest [20].

2.6. Statistical Analysis

GraphPad Prism 9.0 was used for statistical analysis. Categorical variables were compared using chi-squared or Fisher’s exact tests. Continuous variables were analyzed with unpaired Student’s t-tests (normal distribution) or Mann-Whitney U tests (non-normal distribution). Correlations were assessed using Pearson’s or Spearman’s rank correlation coefficients. p<0.05 was considered statistically significant.

3. Results

3.1. Clinicopathological Characteristics of the Study Cohort

In 2023, the study consecutively enrolled 45 patients with clinically diagnosed PTC. The tumor tissues from five patients were used for histological diagnosis only. Totally, 40 PTC patients were finally included for the current study (Figure 1). Histological examination after surgery confirmed that 22 patients had PTC with LNM and 18 patients had PTC without LNM. In the current analysis, the cases of PTC with LNM included both N1a, which is defined as metastasis to level VI or VII lymph nodes, and N1b, which is defined as metastasis to lateral neck lymph nodes or retropharyngeal lymph nodes. The patients diagnosed PTC with LNM (N1) tended to be older than those of PTC without LNM (N0). No significant difference was observed between the N1 patients and N0 patients on the gender, tumor histological types, tumor size, presence of thyroiditis and benign nodules in peritumor tissues (Table 1).

3.2. PTC with LNM Present a Higher Leukocyte Density

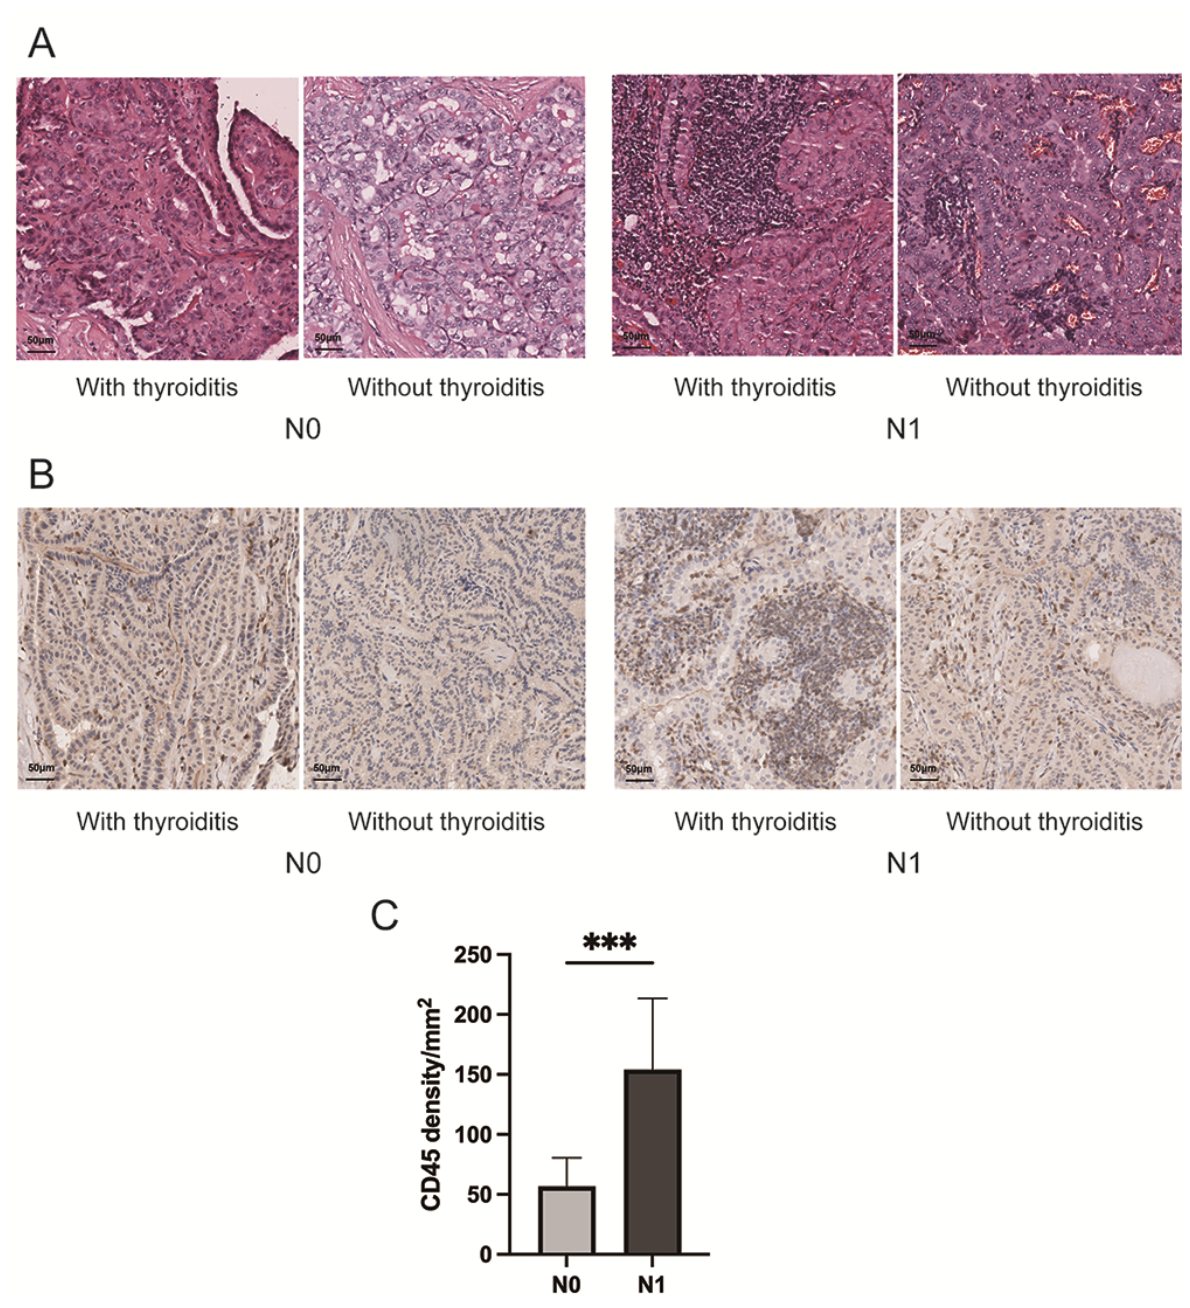
Histological examination showed that the PTC tumors with LNM (N1) presented a greater degree of inflammatory infiltration than that of patients without LNM (N0), regardless of the presence or absence of thyroiditis (Figure 2A). For confirmation of the inflammatory infiltration, we performed immunohistochemistry to identify the presence of CD45+ total immune cells (Figure 2B). The density of CD45+ cells in PTC with LNM (N1) was higher than in PTC without LNM (N0) (p<0.001, Figure 2C).

3.3. PTC with LNM Display Unique Inflammatory Milieu

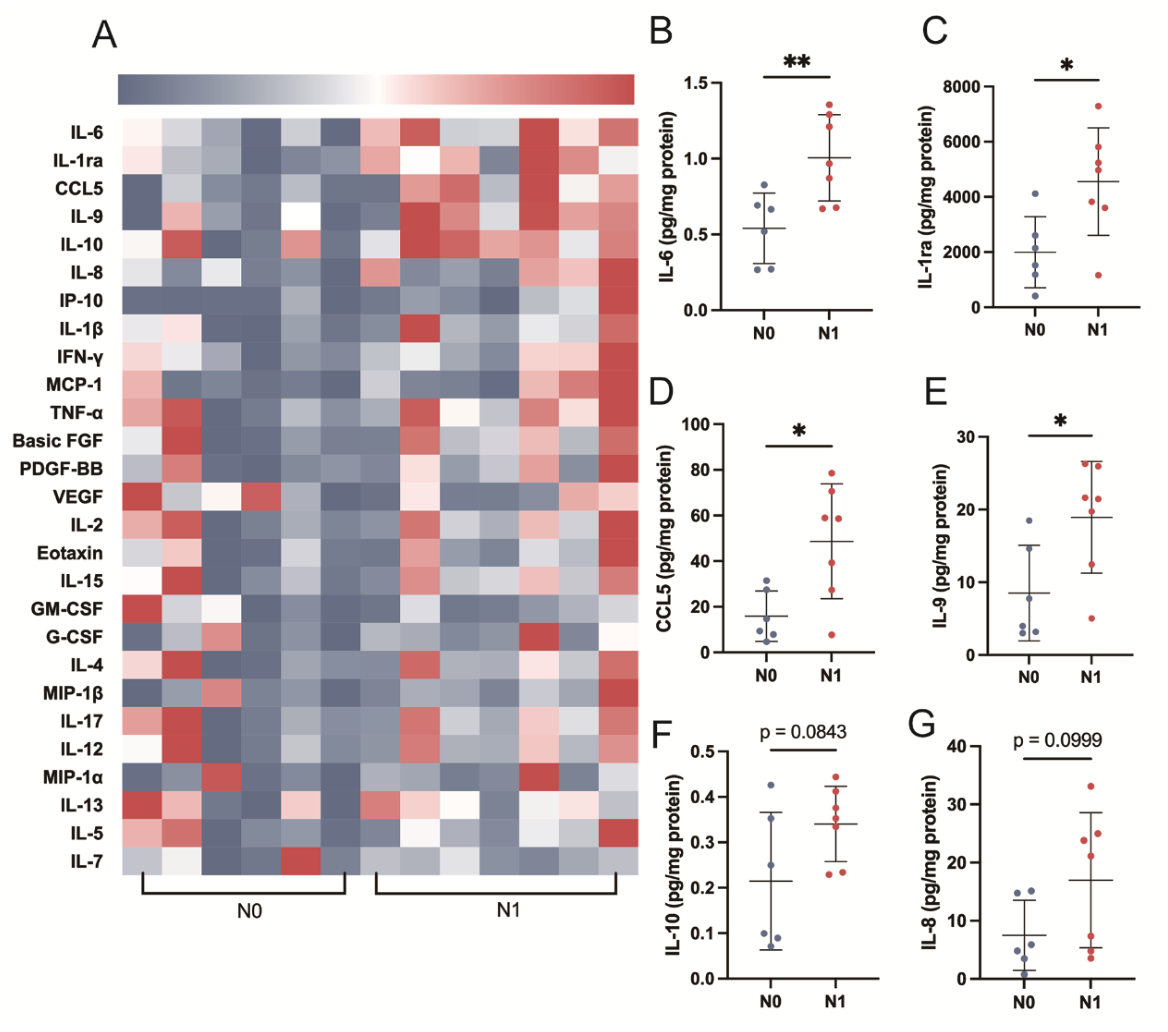
To potentially reflected the TME character of PTC, we quantified the inflammatory cytokines and chemokines in 6 PCT samples without LNM (N0) and 7 samples with LNM (N1). PTCs with LNM expressed different inflammatory cytokines and chemokines from those without LNM (Figure 3A). The tumor tissue with LNM (N1) presented higher levels of IL-6 (p=0.009), IL-1ra (p=0.013), CCL5 (p=0.020) and IL-9 (p= 0.024) than those without LNM (N0) (Figure 3B-3E). The levels of IL-10 (p=0.084), and IL-8 (p=0.099) in PTC with LNM (N1) tended higher than that without LNM (N0) (Figure 3F, 3G), both cytokines are reported to play immune suppressive roles.

3.4. PTC with LNM Present a Greater Infiltration of CD3+CD8+ T Cells

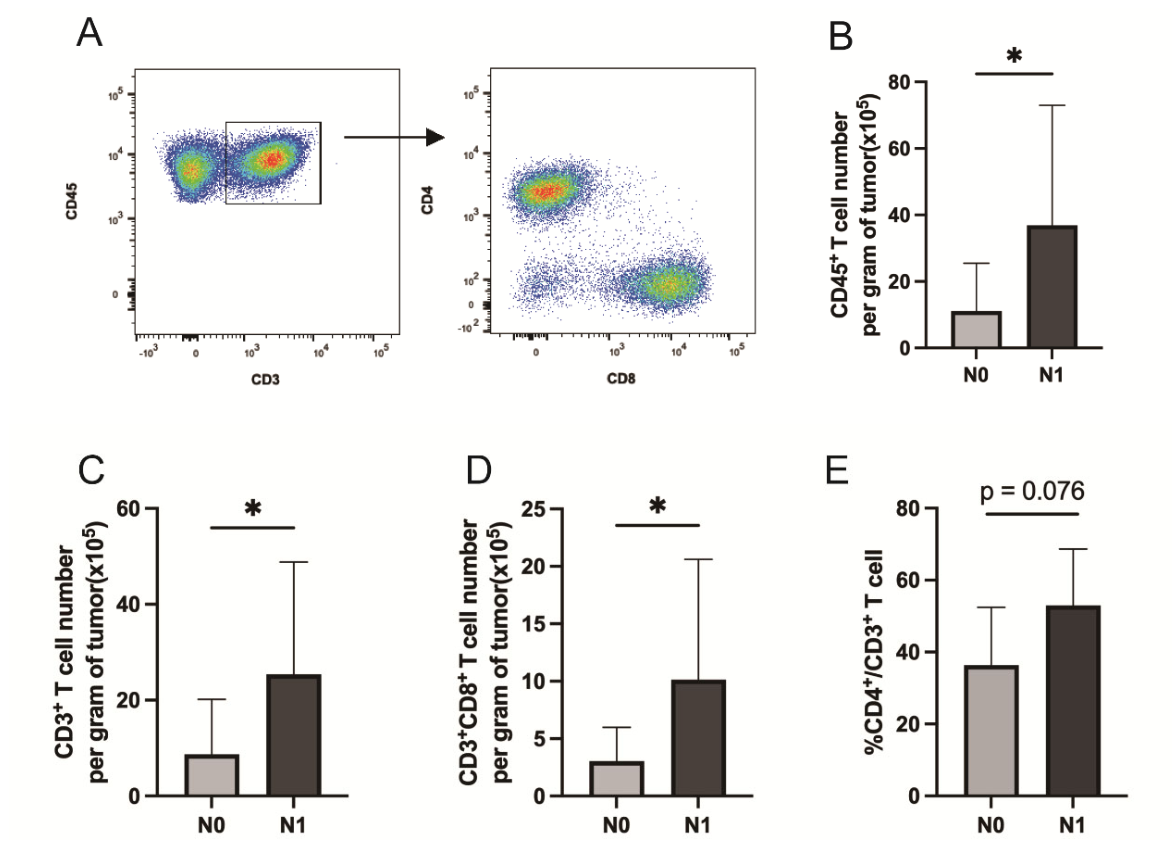
Different types of immune cells within the PTC tissues were further analyzed using FCM (Figure 4A). Tumor tissues with LNM (N1) had more numbers of CD45+ immune cells (p=0.013, Figure 4B), and CD3+ T cells (p=0.016, Figure 4C) than the PTC without LNM (N0). Analysis of different T cell subsets indicated that, PTC with LNM (N1) had more CD3+CD8+ T cells than in PTC without LNM (N0) (p=0.016, Figure 4D). Additionally, the infiltrated proportion of CD4+ T cells elevated in the PTC with LNM (N1) than in PTC without LNM (N0) (p=0.076, Figure 4E).

3.5. PTC with LNM Had More Exhausted PD-1+CD8+ T Cells

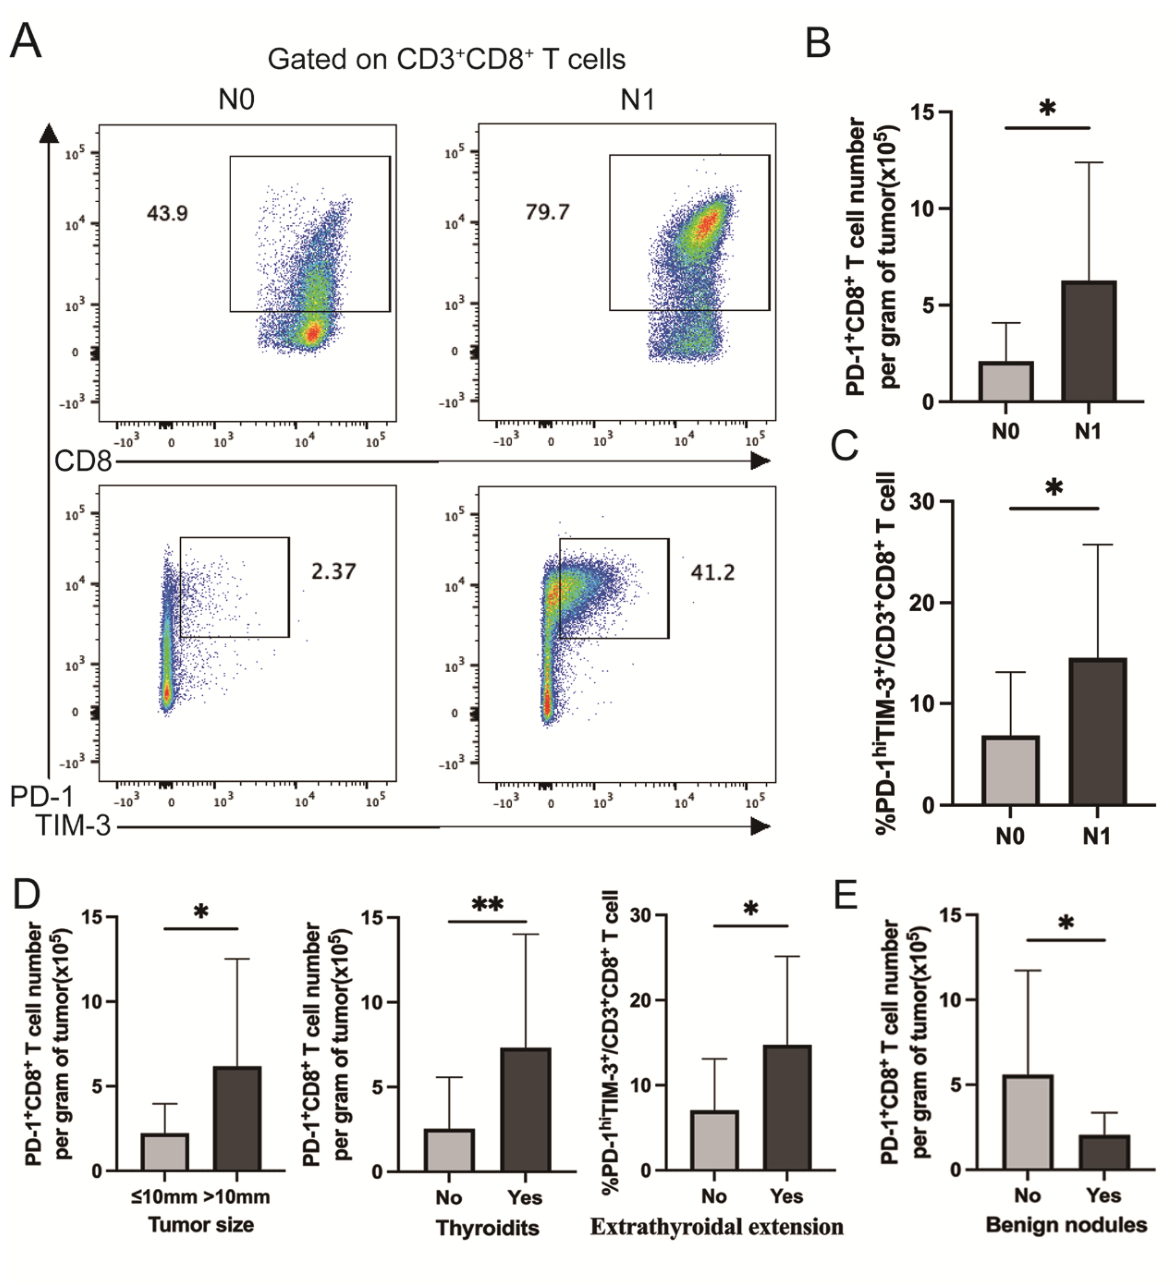
We further analyzed the exhaustion status of CD8+ T cells within tumor tissue (Figure 5A). Increased numbers of exhausted PD1+CD8+ T cells (p=0.016, Figure 5B), particularly the terminally exhausted CD8+ T cells, which is defined as PD1hiTIM-3+ cells [21], were positively related to PCT with LNM (p=0.022, Figure 5C). Further analysis indicated that the infiltrated number of PD-1+CD8+ T cells was positively associated with bigger tumor size (p=0.043), concurrence of thyroiditis in peritumor tissues (p=0.007). Increased numbers of PD1hiTIM-3+ cells were positively associated with the presence of tumor cell extrathyroidal extension (p=0.044) (Figure 5D). Notably, presence of benign nodules in the peritumor tissues was negatively related to infiltrated number of PD-1+CD8+ T cells in tumor tissues (p=0.042, Figure 5E). No relationship was found in extra-thyroidal extension, nerve invasion, and blood vessel invasion.

3.6. Relationship Between Intra-Tumoral CD4+ T Cells and LNM

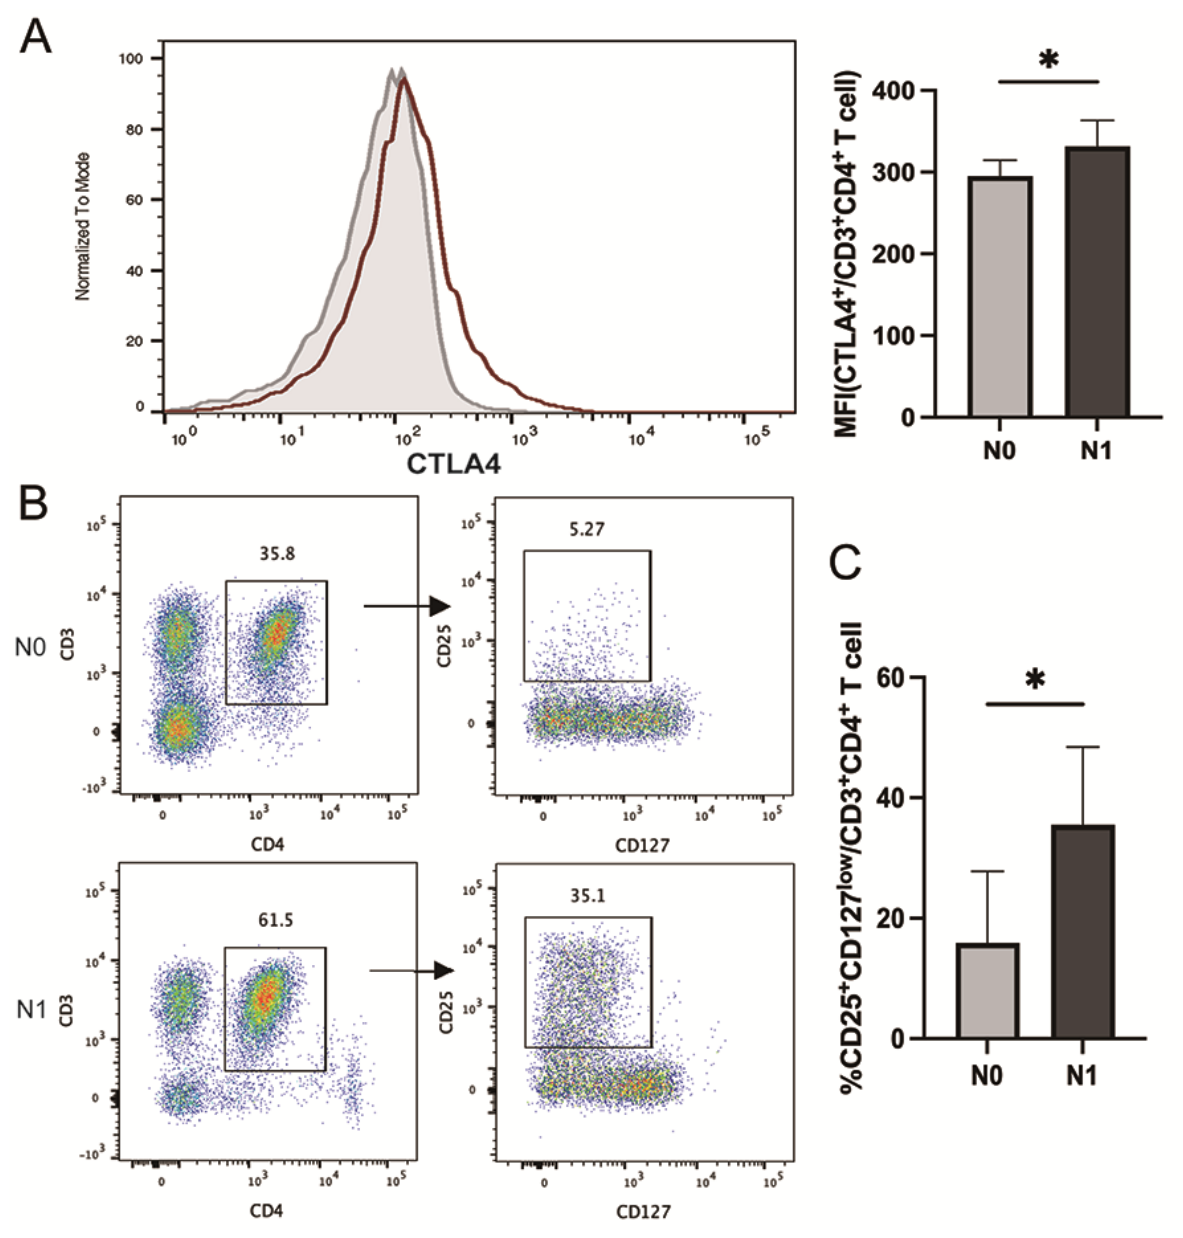
It has been reported that CTLA-4 was a critical immune suppressive marker mainly expressed on CD4+ Treg cells [22]. Indicated by the mean fluorescence intensity (MFI), the CD4+ T cells in the PTC with LNM (N1) displayed an increased surface expression of CTLA-4 than in those without LNM (N0) (p=0.047, Figure 6A). Based on the expression of a high level of CD25 and a low level of CD127 for defining the Treg [23], we detected an elevated frequency of Treg cells among the total CD3+CD4+ T cells, and the elevation was significantly associated with LNM (p=0.023, Figure 6B, 6C).

3.7. An Exhausted Immune Feature Presented in PTC Patients in TCGA Cohort with LNM and Tumor Progression

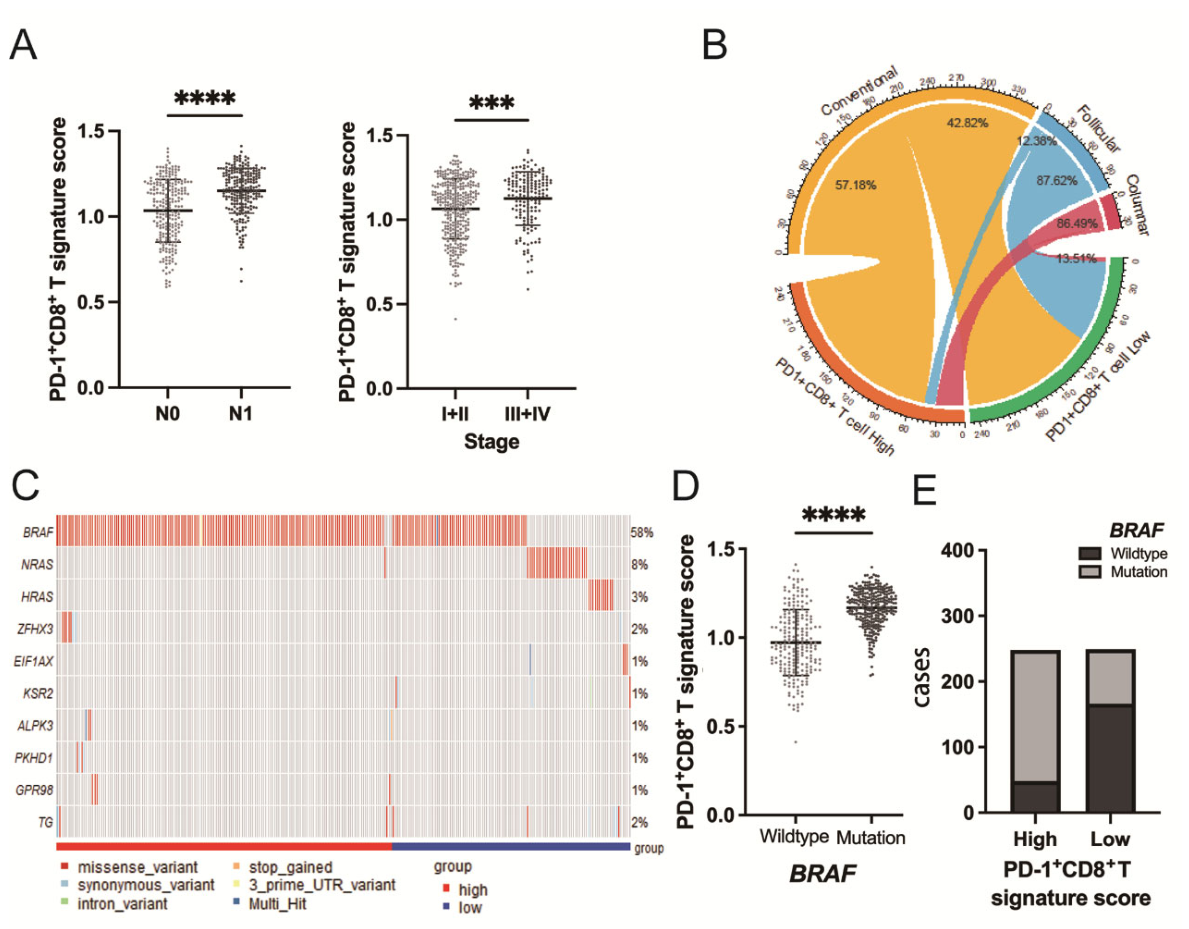
To validate the immune feature of PTC with LNM, we download the transcriptomic and clinical data of 448 TCGA-PTCs. Bioinformatic analysis of the PTC samples indicate that PD-1+CD8+ T cell signature was significantly enriched in the N1 patients (p<0.0001, Figure 7A). The scores of PD-1+CD8+ T cell infiltration in tumor tissues of advanced stage (stage III and IV) tumors were significantly higher than that of early stage (stage I and II) tumors (p<0.001, Figure 7A). We divided the TCGA-PTCs into two groups based on median GSVA scores of PD-1+CD8+T cell infiltration signature, high (n=224) and low (n=224). According to the tumor pathological subtypes, the signature of PD-1+CD8+T cell infiltration was significantly higher in the subtype of columnar cell tumors, which is generally believed to have a poor prognosis (Figure 7B) [12].
We also analyzed relationship of somatic gene mutations on the infiltration of PD-1+CD8+T cells. In the TCGA-PTC cohort, BRAF gene mutation occurred mostly frequently, detecting in 58% tumors and mainly mutated as missense (Figure 7C). The scores of PD-1+CD8+T signature in the BRAF mutated tumors was significantly higher than in the tumors carrying wild-type BRAF (p<0.0001, Figure 7D). Notably, the tumors with high score of PD-1+CD8+T infiltration presented more frequency of BRAF gene mutation (80.6%) than that with low score of PD-1+CD8+T cell infiltration (33.3%) (p<0.0001, Figure 7E).

4. Discussion

This study identifies a terminal immune exhaustion phenotype as one of the key drivers of LNM in PTC, supported by integrated analysis of clinical samples and TCGA data. Our major findings are threefold: (1) LNM-positive PTC harbors a unique TME with elevated pro-inflammatory cytokines (IL-6, CCL5) and enhanced immune cell infiltration; (2) terminally exhausted PD-1hiTIM-3+ CD8+ T cells and Treg enrichment are specific hallmarks of LNM-prone PTC; (3) the terminal exhaustion signature is conserved in TCGA-PTC and strongly correlates with BRAF V600E mutation.
Given insufficient resection can lead to residual tumor in regional lymph nodes resulting in disease recurrence and requiring secondary surgery. In the current study, we characterized the immune features of PTC that are prone to lymph node metastasis (LNM) by analyzing the infiltration of multiple types of immune cells in the freshly removed tumor tissues. The PTC tissues with LNM presented higher levels of inflammatory cytokine IL-6 and chemokine CCL5 in the interstitial fluid, greater numbers of total immune cells than that of PTCs without LNM. PTC tumor extrathyroidal extension was positively related to an increased infiltration of terminally exhausted PD-1hiTIM-3+ T cells. LNM risk was positively correlated with the number of CD4+ Treg in tumor tissues. The findings were confirmed in the cohort of TCGA-PTC, the terminally exhausted T cell gene signature was mainly detected in the tumor tissues with LNM and in progressive tumors. The tumor tissues of PTC with LNM carried a terminally exhaustive immune feature and associated with tumor progression.
Tumor-infiltrating cytotoxic CD8+ T cells can specifically suppress the progression of tumors, but turns to a state of “exhaustion” or “dysfunction” under the continuous stimulation by tumor antigens. Exhausted CD8+ T cells are characterized by impaired cytotoxicity, decreased production of pro-inflammatory cytokine, and overexpression of multiple inhibitory receptors accompanied by transcriptional and epigenetic changes [24,25]. Presence of CD8+ T cell exhaustion, with the expression of T-cell inhibitory receptors, has been reported in multiple types of malignant tumors, such as melanoma, non-small cell lung cancer, hepatocellular carcinoma, and ovarian cancer. Co-expression of PD-1 and Tim-3 proves as the marker of the most dysfunctional tumor-specific T cell subset in peripheral blood of melanoma patients [26]. Previous study reported that PD-1+CD8+ T cells are enriched in PTC tumor-involved lymph nodes, and these cells were associated with dysfunction [11]. Based on the PD-1 expression levels, intermediate level of PD-1+ stem-like CD8+ T cells are critical in maintaining T cell responses in conditions of antigen persistence [27]. In the study, we found that patients without LNM had more infiltration of PD-1intCD8+ T cells. While, the patients who had LNM or larger tumors both had more CD8+PD-1+ T cell infiltration in tumor tissue. Increased numbers of PD1hiTIM-3+ cells were positively associated with the presence of tumor cell extrathyroidal extension. Out data indicated that the tumor tissues of PTC with LNM carried a terminally exhaustive immune feature.
Regulatory T cells (Treg) are a group of CD4+ T cells are originally described in the CD4+ T cells by the surface expression of a high level of CD25, a low level of CD127, and the intracellular expression of FOXP3. The cells are crucial for the maintenance of immunological self-tolerance by suppressing self-reactive T cells [28]. CTLA-4 is constitutively expressed by Treg cells and is upregulated by CD8+ effector T cells after activation [22]. The cell population is frequently in more amounts in tumors. A previous report that the percentage of Treg was increased in tumor and metastatic lymph nodes of patients with PTC [29]. In our current analysis, we detected an elevated frequency of Treg cells among the total CD3+CD4+ T cells, and the elevation was significantly associated with LNM.
BRAF V600E mutation is a key driver of PTC aggressiveness, and our data link it to terminal immune exhaustion. By using the data in TCGA-PTC, we found that BRAF gene mutation was associated with PD1+CD8+T cell infiltration in tumor. BRAF V600E activates the MAPK pathway, which upregulates PD-L1 expression on tumor cells and induces T cell exhaustion [30,31]. Additionally, BRAF V600E may promote the secretion of IL-6 and CCL5, further amplifying the exhausted TME [32,33]. This finding suggests that BRAF V600E mutation and terminal immune exhaustion form a feed-forward loop driving LNM, providing a rationale for combining BRAF inhibitors with anti-PD-1/TIM-3 therapy in high-risk PTC.
The results from our current study point to the association of T cell immune exhaustion with lymph node metastasis of PTC. However, further study is required to validate the immunological character of PTC for predicating distant metastases and disease recurrence risk. Clinically, multiple types of cancer patients benefit from anti-PD-1 therapy. Our results also suggest a potential of anti-PD-1 therapy for the PTC patients that carry the specified immunological character.

4.1. Clinical Implications

Our study addresses an unmet clinical need: preoperative identification of LNM-prone PTC. The terminal exhaustion signature (PD-1hiTIM-3+ CD8+ T cells, Treg frequency) could serve as a biomarker for risk stratification, complementing imaging modalities. For patients with high exhaustion scores, more extensive lymph node dissection may be warranted. Additionally, the enrichment of PD-1hiTIM-3+ cells in LNM-positive PTC suggests that anti-PD-1/TIM-3 combination therapy may be effective in these patients, particularly those with BRAF V600E mutation.

4.2. Limitations

This study has a relatively small sample size, and the observational design cannot establish causality. Future prospective studies should validate the terminal exhaustion signature as a predictive biomarker and explore the efficacy of targeted therapies in high-exhaustion PTC. Additionally, functional assays (e.g., cytokine production, cytotoxicity) would confirm the impairment of PD-1hiTIM-3+ CD8+ T cells. Finally, longer follow-up is needed to determine whether the terminal exhaustion phenotype correlates with recurrence and survival.

5. Conclusions

LNM-prone PTC is characterized by a terminal immune exhaustion phenotype, marked by PD-1hiTIM-3+ CD8+ T cell enrichment, Treg infiltration, and a pro-inflammatory immunosuppressive TME. This phenotype is conserved in the TCGA-PTC cohort and strongly correlates with BRAF V600E mutation. These findings provide novel insights into the immunopathogenesis of PTC metastasis and identify potential biomarkers and therapeutic targets for high-risk patients.

Supplementary Materials

The following supporting information can be downloaded at: https://www.mdpi.com/article/doi/s1, Table S1: List of antibodies.

Funding

This work was supported by the Capital Clinical Features Application Research (Z171100001017211) and the National Natural Science Foundation of China (82373439).

Institutional Review Board Statement

This study was approved by the ethics committee of the Cancer Hospital of Chinese Academy of Medical Sciences (reference number: NCC2016ST-23).

Data Availability Statement

All the data supporting the conclusions of this study are included within the article and its supplementary files. TCGA data are available from the GDC Portal (http://portal.gdc.cancer.gov/).

Acknowledgments

The authors thank Lingdun Zhuge for his excellent technical support.

Conflicts of Interest

The authors declare no conflict of interest.

References

  1. Laura B, Mark Z, Maria EC. Thyroid Cancer: A Review. JAMA 2024; 331(5): 425-435. [CrossRef]
  2. Ringel, M.D.; Sosa, J.A.; Baloch, Z.; Bischoff, L.; Bloom, G.; Brent, G.A.; Brock, P.L.; Chou, R.; Flavell, R.R.; Goldner, W.; et al. 2025 American Thyroid Association Management Guidelines for Adult Patients with Differentiated Thyroid Cancer. Thyroid® 2025, 35, 841–985, . [CrossRef]
  3. Ito, Y.; Miyauchi, A.; Kihara, M.; Fukushima, M.; Higashiyama, T.; Miya, A. Overall Survival of Papillary Thyroid Carcinoma Patients: A Single-Institution Long-Term Follow-Up of 5897 Patients. World J. Surg. 2018, 42, 615–622, . [CrossRef]
  4. Smith, B.D.; Oyekunle, T.O.; Thomas, S.M.; Puscas, L.; Rocke, D.J. Association of Lymph Node Ratio With Overall Survival in Patients With Metastatic Papillary Thyroid Cancer. Arch. Otolaryngol. Neck Surg. 2020, 146, 962–964, . [CrossRef]
  5. Fu, J.; Liu, J.; Wang, Z.; Qian, L. Predictive Values of Clinical Features and Multimodal Ultrasound for Central Lymph Node Metastases in Papillary Thyroid Carcinoma. Diagnostics 2024, 14, . [CrossRef]
  6. Zheng, G.; Zhang, H.; Lin, F.; Zafereo, M.; Gross, N.; Sun, P.; Liu, Y.; Sun, H.; Wu, G.; Wei, S.; et al. Performance of CT-based deep learning in diagnostic assessment of suspicious lateral lymph nodes in papillary thyroid cancer: a prospective diagnostic study. Int. J. Surg. 2023, 109, 3337–3345, . [CrossRef]
  7. Zhang, Q.; Wang, F.; Ma, W.; Liu, N.; Lu, Y.; Zhang, P. Immunotherapy in Thyroid Cancer: Current Strategies and Challenges. Cancer Med. 2026, 15, e71742, . [CrossRef]
  8. Wang, R.; Guo, Y. T-cell exhaustion in tumor immunology: mechanisms, heterogeneity, and therapeutic strategies. Front. Immunol. 2026, 17, 1841281, . [CrossRef]
  9. Li, H.; van der Leun, A.M.; Yofe, I.; Lubling, Y.; Gelbard-Solodkin, D.; van Akkooi, A.C.; Braber, M.v.D.; Rozeman, E.A.; Haanen, J.B.; Blank, C.U.; et al. Dysfunctional CD8 T Cells Form a Proliferative, Dynamically Regulated Compartment within Human Melanoma. Cell 2018, 176, 775–789.e18, . [CrossRef]
  10. Sade-Feldman, M.; Yizhak, K.; Bjorgaard, S.L.; Ray, J.P.; de Boer, C.G.; Jenkins, R.W.; Lieb, D.J.; Chen, J.H.; Frederick, D.T.; Barzily-Rokni, M.; et al. Defining T Cell States Associated with Response to Checkpoint Immunotherapy in Melanoma. Cell 2018, 175, 998–1013.e20, . [CrossRef]
  11. Severson, J.J.; Serracino, H.S.; Mateescu, V.; Raeburn, C.D.; McIntyre, R.C., Jr.; Sams, S.B.; Haugen, B.R.; French, J.D. PD-1+Tim-3+ CD8+ T Lymphocytes Display Varied Degrees of Functional Exhaustion in Patients with Regionally Metastatic Differentiated Thyroid Cancer. Cancer Immunol. Res. 2015, 3, 620–630, . [CrossRef]
  12. Du, J.-J.; Wang, J.; Ma, K.; Ma, P. New insights into the tumor immune microenvironment and immunotherapy of thyroid cancer. Front. Immunol. 2026, 17, 1699500, . [CrossRef]
  13. Zhang, B.; Liu, J.; Mo, Y.; Zhang, K.; Huang, B.; Shang, D. CD8+ T cell exhaustion and its regulatory mechanisms in the tumor microenvironment: key to the success of immunotherapy. Front. Immunol. 2024, 15, 1476904, . [CrossRef]
  14. Li, S.; Chen, Z.; Liu, M.; Li, L.; Cai, W.; Lian, Z.-X.; Guan, H.; Xu, B. Immunophenotyping with high-dimensional flow cytometry identifies Treg cell subsets associated with recurrence in papillary thyroid carcinoma. Endocrine-Related Cancer 2024, 31, . [CrossRef]
  15. Chen, Y.; Zhao, J.; Sun, Y.; Yang, Z.; Yang, C.; Zhu, D. Single-cell RNA sequencing reveals tumor cell and immune cell variations associated with lymphatic metastasis in papillary thyroid cancer. Endocr. Connect. 2025, 14, . [CrossRef]
  16. Liu, P.; Yu, X. Lymphatic metastasis of papillary thyroid carcinoma: mechanism and clinicopathological physiology. Front. Endocrinol. 2026, 16, . [CrossRef]
  17. Mohanty, A.; Afkhami, M.; Reyes, A.; Pharaon, R.; Yin, H.; Li, H.; Do, D.; Bell, D.; Nam, A.; Chang, S.; et al. Exploring markers of immunoresponsiveness in papillary thyroid carcinoma and future treatment strategies. J. Immunother. Cancer 2024, 12, e008505, . [CrossRef]
  18. Zhang, R.; Chen, K.; Gong, C.; Wu, Z.; Xu, C.; Li, X.-N.; Zhao, F.; Wang, D.; Cai, J.; Zhou, A.; et al. Abnormal generation of IL-17A represses tumor infiltration of stem-like exhausted CD8+ T cells to demote the antitumor immunity. BMC Med. 2023, 21, 1–17, . [CrossRef]
  19. Chen, K.; Wu, Z.; Zhao, H.; Wang, Y.; Ge, Y.; Wang, D.; Li, Z.; An, C.; Liu, Y.; Wang, F.; et al. XCL1/Glypican-3 Fusion Gene Immunization Generates Potent Antitumor Cellular Immunity and Enhances Anti–PD-1 Efficacy. Cancer Immunol. Res. 2020, 8, 81–93, . [CrossRef]
  20. Kim, H.-D.; Song, G.-W.; Park, S.; Jung, M.K.; Kim, M.H.; Kang, H.J.; Yoo, C.; Yi, K.; Kim, K.H.; Eo, S.; et al. Association between expression level of PD1 by tumor-infiltrating CD8+ T cells and features of hepatocellular carcinoma. Gastroenterology 2018, 155, 1936–1950.e17, doi:10.1053/j.gastro.2018.08.030.
  21. Ma, J.; Zheng, B.; Goswami, S.; Meng, L.; Zhang, D.; Cao, C.; Li, T.; Zhu, F.; Ma, L.; Zhang, Z.; et al. PD1Hi CD8+ T cells correlate with exhausted signature and poor clinical outcome in hepatocellular carcinoma. J. Immunother. Cancer 2019, 7, 1–15, . [CrossRef]
  22. Sobhani, N.; Tardiel-Cyril, D.R.; Davtyan, A.; Generali, D.; Roudi, R.; Li, Y. CTLA-4 in Regulatory T Cells for Cancer Immunotherapy. Cancers 2021, 13, 1440, doi:10.3390/cancers13061440.
  23. Santegoets, S.J.A.M.; Dijkgraaf, E.M.; Battaglia, A.; Beckhove, P.; Britten, C.M.; Gallimore, A.; Godkin, A.; Gouttefangeas, C.; de Gruijl, T.D.; Koenen, H.J.P.M.; et al. Monitoring regulatory T cells in clinical samples: consensus on an essential marker set and gating strategy for regulatory T cell analysis by flow cytometry. Cancer Immunol. Immunother. 2015, 64, 1271–1286, . [CrossRef]
  24. Baessler A, Vignali DAA. T Cell Exhaustion. Annu Rev Immunol 2024; 42(1):179-206. doi: 10.1146/annurev-immunol-090222-110914.
  25. Kang, T.G.; Johnson, J.T.; Zebley, C.C.; Youngblood, B. Epigenetic regulation of T cell exhaustion in cancer. Nat. Rev. Cancer 2025, 26, 46–61, . [CrossRef]
  26. Fourcade, J.; Sun, Z.; Benallaoua, M.; Guillaume, P.; Luescher, I.F.; Sander, C.; Kirkwood, J.M.; Kuchroo, V.; Zarour, H.M. Upregulation of Tim-3 and PD-1 expression is associated with tumor antigen–specific CD8+ T cell dysfunction in melanoma patients. J. Exp. Med. 2010, 207, 2175–2186, . [CrossRef]
  27. Eberhardt, C.S.; Kissick, H.T.; Patel, M.R.; Cardenas, M.A.; Prokhnevska, N.; Obeng, R.C.; Nasti, T.H.; Griffith, C.C.; Im, S.J.; Wang, X.; et al. Functional HPV-specific PD-1+ stem-like CD8 T cells in head and neck cancer. Nature 2021, 597, 279–284, . [CrossRef]
  28. Wing, K.; Sakaguchi, S. Regulatory T cells exert checks and balances on self tolerance and autoimmunity. Nat. Immunol. 2009, 11, 7–13, . [CrossRef]
  29. Nguyen, A.T.; Viramontes, J.; Vazquez, I.; McWilliam, C.; Devarakonda, V.; Henson, R.; Sacks, W.L.; Clair, J.M.-S.; Chen, Y.; Walgama, E.; et al. Single-cell transcriptomic analysis reveals tumor-immune determinants of lymph node colonization and progression in thyroid cancer. Sci. Adv. 2026, 12, eaea4727, . [CrossRef]
  30. Angell, T.E.; Lechner, M.G.; Jang, J.K.; Correa, A.J.; LoPresti, J.S.; Epstein, A.L. BRAFV600E in Papillary Thyroid Carcinoma Is Associated with Increased Programmed Death Ligand 1 Expression and Suppressive Immune Cell Infiltration. Thyroid 2014, 24, 1385–1393, . [CrossRef]
  31. Schubert, L.; Mariko, M.L.; Clerc, J.; Huillard, O.; Groussin, L. MAPK Pathway Inhibitors in Thyroid Cancer: Preclinical and Clinical Data. Cancers 2023, 15, 710, . [CrossRef]
  32. Zheng, X.; Sun, R.; Wei, T. Immune microenvironment in papillary thyroid carcinoma: roles of immune cells and checkpoints in disease progression and therapeutic implications. Front. Immunol. 2024, 15, 1438235, . [CrossRef]
  33. Zhang, G.; Jiao, Q.; Shen, C.; Song, H.; Zhang, H.; Qiu, Z.; Luo, Q. Interleukin 6 regulates the expression of programmed cell death ligand 1 in thyroid cancer. Cancer Sci. 2021, 112, 997–1010, . [CrossRef]
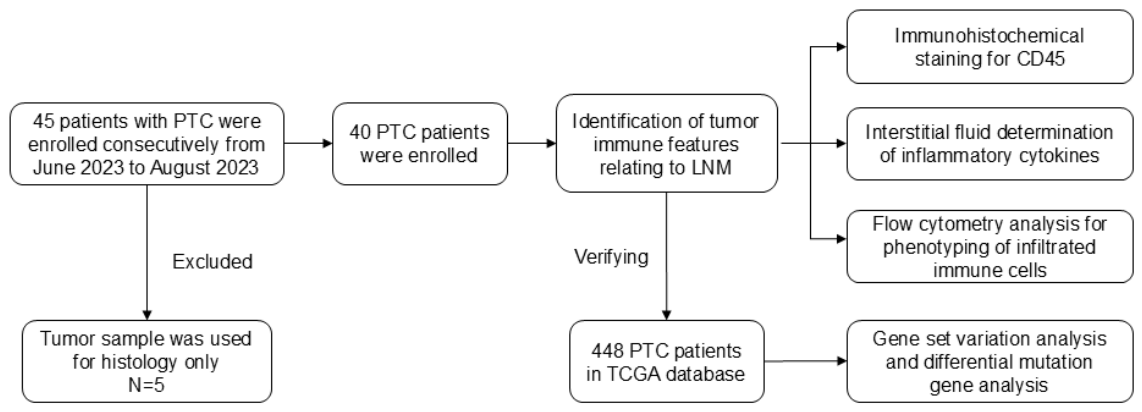
Figure 1. Flow diagram of study design. PTC, papillary thyroid carcinoma; TCGA, The Cancer Genome Atlas.
Preprints 225808 g001
Figure 2. Tumor-infiltrating immune cells in PTC and correlation with LNM. (A) Representative images of H&E staining of PTC with LNM (N1) or without LNM (N0). (B) Representative CD45 immunohistochemistry staining of N1 or N0 tumor tissues. (C) Quantification of CD45+ cells infiltrated in the tumor tissues of, N0 (n=18), and N1 (n=22). Data are shown as mean ± SD. ***p<0.001 examined by Student’s t test, two-tailed.
Preprints 225808 g002
Figure 3. Expression of inflammatory cytokines and chemokines in PTC tumor tissues. (A) Heat map illustrating the relative expression of inflammatory cytokines and chemokines presented in tumor intercellular fluid of PTC with LNM (N1, n=7) or not (N0, n=6). (B-G) Concentration of IL-6 (B), IL-1ra (C), CCL5 (D), IL-9 (E), IL-10 (F) and IL-8 (G) in the tumor intercellular fluid. Data are shown as mean ± SD. *p<0.05, **p<0.01 examined by Student’s t test, two-tailed.
Preprints 225808 g003
Figure 4. Infiltration of CD3+CD8+ cytotoxicity T cells in PTC and correlation with LNM. (A) Representative flow cytometric plots showing the population CD45+ cells, CD3+ T cells and CD3+CD8+ T cells. (B,C,D) Comparison of CD45+ cell, CD3+ T cell and CD3+CD8+ T cell count in tumor tissue via FCM analyses. (E) Bar graph indicates the average percentage of CD4+ among CD3+ T cells. n=18 in N0, n=22 in N1. Student’s t test was applied. Data were shown as mean ± SD. All reported p values were two sided. (*p<0.05).
Preprints 225808 g004
Figure 5. Intra-tumoral PD-1+CD8+ T cell infiltration indicated tumor progression. (A) Representative flow cytometric plots displaying the percentage of intra-tumoral PD1+CD8+T cells and PD-1+TIM-3+CD8+ T cells. (B) Bar graph indicates the average count of PD1+CD8+ T cells per gram of tumor tissues. (C) Bar graph indicates the average percentage of PD-1hiTIM-3+ among CD3+CD8+ T cells. (D, E) Bar graph indicates the average count of PD-1+CD8+ T cells and frequency of PD-1hiTIM-3+ among CD3+CD8+ T cell in tumor tissues with different pathological characters. n=18 in N0, n=22 in N1. Student’s t test was applied. Data were shown as mean ± SD. All reported p values were two sided. (*p<0.05, **p<0.01).
Preprints 225808 g005
Figure 6. CD3+CD4+ T cell and Treg infiltration in tumor indicated LNM. (A) Bar graph indicates the expression of CTLA4 in CD3+CD4+ T cells analyzed by FCM. Representative histogram was shown. (B) Representative flow cytometric plots to show CD25+CD127low T cells infiltration. (C) Bar graph indicates the frequency of CD25+CD127low among CD3+CD4+ T cells with LNM. n=18 in N0, n=22 in N1. Student’s t test was applied. Data were shown as mean ± SD. All reported p values were two sided. (*p<0.05).
Preprints 225808 g006
Figure 7. Bioinformatics characters of papillary thyroid carcinoma patients with LNM in TCGA cohort. (A) Comparison of PD-1+CD8+ T signature score with LNM and AJCC stage. (B) Relationship between infiltration of PD-1+CD8+ T cells and pathology subtype of PTC. (C) Differential mutation gene analysis of high and low PD-1+CD8+T cell enrichment groups, and only specimen with gene mutations were shown. (D) Comparison of PD-1+CD8+ T signature score with BRAF mutation. (E) Comparison of frequency of BRAF gene mutation with PD-1+CD8+T signature score. (***p<0.001, ****p<0.0001).
Preprints 225808 g007
Table 1. Clinicopathological characteristics of the patients.
N0 N1
(n=18) (n=22) pvalue
Gender 0.427
Male 2 5
Female 16 17
*Age (Year) 46±13 36±7 0.004
Histological subtype 0.11
Conventional 12 20
Follicular variant 6 2
*Tumor size (mm) 11.44±4.48 13.41±5.90 0.252
Thyroidistis 0.186
Yes 14 12
No 4 10
Benign nodules 0.341
Yes 11 9
No 7 13
Extrathyroidal extension
Yes 13 18 0.705
No 5 4
* Data expressed as mean ± SD.
Disclaimer/Publisher’s Note: The statements, opinions and data contained in all publications are solely those of the individual author(s) and contributor(s) and not of MDPI and/or the editor(s). MDPI and/or the editor(s) disclaim responsibility for any injury to people or property resulting from any ideas, methods, instructions or products referred to in the content.
Copyright: This open access article is published under a Creative Commons CC BY 4.0 license, which permit the free download, distribution, and reuse, provided that the author and preprint are cited in any reuse.
Prerpints.org logo

Preprints.org is a free preprint server supported by MDPI in Basel, Switzerland.

Subscribe

© 2026 MDPI (Basel, Switzerland) unless otherwise stated

Accessibility

Disclaimer

Terms of Use

Privacy Policy

Privacy Settings