

Submitted:
29 July 2026
Posted:
31 July 2026
You are already at the latest version
Abstract
Polylactic acid (PLA) filaments are considered one of the most significant materials employed in the biomedical fields, particularly in bone fabrication. Hence, the development of bone fabrication is also deeply dependent on the tissue's pores and the resistance of the 3D-printed surface against the plastic deformation generated from indentation. To measure this indentation behavior for these types of fabricated parts, the D-Shore hardness (HS) is one of the most commonly used methods. Unfortunately, this method lacks a mathematical model computing the hardness number compared to the Brinell hardness (HB) method, since the measurement is implemented directly on the printed sample surface. Therefore, this study aims to establish a novel model computing the hardness number of the D-Shore depending on the experimental number of HB and HS. The parameters adopted in this work were (100, 150, and 200 μm) and (0˚/90˚ and -45˚/45˚) for the pore sizes (PS) and orientation layers (OL), respectively, using printed Micro-Samples from PLA filaments. However, the current work has utilized the Explicit Finite Element Analysis (EFEA) to predict the feasible design from these samples. Consequently, trial No. 4 at (100×100 μm2) and (-45˚/45˚) had an error ratio for the average of HB numbers, predictively, without exceeding 2% with experimental outcomes, as a feasible design. Additionally, the mathematical model proposed to compute D-Shore hardness has a correlation factor ranging from 99.55% to 99.99%, depending on experimental results for HB and HS, where the OL-Parameter in analysis of variance (ANOVA) was the dominant factor.
Keywords:
pore sizes
; orientation layers
; bone fabrication
; hardness
; PLA
1. Introduction
In the preliminary design stages for various fields, such as construction, automobile, marine, and aerospace, the modeling operation has employed 3D printing technology [1,2,3]. The advanced and precise manufacturing of human body parts in the biomedical area, especially bones and teeth, has also utilized this technology [4,5,6,7]. Therefore, earlier studies aimed to develop this industry using distinct kinds of filaments, such as polylactic acid (PLA) [8,9]. At the same time, the porosity mechanism is considered one of the revolutionary techniques for enhancing biomedical parts as functional materials, yielding better economic and lower weight patterns [10,11].
Given the preceding, the bio-fabrication field of utilizing PLA for bone and teeth has undergone significant advancements due to the unique features of this type of aliphatic polyester, such as biodegradability and recyclability. Furthermore, this type of filament is eco-friendly and non-toxic because it is fermented from the sugar of sugarcane and corn. Accordingly, the tissue engineering of bones is deemed one of the essential applications of this filament type [12,13,14]. Thus, the Fusion Deposition Modeling (FDM), as a mechanism employed in 3D printers, has been exploited in the scaffolds modeling for bone tissue, where one of these models proposed a regular porosity from 200-350 μm and 90% porosity grade to boost the resurgence of the bone tissues without mechanical properties issues [15]. Additionally, this filament can provide osteogenic properties to healing and implantation. As a testament to these properties, this printed filament successfully eliminated damage to bone tissue in the cortical skull bones of mice. Therefore, the size of the pores in the implanted scaffolds in this bone for the mice ranged from 250 to 1000 μm with a variance in orientation angles from 0˚ to 28˚ [16]. However, other studies have employed a dis-tinct pore size of approximately 100 μm in the fabrication of bone from a ceramic matrix composite and polyurethane [17,18,19]. Consequently, this brief survey has shown the influential function of PLA filament in this medical field. Nonetheless, this filament has limited toughness, since it tends to be brittle [20]. Accordingly, it is essential to comprehend the role of other parameters in enhancing the hardness of bones fabricated, after focusing on the pore size range in bone microfabrication using PLA.
The numerous parameters of FDM weigh on the performance of indentation resistance as a function of PLA hardness. Hence, the thickness and orientation of layers, nozzle temperature, the ratio of infill density, and printing speed are influential parameters in improving this type of resistance [21,22,23]. One of these experimental investigations on this type of filament demonstrated the influence of a 0.1 mm layer height on enhancing hardness, as measured by the D-Shore method at 45˚/-45˚ [24]. Nevertheless, the horizontal and vertical orientation of the printed layers, with a height of 0.15-0.20 mm for each layer, contributed to the increase and stability of PLA hardness [25]. Moreover, the dominance of extrusion temperature compared to infill density and printing speed led to variance in the optimization of hardness behavior. Therefore, the optimal outputs for this experimental procedure were 100%, 220˚C, and 20 mm/s for infill ratio, nozzle temperature, and printing velocity, respectively [26]. In addition, this optimization variance for PLA hardness also presented other reported outcomes represented by 0.25 mm, 65%, and 215˚C for layer height, infill ratio, and extrusion temperature of the nozzle, consecutively [27]. In contrast, the Brinell hardness method was employed with other filament types, as compared to PLA, which usually utilizes the D-Shore method to measure hardness [28]. According to this concise review, the vital levels of key factors affecting the hardness of PLA filament and the pore sizes of bone fabricated from this filament can be summarized in Figure 1.
From here, the synopsis in Figure 1 provides a comprehensive overview of the influential ranges of parameters for boosting this type of fabrication by modifying the indentation resistance and pore sizes of PLA filaments. Similarly, this synopsis demonstrated that PLA filaments were used in conjunction with the D-Shore technique to measure hardness, whereas the Brinell method was employed with other types of filaments [28]. Furthermore, the Brinell method is a widely used test that employs a mathematical formula, unlike the D-Shore method [29,30]. Therefore, the current study focuses on utilizing a variety of micropore sizes and layer orientations to investigate numerically and experimentally the best level of hardness of the PLA sample. Accordingly, by applying the Brinell and D-Shore examinations' outcomes to the PLA samples, these results contribute to establishing a novel D-Shore model. Methodologically, PLA filament is operated at 20 mm/s, 220˚C, 0.2 mm, and 100% for the printing speed, nozzle temperature, layer thickness, and infill ratio, successively. The angles of orientation layers are 0˚/90˚ and 45˚/-45˚, while the micro-sizes for the pore are 100, 150, and 200 μm. Predictively, the indentation’s load is applied to PLA samples using the Explicit Finite Element Analysis (EFEA) technique to determine the Brinell hardness. Thus, this prediction can specify the range of affording for proposed structures of samples to indentation. Based on this concise presentation of methodology procedures, the adopted prediction environment for hardness in this work, along with the experimental settings, contributes to illustrating the numerical and experimental aspects of the current study in succession.
2. Materials and Methods
2.1. Hardness Prediction Environment
Since the data available on the strength of this filament type is scarce, the simulation challenge of indentation behavior for Micro-Samples of PLA utilizing EFEA is complex [31,32]. Furthermore, the sample structure needs to predict the feasibility of the orientation angles of layers and pore sizes adopted in the current work before executing the experimental trials to avoid wasting this filament type [33,34,35]. Therefore, it is essential to demonstrate the Johnson-Cook model's role in describing the behavior of indentation resulting from stressed PLA samples by the Brinell hardness method.
As a concept, the ball tool in the Brinell hardness method begins to penetrate the PLA sample surface to measure the strength of this filament type under indentation, as depicted in Figure 2 [29]. Hence, the nonlinear strength behavior of PLA material in Equations (1) and (2) lead to access to explicit deformation resulting from applied load during this hardness test. This deformation resulting from the penetration of the ball tool contributes to the strain of the PLA surface with increasing penetration depth, as described in Equation (3) [31,36].
where Fi is the nodal applied force, δi is the final nodal acceleration, ai indicates the acceleration of the body, Δt is the incremental time, m is the nodal mass, n is the iteration number, εδ is the directional strain, and h denotes the nodal indentation. Consequently, the applied force in this hardness method on the indentation tool contributes to the interaction between directional strain and the kinetic energy, where this interaction reflects the decrease in tool penetration inside the sample, which can be observed in Equation (4):
where Δv is the variance among the initial and final velocities for the hardness tool according to the Brinell test, this variance represents the progress of deformation between elements based on augmented Lagrange's principle. Hence, this progress needs time, based on a scale of mass density (ρ) and Young's modulus (E) for PLA filament, as illustrated in Table 1. Mesh size (S) and factor of safety (f.o.s), according to EFEA, are also required in progressive deformation. Thus, it can translate these factors into the Courant-Friedrichs-Lewy (CFL) in Equation (5), where the value of f.o.s is ≤ 1. At the same time, the properties of Tungsten Carbide (WC) are also stated in Table 1 for the ball tool.
Through this brief explanation of explicit deformation formulas resulting from PLA indentation by a ball tool, the strength model adopted in the present EFEA simulation relies on the Johnson-Cook (JC) model. Therefore, this model interprets the strength of PLA filament opposite this indentation to obtain the indentation diameter, as demonstrated in Figure 2(a). At room temperature, the assumed PLA strength of this model in the current study can be applied without considering the temperature influences, as exhibited in Equation (6) [39]:
where σJC is the stress according to the JC-Model, k indicates the initial yield stress, N is the strength coefficient, x is the strain hardening exponent, and R signifies the strain rate strength coefficient. These constants of Equation (6) can be seen in Table 2 for PLA filament at orientation angles 0˚, 45˚, and 90˚. Moreover, the reference strain rate () is one unit, while and are the equivalent plastic strain and plastic strain rate, respectively.
As mentioned, the basis adopted for the plastic deformation of PLA filament in this study is nonlinear behavior according to the augmented Lagrange and EFEA principles, as described in Equations (1)-(6). Therefore, the traditional version of SOLIDWORKS 2025, as a CAD tool, has modeled the PLA micro-samples depicted in Figure 3 for exploitation in the simulation operation. Moreover, as a subsequent step in the experimental procedures, 3D printing was utilized to prepare these samples for the Brinell and D-Shore hardness testing. On the other hand, the simulation of these samples in Figure 3 was achieved using a traditional version 6.1 of the Solid Mechanics Package-Time Dependent in COMSOL Multiphysics. One of these meshed samples at 0˚/90˚ and (100×100) μm2 for the orientation layers and pore size, respectively, can be seen in Figure 4.
As is apparent from the facts outlined above, the following section focuses on highlighting the experimental surroundings for implementing the printing of these micro-samples and conducting the hardness tests, after describing the prediction environment of the indentation situation.
2.2. Experimental Surrounding
In the present work, the prediction medium of the penetration process during the Brinell test has become apparent based on principles of EFEA and nonlinear behaviors. Accordingly, it is essential to ascribe this test, along with the D-Shore method, to specify the hardness of these Micro-Samples, depending on the methodological path adopted in the experimental surroundings. Therefore, this surrounding comprises the adopted parameters, the parameters' levels, the specifications of 3D printing, and the hardness test instruments. Consequently, it is noteworthy to highlight these experimental procedures.
Based on the graphical summary of the survey in Figure 1, the influential pore sizes (PS) used in the current study were 100, 150, and 200 μm, while (0˚/90˚) and (-45˚/45) were the angles for the orientation layer (OL), as shown in Table 3. On the contrary, the other parameters in Table 4 utilized to model the Micro-Samples depicted in Figure 3 can be recognized as operational specifications in a 3D printer model (Cocoon Create, Australia) that were constant. In tissue engineering, the main reason for selecting these PS levels is to promote absorption and adhesion to protein and cells, respectively, at the early phase of these sizes. Besides, these active levels of PS contribute to increasing the rate of bone reconstruction as a bionic trabecular structure. These dimensions also ensured optimal exchange and growth for both nutrients and blood vessels, individually. Likewise, these PS levels increase bone porosity by 50% to 80%. Hence, it enhances the structural flexibility and the mechanical strength of bone [41,42,43,44,45,46,47]. In addition, as illustrated in Table 4, the filament material was a black PLA model (Hatchbox, USA) with a diameter of (1.75) mm, (+/- 0.03) mm for accuracy in dimensions, and 1 kg for weight. Accordingly, the levels of PS and OL in Table 3 were designed for 12 trials, using both non-hybrid and hybrid pore sizes, as demonstrated in Table 5, to measure the hardness.
According to the prediction environment for hardness and the number of hardness resulting from the Brinell method [29], as illustrated in Equation (7), the numerical prediction of this number is implemented based on the trials presented in Table 5.
where F is the applied force on the ball tool, D is the ball diameter, and d indicates the indentation diameter. Nevertheless, the experimental measurement for HB and HS numbers according to Brinell and D-Shore, respectively, can be specified using a multifunctional instrument model (UT347A Leeb, Singapore). From here, the methodological stages adopted in the present study are illustrated in Figure 5, which includes the 3D printing stage for the Micro-Samples described in Figure 3 and the hardness measurement stage for the trials presented in Table 5.
This succinct depiction finally presented the notion of experimental surroundings adopted. Therefore, the scenario of this environment contributes to the investigation, debate, and interpretation of the outcomes in the next section. Thus, the outputs of this methodology lead to proposing the model for D-Shore based on the Brinell hardness number.
3. Results and Discussion
The description of the prediction and experimental environments provided a brief explanation of the methodology employed in this study to determine the numerical value for hardness based on the Brinell method. Furthermore, this methodology contributes to specifying the experimental hardness numbers for the Brinell and D-Shore. From here, it is indispensable to show these outcomes and examine the behavior of these results to identify the dominant parameters and the empirical model for D-Shore based on the Brinell number.
Predictively, the simulation of the Brinell environment outlined the indentation zones in run Nos. 1 and 4, as comparative samples for EFEA simulation in Figure 6. Depending on the concept of the Brinell method demonstrated in Figure 2, it is essential to pinpoint the ball and indentation diameters at each run reported in Table 5. Accordingly, the standard ball diameter utilized in the experimental Brinell and D-Shore methods was 2.3813 mm. Additionally, the measurement time applied at each trial typically was 0.5 s for these samples. Therefore, the indentation radius can be predicted, as illustrated in Figure 6. Hence, the resulting diameters from the numerical and experimental at each run can measure the Brinell hardness number described in Equation (7).
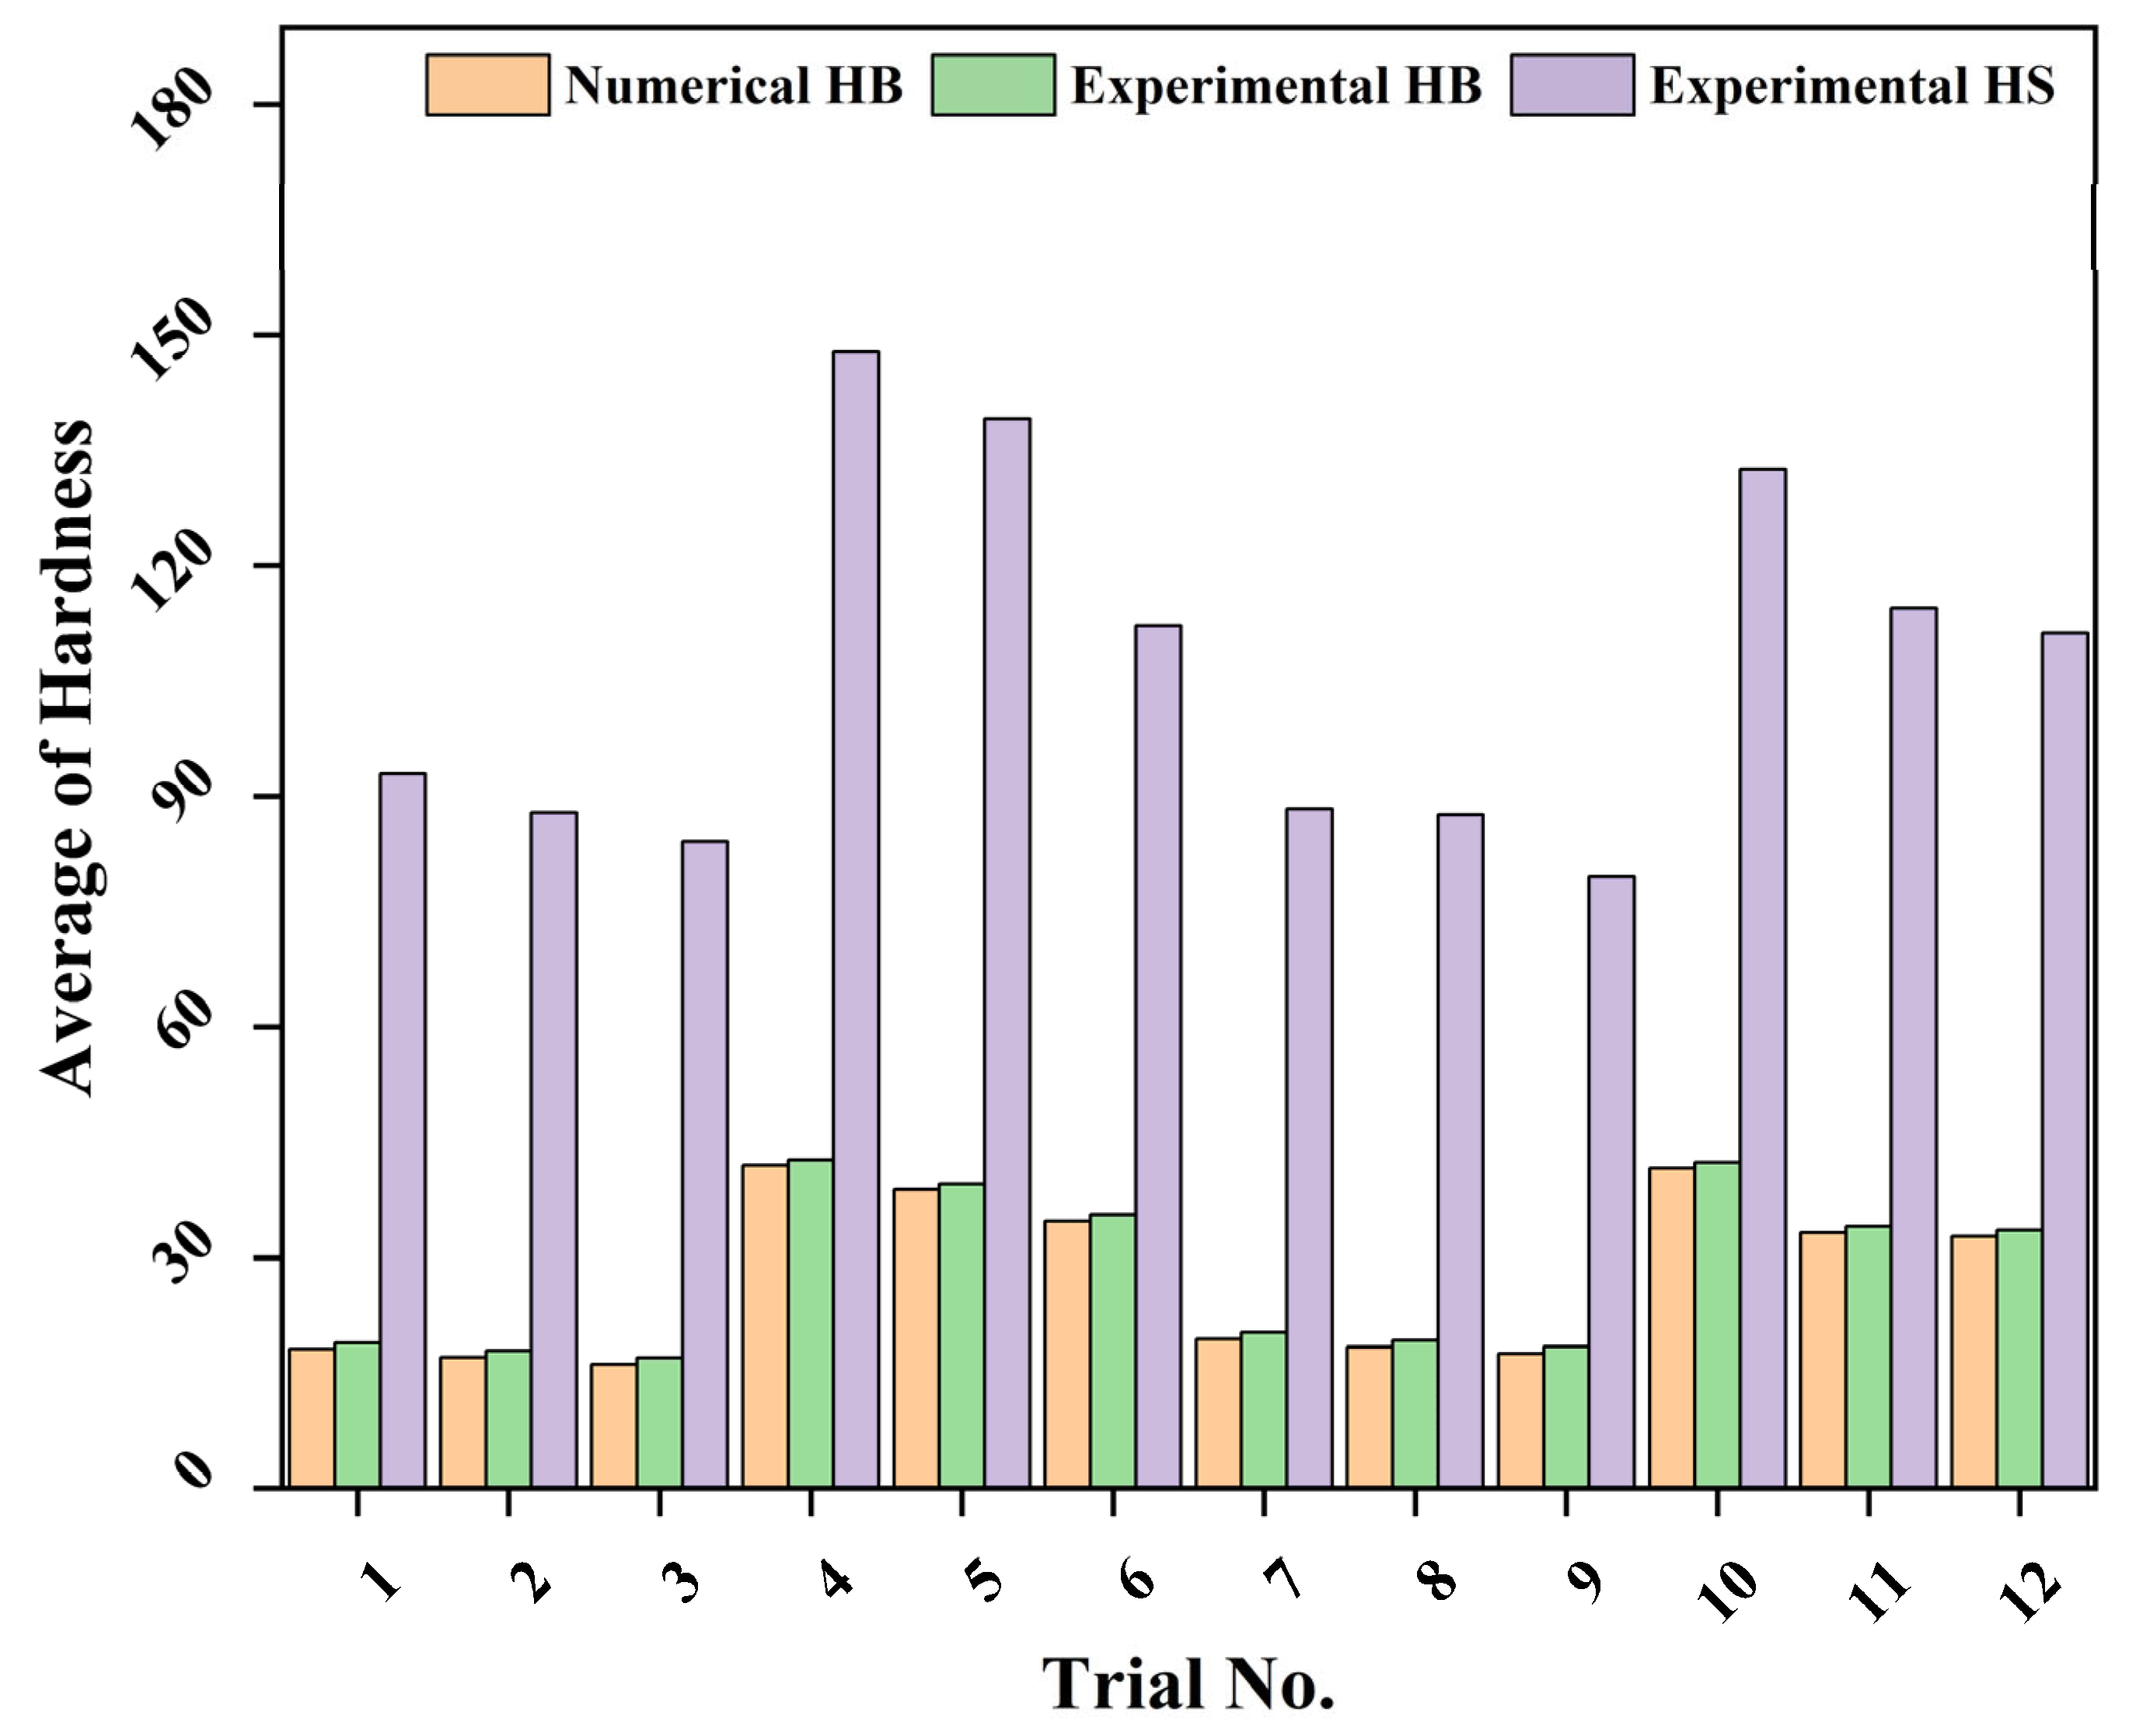
In Table 6, the predictive and experimental data reflected the reality of validation for HB numbers, and the error ratios did not exceed 6% for all trials. In prior studies of bone fabrication [48,49,50], the test methodology for mechanical properties depended on checking the structural integrity and accuracy of pores in bone scaffolds using optical microscopy before these tests. These studies have shown a slight discrepancy in dimensions between CAD models and real samples, where the consistency of flow rate, melt viscosity, and thermal shrinkage for PLA filaments during the 3D printing deposition operation is slightly fluctuating [51,52,53,54,55]. Therefore, these limitations related to thermal deposition in additive manufacturing technology contribute to this discrepancy, resulting in error ratios between predicted and experimental HB values of less than 6%. Consequently, the symmetrical model adopted in EFEA for HB is feasible and can predict the strength behavior against the indentation for PLA samples. Accordingly, the predictive environment played a significant role in demonstrating the viability of these designed samples, illustrated in Figure 3, in the experimental medium. As depicted in Figure 6, the predicted outputs of HB numbers for trials 1 and 4 have approached the experimental outcomes at (100×100 μm2) of pore size, where the error ratios illustrated in Table 6 for these trials were not over 5% and 2%, respectively. On the other hand, the average hardness numbers produced by the D-Shore method for runs 1 and 4 in Table 7 were 92.98 and 147.83, respectively. However, what's important is that the leap of HB and HS numbers in Table 6 and Table 7 increased by 125.489% and 58.991% for these trials sequentially. This leap in these outcomes, as described in Figure 7, was a result of employing -45˚/45˚ for odd and even layers in Micro-sample No. 4 instead of 0˚/90˚, since this OL at -45˚/45˚ can efficiently analyze and reduce plastic strain during this hardness test compared to 0˚/90˚ [56,57].
The non-hybrid pore sizes employed in trials from (1) to (6), as illustrated in Table 6 and Table 7 and Figure 7, revealed that the OL parameter played a less essential role for HB and HS numbers at 0˚/90˚ compared to -45˚/45˚. Simultaneously, the hardness number depending on the Brinell and D-Shore methods at the size of the hybrid pores for runs from (7) to (12) has a similar behavior to trials No. 1-6, especially at -45˚/ 45˚. Nonetheless, the size of pores in hybrid run 10 had less influence on HB and HS numbers compared to trial 4, as depicted in Figure 7, at -45˚/45˚. The main reason for this behavior is attributed to the homogeneity of pore sizes in the non-hybrid case for run No. 4. Consequently, the concentration of porosity density in these samples is lower [58,59,60]. In contrast, the values of HB and HS for trials No. 1 and 7 have a slighter effect at 0˚/90˚ than trials No. 4 and 10. According to the Analysis of Variance (ANOVA) illustrated in Table 8 and Table 9, the size of the pores in the trials conducted is a non-significant parameter in the Brinell and D-Shore tests, while the OL-Parameter is dominant in these runs. Given these facts, trial No. 4 is considered the best outcome for HB and HS at 100×100 μm2 and -45˚/45˚ for OL and PS, respectively, where this design supplies a lower intensity of porosity with the ability to reduce the indentation force at angles -45˚/45˚. Therefore, the outcomes of ANOVA, besides the behavior of Micro-Samples, indicate that the increased pore sizes over 100×100 μm2 in non-hybrid and hybrid cases lead to a lowering of the dominance of the PS parameter in the current work. Casually, the strength in these samples is insufficient to resist the indentation resulting from the hardness tool [61,62].
Depending on the experimental outcomes, the fitting function for the D-Shore hardness number (HS) based on the number of Brinell hardness (HB) is:
where A and Q are the empirical constants related to the experimental data of hardness numbers (HS) and (HB) relying on OL and PS parameters operated in the present work. Accordingly, both sides of Equation (8) apply the logarithmic rule to determine these empirical constants, as follows [63]:
Then, the fitted values are:
It is better to minimize Equation (8) to avoid unfitted values of HB and HS numbers as observed:
Based on the least squares fitting rule, then Equation (12) yields:
Finally, the fitted values of the constants A and Q are:
Thus, the coefficients A and Q of the D-Shore hardness number in Equation (8) for non-hybrid and hybrid pore sizes cases in Table 8, depending on the number of Brinell, describe the outcomes of Equations (16) and (17) consecutively.
According to these results, the empirical model of the D-Shore number in Equation (8) is deemed a novel model output based on HB numbers, where the correlation factor (R2) for this model, as demonstrated in Table 10, has ranged from 0.9955 to 0.9999. In the tissue engineering of bones, as a practical application, this model can be utilized to estimate the hardness of biomedical parts fabricated from PLA filaments [64,65,66]. Moreover, the experimental results presented in this study demonstrated that the size of the minimum pores in the non-hybrid style at -45˚/45˚ is beneficial for this novel model, as the lower porosity concentration contributes to enhancing the strength of the PLA surface against indentation [61]. As the scope of future work, this model can be improved by incorporating a variety of pore shapes and filament types in the biomedical fabrication fields (61,62) [67,68].
5. Conclusions
The porosity in the microfabrication is a promising area in developing bone tissue modeling. Therefore, this article adopted a regular distribution of non-hybrid and hybrid dimensions for micro-pore sizes of PLA samples. These samples consist of 12 layers with orientation angle (0˚/90˚) or (-45˚/45˚), where these pores are distributed at each layer. Hence, the current study aimed to design a feasible approach against the indentation for each sample based on the principles of Explicit Finite Element Analysis (EFEA). The experimental outcomes of Brinell and D-Shore hardness numbers were also utilized to develop a novel mathematical model for D-Shore hardness, based on these results. Consequently, the present study concluded the following:
- The predictive environment using EFEA bases contributed to specifying a feasible design for the Micro-Samples against the indentation force. The best samples for 0˚/90˚ and -45˚/45˚ were at trials Nos. 1 and 4, respectively. Whereby the Brinell hardness numbers were 18.12 and 41.99 consecutively. Experimentally, the estimated values of HB were 18.91 and 42.64 for these runs. Hence, the error ratios for these experiments did not exceed 5% and 2% successively.
- The orientation layers for the printed Micro-Sample at -45˚/45˚ rather than 0˚/90˚ effectively enhanced the analysis of indentation force and reduced plastic strain in trial No. 4. As a result of this behavior, the average number of HS based on the D-Shore method increased from 92.98 to 147.83, by 58.991% for runs Nos. 1 and 4 sequentially. On the other hand, the growth ratio of HB was 125.489% based on the expansion in HB number from 18.91 to 42.64 for trials Nos. 1 and 4, respectively.
- The orientation layers according to ANOVA are the dominant factor in the Micro-samples, while the pore sizes at (100×100 μm2), as a feasible parameter in the tissue's pore design, lost their dominant role over this size. The main reason for this behavior is attributed to the increased porosity percentage in these samples, which contributes to reducing the resistance of the sample surface against the indentation force of the hardness tool.
- The proposed model for D-Shore hardness, a novel model based on the experimental results of HB and HS numbers, has boasted a correlation rate from 99.55% to 99.99%. Consequently, this model can measure the number of D-Shore hardness using the Brinell method only for PLA samples with various fields, especially in the bone- biomedical area.
Relying on these truths to enhance the resistance of indentation, this article encourages that the pore of tissue design must not exceed (100x100 μm2). Likewise, the orientation layers for bone fabrication must employ (-45˚/45˚). Similarly, the main recommendation is to employ the novel model of D-Shore produced from this study to measure the hardness of PLA samples based on HB numbers. Therefore, it can utilize these outcomes in tissue engineering applications for bone fabrication, with the ability to employ different types of filaments and other shapes for the tissue's pores.
Author Contributions
Conceptualization, M.A.A., M.A., A.H.S.A., M.A.L. and R.H.; methodology, M.A.A., M.A., A.H.S.A., M.A.L. and R.H.; software, M.A.A.; validation, M.A.A., M.A. and A.H.S.A.; formal analysis, M.A.A.; investigation, M.A.A. and M.A.; resources, M.A.A., M.A. and A.H.S.A.; data curation, M.A.A.; writing—original draft preparation, M.A.A.; writing—review and editing, M.A.L. and R.H.; visualization, M.A.A. and M.A.; supervision, M.A.A., M.A.L. and R.H.; project administration, M.A.A. All authors have read and agreed to the published version of the manuscript.
Data Availability Statement
The data presented in this study are available on request from the corresponding author.
Conflicts of Interest
On behalf of all authors, the corresponding author states there is no conflict of interest.
Acknowledgments
The authors would like to express a special heartfelt appreciation to the Ministry of Higher Education and Scientific Research in Iraq for its encouragement and support. They also extend their heartfelt gratitude to the Engineering Technical College of Najaf and the Faculty Polytechnic of Kufa at Al-Furat Al-Awsat Technical University (ATU) in Najaf, Iraq, and to the Sustainable Manufacturing and Recycling Technology-Advanced Manufacturing and Materials Centre (SMART-AMMC) at Universiti Tun Hussein Onn Malaysia (UTHM) in Parit Raja, Malaysia, for their invaluable contributions.
References
- Kostidi, E.; Nikitakos, N. Exploring the potential of 3D printing of the spare parts supply chain in the maritime industry. In Safety of Sea Transportation; CRC Press, 2017; pp. 171–178. [Google Scholar]
- Mohammed, J.S. Applications of 3D printing technologies in oceanography. Methods Oceanogr. 2016, 17, 97–117. [Google Scholar] [CrossRef]
- Mouzakis, D.E. Advanced technologies in manufacturing 3D-layered structures for defense and aerospace. Lamination-Theory Appl. 2018, 74331. [Google Scholar] [CrossRef]
- Bakhtiar, S.M.; Butt, H.A.; Zeb, S.; Quddusi, D.M.; Gul, S.; Dilshad, E. 3D printing technologies and their applications in biomedical science. In Omics technologies and bio-engineering; Elsevier, 2018; pp. 167–189. [Google Scholar] [CrossRef]
- Dawood, A.; Marti, B.M.; Sauret-Jackson, V.; Darwood, A. 3D printing in dentistry. Br. Dent. J. 2015, 219, 521–529. [Google Scholar] [CrossRef] [PubMed]
- Feng, Y.; Zhu, S.; Mei, D.; Li, J.; Zhang, J.; Yang, S.; Guan, S. Application of 3D printing technology in bone tissue engineering: a review. Curr. Drug Deliv. 2021, 18, 847–861. [Google Scholar] [CrossRef] [PubMed]
- Lin, L.; Fang, Y.; Liao, Y.; Chen, G.; Gao, C.; Zhu, P. 3D printing and digital processing techniques in dentistry: a review of literature. Adv. Eng. Mater. 2019, 21, 1801013. [Google Scholar] [CrossRef]
- Islam, A.; Mammadov, E.; Kendirci, R.; Aytac, E.; Cetiner, S.; Vatansever, H.S. In vitro cultivation, characterization and osteogenic differentiation of stem cells from human exfoliated deciduous teeth on 3D printed polylactic acid scaffolds. Iran. Red. Crescent Med. J. 2017. [Google Scholar] [CrossRef]
- Karacan, I.; Macha, I.J.; Choi, G.; Cazalbou, S.; Ben-Nissan, B. Antibiotic containing poly lactic acid/hydroxyapatite biocomposite coatings for dental implant applications. Key Eng. Mater. 2017, 758, 120–125. [Google Scholar] [CrossRef]
- Jandyal, A.; Chaturvedi, I.; Wazir, I.; Raina, A.; Haq, M.I.U. 3D printing–A review of processes, materials and applications in industry 4.0. Sustain. Oper. Comput. 2022, 3, 33–42. [Google Scholar] [CrossRef]
- Ngo, T.D.; Kashani, A.; Imbalzano, G.; Nguyen, K.T.; Hui, D. Additive manufacturing (3D printing): A review of materials, methods, applications and challenges. Compos. Part B Eng. 2018, 143, 172–196. [Google Scholar] [CrossRef]
- Farah, S.; Anderson, D.G.; Langer, R. Physical and mechanical properties of PLA, and their functions in widespread applications—A comprehensive review. Adv. Drug Deliv. Rev. 2016, 107, 367–392. [Google Scholar] [CrossRef] [PubMed]
- Kumar, R.; Kumar, M.; Chohan, J.S. The role of additive manufacturing for biomedical applications: A critical review. J. Manuf. Process. 2021, 64, 828–850. [Google Scholar] [CrossRef]
- Tyler, B.; Gullotti, D.; Mangraviti, A.; Utsuki, T.; Brem, H. Polylactic acid (PLA) controlled delivery carriers for biomedical applications. Adv. Drug Deliv. Rev. 2016, 107, 163–175. [Google Scholar] [CrossRef] [PubMed]
- Gregor, A.; Filová, E.; Novák, M.; Kronek, J.; Chlup, H.; Buzgo, M.; Blahnová, V.; Lukášová, V.; Bartoš, M.; Nečas, A. Designing of PLA scaffolds for bone tissue replacement fabricated by ordinary commercial 3D printer. J. Biol. Eng. 2017, 11, 31. [Google Scholar] [CrossRef] [PubMed]
- Diomede, F.; Gugliandolo, A.; Cardelli, P.; Merciaro, I.; Ettorre, V.; Traini, T.; Bedini, R.; Scionti, D.; Bramanti, A.; Nanci, A. Three-dimensional printed PLA scaffold and human gingival stem cell-derived extracellular vesicles: a new tool for bone defect repair. Stem Cell Res. Ther. 2018, 9, 104. [Google Scholar] [CrossRef] [PubMed]
- Ajaal, T.T. Dev. Hydroxyapatite Scaffolds Artif. Bone Grafts 2003. [CrossRef]
- Kumar, A. Synthesis and Characterization of Porous Titania for Bone Implants. 2010. [Google Scholar] [CrossRef] [PubMed]
- Oh, D.S.; Kim, Y.H.; Ganbat, D.; Han, M.-H.; Lim, P.; Back, J.-H.; Lee, F.Y.; Tawfeek, H. Bone marrow absorption and retention properties of engineered scaffolds with micro-channels and nano-pores for tissue engineering: a proof of concept. Ceram. Int. 2013, 39, 8401–8410. [Google Scholar] [CrossRef]
- Singhvi, M.; Zinjarde, S.; Gokhale, D. Polylactic acid: synthesis and biomedical applications. J. Appl. Microbiol. 2019, 127, 1612–1626. [Google Scholar] [CrossRef] [PubMed]
- Lalegani Dezaki, M.; Mohd Ariffin, M.K.A.; Hatami, S. An overview of fused deposition modelling (FDM): research, development and process optimisation. Rapid Prototyp. J. 2021, 27, 562–582. [Google Scholar] [CrossRef]
- Popescu, D.; Zapciu, A.; Amza, C.; Baciu, F.; Marinescu, R. FDM process parameters influence over the mechanical properties of polymer specimens: A review. Polym. Test. 2018, 69, 157–166. [Google Scholar] [CrossRef]
- Solomon, I.J.; Sevvel, P.; Gunasekaran, J. A review on the various processing parameters in FDM. Mater. Today Proc. 2021, 37, 509–514. [Google Scholar] [CrossRef]
- Hanon, M.M.; Dobos, J.; Zsidai, L. The influence of 3D printing process parameters on the mechanical performance of PLA polymer and its correlation with hardness. Procedia Manuf. 2021, 54, 244–249. [Google Scholar] [CrossRef]
- Zhiani Hervan, S.; Altınkaynak, A.; Parlar, Z. Hardness, friction and wear characteristics of 3D-printed PLA polymer. Proc. Inst. Mech. Eng. Part J. J. Eng. Tribol. 2021, 235, 1590–1598. [Google Scholar] [CrossRef]
- Maguluri, N.; Suresh, G.; Guntur, S.R. Effect of printing parameters on the hardness of 3D printed poly-lactic acid parts using DOE approach. In Proceedings of the IOP Conference Series: Materials Science and Engineering, 2022; p. 012004. [Google Scholar] [CrossRef]
- Mani, M.; Karthikeyan, A.; Kalaiselvan, K.; Muthusamy, P.; Muruganandhan, P. Optimization of FDM 3-D printer process parameters for surface roughness and mechanical properties using PLA material. Mater. Today Proc. 2022, 66, 1926–1931. [Google Scholar] [CrossRef]
- Sarkar, M.; Samanta, S.; Paul, T. Influence of process parameters on material addition rate and hardness of 3D printer material. Mater. Today Proc. 2023, 80, 1599–1604. [Google Scholar] [CrossRef]
- Broitman, E. Indentation hardness measurements at macro-, micro-, and nanoscale: a critical overview. Tribol. Lett. 2017, 65, 23. [Google Scholar] [CrossRef]
- Okafor, C.E.; Sunday, I.; Ani, O.I.; Akçakale, N.; Ekwueme, G.O.; Ugwu, P.C.; Nwanna, E.C.; Onovo, A.C. Biobased hybrid composite design for optimum hardness and wear resistance. Compos. Part C Open Access 2023, 10, 100338. [Google Scholar] [CrossRef]
- Alshihabi, M.; Kayacan, M.Y. An optimization study focused on lattice structured custom arm casts for fractured bones inspiring additive manufacturing. Int. Adv. Res. Eng. J. 2024, 8, 9–19. [Google Scholar] [CrossRef]
- Qing, J.; Wei, J.; Jianya, Y.; Zhang, L.; Ma, J.; Wang, Z. Study on the static and dynamic mechanical properties and constitutive models of 3D printed PLA and PLA-Cu materials. Mater. Today Commun. 2024, 39, 108690. [Google Scholar] [CrossRef]
- Dussault, A.; Pitaru, A.A.; Weber, M.H.; Haglund, L.; Rosenzweig, D.H.; Villemure, I. Optimizing design parameters of PLA 3D-printed scaffolds for bone defect repair. Surgeries 2022, 3, 162–174. [Google Scholar] [CrossRef]
- Gonabadi, H.; Chen, Y.; Yadav, A.; Bull, S. Investigation of the effect of raster angle, build orientation, and infill density on the elastic response of 3D printed parts using finite element microstructural modeling and homogenization techniques. Int. J. Adv. Manuf. Technol. 2022, 118, 1485–1510. [Google Scholar] [CrossRef]
- Wang, X.; Zhao, L.; Fuh, J.Y.H.; Lee, H.P. Effect of porosity on mechanical properties of 3D printed polymers: Experiments and micromechanical modeling based on X-ray computed tomography analysis. Polymers 2019, 11, 1154. [Google Scholar] [CrossRef] [PubMed]
- Lee, H.-H. Finite element simulations with ANSYS workbench 2023: Theory, applications, case studies; SDC publications, 2023. [Google Scholar]
- Holmquist, T.; Randow, C. Modeling the ballistic response of the 14.5 mm BS41 projectile. Eur. Phys. J. Spec. Top. 2012, 206, 129–137. [Google Scholar] [CrossRef]
- Usta, F.; Türkmen, H.S.; Scarpa, F. Low-velocity impact resistance of composite sandwich panels with various types of auxetic and non-auxetic core structures. Thin-Walled Struct. 2021, 163, 107738. [Google Scholar] [CrossRef]
- Zhu, H.; Zhang, C.; Chen, S.; Wu, J. A modified Johnson-Cook constitutive model for structural steel after cooling from high temperature. Constr. Build. Mater. 2022, 340, 127746. [Google Scholar] [CrossRef]
- Priyanka, G.; Saideep, C.; Tadepalli, T. Dynamic characterization of additively manufactured polylactide (PLA). Proceedings of the Institution of Mechanical Engineers, Part L: Journal of Materials: Design and Applications 2022, 236, 963–976. [Google Scholar] [CrossRef]
- Bartoš, M.; Suchý, T.; Foltán, R. Note on the use of different approaches to determine the pore sizes of tissue engineering scaffolds: what do we measure? Biomed. Eng. Online 2018, 17, 110. [Google Scholar] [CrossRef] [PubMed]
- Gupte, M.J.; Swanson, W.B.; Hu, J.; Jin, X.; Ma, H.; Zhang, Z.; Liu, Z.; Feng, K.; Feng, G.; Xiao, G. Pore size directs bone marrow stromal cell fate and tissue regeneration in nanofibrous macroporous scaffolds by mediating vascularization. Acta Biomater. 2018, 82, 1–11. [Google Scholar] [CrossRef] [PubMed]
- Mukasheva, F.; Adilova, L.; Dyussenbinov, A.; Yernaimanova, B.; Abilev, M.; Akilbekova, D. Optimizing scaffold pore size for tissue engineering: insights across various tissue types. Front. Bioeng. Biotechnol. 2024, 12, 1444986. [Google Scholar] [CrossRef] [PubMed]
- Mukhopadhyay, B.; Jena, M.K.; Singh, S. Advances in bone tissue engineering: Addressing challenges in conventional techniques for treating bone defects and delving into recent advancements. Transform. Technol. 2026, 52–77. [Google Scholar]
- Wang, X.; Zhang, D.; Peng, H.; Yang, J.; Li, Y.; Xu, J. Optimize the pore size-pore distribution-pore geometry-porosity of 3D-printed porous tantalum to obtain optimal critical bone defect repair capability. Biomater. Adv. 2023, 154, 213638. [Google Scholar] [CrossRef] [PubMed]
- Yamahara, S.; Raudales, J.L.M.; Akiyama, Y.; Ito, M.; Chimedtseren, I.; Arai, Y.; Wakita, T.; Hiratsuka, T.; Miyazawa, K.; Goto, S. Appropriate pore size for bone formation potential of porous collagen type I-based recombinant peptide. Regen. Ther. 2022, 21, 294–306. [Google Scholar] [CrossRef] [PubMed]
- Zhang, Y.; Sun, N.; Zhu, M.; Qiu, Q.; Zhao, P.; Zheng, C.; Bai, Q.; Zeng, Q.; Lu, T. The contribution of pore size and porosity of 3D printed porous titanium scaffolds to osteogenesis. Biomater. Adv. 2022, 133, 112651. [Google Scholar] [CrossRef] [PubMed]
- Abdelgaber, Y.; Klemstine, C.; Salary, R. A novel, image-based method for characterization of the porosity of additively manufactured bone scaffolds with complex microstructures. J. Manuf. Sci. Eng. 2023, 145, 041008. [Google Scholar] [CrossRef]
- Woodard, J.R.; Hilldore, A.J.; Lan, S.K.; Park, C.; Morgan, A.W.; Eurell, J.A.C.; Clark, S.G.; Wheeler, M.B.; Jamison, R.D.; Johnson, A.J.W. The mechanical properties and osteoconductivity of hydroxyapatite bone scaffolds with multi-scale porosity. Biomaterials 2007, 28, 45–54. [Google Scholar] [CrossRef] [PubMed]
- Xu, C.; Zhang, H.; Yu, S.; Wu, W.; Zhang, L.; Liu, Q.; Ren, L. Direct ink writing of porous Fe scaffolds for bone implants: Pore size evolution and effect on degradation and mechanical properties. J. Mater. Res. Technol. 2023, 25, 4901–4912. [Google Scholar] [CrossRef]
- Jahir-Hussain, M.; Maaruf, N.; Esa, N.; Jusoh, N. The effect of pore geometry on the mechanical properties of 3D-printed bone scaffold due to compressive loading. In Proceedings of the IOP Conference Series: Materials Science and Engineering, 2021; p. 012016. [Google Scholar] [CrossRef]
- Magri, A.E.; El Mabrouk, K.; Vaudreuil, S.; Touhami, M.E. Mechanical properties of CF-reinforced PLA parts manufactured by fused deposition modeling. J. Thermoplast. Compos. Mater. 2021, 34, 581–595. [Google Scholar] [CrossRef]
- Quan, R.; Cantero Chinchilla, S.; Liu, F. Investigation of the effects of 3D printing parameters on the mechanical properties of bone scaffolds: experimental study integrated with artificial neural networks. Bioengineering 2025, 12, 315. [Google Scholar] [CrossRef] [PubMed]
- Rasheed, S.; Lughmani, W.A.; Obeidi, M.A.; Brabazon, D.; Ahad, I.U. Additive manufacturing of bone scaffolds using polyjet and stereolithography techniques. Appl. Sci. 2021, 11, 7336. [Google Scholar] [CrossRef]
- Wang, F.; Tankus, E.B.; Santarella, F.; Rohr, N.; Sharma, N.; Märtin, S.; Michalscheck, M.; Maintz, M.; Cao, S.; Thieringer, F.M. Fabrication and characterization of PCL/HA filament as a 3D printing material using thermal extrusion technology for bone tissue engineering. Polymers 2022, 14, 669. [Google Scholar] [CrossRef] [PubMed]
- Samykano, M. Mechanical property and prediction model for FDM-3D printed polylactic acid (PLA). Arab. J. Sci. Eng. 2021, 46, 7875–7892. [Google Scholar] [CrossRef]
- Vorkapić, M.; Mladenović, I.; Ivanov, T.; Kovačević, A.; Hasan, M.S.; Simonović, A.; Trajković, I. Enhancing mechanical properties of 3D printed thermoplastic polymers by annealing in moulds. Adv. Mech. Eng. 2022, 14, 16878132221120737. [Google Scholar] [CrossRef]
- González-López, M.E.; Pérez-Fonseca, A.A.; Cisneros-López, E.O.; Manríquez-González, R.; Ramírez-Arreola, D.E.; Rodrigue, D.; Robledo-Ortíz, J.R. Effect of maleated PLA on the properties of rotomolded PLA-agave fiber biocomposites. J. Polym. Environ. 2019, 27, 61–73. [Google Scholar] [CrossRef]
- Kumar, S.; Singh, R.; Singh, T.; Batish, A. On flexural and pull out properties of 3D printed PLA based hybrid composite matrix. Mater. Res. Express 2020, 7, 015330. [Google Scholar] [CrossRef]
- Ramesh, M.; Panneerselvam, K. PLA-based material design and investigation of its properties by FDM. Adv. Addit. Manuf. Join. Proc. AIMTDR 2018 2019, 229–241. [Google Scholar] [CrossRef]
- Baptista, R.; Guedes, M. Morphological and mechanical characterization of 3D printed PLA scaffolds with controlled porosity for trabecular bone tissue replacement. Mater. Sci. Eng. C 2021, 118, 111528. [Google Scholar] [CrossRef] [PubMed]
- von Windheim, N.; Collinson, D.W.; Lau, T.; Brinson, L.C.; Gall, K. The influence of porosity, crystallinity and interlayer adhesion on the tensile strength of 3D printed polylactic acid (PLA). Rapid Prototyp. J. 2021, 27, 1327–1336. [Google Scholar] [CrossRef]
- Weisstein, E.W. Least squares fitting–exponential. MathWorld-A Wolfram Web Resour. 2011, 29. [Google Scholar]
- Hassanajili, S.; Karami-Pour, A.; Oryan, A.; Talaei-Khozani, T. Preparation and characterization of PLA/PCL/HA composite scaffolds using indirect 3D printing for bone tissue engineering. Mater. Sci. Eng. C 2019, 104, 109960. [Google Scholar] [CrossRef] [PubMed]
- Tajbakhsh, S.; Hajiali, F. A comprehensive study on the fabrication and properties of biocomposites of poly (lactic acid)/ceramics for bone tissue engineering. Mater. Sci. Eng. C 2017, 70, 897–912. [Google Scholar] [CrossRef] [PubMed]
- Wang, W.; Liu, P.; Zhang, B.; Gui, X.; Pei, X.; Song, P.; Yu, X.; Zhang, Z.; Zhou, C. Fused deposition modeling printed PLA/nano β-TCP composite bone tissue engineering scaffolds for promoting osteogenic induction function. Int. J. Nanomed. 2023, 5815–5830. [Google Scholar] [CrossRef] [PubMed]
- Entezari, A.; Roohani, I.; Li, G.; Dunstan, C.R.; Rognon, P.; Li, Q.; Jiang, X.; Zreiqat, H. Architectural design of 3D printed scaffolds controls the volume and functionality of newly formed bone. Adv. Healthc. Mater. 2019, 8, 1801353. [Google Scholar] [CrossRef] [PubMed]
- Yao, M.-X.; Shi, T.-L.; Zhang, Y.-Q.; Zhang, Y.-F.; Ren, C.; Dong, S.-W.; Hou, Z.-Y.; Zhang, Y.-Z.; Lv, H.-Z.; Chen, W. Optimising bionic pore designs in a spiral blade implant to enhance bone ingrowth and stability: A combined CFD and large-animal study. J. Orthop. Transl. 2026, 59, 101165. [Google Scholar] [CrossRef] [PubMed]
Figure 1.
This A graphical synopsis of the significant parameter ranges related to the hardness property and the sizes of the pores of PLA filaments. Observed in: (a) The parameters range adopted for measuring D-Shore hardness, and (b) The range of pore sizes.
Figure 1.
This A graphical synopsis of the significant parameter ranges related to the hardness property and the sizes of the pores of PLA filaments. Observed in: (a) The parameters range adopted for measuring D-Shore hardness, and (b) The range of pore sizes.
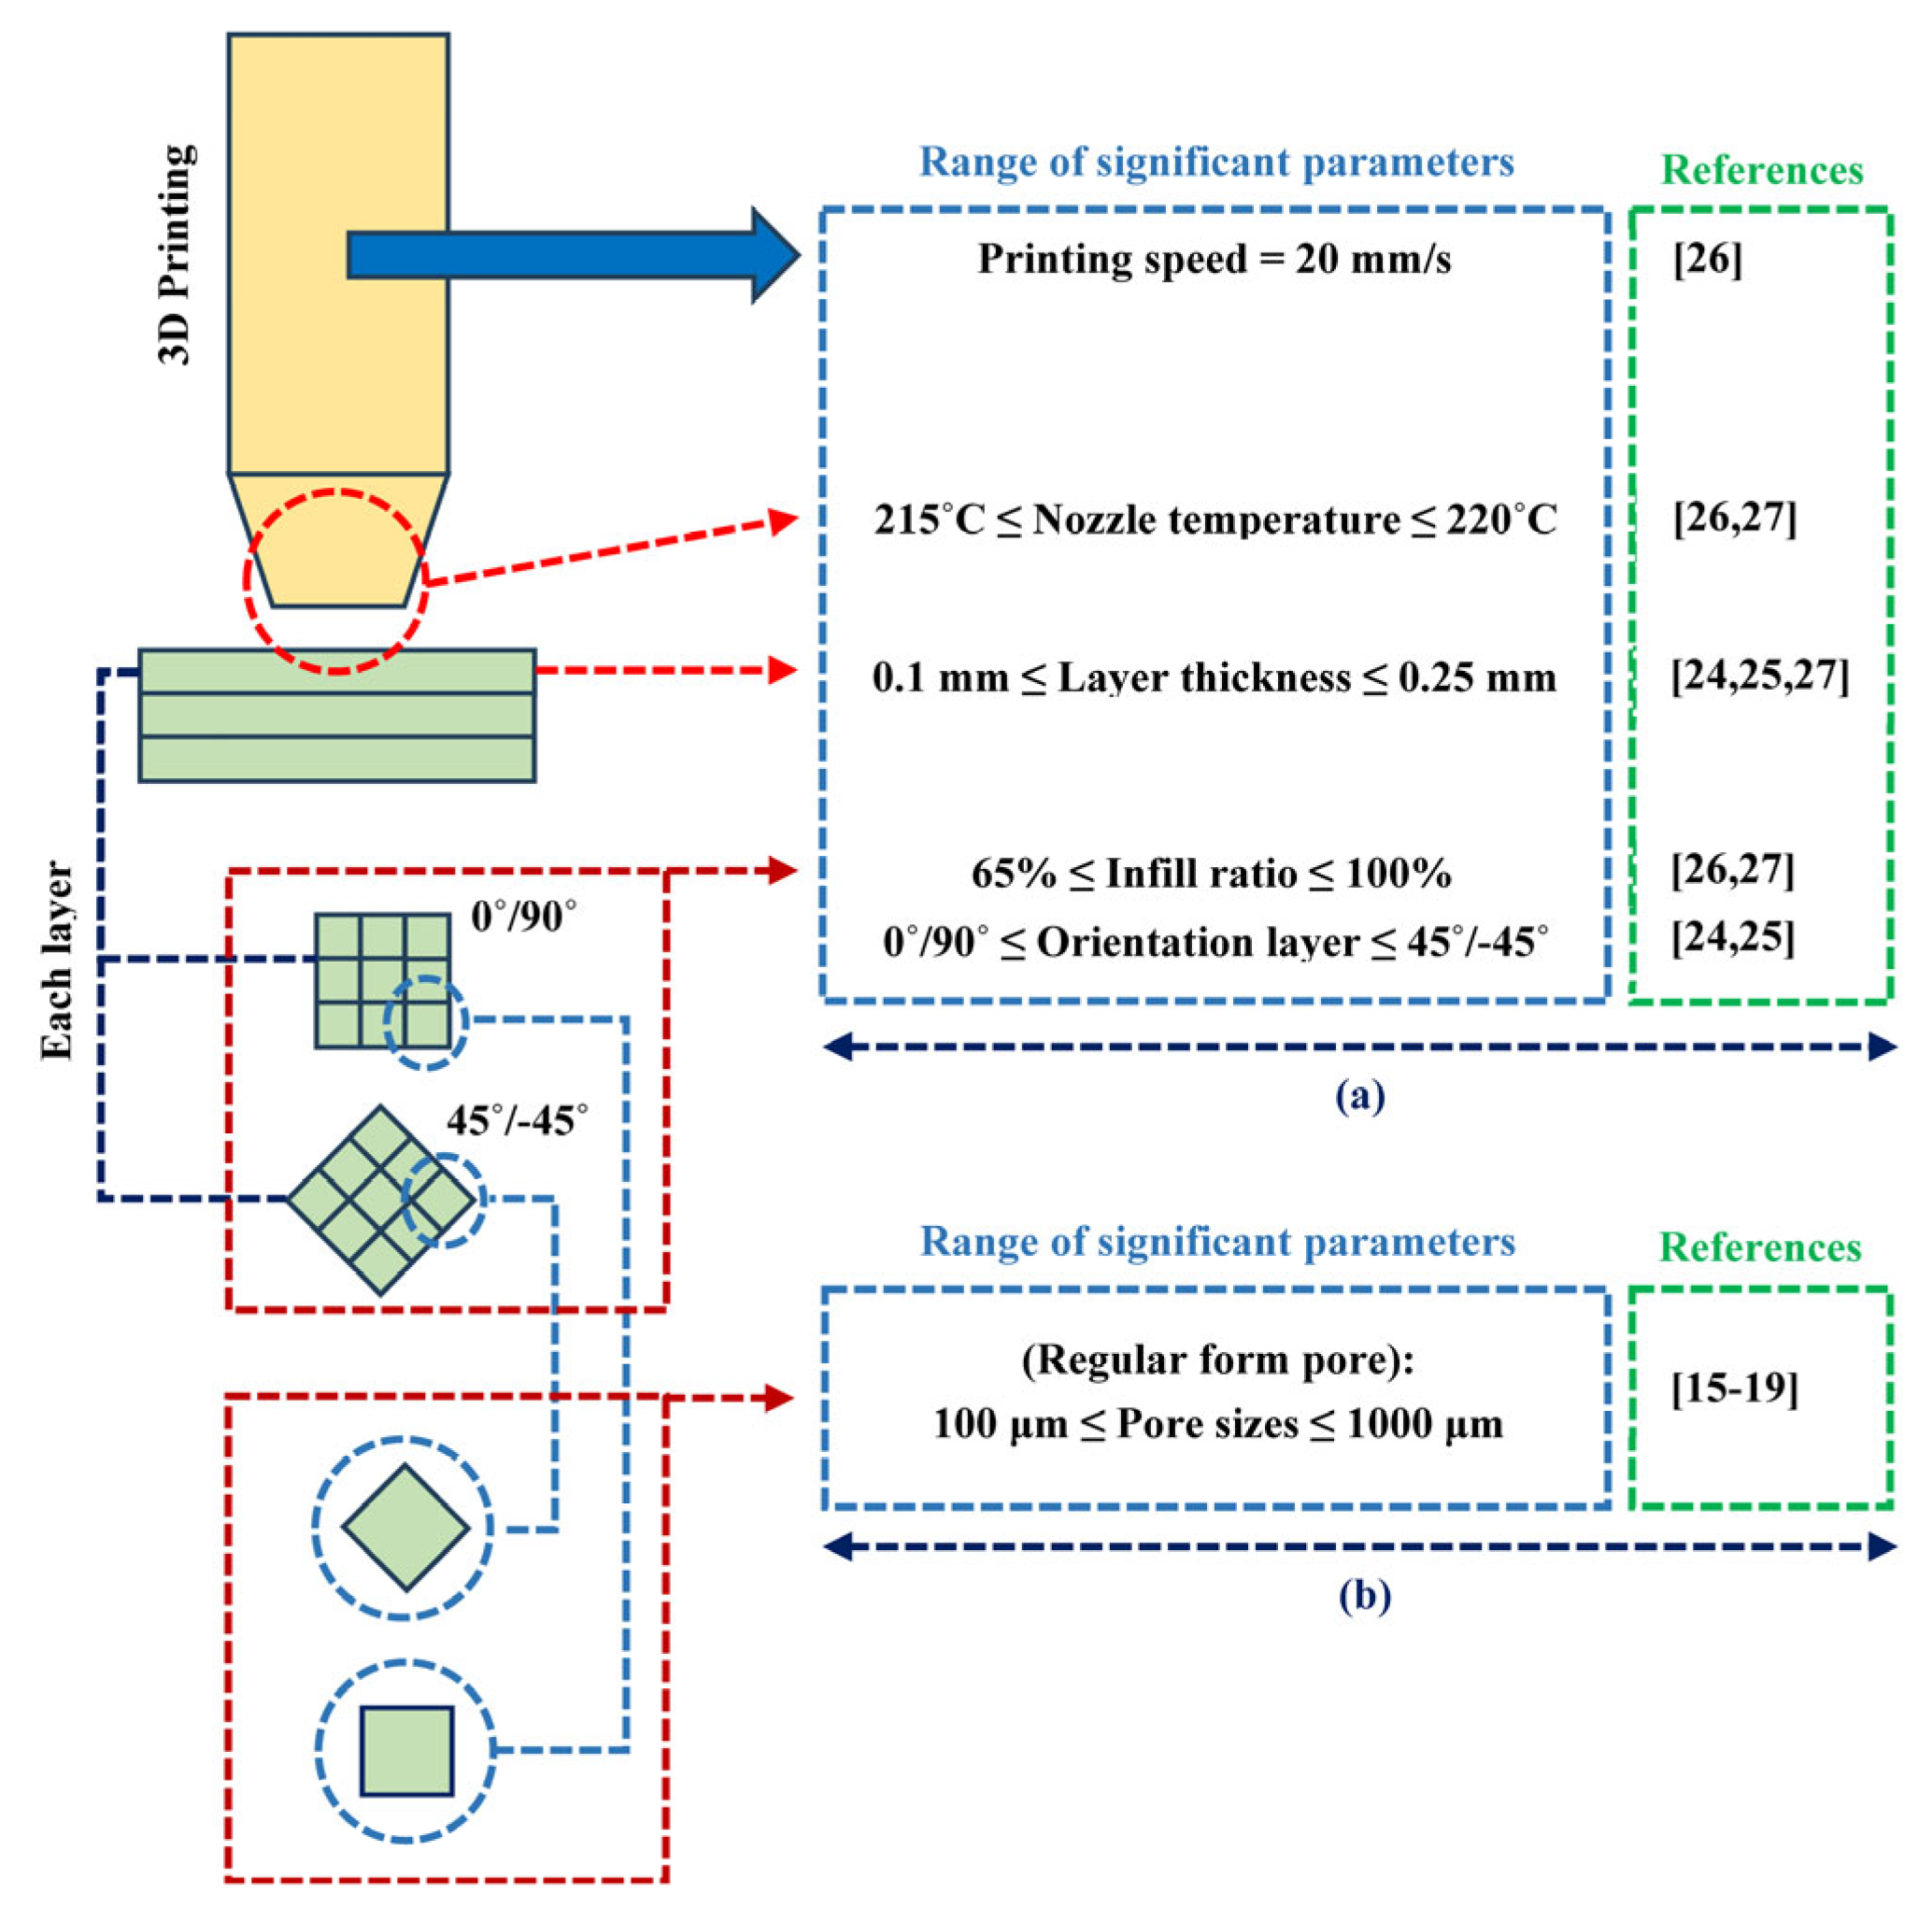
Figure 2.
Concept of Brinell hardness test. Observed in (a) Front view of ball indentation, and (b) Top view of indentation diameter.
Figure 2.
Concept of Brinell hardness test. Observed in (a) Front view of ball indentation, and (b) Top view of indentation diameter.
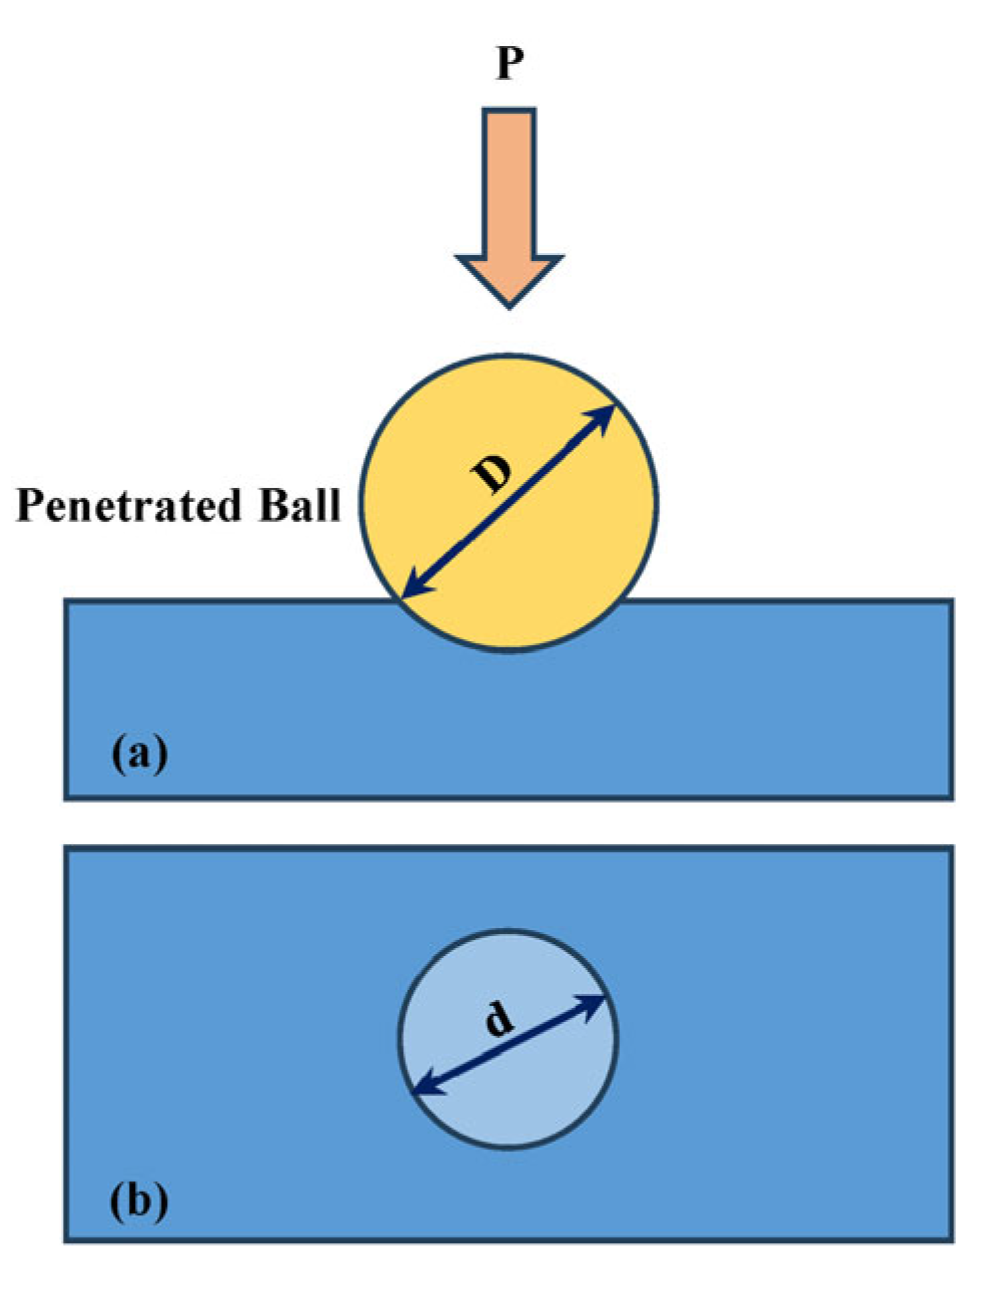
Figure 3.
CAD models for PLA samples employed in Brinell and D-Shore hardness tests. Observing the orientation layers and case of pore sizes in: (a-c) 0˚/90˚ with non-hybrid pore sizes, (d-f) 0˚/90˚ with hybrid pore sizes, (h-j) -45˚/45˚ with non-hybrid pore sizes, and (k-m) -45˚/45˚ with hybrid pore sizes, while in (g) Odd and even layers concept applied in each sample.
Figure 3.
CAD models for PLA samples employed in Brinell and D-Shore hardness tests. Observing the orientation layers and case of pore sizes in: (a-c) 0˚/90˚ with non-hybrid pore sizes, (d-f) 0˚/90˚ with hybrid pore sizes, (h-j) -45˚/45˚ with non-hybrid pore sizes, and (k-m) -45˚/45˚ with hybrid pore sizes, while in (g) Odd and even layers concept applied in each sample.
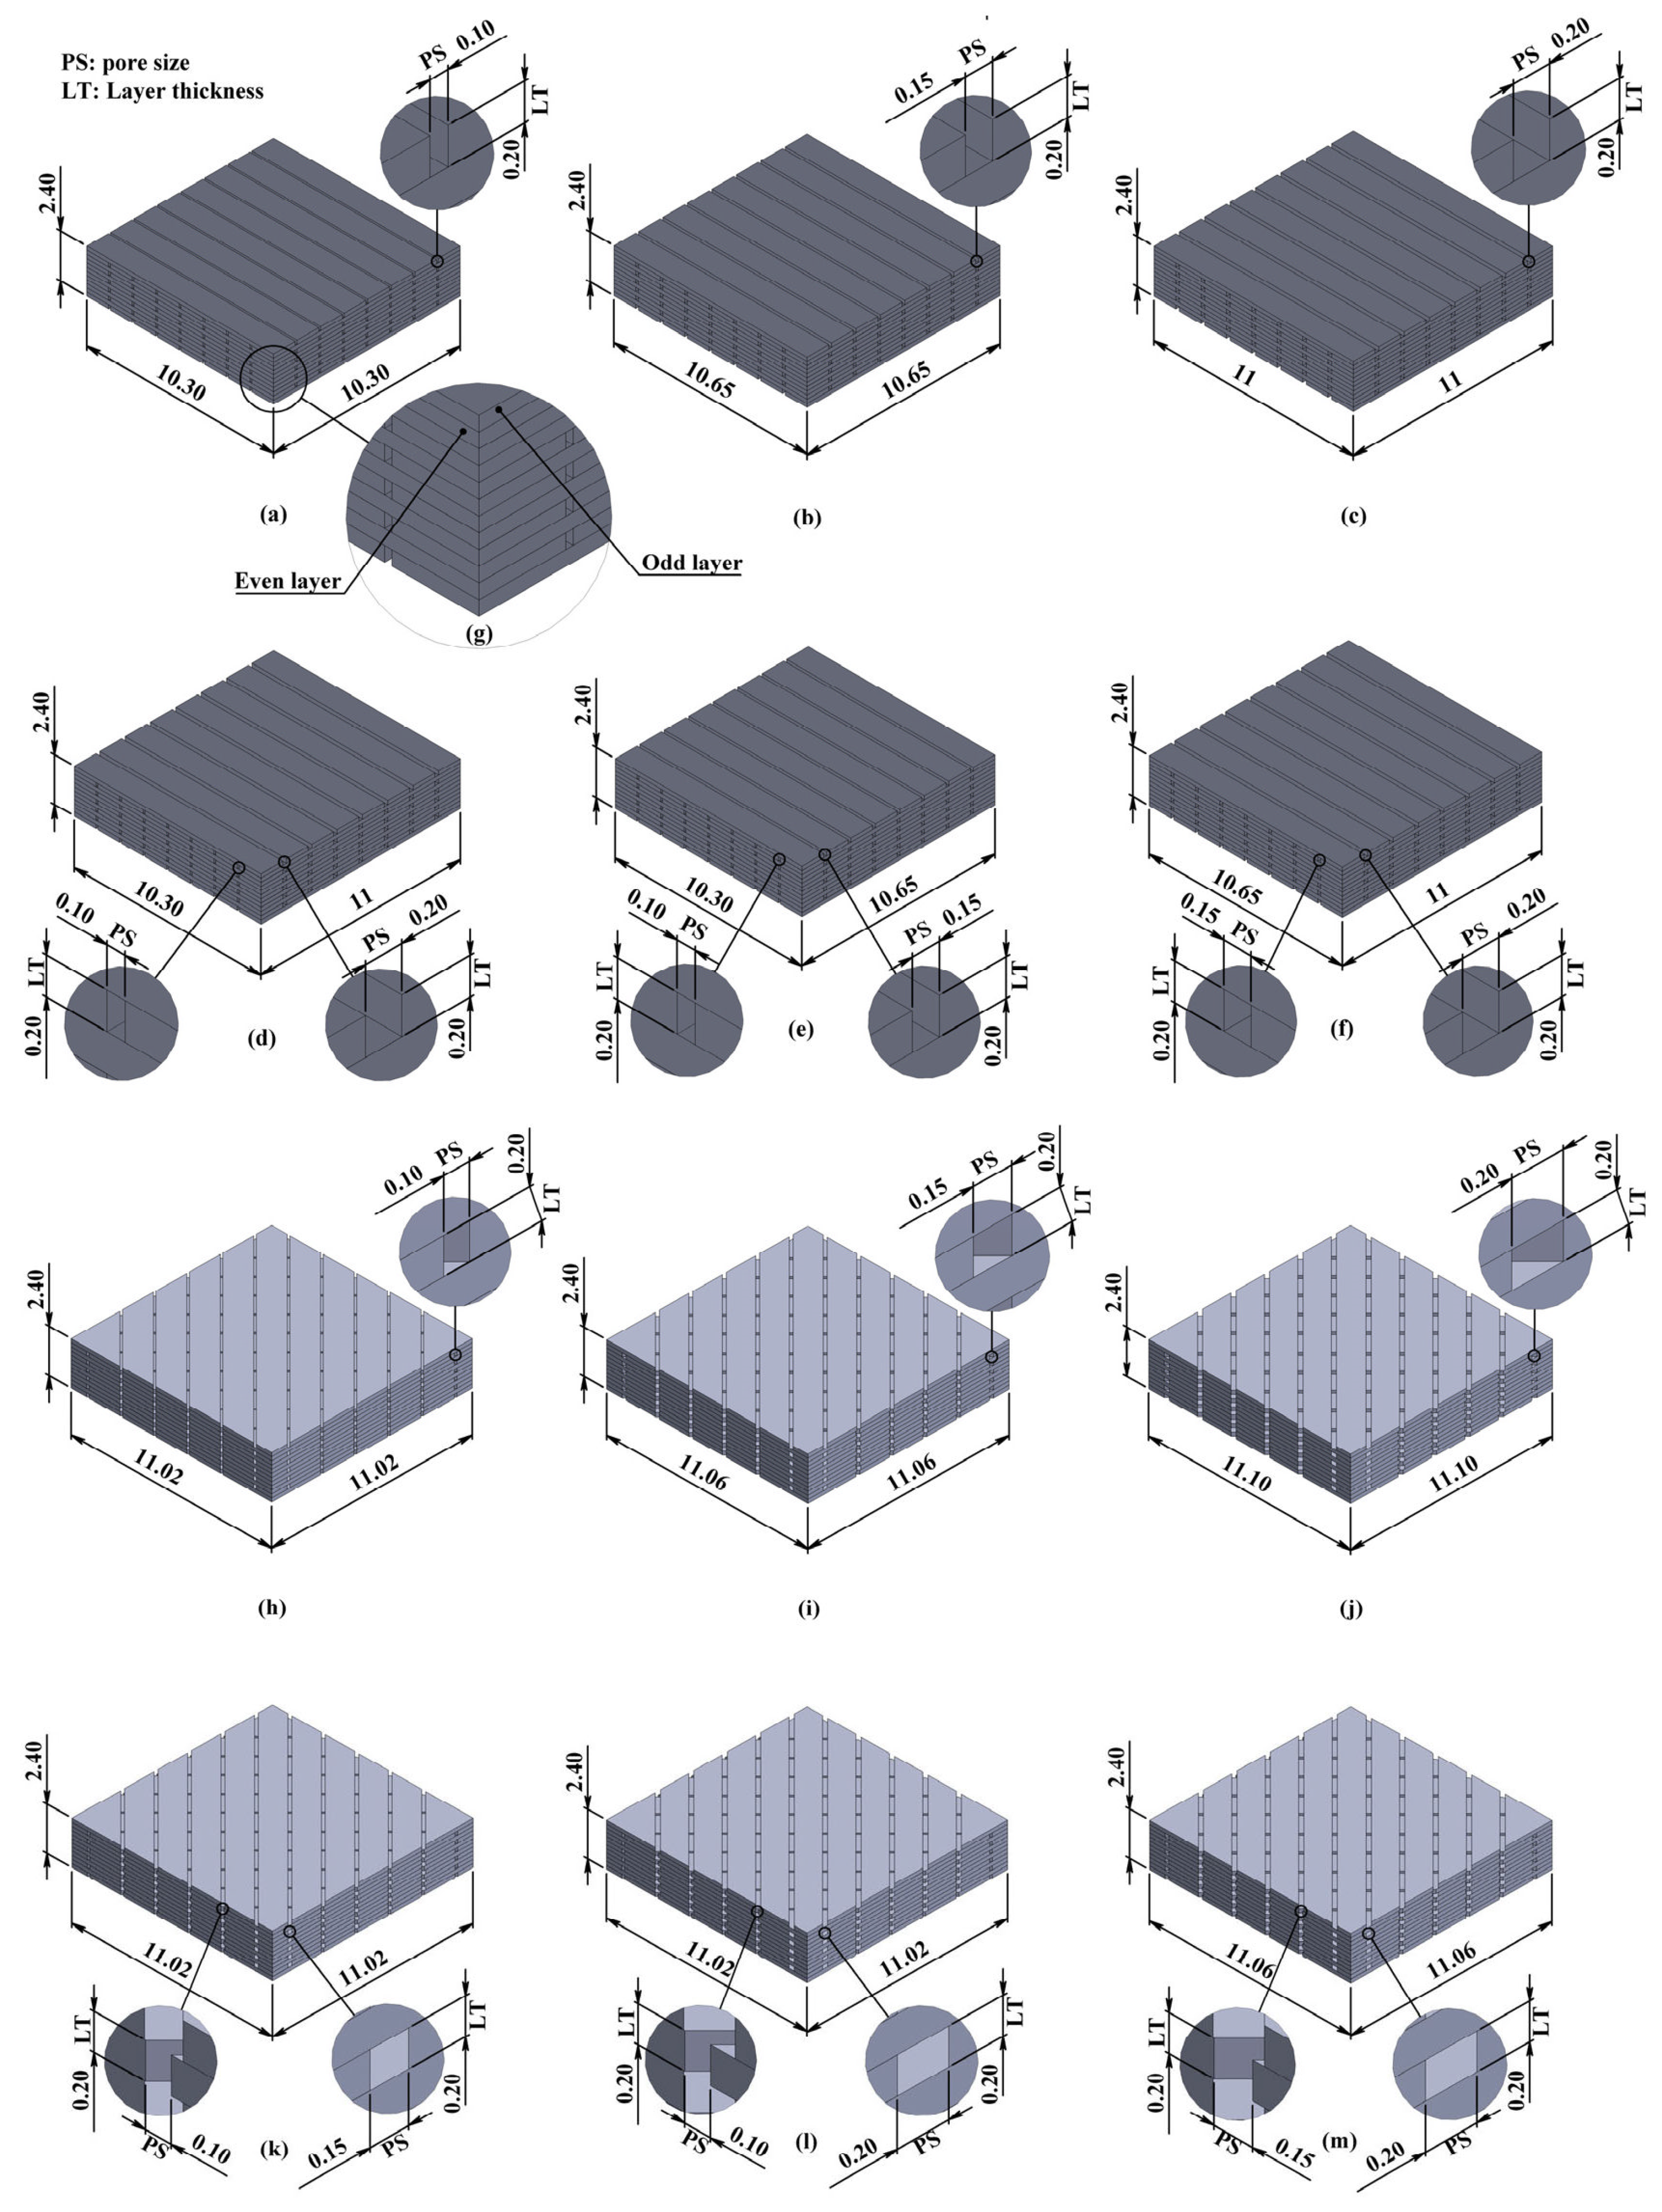
Figure 4.
2D-Symmetric meshing for PLA sample: Trial No.1.
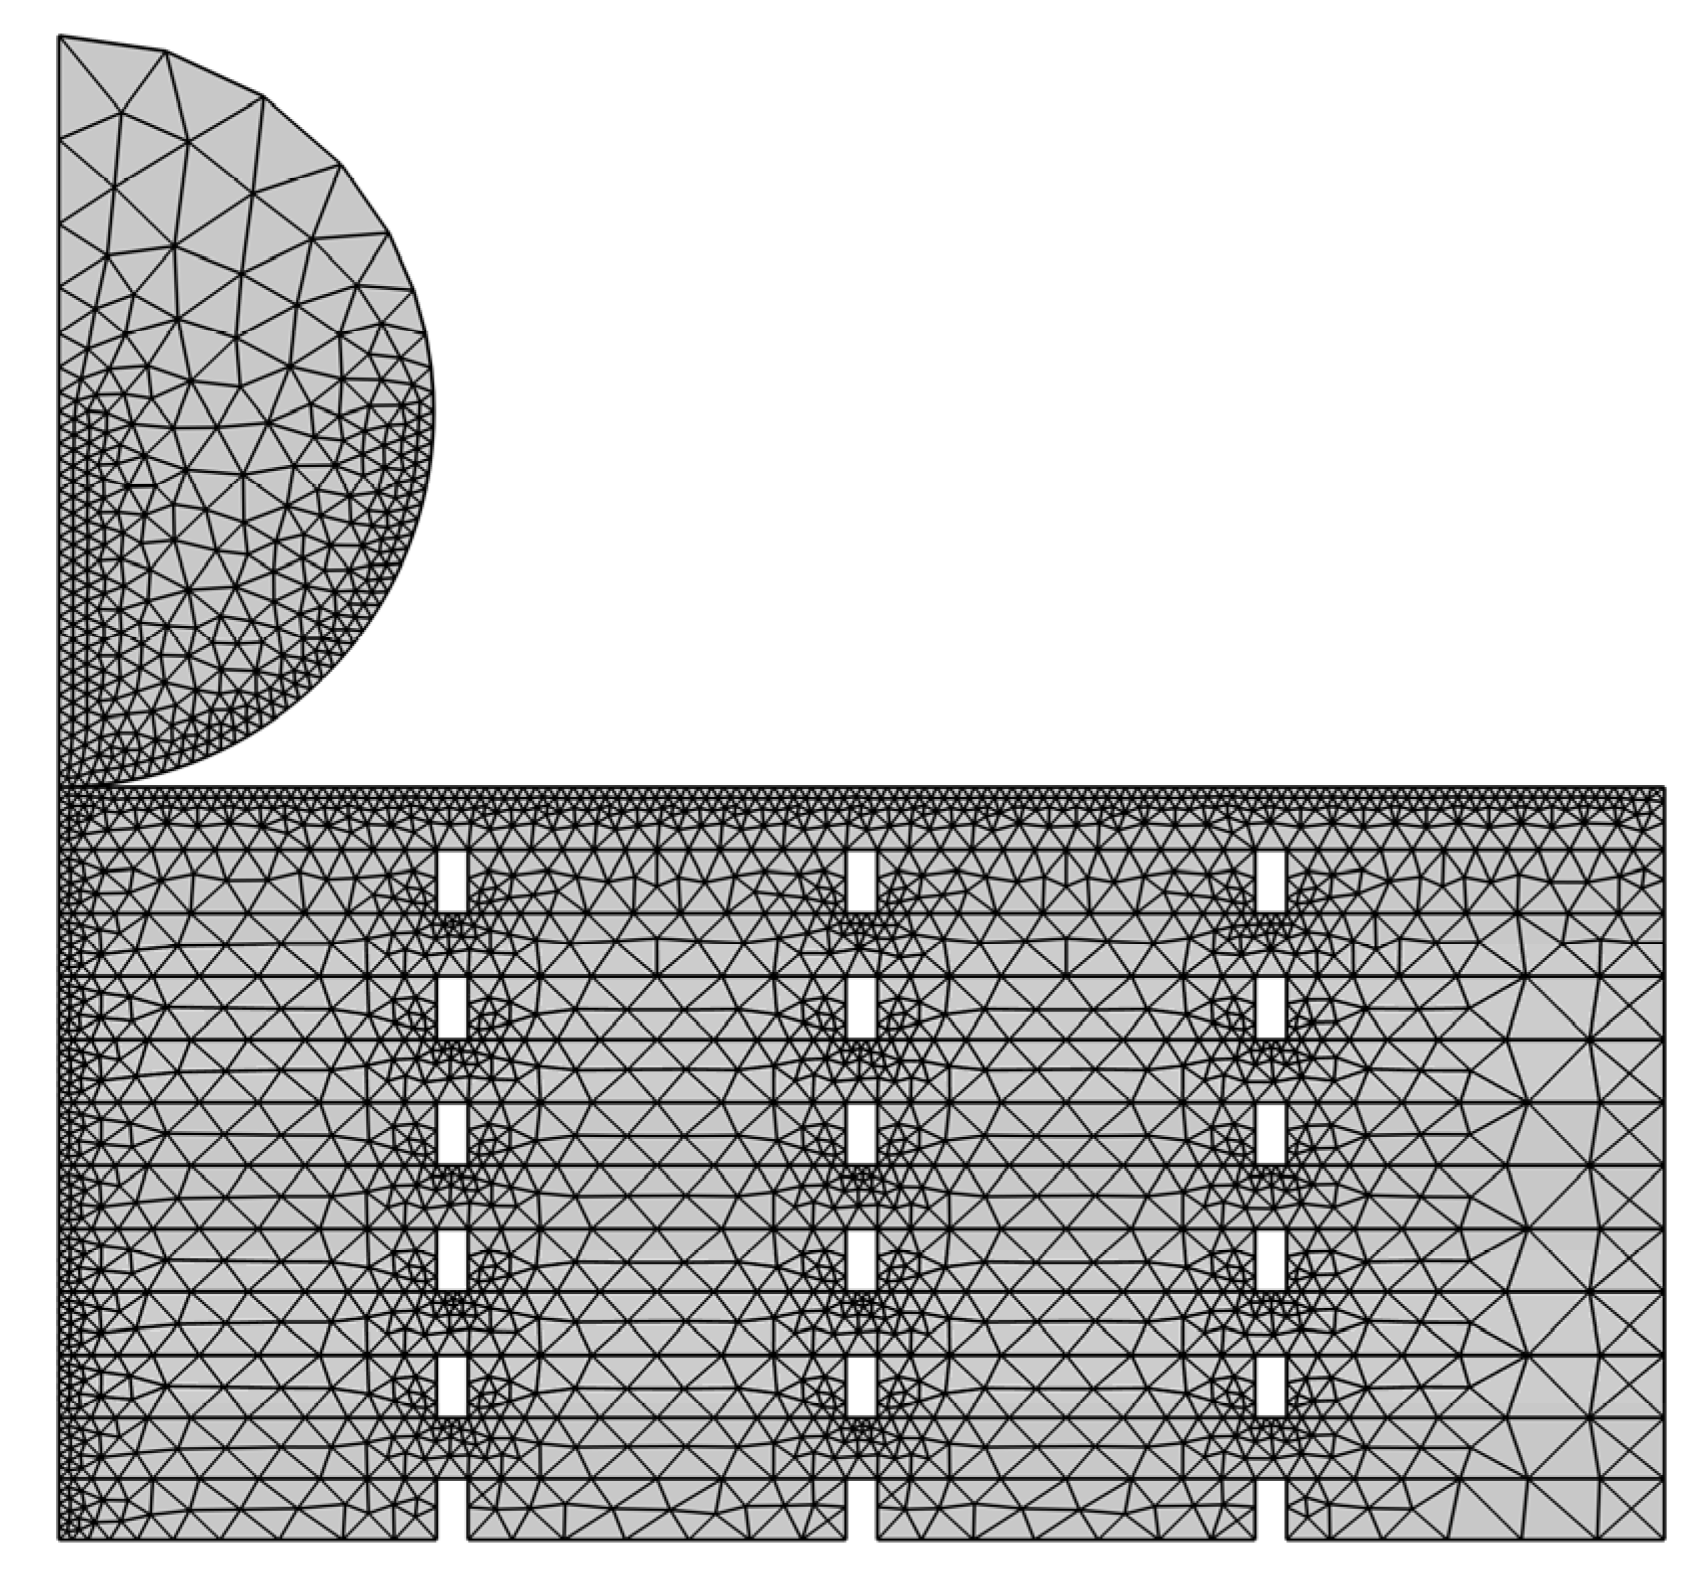
Figure 5.
Experimental methodology stages: 3D-Printing stage includes (a) 3D-Printing environment, and (b) Printed Micro-Sample: Trial No. 2 (Non-Hybrid pore sizes); Hardness test stage (c) Brinell and D-Shore test for printed sample.
Figure 5.
Experimental methodology stages: 3D-Printing stage includes (a) 3D-Printing environment, and (b) Printed Micro-Sample: Trial No. 2 (Non-Hybrid pore sizes); Hardness test stage (c) Brinell and D-Shore test for printed sample.
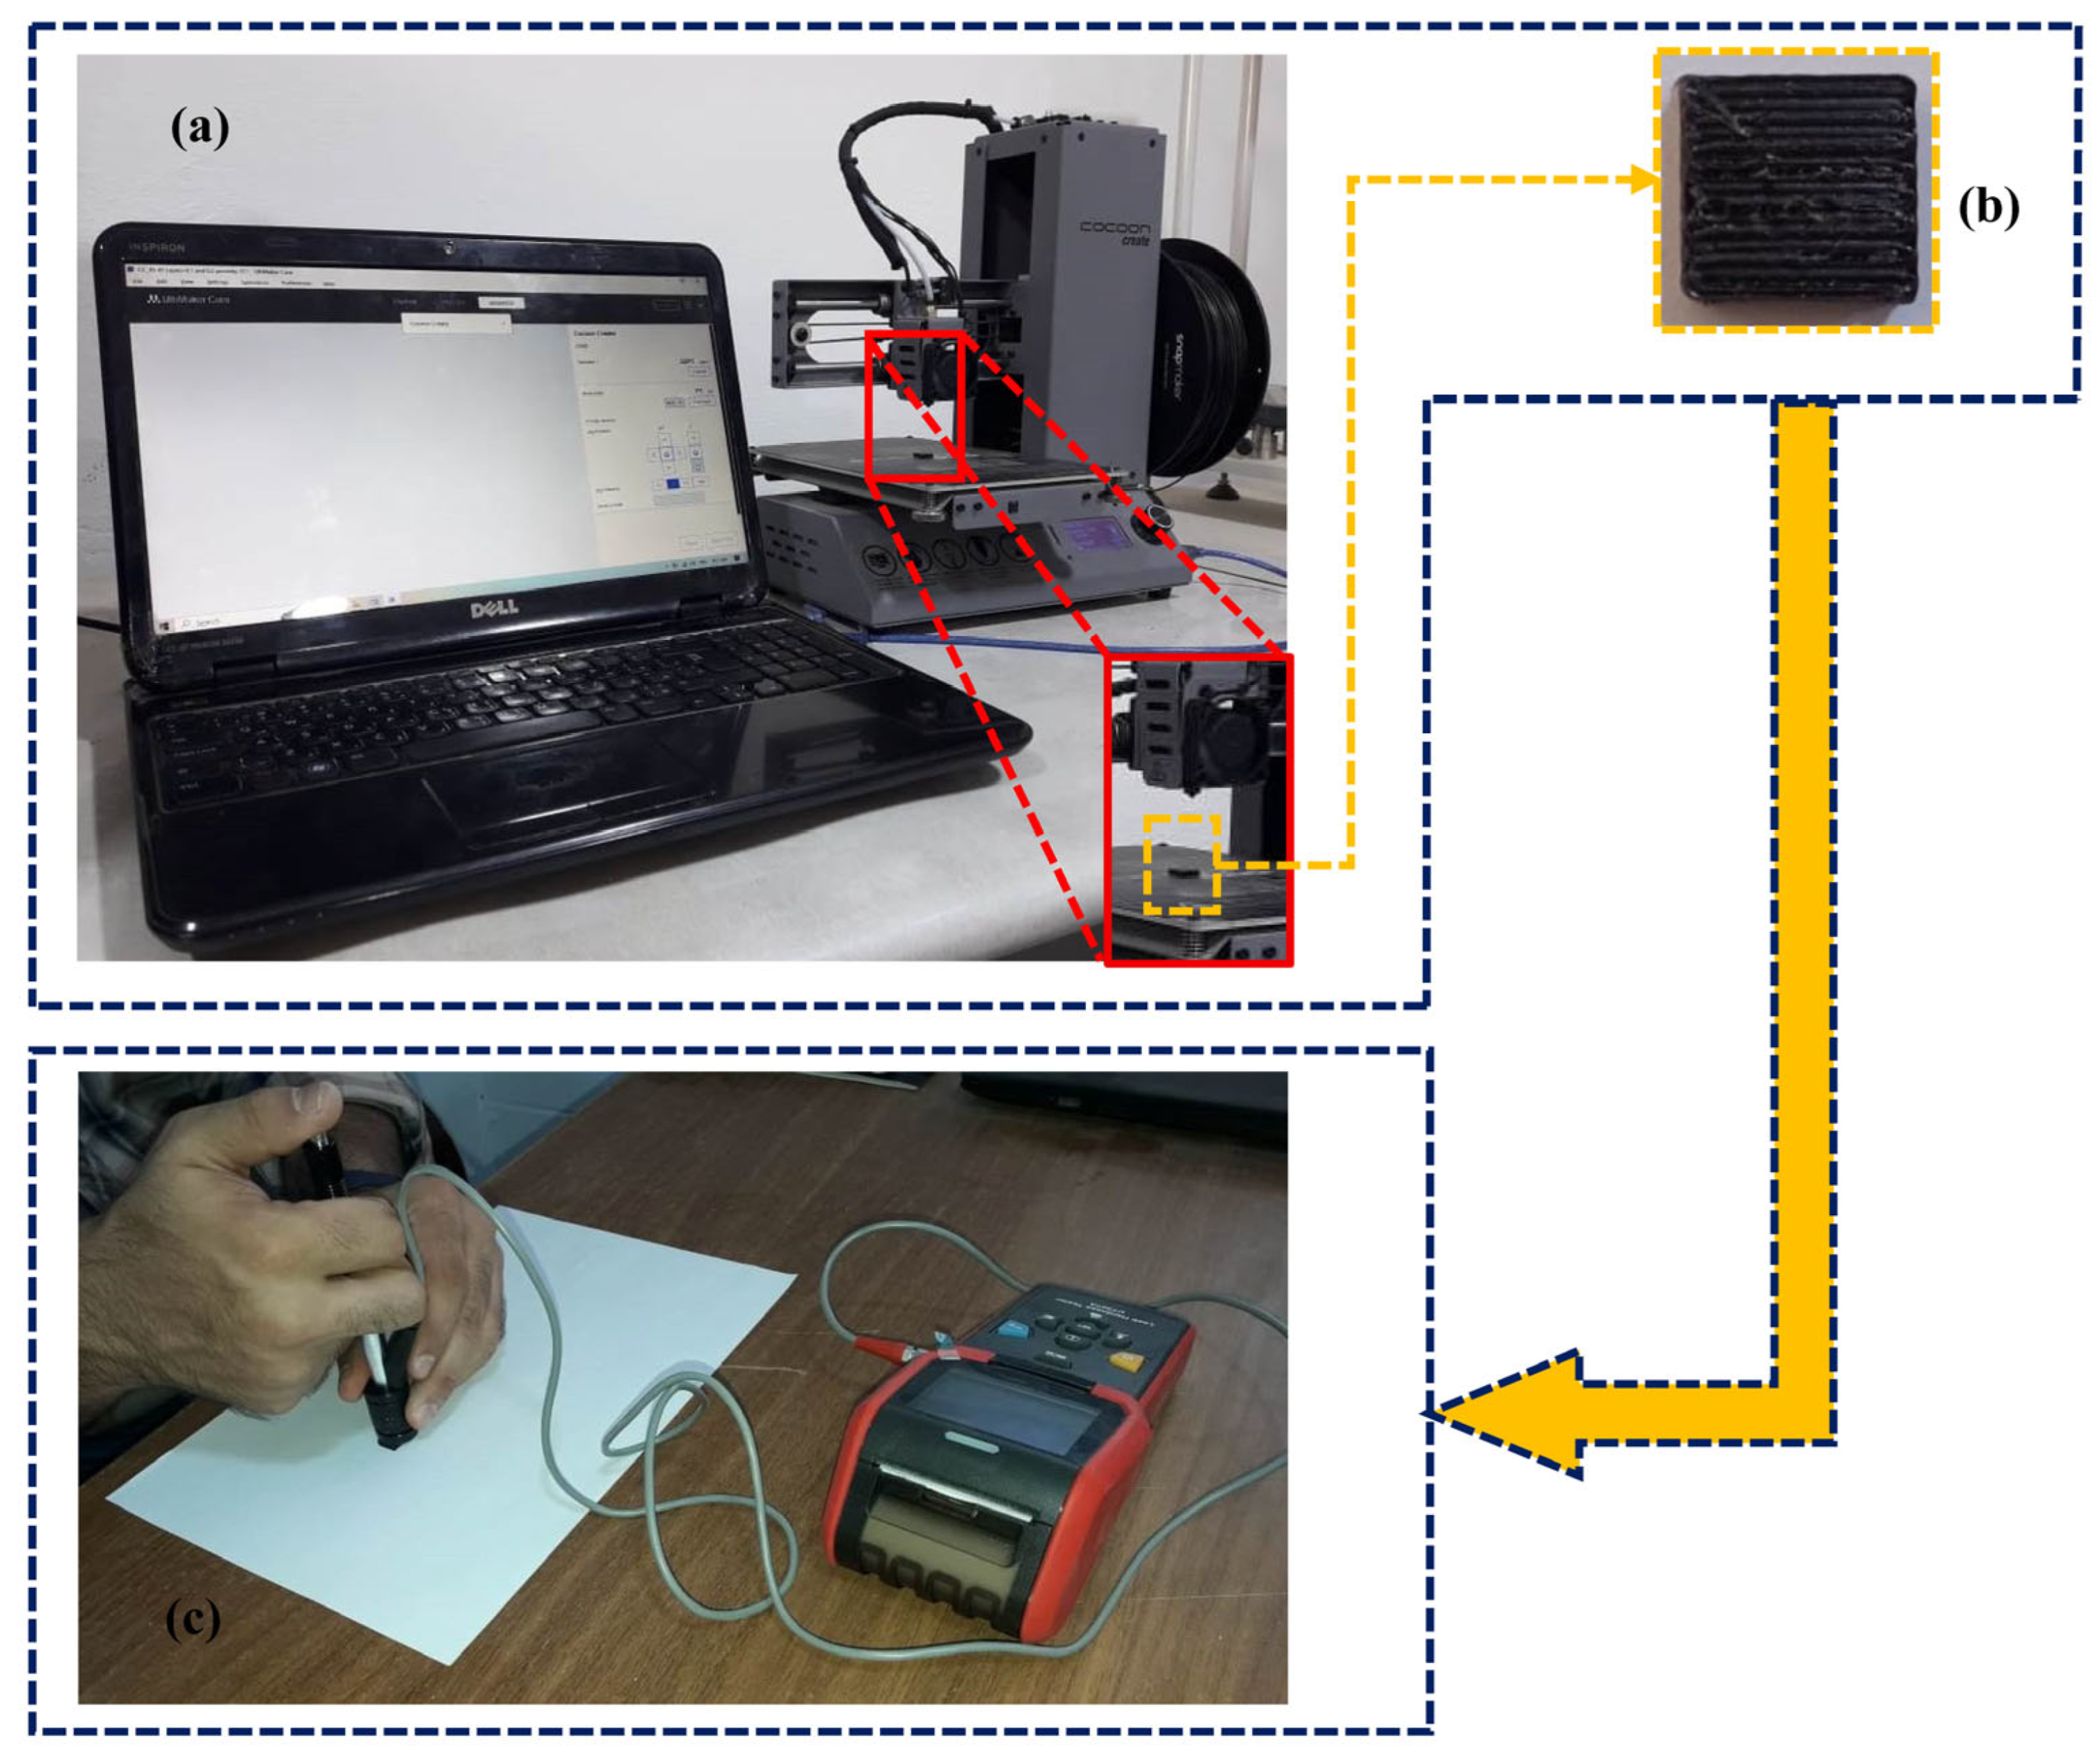
Figure 6.
EFEA simulation of Brinell medium. Observed indentation radiuses for runs (a) No. 1 and (b) No. 4.
Figure 6.
EFEA simulation of Brinell medium. Observed indentation radiuses for runs (a) No. 1 and (b) No. 4.
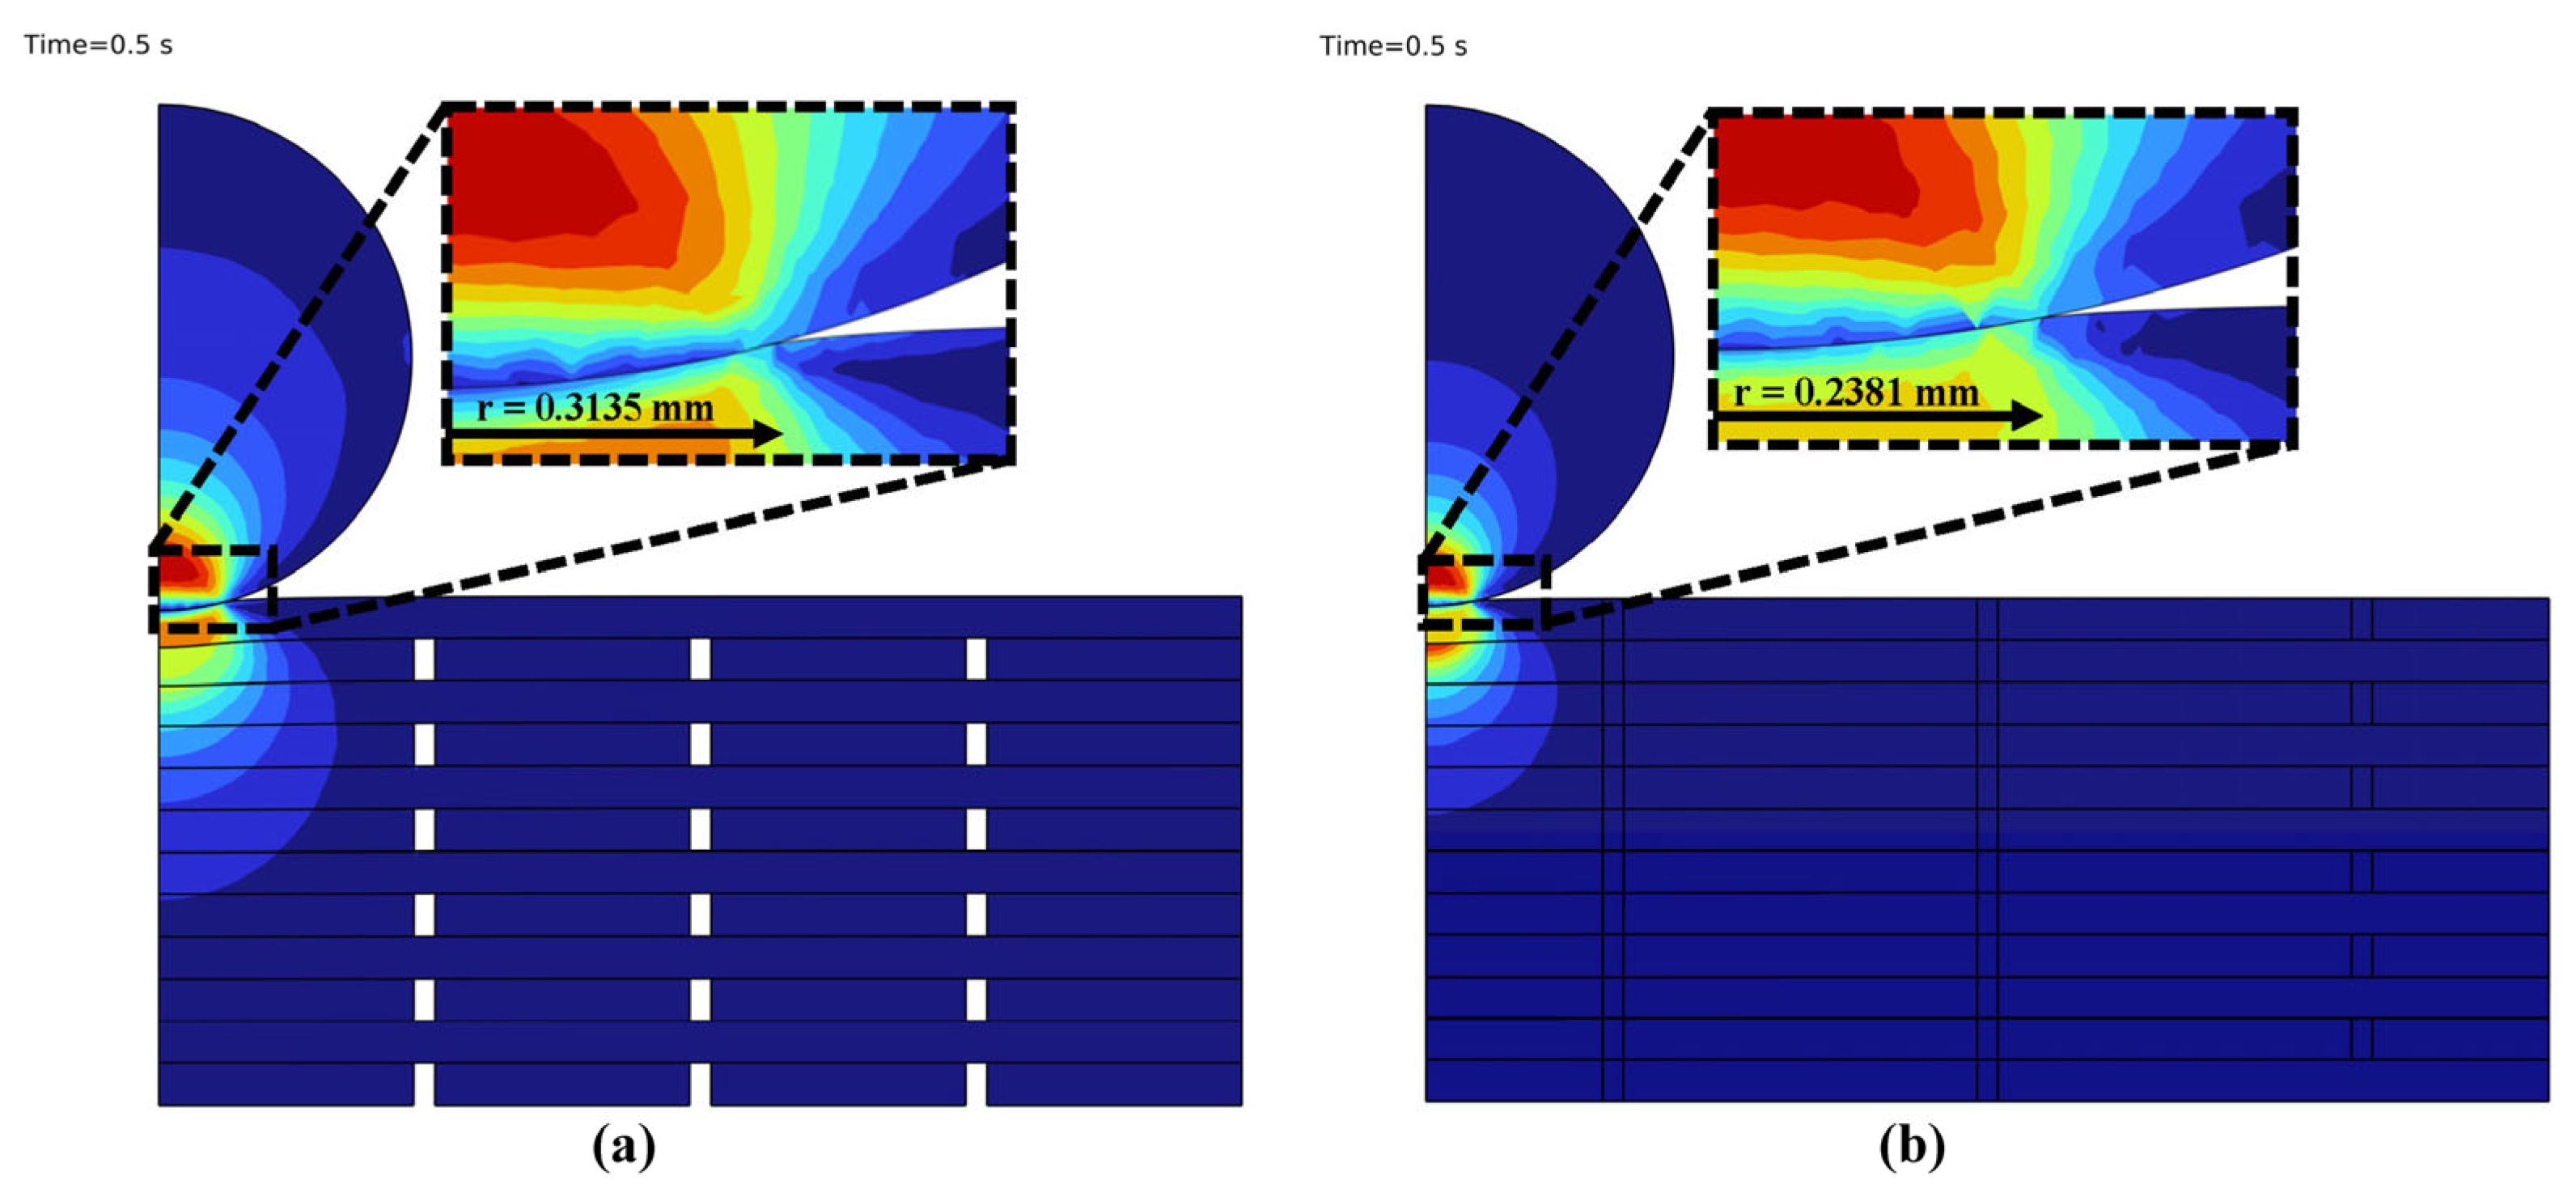
Figure 7.
Comparison between hardness numbers for PLA microsamples resulting from Brinell and D-Shore methods.
Figure 7.
Comparison between hardness numbers for PLA microsamples resulting from Brinell and D-Shore methods.

| Item | Symbols | PLA | WC |
| Density (kg/m3) | ρ | 1400 | 14770 |
| Poisson’s Ratio | υ | 0.36 | 0.215 |
| Young’s Modulus (GPa) | E | 1.9 | 620 |
Table 2.
Constants of JC-Model without temperature effect for PLA filament [40].
Table 2.
Constants of JC-Model without temperature effect for PLA filament [40].
| Angle of orientation layer | JC-Constants | |||
| K (MPa) | N(MPa) | x | R | |
| 0˚ | 67 | -78.392 | 0.091 | 0.669 |
| 45˚ | 42.01 | -55.670 | 0.176 | 0.170 |
| 90˚ | 54.77 | -65.293 | 0.161 | 0.585 |
Table 3.
Parameters levels of the experimental trials.
| Parameter | Symbol | levels |
| Orientation layer | OL | B1:0˚/90˚, B2:45˚/-45˚ |
| Pores size | PS | C1:100×100 μm2 for odd and even layers |
| C2:150×150 μm2 for odd and even layers | ||
| C3:200×200 μm2 for odd and even layers | ||
| C4:100×100 μm2 for odd layer and 150×150 μm2 for even layer | ||
| C5:100×100 μm2 for odd layer and 200×200 μm2 for even layer | ||
| C6:150×150 μm2 for odd layer and 200×200 μm2 for even layer |
Table 4.
Operational specifications for 3D printing.
| No. | Specification | Description |
| 1 | Quantity of extruder | Single |
| 2 | Diameter of extruder | 0.4 mm |
| 3 | Build space | 200×200×180 mm |
| 4 | Print speed | 20 mm/s |
| 5 | Bed temperature for operating print | 60˚C |
| 6 | Layer thickness | 0.2 mm |
| 7 | Filament material | Black PLA |
| 8 | Nozzle temperature | 220˚C |
| 9 | Infill ratio | 100% |
| 10 | Number of layers | 12 |
Table 5.
Experimental trials designated for measuring the hardness.
| No. of runs | Parameters | ||
| OL | PS | ||
| Non-Hybrid pore sizes | 1 | B1 | C1 |
| 2 | B1 | C2 | |
| 3 | B1 | C3 | |
| 4 | B2 | C1 | |
| 5 | B2 | C2 | |
| 6 | B2 | C3 | |
| Hybrid pore sizes | 7 | B1 | C4 |
| 8 | B1 | C5 | |
| 9 | B1 | C6 | |
| 10 | B2 | C4 | |
| 11 | B2 | C5 | |
| 12 | B2 | C6 | |
Table 6.
Predicted and experimental outcomes for hardness according to the Brinell method.
| Run No. | Parameters | EFEA Prediction | Experimental HB | Range of %ε 2 | ||||||
| OL | PS | HB | 1 | 2 | 3 | 4 | 5 | Av 1 | ||
| 1 | B1 | C1 | 18.12 | 18.94 | 18.93 | 18.91 | 18.90 | 18.88 | 18.91 | 4.00%-4.26% |
| 2 | B1 | C2 | 17.06 | 17.97 | 17.90 | 17.89 | 17.84 | 17.81 | 17.88 | 4.17%-5.02% |
| 3 | B1 | C3 | 16.11 | 17.02 | 17.00 | 16.95 | 16.92 | 16.91 | 16.96 | 4.67%-5.29% |
| 4 | B2 | C1 | 41.99 | 42.65 | 42.65 | 42.65 | 42.64 | 42.63 | 42.64 | 1.50%-1.54% |
| 5 | B2 | C2 | 38.92 | 39.62 | 39.61 | 39.59 | 39.58 | 39.58 | 39.60 | 1.65%-1.74% |
| 6 | B2 | C3 | 34.75 | 35.60 | 35.56 | 35.55 | 35.54 | 35.52 | 35.55 | 2.14%-2.36% |
| 7 | B1 | C4 | 19.41 | 20.32 | 20.29 | 20.29 | 20.20 | 20.17 | 20.25 | 3.77%-4.45% |
| 8 | B1 | C5 | 18.39 | 19.24 | 19.26 | 19.23 | 19.21 | 19.20 | 19.23 | 4.21%-4.47% |
| 9 | B1 | C6 | 17.50 | 18.51 | 18.49 | 18.48 | 18.40 | 18.25 | 18.43 | 4.08%-5.39% |
| 10 | B2 | C4 | 41.61 | 42.37 | 42.36 | 42.35 | 42.34 | 42.30 | 42.34 | 1.60%-1.78% |
| 11 | B2 | C5 | 33.26 | 34.06 | 34.05 | 34.03 | 34.02 | 34.02 | 34.04 | 2.19%-2.33% |
| 12 | B2 | C6 | 32.80 | 33.62 | 33.59 | 33.58 | 33.58 | 33.57 | 33.59 | 2.27%-2.42% |
1 Av: Average values for five measurements of hardness; 2 %ε: Error ratio.
Table 7.
Experimental outcomes for hardness according to the D-Shore method.
| Run No. | Parameters | Experimental HS | ||||||
| OL | PS | 1 | 2 | 3 | 4 | 5 | Av | |
| 1 | B1 | C1 | 18.94 | 18.93 | 18.91 | 18.90 | 18.88 | 18.91 |
| 2 | B1 | C2 | 17.97 | 17.90 | 17.89 | 17.84 | 17.81 | 17.88 |
| 3 | B1 | C3 | 17.02 | 17.00 | 16.95 | 16.92 | 16.91 | 16.96 |
| 4 | B2 | C1 | 42.65 | 42.65 | 42.65 | 42.64 | 42.63 | 42.64 |
| 5 | B2 | C2 | 39.62 | 39.61 | 39.59 | 39.58 | 39.58 | 39.60 |
| 6 | B2 | C3 | 35.60 | 35.56 | 35.55 | 35.54 | 35.52 | 35.55 |
| 7 | B1 | C4 | 20.32 | 20.29 | 20.29 | 20.20 | 20.17 | 20.25 |
| 8 | B1 | C5 | 19.24 | 19.26 | 19.23 | 19.21 | 19.20 | 19.23 |
| 9 | B1 | C6 | 18.51 | 18.49 | 18.48 | 18.40 | 18.25 | 18.43 |
| 10 | B2 | C4 | 42.37 | 42.36 | 42.35 | 42.34 | 42.30 | 42.34 |
| 11 | B2 | C5 | 34.06 | 34.05 | 34.03 | 34.02 | 34.02 | 34.04 |
| 12 | B2 | C6 | 33.62 | 33.59 | 33.58 | 33.58 | 33.57 | 33.59 |
Table 8.
ANOVA for hardness according to Brinell method.
| Source | DF | Seq SS | Adj SS | Adj MS | F | P |
Parameter situation |
| OL | 1 | 1123.19 | 1123.19 | 1123.19 | 113.82 | <5% | Significant |
| PS | 5 | 41.24 | 41.24 | 8.25 | 0.84 | >5% | Non-significant |
| Residual Error | 5 | 49.34 | 49.34 | 9.87 | |||
| Total | 11 | 1213.77 |
Table 9.
ANOVA for hardness according to D-Shore method.
| Source | DF | Seq SS | Adj SS | Adj MS | F | P |
Parameter situation |
| OL | 1 | 4675.5 | 4675.5 | 4675.5 | 33.95 | <5% | Significant |
| PS | 5 | 645.6 | 645.6 | 129.1 | 0.94 | >5% | Non-significant |
| Residual Error | 5 | 688.5 | 688.5 | 137.7 | |||
| Total | 11 | 6009.5 |
Table 10.
D-Shore hardness coefficients.
| No. of Runs | Parameters | Coefficients | R2 | |||
| OL | PS | A | Q | |||
| Non-Hybrid pore sizes | 1 | B1 | C1 | 3E12 | -1.595 | 0.9955 |
| 2 | B1 | C2 | 4E12 | -1.206 | 0.9998 | |
| 3 | B1 | C3 | 9E11 | -1.198 | 0.9999 | |
| 4 | B2 | C1 | 3E20 | -1.265 | 0.9999 | |
| 5 | B2 | C2 | 7E27 | -1.399 | 0.9997 | |
| 6 | B2 | C3 | 2E21 | -1.297 | 0.9999 | |
| Hybrid pore sizes | 7 | B1 | C4 | 3E12 | -1.278 | 0.9999 |
| 8 | B1 | C5 | 3E11 | -1.219 | 0.9999 | |
| 9 | B1 | C6 | 4E10 | -1.183 | 0.9998 | |
| 10 | B2 | C4 | 2E21 | -1.245 | 0.9997 | |
| 11 | B2 | C5 | 5E27 | -1.484 | 0.9999 | |
| 12 | B2 | C6 | 4E30 | -1.537 | 0.9999 | |
Disclaimer/Publisher’s Note: The statements, opinions and data contained in all publications are solely those of the individual author(s) and contributor(s) and not of MDPI and/or the editor(s). MDPI and/or the editor(s) disclaim responsibility for any injury to people or property resulting from any ideas, methods, instructions or products referred to in the content. |
© 2026 by the authors. Licensee MDPI, Basel, Switzerland. This article is an open access article distributed under the terms and conditions of the Creative Commons Attribution (CC BY) license (http://creativecommons.org/licenses/by/4.0/).
Copyright: This open access article is published under a Creative Commons CC BY 4.0 license, which permit the free download, distribution, and reuse, provided that the author and preprint are cited in any reuse.