

Submitted:
29 July 2026
Posted:
31 July 2026
You are already at the latest version
Abstract
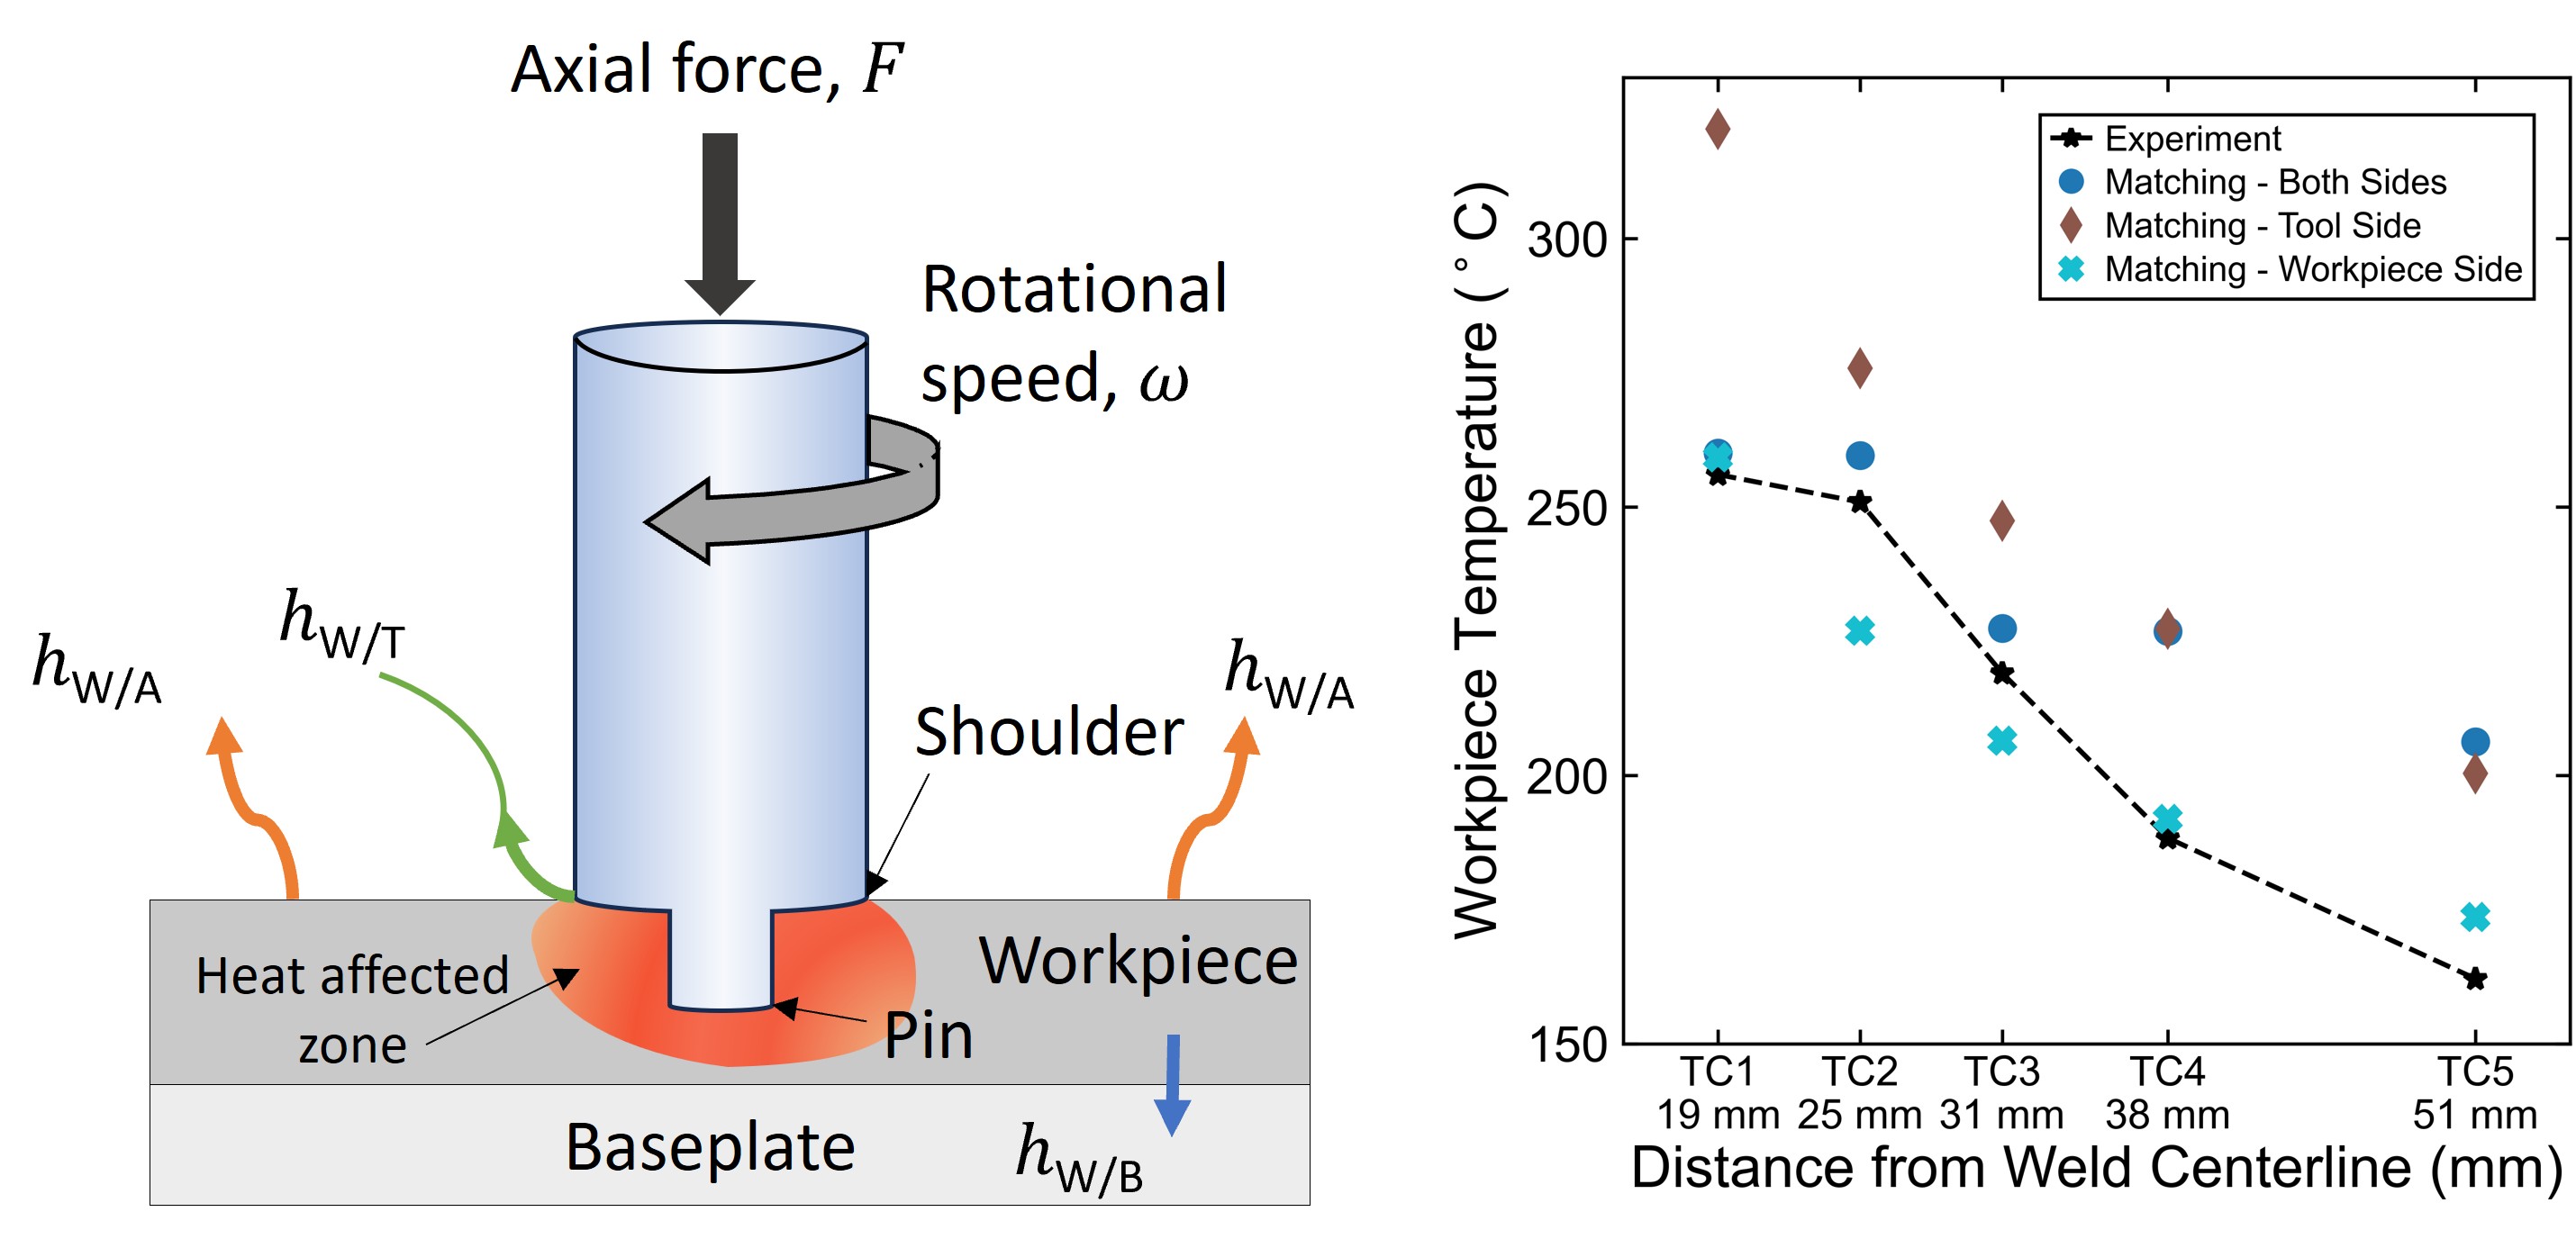
Accurate thermal modeling of friction stir welding (FSW) requires correct representation of heat generation and heat partitioning at the workpiece/tool interface. However, most published models are validated against temperature measurements from only one side of this interface, so agreement with experiment does not guarantee that interfacial heat transfer is correctly represented. This study evaluates whether one-sided temperature validation is sufficient, using steady-state FSW of AA 6061-T6 aluminum with an H13 steel tool. Temperatures were measured with thermocouples embedded in both the workpiece and the tool, and an Eulerian thermomechanical model was developed in ForgeNxt. The viscoplastic friction coefficient and the workpiece/tool heat transfer coefficient were calibrated against tool temperatures only, workpiece temperatures only, and both simultaneously. Tool only calibration reproduced tool temperatures within 2.5% but overpredicted workpiece temperatures by 18% on average; workpiece only calibration achieved 5% average workpiece error but underpredicted tool temperatures by 26%. Sensitivity analysis showed that workpiece temperatures were governed primarily by the friction coefficient, while tool temperatures were sensitive to both friction coefficient and heat transfer coefficient. No single parameter pair reproduced both temperature sets, indicating that one-sided validation can produce misleading agreement and that two-sided validation is necessary to achieve accurate interfacial heat partitioning.
Keywords:
friction stir welding
; thermal modeling
; interfacial heat transfer coefficient
; friction coefficient
; temperature validation
1. Introduction
Friction stir welding (FSW) is a solid state joining process that offers advantages over traditional fusion welding. FSW uses a rotating tool with a pin, which is plunged into the materials to be joined. The process begins with the tool plunging to a specific depth as shown in Figure 1, followed by a dwell phase where the tool remains in place to increase the temperature through friction and plastic deformation. Because temperatures remain below the material’s melting point, the resulting welds often exhibit superior physical properties compared to those produced by fusion welding [1]. FSW has been successfully used to weld aluminum, copper, and dissimilar metal joints that are typically non weldable by using fusion welding processes [2,3,4].
To improve process efficiency and predict weld outcomes, thermal and thermomechanical models of FSW have been developed since the early 2000s [5,6,7,8,9,10,11,12]. These models typically represent heat generation and heat transfer through parameters such as the interfacial friction coefficient (α) and the heat transfer coefficients (h) between components. A persistent challenge is that several of these parameters cannot be measured directly. The heat transfer coefficients between the workpiece and the surrounding air (hW/A), and between the workpiece and the backing plate (hW/B), have been characterized in prior work and fall within relatively narrow ranges (Figure 2) [13]. In contrast, the heat transfer coefficient between the workpiece and the tool (hW/T), remains highly uncertain, with reported values spanning more than two orders of magnitude, and is in practice treated as a fitting parameter [6,9]. Critically, this fitting is almost always performed against temperature measurements from only one side of the workpiece/tool interface, most commonly the workpiece, and this limitation is rarely acknowledged explicitly in the literature. Because the friction coefficient and hW/T jointly determine both the magnitude and the partitioning of interfacial heat, agreement with measurements on one side does not guarantee that the temperature field on the other side, or the underlying heat partitioning, is correct [14].
To the authors’ knowledge, no prior study has evaluated whether a single, physically coupled thermomechanical model, using one friction coefficient and one interfacial heat transfer coefficient, can simultaneously reproduce measured temperatures in both the tool and workpiece. Previous studies have also not quantified the prediction error on the uncalibrated side when model calibration is based solely on tool or workpiece temperatures, as well as, the temperature sensitivity to α and h on both sides of the interface. This study aims to address these limitations by developing a steady state model that considers temperature predictions in both the tool and the workpiece. During transverse phase, the extent to which one sided, either only tool or only workpiece validation, misrepresents the underlying heat transfer mechanisms is identified. Experimental temperature data were collected from embedded thermocouples during friction stir welding of AA 6061-T6 aluminum alloy using an H13 steel tool, and the corresponding simulations were tuned in ForgeNxt. By doing so, this work aims to contribute to the development of predictive models that more accurately reflect the coupled thermal behavior of the tool and workpiece.
2. Background
Heat generation at the workpiece/tool interface arises from both friction and plastic deformation [15]. Friction is generally the dominant contributor, especially during the initial plunge phase, while plastic deformation becomes more significant during the steady-state traverse [7]. As the material softens with increased temperature, the yield strength decreases, and the sticking/sliding condition between the tool and workpiece evolves. This complex interaction reduces frictional heating and increases the relative contribution from plastic deformation and a more balanced heat generation between friction and plastic deformation is established [11].
Heat generation models typically employ some form of Equation (1).
Selecting the maximum temperature is one of the critical factors in models. Studies indicate that during the friction stir process, the peak temperature typically reaches 80–90% of the workpiece’s melting temperature [17]. Maximum temperatures for good models never exceed these values due to the nature of the solid-state process. When computer power is limited, typically for older models, full thermo-mechanical simulations are too expensive and thus experimental temperature values can be used to approximate temperature fields for simulations.
Modeling Approaches in Literature
Several heat transfer models for FSW have been proposed, many relying on finite element methods (FEM) and temperature validation through embedded thermocouples. The main method for experimentally measuring the temperature during FSW is done through thermocouples. The two most common methods of using thermocouples are embedding thermocouples into the workpiece [18] and embedding thermocouples into the tool [19].
Two most cited studies are those of Chao and Khandkar, both of which validated models using thermocouples. Chao et al. [6] embedded nine thermocouples in the AA 2195 workpiece and five in the M2 steel tool. Temperature profiles were matched by fitting heat input separately to the tool and workpiece, without reference to physical laws; an improvement over earlier work that had only matched peak temperatures [5]. Khandkar et al. [9] embedded 25 thermocouples in an AA 6061-T651 workpiece and modeled heat transfer using a moving heat source as a boundary condition. Agreement with experimental data was achieved by varying the workpiece/backing plate heat transfer coefficient (hW/B), but validation was limited to the workpiece side.
In case of an aluminum workpiece hW/A ranges from 10 to 20 W m-2 K-1 [20,21] and hW/B is typically around 1,000 W m-2 K-1 [11]. However, the heat transfer coefficient between the workpiece and the tool, hW/T, is primarily a fitting parameter due to the difficulty of precise measurements [22] . hW/T from literature varies from 100 to 10,000 W m-2 K-1 or greater [13].
As friction coefficient and heat transfer coefficient both influence temperatures in each component, tuning parameters to match only one side introduces uncertainty. Validating both tool and workpiece temperatures is necessary to correctly partition heat across the interface.
3. Materials and Methods
This section describes the experimental and numerical setup used in this study. The experimental setup is first described, including the placement of embedded thermocouples used to measure temperatures in the workpiece and tool. The procedure used to identify the steady state region of the process is then discussed. The section also details the numerical model developed in ForgeNxt, including the material properties, boundary conditions, and FSW simulation.
3.1. Experimental Setup
FSW experiments were conducted on AA 6061-T6 aluminum alloy plates using an H13 steel tool. The workpiece was supported by a backing plate made of SAE 1008 low carbon steel, which was in direct contact with the bottom surface of the workpiece during welding. The experiments were conducted on a TTI High Stiffness RM2 FSW machine (Bond Technologies, Elkhart, IN, USA). A Bond Technologies B&R-based programmable logic controller, equipped with high-speed data acquisition and control, was used to set the welding parameters [23]. The machine provides control over rotation speed, tool displacement, and applied force. The FSW tool was mounted on the machine along with a Bluetooth collar used to transmit thermocouple data [24]. The experimental setup is shown in Figure 3. Thermocouples embedded in the tool and workpiece were used to record temperature data during welding. A preliminary experiment was conducted to identify the steady state region of the FSW process. This region constitutes the majority of the weld, strongly influences final weld quality, and was used to guide thermocouple placement in the workpiece. The tool was plunged and traversed along the plate at 200 mm/min, with a rotational speed of 400 RPM, a plunge depth of 3.5 mm, and a 2° tilt angle to reduce lateral forces. The tool temperature increased rapidly during plunge and reached a steady value approximately 100 s after welding began, corresponding to about 333 mm from the weld start. To ensure measurements were collected under steady state conditions, thermocouples were embedded 400 mm, from the weld start. All thermocouples were positioned at the same distance from the top of the workpiece surface at varying distances from the weld centerline, as shown in Figure 4. Thermocouple 6 was placed to test symmetry of heat distribution only and was not used for further analysis.
3.2. Steady State Modeling Approach
The translational model was developed using the ForgeNxt software [25]. Due to the more complicated nature of modeling the steady state process, an Eulerian finite element formulation was used rather than the Lagrangian formulation. The Eulerian simulation reduced computation time compared to a Lagrangian simulation and was better suited for modeling the coupling of the moving boundaries and workpiece/tool interfaces [2,17,26,27]. One key characteristic of the Eulerian simulation is that it does not progress through time but instead proceeds through a series of steps until a steady state is reached. This makes it challenging to compare with experimental results that are time based [28]. To overcome this, maximum temperatures from the experiment were compared with temperatures from the final steady state timestep.
Norton's viscoplastic friction law, expressed in Equation (2), was used to model the contact shear stresses between the tool and workpiece. The law represents the shearing of a thin boundary layer of workpiece material adjacent to the interface [29]. The viscoplastic friction coefficient (α) in Equation (2) is a property of this law and is distinct from the Coulomb type friction coefficient (μ) appearing in Equation (1). The two are not numerically comparable, because the material consistency (K) is temperature dependent, the effective frictional response in Equation (2) decreases as the interface heats, consistent with the experimentally observed reduction in friction with temperature during welding [7,15,30]. Hence, a variable friction coefficient was used within Norton’s viscoplastic law to better capture the influence of temperature on material properties [31].
To implement this framework in the steady state region, both friction and plastic deformation were modeled as sources of heat generation [7]. The tuning values for α ranged from 0.11 to 0.05, which are lower than those reported in prior work on the transient plunge model [33]. An array of sensors was placed along the length of the weld in simulation to capture the temperature profile relative to the tool position. All sensor positions are illustrated in Figure 5. The stationary tool at origin is shown by ‘X’ while the dashed line shows the simulated weld line. This was done to compare the shape of the simulation temperature profile with that of the experiment.
3.3. Material Properties
3.4. Boundary Conditions
Boundary conditions and sensor locations were set to complete the model. The various values for the heat transfer coefficients and friction coefficients were referenced from the literature values or determined by tuning of the model. Table 2 lists the boundary conditions used, while Figure 6 shows the same including sensor locations.
Adiabatic boundary condition is used for the heat transfer coefficient between the tool and holder interface, hT/holder [34]. The heat transfer coefficients between the workpiece and air, hW/A, and between the workpiece and the baseplate, hW/B are generally determined empirically, as they depend on material properties, clamping, and experimental conditions. For aluminum workpieces, heat transfer coefficient between workpiece and air, hW/A as well as heat transfer coefficient between tool and air, hT/A typically range from 10 to 20 W m-2 K-1 [35], while hW/B is usually about 500 W m-2 K-1 [21]. In contrast, the heat transfer coefficient between the workpiece and the tool hW/T is treated as a fitting parameter. A value of 40 kW m-2 K-1 was selected, as it provided the best agreement with measured temperatures following friction tuning in the plunge stage experiment [14].
Sensors were placed in the simulation at thermocouple locations and along the weld length, and tuning was performed by matching maximum experimental and simulated temperatures at corresponding radial distances. The tool and workpiece were meshed with higher density in regions expected to experience elevated strain rates and temperature gradients. Zones beneath the tool were defined for remeshing to prevent element distortion, ensuring accurate capture of the high strain rate and temperature gradients inherent in the process.
4. Results
4.1. Only Matching Tool Temperature
First, following the common practice of fitting only one side, i.e., validating only the experimental tool temperatures with the model, hW/T and α were tuned until the tool temperatures matched reasonably well. This is done only to show the importance of validation of the model on both sides of the interface and to highlight the weakness of one sided fitting. During the tuning process, increasing α raised tool’s both pin and shoulder temperatures, while increasing hW/T reduced the temperature difference between pin and shoulder. Tool temperatures matched modeled temperatures when hW/T =65 kW m−2 K−1 and α = 0.20 as shown in Figure 7.
The hollow circles show the simulated steady state temperatures, while the dashed lines show the experimental projection if there was no peak. The peak in the experimental temperatures is most likely due to the material removed from the workpiece to allow for the thermocouples to be placed. This removal of material was not modeled in the simulation. Therefore, the model was evaluated against the steady state projection temperature rather than the local peak. The comparison was made at approximately 490 °C for the pin and 505 °C for the shoulder. The temperature difference between the experimental and simulated values was 0.5 °C for the pin and 12.1 °C for the shoulder, corresponding to differences of 0.1% and 2.4%, respectively.
Figure 8 shows that, although the tool temperatures were validated using one sided matching, this did not accurately predict the workpiece temperatures. The model consistently overpredicted the experimental workpiece temperatures at all thermocouple locations, with an average difference of approximately 40 °C, or 18%. This discrepancy indicates that validation of model only one side temperatures is insufficient and can lead to inaccurate predictions in the workpiece.
To further highlight the limitation of validating the simulation using only one side of the interface, the same data is evaluated in the next section by tuning the model only to the workpiece temperatures.
4.2. Only Matching Workpiece Temperature
Next, using the same simulation and experimental data for comparison, only workpiece temperatures were validated in the model by tuning hW/T and α. Error was minimized for workpiece temperature when hW/T = 40 kW m−2 K−1 and α = 0.08. As shown in Figure 9, this provided reasonable agreement across the workpiece thermocouple locations, with a maximum error below 9% and an average error of approximately 5%. However, the same parameter set did not accurately predict the tool temperatures this time. As shown in Figure 10, the simulated steady state pin and shoulder temperatures were substantially lower than the corresponding experimental tool temperatures and the tool side error was approximately 130 °C, or 26%.
These results show that different sets of combinations of hW/T and α are required depending on whether the model is validated to the tool or workpiece temperatures. However, if the model was fully describing the experiment we would expect a single pair of hW/T and α values to match temperatures on both sides of the workpiece/tool interface. This highlights the limitations of current one sided modeling. The two tuning variables hW/T and α need to be better understood by validating both sides of the interface simultaneously, as discussed in the next section.
4.3. Matching both Tool-Workpiece Temperatures
Finally, to understand how α and hW/T affect tool and workpiece temperatures, a study was conducted using the steady state model to match both sides of the interface. Firstly, α was varied and its response to temperature was studied at the workpiece. Figure 11a compares the maximum experimental temperatures with the maximum simulated temperatures at each workpiece thermocouple location for different values of α ranging from 0.05 to 0.11. As expected, the temperature decreases with increasing distance from the weld centerline. The sensitivity of the simulated temperature to α also decreases farther from the tool, whereas near the weld centerline temperatures are more sensitive to α.
Figure 11b shows the temperature difference between the experimental maximum and simulated maximum values at each thermocouple location for each value of α. The heat map provides a direct way to identify which friction coefficient values produce the closest agreement with the experiment, where lower temperature differences are shown in green and higher in red. The best overall agreement was obtained at α = 0.08, which produced a maximum error below 9% and an average error of approximately 5% across all workpiece thermocouple locations. Together, these results show how α affects the predicted workpiece temperatures and provide the basis for selecting α for workpiece side validation of the model.
To further evaluate the model, the simulated maximum temperatures were plotted at the same tool-relative positions as the experimental thermocouple measurements. Figure 12 compares the measured workpiece thermocouple response with the simulated temperature at the same location as the tool passes by a thermocouple, specifically the 3rd thermocouple in this case. The curve shows the transient temperature history recorded by the embedded thermocouple, while the simulation points represent temperatures at corresponding tool positions for α = 0.08. The simulated temperatures capture the peak temperature and follow the general shape of the measured response during tool passage. This comparison provides additional validation that the model can reproduce the local workpiece temperature profile. The effect of two-sided temperature validation on the predicted tool temperatures is discussed in Section 5.
4.3.1. Workpiece Temperature Sensitivity
After validating the model with α = 0.08, hW/T was varied to evaluate its effect on the predicted workpiece temperatures. The friction coefficient was held constant at α = 0.08, while hW/T was varied from 10 to 50 kW m-2 K-1, in increments of 10 based on the upper range of values reported in [13]
Figure 13a shows that changing hW/T has a negligible effect on the maximum workpiece temperatures and the overall temperature gradient across the thermocouple locations. Similarly, Figure 13b shows that the temperature difference between the simulated and experimental values remains nearly unchanged across the tested hW/T range. These results indicate that, once α is fixed, the predicted workpiece temperatures are relatively insensitive to hW/T changes atleast in case of aluminum. The high thermal conductivity of aluminum promotes rapid heat transfer into the surrounding workpiece, which reduces the sensitivity of the predicted workpiece temperatures to changes in hW/T. This behavior may be different for materials with lower thermal conductivity, such as stainless steel, where interfacial heat transfer could have a stronger influence on the temperature field.
4.3.2. Tool Temperature Sensitivity
In addition to the workpiece, the effect of α and hW/T on the tool temperature was also examined. Unlike the workpiece temperatures, the tool temperatures were strongly affected by both α and hW/T variation.
Figure 14a shows the effect of varying the α, on the pin and shoulder tool temperatures. Over the tested range of α, the predicted tool temperatures varied by approximately 150 °C. The value that best matched the workpiece temperatures, α = 0.08, underpredicted the experimental tool temperatures by approximately 125 °C. Increasing α improved the tool temperature prediction, but it also overestimated the workpiece temperatures, indicating that α alone cannot be tuned to match both regions simultaneously.
Figure 14b shows the sensitivity of the tool temperatures to hW/T. As hW/T decreased, the predicted tool temperatures increased, with a larger effect observed at the shoulder than at the pin. However, even across the tested hW/T range, the simulated tool temperatures remained below the experimental values. These results show that the tool temperature response is strongly dependent on both frictional heating and interfacial heat transfer, while the parameter set that best matches the workpiece side does not fully reproduce the measured tool side temperatures.
5. Discussion
A key focus of this study is the impact of validating the model with experimental data on a single side of the workpiece/tool interface or simultaneous validation on both sides of the interface. To investigate this, the steady state temperatures of FSW were matched by tuning the workpiece/tool heat transfer coefficient, hW/T and the friction coefficient, α. The results show that the apparent accuracy of the model depends strongly on which side of the workpiece/tool interface is used for tuning. When the model was tuned using only the tool temperatures, the steady state tool temperatures matched within 2.5%, but the workpiece temperatures had errors as large as 18%. Conversely, when the model was tuned using only the workpiece temperatures, the workpiece temperatures matched with an average error of approximately 5%, but the tool temperatures had errors as large as 26%. These results demonstrate that one sided validation of the model can produce good agreement with the selected target side while failing to predict the thermal response on the other side of the interface.
This behavior highlights the limitation of using only tool side or workpiece side temperatures to validate an FSW model. In one sided tuning, α can be adjusted to match either the tool or workpiece temperatures, but this does not guarantee that physics that govern the heat generation and heat transfer at the interface are represented correctly. The tool and workpiece temperatures are coupled through the interface, but they are not equally sensitive to the same parameters. Therefore, validating the model with one temperature side alone does not capture the interface behavior.
This study found both the tool and workpiece temperatures were sensitive to changes in α, while only the tool temperature showed a clear sensitivity to changes in hW/T. In the workpiece, varying hW/T over the tested range had little effect on the predicted temperatures. This is likely because the high thermal conductivity of aluminum promotes rapid heat transfer away from the interface and through the workpiece. As a result, the workpiece temperatures were controlled primarily by the friction coefficient α within the tested parameter range. In contrast, the tool temperatures were affected by both α and hW/T, indicating that the tool response provides an important additional constraint on the interface heat transfer behavior.
The optimized parameter sets also show that agreement with the workpiece temperatures alone should not be treated as complete model validation. For instance, Figure 15 compares the workpiece temperature distributions obtained from three calibration approaches: validating the model with only the workpiece temperatures, validating with only the tool temperatures, and validating both tool and workpiece temperatures simultaneously. The workpiece matched and both matched cases produced nearly identical workpiece temperature profiles and followed the experimental trend reasonably well, particularly near the weld centerline. Based only on the workpiece data, this agreement could suggest that the model was sufficiently calibrated.
However, the corresponding tool temperatures in Figure 16 show that this conclusion is incomplete. Although the workpiece matched case agreed reasonably well with the experimental workpiece temperatures, it substantially underpredicted the measured tool temperatures. The experimental steady state tool temperatures were approximately 490°C, while the workpiece matched and both matched cases remained near 370°C, corresponding to an underprediction of approximately 120°C. In contrast, the tool validated case closely predicted the experimental tool temperatures, but the same parameter set overpredicted the workpiece temperature distribution. Thus, a parameter set that appears accurate on one side of the interface does not necessarily describe the full thermal response of the system.
Validation of the model on both sides case further suggests that the discrepancy is not only an optimization issue, but may also reflect limitations in the current interface formulation. Ideally, tuning the model using both tool and workpiece temperatures would produce a parameter set that improves agreement on both sides of the interface. Instead, the approach of validating the model on both sides remained close to the workpiece matched result and did not recover the measured tool temperature. This indicates that representing the interface using constant, effective values of α and hW/T may be too simplified to capture the actual thermal behavior during steady state welding. The effective friction and interfacial heat transfer conditions may vary with local pressure, temperature, slip condition, mechanical work to frictional heating, contact state, and position under the tool’s shoulder and pin [36].
Another potential source of error is the tool boundary condition. In the present steady state model, the tool/holder, hT/Holder boundary condition was modeled using a constant temperature because coolant was used during the experiment. However, this may not fully represent the physical tool holder contact, since the holder encases the tool up to approximately 50 mm from the tool end. A more representative boundary condition may prescribe a fixed temperature at the end face of the tool opposite the working end, similar to the approach used in the plunge model. This boundary condition could affect the predicted tool temperature and should be examined in future work.
Overall, these results show that agreement with workpiece thermocouple measurements alone is not sufficient to validate an FSW thermal model. A model may reproduce the workpiece temperature while still predicting an incorrect tool temperature, which implies an incorrect workpiece/tool interface understanding. This highlights that the two tuning variables, hW/T and α, need to be better understood. This is important for simulations used to evaluate material flow, tool loading, microstructure evolution, or process limits, since these quantities depend on the local thermal conditions near the tool.
6. Conclusions
Validating FSW temperature predictions in both the tool and the workpiece is challenging but is necessary to ensure that partitioning of heat at the workpiece/tool interface is accurate. Most prior studies validate temperatures on only one side of the heat generation interface resulting in a lack of understanding of how heat is shared between components.
This study evaluated the steady state thermal response during friction stir welding of AA 6061-T6 using experimental temperature measurements from both the workpiece and the H13 steel tool. A numerical model was developed in ForgeNxt and tuned by varying the workpiece/tool heat transfer coefficient, hW/T, and the friction coefficient, α. a friction coefficient that varies with time was needed to model temperatures with time. Through a tuning optimization, the α curve was adjusted to match temperature results for a given parameter set using Norton’s viscoplastic friction law.
This study’s results show that one sided validation can produce misleading agreement. When the model was tuned using only the tool temperatures, the simulated steady state tool temperatures matched the experimental values but the workpiece temperatures were overpredicted. Conversely, when the model was tuned using only the workpiece temperatures, the workpiece temperatures were matched but the tool temperatures were underpredicted. These results demonstrate that validating the model using either the tool or workpiece temperatures alone does not guarantee that the thermal behavior at the workpiece/tool interface is accurately represented. The sensitivity analysis further showed that both the tool and workpiece temperatures were affected by changes in the friction coefficient, α, while the tool temperatures were more sensitive to changes in hW/T than the workpiece temperatures.
When both tool and workpiece temperatures were considered, the optimized result remained close to the workpiece validated case and did not fully recover the measured tool temperatures. This suggests that the discrepancy is not simply caused by the optimization procedure, but may reflect limitations in the current interface formulation. These findings support two main conclusions. First, FSW models should be validated using temperature measurements from both the tool and workpiece whenever possible. Second, the present results show that optimizing interface parameters can produce good agreement with selected measurements, but this agreement does not necessarily guarantee that the model captures the correct thermal partitioning at the workpiece/tool interface.
Author Contributions
M.T.: Investigation: Data Curation, Writing—Original Draft, Writing—Review and Editing, Visualization; M.G.: Conceptualization, Methodology, Software, Validation, Formal Analysis, Investigation, Data Curation, Writing—Original Draft, Writing—Review and Editing, Visualization; R.M.: Methodology, Software, Validation, Formal Analysis, Investigation, Data Curation, Writing—Original Draft, Visualization; M.P.M.: Conceptualization, Software, Resources, Writing—Original Draft, Writing—Review and Editing, Resources, Supervision, Funding Acquisition, Project Administration; T.M.: Conceptualization, Writing—Review and Editing, Supervision, Funding Acquisition, Resources, Project Administration. All authors have read and agreed to the published version of the manuscript.
Funding
This work was supported by the National Science Foundation under Grant No. 1935767.
Institutional Review Board Statement
Not applicable.
Informed Consent Statement
Not applicable.
Data Availability Statement
The data are contained within the article, or they can be requested.
Conflicts of Interest
The authors declare no conflict of interest.
References
- Hwang, Y.-M.; Kang, Z.-W.; Chiou, Y.-C.; Hsu, H.-H. Experimental Study on Temperature Distributions within the Workpiece during Friction Stir Welding of Aluminum Alloys. Int. J. Mach. Tools Manuf. 2008, 48, 778–787. [Google Scholar] [CrossRef]
- Assidi, M.; Fourment, L.; Guerdoux, S.; Nelson, T. Friction Model for Friction Stir Welding Process Simulation: Calibrations from Welding Experiments. Int. J. Mach. Tools Manuf. 2010, 50, 143–155. [Google Scholar] [CrossRef]
- Mishra, R.S.; Ma, Z.Y. Friction Stir Welding and Processing. Mater. Sci. Eng. R Rep. 2005. [Google Scholar] [CrossRef]
- Threadgill, P.L.; Leonard, A.J.; Shercliff, H.R.; Withers, P.J. Friction Stir Welding of Aluminium Alloys. Int. Mater. Rev. 2009, 54, 49–93. [Google Scholar] [CrossRef]
- Ulysse, P. Three-Dimensional Modeling of the Friction Stir-Welding Process. Int. J. Mach. Tools Manuf. 2002, 42, 1549–1557. [Google Scholar] [CrossRef]
- Chao, Y.J.; Qi, X.; Tang, W. Heat Transfer in Friction Stir Welding - Experimental and Numerical Studies. J. Manuf. Sci. Eng. Trans. ASME 2003, 125, 138–145. [Google Scholar] [CrossRef]
- Chen, C.M.; Kovacevic, R. Finite Element Modeling of Friction Stir Welding—Thermal and Thermomechanical Analysis. Int. J. Mach. Tools Manuf. 2003, 43, 1319–1326. [Google Scholar] [CrossRef]
- Song, M.; Kovacevic, R. Thermal Modeling of Friction Stir Welding in a Moving Coordinate System and Its Validation. Int. J. Mach. Tools Manuf. 2003, 43, 605–615. [Google Scholar] [CrossRef]
- Khandkar, M.Z.H.; Khan, J.A.; Reynolds, A.P. Prediction of Temperature Distribution and Thermal History during Friction Stir Welding: Input Torque Based Model. Sci. Technol. Weld. Join. 2003, 8, 165–174. [Google Scholar] [CrossRef]
- Colegrove, P.A.; Shercliff, H.R. Experimental and Numerical Analysis of Aluminium Alloy 7075-T7351 Friction Stir Welds. Sci. Technol. Weld. Join. 2003, 8, 360–368. [Google Scholar] [CrossRef]
- Schmidt, H.; Hattel, J. A Local Model for the Thermomechanical Conditions in Friction Stir Welding. Model. Simul. Mater. Sci. Eng. 2004, 13, 77–93. [Google Scholar] [CrossRef]
- Soundararajan, V.; Zekovic, S.; Kovacevic, R. Thermo-Mechanical Model with Adaptive Boundary Conditions for Friction Stir Welding of Al 6061. Int. J. Mach. Tools Manuf. 2005, 45, 1577–1587. [Google Scholar] [CrossRef]
- Ellis, D.; Goodson, M.; Miles, M.; Munro, T. Optimized Design for a Device to Measure Thermal Contact Conductance During Friction Stir Welding. Int. J. Thermophys. 2020, 42, 6. [Google Scholar] [CrossRef]
- Goodson, M.; Melander, R.; Miles, M.P.; Munro, T. Effect of Workpiece/Tool Heat Transfer and Friction Coefficients on Accuracy of Simulated Temperatures and Torques in a Friction Stir Welding Plunge. Materials 2024, 17, 198. [Google Scholar] [CrossRef] [PubMed]
- Nandan, R.; DebRoy, T.; Bhadeshia, H.K.D.H. Recent Advances in Friction-Stir Welding – Process, Weldment Structure and Properties. Prog. Mater. Sci. 2008, 53, 980–1023. [Google Scholar] [CrossRef]
- Frigaard, Ø.; Grong, Ø.; Midling, O.T. A Process Model for Friction Stir Welding of Age Hardening Aluminum Alloys. Metall. Mater. Trans. A 2001, 32, 1189–1200. [Google Scholar] [CrossRef]
- Zhang, H.W.; Zhang, Z.; Chen, J.T. 3D Modeling of Material Flow in Friction Stir Welding under Different Process Parameters. J. Mater. Process. Technol. 2007, 183, 62–70. [Google Scholar] [CrossRef]
- Fereiduni, E.; Movahedi, M.; Kokabi, A.H. Aluminum/Steel Joints Made by an Alternative Friction Stir Spot Welding Process. J. Mater. Process. Technol. 2015, 224, 1–10. [Google Scholar] [CrossRef]
- Schmale, J.; Fehrenbacher, A.; Shrivastava, A.; Pfefferkorn, F.E. Calibration of Dynamic Tool–Workpiece Interface Temperature Measurement during Friction Stir Welding. Measurement 2016, 88, 331–342. [Google Scholar] [CrossRef]
- Bachmann, M.; Carstensen, J.; Bergmann, L.; dos Santos, J.F.; Wu, C.S.; Rethmeier, M. Numerical Simulation of Thermally Induced Residual Stresses in Friction Stir Welding of Aluminum Alloy 2024-T3 at Different Welding Speeds. Int. J. Adv. Manuf. Technol. 2017, 91, 1443–1452. [Google Scholar] [CrossRef]
- Paulo, R.M.F.; Carlone, P.; Paradiso, V.; Valente, R.A.F.; Teixeira-Dias, F. Prediction of Friction Stir Welding Effects on AA2024-T3 Plates and Stiffened Panels Using a Shell-Based Finite Element Model. Thin-Walled Struct. 2017, 120, 297–306. [Google Scholar] [CrossRef]
- Mishin, V.; Shishov, I.; Kalinenko, A.; Vysotskii, I.; Zuiko, I.; Malopheyev, S.; Mironov, S.; Kaibyshev, R. Numerical Simulation of the Thermo-Mechanical Behavior of 6061 Aluminum Alloy during Friction-Stir Welding. JMMP 2022, 6, 68. [Google Scholar] [CrossRef]
- Taysom, B.S.; Sorensen, C.D. Advances in Signal Processing for Friction Stir Welding Temperature Control.; Hovanski, Y., Mishra, R., Sato, Y., Upadhyay, P., Yan, D., Eds.; Springer International Publishing, 2019; pp. 135–147. [Google Scholar]
- Wright, A.; Munro, T.R.; Hovanski, Y. Evaluating Temperature Control in Friction Stir Welding for Industrial Applications. J. Manuf. Mater. Process. 2021, 5. [Google Scholar] [CrossRef]
- Transvalor FORGE NxT Simulation Software 2020.
- Guerdoux, S.; Fourment, L.; Miles, M.; Sorensen, C. Numerical Simulation of the Friction Stir Welding Process Using Both Lagrangian and Arbitrary Lagrangian Eulerian Formulations. AIP Conf. Proc. 2004, 712, 1259–1264. [Google Scholar] [CrossRef]
- Al-Badour, F.; Merah, N.; Shuaib, A.; Bazoune, A. Coupled Eulerian Lagrangian Finite Element Modeling of Friction Stir Welding Processes. J. Mater. Process. Technol. 2013, 213, 1433–1439. [Google Scholar] [CrossRef]
- Jacquin, D.; De Meester, B.; Simar, A.; Deloison, D.; Montheillet, F.; Desrayaud, C. A Simple Eulerian Thermomechanical Modeling of Friction Stir Welding. J. Mater. Process. Technol. 2011, 211, 57–65. [Google Scholar] [CrossRef]
- Berger, E.; Miles, M.; Curtis, A.; Blackhurst, P.; Hovanski, Y. 2D Axisymmetric Modeling of Refill Friction Stir Spot Welding and Experimental Validation. JMMP 2022, 6, 89. [Google Scholar] [CrossRef]
- Liu, Q.; Li, W.; Zhu, L.; Gao, Y.; Xing, L.; Duan, Y.; Ke, L. Temperature-Dependent Friction Coefficient and Its Effect on Modeling Friction Stir Welding for Aluminum Alloys. J. Manuf. Process. 2022, 84, 1054–1063. [Google Scholar] [CrossRef]
- Chiumenti, M.; Cervera, M.; de Saracibar, C.A.; Dialami, N. Numerical Modeling of Friction Stir Welding Processes. Comput. Methods Appl. Mech. Eng. 2013, 254, 353–369. [Google Scholar] [CrossRef]
- Andrade, D.G.; Leitão, C.; Dialami, N.; Chiumenti, M.; Rodrigues, D.M. Analysis of Contact Conditions and Its Influence on Strain Rate and Temperature in Friction Stir Welding. Int. J. Mech. Sci. 2021, 191, 106095. [Google Scholar] [CrossRef]
- Meyghani, B.; Awang, M.; Emamian, S.; Khalid, N.M. Developing a Finite Element Model for Thermal Analysis of Friction Stir Welding by Calculating Temperature Dependent Friction Coefficient; Awang, M., Ed.; Springer, 2017; pp. 107–126. [Google Scholar]
- Awang, M.; Mucino, V.H. Energy Generation during Friction Stir Spot Welding (FSSW) of Al 6061-T6 Plates. Mater. Manuf. Process. 2010, 25, 167–174. [Google Scholar] [CrossRef]
- Nakamura, T.; Obikawa, T.; Yukutake, E.; Ueda, S.; Nishizaki, I. Tool Temperature and Process Modeling of Friction Stir Welding. Mod. Mech. Eng. 2018, 08, 78–94. [Google Scholar] [CrossRef]
- Hossfeld, M. On Friction, Heat Input, and Material Flow Initiation during Friction Stir Welding: Tool and Process Optimization. JMMP 2023, 7, 34. [Google Scholar] [CrossRef]
Figure 1.
Steps to a FSW process: 1) plunge, 2) dwell, 3) traverse, and 4) withdraw.
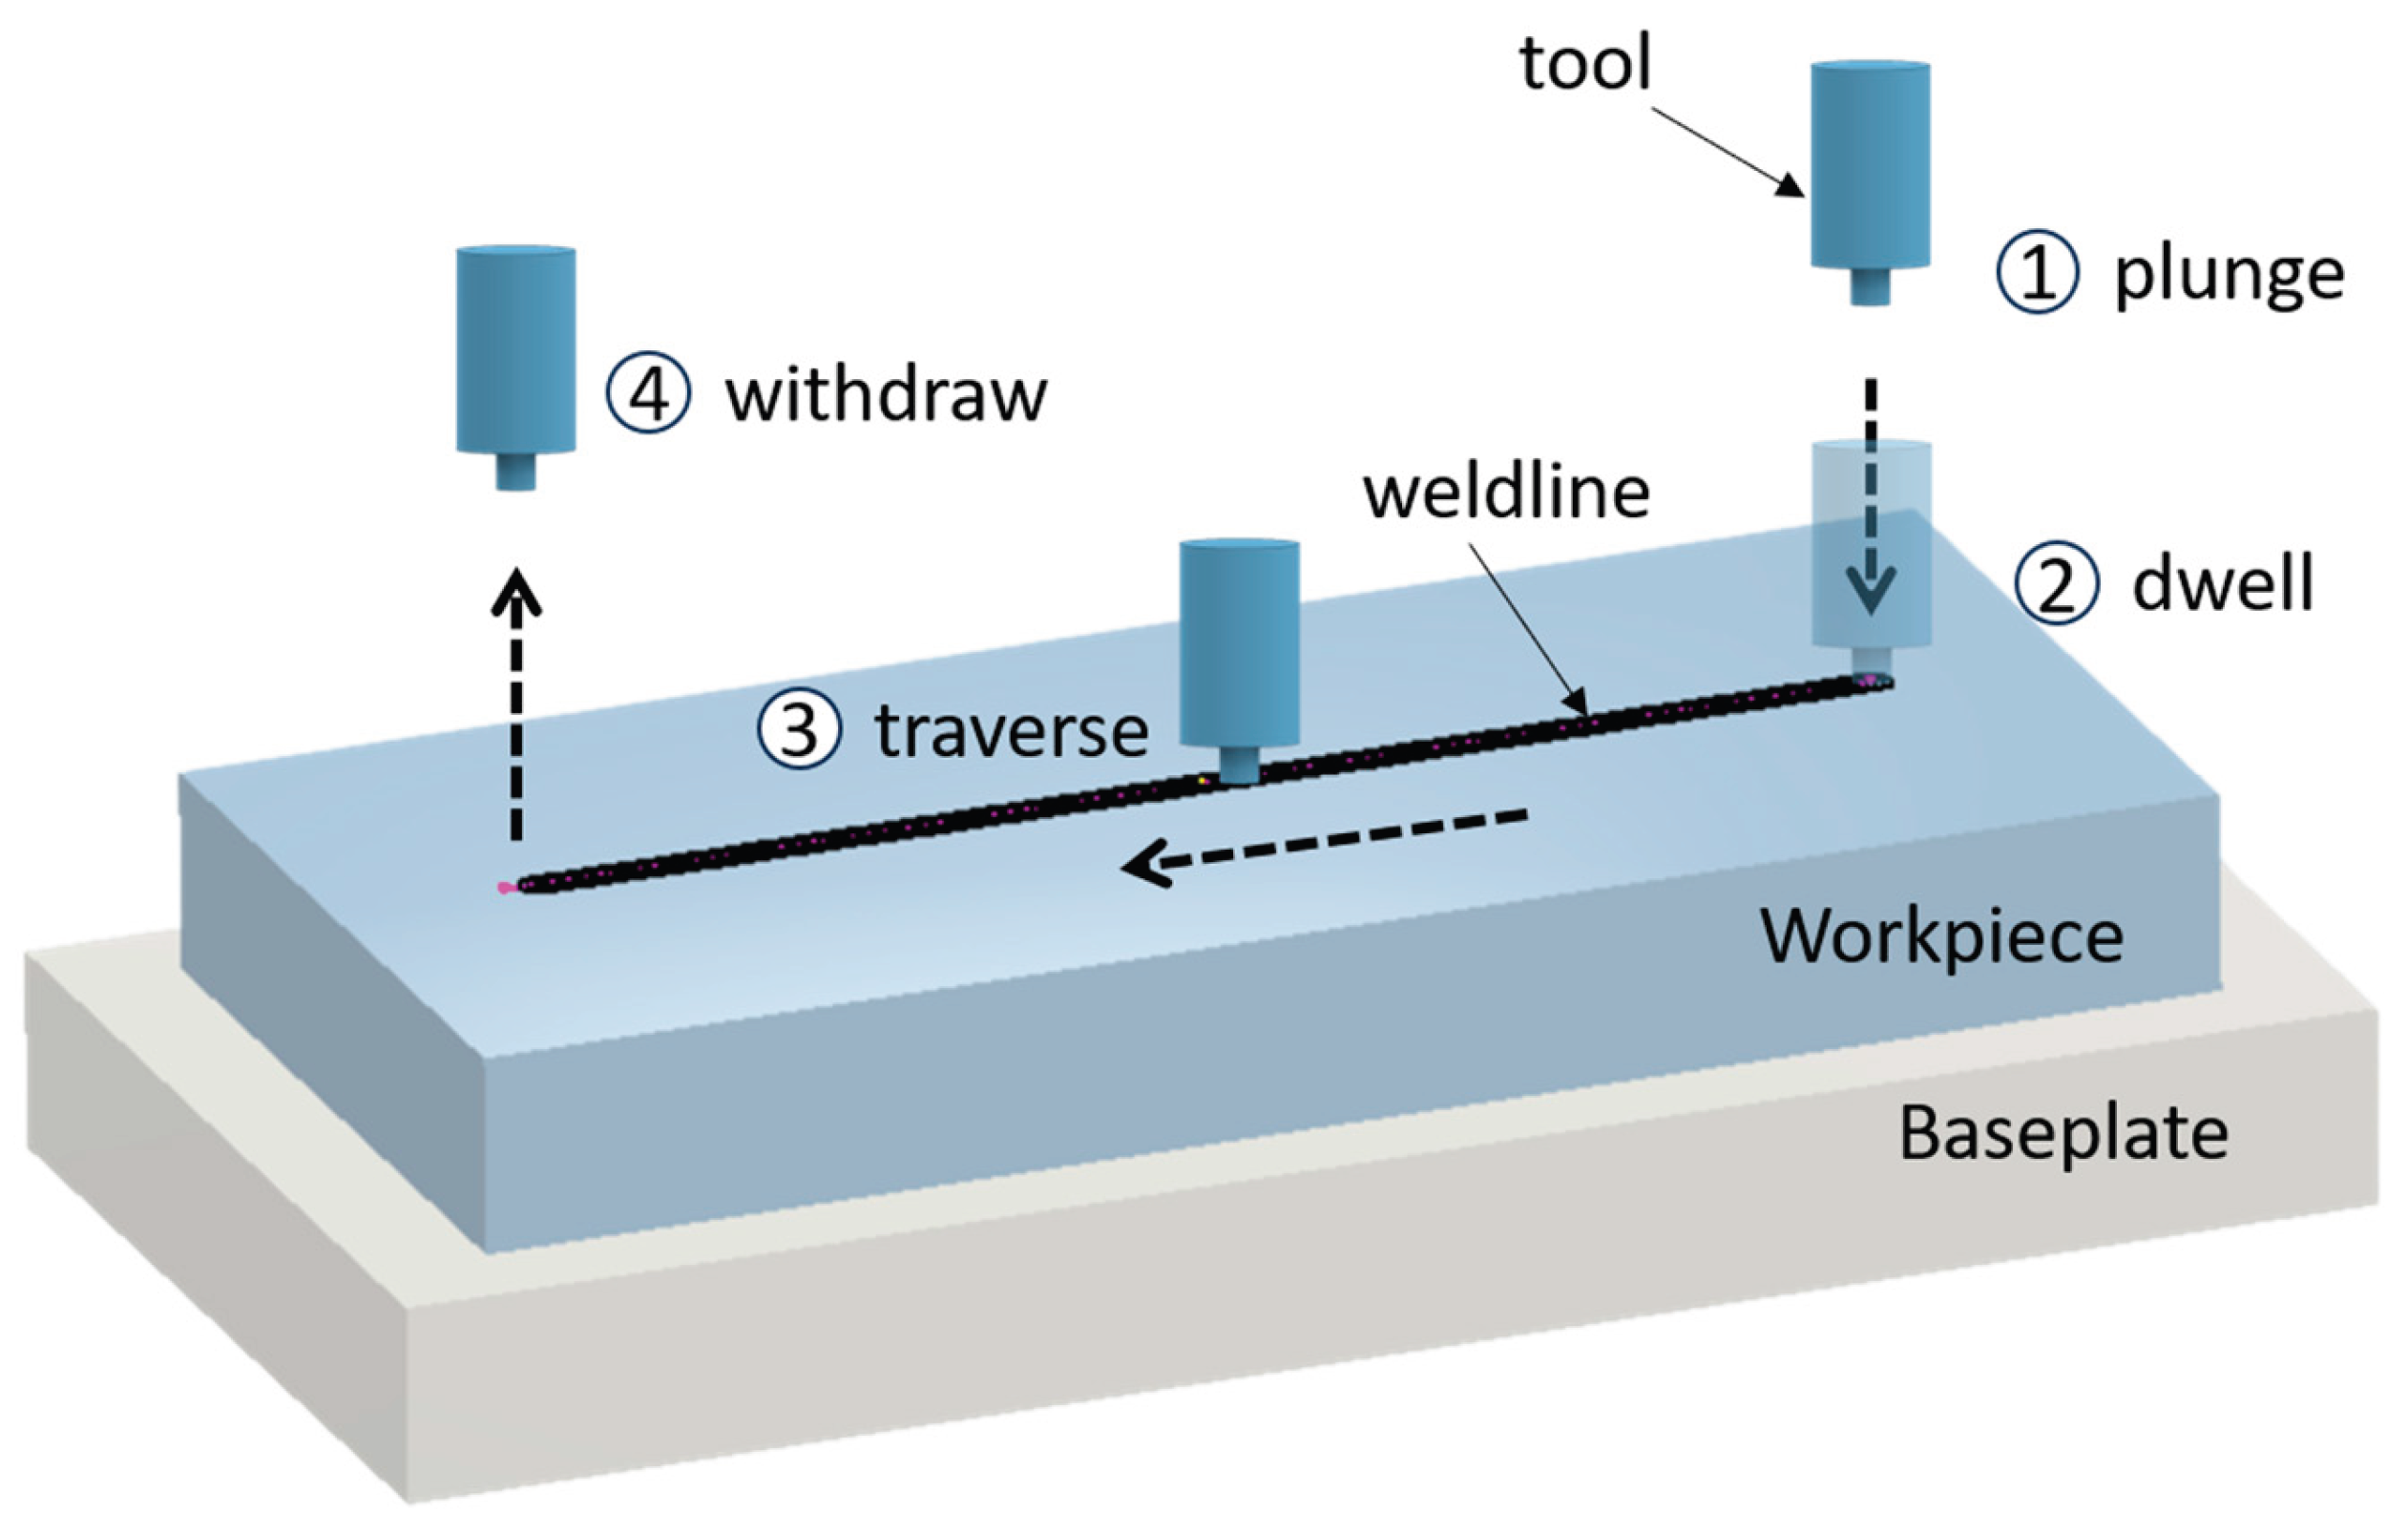
Figure 2.
Schematic of the FSW process showing the main thermal boundary conditions considered in the numerical model, including heat transfer coefficients.
Figure 2.
Schematic of the FSW process showing the main thermal boundary conditions considered in the numerical model, including heat transfer coefficients.
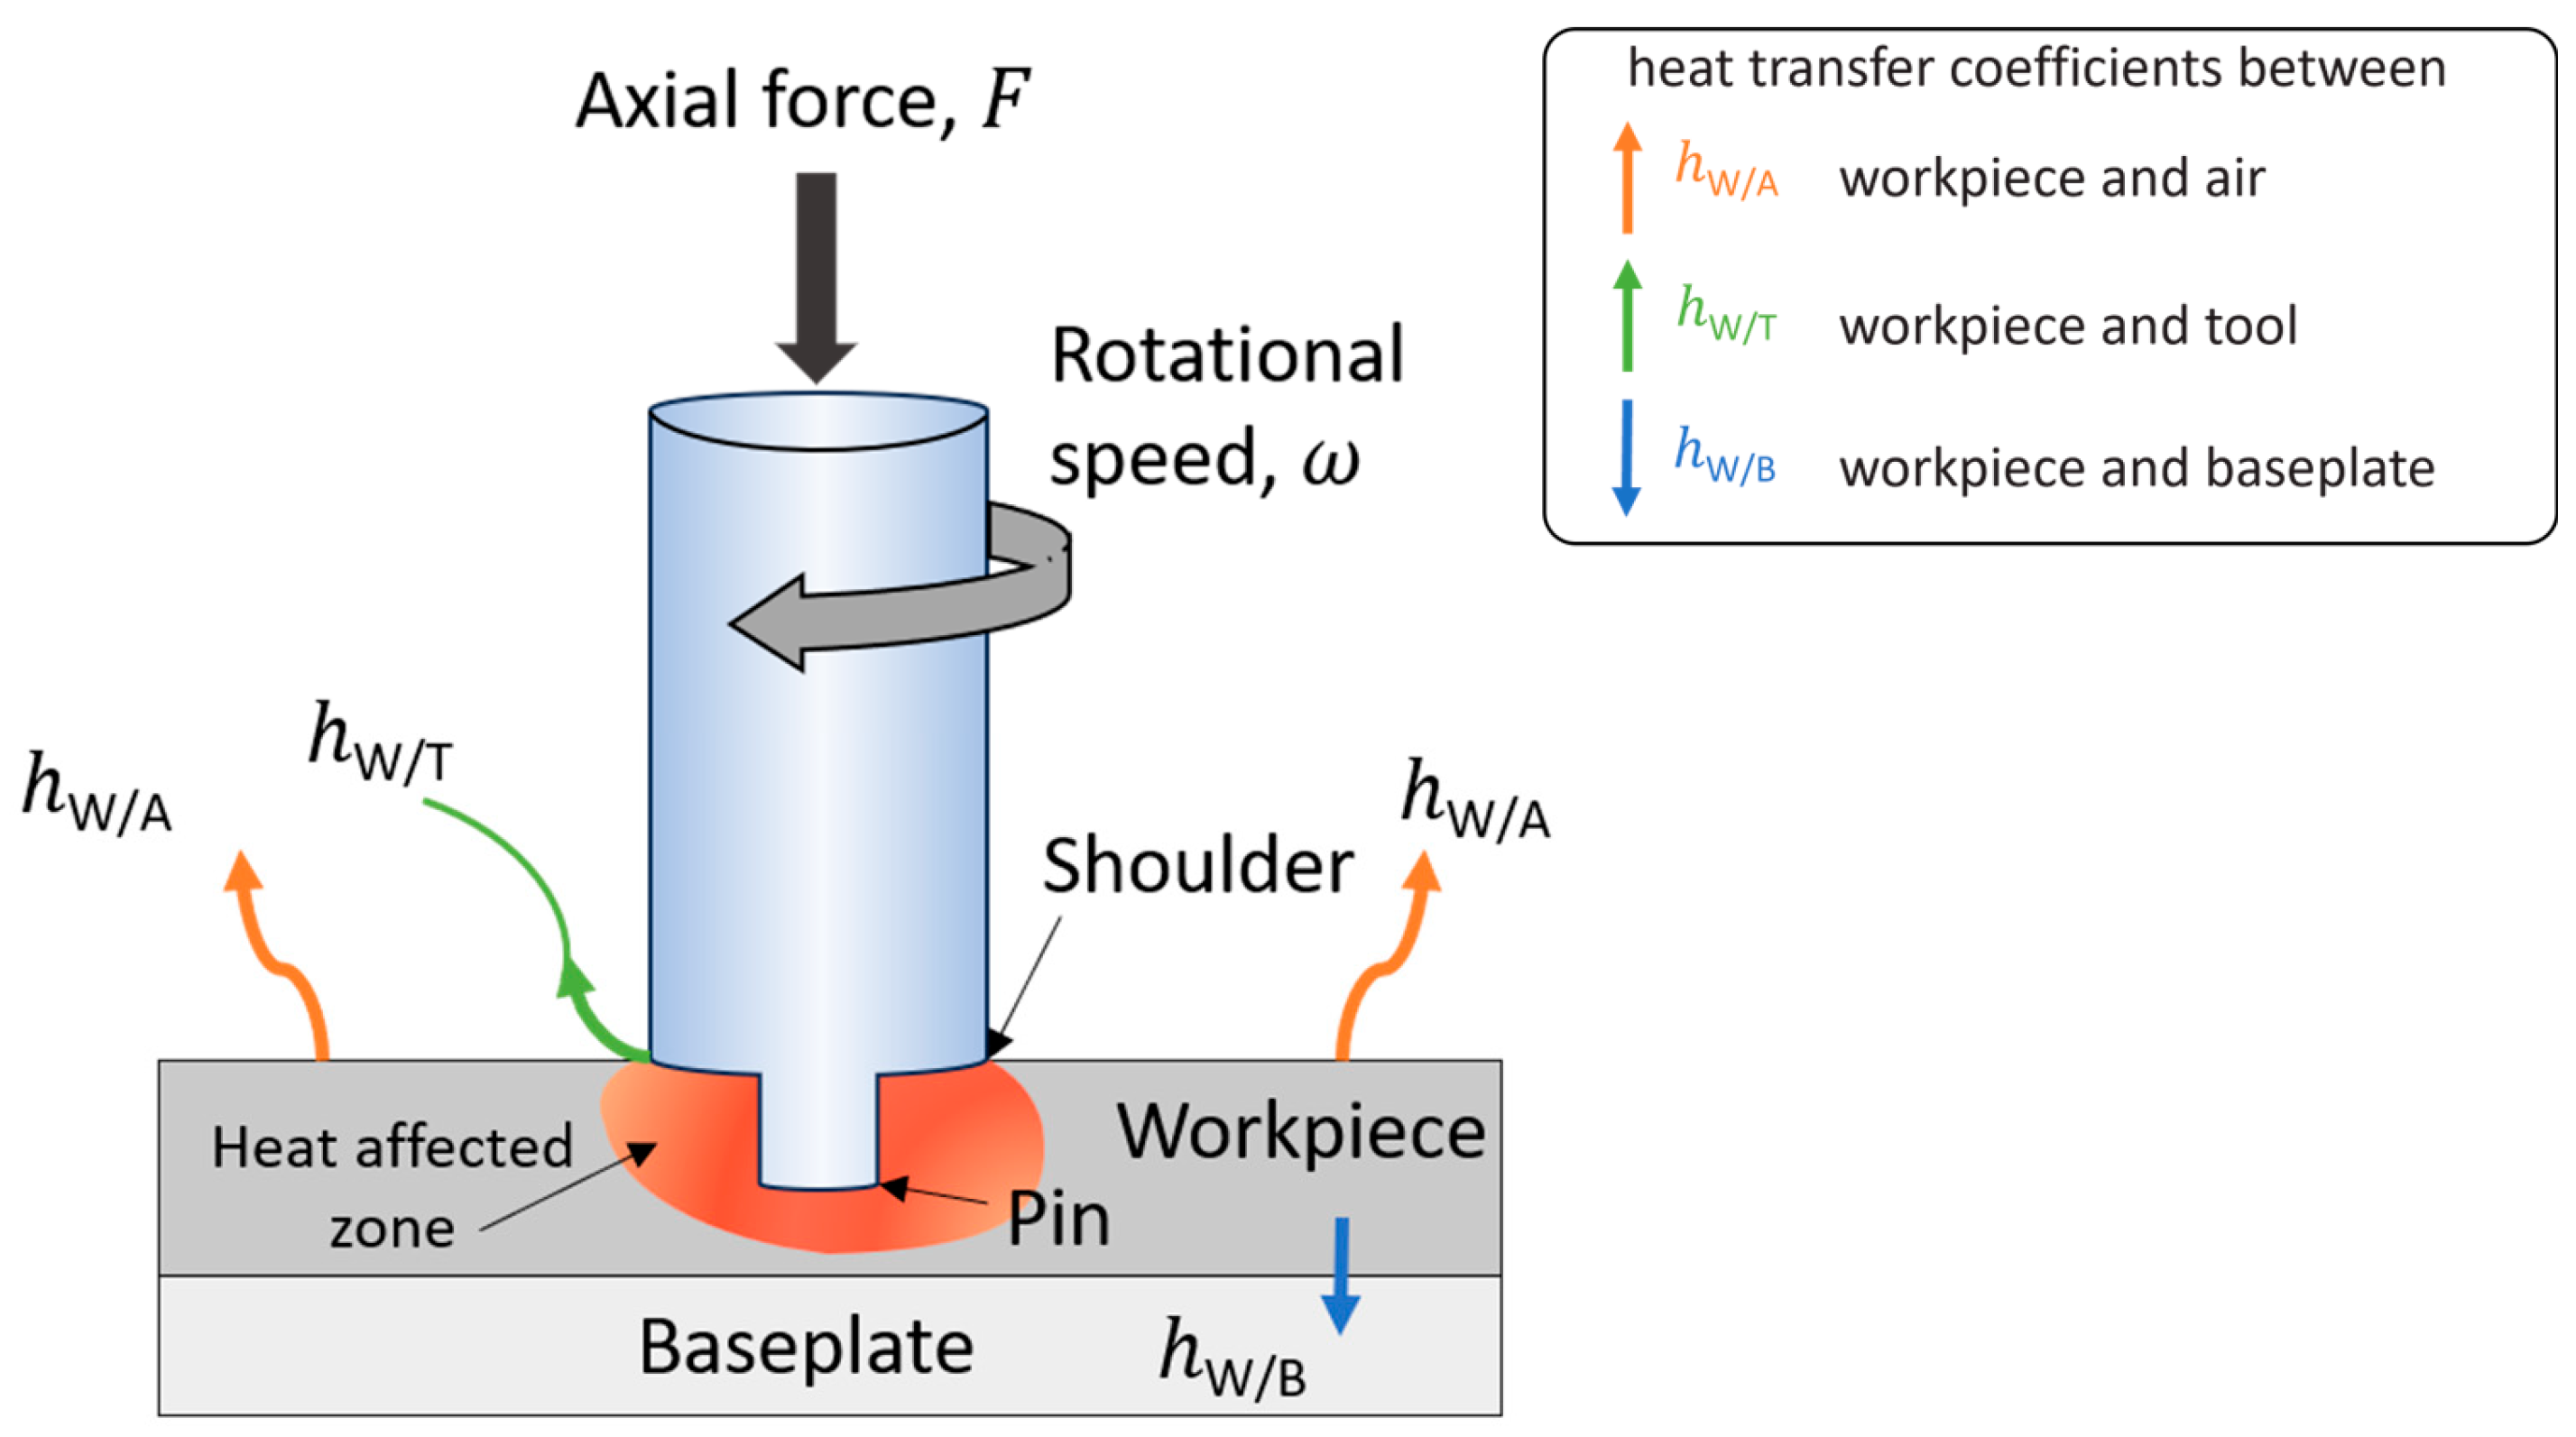
Figure 3.
Experimental setup of the steady state experiment.
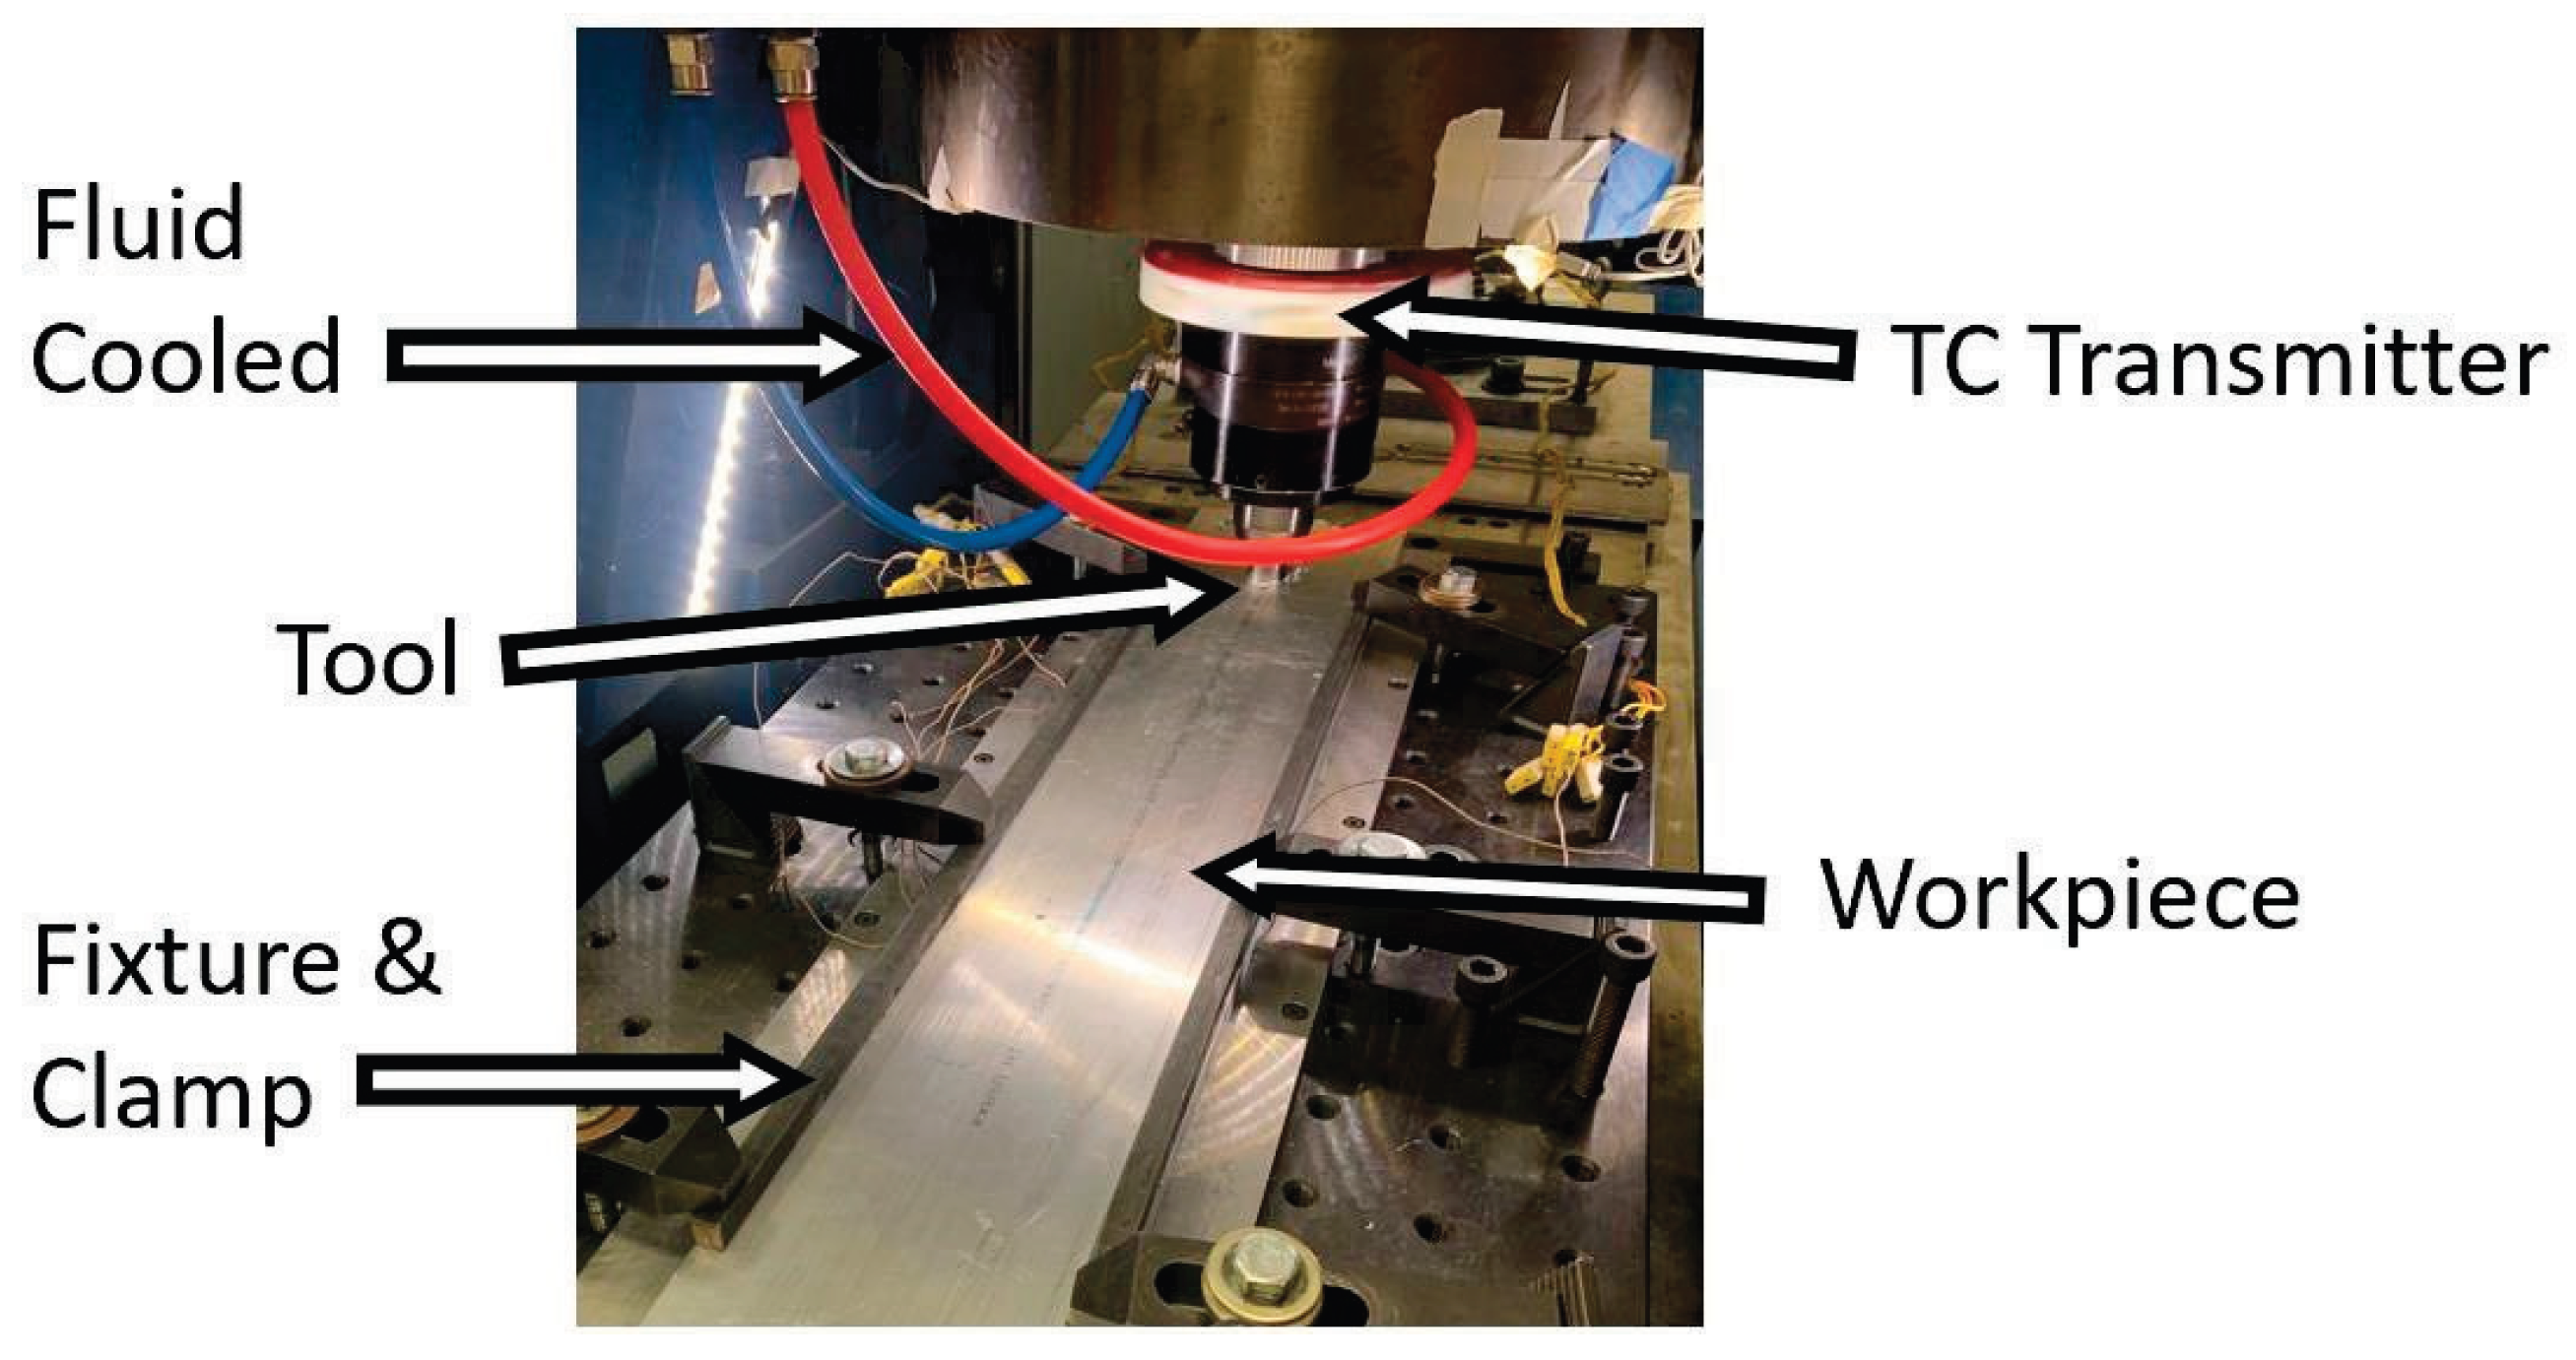
Figure 4.
Schematic of the aluminum weld plate and thermocouple placement. a) Overall plate schematic showing the weld centerline and embedded thermocouple locations. b) Section A-A showing the hole geometry and thermocouple depth. c) Drawing showing underside of the plate with thermocouple positions relative to the weld centerline. All dimensions are in mm.
Figure 4.
Schematic of the aluminum weld plate and thermocouple placement. a) Overall plate schematic showing the weld centerline and embedded thermocouple locations. b) Section A-A showing the hole geometry and thermocouple depth. c) Drawing showing underside of the plate with thermocouple positions relative to the weld centerline. All dimensions are in mm.
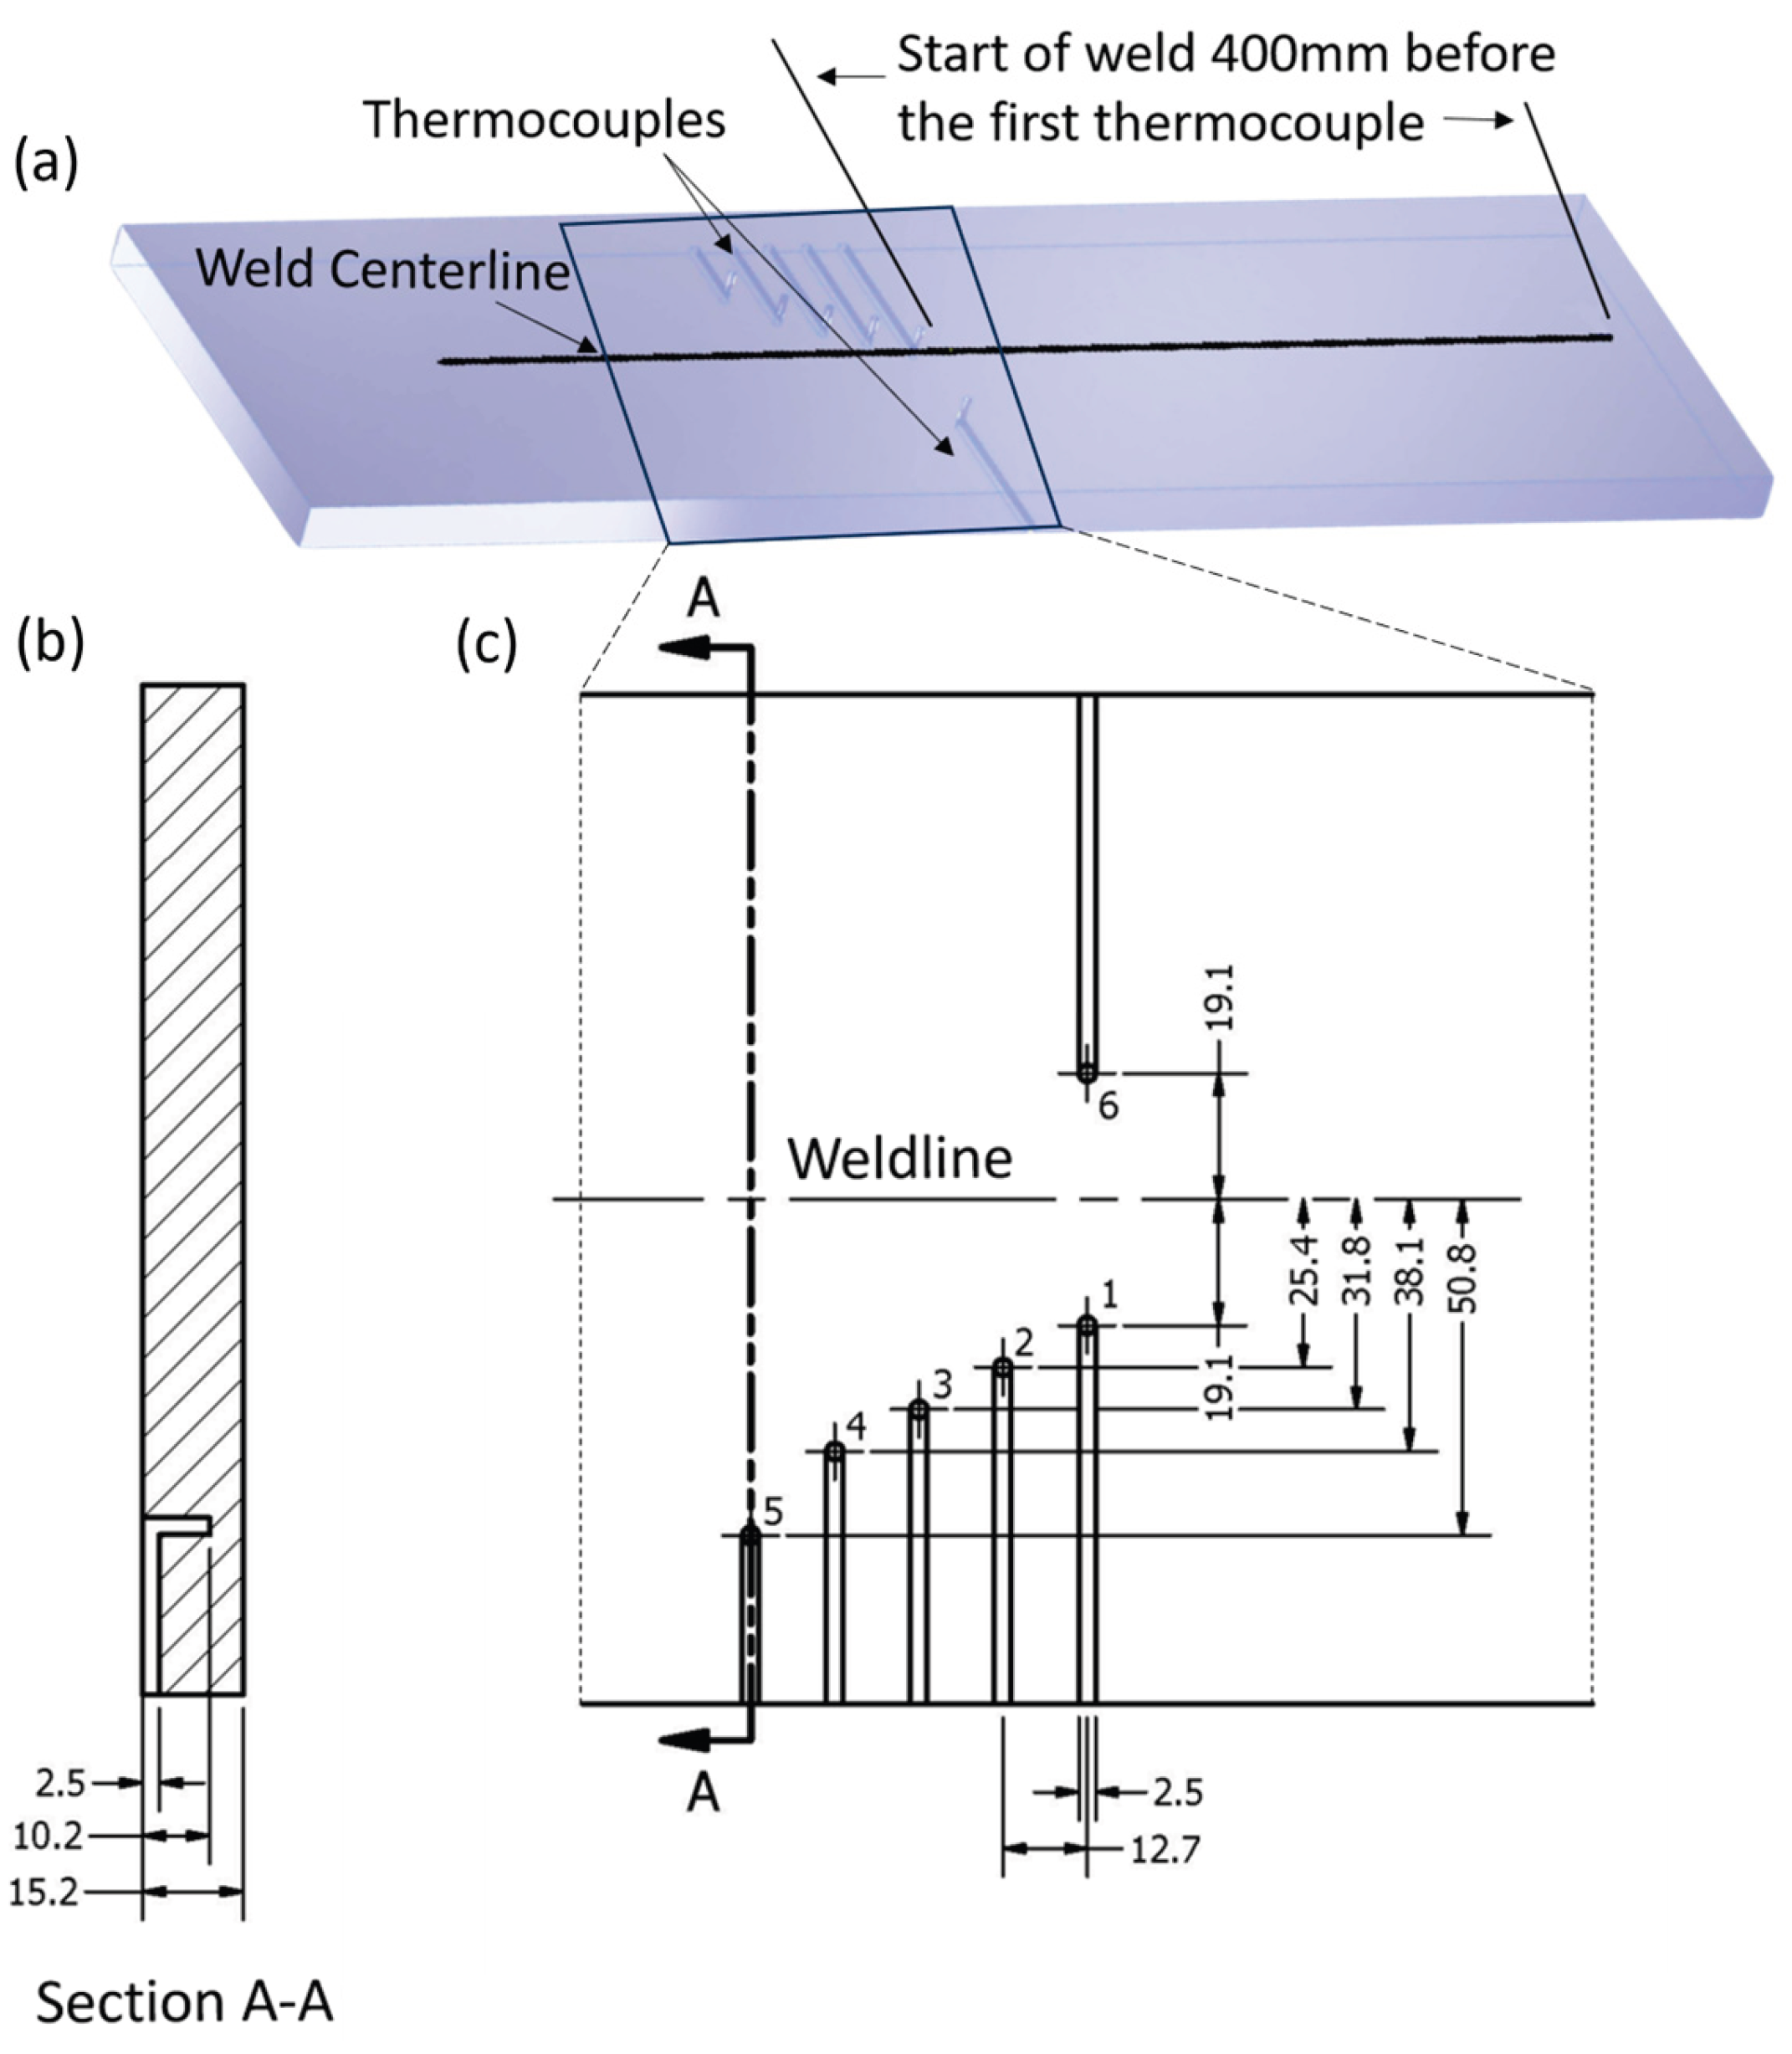
Figure 5.
Temperature sensor array used in the model to capture the temperature relative to tool position along the length of the weld. The tool is stationary at the origin as represented by the X.
Figure 5.
Temperature sensor array used in the model to capture the temperature relative to tool position along the length of the weld. The tool is stationary at the origin as represented by the X.
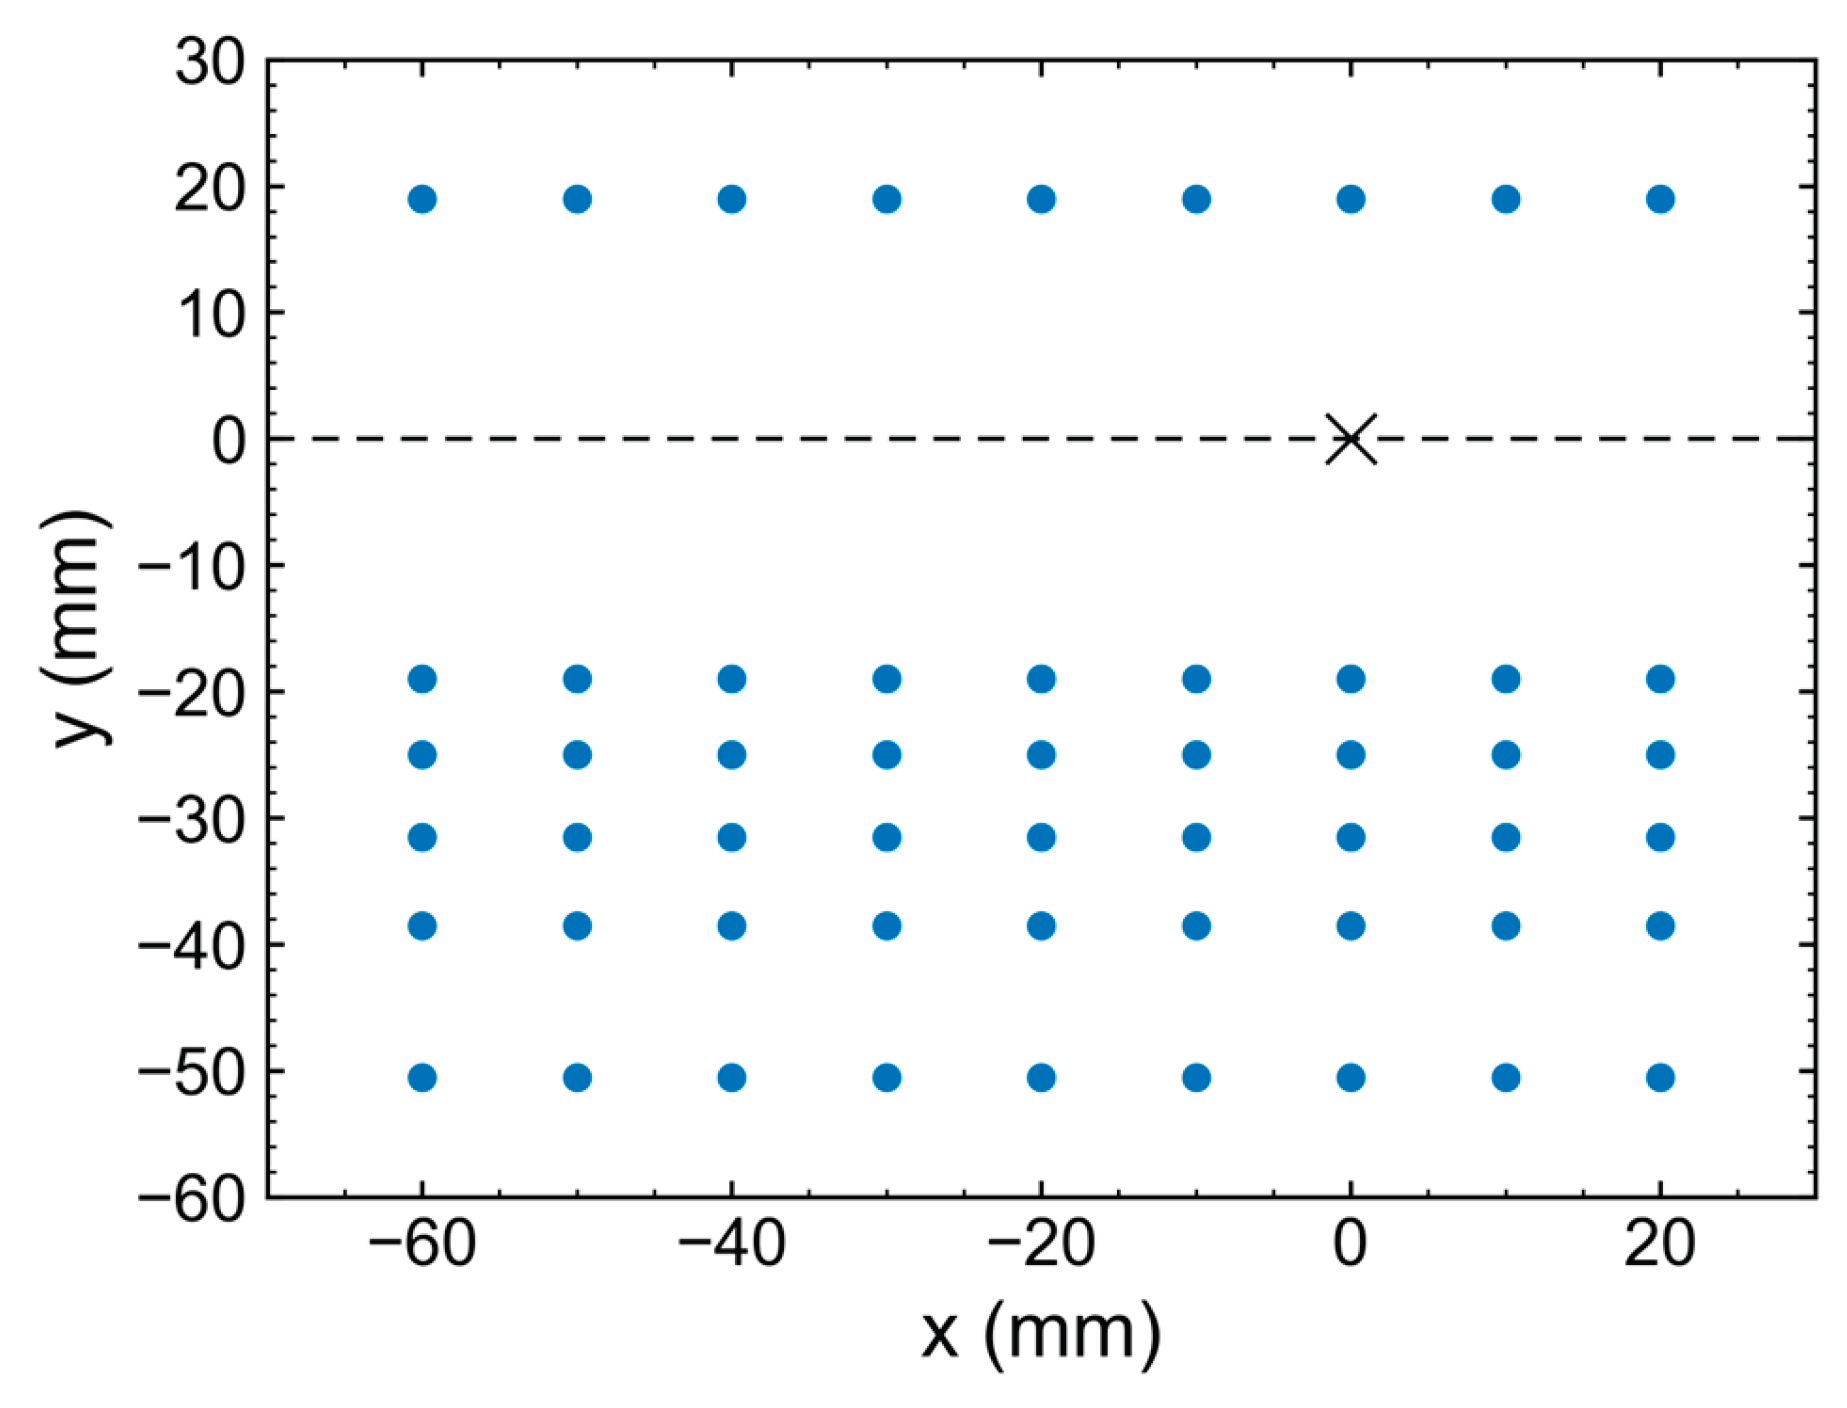
Figure 6.
Schematic detailing the location of the different thermal boundary conditions and frictional boundary conditions. The baseplate and holder were set at a constant temperature of 20 °C.
Figure 6.
Schematic detailing the location of the different thermal boundary conditions and frictional boundary conditions. The baseplate and holder were set at a constant temperature of 20 °C.
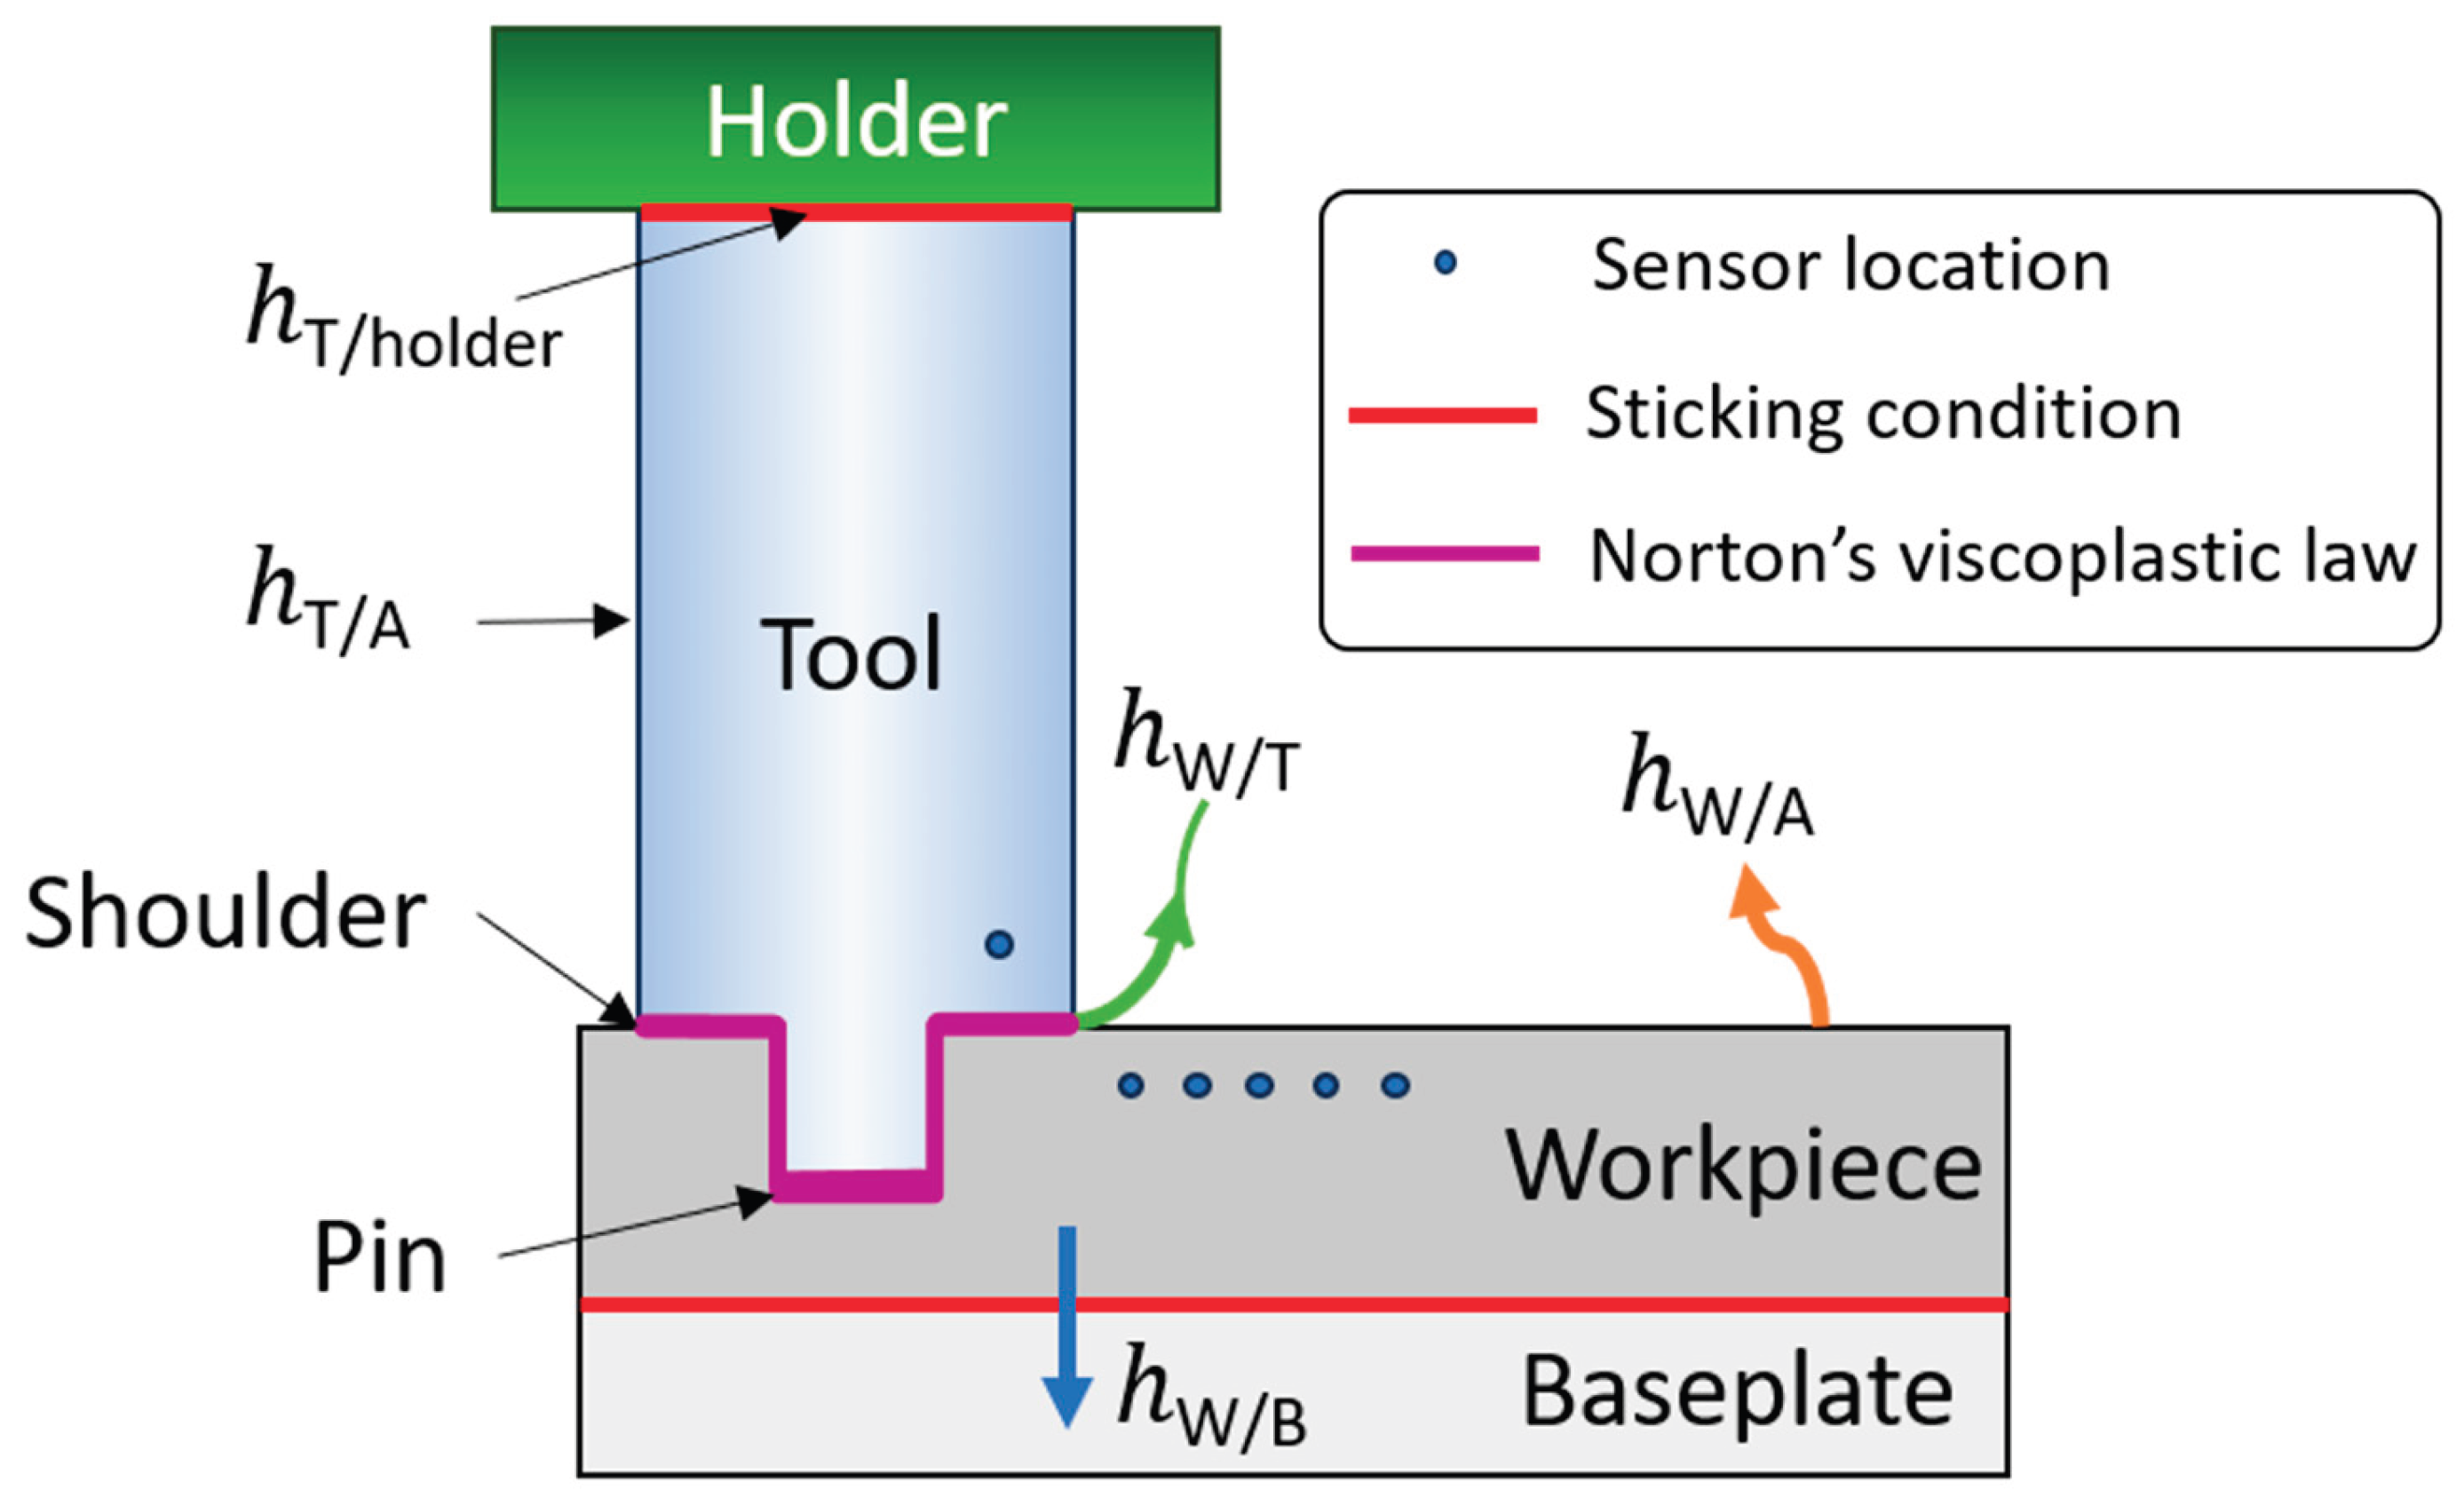
Figure 7.
Validating only the experimental tool temperatures with the model when hW/T =65 kW m−2 K−1 and α = 0.20. Hollow circles indicate simulated steady state temperatures, dashed lines show the projected experimental values, and solid lines show the experimental pin and shoulder tool temperatures.
Figure 7.
Validating only the experimental tool temperatures with the model when hW/T =65 kW m−2 K−1 and α = 0.20. Hollow circles indicate simulated steady state temperatures, dashed lines show the projected experimental values, and solid lines show the experimental pin and shoulder tool temperatures.
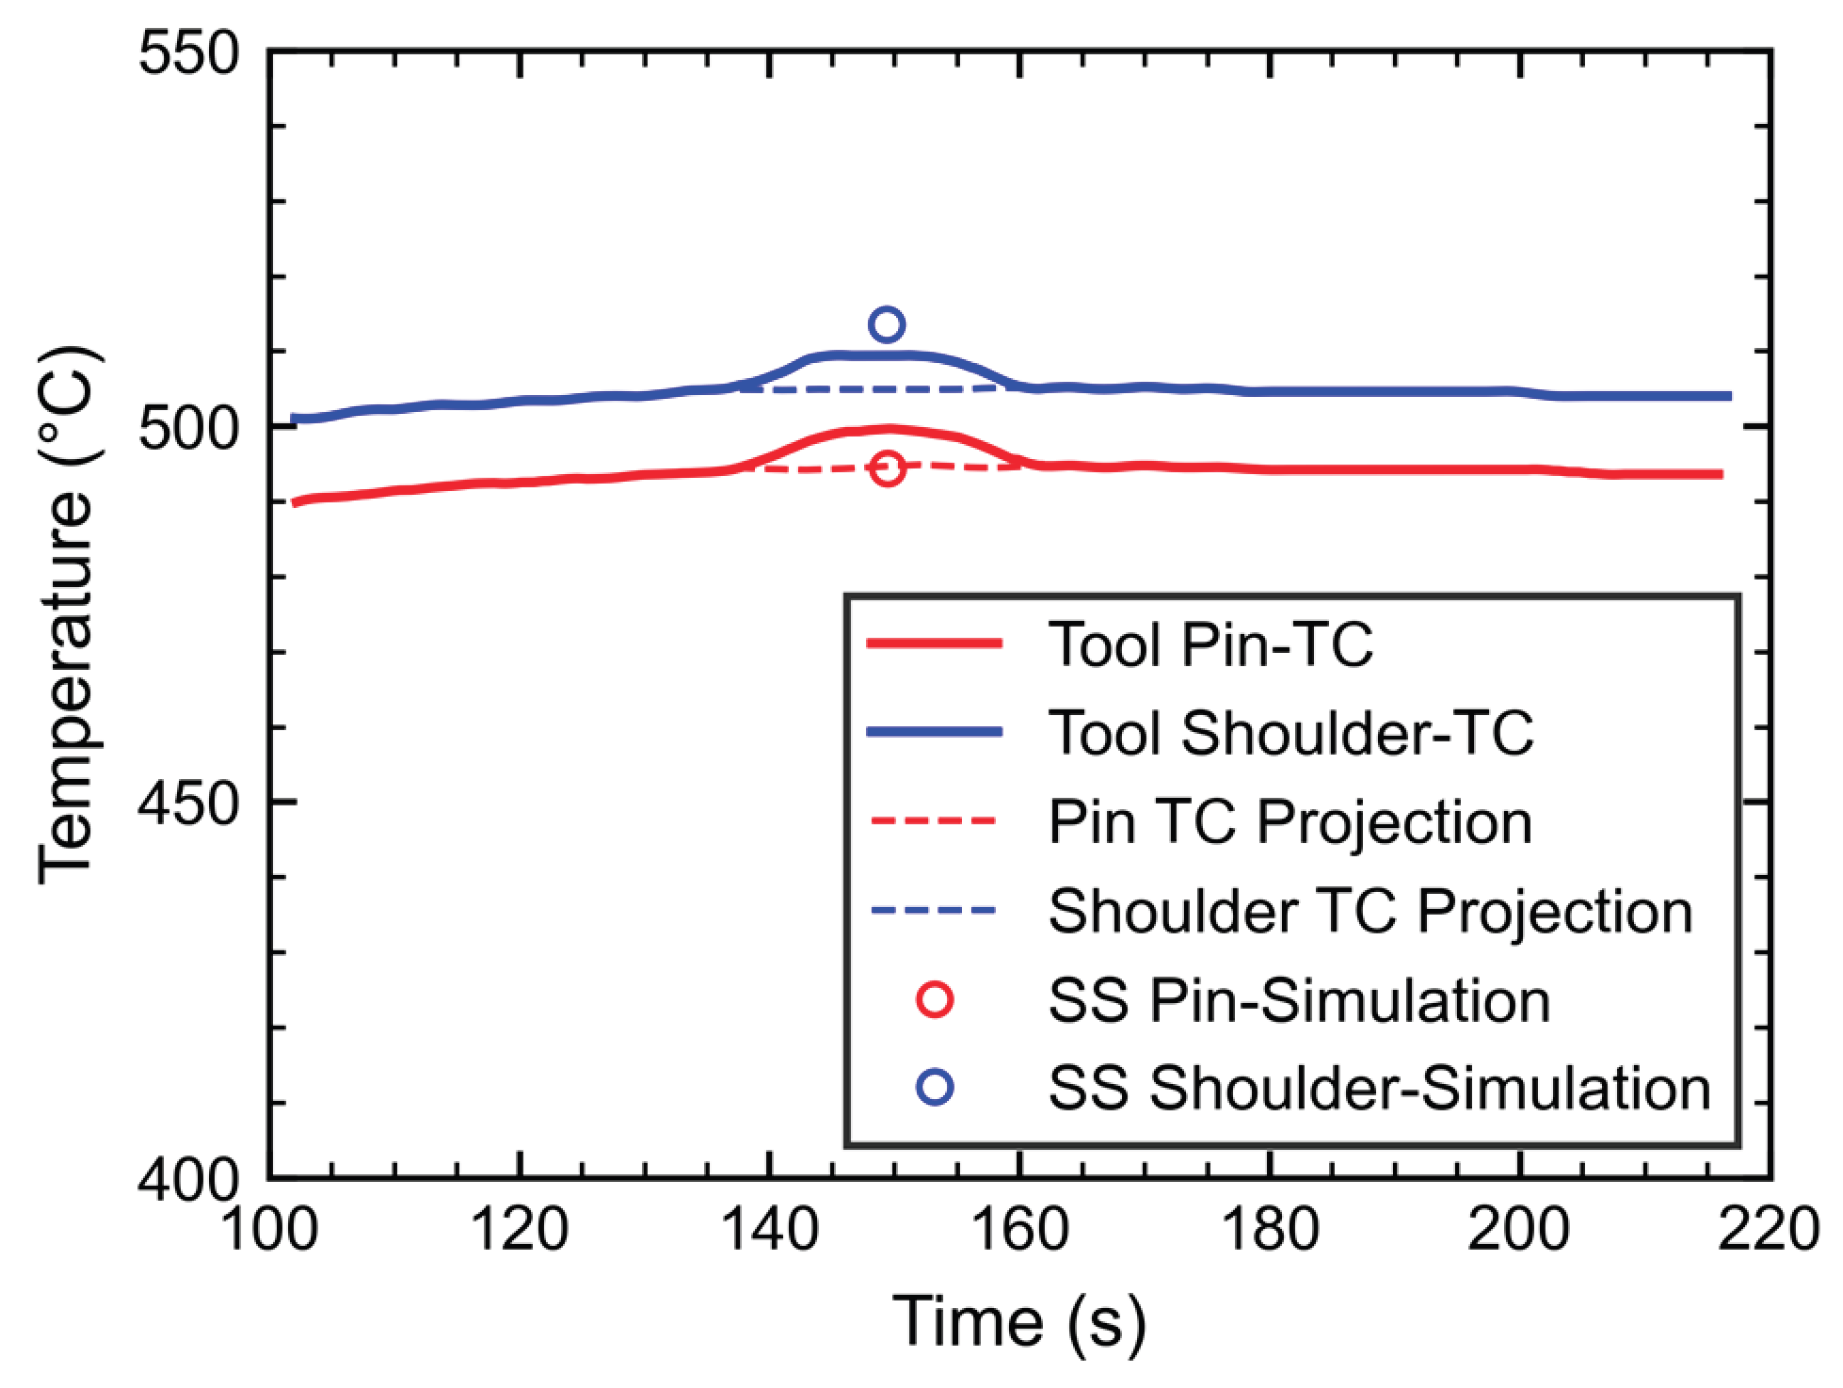
Figure 8.
Workpiece experimental max temperatures compared to simulated workpiece temperatures at the thermocouple locations after one sided matching using tool temperatures. Vertical lines indicate the temperature difference between the experimental and simulated values, showing consistent overprediction of the workpiece temperatures by the model.
Figure 8.
Workpiece experimental max temperatures compared to simulated workpiece temperatures at the thermocouple locations after one sided matching using tool temperatures. Vertical lines indicate the temperature difference between the experimental and simulated values, showing consistent overprediction of the workpiece temperatures by the model.
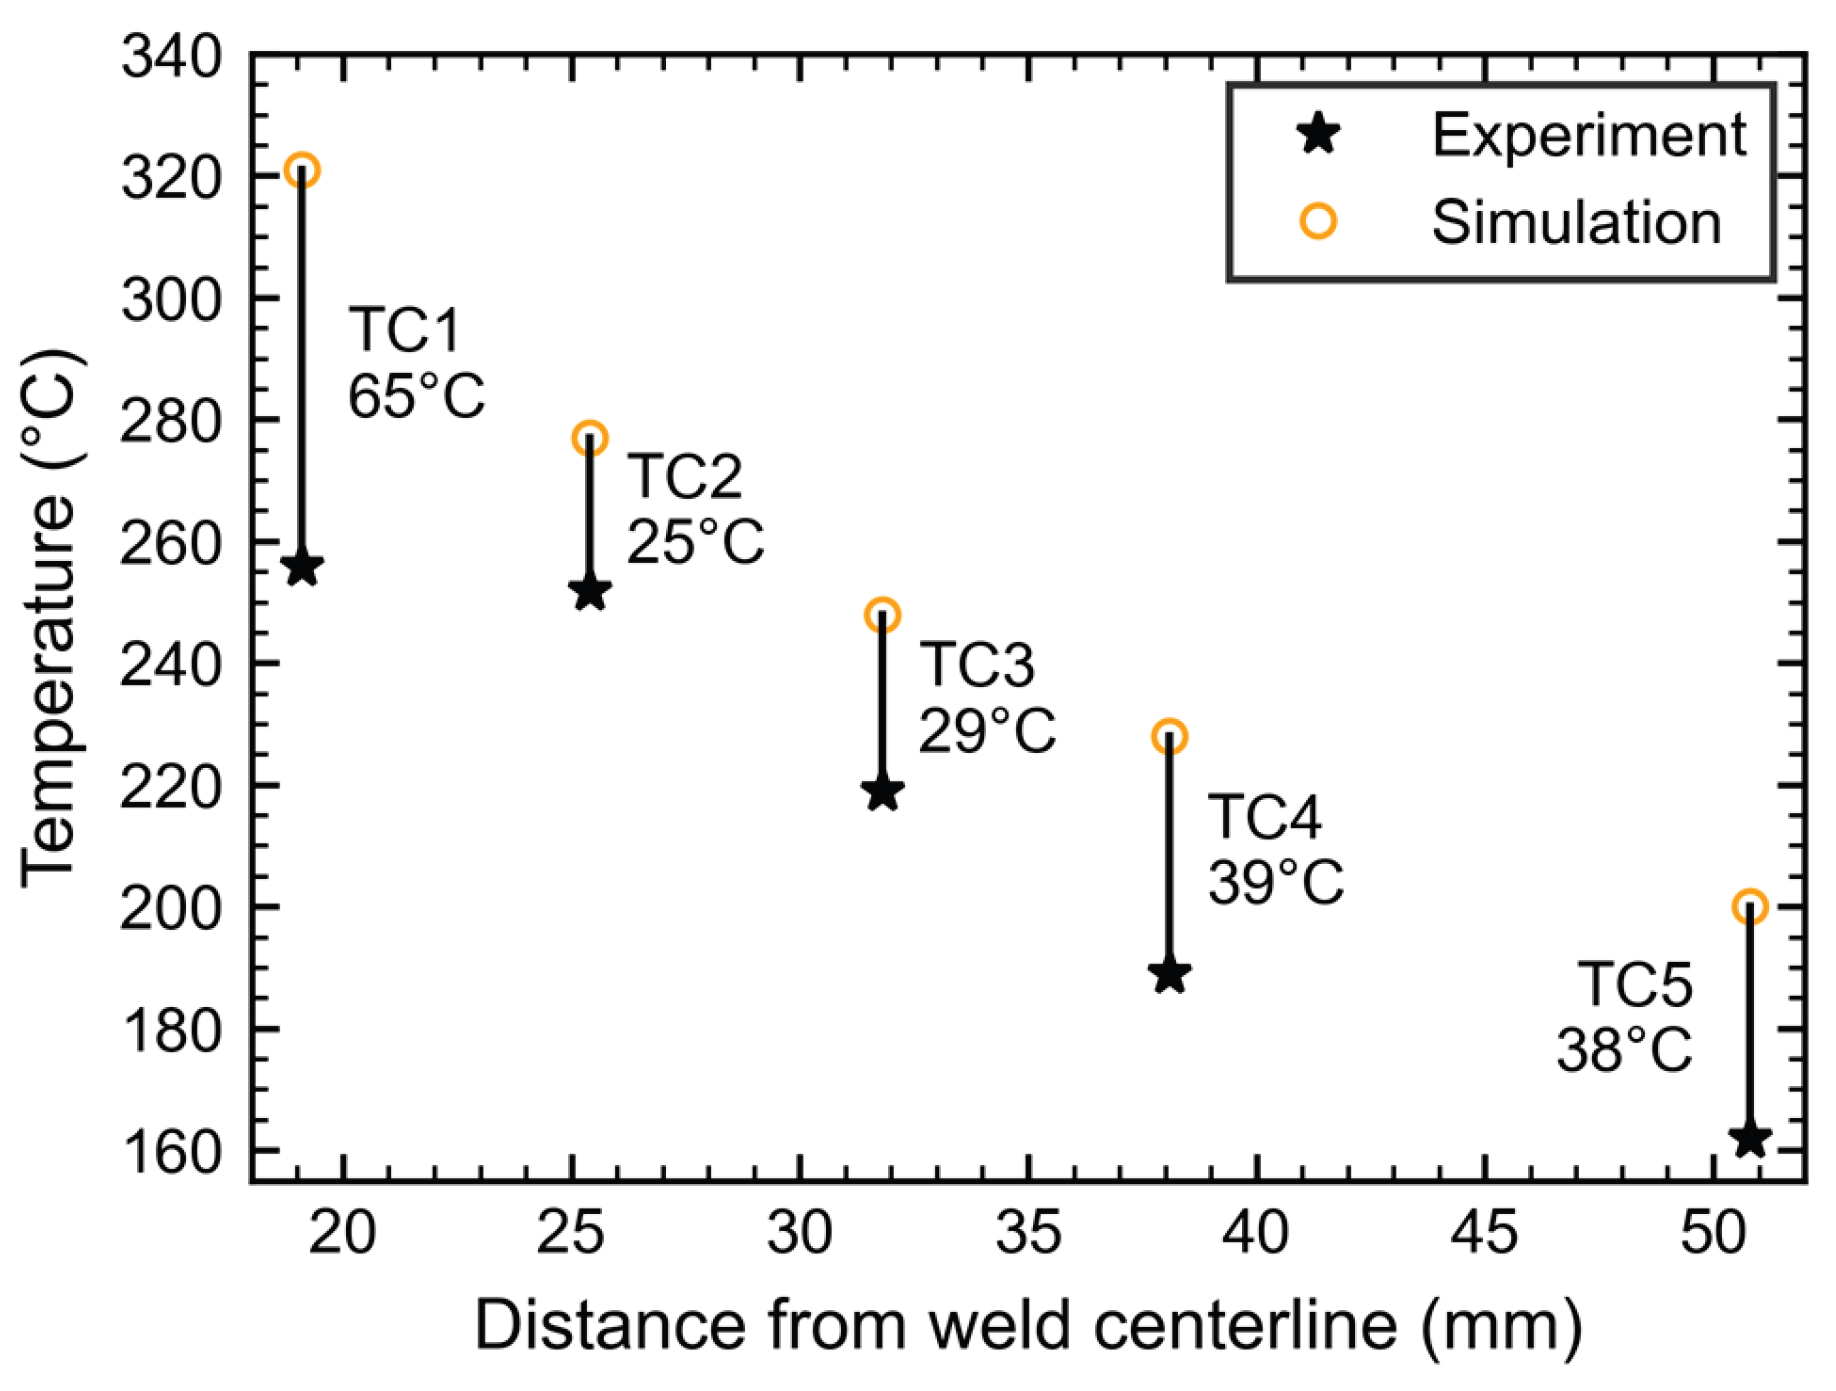
Figure 9.
Workpiece experimental max temperatures compared to simulated workpiece temperatures at the thermocouple locations after matching only workpiece temperature measurements. Vertical lines indicate the temperature difference between the experimental and simulated values.
Figure 9.
Workpiece experimental max temperatures compared to simulated workpiece temperatures at the thermocouple locations after matching only workpiece temperature measurements. Vertical lines indicate the temperature difference between the experimental and simulated values.
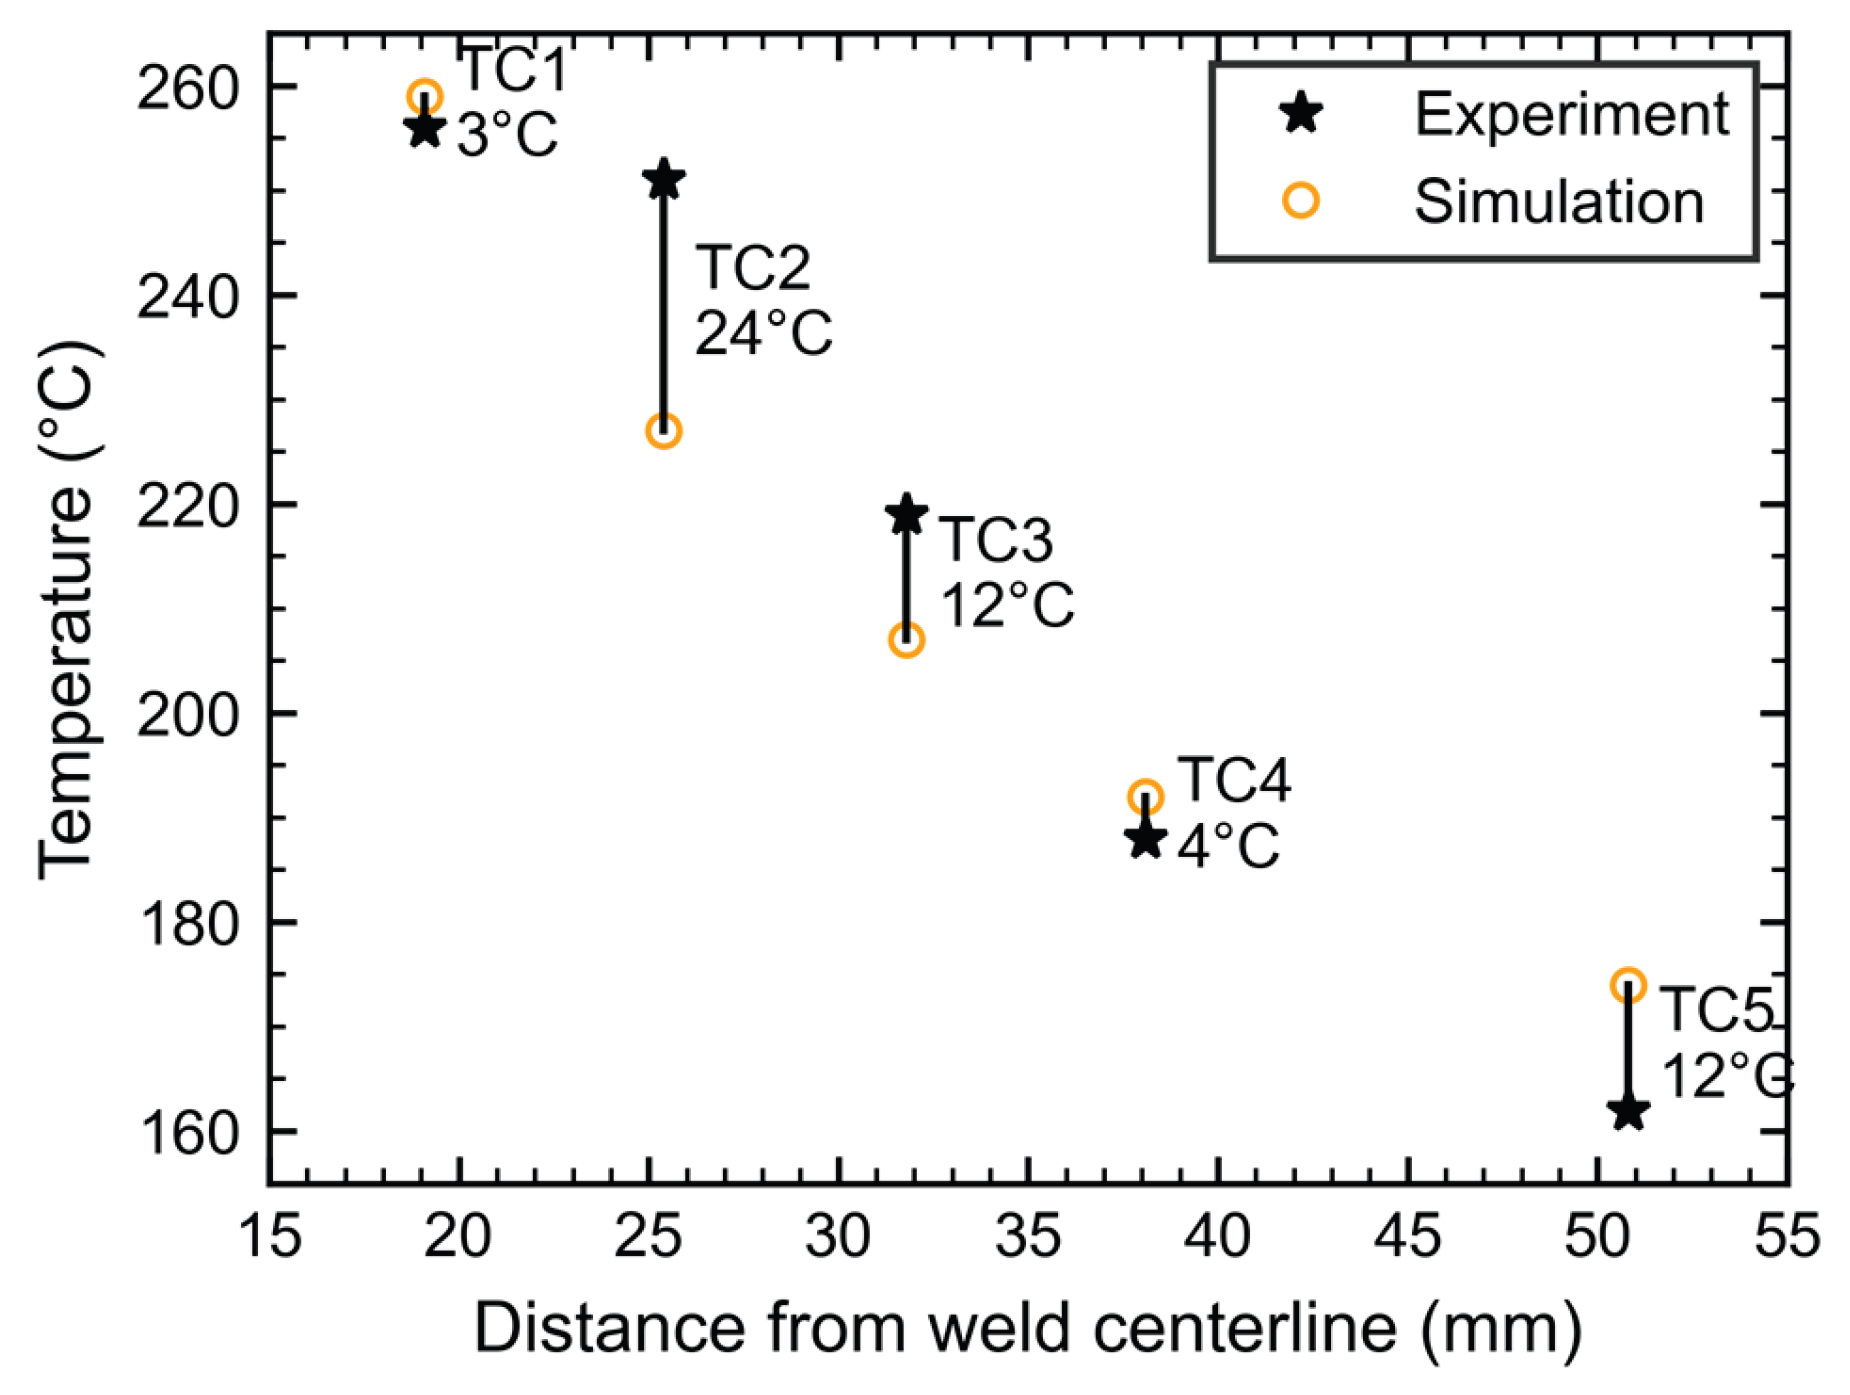
Figure 10.
Matching only workpiece temperatures with the model when hW/T = 40 kW m−2 K−1 and α = 0.08. Hollow circles indicate simulated steady state temperatures, dashed lines show the projected experimental values, and solid lines show the experimental pin and shoulder tool temperatures.
Figure 10.
Matching only workpiece temperatures with the model when hW/T = 40 kW m−2 K−1 and α = 0.08. Hollow circles indicate simulated steady state temperatures, dashed lines show the projected experimental values, and solid lines show the experimental pin and shoulder tool temperatures.
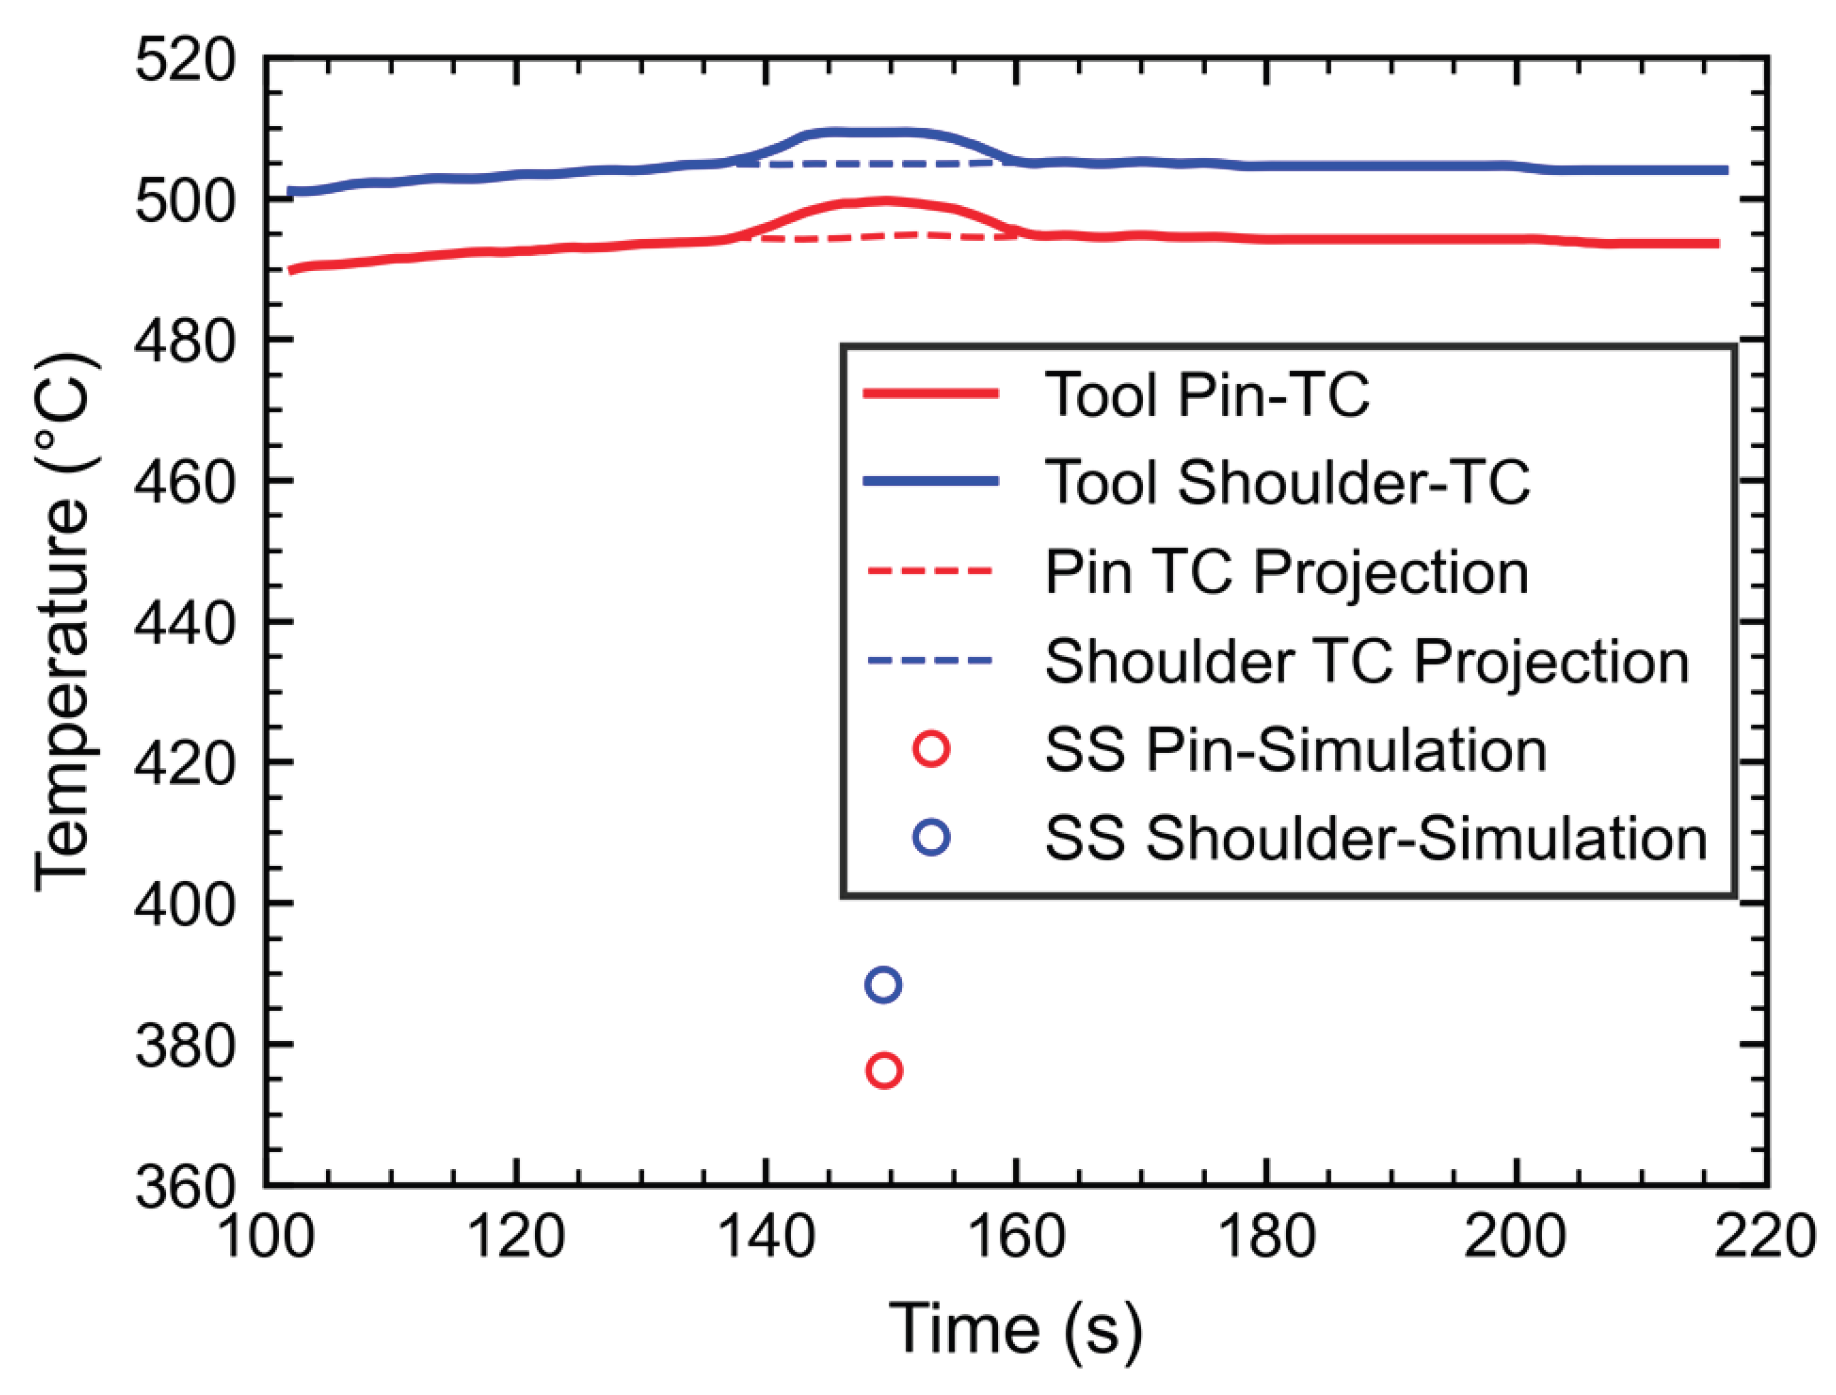
Figure 11.
Effect of friction coefficient, α, on workpiece temperature prediction. a) Maximum experimental temperatures compared with maximum simulated temperatures at the same thermocouple locations for a range of α values. b) Temperature difference between the maximum simulated and experimental temperatures for the same α values and thermocouple locations, where lower values indicate better agreement.
Figure 11.
Effect of friction coefficient, α, on workpiece temperature prediction. a) Maximum experimental temperatures compared with maximum simulated temperatures at the same thermocouple locations for a range of α values. b) Temperature difference between the maximum simulated and experimental temperatures for the same α values and thermocouple locations, where lower values indicate better agreement.
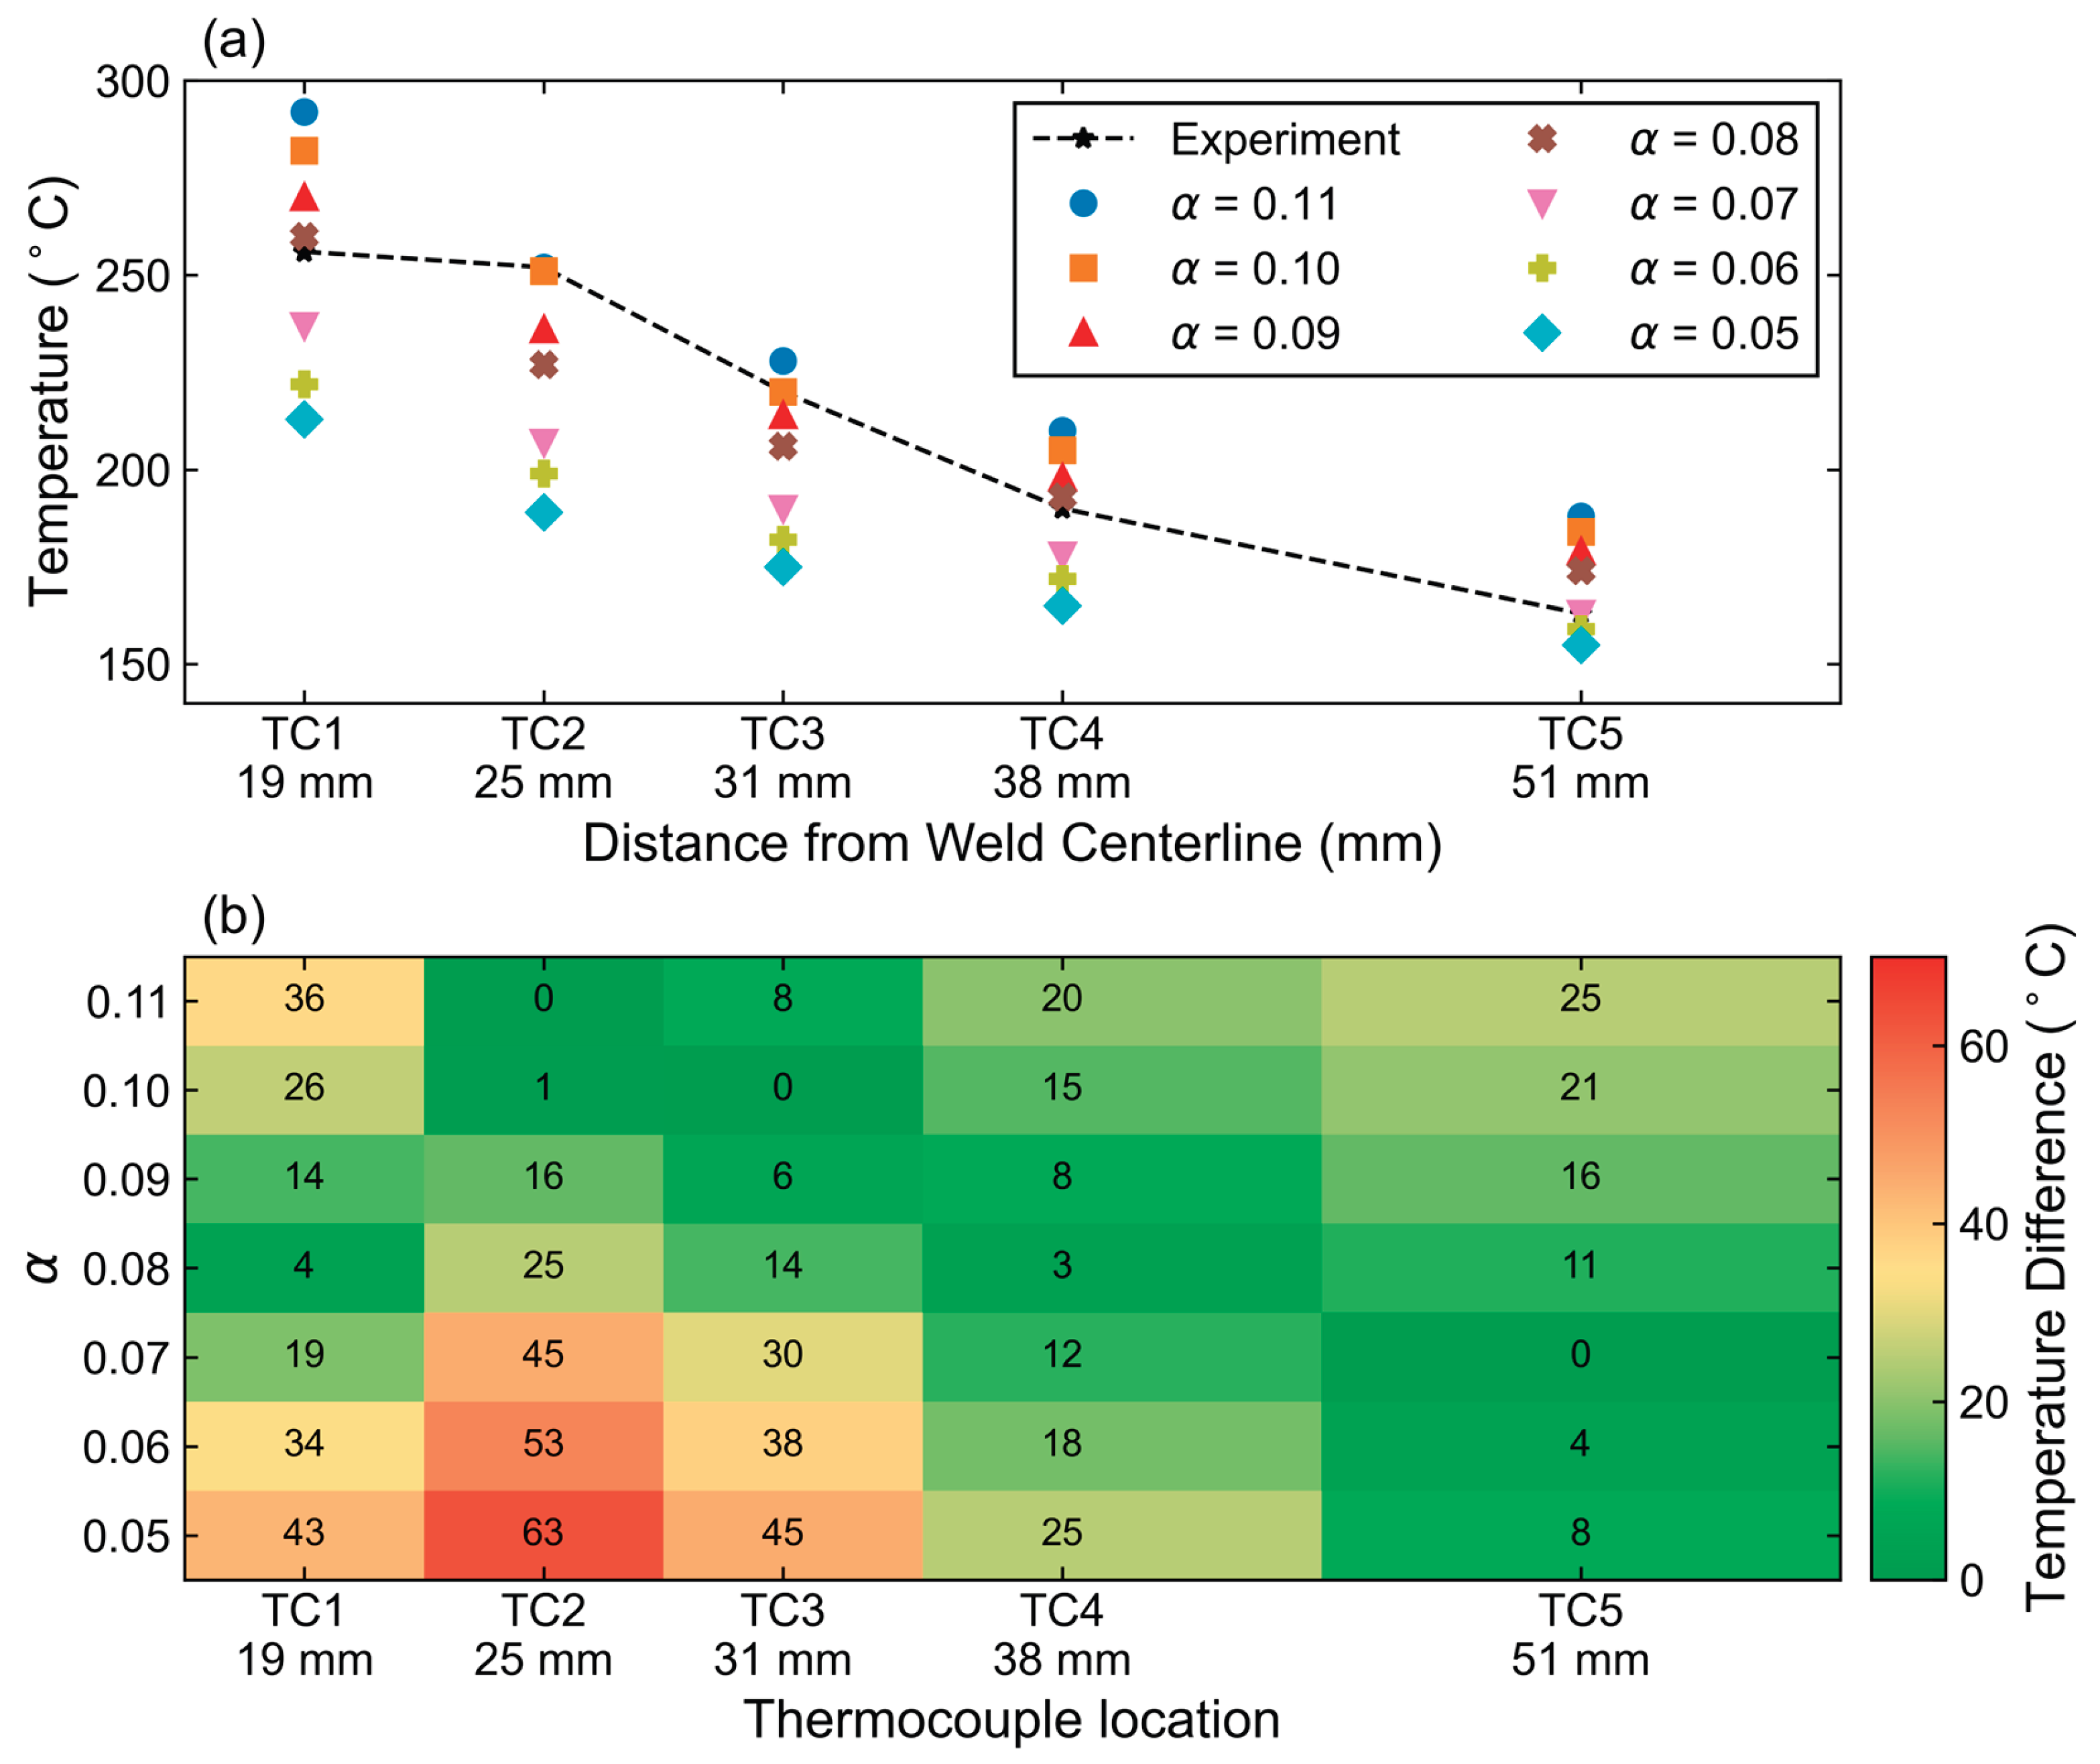
Figure 12.
Workpiece thermocouple temperature response as the tool passes the 3rd thermocouple location for α = 0.08. The solid line shows the experimental thermocouple temperature as a function of tool position, while the points show the simulated maximum temperatures at corresponding positions relative to tool.
Figure 12.
Workpiece thermocouple temperature response as the tool passes the 3rd thermocouple location for α = 0.08. The solid line shows the experimental thermocouple temperature as a function of tool position, while the points show the simulated maximum temperatures at corresponding positions relative to tool.
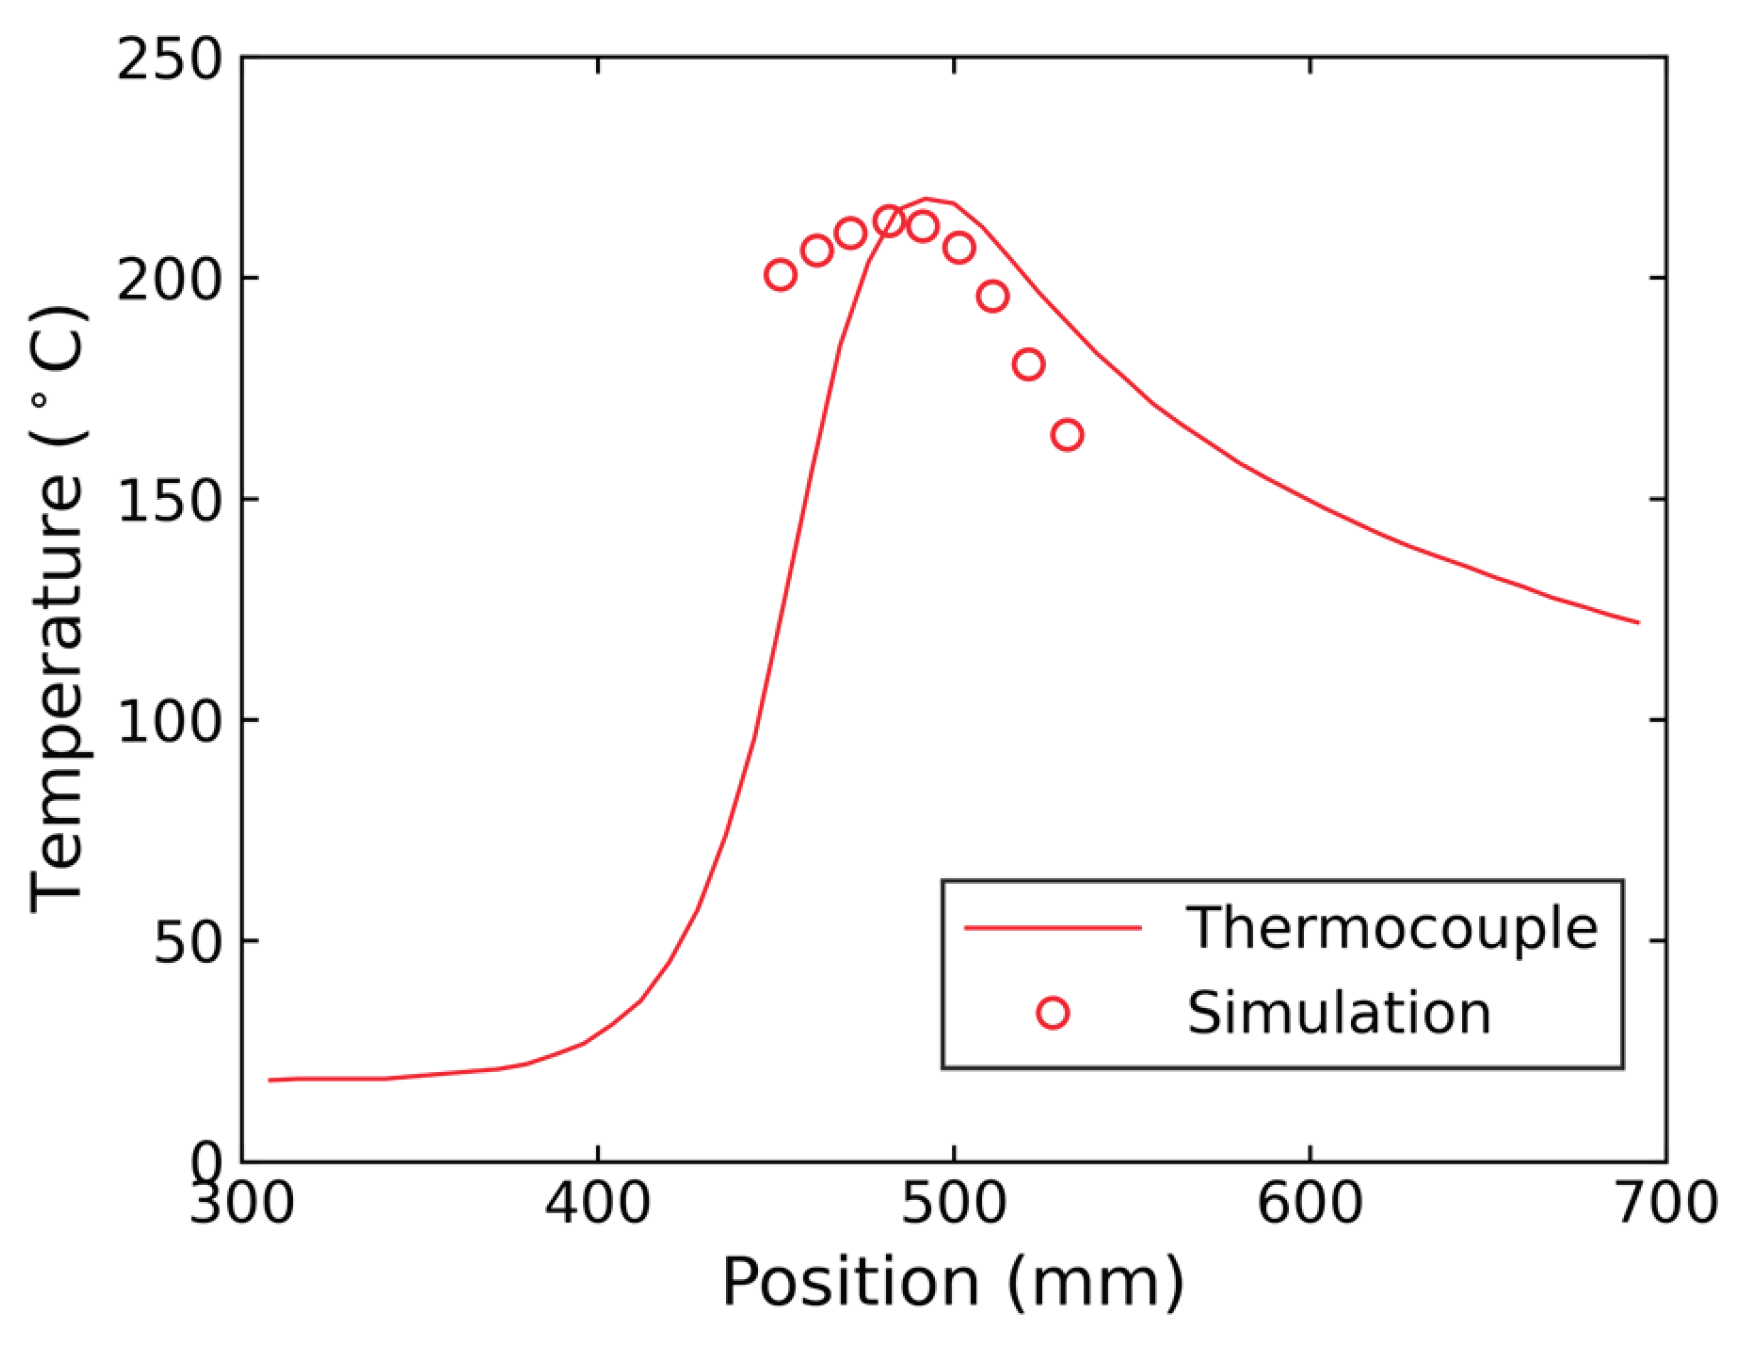
Figure 13.
Effect of the workpiece/tool heat transfer coefficient, hW/T, on workpiece temperature prediction with α = 0.08. a) Maximum experimental temperatures compared with maximum simulated temperatures at each thermocouple location for different hW/T values b) Temperature difference between the simulated and experimental maximum temperatures for each hW/T value and thermocouple location.
Figure 13.
Effect of the workpiece/tool heat transfer coefficient, hW/T, on workpiece temperature prediction with α = 0.08. a) Maximum experimental temperatures compared with maximum simulated temperatures at each thermocouple location for different hW/T values b) Temperature difference between the simulated and experimental maximum temperatures for each hW/T value and thermocouple location.
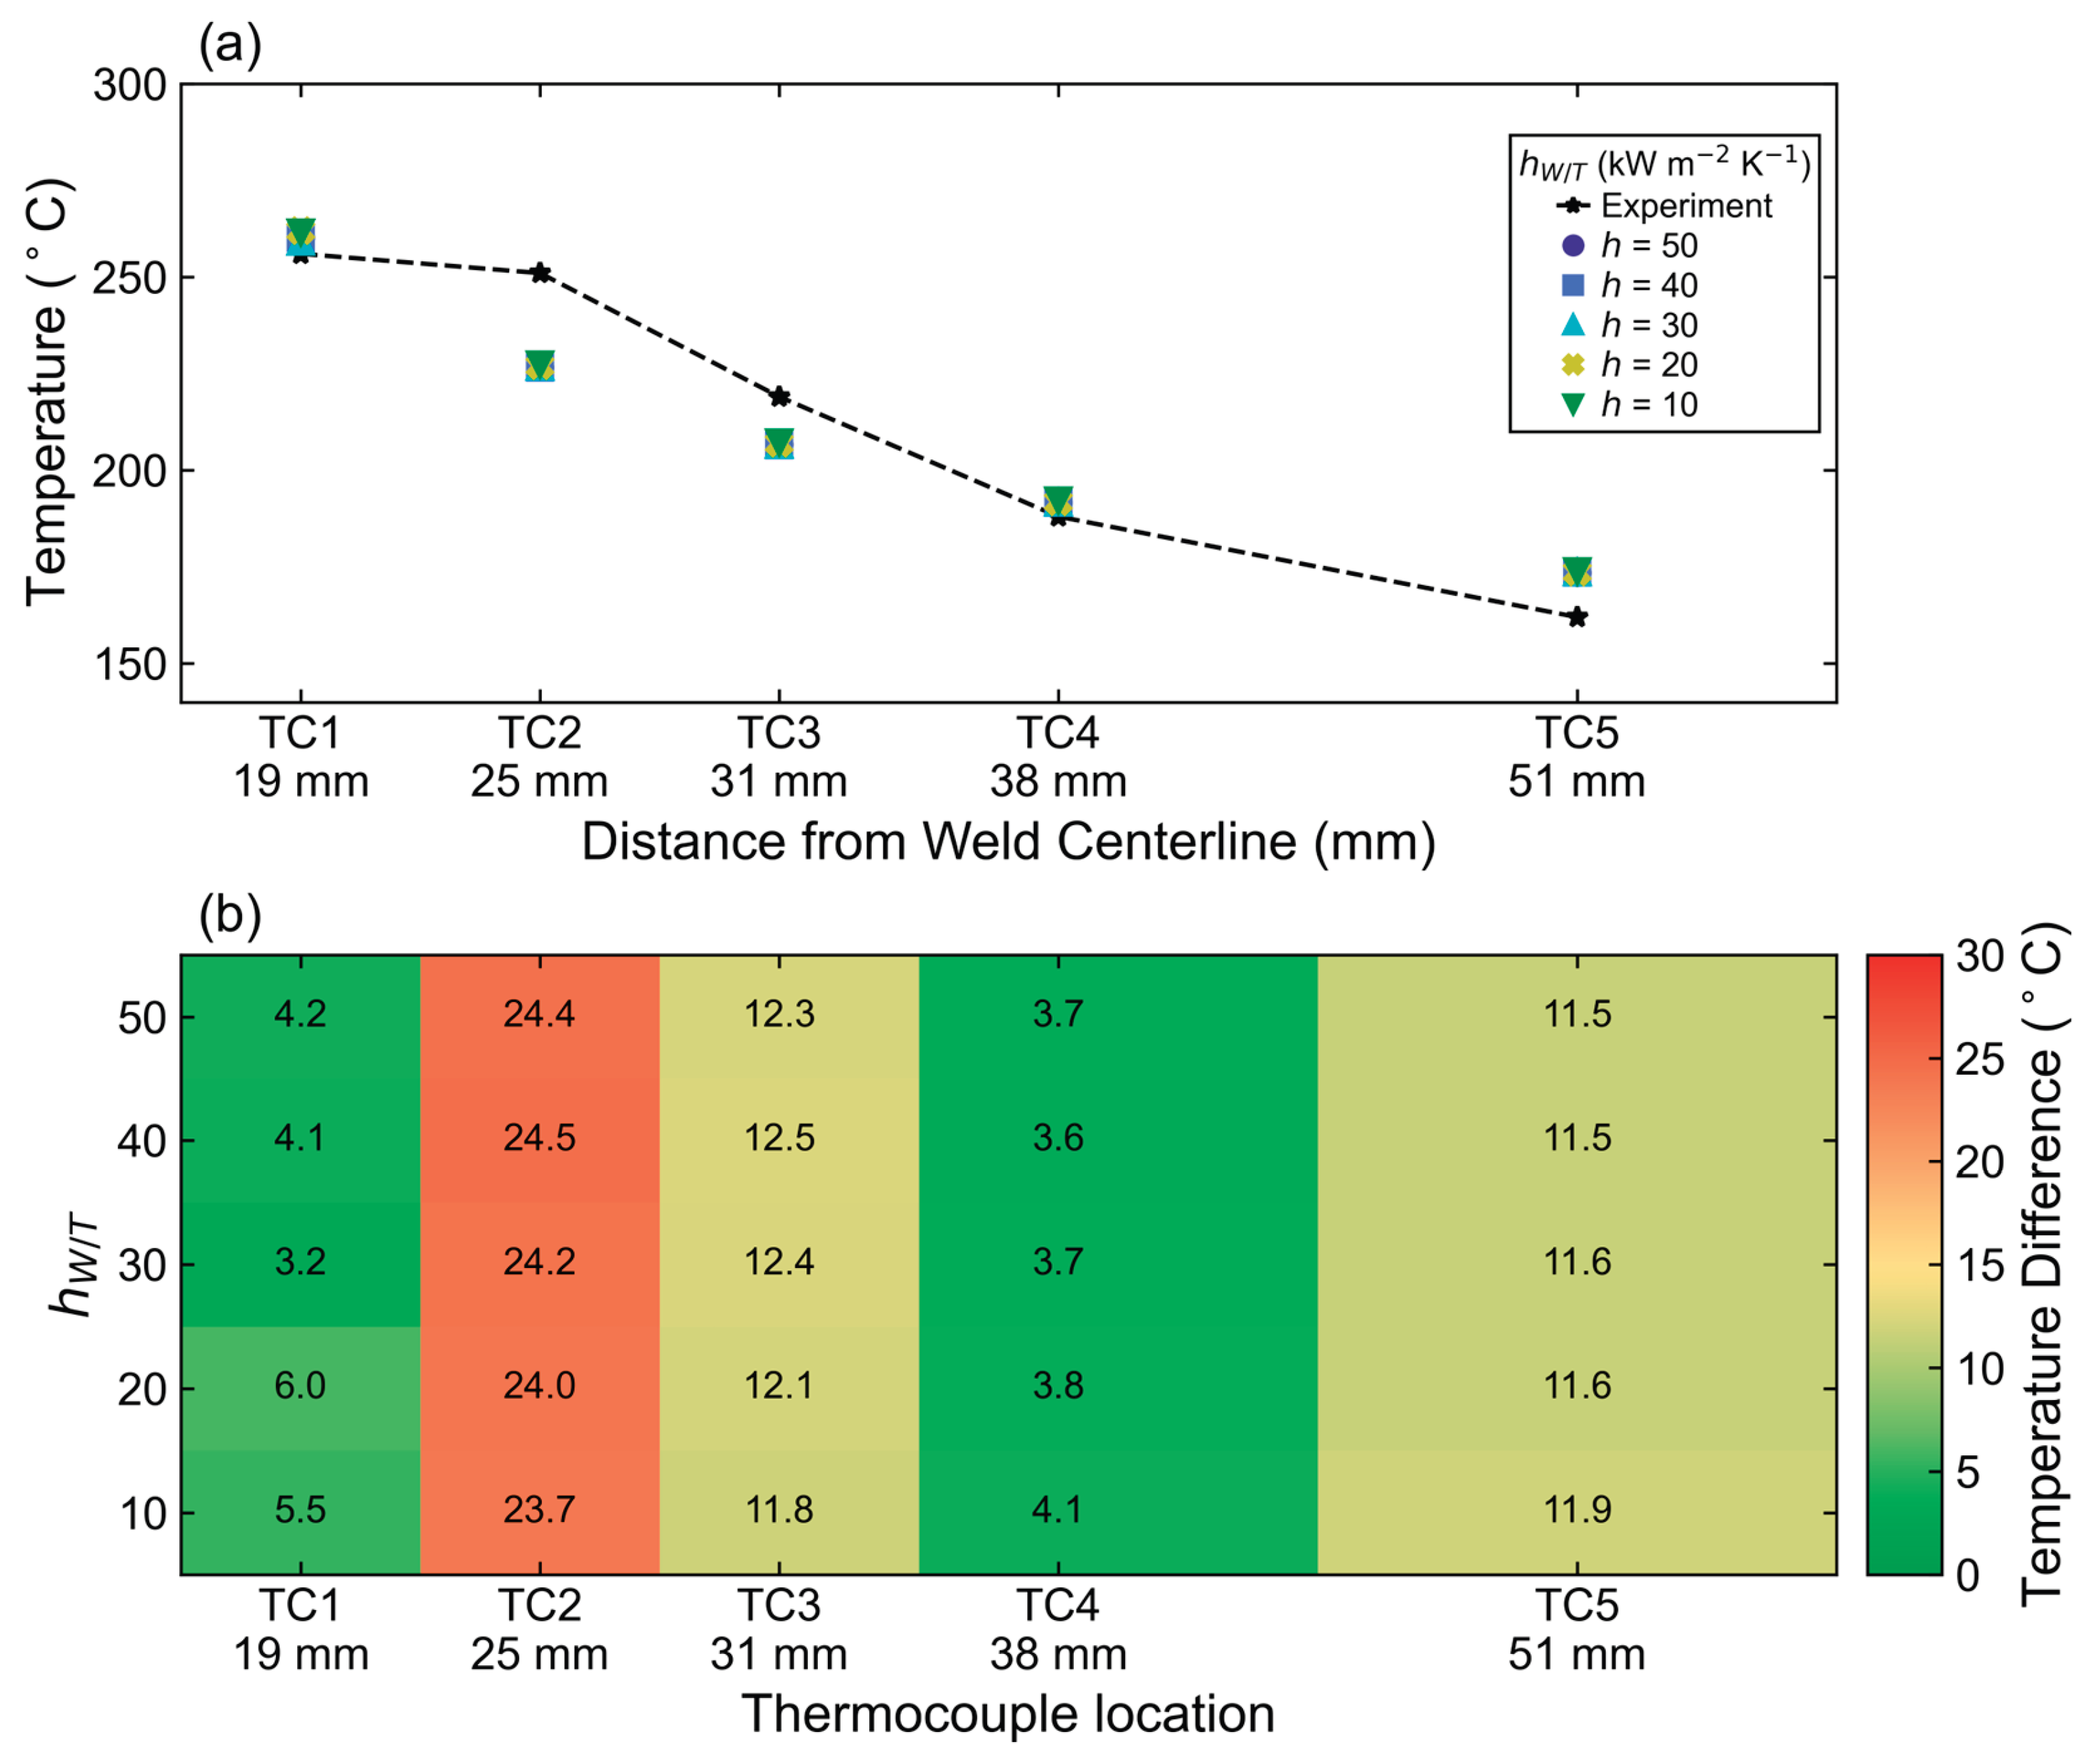
Figure 14.
Tool temperature sensitivity to α and hW/T in pin and shoulder. a) Tool temperature sensitivity to α at the thermocouple locations in the tool for a constant hW/T = 40 kW m-2 K-1. b) Tool temperature sensitivity to hW/T at the thermocouple locations in the tool for a constant α = 0.08.
Figure 14.
Tool temperature sensitivity to α and hW/T in pin and shoulder. a) Tool temperature sensitivity to α at the thermocouple locations in the tool for a constant hW/T = 40 kW m-2 K-1. b) Tool temperature sensitivity to hW/T at the thermocouple locations in the tool for a constant α = 0.08.
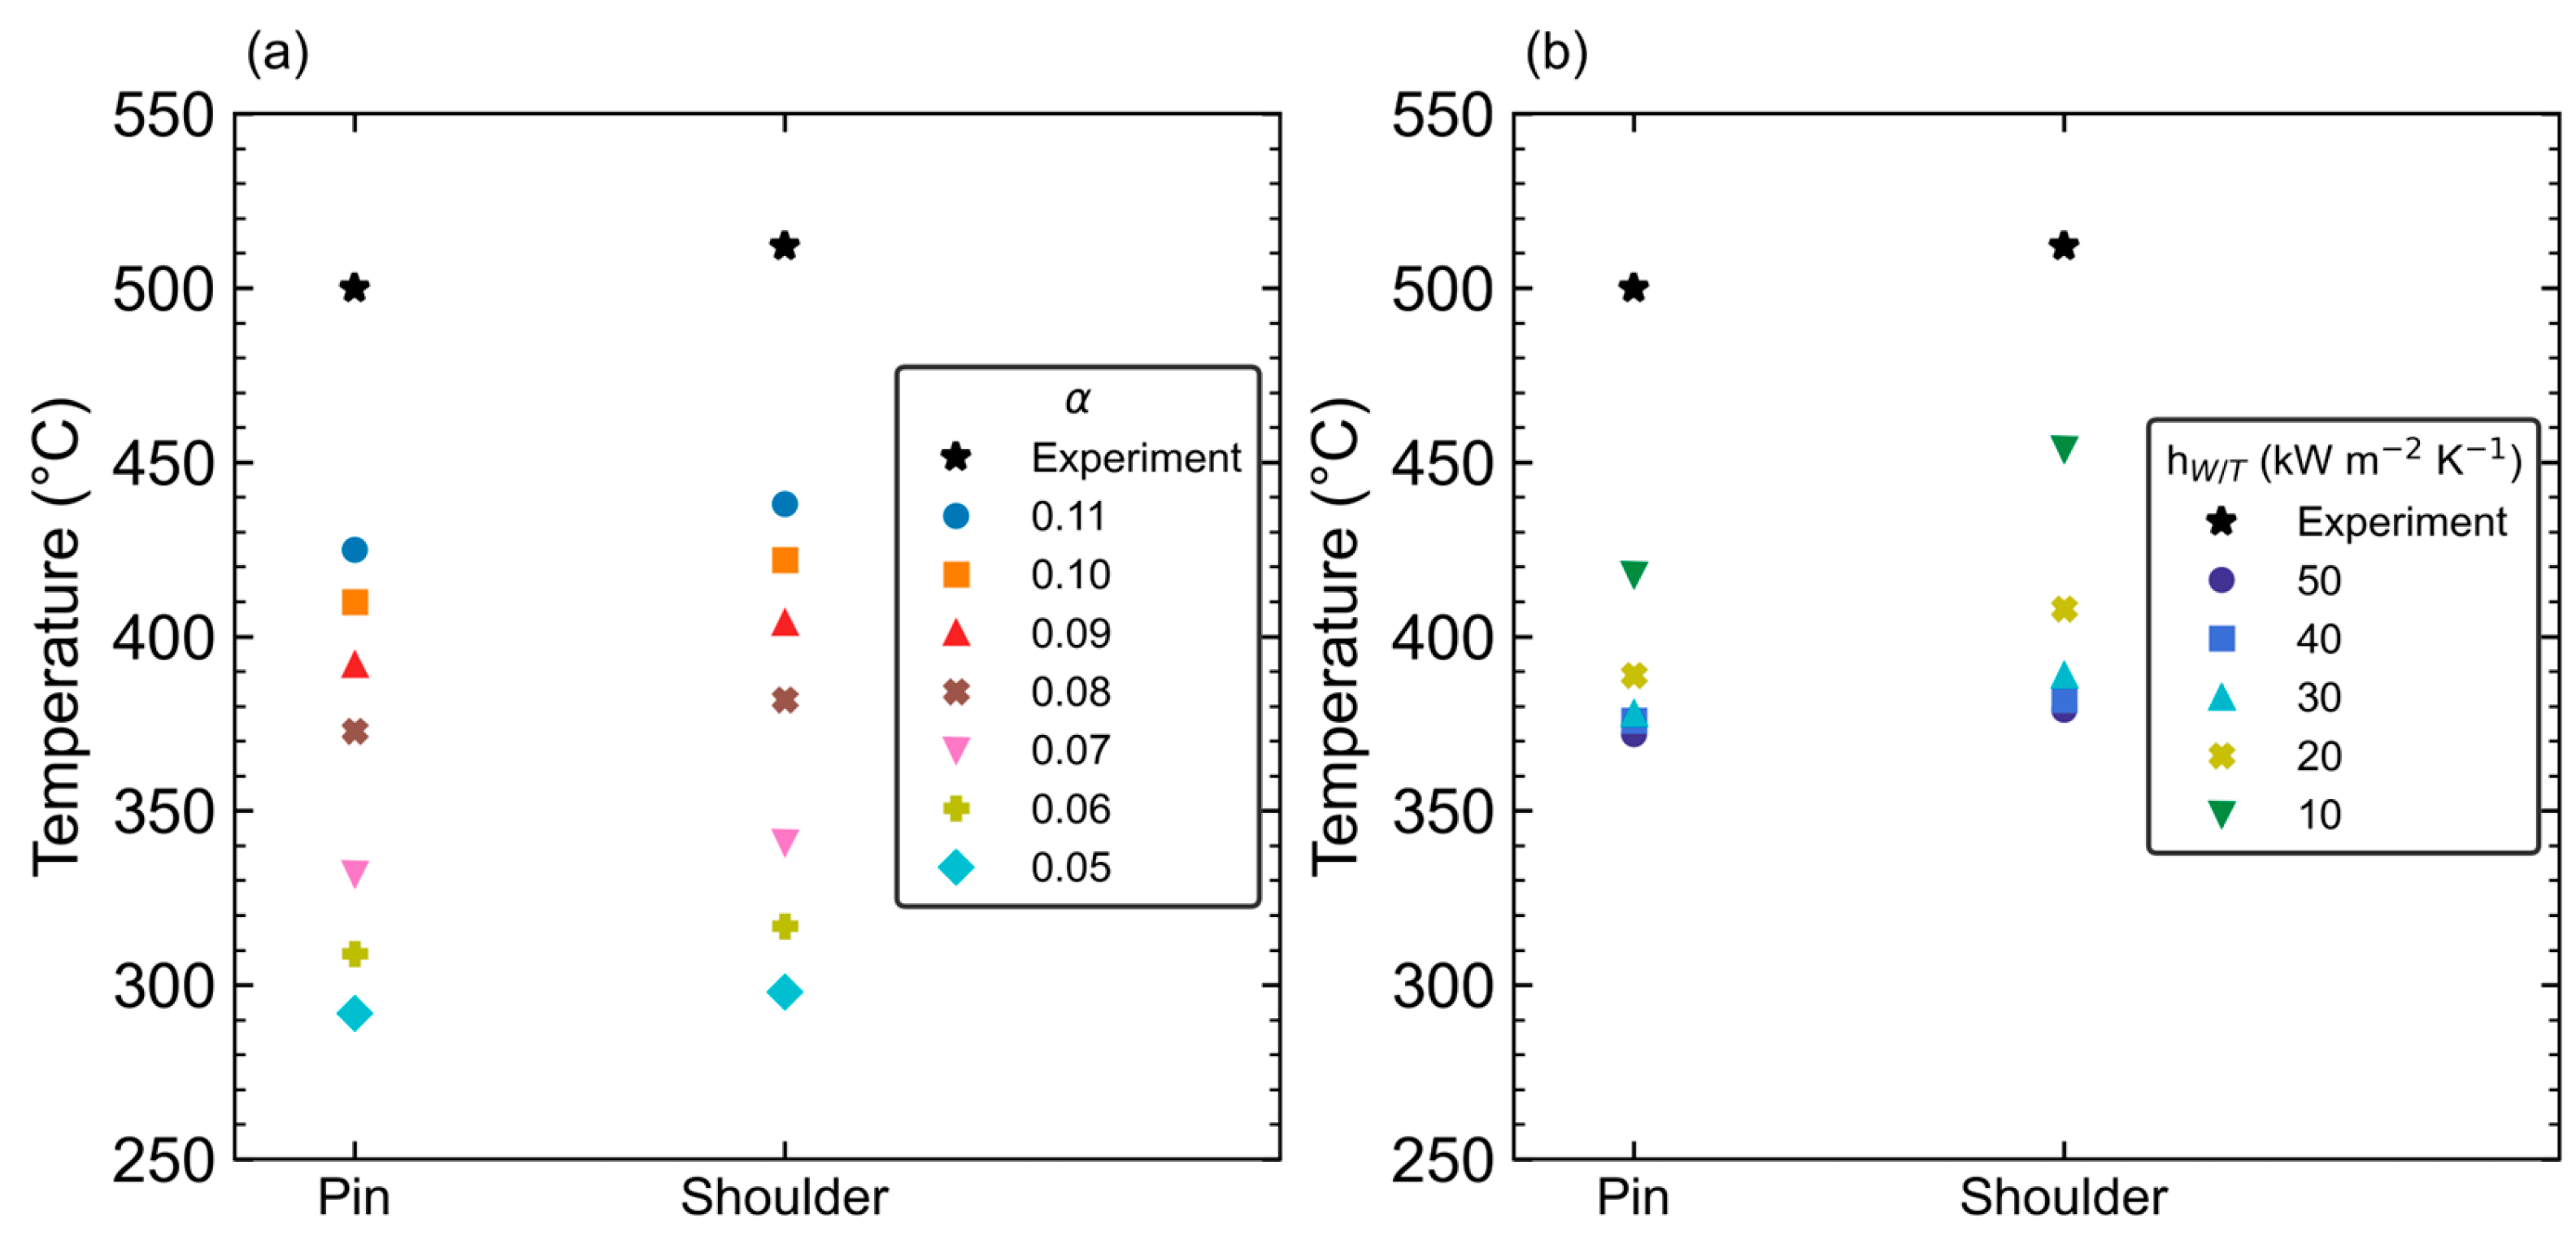
Figure 15.
Steady state workpiece temperature matching for different α and hW/T sets tuned using workpiece temperatures only, tool temperatures only, and both tool and workpiece temperatures simultaneously. Experimental temperatures are also shown for reference.
Figure 15.
Steady state workpiece temperature matching for different α and hW/T sets tuned using workpiece temperatures only, tool temperatures only, and both tool and workpiece temperatures simultaneously. Experimental temperatures are also shown for reference.
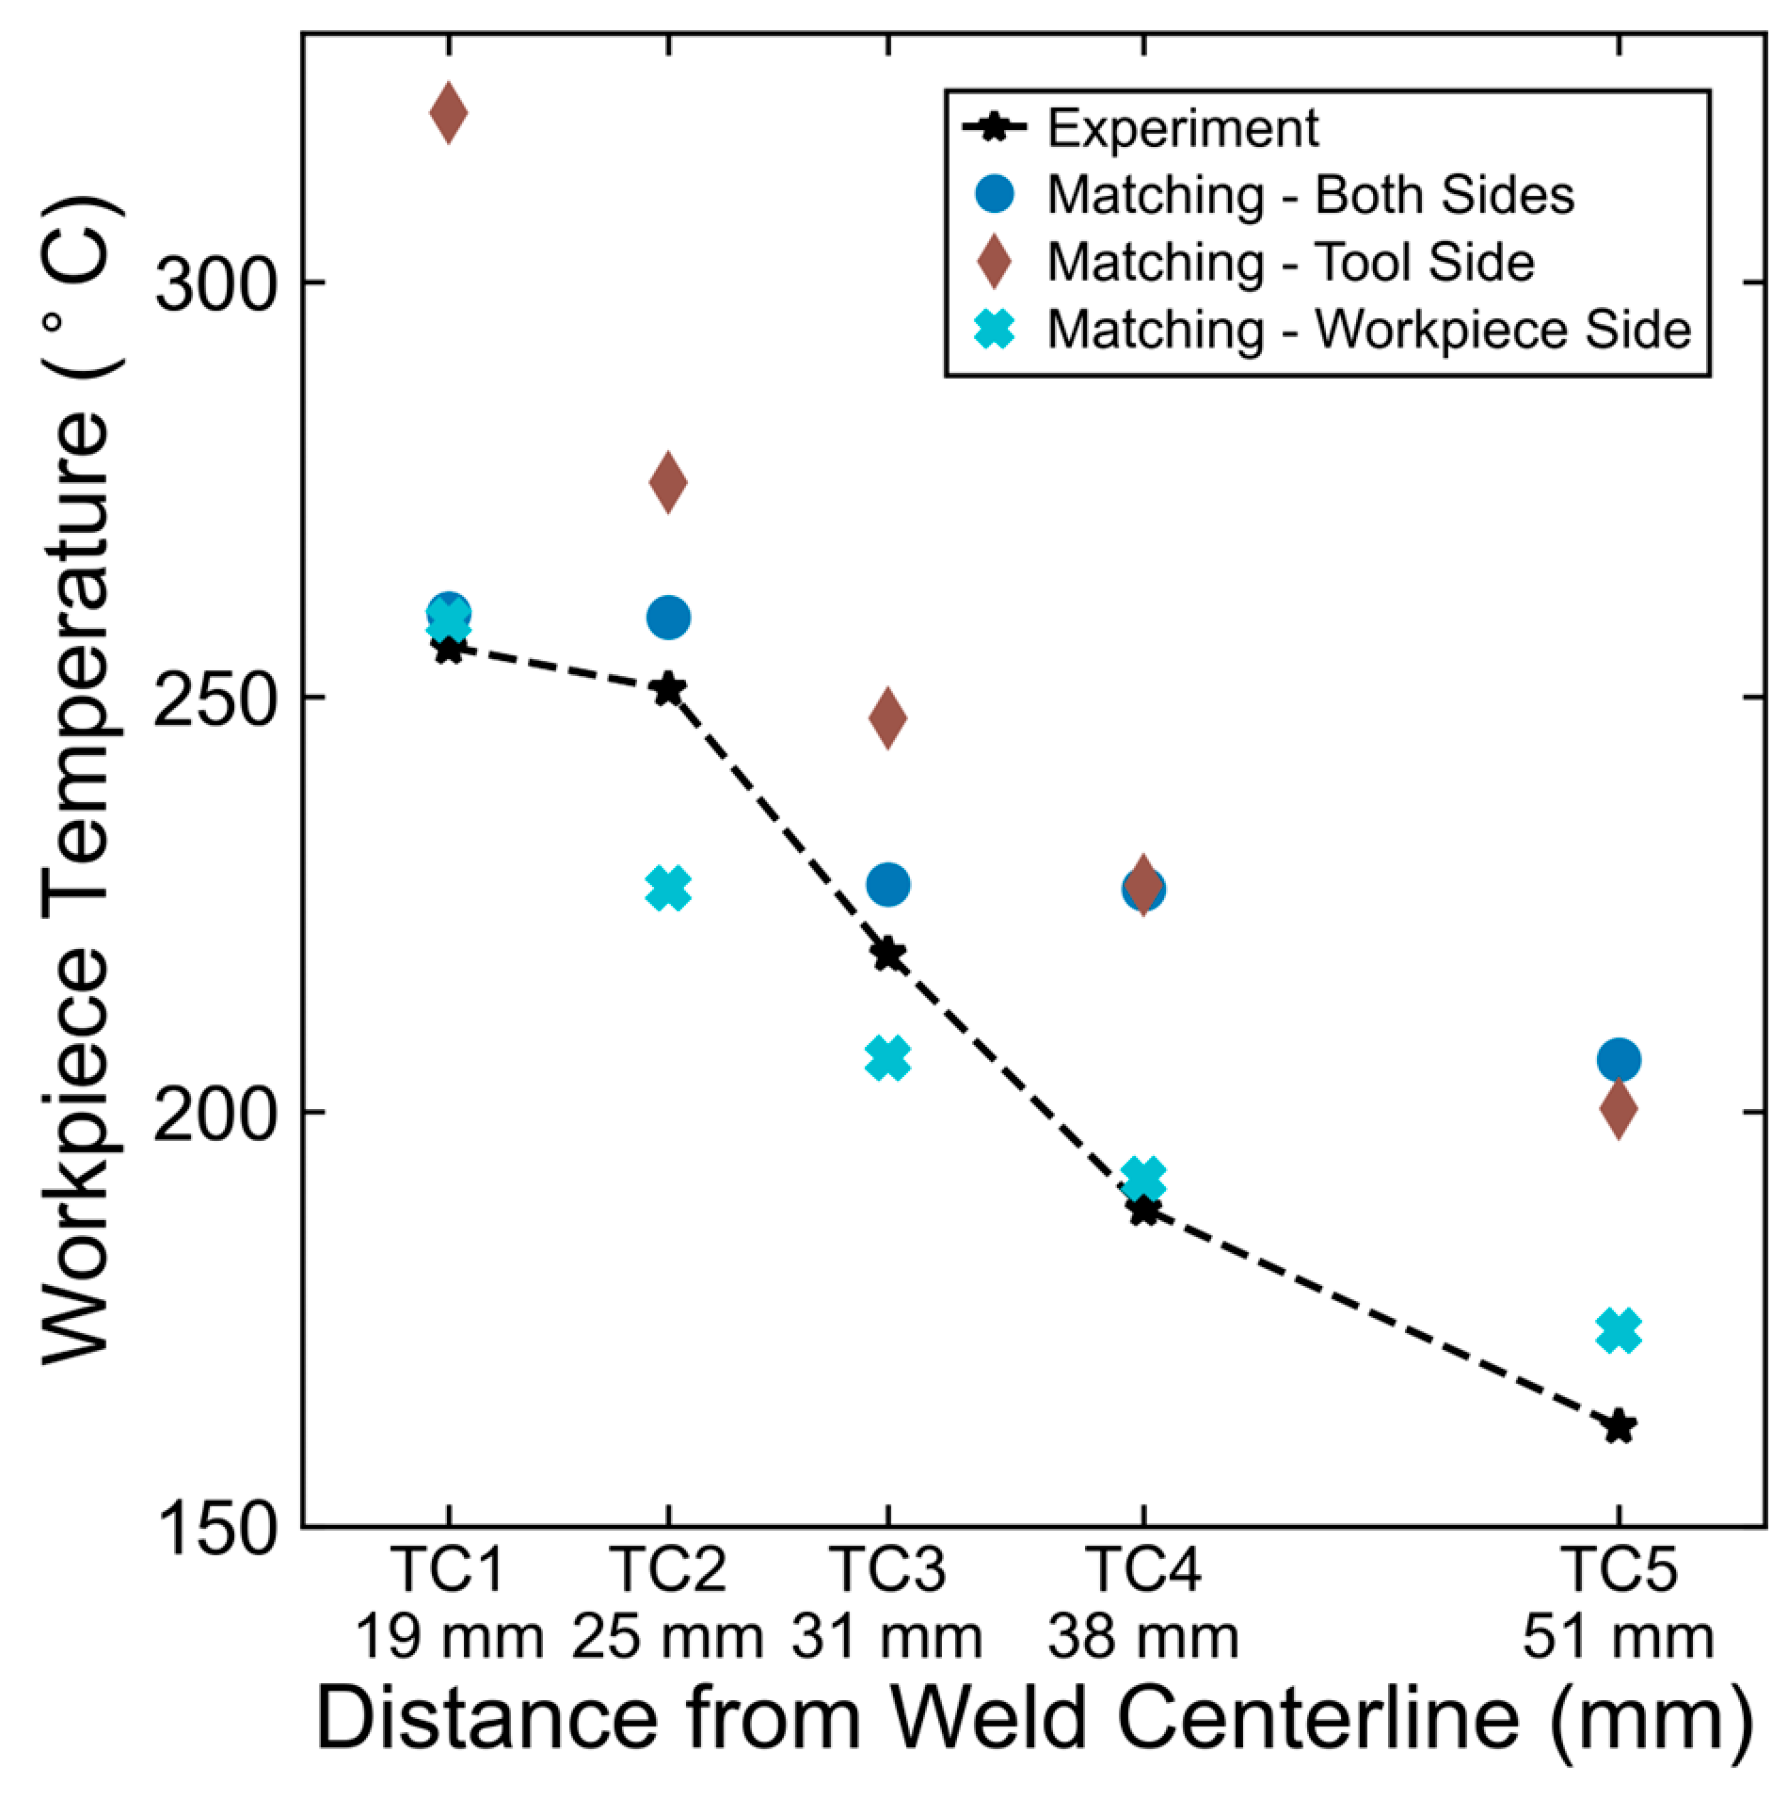
Figure 16.
Steady state tool temperature matching for different α and hW/T sets tuned using workpiece temperatures only, tool temperatures only, and both tool and workpiece temperatures simultaneously. The experimental tool temperature history is shown for reference.
Figure 16.
Steady state tool temperature matching for different α and hW/T sets tuned using workpiece temperatures only, tool temperatures only, and both tool and workpiece temperatures simultaneously. The experimental tool temperature history is shown for reference.
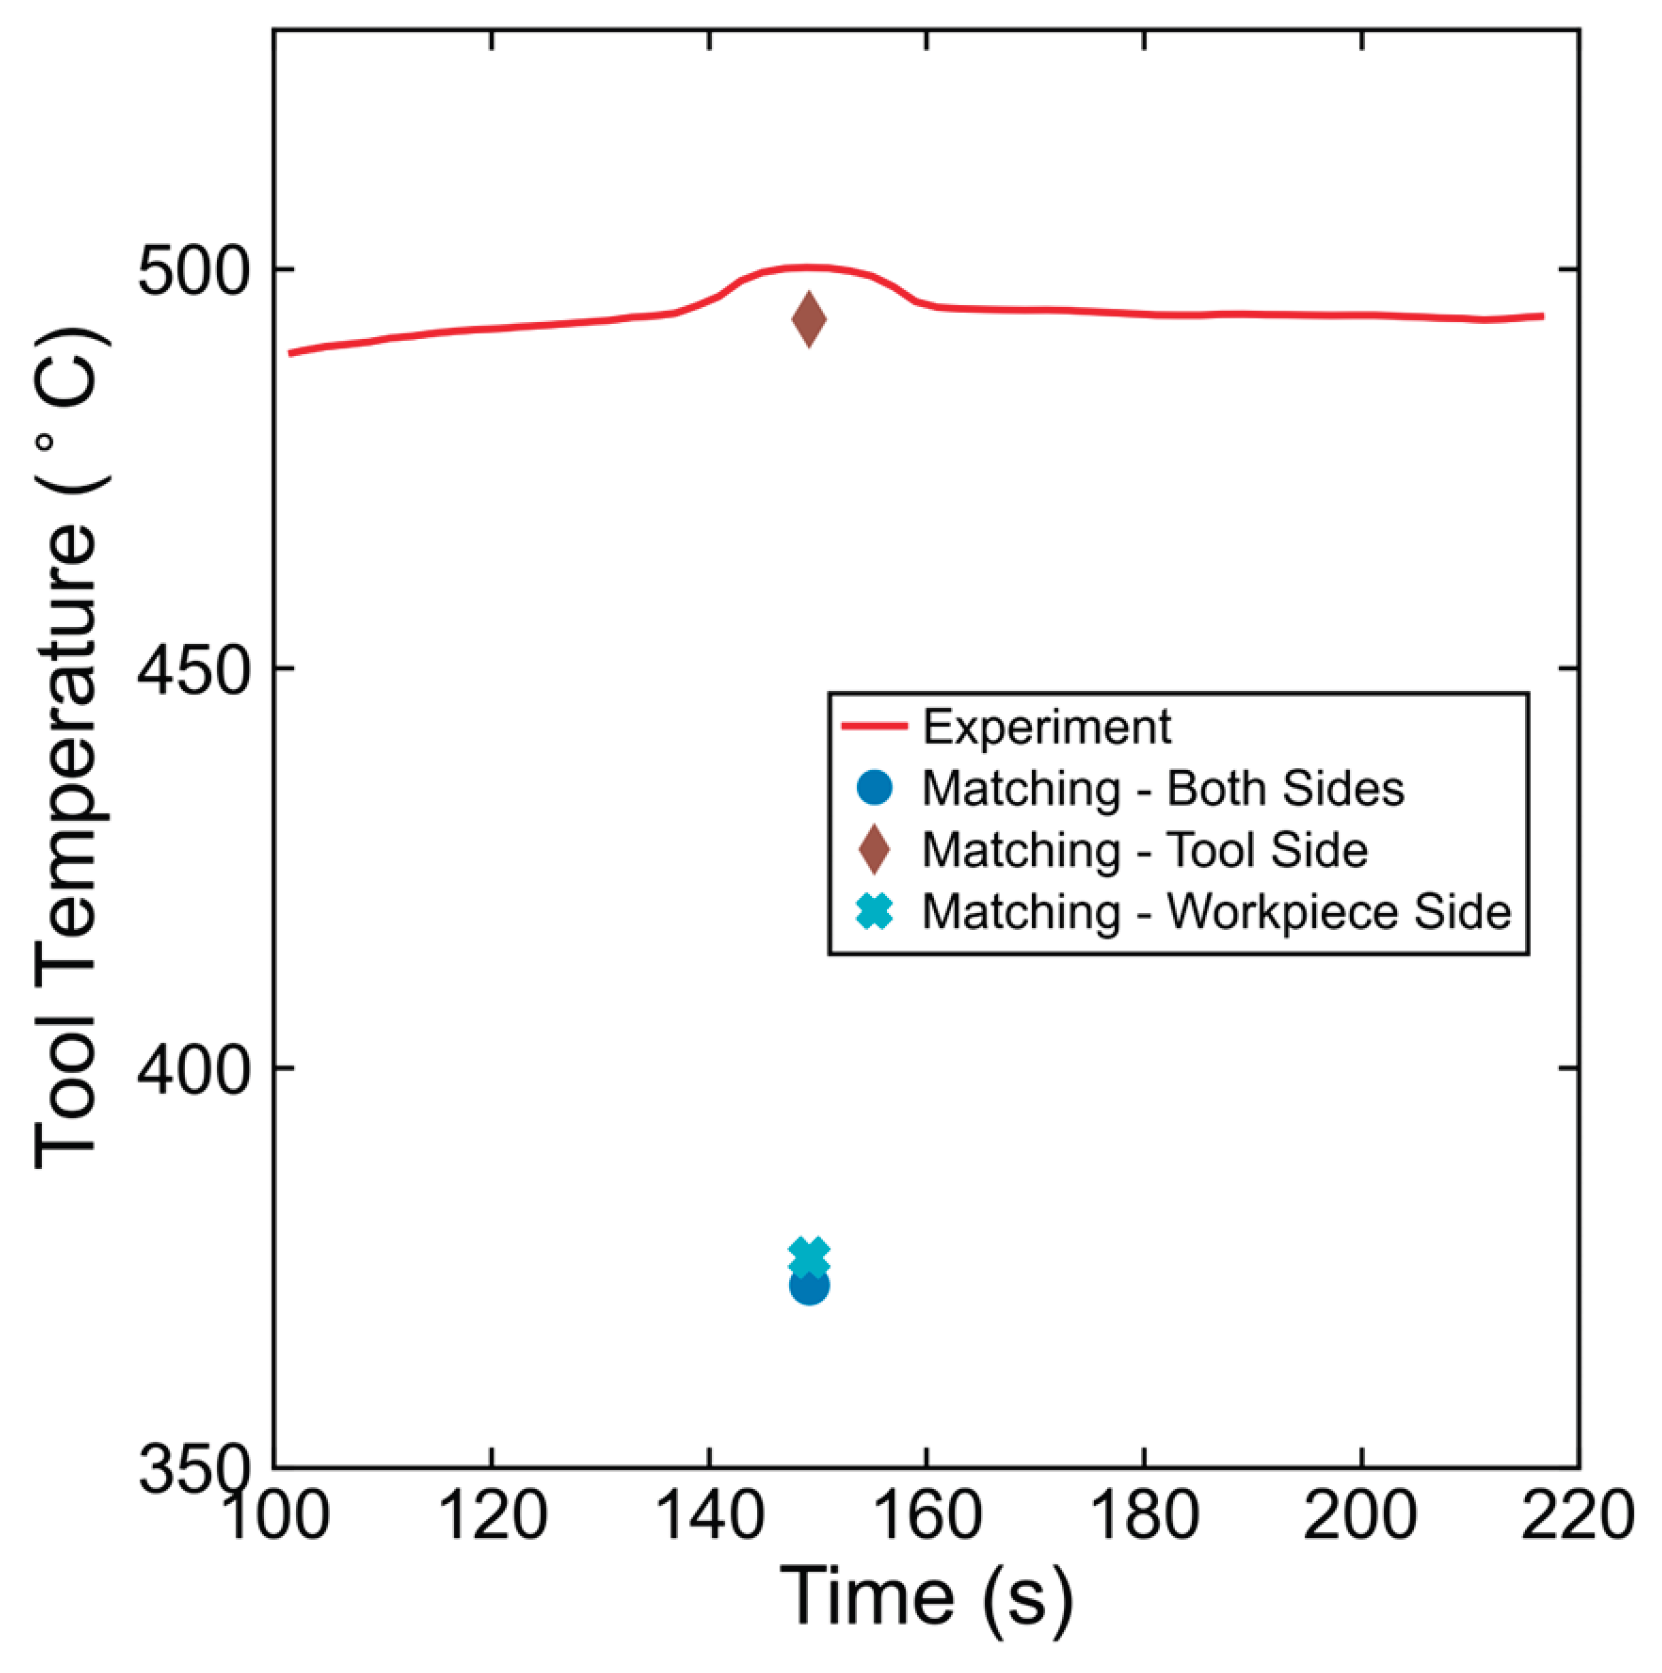

Table 1.
Mechanical, physical, and thermal properties used for each part in the steady state simulation. Values for the workpiece properties are for a temperature of 480 ˚C.
Table 1.
Mechanical, physical, and thermal properties used for each part in the steady state simulation. Values for the workpiece properties are for a temperature of 480 ˚C.
| Young’s Modulus | Poisson’s | Density | Specific Heat | Thermal Conductivity | |
| Part | (GPa) | Ratio | (kg m-3) | (J kg-1 K-1) | (W m-1 K-1) |
| Workpiece | 52 | 0.36 | 2709 | 1278 | 221 |
| Tool | 200 | 0.3 | 7850 | 460 | 24.3 |
| Backing Plate | 200 | 0.3 | 7850 | 460 | 35.3 |
Table 2.
Boundry conditions used to set the model.
| Parameter | Description | Value / Range | Reference / Notes |
| hW/T | Heat transfer coefficient (workpiece/tool) | 10, 20, 30, 40, 50 kW m-2 K-1 |
40 kW m-2 K-1 used for temperature matching |
| hT/A | Heat transfer coefficient (tool/air) | 10 W m-2 K-1 | [35] |
| hW/A | Heat transfer coefficient (workpiece/air) | 10 W m-2 K-1 | [35] |
| hW/B | Heat transfer coefficient (workpiece/baseplate) | 500 W m-2 K-1 | [21] |
| hT/holder | Heat transfer coefficient (tool/holder) | Adiabatic | [21] |
| α = s curve | Viscoplastic friction coefficient (Norton’s law) | Defined according to Norton’s viscoplastic law | Equation (2) |
| T∞ | Ambient temperature | 28 °C | - |
| Baseplate & holder | Constant temperature boundary condition | 20 °C | - |
| Mesh density | Tool and workpiece meshing | Tool: 116,339 elements; Workpiece: 49,547 elements |
- |
Disclaimer/Publisher’s Note: The statements, opinions and data contained in all publications are solely those of the individual author(s) and contributor(s) and not of MDPI and/or the editor(s). MDPI and/or the editor(s) disclaim responsibility for any injury to people or property resulting from any ideas, methods, instructions or products referred to in the content. |
© 2026 by the authors. Licensee MDPI, Basel, Switzerland. This article is an open access article distributed under the terms and conditions of the Creative Commons Attribution (CC BY) license (http://creativecommons.org/licenses/by/4.0/).
Copyright: This open access article is published under a Creative Commons CC BY 4.0 license, which permit the free download, distribution, and reuse, provided that the author and preprint are cited in any reuse.


