

Submitted:
29 July 2026
Posted:
31 July 2026
You are already at the latest version
Abstract
Inappropriate concentrations of elements in formulae for infants may lead to adverse health effects. Selenium (Se) is a trace element essential for the proper development of infants. It is naturally present in human milk and is also added to infant formulae. However, both insufficient and excessive Se intake may be harmful. The aim of this study was to determine the Se concentrations and chemical forms in all formulae for infants available on the Polish market and to assess their nutritional safety. Se concentrations were determined using inductively coupled plasma mass spectrometry (ICP‑iCRC‑MS). Se speciation was performed using a HPLC system coupled to ICP‑iCRC‑MS. The Se concentrations in most analyzed formulae were in good agreement with the recommended EU limits (median 4.5 µg/100 kcal, range 0 – 15.6 µg/100 kcal). However, the estimated daily intake for 6‑month‑old infants exceeded the tolerable upper intake level in six formulae, indicating a potential health risk. Speciation analysis showed that the dominant Se forms were sodium selenite and sodium selenate, and their levels were mostly consistent with the manufacturers’ declarations. Additionally, trace amounts of selenometionine (SeMet) and methyloselenocysteine (MeSeCys) were detected. Therefore, regular monitoring of the composition of infant formulae remains necessary. The detection of SeMet and MeSeCys provides new avenues for research on Se content and Se speciation in formulae intended for infants.
Keywords:
infant nutrition
; infant formula
; follow-up formula
; Se forms
; toxic
; selenomethionine
; methylselenocysteine
1. Introduction
Infant nutrition during the first year of life plays a fundamental role in ensuring proper growth and development. According to leading international authorities, such as the European Society for Pediatric Gastroenterology, Hepatology and Nutrition (ESPGHAN), European Food Safety Authority (EFSA), the American Society for Par-enteral and Enteral Nutrition (ASPEN), and the Food and Drug Administration (FDA), breastfeeding is considered the gold standard for infant nutrition in the first months of life [1,2]. Nevertheless, formula feeding continues to account for a substantial proportion of infant nutrition worldwide. According to World Health Organization (WHO) report from 2025, only 47% of infants under 6 months of age are exclusively breastfed [3]. Therefore, public health initiatives promoting breastfeeding should continue to be strengthened. At the same time, when formula feeding is necessary, efforts should be made to ensure that infant formulae resemble human milk as closely as possible [4].
The composition of infant formula is strictly regulated. In the European Union, nutrient requirements and permitted chemical forms are defined by EU legislation [5,6]. In the United States, the composition of infant formula is regulated exclusively by the FDA [7]. Recent developments in the field include the introduction of probiotics and human milk oligosaccharides (HMOs) into formulae, as well as the increasing availability of specialized products, such as formulae for premature infants or those with lactose intolerance [8]. Although this broadens the range of available options, it also poses challenges for quality control. In Poland, approximately 150 formulae intended for infants up to 12 months of age are currently available [9]. These include infant formulae intended for infants aged 0–6 months, follow-on formulae for infants aged 6–12 months, and formulae for special medical purposes. The use of formulae for special nutritional purposes is strictly defined by the manufacturer on the label.
From a clinical perspective, monitoring the content of nutrients in formula for infants and their potential impact on infant health and development is essential. Trace elements are of particular interest, as they are required in very small amounts yet play key physiological roles [10]. Importantly, not only the total amount of elements but also their chemical form and oxidation state influence their biological function. One of the most illustrative examples is selenium (Se) [11].
According to European Union and FDA regulations, only two inorganic forms of Se are permitted in infant formulae: sodium selenite and sodium selenate. Regardless of formula type, the Se content should range from 3.0 to 8.6 µg/100 kcal [5,6].
It is worth emphasizing that both insufficient and excessive Se intake may be harmful. Se is essential for the proper functioning of the immune [12], endocrine [13], and reproductive systems [14]. Its immunoregulatory functions include modulation of cytokine production and maintenance of redox homeostasis by limiting oxidative stress [15,16]. This element is also required for thyroid hormone metabolism, particularly for the conversion of thyroxine (T4) to triiodothyronine (T3) [17]. Excessive Se intake may lead to diarrhea, vomiting, and irritability [18]. Chronic excessive intake leads to selenosis, typically associated with organic selenium forms, manifests as hair and nail abnormalities, halitosis, muscle pain, memory impairment, mood disturbances, and severe paresthesia [19,20,21]. According to the available literature, both Se deficiency and toxicity in infants are rare, although potentially dangerous [22].
Therefore, the aim of this study was to determine the concentration and chemical forms of Se in infant formulae and assess their safety.
2. Materials and methods
2.1. Materials
A total of 148 powdered milk formulae available on the Polish market between 2019 and 2023, intended for consumption during the first year of life, were subjected to analysis. The sample encompassed 37 infant formulae, 33 follow-on formulae, and 78 formulae for special medical purposes. The detailed types of special medical purpose formulae analysed are presented in Figure 1.
All formulae were coded and stored under conditions consistent with the manufacturer’s specifications. Validation of the analytical procedures was performed using certified reference material - skimmed milk powder ERM-BD150 (European Reference Materials, Belgium). Depending on the type of formula, one to three parallel samples (from independent commercial containers) were analysed: four formulae were tested in duplicate, twenty in triplicate, and the remaining in a single replicate. The number of repetitions was determined by both the availability of the products and the financial constraints of the study.
2.2. Methods
2.2.1. Total Se Concentrations
For total Se determination, 0.25g of milk samples were mineralized in 5 mL of 65% nitric acid (Merck, Germany) in closed PTFE containers in the Mars 6 Microwave Digestion System (CEM, USA). The program included 20 min of heating to 180°C (ramp), 20 min of holding the temperature and 30 min of cooling. Afterward, samples were poured over to the polypropylene Falcon tubes and filled up to final volume (15 mL) with ultra-pure water with a resistivity ≥18 MΩ cm (Milli-Q system, Merck Millipore, Germany). A commercial Se standard (Romil, UK) was used for calibration of total Se determination. High-purity argon and hydrogen gases (N–5.0, purity 99.999%) were supplied by Linde (Poland) and used throughout the ICP MS analysis.
Total Se concentrations were measured using inductively coupled plasma mass spectrometry with Integrated Collision Reaction Cell ICP(iCRC)MS Plasma Quant MS Q (Analytik Jena, Germany). Interfering polyatomic ions were reduced with the use of iCRC with hydrogen as reaction gass before they reach the mass analyzer. Signal was measured in 5 replicates of 20 scans. Detection limits (DLs) were calculated using 3–sigma criteria.
2.2.2. Selenium Speciation Analysis
For the Se species determination, 0.50 g of milk sample and 0.020 g of protease (Streptomyces griseus type XIV, Sigma Aldrich, USA) were weighed into a test tube, followed by the addition of 7 mL of water. The extraction was performed in an ultrasonic bath for 30 minutes at ambient temperature. Then, the samples were centrifuged for 10 minutes using the MPW-260R laboratory centrifuge (MPW Med. Instruments, Warszawa, Poland). Supernatants were filtered using a paper filter, washed with 200 mL of ultra-pure water, transferred to 10 mL test tubes, and diluted to a final volume of 10 mL with 5 mM L-1 acetate buffer.
Stock standard solutions (1000 mg Se L⁻¹ in a single solution) of selenite (Se(IV)), selenate (Se(VI)), selenomethionine (Se Met) and selenomethylselenocysteine (Se MetSeCys) were prepared by dissolving appropriate amounts of disodium selenite (Na₂SeO₃), disodium selenate (Na₂SeO₄), seleno L methionine, and (methyl)selenocysteine hydrochloride (Sigma Aldrich, USA). Stock solutions were stored in plastic bottles at 4°C. Less concentrated standard solutions were prepared by diluting the stock solutions and were prepared daily.
The mobile phase for chromatographic separation was prepared by dissolving 5.4 g of CH₃COONH₄ (Sigma Aldrich, USA) and mixing it with 4.6 mL of CH₃COOH (Stanlab, Poland), followed by dilution to 1 L with ultrapure water to obtain mobile phase B (150 mM acetate buffer). This stock solution was further diluted to 5 mM to obtain mobile phase A.
Se speciation analysis was performed using a PQ LC system (Analytik Jena, Germany) coupled to the ICP(iCRC)MS. The HPLC system consisted of an S 1130 HPLC pump (Analytik Jena, Germany), an S 5300 autosampler (Analytik Jena, Germany), and an anion-exchange column PRP-X100 (50 mm × 4.1 mm i.d., 5 μm; Hamilton, Switzerland). Standards and samples were injected using a 100 μL sample loop.
Chromatographic separation was performed with the column temperature set to 20 °C. Separation of Se compounds was achieved using a gradient flow with 5 mM and 150 mM acetate buffer. The flow rate of the mobile phase was maintained at 1.0 and 1.5 ml min-1. The total separation time was about 9.5 minutes. Se species identification was based on retention time and signals at m/z 78, with additional monitoring at m/z 82. Quantification was based on external standard curves.
Certified reference material, skimmed milk powder (BD150, European Reference Materials, Belgium), was used for the control of milk extraction and the digestion process. For quality control of the analysis, skimmed milk powder BD150 and wheat flour (BC210a, European Reference Materials, Belgium) were analyzed. The acceptable recovery (80–120%) was obtained for both CRMs. The combined expanded uncertainty was less than 20% for the whole analytical procedure (a coverage factor k=2 for approximately 95% confidence). HPLC and ICP(iCRC)MS operating conditions are presented in the supplemental material (Table S1).
2.2.3. Data Analyses
The Se concentrations were evaluated against the minimum and maximum levels permitted in formulae for infants according to EU regulations, namely Commission Directive 2016/127 and Commission Delegated Regulation (EU) 2016/128, both supplementing Regulation (EU) No 609/2013 concerning compositional and information requirements for infant formula, follow-on formula, and food for special medical purposes [5,6]. The analytical values were converted to µg per 100 kcal and stratified into three formula types: infant formulae, follow-on formulae, and formulae for special medical purposes.
The estimated daily intake (EDI) was calculated for all analyzed formulae. For products intended for infants from birth to 6 months (infant formulae), the EDI was determined for infants aged 1, 3, and 6 months. For formulae designed for infants aged 7–12 months (follow-on formulae), the EDI was calculated for infants aged 7 and 10 months. Formulae for special medical purposes were additionally subdivided into four categories according to the age range for which they were intended. In products formulated for infants from birth to 6 months, the EDI was calculated using the same age points as for standard infant formulae (1, 3, and 6 months). For formulae intended for infants aged 7–12 months, the EDI corresponded to the age points applied to follow-on formulae (7 and 10 months). For formulae intended for infants from birth to 12 months, the EDI was calculated for infants aged 1, 3, 6, 7, and 10 months. For formulae intend for preterm infants until achieving appropriate body weight, the EDI was calculated for infants aged 1, 3 and 6 months.
Recommendations on energy intake were applied to estimate the EDI of Se using the present data from the Stan et al. study, while average body weights were determined based on the recent WHO growth percentiles for infants [23]. It should be noted that, after 6 months of age, infants no longer meet their full energy requirements solely from formula due to the introduction of complementary foods. Therefore, it was assumed that infants at 7 months of age obtain 45% of their total energy intake from formula, and those at 10 months obtain 25% [24].
The results were compared with the nutritional guidelines applicable in Poland, as per the EFSA. The EDI was evaluated against the adequate intake (AI) for infants aged 6–11 months (20 µg/day) and the tolerable upper intake level (UL), set at 45 µg/day for infants aged 4–6 months and 55 µg/day for infants aged 7–11 months [25,26].
The identified selenium species were expressed as percentages, taking into account the distribution of formulae according to their type: infant formulae, follow-on formulae, and formulae for special medical purposes. Due to differences in the ingredients used in the production of each formula category, the formulae for special medical purposes were further subdivided into the following groups: extensively hydrolyzed formulae, amino acid-based formulae, goat milk-based formulae, comfort formulae, anti-reflux formulae, lactose-free formulae, preterm formulae, and soy-based formulae.
Median values, first and third quartiles, and minimum and maximum values were calculated for all analyzed formulae. Statistical analyses were performed using Statistica 13.3 (StatSoft, TIBCO Software Inc., Palo Alto, CA, USA). Figures were prepared using Microsoft Excel 365 (Microsoft Corporation, Redmond, WA, USA).
The detection of several selenium species prompted an attempt to estimate the possible origin of these compounds, which was explored through statistical analysis. Firth’s penalized likelihood regression was employed to model the detection probability of SeMet and MeSeCys, given that 12% of the total observations contained zero values. To investigate the effects of the selected factors on the levels of organic Se forms, a generalized linear model (GLM) with a Gamma distribution and a log link function was applied. For each polytomous factor, the most populous category was systematically designated as the reference baseline level. This approach ensures optimal numerical stability during the maximum likelihood estimation and maximizes statistical power by minimizing the standard errors of the estimated parameters across all subsequent pairwise contrasts. Several models with different sets of explanatory variables were evaluated. Based on information criteria (AIC and BIC), the deviance-to-degrees-of-freedom ratio, and cross-validation results, the models that best described the data were selected and subsequently used to infer the influence of the analyzed factors on selenomethionine and methylselenocysteine levels. Statistical inference was conducted at the 0.05 significance level. All analyses were performed in the R environment.
3. Results
3.1. Selenium Concentrations in Analyses Formulae
The Se concentrations in the analyzed formulae (µg/100 kcal) are presented in Table 1. Most of the formulae met the recommended minimum and maximum Se levels (78.4% of the tested products). Among the remaining samples, nine formulae were below the detection limit, Se was detected but remained below the minimum value in eighteen formulae, and five formulae exceeded the maximum permissible Se content. The lowest proportion of formulae with values outside the recommended range was observed among infant formulae, where only approximately 11% showed abnormal Se levels. Notably, none of the formulae for special nutritional purposes exceeded the maximum Se limits. The Se concentrations expressed in µg/kg of analized formulae are provided in the supplementary material (Table S2).

Table 1.
Selenium concentrations in analyzed formulae.
| Analyzed elements | Norms* | Infant formulae (n=37) |
Follow-on formulae (n=33) |
Formulae for special medical purposes intended for infants (n=78) |
Total analyzed formulae (n=148) |
| 3-8.6 µg | Median (1st–3rd) <min–max> |
||||
| Se [µg/100 kcal]* | 4.9 (4.0-6.3) <0.0-15.6> |
4.8 (4.0-6.3) <0.0-9.3> |
4.0 (3.0-5.5) <0.0-8.5> |
4.5 (3.3-6.1) <0.0-15.6> |
|
| Se below minimum levels [amount] | 3 | 5 | 19 | 27 | |
| Se above maximum levels [amount] | 1 | 4 | 0 | 5 | |
| Amount of formulae inconsistent with EU regulations [% ] | 10.8 | 27.3 | 24.4 | 21.6 | |
* Appropriate composition of Se in formulae for infants as specified by the European Union guidelines.
3.2. Estimated Daily Intake of Selenium
Table 2 presents the EDI expressed in ug/day, divided into infant formulae, follow-on formulae and special medical purposes formulae. Formulae for special medical purposes were categorized according to their intended use: for infants aged 0–6 months, 7–12 months, from birth to 12 months, and for preterm infants.
There is no specific adequate intake value established for infants under 6 months of age, and therefore, for infant formulae and EDI calculations, the assessment focused on the potential to exceed the UL. The UL value was exceeded in the first month by one formula, which also above the maximum level permitted by the EU. In subsequent months, the number of formulae exceeding the UL increased: five formulae in the third month and six in the sixth month. This indicates that even when EU standards for nutrient content are met, the upper level may still be exceeded. The lowest Se concentration expressed in µg/100 kcal, corresponding to an EDI above 45 µg (UL value), was 7.8 µg/100 kcal.
The EDI for follow-on formulae was assessed in infants aged 7 and 10 months, assuming that the formula provided 45% and 25% of the total daily energy requirement, respectively. At 7 months, only seven formulae met the daily Se requirement, whereas at 10 months none of the formulae provided adequate intake. This underscores the need to introduce Se-containing complementary foods during the complementary feeding period. None of the formulae exceeded the UL value.
In formulae for special medical purposes, the EDI depended on the formula category. In formulae intended for use from birth to 6 months, the UL value was exceeded at 6 months in two preparations. Similarly to infant formulae, these preparations did not exceed the maximum level recommended by the EU (Table 1). In formulae intended for feeding from 7 to 12 months, only one preparation had an EDI value above the AI. In formulae intended for feeding from 0 to 12 months, the UL values were exceeded at 3 months in two formulae and at 6 months in six formulae. At 7 months, the EDI values for seven formulae were above the AI. Importantly, the preparations that met the AI for 7-month-old infants also exceeded the UL values calculated for 6 months of age. This suggests that formulae intended for use from birth to 12 months may not adequately meet infants’ Se requirements at specific developmental stages. In formulae intended for preterm infants, none of the analyzed samples exceeded the UL values.
3.3. Selenium Speciation
The Se concentrations and Se speciation profiles in the different formulae, determined using ICP-MS, are presented in Table 3.
According to the manufacturer's declaration on the label, Se was added in the form of sodium selenite in 72 formulae and sodium selenate in 49 formulae. The Se form was not specified in 26 formulae; only “selenium” was listed. One formula did not list Se in the ingredients, even though it appeared in the nutritional information. Of the 121 samples in which the Se form was specified, 71.1% matched the manufacturer’s declaration, 22.3% were incorrect (7.4% of these were below the detection limit), and 6.6% contained similar proportions of Se forms, making it difficult to determine the dominant one.
Two additional organic forms of selenium were also identified: selenomethionine (SeMet) and methylselenocysteine (MeSeCys). The mean content of SeMet was 7.3% (min. – 0%, max. – 27.3%), and that of MeSeCys was 8.5% (min. – 0%, max. – 29.5%).
As Se species were reported as percentage contributions rather than absolute concentrations, the intake of individual Se forms was estimated using the previously calculated total EDI for 6-month-old infants, the age group with the highest overall Se intake. Using this approach, the estimated mean SeMet intake was 2.3 µg/day, while the estimated mean MeSeCys intake was 1.8 µg/day.
3.4. Associations Between Selenium Species and Milk Composition
According EU and FDA regulations, formulae for infants must not contain added organic forms of Se. Because organic Se form were identified in the samples, an attempt was made to determine their origin. To explore the potential origin of the detected selenium species, a series of statistical models was applied. A complete overlap in zero observations—where the absence of SeMet and MeSeCys occurred simultaneously in the exact same samples. Consequently, a shared Firth’s penalized logistic regression was evaluated, revealing that the type of infant formula had no statistically significant effect on the probability of occurrence for either organic selenium species (Penalized Likelihood Ratio Test: χ 2= 7.27, p = 0.609). The second step, analyzing only the positive concentration values, evaluated the impact of formula type on the amount of individual organic Se forms (Table 4 and Table 5). Subsequently, based on a literature review, we selected potential ingredients that might contain trace amounts of these compounds, such as milk powder, whey powder, casein, probiotic additives (Table 6 and Table 7). The statistical analysis showed that the amino acid-based formulae had a significantly lower SeMet level (approximately 76% lower), whereas the extensively hydrolyzed formulae formula exhibited a significantly higher level (approximately 47% higher) compared with the reference group (infant formulae). No significant differences were observed for the remaining formula types (Table 4). For MeSeCys, the amino acid-based formulae demonstrated a lower level (approximately 60% lower) than infant formulae, while the comfort formulae had approximately 37% lower MeSeCys content compared with the reference group (Table 5). In the case of the analyzed ingredients, no significant effects on the levels of either organic Se form were observed (Table 6 and Table 7), where milk powder, whey, casein, proboitic were selected as the reference baseline levels.
4. Discussion
This study encompasses one of the most extensive sets of milk samples analyzed to date and includes a complete Se speciation workflow. The combination of broad sampling and molecular-level characterization provides a novel and methodologically robust contribution to current research on selenium distribution in infant formulae intended for infant nutrition. The composition of infant formula is continually modified to more closely match human milk, which underscores the essential need for regular monitoring of nutrient concentrations.
Our study determined the Se concentration in all formulae for infatns available on the Polish market intended for consumption from birth to 12 months of age. An additional objective was to identify the chemical forms of Se present in these products. Considering the occurrence of various Se species, including SeMet and MeSeCys, an attempt was made to estimate which raw materials used in formula production could be potential sources of these forms.
The Se concentrations reported in our study were comparable to those described by other authors. Both insufficient Se concentration and formulae for which the calculated EDI may exceed the UL were observed [27,28,29,30,31,32,33]. Some of the available studies focused on comparing different formula types in relation to their Se concnetration, whereas others referred to international guidelines (EU, Codex Alimentarius or FDA) specifying the required Se levels in formulae or assessed the estimated daily selenium intake. In the study by Pandelova M. et al., 42 formulae for infants from several European countries were analyzed. The mean Se concentrations in infant formulae were 0.09 µg/g, 0.12 µg/g, and 0.07 µg/g for cow-based, soy-based, and hypoallergenic formulae, respectively. For follow-on formulae, the corresponding values were 0.51 µg/g, 0.22 µg/g, and 0.41 µg/g. In some formulae, the estimated daily intake exceeded the UL of 60 µg/day [27]. In the studies of Sola-Larraña et al., which included 105 formulae from Spain, Se concentrations were 7.4 ± 5.6 µg/L in infant formulae, 7.4±5.2 µg/L in follow-up formulae, 9.7±6.3 µg/L in formulae for preterm infants, 7.9±7.9 µg/L in formulae for special medical purposes, and 22.3±12.8 µg/L in soy-based formulae [28]. In Sweden, Ljung C. et al. analyzed nine preparations. They reported Se concentrations of 5.7 and 5.9 µg/L in organic cow-based formulae, 16.0–18.0 µg/L in conventional cow- -based formulae, 29.0 µg/L in hydrolysed formula, 18.0 µg/L in casein-extensively hydrolysed formula, 13.0 µg/L in whey-extensively hydrolysed formula, 15.0 µg/L in rice-based formula, and 15.0 µg/L in soy-based formula [29]. In Italy, Bargellini A. et al. analyzed 35 infant formulae mean Se concentration was 13.27 µg/L, with values of 13.82 µg/L in infant formulae, 13.7 µg/L in formulae for allergic infants (milk proteins or lactose-intolerant), and 11.4 µg/L in formulae intended for infants with gastrointestinal problems such as diarrhea or reflux. All values were consistent with EU requirements, and no statistically significant differences in Se concentrations were observed between product categories [30]. In Jordan, Tahboub Y. R. et al. reported a mean Se concentration of 0.12±0.07 µg/g in 22 infant formulae, which was substantially higher than the levels found in human milk, which served as the reference material in that study [31]. In southern China, Lin X. et al. analyzed 54 formulae, in which Se concentrations ranged from 0.07 to 0.32 µg/kg, with some values below the Codex Alimentarius reference range [32]. In Poland, Chajduk E. et al. analyzed six formulae for infants. They reported Se concentrations of 0.12–0.20 µg/g in cow-based formulae, 0.16 µg/g in a goat-milk-based formula, and a markedly higher value of 0.98 µg/g in a soy-based formula [33].
Our analysis indicates that, regardless of formula type, both selenium deficiency and excessive intake are possible. From a clinical perspective, exceeding the UL is particularly concerning. Exceedance was already observed in the first month of life, and its frequency increased with infant age up to 6 months. It should be emphasized that this occurred in a small proportion of samples, with approximately 5% exceeding the UL by 6 months of age. Nevertheless, for infants consuming these specific formulae, this represents a potential risk.
In the second half of infancy (beyond 6 months of age), no exceedance of the UL value was observed. This is primarily because infant formulas constitute a much smaller proportion of total energy intake at this stage, as complementary feeding becomes established. Our analysis showed that the EDI for selenium provided solely by formulae during this period is often lower than the AI, which highlights the importance of introducing selenium-containing complementary foods. Good dietary sources of selenium at this age include fish, egg yolk, and broccoli [34].
The next stage of the study was to identify the Se species present in formulae. The dominant forms were sodium selenite and sodium selenate. In most of the analyzed formulae their presence was consistent with the manufacturer’s declaration on the label. Trace amounts of SeMet and MeSeCys were also detected, and their levels were considered completely safe. However, because the addition of organic Se forms to formula for infants is not permitted, an attempt was made to determine which ingridients used in production could be potential sources of these compounds. The statistical analysis showed that the levels of SeMet and MeSeCys were significantly lower in analog formulae compared with infant formulae. This may be associated with the substantial degree of ingredient fragmentation and the more detailed composition characteristic of these products. Interestingly, SeMet content was significantly higher in extensively hydrolyzed formulae. In the case of MeSeCys, its concentration was also significantly lower in comfort formulae. These differences may therefore be related not to the formula type itself, but rather to the specific added ingredients. However, the analysis of potential components that could contain trace amounts of the examined Se species did not reveal any significant associations. This can likely be explained by the varying proportions of added ingredients, and the diversity of ingredient forms. For example, whey powder could be fully demineralized, partially demineralized, or appear in two different forms within the same product, while in other cases only its presence was indicated. These findings highlight the need for further investigation of individual raw materials and a closer examination of production technologies to identify the source of trace amounts of organic Se species.
Limitation of the study is that it covered only formulae for infants available on the Polish market and did not take into account products from other European countries. In addition, different batches of the same formula were not included for all samples due to the costs of purchasing additional units and the costs of chemical analyses.
5. Conclusions
In most cases, the Se concentration in the analyzed infant formulae was within the recommended range and therefore safe. Nevertheless, exceedances of the UL observed in some samples may pose a clinical risk to infants, highlighting the need for regular monitoring of formula composition. The detection of SeMet and MetSeCys species provides additional insight into the overall Se profile of these products and opens a new research path regarding the selenium content in formulae for infants.
Supplementary Materials
The following supporting information can be downloaded at the website of this paper posted on Preprints.org. Table S1: Instrumental parameters for the determination of selenium species and total elements; Table S2: Selenium concentrations in analyzed formulae [µg/g].
Author Contributions
M.D., S.D.C and P.N. conceived the study; Z.W. performed laboratory analyses; A.S.A. and M.D. performed statisitical analyses M.D. drafted the manuscript; M.D. and K.A.K.K. wrote and edited the first version of the manuscript; S.D.C., P.N. and J.P. supervised the study and project administration. All authors read and approved the final manuscript.
Funding
The research was funded from the budget of the Department of Bromatology, Poznan University of Medical Sciences.
Institutional Review Board Statement
Not applicable.
Informed Consent Statement
Not applicable.
Data Availability Statement
The datasets generated and analyzed during the current study are available from the corresponding author upon reasonable request.
Conflicts of Interest
The authors declare no conflicts of interest.
References
- Fewtrell, M.; Bronsky, J.; Campoy, C.; Domellöf, M.; Embleton, N.; Fidler Mis, N.; Hojsak, I.; Hulst, J.M.; Indrio, F.; Lapillonne, A.; et al. Complementary Feeding: A Position Paper by the European Society for Paediatric Gastroenterology, Hepatology, and Nutrition (ESPGHAN) Committee on Nutrition. J. Pediatr. Gastroenterol. Nutr. 2017, 64, 119–132. [Google Scholar] [CrossRef] [PubMed]
- Koletzko, B.; Hirsch, N.L.; Jewell, J.M.; Dos Santos, Q.; Breda, J.; Fewtrell, M.; Weber, M.W. National Recommendations for Infant and Young Child Feeding in the World Health Organization European Region. J. pediatr. gastroenterol. nutr. 2020, 71, 672–678. [Google Scholar] [CrossRef] [PubMed]
- World Health Organization. United Nations Children’s Fund Global Breastfeeding Scorecard, 2025: Breastfeeding Rates Are Increasing but Improved Support Is Needed; World Health Organization, 2026. [Google Scholar]
- Martin, C.; Ling, P.-R.; Blackburn, G. Review of Infant Feeding: Key Features of Breast Milk and Infant Formula. Nutrients 2016, 8, 279. [Google Scholar] [CrossRef] [PubMed]
- COMMISSION DELEGATED REGULATION (EU) 2016/127; of 25 September 2015 Supplementing Regulation (EU) No 609/2013 of the European Parliament and of the Council as Regards the Specific Compositional and Information Requirements for Infant Formula and Follow-on Formula and as Regards Requirements on Information Relating to Infant and Young Child Feeding.
- COMMISSION DELEGATED REGULATION (EU) 2016/128; of 25 September 2015 Supplementing Regulation (EU) No 609/2013 of the European Parliament and of the Council as Regards the Specific Compositional and Information Requirements for Food for Special Medical Purposes.
- Guo, M.; Ahmad, S. Formulation Guidelines for Infant Formula. In Human Milk Biochemistry and Infant Formula Manufacturing Technology; Elsevier, 2014; pp. 141–171. ISBN 978-1-84569-724-2. [Google Scholar]
- Wong, C.B.; Huang, H.; Ning, Y.; Xiao, J. Probiotics in the New Era of Human Milk Oligosaccharides (HMOs): HMO Utilization and Beneficial Effects of Bifidobacterium Longum Subsp. Infantis M-63 on Infant Health. Microorganisms 2024, 12, 1014. [Google Scholar] [CrossRef] [PubMed]
- Dobrzyńska, M.; Wojciechowska, Z.; Jakubowski, K.; Markowska, H.; Przysławski, J.; Niedzielski, P.; Drzymała-Czyż, S. Analysis of the Elemental Composition of Milk Formulae: Impact on the Nutritional Status of Infants From Birth to 1 Year of Age. Biol. Trace Elem. Res. 2025, 204, 385–400. [Google Scholar] [CrossRef] [PubMed]
- Jomova, K.; Makova, M.; Alomar, S.Y.; Alwasel, S.H.; Nepovimova, E.; Kuca, K.; Rhodes, C.J.; Valko, M. Essential Metals in Health and Disease. Chem.-Biol. Interact. 2022, 367, 110173. [Google Scholar] [CrossRef] [PubMed]
- Fraga, C.G. Relevance, Essentiality and Toxicity of Trace Elements in Human Health. Mol. Asp. Med. 2005, 26, 235–244. [Google Scholar] [CrossRef] [PubMed]
- Huang, Z.; Rose, A.H.; Hoffmann, P.R. The Role of Selenium in Inflammation and Immunity: From Molecular Mechanisms to Therapeutic Opportunities. Antioxid. Redox Signal 2012, 16, 705–743. [Google Scholar] [CrossRef] [PubMed]
- Ventura, M.; Melo, M.; Carrilho, F. Selenium and Thyroid Disease: From Pathophysiology to Treatment. Int. J. Endocrinol. 2017, 2017, 1297658. [Google Scholar] [CrossRef] [PubMed]
- Pieczyńska, J.; Grajeta, H. The Role of Selenium in Human Conception and Pregnancy. J. Trace Elem. Med. Biol. 2015, 29, 31–38. [Google Scholar] [CrossRef] [PubMed]
- Shahidin; Wang, Y.; Wu, Y.; Chen, T.; Wu, X.; Yuan, W.; Zhu, Q.; Wang, X.; Zi, C. Selenium and Selenoproteins: Mechanisms, Health Functions, and Emerging Applications. Molecules 2025, 30, 437. [Google Scholar] [CrossRef] [PubMed]
- Leszto, K.; Biskup, L.; Korona, K.; Marcinkowska, W.; Możdżan, M.; Węgiel, A.; Młynarska, E.; Rysz, J.; Franczyk, B. Selenium as a Modulator of Redox Reactions in the Prevention and Treatment of Cardiovascular Diseases. Antioxidants 2024, 13, 688. [Google Scholar] [CrossRef] [PubMed]
- Bano, I.; Hassan, M.F.; Kieliszek, M. A Comprehensive Review of Selenium as a Key Regulator in Thyroid Health. Biol. Trace Elem. Res. 2025, 203, 6466–6480. [Google Scholar] [CrossRef] [PubMed]
- Hadrup, N.; Ravn-Haren, G. Acute Human Toxicity and Mortality after Selenium Ingestion: A Review. J. Trace Elem. Med. Biol. 2020, 58, 126435. [Google Scholar] [CrossRef] [PubMed]
- Smith, A.; Picciano, M.; Milner, J. Selenium Intakes and Status of Human Milk and Formula Fed Infants. Am. J. Clin. Nutr. 1982, 35, 521–526. [Google Scholar] [CrossRef] [PubMed]
- World Health Organization. Environmental Health Criterion 58—Selenium; World Health Organization: Geneva, 1987. [Google Scholar]
- Barchielli, G.; Capperucci, A.; Tanini, D. The Role of Selenium in Pathologies: An Updated Review. Antioxidants 2022, 11, 251. [Google Scholar] [CrossRef] [PubMed]
- Fordyce, F.M. Selenium Deficiency and Toxicity in the Environment. In Essentials of Medical Geology; Selinus, O., Ed.; Springer Netherlands: Dordrecht, 2013; pp. 375–416. ISBN 978-94-007-4374-8. [Google Scholar]
- Stan, S.V.; Grathwohl, D.; O’Neill, L.M.; Saavedra, J.M.; Butte, N.F.; Cohen, S.S. Estimated Energy Requirements of Infants and Young Children up to 24 Months of Age. Curr. Dev. Nutr. 2021, 5, nzab122. [Google Scholar] [CrossRef] [PubMed]
- Piccinelli, R.; Pandelova, M.; Le Donne, C.; Ferrari, M.; Schramm, K.-W.; Leclercq, C. Design and Preparation of Market Baskets of European Union Commercial Baby Foods for the Assessment of Infant Exposure to Food Chemicals and to Their Effects. Food Addit. Contam. Part A 2010, 27, 1337–1351. [Google Scholar] [CrossRef] [PubMed]
- Rychlik, E.; Stoś, K.; Woźniak, A.; Mojska, H. Normy Żywienia Dla Populacji Polski; Narodowy Instytut Zdrowia Publicznego PZH-Państwowy Instytut Badawczy: Warsaw, Poland, 2025. [Google Scholar]
- EFSA Panel on Nutrition; Novel Foods and Food Allergens (NDA); Turck, D.; Bohn, T.; Castenmiller, J.; de Henauw, S.; Hirsch-Ernst, K.; Knutsen, H.K.; Maciuk, A.; Mangelsdorf, I.; McArdle, H.J.; et al. Scientific Opinion on the Tolerable Upper Intake Level for Selenium. EFS2 2023, 21. [Google Scholar] [CrossRef] [PubMed]
- Pandelova, M.; Lopez, W.L.; Michalke, B.; Schramm, K.-W. Ca, Cd, Cu, Fe, Hg, Mn, Ni, Pb, Se, and Zn Contents in Baby Foods from the EU Market: Comparison of Assessed Infant Intakes with the Present Safety Limits for Minerals and Trace Elements. J. Food Compos. Anal. 2012, 27, 120–127. [Google Scholar] [CrossRef]
- Sola-Larrañaga, C.; Navarro-Blasco, I. Preliminary Chemometric Study of Minerals and Trace Elements in Spanish Infant Formulae. Anal. Chim. Acta 2006, 555, 354–363. [Google Scholar] [CrossRef]
- Ljung, K.; Palm, B.; Grandér, M.; Vahter, M. High Concentrations of Essential and Toxic Elements in Infant Formula and Infant Foods – A Matter of Concern. Food Chem. 2011, 127, 943–951. [Google Scholar] [CrossRef] [PubMed]
- Bargellini, A.; Venturelli, F.; Casali, E.; Ferrari, A.; Marchesi, I.; Borella, P. Trace Elements in Starter Infant Formula: Dietary Intake and Safety Assessment. Env. Sci. Pollut. Res. 2018, 25, 2035–2044. [Google Scholar] [CrossRef] [PubMed]
- Tahboub, Y.R.; Massadeh, A.M.; Al-sheyab, N.A.; El Shrafat, D.; Nsserat, I.A. Levels of Trace Elements in Human Breast Milk in Jordan: A Comparison with Infant Formula Milk Powder. Biol. Trace Elem. Res. 2021, 199, 4066–4073. [Google Scholar] [CrossRef] [PubMed]
- Lin, X.; Wu, X.; Li, X.; Zhang, D.; Zheng, Q.; Xu, J.; Lu, S. Infant Exposure to Trace Elements in Breast Milk, Infant Formulas and Complementary Foods from Southern China. Sci. Total Environ. 2022, 838, 156597. [Google Scholar] [CrossRef] [PubMed]
- Chajduk, E.; Pyszynska, M.; Polkowska-Motrenko, H. Determination of Trace Elements in Infant Formulas Available on Polish Market. Biol. Trace Elem. Res. 2018, 186, 589–596. [Google Scholar] [CrossRef] [PubMed]
- Dobrzyńska, M.; Kaczmarek, K.; Przysławski, J.; Drzymała-Czyż, S. Selenium in Infants and Preschool Children Nutrition: A Literature Review. Nutrients 2023, 15, 4668. [Google Scholar] [CrossRef] [PubMed]
Figure 1.
Detailed types of special medical purpose formulae included in the analysis.
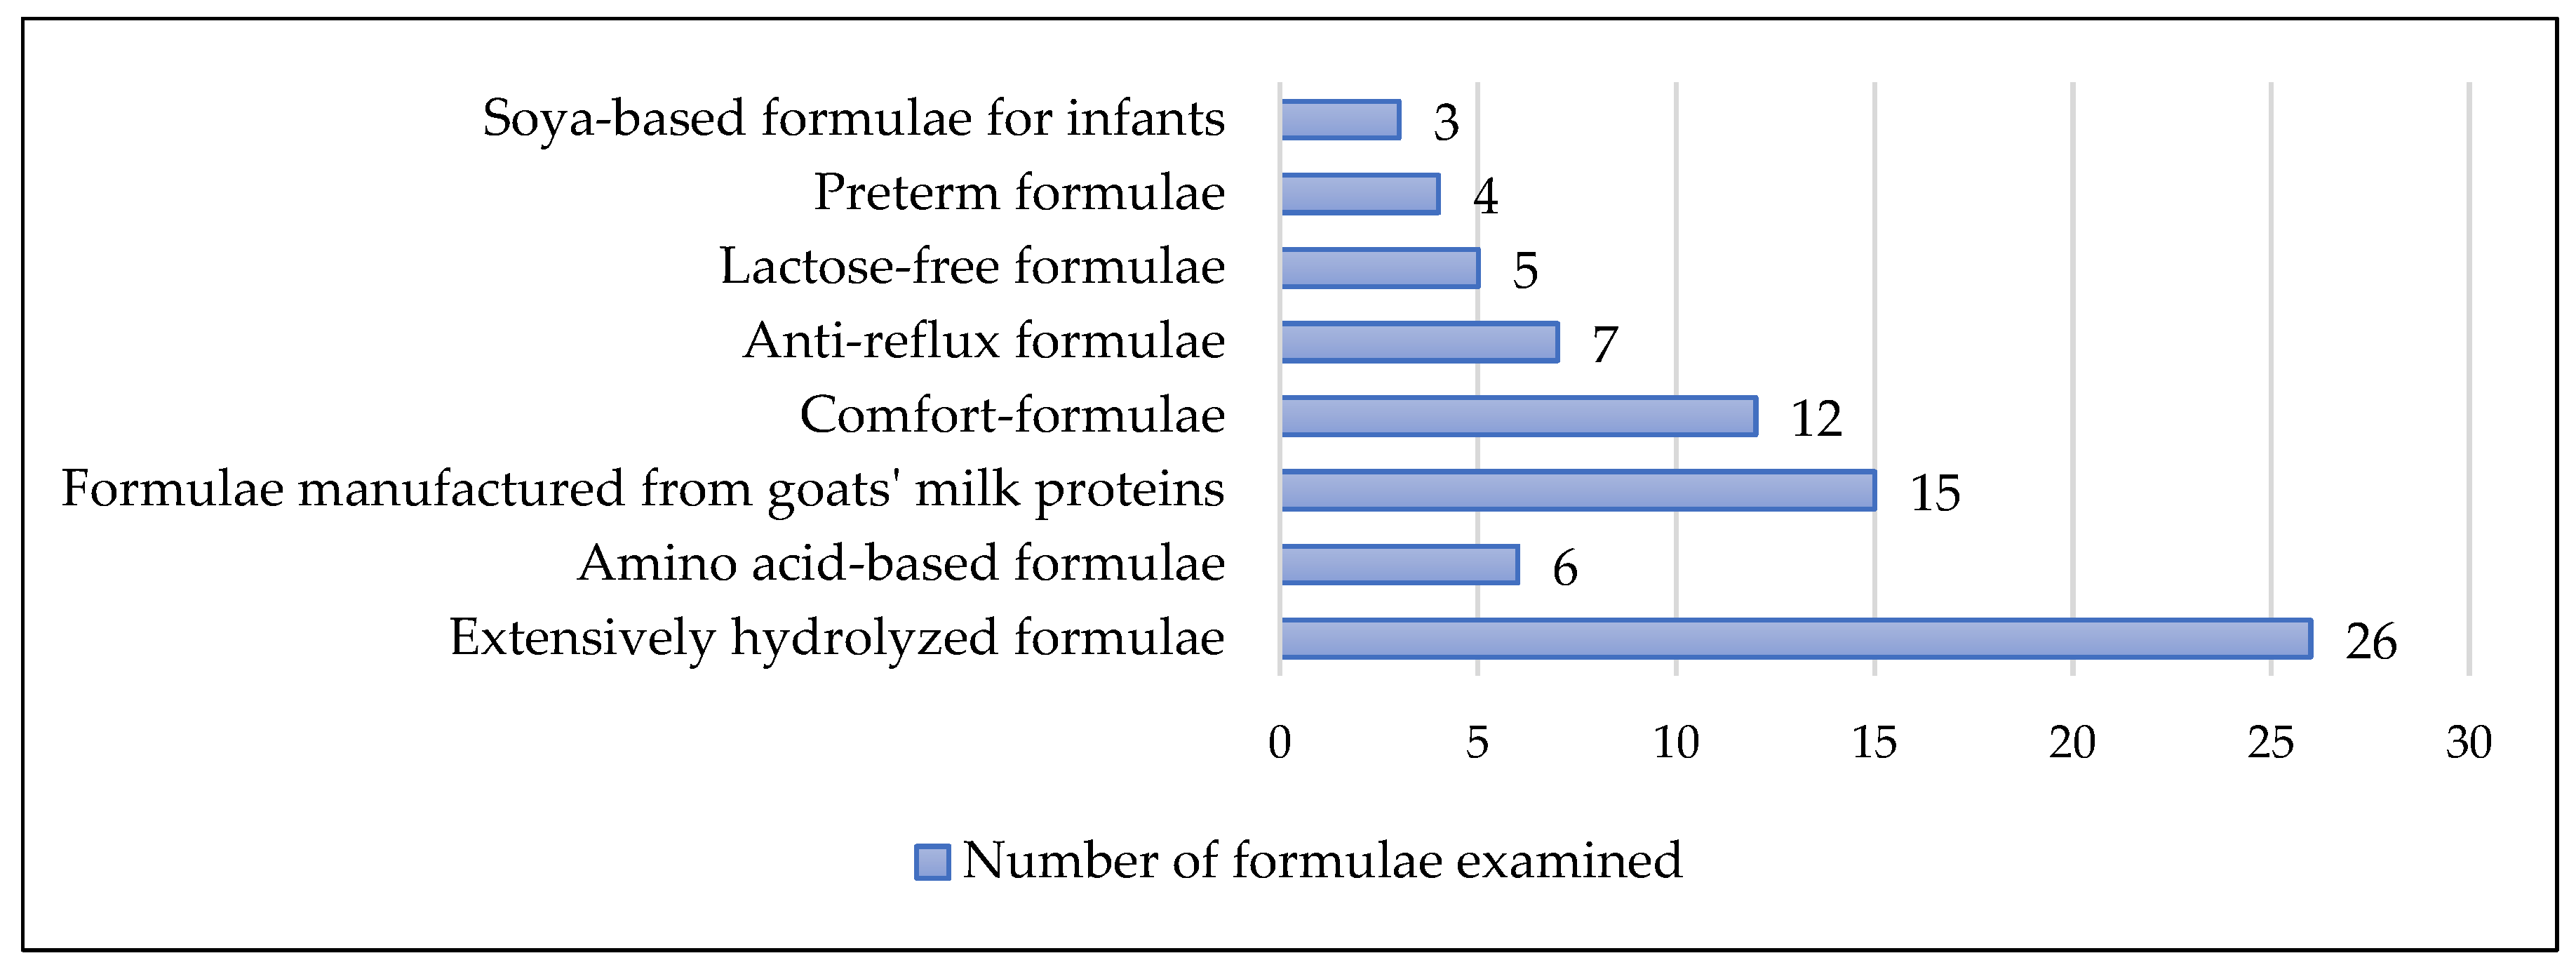
Table 2.
Estimated daily selenium intake of infants from different formulae.
| Analyzed formulae | Infant age | |||||
| 1 month | 3 month | 6 month |
7 month 45% of the daily energy coverage |
10 month 25% of the daily energy coverage |
||
| Median (1st–3rd) <min–max> | ||||||
| Infant formulae (n=37) | 22.3 (14.9-28.2) | 28.2 (23.2-36.7) | 30.5 (25.2-39.6) | |||
| <0.0-71.5> | <0.0-90.6> | <0.0-97.9> | ||||
| Follow-on formulae (n=33) | 13.6 (11.5-17.9) | 8.5 (7.2-11.2) | ||||
| <0.0-26.7> | <0.0-16.7> | |||||
| Formulae for special medical purposes intended for infants (n=78) | ||||||
| Intended for infants for birth to 6 months of age (n=29) | 18.2 (13.7-23.3) | 23.0 (17.4-29.5) | 24.9 (18.8-31.9) | |||
| <0.0-34.4> | <0.0-43.6> | <0.0-47.1> | ||||
| Intended for infants from 6 to 12 months of age (n=21) | 11.8 (8.6-14.1) | 7.4 (5.4-8.9) | ||||
| <0.0-21.5> | <0.0-13.5> | |||||
| Intended for infants for birth to 12 months of age (n=24) | 21.9 (14.6-32.5) | 27.8 (18.6-41.3) | 30.0 (20.1-44.6) | 13.6 (9.1-20.3) | 8.5 (5.7-12.7) | |
| <0.0-39.1> | <0.0-49.6> | <0.0-53.6> | <0.0-24.4> | <0.0-15.3> | ||
| Intended for preterm infants (n=4) | 15.8 (4.5-24.0) | 20.1 (5.8-30.4) | 21.7 (6.2-32.9) | |||
| <0.0-25.4> | <0.0-32.1> | <0.0-34.7> | ||||
*adequate intake for infants 6-11 months - 20 µg; upper level for Se for infants 4-6 months - 45 µg, for 7-11 months - 55 µg.
Table 3.
Selenium concentrations and selenium speciation in different formulae determined using ICP-MS.
Table 3.
Selenium concentrations and selenium speciation in different formulae determined using ICP-MS.
| Analyzed formulae | Se [µg/kg]* | Se IV [%] | Se VI [%] | SeMet [%] | MeSeCys [%] | Others [%] |
| Median (1st–3rd) <min–max> | ||||||
| Infant formulae (n=37) | 200.5 (160.0-245.5) | 10.2 (2.2-55.4) | 11.4 (5.8-48.0) | 8.7 (5.1-11.5) | 7.9 (5.8-10.8) | 23.1 (6.9-37.2) |
| <0.0-23.8> | <0.0-77.0> | <0.0-76.5> | <0.0-23.8> | <0.0-29.5> | <0.0-94.0> | |
| Follow-on formulae (n=33) | 193.8 (141.0-250.4) | 7.7 (4.1-60.6) | 12.3 (7.0-55.6) | 6.6 (4.6-9.1) | 7.1 (4.0-8.7) | 19.4 (4.0-47.8) |
| <0.0-451.4> | <0.0-89.0> | <0.0-84.1> | <0.0-27.3> | <0.0-26.0> | <0.0-92.6> | |
| Total formulae for special medical intend (n=78) | 163.9 (121.0-234.2) | 20.6 (4.8-54.0) | 5.0 (0.0-14.5) | 9.4 (3.0-13.2) | 6.3 (3.0-9.8) | 21.8 (6.3-56.3) |
| <0.0-362.0> | <0.0-94.1> | <0.0-87.9> | <0.0-24.8> | <0.0-26.2> | <0.0-100.0> | |
| Extensively hydrolyzed formulae (n=26) | 163.9 (129.5-211.1) | 42.6 (8.4-62.3) | 3.3 (0.0-8.0) | 12.2 (7.7-15.2) | 6.2 (4.4-9.5) | 15.1 (1.3-42.1) |
| <0.0-336.8> | <0.0-82.4> | <0.0-71.1> | <0.0-24.8> | <0.0-14.4> | <0.0-91.6> | |
| Amino acid-based formulae (n=6) | 199.9 (172.3-340.0) | 44.4 (22.1-63.7) | 2.8 (0.0-9.4) | 1.4 (0.0-3.0) | 0.9 (0.0-4.8) | 41.4 (21.9-779.0) |
| <156.1-362.0> | <19.1-94.1> | <0.0-11.2> | <0.0-3.5> | <0.0-9.0> | <0.0-80.9> | |
| Formulae manufactured from goats' milk proteins (n=15) | 159.4 (76.5-236.6) | 14.6 (6.2-34.5) | 5.9 (3.3-14.7) | 10.5 (7.8-12.4) | 7.3 (5.9-8.1) | 15.0 (22.6-58.2) |
| <0.0-310.0> | <0.0-78.7> | <0.0-58.6> | <0.0-14.5> | <0.0-16.5> | <0.0-71.0> | |
| Comfort-formulae (n=12) | 182.4 (91.7-272.5) | 2.2 (0.0-27.4) | 5.2 (0.0-73.2) | 8.2 (0.0-11.6) | 3.2 (0.0-5.2) | 8.6 (2.3-26.8) |
| <0.0-301.9> | <0.0-73.8> | <0.0-87.9> | <0.0-13.3> | <0.0-13.4> | <0.0-100.0> | |
| Anti-reflux formulae (n=7) | 135.0 (101.5-187.5) | 45.2 (8.6-56.8) | 8.2 (0.0-11.8) | 10.3 (5.0-18.1) | 10.3 (5.6-17.0) | 16.4 (0.0-79.0) |
| <96.8-213.3> | <0.0-76.3> | <0.0-12.9> | <0.0-24.3> | <0.0-17.7> | <0.0-91.6> | |
| Lactose-free formulae (n=6) | 153.4 (147.9-183.4) | 34.5 (4.9-52.1) | 27.6 (15.9-43.2) | 8.9 (6.4-9.4) | 10.9 (9.8-14.6) | 15.7 (9.5-22.4) |
| <117.4-274.8> | <2.6-54.1> | <4.3-58.2> | <4.5-13.8> | <8.1-26.2> | <8.5-33.9> | |
| Preterm formulae (n=4) | 167.0 (53.4-271.0) | 27.5 (6.0-53.7) | 1.1 (0.0-15.8) | 3.8 (0.8-9.3) | 6.8 (0.9-13.1) | 50.2 (8.0-92.2) |
| <0.0-314.7> | <0.0-64.2> | <0.0-29.4> | <0.0-12.7> | <0.0-14.7> | <0.1-100.0> | |
| Soya-based formula for infants (n=3) | 257.1 (0.0-296.7) | 9.1 (0.0-52.5) | 0.0 (0.0-4.8) | 2.9 (0.0-16.3) | 1.5 (0.0-8.5) | 17.9 (0.0-86.5) |
| <0.0-296.7> | <0.0-52.5> | <0.0-4.8> | <0.0-16.3> | <0.0-8.5> | <0.0-86.5> | |
| Total analised formulae (n=148) | 187.2 (125.2-239.7) | 15.5 (3.4-54.5) | 8.0 (2.4-30.7) | 8.5 (4.4-12.2) | 6.9 (3.9-10.0) | 21.1 (5.0-47.1) |
| <0.0-451.4> | <0.0-94.1> | <0.0-87.9> | <0.0-27.3> | <0.0-29.5> | <0.0-100.0> | |
SeMet – Selenomethionine; MeSeCys – Methylselenocysteine.
Table 4.
Effect of formula type on SeMet content: GLM results (Gamma distribution, log link).
| Analised parameter | Coefficients: | |||
| Estimate | Std. Error | t value | p | |
| (Intercept) | 2.269848 | 0.088399 | 25.677 | 0.0000 *** |
| Folow-on formulae | -0.147286 | 0.127082 | -1.159 | 0.2489 |
| Amino acid-based formulae | -1.429801 | 0.265198 | -5.391 | 0.0000 *** |
| Anti-reflux formulae | 0.303400 | 0.222467 | 1.364 | 0.1753 |
| Comfort-formulae | 0.049937 | 0.197667 | 0.253 | 0.8010 |
| Formulae manufactured from goats' milk proteins | 0.073105 | 0.160237 | 0.456 | 0.6491 |
| Extensively hydrolyzed formulae | 0.382974 | 0.142539 | 2.687 | 0.0083 ** |
| Lactose-free formulae | -0.141682 | 0.265198 | -0.534 | 0.5942 |
| Preterm formulae | -0.354952 | 0.301941 | -1.176 | 0.2422 |
| Soya-based formula for infants | -0.008633 | 0.364479 | -0.024 | 0.9811 |
*** p<0.001, ** p< 0.01, * p< 0.05 .(Dispersion parameter for Gamma family taken to be 0.2500616)
Table 5.
Effect of formula type on MeSeCys content: GLM results (Gamma distribution, log link).
| Analised parameter | Coefficients: | |||
| Estimate | Std. Error | t value | p | |
| (Intercept) | 2.29049 | 0.09799 | 23.375 | 0.0000*** |
| Folow-on formulae | -0.20189 | 0.14087 | -1.433 | 0.1546 |
| Amino acid-based formulae | -0.92733 | 0.29397 | -3.154 | 0.0021 ** |
| Anti-reflux formulae | 0.19116 | 0.24660 | 0.775 | 0.4399 |
| Comfort-formulae | -0.45952 | 0.21911 | -2.097 | 0.0382 * |
| Formulae manufactured from goats' milk proteins | -0.17580 | 0.17762 | -0.990 | 0.3244 |
| Extensively hydrolyzed formulae | -0.21015 | 0.15801 | -1.330 | 0.1862 |
| Lactose-free formulae | 0.39506 | 0.29397 | 1.344 | 0.1816 |
| Preterm formulae | -0.04991 | 0.33470 | -0.149 | 0.8817 |
| Soya-based formula for infants | -0.67434 | 0.40403 | -1.669 | 0.0979 |
*** p<0.001, ** p< 0.01, * p< 0.05 (Dispersion parameter for Gamma family taken to be 0.3072698).
Table 6.
Effect of selected added ingredients on SeMet content: GLM results (Gamma distribution, log link). .
Table 6.
Effect of selected added ingredients on SeMet content: GLM results (Gamma distribution, log link). .
| Analised parameter | Coefficients: | |||
| Estimate | Std. Error | t value | p | |
| (Intercept) | 2.1921101 | 0.0834801 | 26.259 | 0.000 *** |
| Addition of whey | -0.0241901 | 0.1305684 | -0.185 | 0.853 |
| No addition of whey | -0.0006517 | 0.1264469 | -0.005 | 0.996 |
| Addition of probiotics | 0.1708465 | 0.1048298 | 1.630 | 0.106 |
| No addition of milk powder | 0.1497368 | 0.1216127 | 1.231 | 0.221 |
| Addition of casein | 0.3070848 | 0.2781958 | 1.104 | 0.272 |
*** p<0.001, ** p< 0.01, * p< 0.05 (Dispersion parameter for Gamma family taken to be 0.2693011).
Table 7.
Effect of selected added ingredients on MeSeCys content: GLM results (Gamma distribution, log link).
Table 7.
Effect of selected added ingredients on MeSeCys content: GLM results (Gamma distribution, log link).
| Analised parameter | Coefficients: | |||
| Estimate | Std. Error | t value | p | |
| (Intercept) | 2.302540 | 0.090238 | 25.516 | 0.000 *** |
| Addition of whey | -0.222779 | 0.141139 | -1.578 | 0.117 |
| No addition of whey | -0.175681 | 0.136684 | -1.285 | 0.201 |
| Addition of probiotics | -0.001644 | 0.113316 | -0.015 | 0.988 |
| No addition of milk powder | -0.066273 | 0.131458 | -0.504 | 0.615 |
| Addition of casein | -0.091015 | 0.300718 | -0.303 | 0.763 |
*** p<0.001, ** p< 0.01, * p< 0.05 (Dispersion parameter for Gamma family taken to be 0.3146695).
Disclaimer/Publisher’s Note: The statements, opinions and data contained in all publications are solely those of the individual author(s) and contributor(s) and not of MDPI and/or the editor(s). MDPI and/or the editor(s) disclaim responsibility for any injury to people or property resulting from any ideas, methods, instructions or products referred to in the content. |
© 2026 by the authors. Licensee MDPI, Basel, Switzerland. This article is an open access article distributed under the terms and conditions of the Creative Commons Attribution (CC BY) license (http://creativecommons.org/licenses/by/4.0/).
Copyright: This open access article is published under a Creative Commons CC BY 4.0 license, which permit the free download, distribution, and reuse, provided that the author and preprint are cited in any reuse.


