

Submitted:
29 July 2026
Posted:
30 July 2026
You are already at the latest version
Abstract
Background / Objectives: Colorectal cancer is a leading cause of global cancer-related mortality. Capecitabine, a 5-fluorouracil prodrug, effectively targets colorectal cancer but suffers from an extremely short half-life, requiring frequent administration. Bilosomes (membrane-stabilized bile salts) are vesicular systems that improve gastrointestinal stability, prevent drug leakage, and extend residence time. This study aimed to develop capecitabine-loaded bilosomes to overcome these pharmacokinetic drawbacks and enhance therapeutic efficacy. Methods: In a 32 full factorial design, nine capecitabine-loaded bilosomes were generated utilizing a central composite design within the framework of response surface methodology. Entrapment efficiency, in vitro drug release, and its kinetics vesicle size, zeta potential, and their kinetics were evaluated. The optimized capecitabine-loaded bilosomes formulation was exposed to further investigations, such as ATR-FTIR, DSC, X-ray diffractometry study, stability studies, pharmacokinetic study, and in vivo studies, including detection of matrix metalloproteinase-9 and vascular endothelial growth factor A by Real-Time polymerase chain reaction, evaluation of colon biomarker, and examination of colon tissue through histopathology. Results: The prepared capecitabine-loaded bilosomes were nanosized spheres with suitable entrapment efficiency and a high zeta potential. After treatment with capecitabine-loaded bilosomes, the data collected from living organisms indicated a notable reduction in the serum value of carbohydrate antigen 19.9 and cancer embryonic antigen, gene expression values of matrix metalloproteinase-9, and vascular endothelial growth factor A. Histopathological study showed almost restoration of colonic features with a lesser extent of epithelial lining and crypt dysplasia. Conclusion: The present study findings demonstrate that capecitabine-loaded bilosomes possess high anti-tumor activity against colorectal cancer.
Keywords:
nanosized vesicles
; ultradeformable bilosomes
; bile salts
; capecitabine
; colorectal cancer
; histopathology
1. Introduction
Cancer develops when cells in one area of the body multiply rapidly and uncontrollably [1]. Malignant cells can invade and destroy adjacent healthy tissue. After breast and lung cancer, colorectal cancer (CRC) is the third most frequent type of cancer worldwide and the third leading cause of cancer-related death [2]. Worldwide, about 1 million new instances of CRC are identified in both men and women each year. Out-of-control development in the colon, rectum, or cecum is its hallmark. In CRC, a cell from an adenomatous polyp acquires the malignant characteristics of uncontrolled growth, invasion of nearby organs, and metastasis due to accumulating genetic alterations in the colon [3]. CRC continues to be a condition with high morbidity and mortality despite improvements in prognosis and treatment [4]. Early-stage CRC detection and treatment with appropriate medication play a critical role in reducing CRC spread. A prodrug of 5-fluorouracil (5-FU), capecitabine (CAP), inhibits thymidine synthesis and causes apoptosis. After consumption, the thymidine phosphorylase enzyme in tumor tissue converts CAP to 5-FU [5]. Compared to infusional FU, CAP is safer and has far fewer adverse effects, such as nausea, diarrhea, and alopecia. Myocardial infarction, hand-foot syndrome, angina, anemia, thrombocytopenia, and hyperbilirubinemia are among the negative effects of taking CAP in a traditional dosage form [6]. Rapid 5-FU clearance from the bloodstream also lowers CAP levels at the tumor site, thereby reducing therapeutic efficacy and, occasionally, causing severe side effects [7].
CAP is a class I drug with an extremely short half-life (38-45 min), so it must be administered more often. To overcome the above problems, various nanosystems have been developed, including niosomes, liposomes, virosomes, transferosomes, bilosomes, ethosomes, microspheres, nanoparticles (NPs), and polymeric micelles [8]. The benefits of nanosized vesicular systems include prolonged drug existence in the systemic circulation, decreased drug toxicity (the drug is delivered directly to the site of action), increased bioavailability (particularly for poorly water-soluble drugs), the ability to encapsulate hydrophilic and hydrophobic drugs, and protection of the entrapped moieties from metabolism with sustained drug action [9]. Bilosomes (membrane stabilized bile salts) are one of the most important vesicular systems that address the limitations of other NPs as degradation in the gastrointestinal tract and limited permeability through the gastrointestinal membrane. This is due to the presence of bile salts like sodium deoxycholate (SDC) as major component into the bilosomes. SDC helps enhance membrane permeability, protect active ingredients from natural bile salts, decrease leakage, and prolong their presence in the GIT by sticking to intestinal mucus. This process offers a solution to the issue of short half-life [10].
Among these biomarkers, crucial in diagnosis, prognosis, and treatments of CRC, are CEA, CA 19.9, MMP-9, and VEGF A. CEA is a glycoprotein generated during the embryonic stage, and its creation stops after birth. Hence, its concentration in serum is low and increases significantly during the development of cancer in adults, as cancer cells secrete CEA [11]. CEA is considered the common diagnostic marker for colorectal cancer in humans [12]. In addition, CA-19-9 has been identified as another important marker for colorectal cancer [13]. CA19.9 is a glycoprotein linked to the Lewis antigen found in red blood cells and produced by the pancreas in healthy individuals, colon, biliary duct, gastric, endometrial, and salivary epithelial [14]. The merging of CEA and CA 19.9 leads to a more precise biomarker. for colorectal cancer [15]. MMPs are a family that can be ordered into several groups, including gelatinase, collagenase, matrilysin, and stromelysin. It is a zinc-dependent endopeptidase with more than twenty different members [16]. MMP-9 is extensively studied among MMPs and is a crucial enzyme that has a significant impact on numerous biological functions [17]. MMP-9 is involved in many biological processes due to its proteolytic activity in the extracellular environment, including the degradation of the extracellular matrix and the cleavage of cell-surface proteins [18]. MMP-9 is considered a potential biomarker for many cancers and plays an important role in diagnosis, monitoring, and disease treatment [19]. VEGF is an angiogenic growth factor that plays a vital role in mitogenesis and permeability. It regulates angiogenesis and vasculogenesis and plays a vital role in studies of tumor pathogenesis [20]. VEGF-A is a member of the VEGF family and plays an important role in regulating angiogenesis and vasculogenesis, and is the most widely used member in studies of tumor progression [20].
This study aims to prepare capecitabine nanosized bilosomes (CAP-NBLs) to overcome the side effects associated with conventional dosage forms, provide a sustained-release formulation with enhanced permeability, and enhance the anticancer effect against colon cancer. The assessment of anticancer activity of CAP-NBLs is measured using specific biomarkers, which are the most important vital techniques in diagnosis, prognosis, treatment, response, and personalized medicine, especially in cancer. They also help predict disease outcomes and facilitate the development of personalized treatment plans [21].
2. Materials and Methods
2.1. Material
Sodium deoxycholate, capecitabine, and cholesterol were bought from Sigma-Aldrich Company (St. Louis, USA). Egg yolk-derived phosphatidylcholine (PC) with a concentration of around 60%, confirmed through thin layer chromatography (TLC), was obtained from Navi Mumbai in India through Advent Chembio Pvt. Ltd. El-Nasr Co for intermediate Chemicals Co., Egypt, provided sorbitan monostearate (Span 60), CHCL3, diethyl ether, Na2HPO4, and KH2PO4. Visking dialysis tubing made of regenerated cellulose, with a diameter of 21 mm and a molecular weight cutoff from 12,000 to 14,000 Da, were purchased from Germany through Serva Electrophoresis GmbH Company located in Heidelberg. Each alternate chemical or reagent utilized was of analytical quality and employed without additional refinement.
2.2. Design and Preparation of CAP-NBLs
Nine CAP-NBL formulations were designed using a central composite design employing response surface methodology, and he outcomes of the experiments were assessed using Design-Expert® software version 13.0.5.0 by Stat-Ease, Inc. located in Minneapolis, MN, USA [22]. Span 60 concentration (A) and sorbitol amount (B) were selected as the independent variables. % entrapment (EE%), vesicle size (VS), and CAP cumulative % released at 24 hr were chosen as the dependent responses. Table 1 lists the suggested design. A slightly modified reverse-phase evaporation methodology was used to prepare CAP-NBLs. In a round-bottom flask (100 mL), a mixture of PC (100 mg), cholesterol (25 mg), and different levels of Span 60 was dissolved in a combination of chloroform and diethyl ether (1:1 v/v) using a hotplate/magnetic stirrer (Stuart UC152, Breckland Scientific Co., UK), forming the non-aqueous phase. A water-based solution containing CAP (10 mg) and SDC in varying ratios was slowly added to the lipid mixture while being stirred on a magnetic stirrer at 3,000 rpm, with a ratio of (1:3) of the organic mixture. Then for twenty min the mixture was sonicated until a milky w/o emulsion formed. The organic phase was vacuum-vaporized by a rotary evaporator for 30 min (Heidolph Instruments, Heidolph digital, GmbH & Co., Germany).
The final volume of the mixture was then adjusted by adding distilled water (the continuous phase) with stirring for an extra 10 min to complete the hydration. A homogenizer (high pressure) (IKA, T25, digital, Vietnam) was used to homogenize the crude dispersion for 10 min at 10,000 rpm to reduce particle size to the nanoscale. Next, ultra-sonication was carried out with an ultrasonic probe sonicator (Sonics & Materials Inc., VCX 750, USA) for ten minutes in a chilled environment at an intensity level of 40%, alternating between being on for 59 s and off for 5 s. Until they were further characterized, the bilosomal dispersions were kept in a refrigerator at 4 °C [23]. Nine different formulations with different components were prepared (Table 1). The effects of Span 60 and bile salt concentrations on the physicochemical characteristics of the bilosomal formulations were evaluated.
2.3. CAP-NBLs Characterization
2.3.1. Assessments of Vesicle Size (VS), Polydispersity Index (PDI), and Zeta Potential (ZP)
Using a Malvern Zetasizer (Ultra-red label, Malvern, UK) at 25 ± 2 °C, VS, PDI, and ZP can be measured. The apparatus has a 90° scattering angle, a 120 s equilibration period, and a backscatter detection angle. To create a dispersion with a sufficient level of light scattering, 1 mL of CAP-NBLs dispersion was thinned with 10 mL of deionized water in a glass tube, then sonicated for ten min. Every measurement was done three times [24]. The mean ± (SD) was employed to display the data.
2.3.2. Estimation of Drug Content
An accurate volume (1 mL) of each formula (# 5 mg) of CAP was dissolved in ethyl alcohol, and the obtained solution was analyzed for CAP amount spectrophotometrically at 301 nm using a double-beam spectrophotometer (Shimadzu 1601 Co., Japan) [25]. The drug content was determined from the following equation.
2.3.3. Entrapment Efficiency Percentage (EE%)
Centrifugation/ultrafiltration was used to remove free CAP from CAP-NBLs to calculate the EE% [26]. Deionized water was used to dilute 1 mL of freshly prepared CAP-NBLs to 10 mL. To achieve effective separation, the diluted solution (3 mL) was transferred to a Micro Ultra centrifuge tube (3000 M.wt. cutoff) (Millipore, USA) and centrifuged at 8,000 rpm for thirty min at 4 °C using a Centurion cooling centrifuge (K241R Pro, Scientific Laboratory Supplies, UK). The free CAP amount in the filtrate was measured spectrophotometrically at 301 nm by a UV-visible spectrophotometer, relative to deionized water [27]. The amount of free CAP was then subtracted from the initial amount, and the following equation was employed to assess EE%.
2.3.4. Yield Percentage
The subsequent equation was employed to calculate % of CAP yield after lyophilization of the prepared CAP-NBLs [28].
2.3.5. In Vitro Release Study of CAP
The cumulative % of in vitro release of CAP-NBLs and unloaded CAP as a reference was measured utilizing a shaking horizontal water bath and the dialysis bag technique in SGF and SIF [23]. First, a dialysis bag made of a semipermeable cellophane membrane with a diameter of 21 mm (12,000–14,000 Da MWT cutoff) was filled with CAP-NBLs (equivalent to 5 mg CAP) and knotted at both ends with cotton threads. The dialysis bag was immersed in distilled water for the whole night before the procedures began. The systems were kept at a temperature of 37 ± 0.5 degrees Celsius, and the dialysis pouch was placed in a 250 mL container filled with 100 mL of SIF (phosphate buffer, pH 6.8, without enzymes). To verify the sink condition, a (5 mL) sample of release medium was substituted with an equal amount of fresh phosphate buffer after 1, 2, 4, 6, 8, 10, 12, and 24 hr from the start. Using phosphate buffer, pH 6.8 as a blank, the amount of CAP released was determined spectrophotometrically at 301 nm. The average values were shown as in vitro total CAP % release over time (n=3). Second, for further investigation, the in vitro release % of CAP-NBLs and CAP solution was evaluated in SGF (enzyme-free, solution of HCl, pH of 1.2) for two hr [23].
Various kinetic equations, such as zero-order (cumulative % left vs. time), first-order (log % substance left vs. time), Higuchi-diffusion model (cumulative % substance discharged vs. square root of time), and Korsmeyer-Peppas model (log % substance discharged vs. log time), were used to analyze the in vitro release data of CAP-NBLs, to comprehend the kinetics and mechanism of drug release. The straight line generated from analyzing the in vitro release data was utilized to determine the correlation coefficient (R2) for various kinetic models and the release exponent (n) values for the Korsmeyer-Peppas model [29].
2.4. The Optimized CAP-NBLs Characterization
2.4.1. Stability of CAP-NBLs
For six months at 4 ± 0.5 °C and room temperature, the optimized CAP-NBLs formulation was kept in vials (airproof, dry, clean, borosilicate dark-colored). The VS and EE% were examined and contrasted with the corresponding characteristics of the stored formulation at time zero. Each test was performed 3 times, and the mean ± SD was recorded [2].
2.4.2. CAP-NBLs Morphology
The morphological characteristics and particle size of the optimized CAP-NBLs were evaluated by JEOL JEM-2100 Plus transmission electron microscopy operating at 200 kV. Uranyl acetate was used to stain the chosen recipe. Before TEM scanning and visualization, the sample was dehydrated on the grid coated with carbon for 10 min at ambient temperature to produce a slender layer. Lastly, photos are captured at the proper magnification [30].
2.4.3. Differential Scanning Calorimetry (DSC) Study
The Pyris 6 thermal analysis machine from PerkinElmer in Waltham, MA was employed to examine how CAP, SDC, cholesterol, Span 60, egg yolk PC, and the improved CAP-NBLs react to heat, to detect any alterations in the structure of CAP when enclosed in the biosomes dispersion. The standard aluminum pans were then filled with the sample (2 mg) and heated from 30 °C to 300 °C at 10 °C/min [31,32].
2.4.5. Attenuated Total Reflectance-Fourier Transform Infrared (ATR-FTIR) Spectroscopy
The possible chemical interactions between CAP and bilosomes components can be detected by ATR-FTIR. Using an IR vortex spectrophotometer (Bruker, Germany) connected to an ATR platinum diamond (an internal reflector diamond disc) with 3500–500 cm-1 frequency, 2.4 refractive index, and 4 cm-1 resolution, the ATR-FTIR spectra of all samples were investigated [8,33].
2.4.6. X-Ray Diffraction Pattern (XRD) Study
XRD was utilized to examine how encapsulation impacted the crystalline characteristics of the CAP powder. A diffractogram of CAP, SDC, cholesterol, Span 60, PC, and the optimized CAP-NBLs was recorded using an advanced X-ray diffractometer (Bruker instrument, D8, XRD, Japan) with the help of a radiation detector (monochromatized Cu Ka) with a wavelength (λ = 1.54056 Å) operating at 40 kV and 40 mA to obtain two theta levels of 5° and 70° [34,35].
2.4.7. Ex Vivo Permeation Assessment of CAP
Everted gut sac methodology was utilized, with minor modifications, to test both the CAP solution and the optimized CAP-NBLs to examine intestinal permeability of CAP from the optimized CAP-NBLs. After being fixed for the entire night and given diethyl ether anesthesia, the rats were sacrificed by cervical dislocation. After the small intestine was surgically removed, a 5 cm segment was cut and washed in normal saline to remove any remaining food particles. Using a smooth glass rod, the detached intestinal portion was turned over and given normal saline (2 mL) [36].
The extended gut pouch holding 10,000 μg of CAP, dispersed throughout the contained media, was placed in normal saline (50 mL) at 37 ± 0.5 °C, and the gut was supplied with 5% CO2 and 95% O2 [37]. 1mL samples of the receptor compartment were removed at predetermined intervals (5, 10, 15, 30, 45, 60, 90, and 120 min) to determine the amount of CAP penetrated following appropriate dilution. A 0.45 μm pore size syringe filter was used to filter the withdrawn aliquots, and chromatographic analysis at 303 nm was used to assess the CAP concentration of either pure CAP solution or CAP-NBLs that had passed through the intestine [38].
Three trials were carried out. The cumulative % of CAP permeated from the CAP solution and the optimized CAP-NBLs was estimated and plotted vs time (hr). The APC (apparent permeability coefficient, cm/min) of CAP solution and CAP-NBLs, and the ER (enhancement ratio) were calculated from the provided formulas [23].
where Q: the CAP cumulative amount permeated (µg), C0: the initial CAP concentration (µg/mL), A: the surface area (cm2) of the intestinal sac, and t: the time period (min).
2.5. In Vivo Experiments
2.5.1. Animals
The animal studies followed the ARRIVE guidelines and were authorized by the animal ethics committee at Zagazig University (ZU-IACUC), ZU-IACUC/3/F/308/2026, Approval number The experiments followed the regulations of the UK Animals (Scientific Procedures) Act, 1986, EU Directive 2010/63/EU, and the NIH Guide for the Care and Use of Laboratory Animals (NIH Publications No. 8023, revised 1978). Male Wistar rats (average weight =150 gm) and healthy New Zealand rabbits (average weight = 2.25 kg) were obtained from the faculty of veterinary medicine, Suez Canal University, Ismailia, Egypt. All animals were kept in a controlled environment (temperature, 20–22 °C; humidity, 50 ± 5%; night/day cycle, 12 hr) with standard diet pellets and sterile water.
2.5.2. Pharmacokinetic Studies
The animals were split into three groups (n = 6). Groups B and C were the tested groups, while group A served as the control and received only normal saline. Group B received a 10 mg/kg dosage of pure CAP solution by oral gavage, while group C received CAP-NBLs at the same dose level. After properly handling the rabbits, blood samples (0.5 mL) were drawn after 1, 2, 3, 4, 6, 8, 10, and 12 hr from the ear vein. The samples were then stored in heparin-coated microcentrifuge tubes and centrifuged (Primo Heraeus, Biofuge, Germany) at 4,000 rpm for 15 min to separate plasma. The resulting plasma samples were stored at ˗ 20 °C for further CAP analysis. An HPLC system from Jasco Co. in Japan, featuring a dual pump and a UV detector model SPD-10A, was utilized for the chromatographic examination. A C-18 column (250 mm × 4.6 mm) served as the stationary phase, and a 50:50 v/v mixture of distilled water and acetonitrile (HPLC grade) served as the mobile phase. The run time was 15 min, and the lambda max was set at 303 nm. For 20 µL of the injected sample, the pump’s flow rate was 1 mL/min [39]. The Microsoft Excel program was then used to examine several pharmacokinetic parameters (PKPs), The results were presented using the mean ± standard deviation for various parameters such as the area beneath the curve (AUC), maximum plasma level (Cmax), time taken to reach maximum plasma level (tmax), elimination rate constant (Kel), and mean residence time (MRT).
2.5.3. Animal Experiments
Ninety male Wistar rats in good health were distributed randomly into six bunches, with each bunch containing 15 rats after a 2-week adaptation period. Animals in bunches 1 and 2 were not exposed to any carcinogenic materials. They received 0.5%, w/v sodium CMC-Na in water and blank biosomes every day by oral route during the experimental period, and were considered as the negative control groups. A single injection of DMH (20 mg/kg, subcutaneously) for four weeks, twice weekly, was administered to animals in bunches 3, 4, 5, and 6 to enhance the cancer-causing impact of DMH [40]. Animals in bunches 3 and 4 were administered a mixture of (CMC-Na) in water (0.5%, w/v) and empty vesicles individually via oral gavage each day, starting two weeks post the final DMH dosage throughout the experiment, and were considered as positive control groups. Animals in bunch 5 were taken capecitabine (200 mg/kg body weight) dissolved in a solution of (CMC-Na) in water (0.5%, w/v) daily by oral gavage for 8 weeks [41]. Animals in bunch 6 were given an equal amount of CAP from CAP-NBLs for 8 weeks, as shown in bunch 5.
2.5.3.1. Serum Specimen Collection
Blood samples were obtained from the lateral tail vein of animals using needle canulation after 12 hr fasting interval following the latter dosage, and for coagulation of blood samples, wait for 20 min and then centrifuged the sample at 4,000 rpm at 4 °C for 15 min using a Beckman show cooling centrifuge (Waltham, L3-50, MA, USA). The serum was collected and frozen at ˗ 80 °C [42].
2.5.3.2. Tissue Specimen
After cervical dislocation of rats under anesthesia using compressed CO2 gas in a cylinder, which slows the inflow of gas to the induction chamber, the colon was over washed with phosphate-buffered saline solution, then wiped with tissue paper cut in half. The first part was frozen at ˗ 80 °C for later analysis by real-time polymerase chain reaction. The second part was kept in 10% formalin for histopathological examination [43].
2.5.3.4. Detection of MMP-9 and VEGF A by Real-Time Polymerase Chain Reaction (RT-PCR).
The primers were acquired from Vivantis Technologies in Malaysia, and the reference sequences from NCBI were utilized to create the primers.
MMP-9 forward Tm = 60 °C: 5’-TCGGATGGTTATCGCTGGTG-3’.
MMP-9 reverse Tm = 60 °C: 5’-GCCACGACCATACAGATGCT-3’.
VEGF A forward Tm = 60 °C: 5’-CCAGGACCTGAATTCCCAGC-3’.
VEGF A reverse Tm = 60 °C: 5’-ACTCCCTAATCTTCCGGGCT-3’.
β-actin forward Tm = 60 °C: 5’-CCCGCGAGTACAACCTTCTT-3’.
β-actin reverse Tm = 60 °C: 5’-AACACAGCCTGGATGGCTAC-3’.
2.5.3.5. Assessment of Colon Biomarkers
Serum levels of both CA 19.9 and CEA were assessed using an enzyme-linked immunosorbent assay kit provided by Glory Science. (Hangzhou, China) [46].
2.5.3.6. Histopathological Evaluation
The tissues of the colon were preserved in formalin (10%, v/v) solution and subjected to a series of washes by ethanol for dehydration. Afterward, the specimens underwent xylene treatment, were immersed in paraffin at 56 °C using a hot-air oven for a full day, and then sliced into 4-5 µm segments. The sections were dyed using hematoxylin and eosin (H&E) and scrutinized under a light microscope (Olympus, USA) by a histopathologist who was unaware to the intervention [47].
2.6. Statistical Analysis
One-way analysis of variance (ANOVA) was used to statistically analyze the following data: EE%, PS, ZP, drug content, and cumulative % CAP amount released after 24 hr, data presented as means ± SD. Statistical data analysis was conducted using GraphPad Prism version 5.0 (GraphPad, San Diego, USA). Tukey’s t-test and analysis of variance were used to compare groups. A p-value of less than 0.05 was chosen as the significance level, and all pertinent findings were presented graphically as means ± SD.
3. Results and Discussion
3.1. Preparation of CAP-NBLs
Reversed-phase: The evaporation followed by ultrasound (ultrasonication) was used to prepare the CAP-NBLs. Primary practical trials were performed to investigate the effects of varying the amounts of Span 60 and SDC on the size of the vesicle and EE%. The trial showed that increasing the Span 60/cholesterol ratio to 5:1 (%, w/w) decreased vesicle size and increased EE%, consistent with previous studies [48]. The trial showed that an increase in SDC by more than 15%, w/w markedly increased vesicle size and decreased EE%. Accordingly, we used Span 60/cholesterol ratios of 5:1, 4:1, and 3:1, and SDC at three levels below 15%, w/w.
3.2. Vesicle Size, PDI, and ZP
The mean VS of the CAP-NBLs ranged from 220.32 ± 1.39 to 412.45 ± 3.59 nm; the data are shown in Table 2. Increasing the concentration of Span 60 typically results in smaller bilosomal vesicles. Increased surfactant concentrations stabilize the vesicles and lessen vesicle aggregation. PDI values range from 0.139 to 0.422, suggesting uniform vesicle spreading, as shown in Table 2. The ZP values of all CAP-NBLs ranged between −32.6 ± 2.92 and −41.1 ± 1.18 mV. Figure 1 displays the ZP of the optimized CAP-NBLs (Table 2). For optimal stabilization and to avoid vesicle aggregation, a theoretical ZP value of ± 30 mV is crucial [49]. Because bile salts have anionic properties due to the abundance of negatively charged groups in their structures, SDC significantly increases the negative ZP values [50].
3.3. Drug Content
The drug content evaluation showed that the CAP amount in the formulated CAP-NBLs ranged from 85.56 ± 2.58 to 98.2 ± 3.02% (Table 2). The drug content analysis of the CAP-NBLs demonstrated efficient incorporation of CAP. This outcome highlights the suitability of Span 60, SDC, and the used excipient for co-delivery of CAP-NBL systems [51].
3.4. EE%
The EE% of the fabricated CAP-NBLs formulations is shown in Figure 1. The EE% values of CAP-NBLs varied from 59.44 ± 1.12 to 87.66 ± 1.11%, indicating a little amount of drug loss during formulation and effective drug encapsulation in the bilosomal nanosystem [52]. The following can be used to explain the phenomenon. First, the negative charge of the vesicle contributes to a significant repulsive force caused by the anionic nature of bile salts, which increases the size of the inner core of the bilosomes. Consequently, the bilosomes effectively trap hydrophilic drugs. Compared to other bile salts, the lower HLB value of SDC (16) makes it less hydrophilic and acts as a barrier, preventing the drug from leakage from the bilosomes. Furthermore, SDC can integrate into the bilayer membrane due to its surface-active properties, thereby increasing the membrane’s flexibility and the drug’s solubility. As a result, the EE rises [53]. Thirdly, compared with thin-film hydration methods, the drug encapsulation efficiency was significantly higher with the reversed-phase evaporation method [54]. Fourth, it was found that PC and cholesterol, when combined to form nanobilosomes, increased the % of EE of nanobilosomal vesicles as cholesterol increases the stiffness and viscosity [55]. Examining the impact of surfactant concentration on EE, the results showed that surfactant concentration significantly affected EE% (p < 0.0001), with EE% increasing as surfactant concentration increased. Additionally, the amount of bile salt negatively affected EE%; increasing the amount of bile salt results in a decrease in EE% [56]. This problem arises when the vesicle’s lipid bilayer becomes overly fluid, allowing the drug to leak. Additionally, increased bile salt levels are linked to the formation of holes in the bilosomal membrane, which have been shown to possess a lower drug-loading efficiency than the initial vesicles [57].
3.5. Yield Percentage
3.6. In Vitro Release Studies
The in vitro release of CAP-NBLs in phosphate buffer at pH 6.8 is shown in Figure 2. The data showed that all CAP-NBLs exhibited a sustained release pattern compared to pure CAP. Also, CAP. Also, as the concentration of Span 60 increased, the cumulative % of CAP release decreased from 59.6 ± 1.2% (CAPB1) to 47.33 ± 1.56% (CAPB5). The transition temperature of Span 60 is high (Tc). Increasing its concentration often results in a bilayer or surface that is less permeable and stiffer, thereby preventing the medication from diffusing [59]. Increased surfactant concentrations can make the formulation more viscous or cause more stable vesicles to form, thereby better retaining the drug and slowing its release into the release media [60], and on the other hand, increasing the amount of SDC results in increased cumulative percent release, as illustrated by the increase from 49.32 ± 1.35% (CAPB6) to 53.31 ± 2.45% (CAPB9). This effect may be attributed to both SDC’s permeability-enhancing property and its impact on fluidity, which increases the bilayer fluidity and permits drug release [61].
Secondly, the optimized CAP-NBLs were used for in vitro release studies in SGF for a duration of 2 hr. Using pure CAP as a reference, the data are illustrated in the Supplementary material, Figure S1. The cumulative % drug release was lower than that after 2 hr in the case of SIF. This can be attributed to CAP’s weakly acidic properties, with a pKa of 8.8, which means it is highly soluble at higher pH values and less soluble at lower pH values [62]. However, all CAP-NBLs exhibit sustained release at pH 1.2, indicating that they are stable under GIT conditions [23].
3.7. Mathematical Modeling of In Vitro Drug Release
All CAP-NBLs followed a Higuchi-diffusion model as indicated by the highest (R2) value. Regarding the formulation of CAPB1, CAPB2, CAPB3, CAPB4, CAPB6, CAPB8, and CAPB9, the exponents (n) were less than 0.45, proving that the Fickian mechanism is the main mechanism governing the release of CAP from these formulations [63]. For the formulations coded with CAPB3, CAPB5, and CAPB7, the exponents (n) were more than 0.45, proving that the non-Fickian (anomalous) mechanism is the main mechanism that controls the CAP release from these CAP-NBLs formulations (Table 3).
3.8. Effect of the Independent Variables of CAP-NBLs on the Selected Responses
The response surface methodology was used to study the effect of Span 60 amount (X1: A) and SDC content (X2: B) on EE% of CAP (Y1), vesicle size (VS), Y2, and cumulative % CAP released at 24 hr (Y3). The independent variables and the responses were modeled using second-order (quadratic) equations to demonstrate their relationship. The quadratic equation allows the evaluation of the combined and individual effects of the independent variables on the measured dependent variables (Y1, Y2, and Y3).
This model determines how each part, alone or in combination, affects results Y1, Y2, and Y3. When the coefficients are positive, the factors work well together; when they’re negative, they tend to cancel each other out. We consider coefficients with a p-value less than 0.05 to be statistically significant.
The following equations were obtained from the factorial design, demonstrating the effects of the variables on Y1, Y2, and Y3 for CAP.
Y1 (EE, %) = +35.12 + 0.4503 Span 60 – 0.2000 SDC
Y2 (VS, nm) = +555.9138 - 2.6282 Span 60 + 1.6807 SDC
Y3 (% drug released at 24 hr) = + 75.3600 + 0.26093 Span 60 + 0.1411 SDC
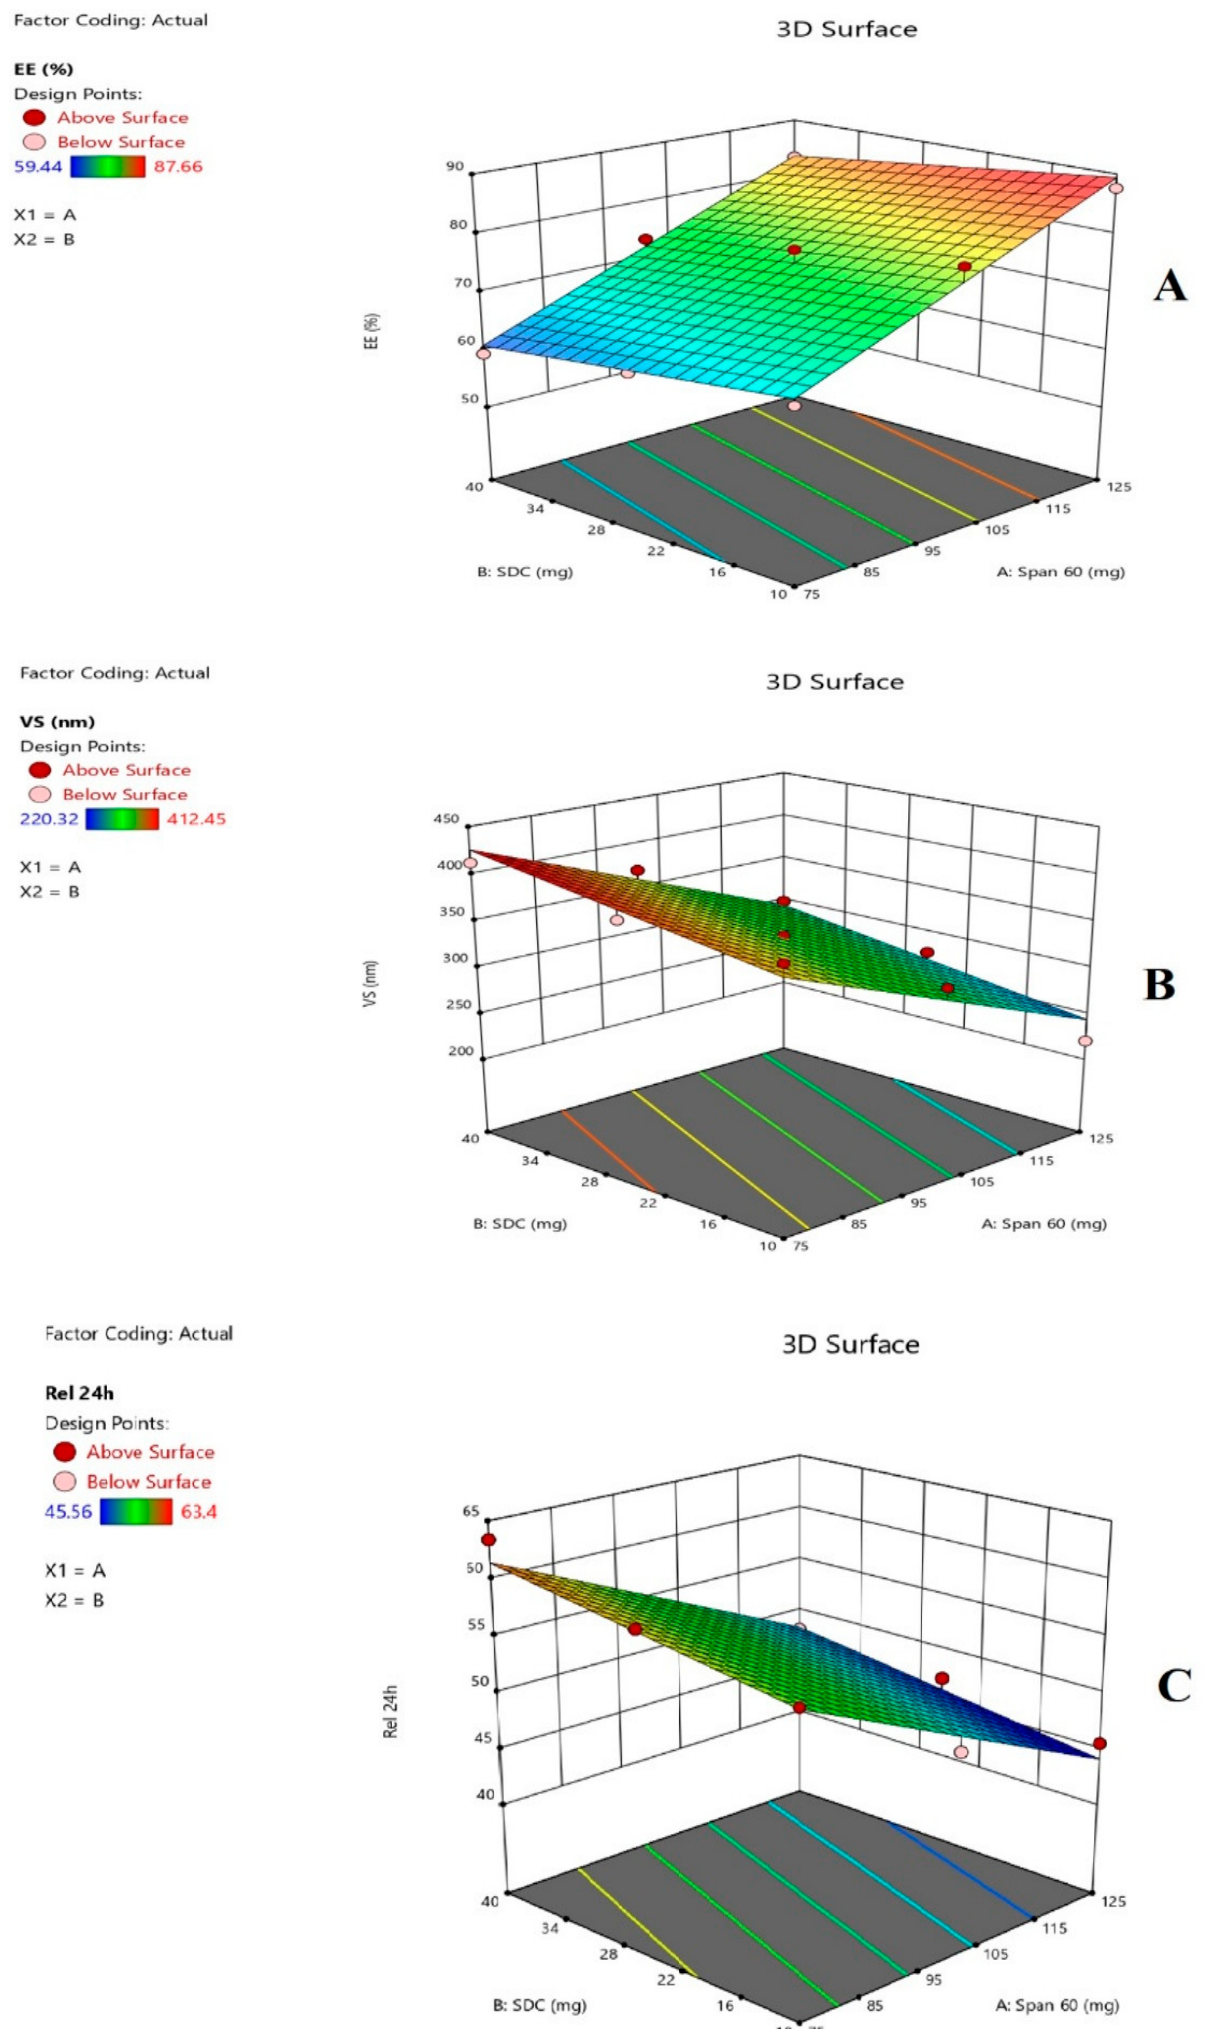
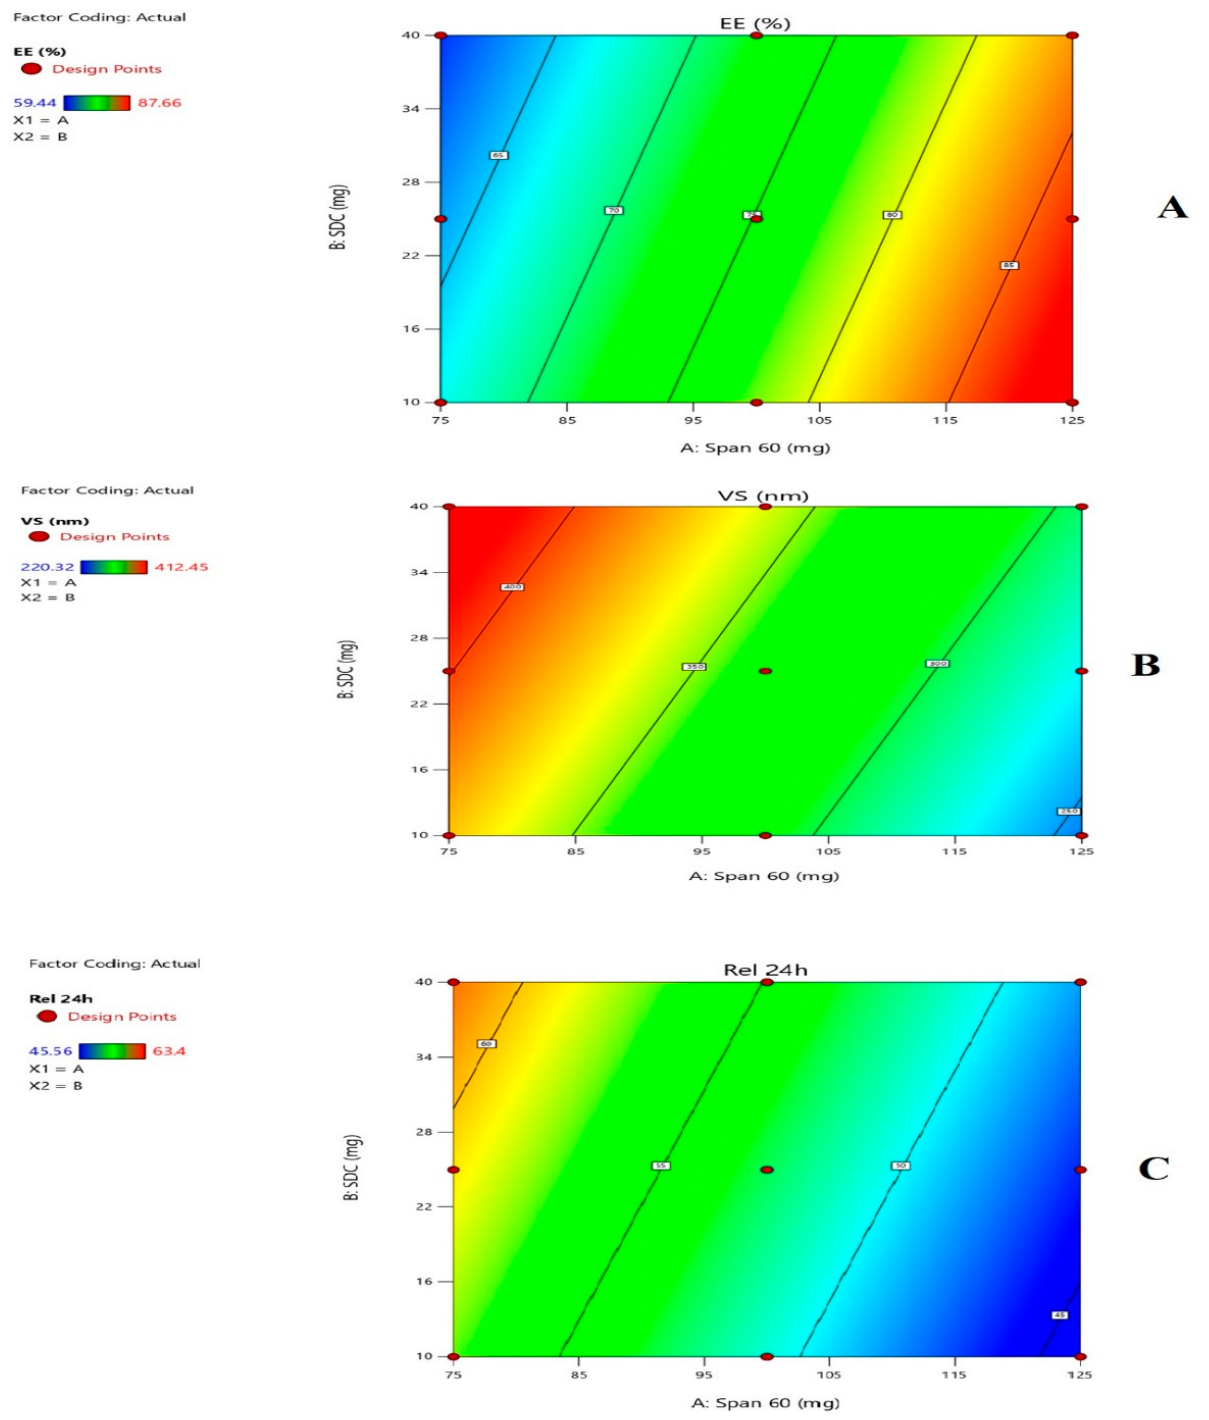
Span 60 (X1: A) had the most significant effect on increasing EE%, lowering VS, and cumulative % drug released after 24 hr as demonstrated from 3D response surface plots and the contour plots with higher positive coefficients, as it overcomes the critical significant value (p < 0.05) (Figure 4 and Figure 5). SDC (X2: A) had a significant effect on decreasing EE% and increasing VS and cumulative % released after 24 hr, as shown by the 3D response surface plots and the contour plots with higher positive coefficients. The significant impact of Span 60 and SDC on the dependent responses is confirmed by the ANOVA results, where the Span 60 (A) and SDC (B) show a highly significant F-value (116.24 for EE%, 65.46 for VS, and 60.5 for % released at 24 hr), indicating a strong influence on the responses (Supplementary materials, Tables S1-S3).
3.9. CAP-NBLs Optimization
The design software determines the optimal levels of the independent variables (Figure 6) based on the optimization results: 125 mg for A (Span 60 amount) and 10 mg for B (SDC amount), as listed in Table 4. Optimum CAP-NBLs were formulated and characterized for EE%, VS, and cumulative % drug released at 24 hr.
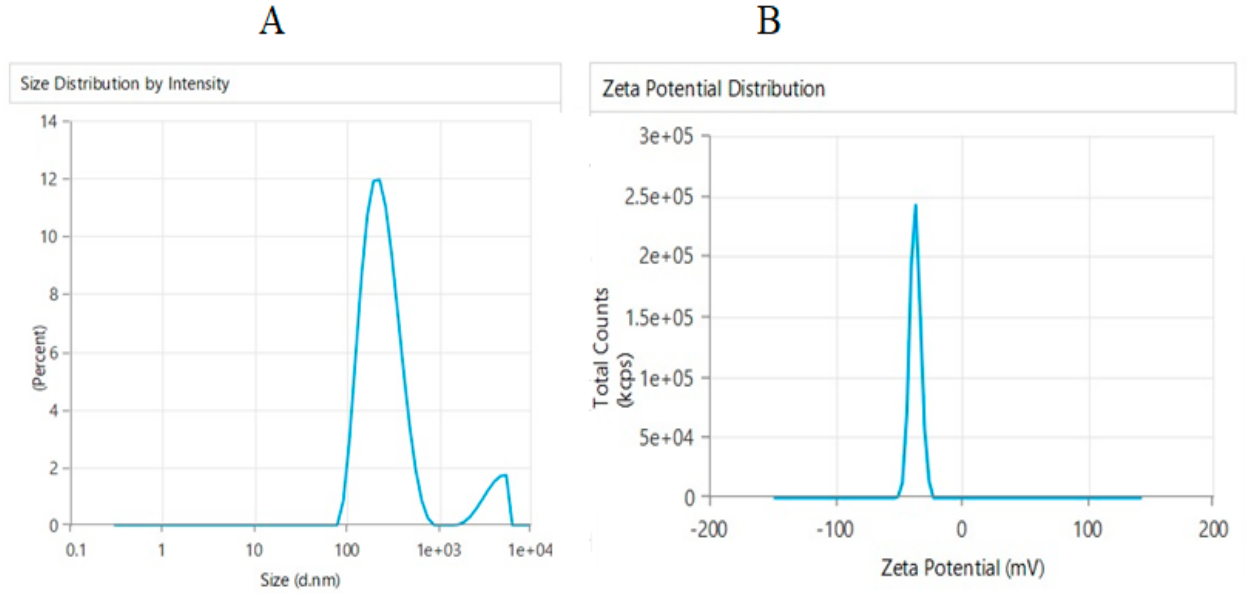
The data obtained showed that the optimized CAP-NBLs had a mean vesicle size of 243.35 ± 40.31 nm, a ZP value of –37.4 ± 2.18 (Figure 3A), and EE of 89.5 ± 2.33% and 43.8 ± 1.25% released after 24 hr (Figure 3B). Due to its close agreement with the predicted optimum and favorable CAP-NBLs formulation performance, this CAP-NBLs formulation was utilized for the subsequent characterization procedures.
Figure 3.
Particle size of the optimized CAP-NBLs (A) and its ZP (B).
3.10. Characterizations of the Optimized CAP-NBLs Formulation
3.10.1. Stability Studies
The data on VS and EE% for CAP-NBLs over 42 weeks are illustrated in Figure 7. When the optimized CAP-NBLs formula was kept at 25 ± 2 °C for 43 weeks, a significant rise (p < 0.05) in VS from 240 ± 17.42 nm to 430 ± 15.2 nm was observed. Yet, when kept at 4 ± 0.5 °C, CAP-NBLs stayed constant with no significant change in the VS after 42 weeks (247 ± 13.16 nm). The SDC negative charge is responsible for the stability of CAP-NBLs by preventing aggregation and fusion [64]. At 25 ± 2 °C, the EE% of CAP-NBLs was also decreased from 89.5 ± 2.33% to 46.11 ± 3.3%. During storage of the optimized CAP-NBLs at 4 ± 0.5, EE% was insignificantly decreased (Figure 7). At 25 ± 2 °C, CAP-NBLs possess an enhanced Brownian motion (collision of bilosomal particles) gained from the heat energy of the surroundings, leading to sticking together of the vesicles to form distorted bilosomal particles that are bigger in size and have a lower EE% [65]. Therefore, storing CAP-NBLs in cold temperatures is recommended to avoid merging and drug spillage during storage. The results obtained were consistent with those reported previously [52].
3.10.2. TEM Micrograph of CAP-NBLs
An essential method for examining the appearance and surface properties of the optimized CAP-NBL formulation is TEM. The micrographs of the optimized CAP-NBLs exhibited spherical-shaped vesicles in the nanoscale, devoid of any vesicular fusions (Figure 8), which aligns with the findings from the DLS analysis (Figure 3A). Furthermore, the absence of CAP crystals in TEM images indicates that CAP has completely changed to an amorphous rather than a crystalline state [66].
3.10.3. DSC
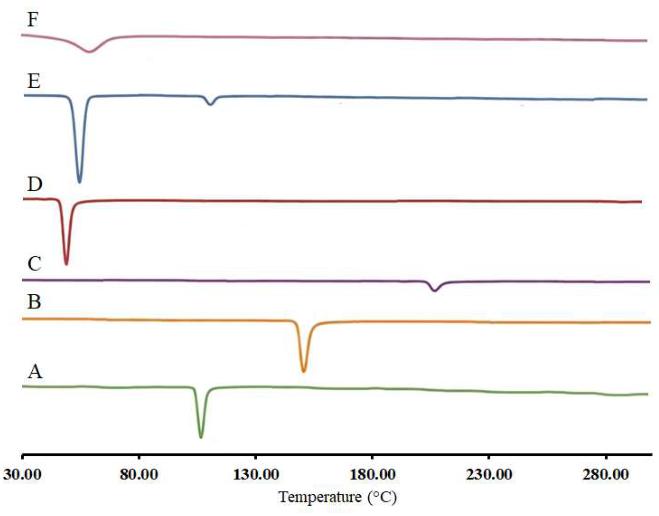
Figure 9 shows the DSC thermograms of CAP, Cholesterol, SDC, egg yolk PC, Span 60, and the optimized CAP-NBLs formulation. DSC study revealed the presence of pure CAP in a crystalline state. The DSC analysis confirms the crystalline character of CAP, which exhibits a characteristic melting endotherm at 115.25 °C (Figure 9A) [67]. Cholesterol showed an endothermic peak at 149.3 °C (Figure 9B) [68]. SDC showed a small broad peak at 214.27 °C (Figure 9C) [69]. Egg yolk PC showed a characteristic endothermic peak at 51.57 °C (Figure 9D) [70]. Span 60 displayed two endothermic peaks at temperatures of 56.12 °C and 121.39 °C (Figure 9E) [71]. The optimized CAPNBLs formulation showed a total absence of the characteristic peaks of CAP, which revealed that it was entirely enclosed within the fabricated vesicles (Figure 9F) [26].
Figure 4.
3D surface plots show how independent variables impact EE% (A) and VS (B)., and cumulative % drug released at 24 hr (C).
Figure 4.
3D surface plots show how independent variables impact EE% (A) and VS (B)., and cumulative % drug released at 24 hr (C).
3.10.4. ATR-FTIR
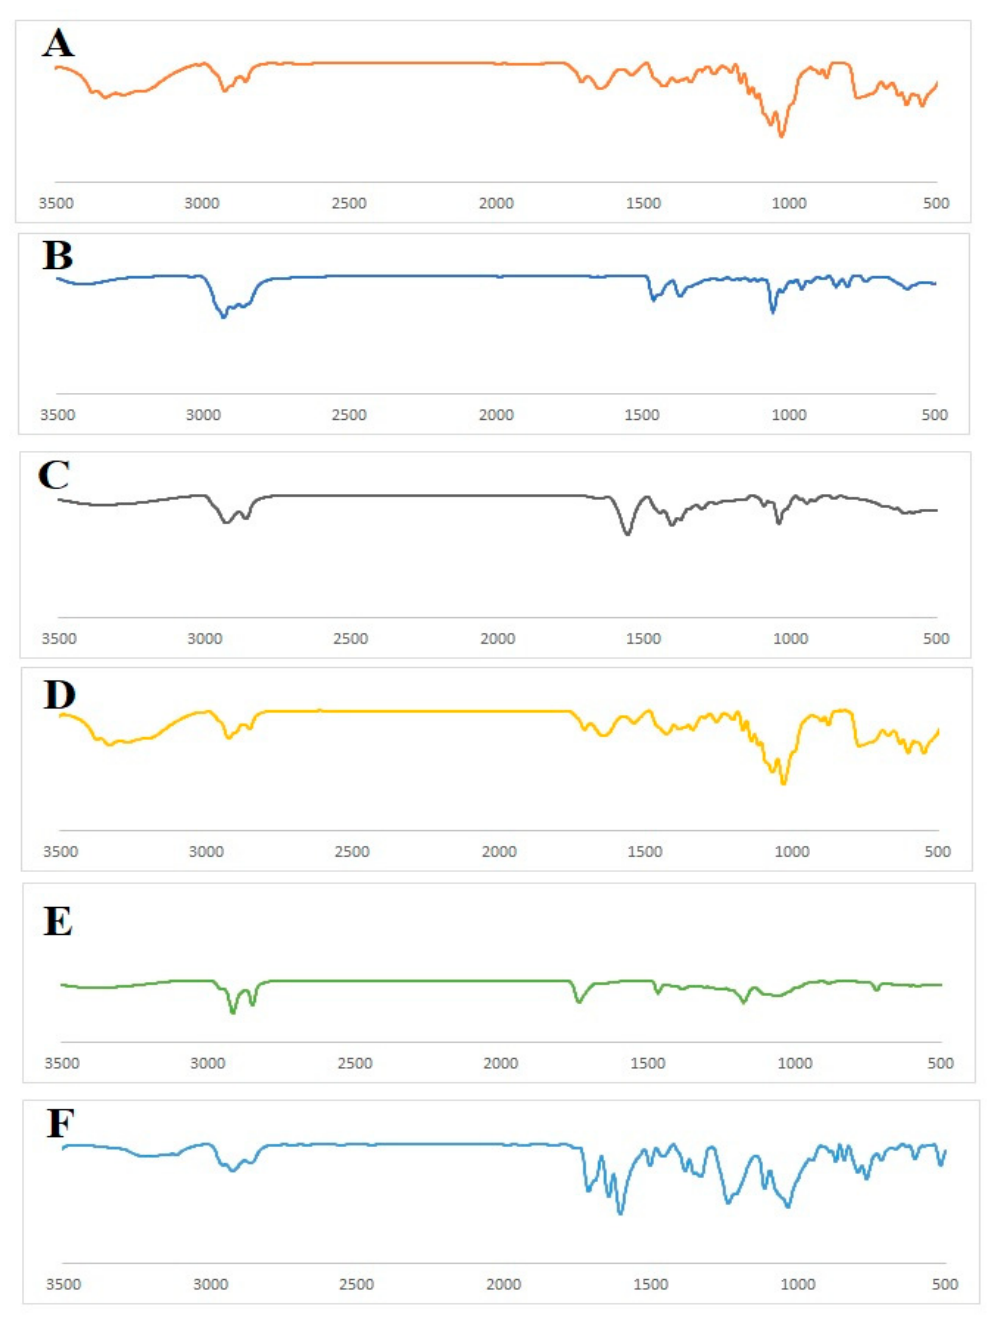
Figure 10 displays the ATR-FTIR spectra of the investigated samples. The ATR-FTIR spectra of pure CAP revealed a distinctive peak that included N-H stretching at 3523 cm-1, O-H stretching at 3242 cm-1, C-H stretching at 2926 cm-1, and C=O stretching at 1775 cm-1 [72]. Cholesterol’s ATR-FTIR spectra revealed prominent stretching vibration peaks for the –OH group at 3392.9 cm-1 and 2929.8 cm-1 for C–H stretching [73]. SDC’s ATR-FTIR spectra show both the alcoholic –OH group at 3338.3 cm-1 and asymmetric –CH3 stretching at 2929.5 cm-1 [74]. PC exhibits a broad peak at 3332.2 cm-1, indicating the existence of amine and alcoholic hydroxyl groups, along with the distinctive P-O group at 1735.4 cm-1 [75]. Conversely, Span 60 displays the ester carbonyl at 1735.4 cm-1 [76]. Additionally, the optimized CAP-NBLs showed all of the distinctive CAP absorption peaks with little variations in amplitude and intensity, highlighting the insignificant physicochemical interaction between the medication and excipients [51].
Figure 5.
Contour graphs predicting how independent variables impact the EE% (A), VS (B), and cumulative % drug released after 24 hr (C).
Figure 5.
Contour graphs predicting how independent variables impact the EE% (A), VS (B), and cumulative % drug released after 24 hr (C).
3.10.5. XRD
The drug’s crystalline nature was confirmed by XRD analysis, which showed that CAP exhibited diffraction peaks at 2θ values of 19.28°, 20.68°, 26.08°, and 28.3° [77]. Cholesterol peaks were observed at 13.9°, 16.8°, and 15.1° [78]. The peak of SDC is at 14.4° [79]. Additionally, Span 60 showed a high at 21.3° [80], while PC showed peaks at 12.4°, 16.3°, and 19.9° [81]. All of the CAP’s prominent peaks in the optimized CAP-NBL formulation faded, leaving only small, weak cholesterol peaks. This demonstrated that the drug was effectively loaded into the bilosomal vesicles and verified that it had completely changed from its crystalline to amorphous state, as shown in Figure 11 [82].
Figure 6.
The structure and the variables that rely on of the optimized CAP-NBLs.
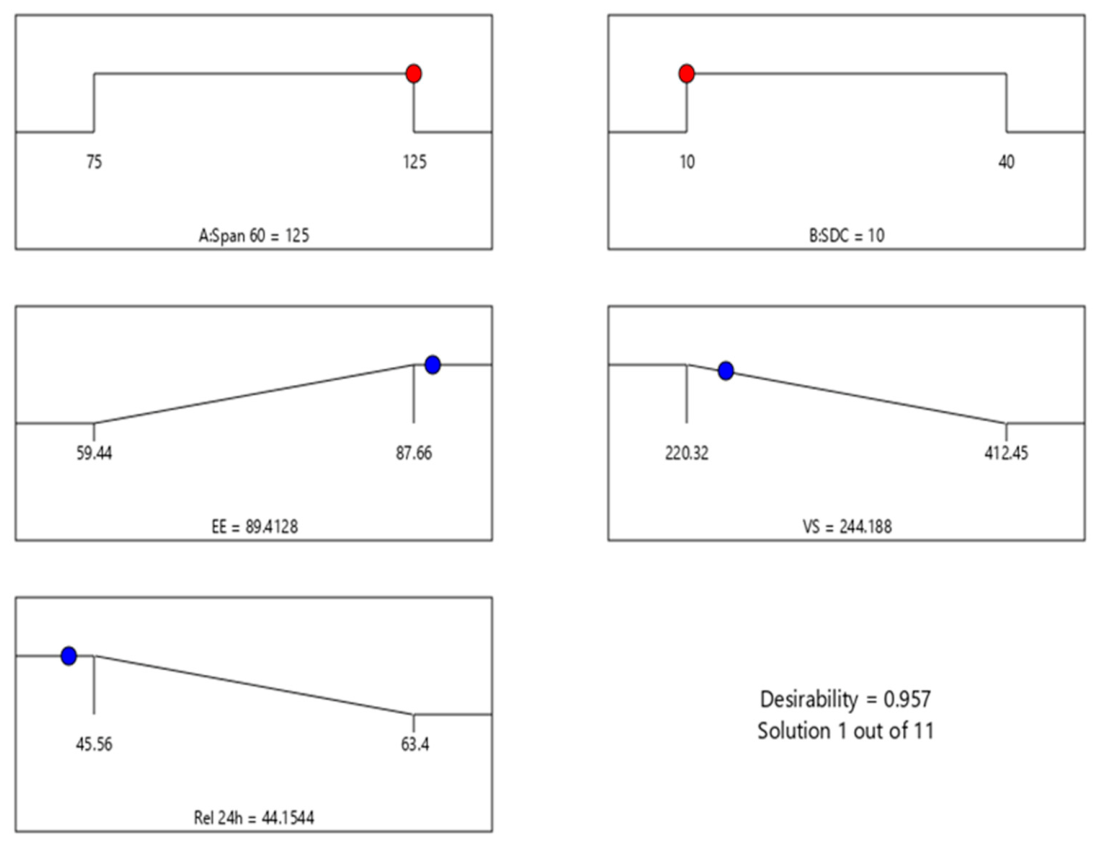
Figure 7.
Stability profiles of the optimized CAP-NBLs formulation stored at 4 °C and 25 °C for 42 months (mean ± SD, n = 3).
Figure 7.
Stability profiles of the optimized CAP-NBLs formulation stored at 4 °C and 25 °C for 42 months (mean ± SD, n = 3).
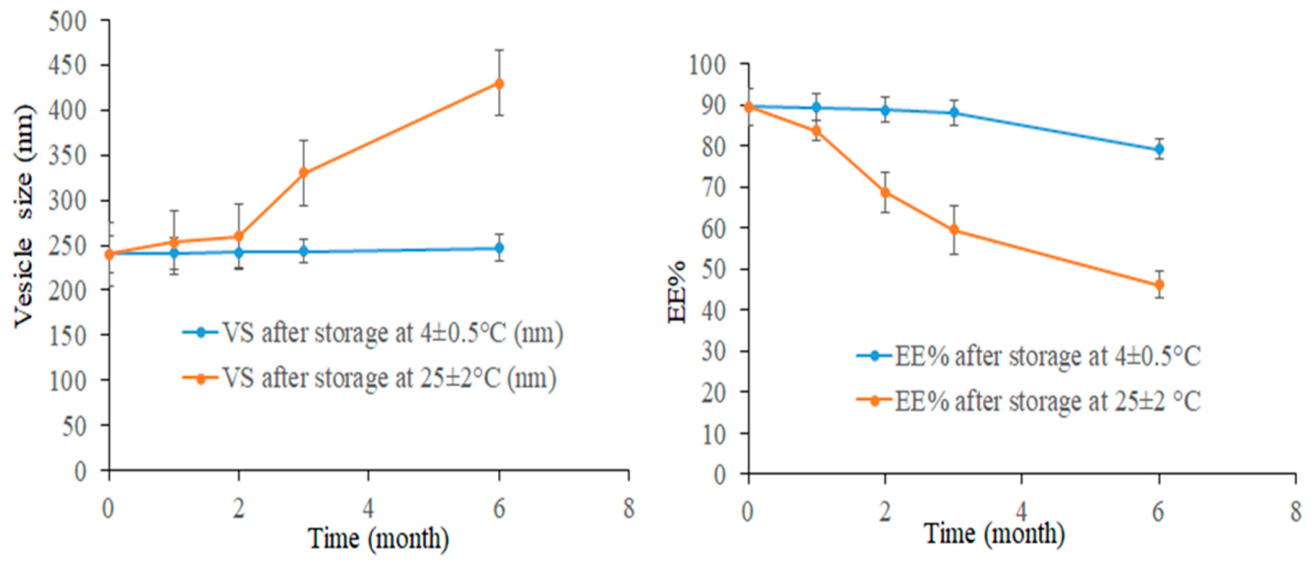
Figure 8.
TEM micrograph of the optimized CAP-NBLs.
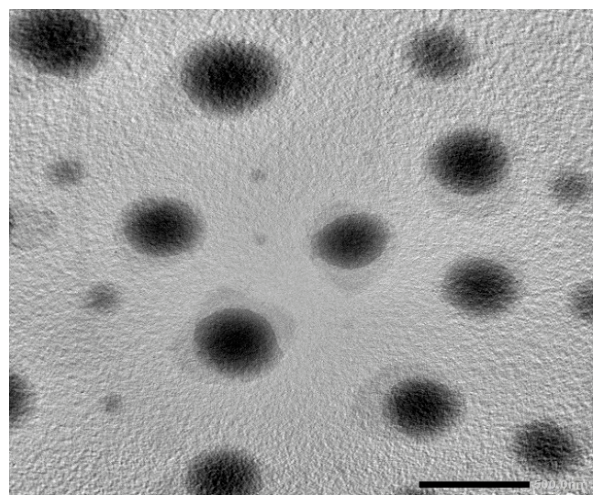
Figure 9.
Thermal analysis graph showing (A) CAP, (B) Cholesterol, (C) SDC, (D) PC, (E) Span 60, and (F) the optimized CAP-NBLs formulation.
Figure 9.
Thermal analysis graph showing (A) CAP, (B) Cholesterol, (C) SDC, (D) PC, (E) Span 60, and (F) the optimized CAP-NBLs formulation.
3.10.6. Ex Vivo Drug Permeation Assessment
To determine how well CAP from CAP-NBLs can pass through the intestines compared to pure CAP, a study was conducted using a rat intestine for 120 min to assess gut permeation. The ability of bilosomal nanocarriers to improve CAP penetration through the GI membrane is shown by the permeation patterns shown in Figure 12. The total CAP amount that crossed the membrane was 7200 ± 36.10 for CAP-NBLs and 2930 ± 57.50 µg/cm2 for pure CAP, as shown in Table 5 (p < 0.001). Consequently, compared to free CAP (29.3 ± 2.25%), the cumulative % of CAP that crossed the membrane from CAP-NBLs was 72 ± 1.42%, which is extremely significant (p < 0.001). Interestingly, compared to pure CAP, which has a permeation flux value (Jmax) of 2.44 ± 1.89 µg/cm2/hr, the Jmax of CAP-NBLs was 6 ± 1.78 µg/cm2/hr. Furthermore, compared to pure CAP, the apparent permeability coefficient (APC) was measured to be 2.44 × 10⁻⁴ cm/min; the optimized CAP-NBL formulation had a much higher APC of 6 × 10⁻⁴ cm/min. Consequently, an enhancement ratio (ER) of CAP-NBLs showed a 2.45-fold rise in drug permeability [52] (Table 5).
The smaller size and the efficient entrapment of CAP into the vesicles containing bile salts (SDC) are responsible for the increase in penetration [64]. According to previous studies, the negative charge of the bile salts imparts vesicles with elasticity and improves permeability across the intestinal membrane [83]. As a result, it makes it easier for the drug to diffuse across the membrane. Additionally, the vesicles’ negative charge enhances the absorption of the drug via the intestinal lymphatic transport system and promotes drug uptake by intestinal M-cells [84].
Figure 10.
ATR-FTIR spectra of (A) CAP, (B) Cholesterol, (C) SDC, (D) PC, (E) Span 60, and (F) the optimized CAP-NBLs formulation.
Figure 10.
ATR-FTIR spectra of (A) CAP, (B) Cholesterol, (C) SDC, (D) PC, (E) Span 60, and (F) the optimized CAP-NBLs formulation.
3.10.7. In Vivo Pharmacokinetic Studies
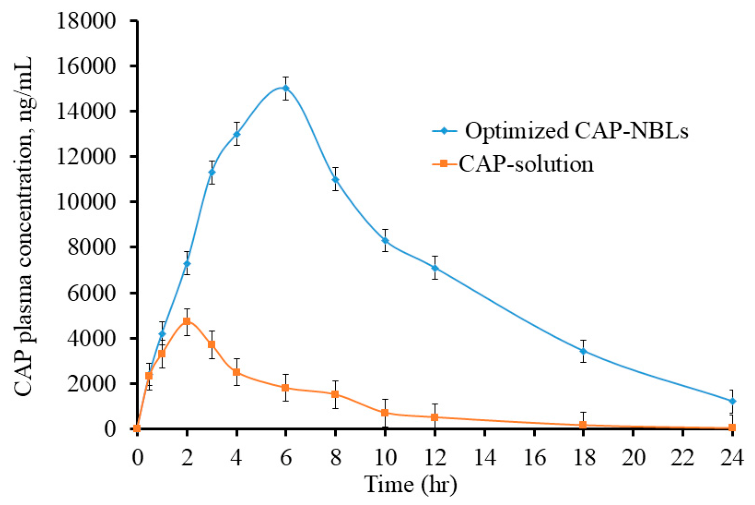
Figure 13 shows the pharmacokinetic attributes of the CAP solution and the optimized CAP-NBLs formulation following oral administration, and Table 6 shows the results of the investigated PKPs. At every treatment stage, the group that received CAP-NBLs had higher CAP plasma concentrations than the CAP solution group. Compared to CAP-solution (4700 ± 105.12 ng/mL), CAP-NBLs showed a significantly higher (p < 0.001) Cmax of 15000 ± 272.48 ng/mL, indicating enhanced drug bioavailability [82]. AUC0-∞ of CAP-NBLs was 165230.99 ± 616.35 ng×hr/mL, which was substantially more than AUC0-∞ of CAP solution (27703.86 ± 542.32 ng×hr/mL) (p < 0.001). The optimized CAP-NBLs formulation had much higher Cmax and AUC0-∞ caused by the effective encapsulation of CAP in the bilosomal vesicles, small VS, and avoiding hepatic metabolism [85]. The prolonged MRT from 5.885 ± 0.54 to 9.009 ± 0.67 hr and the delayed tmax from 2 ± 0.1 to 6 ± 0.11 hr may ensure sustained release from the investigated nanosized bilosomes. The relative bioavailability of CAP-NBLs was increased by 5.96-fold (p < 0.001) in comparison to the CAP solution, which may have resulted from significant uptake of bilosomes by the M-cells in the GIT and their movement via the cell membrane with the aid of carriers [86]. Additionally, bilosomes’ exceptional stability in the GIT may enhance their bioavailability by protecting the delivery mechanism from degradation by bile salts [51,87].
Figure 11.
XRD analysis of (A) CAP, (B) Cholesterol, (C) SDC, (D) Span 60, (E) PC, and (F) the optimized CAP-NBLs formulation.
Figure 11.
XRD analysis of (A) CAP, (B) Cholesterol, (C) SDC, (D) Span 60, (E) PC, and (F) the optimized CAP-NBLs formulation.
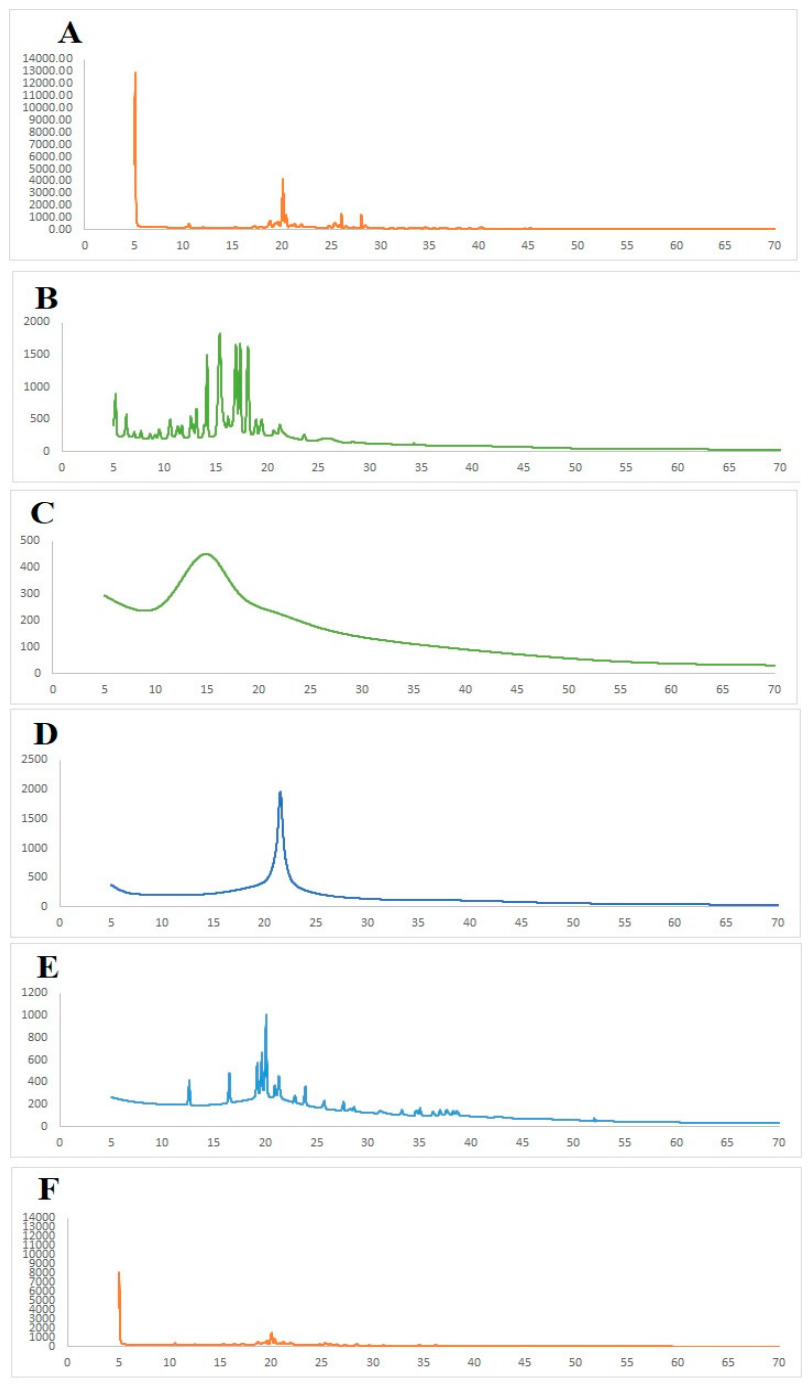
Figure 12.
Ex vivo gut permeation investigation showing cumulative % of CAP permeated against time from the CAP solution and the optimized CAP-NBLs formulation.
Figure 12.
Ex vivo gut permeation investigation showing cumulative % of CAP permeated against time from the CAP solution and the optimized CAP-NBLs formulation.
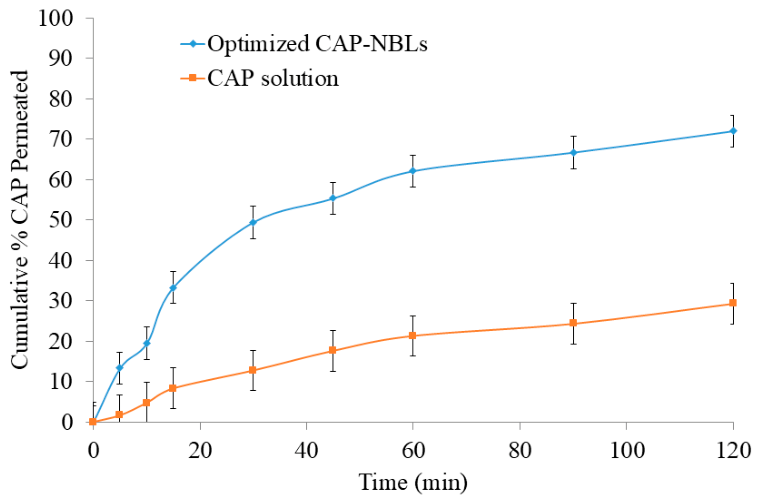
Figure 13.
Plasma concentration against time after administration of CAP-NBLs and pure CAP solution to animals.
Figure 13.
Plasma concentration against time after administration of CAP-NBLs and pure CAP solution to animals.
3.10.8. Gene Expression Levels of MMP-9 and VEGF A by RT-PCR
Evidence clearly supporting the superiority of treatment with the optimized CAP-NBLs formulation over pure CAP solution was presented in the assessment of important colon cancer tumor markers, including MMP-9 and VEGF A. As shown in the results, the gene expression level of the colon MMP-9 and VEGFA was markedly increased in the carcinogenic groups compared with the control groups (p < 0.001). Also, gene expression was significantly decreased in the bunch treated with the optimized CAP-NBL formulation compared with carcinogenic groups and the group treated with capecitabine solution (p < 0.01 and p < 0.05, respectively), as illustrated in Figure 14A,B.
These results agree with the study, which showed that MMP-9 plays a significant role in the progression of colorectal cancer due to its ability to degrade components of the extracellular matrix and basement membrane [88]. Additionally, in agreement with the study, which reported that MMP-9 degrades the extracellular matrix, it releases growth factors and reactivates factors. It plays an important role in progression, angiogenesis, rapid tumor growth, and metastasis [89]. These findings also corroborate a study that found VEGF is identified early in the progression of CRC and that its expression plays a vital role in metastases. It is linked to an excessive count of microvessels in colon cancer [90]. Also, in agreement with the study, which showed that the VEGF family plays a vital role in the formation of blood vessels in embryonic development and in pathological angiogenesis, lymphangiogenesis, which permits the tumor growth exponentially [91]
3.10.9. Serum Levels of CA19.9 and CEA
In the current study, we observed that treatment with the optimized CAP-NBLs formulation was superior to treatment with the corresponding pure CAP solution. This study measured specific colon cancer markers, CA19-9 and CEA, and found that serum levels of CA19-9 and CEA were significantly elevated in carcinogenic groups (p < 0.001) compared with control groups. Furthermore, the treatment with the optimized CAP-NBLs formulation showed significantly decreased serum levels of CA 19.9 and CEA compared with carcinogenic groups and the group treated with CAP solution (p < 0.01 and p < 0.05, respectively) (Figure 14C,D). These results agree with the study, which reported that CEA protein concentration was significantly increased in DMH-induced CRC compared with the control group, as CEA is a cancer-specific marker [11]. Also, in line with the study, which showed that the CEA is a widely used tumor marker for early diagnosis of colorectal cancer, with a specificity of 78.8% for CRC [92]. Additionally, in agreement with the study, which observed that low serum levels of CA-19-9 in normal cells and a significant increase in serum levels in neoplastic disease [14]. As well, in agreement with the study which reported that the combination of both CEA and CA 19.9, when its serum levels are elevated, is an indicator of poor prognosis and tumor invasion and recurrence, which is important in the monitoring of CRC [93].
3.10.10. Histopathological Examination
The evidence supporting the superior effect of the optimized CAP-NBLs formulation over pure CAP solution is the histopathological examination of colon tissue. Photomicrograph A in Figure 15 shows a colon section from bunch 1 in a normal adult male Wistar rat, demonstrating normal histoarchitecture. Its mucosa was lined by columnar epithelial cells, and the crypts were lined by numerous goblet cells. Also, Photomicrograph B in Figure 15 shows a colon section from bunch 2 in a normal adult male Wistar rat, taken with blank bilosomes, which shows the normal tissue structure, with both mucosa and crypts lined with columnar and goblet cells. Furthermore, photomicrograph C in Figure 15 shows a colon section from bunch 3, which shows marked epithelial lining and crypt dysplasia. Additionally, photomicrograph D in Figure 15 shows a colon section from bunch 4. The image shows hyperplasia of both mucosa and crypts. The photomicrograph E in Figure 15 shows a colon section from bunch 5, an adult male Wistar rat treated with CAP solution. The image shows decreased epithelial lining and crypt dysplasia, and some sections exhibit submucosal inflammatory cell infiltrates. Finally, photomicrograph F in Figure 15 shows a colon section from bunch 6, an adult male Wistar rat treated with CAP-NBLs, which shows almost restoration of colonic features with a lesser extent of epithelial lining and crypt dysplasia.
4. Conclusions
In the present study, capecitabine nanosized bilosomes (CAP-NBLs) were prepared to overcome the drawbacks associated with infusional 5-FU, traditional CAP formulations, and CAP’s extremely short half-life. The prepared CAP-NBLCAP-NBL formulations were nanoscale spheres with suitable entrapment efficiency, higher ZP values, and sustained release behavior. ATR-FTIR analysis showed no interaction between CAP and the excipient. DSC data showed no CAP-specific peak, indicating that CAP was successfully encapsulated into the bilosomal matrix without significant interaction or degradation. The XRD confirms the transition of CAP from crystalline to amorphous form upon encapsulation into bilosomes. The in vivo data after treatment with CAP-NBLs showed that the CA 19.9 and CEA serum levels were markedly decreased, gene expression levels of MMP-9 and VEGF A, and a histopathological study showed almost restoration of colonic features with a lesser extent of epithelial lining and crypt dysplasia.
Supplementary Materials
The following supporting information can be downloaded at the website of this paper posted on Preprints.org.
Author Contributions
Conceptualization, Abd El hakim Ramadan, Ahmed A. El-Shenawy, and Gamal M.K. Atwa; methodology, Abd El hakim Ramadan, Ahmed A. El-Shenawy, and Gamal M.K. Atwa; software, Mahmoud Elkot Mostafa, Islam Kamal, and Loiy B. Hamed; validation, Abd El hakim Ramadan, Ahmed A. El-Shenawy, and Gamal M.K. Atwa; formal analysis, Ahmed S. Saad and Ayman Salama.; investigation, Abd El hakim Ramadan, Ahmed A. El-Shenawy, and Gamal M.K. Atwa; resources, Abd El hakim Ramadan, Ahmed A. El-Shenawy, and Gamal M.K. Atwa; data curation, Mohamed Mahrous and Gamal M.K. Atwa; writing—original draft preparation, Abd El hakim Ramadan, Ahmed A. El-Shenawy, and Gamal M.K. Atwa; writing—review and editing, Abd El hakim Ramadan, Ahmed A. El-Shenawy, and Gamal M.K. Atwa; visualization, Ahmed S. Saad and Ayman Salama; supervision, Ahmed A. El-Shenawy and Islam Kamal. All authors have read and agreed to the published version of the manuscript.
Funding
This research received no external funding.
Institutional Review Board Statement
The animal studies followed the ARRIVE guidelines and were authorized by the animal ethics committee at Zagazig University (ZU-IACUC), ZU-IACUC/3/F/308/2026, Approval number The experiments followed the regulations of the UK Animals (Scientific Procedures) Act, 1986, EU Directive 2010/63/EU, and the NIH Guide for the Care and Use of Laboratory Animals (NIH Publications No. 8023, revised 1978).
Informed Consent Statement
Not applicable.
Data Availability Statement
The datasets generated during and/or analyzed during the current investigation are available from the corresponding authors on reasonable request.
Acknowledgments
The authors would like to express their sincere gratitude to the Faculty of Pharmacy (Boys), Al-Azhar University, Assiut Branch, for providing the necessary facilities, equipment, and technical support that greatly assisted in the completion of this research.
Conflicts of Interest
The authors declare no conflicts of interest.
Abbreviations
The following abbreviations are used in this manuscript:
| 5-FU | 5-fluorouracil |
| AUC | Area under the plasma concentration -time curve |
| ATR-FTIR | Attenuated total reflectance-fourier transform infrared |
| CEA | Cancer embryonic antigen |
| CAP | Capecitabine |
| CAP-NBLs | Capecitabine nanosized bilosomes |
| CA 19.9 | Carbohydrate antigen 19.9 |
| CRC | Colorectal cancer |
| EE% | Entrapment efficiency percentage |
| MMP-9 | Matrix metalloproteinase-9 |
| PC | Phosphatidylcholine |
| RT-PCR | Real-time polymerase chain reaction |
| SGF | Simulated gastric fluid |
| SIF | Simulated intestinal fluid |
| SDC | Sodium deoxycholate |
| VEGF | Vascular endothelial growth factor A |
References
- Elsayed, M.M.; et al. Design and optimization of orally administered luteolin nanoethosomes to enhance its anti-tumor activity against hepatocellular carcinoma. Pharmaceutics 2021, 13(5), 648. [Google Scholar] [CrossRef] [PubMed]
- El-Shenawy, A.A.; et al. Anti-tumor activity of orally administered gefitinib-loaded nanosized cubosomes against colon cancer. Pharmaceutics 2023, 15(2), 680. [Google Scholar] [CrossRef] [PubMed]
- Mármol, I.; et al. Colorectal carcinoma: a general overview and future perspectives in colorectal cancer. Int. J. Mol. Sci. 2017, 18(1), 197. [Google Scholar] [CrossRef] [PubMed]
- Biller, L.H.; Schrag, D. Diagnosis and treatment of metastatic colorectal cancer: a review. Jama 2021, 325(7), 669–685. [Google Scholar] [CrossRef] [PubMed]
- Endo, M.; et al. Induction of thymidine phosphorylase expression and enhancement of efficacy of capecitabine or 5′-deoxy-5-fluorouridine by cyclophosphamide in mammary tumor models. Int. J. Cancer 1999, 83(1), 127–134. [Google Scholar] [CrossRef]
- Zhong, Q., et al., Side effects of anti-cancer medications, in Side Effects of Drugs Annual. 2022, Elsevier. p. 431-445.
- Alzahrani, S.M.; et al. 5-Fluorouracil and capecitabine therapies for the treatment of colorectal cancer. Oncol. Rep. 2023, 50(4), 1–16. [Google Scholar] [CrossRef] [PubMed]
- Sabry, S.; Okda, T.; Hasan, A. Formulation, characterization, and evaluation of the anti-tumor activity of nanosized galangin loaded niosomes on chemically induced hepatocellular carcinoma in rats. J. Drug Deliv. Sci. Technol. 2021, 61, 102163. [Google Scholar] [CrossRef]
- Jadhav, S.M., et al., Novel vesicular system: an overview. Journal of applied pharmaceutical science, 2012(Issue): p. 193-202.
- Moghimipour, E.; Ameri, A.; Handali, S. Absorption-enhancing effects of bile salts. Molecules 2015, 20(8), 14451–14473. [Google Scholar] [CrossRef] [PubMed]
- Salehi, A.; Hosseini, S.M.; Kazemi, S. Antioxidant and Anticarcinogenic Potentials of Propolis for Dimethylhydrazine-Induced Colorectal Cancer in Wistar Rats. BioMed Res. Int. 2022, 8497562. [Google Scholar] [PubMed]
- Ogata, Y.; et al. Elevated preoperative serum carcinoembrionic antigen level may be an effective indicator for needing adjuvant chemotherapy after potentially curative resection of stage II colon cancer. J. Surg. Oncol. 2009, 99(1), 65–70. [Google Scholar] [PubMed]
- Shibutani, M.; et al. Significance of CEA and CA19-9 combination as a prognostic indicator and for recurrence monitoring in patients with stage II colorectal cancer. Anticancer Res. 2014, 34(7), 3753–8. [Google Scholar] [CrossRef] [PubMed]
- Scarà, S.; Bottoni, P.; Scatena, R. CA 19-9: Biochemical and Clinical Aspects. Adv. Exp. Med. Biol. 2015, 867, 247–60. [Google Scholar] [CrossRef] [PubMed]
- Hara, M.; et al. Accuracy of monitoring serum carcinoembryonic antigen levels in postoperative stage III colorectal cancer patients is limited to only the first postoperative year. Surg. Today 2011, 41(10), 1357–62. [Google Scholar] [CrossRef] [PubMed]
- Nagase, H.; Visse, R.; Murphy, G. Structure and function of matrix metalloproteinases and TIMPs. Cardiovasc Res. 2006, 69(3), 562–73. [Google Scholar] [CrossRef] [PubMed]
- Vandooren, J.; Van den Steen, P.E.; Opdenakker, G. Biochemistry and molecular biology of gelatinase B or matrix metalloproteinase-9 (MMP-9): the next decade. Crit. Rev. Biochem Mol. Biol. 2013, 48(3), 222–72. [Google Scholar] [CrossRef] [PubMed]
- Reinhard, S.M.; Razak, K.; Ethell, I.M. A delicate balance: role of MMP-9 in brain development and pathophysiology of neurodevelopmental disorders. Front Cell Neurosci. 2015, 9, 280. [Google Scholar] [CrossRef] [PubMed]
- Chen, L.; et al. Matrix metalloproteinase-9 expression of GCTSC in peripheral tissue and central tissue of GCTB. J. Cell Biochem 2018, 119(7), 5805–5812. [Google Scholar] [CrossRef] [PubMed]
- Ahmad, A.; Nawaz, M.I. Molecular mechanism of VEGF and its role in pathological angiogenesis. J. Cell Biochem 2022, 123(12), 1938–1965. [Google Scholar] [CrossRef] [PubMed]
- Das, S.; et al. Biomarkers in cancer detection, diagnosis, and prognosis. Sensors 2023, 24(1), 37. [Google Scholar] [CrossRef] [PubMed]
- Abdullah, H.D.; et al. Clarithromycin-tailored cubosome: A sustained release oral nano platform for evaluating antibacterial, anti-biofilm, anti-inflammatory, anti-liver cancer, biocompatibility, ex-vivo and in-vivo studies. Int. J. Pharm. 2024, 667, 124865. [Google Scholar] [CrossRef] [PubMed]
- Abdullah, H.D.; et al. Effective tailoring of cefepime into bilosomes: A promising nanoplatform for enhancing oral absorption, extending half-life, and evaluating biocompatibility, antibacterial, anti-biofilm, anti-breast cancer activity, ex-vivo, and in-vivo studies. Int. J. Pharm. 2025, 668, 125001. [Google Scholar] [CrossRef] [PubMed]
- Ghanem, H.A.; et al. Enhanced Oral Bioavailability of Irbesartan via Nano-Bilosomes: A Potential Breakthrough in Hypertension Treatment. OpenNano 2025, 100255. [Google Scholar] [CrossRef]
- Salman, A.H. S. Nazar Abd Alhammid, Design, Optimization, and in-Vitro Evaluation of Dasatinib-Loaded Bilosomes Using Response Surface Methodology. J. Nanostructures 2026, 16(1), 109–133. [Google Scholar] [CrossRef]
- Zafar, A.; et al. Development and evaluation of luteolin loaded pegylated bilosomes: optimization, in vitro characterization, and cytotoxicity study. Drug Deliv. 2021, 28(1), 2562–2573. [Google Scholar] [CrossRef] [PubMed]
- El-Shenawy, A.A.; et al. Zaleplon nanospanlastics loaded transdermal patches: formulation, optimization, ex-vivo permeation, and in-vivo studies. J. Pharm. Pharm. Sci. 2025, 28, 15406. [Google Scholar] [CrossRef] [PubMed]
- Elsayed, M.M.; et al. Development and optimization of vildagliptin solid lipid nanoparticles loaded ocuserts for controlled ocular delivery: A promising approach towards treating diabetic retinopathy. Int. J. Pharm. X 2024, 7, 100232. [Google Scholar] [CrossRef] [PubMed]
- Zhang, Z.; et al. The Prediction of the In Vitro Release Curves for PLGA-Based Drug Delivery Systems with Neural Networks. Pharmaceutics 2025, 17(4), 513. [Google Scholar] [CrossRef] [PubMed]
- Salim, K.S.; Abood, A. Najim; Almakki, A. Design Optimization and Physicochemical/Structural Characterization of Levofloxacin-Loaded Nanoscale Bilosomes for Topical Delivery. J. Nanostructures 2026, 16(1), 288–307. [Google Scholar] [CrossRef]
- Hasan, A.; Abd Elghany, M.; Sabry, S. Design and characterization of intra-oral fast dissolving tablets containing diacerein-solid dispersion. J. Appl. Pharm. Sci. 2020, 10(6), 044–053. [Google Scholar] [CrossRef]
- Mohamed, M.S.; et al. Formulation and Evaluation of Liquisolid Orally Disintegrating Tablets of Agomelatine with Natural Excipients for Enhanced Oral Bioavailability. J. Pharm. Innov. 2026, 21(4), 412. [Google Scholar] [CrossRef]
- Abdallah, M.H.; et al. Rectal In Situ Thermosensitive Gel Loaded with Agomelatine-Silver Nanoparticles: Formulation and Characterization. Gels 2026, 12(1), 51. [Google Scholar] [CrossRef] [PubMed]
- Elsayed, M.M.; et al. Tailoring of rosuvastatin calcium and atenolol bilayer tablets for the management of hyperlipidemia associated with hypertension: a preclinical study. Pharmaceutics 2022, 14(8), 1629. [Google Scholar] [CrossRef] [PubMed]
- Mohamed, M.S.; et al. Metolazone co-crystals-loaded oral fast dissolving films: Design, optimization, and in vivo evaluation. J. Drug Deliv. Sci. Technol. 2023, 90, 105167. [Google Scholar] [CrossRef]
- Masiiwa, W.L.; Gadaga, L.L. Intestinal Permeability of Artesunate-Loaded Solid Lipid Nanoparticles Using the Everted Gut Method. J. Drug Deliv. 2018, 2018(1), 3021738. [Google Scholar] [CrossRef] [PubMed]
- Alam, M.A.; Al-Jenoobi, F.I.; Al-Mohizea, A.M. Everted gut sac model as a tool in pharmaceutical research: limitations and applications. J. Pharm. Pharmacol. 2012, 64(3), 326–336. [Google Scholar] [CrossRef] [PubMed]
- Li, M.; et al. Excipients enhance intestinal absorption of ganciclovir by P-gp inhibition: assessed in vitro by everted gut sac and in situ by improved intestinal perfusion. Int. J. Pharm. 2011, 403(1-2), 37–45. [Google Scholar] [CrossRef] [PubMed]
- Fawad, M.; et al. Fabrication of oral sustained release capecitabine loaded nanostructured lipid carriers with improved bioavailability and prolonged anticancer effects. J. Mol. Liq. 2025, 421, 126852. [Google Scholar] [CrossRef]
- El-Shenawy, A.A.; et al. Anti-Tumor Activity of Orally Administered Gefitinib-Loaded Nanosized Cubosomes against Colon Cancer. Pharmaceutics 2023, 15. [Google Scholar] [CrossRef] [PubMed]
- Hassan, A.K.; et al. Hesperetin and Capecitabine Abate 1,2 Dimethylhydrazine-Induced Colon Carcinogenesis in Wistar Rats via Suppressing Oxidative Stress and Enhancing Antioxidant, Anti-Inflammatory and Apoptotic Actions. Life 2023, 13(4). [Google Scholar] [CrossRef] [PubMed]
- Lee, G.; Goosens, K.A. Sampling blood from the lateral tail vein of the rat. J. Vis. Exp. JoVE 2015, 99, 52766. [Google Scholar]
- Aguwa, U.; et al. Comparing the effect of methods of rat euthanasia on the brain of Wistar rats: Cervical dislocation, chloroform inhalation, diethyl ether inhalation and formalin inhalation. J. Adv. Med. Res. 2020, 32(17), 8–16. [Google Scholar] [CrossRef]
- Atwa, G.; et al. The antitumor effect of galangin and luteolin with doxorubicin on chemically induced hepatocellular carcinoma in rats. Contemp. Oncol. (Pozn) 2021, 25(3), 174–184. [Google Scholar] [CrossRef] [PubMed]
- Livak, K.J.; Schmittgen, T.D. Analysis of relative gene expression data using real-time quantitative PCR and the 2(-Delta C(T)) Method. Methods 2001, 25(4), 402–8. [Google Scholar] [CrossRef] [PubMed]
- Deng, Q.-X.; et al. Study of serum tumor markers in the early diagnosis of pancreatic cancer. World J. Gastrointest. Oncol. 2025, 17(9), 106910. [Google Scholar] [CrossRef] [PubMed]
- Bancroft, J.D. Observations on the effect on histochemical reactions of different processing methods. J. Med. Lab Technol. 1966, 23(2), 105–8. [Google Scholar] [PubMed]
- Nagib, M.M.; et al. Design and optimization of carvedilol-loaded transbilosomes for the control of diabetic high-fat diet-induced atherosclerosis in rats. J. Pharm. Pharmacol. 2026, 78(1), rgaf086. [Google Scholar] [CrossRef] [PubMed]
- Midekessa, G.; et al. Zeta potential of extracellular vesicles: toward understanding the attributes that determine colloidal stability. ACS Omega 2020, 5(27), 16701–16710. [Google Scholar] [CrossRef] [PubMed]
- Baker, K.; et al. Multifunctional properties of commercial bile salts for advanced materials engineering. Adv. Eng. Mater. 2021, 23(5), 2001261. [Google Scholar] [CrossRef]
- Mitrović, D.; et al. The Pharmaceutical and pharmacological potential applications of bilosomes as nanocarriers for drug delivery. Molecules 2025, 30(5), 1181. [Google Scholar] [CrossRef] [PubMed]
- Ahmed, S.; Kassem, M.A.; Sayed, S. Bilosomes as promising nanovesicular carriers for improved transdermal delivery: construction, in vitro optimization, ex vivo permeation and in vivo evaluation. Int. J. Nanomed. 2020, 9783–9798. [Google Scholar] [CrossRef] [PubMed]
- Asokan, A.; et al. Development of a Surface Interactive Membrane via Layer-by-Layer assembly and its application towards the removal of Non-Steroidal Anti-Inflammatory Drugs from water. Surf. Interfaces 2025, 107971. [Google Scholar]
- Thabet, Y.; Elsabahy, M.; Eissa, N.G. Methods for preparation of niosomes: A focus on thin-film hydration method. Methods 2022, 199, 9–15. [Google Scholar] [CrossRef] [PubMed]
- Can, A., Investigation into the potential of bilosomes (bile salt-containing liposomes) to increase the bioavailability of phenolic compounds. 2023, University of Leeds.
- Chen, W.; et al. Comprehensive analysis of serum and fecal bile acid profiles and interaction with gut microbiota in primary biliary cholangitis. Clin. Rev. Allergy Immunol. 2020, 58(1), 25–38. [Google Scholar] [CrossRef] [PubMed]
- Niu, M.; et al. Enhanced oral absorption of insulin-loaded liposomes containing bile salts: a mechanistic study. Int. J. Pharm. 2014, 460(1-2), 119–130. [Google Scholar] [CrossRef] [PubMed]
- Shankar, M.L.K., optimization of process parameters for extraction of oil from kokum oil seeds by screw press mini oil mill. 2023, dr. balasaheb sawant konkan krishi vidyapeeth.
- Amalia, A.; Srifiana, Y.; Anwar, A. Physical properties and rate of diffusion transethosome curcumin using a combination of tween 60 and span 60 as surfactant. Int. J. Appl. Pharm. 2021, 66–70. [Google Scholar] [CrossRef]
- Bnyan, R.; et al. Surfactant effects on lipid-based vesicles properties. J. Pharm. Sci. 2018, 107(5), 1237–1246. [Google Scholar] [CrossRef] [PubMed]
- Biscaia-Caleiras, M.; et al. Unveiling the impact of membrane fluidity in shaping lipid-based drug delivery systems development. Biochim. Et. Biophys. Acta (BBA) -Biomembranes 2025, 184461. [Google Scholar] [CrossRef] [PubMed]
- Rehman, U.; et al. pH responsive hydrogels for the delivery of capecitabine: Development, optimization and pharmacokinetic studies. Gels 2022, 8(12), 775. [Google Scholar] [CrossRef] [PubMed]
- Lakshani, N.; et al. Release kinetic models and release mechanisms of controlled-release and slow-release fertilizers. ACS Agric. Sci. Technol. 2023, 3(11), 939–956. [Google Scholar] [CrossRef]
- Naji, G.H.; Al Gawhari, F.J. Evaluation of types and concentration of bile salts impact on physical properties of nisoldipine-loaded bilosomes. Pharmacia 2024, 71, 1–7. [Google Scholar] [CrossRef]
- Nayak, A.K., et al., Systems of nanovesicular drug delivery. 2022: Academic Press.
- Papadimitriou, S.; Bikiaris, D. Novel self-assembled core–shell nanoparticles based on crystalline amorphous moieties of aliphatic copolyesters for efficient controlled drug release. J. Control. Release 2009, 138(2), 177–184. [Google Scholar] [CrossRef] [PubMed]
- Bhattacharya, S., A. Page, and P. Shinde, Development and Evaluation of Potato Starch and Chitosan Modified Capecitabine Nanoparticles for Enhanced Colon Cancer Treatment: A Comprehensive Study on Physical Properties, In vitro Efficacy, and In vivo Targeting. 2024. [CrossRef] [PubMed]
- Alam, A.A.; et al. Production and statistical optimization of cholesterol-oxidase generated by Streptomyces sp. AN strain. J. Genet. Eng. Biotechnol. 2022, 20(1), 156. [Google Scholar] [CrossRef] [PubMed]
- Biswas, S.; et al. Fabrication of morphologically modified strong supramolecular nanocomposite antibacterial hydrogels based on sodium deoxycholate with inverted optical activity and sustained release. Colloids Surf. B Biointerfaces 2020, 188, 110803. [Google Scholar] [CrossRef] [PubMed]
- Yu, W.; et al. Production of glyceryl phosphorylcholine-enriched defatted egg yolk powder through integrated enzymatic and supercritical CO2 processing. Food Biosci. 2025, 68, 106171. [Google Scholar] [CrossRef]
- Rochdy Haj-Ahmad, R.; Elkordy, A. Ali; Chaw, C. Shu. In vitro characterisation of Span™ 65 niosomal formulations containing proteins. Curr. Drug Deliv. 2015, 12(5), 628–639. [Google Scholar] [CrossRef] [PubMed]
- Moorthi, P.V., et al., Carbon Nanomaterials in Plant Nanotechnology, in Plant Nanotechnology Fundamentals and Methodologies. 2025, Springer. p. 241-258.
- Dakupati, R., et al. Non-Invasive Cholesterol Detection Leveraging FTIR Spectroscopy. in 2025 5th IEEE International Conference on Applied Electromagnetics, Signal Processing, & Communication (AESPC). 2025. IEEE.
- Pramitha, V.S., et al., Characterization and bioactivity study of chitosan-based nanomaterial from exoskeleton waste of Parapaeneopsis stylifera. Researc h Square, 2021.
- Jackson, M., Fourier transform infrared spectroscopic characterisation of biomolecules. 1990: University of London, Royal Free Hospital School of Medicine (United Kingdom).
- Karan, G.; et al. Comprehensive and comparative analysis of sorbitan ester (Span) niosomes as emerging vesicular drug delivery platform: fabrication, characterization, release dynamics, biocompatibility profiling and toxicological implications. Colloids Surf. A Physicochem. Eng. Asp. 2025, 138731. [Google Scholar]
- Das, S.; et al. Design and Optimization of Trastuzumab-Functionalized Nanolipid Carriers for Targeted Capecitabine Delivery: Anti-Cancer Effectiveness Evaluation in MCF-7 and SKBR3 Cells. Int. J. Nanomed. 2025, 12075–12102. [Google Scholar] [CrossRef] [PubMed]
- Léonard, A.; et al. Location of cholesterol in DMPC membranes. A comparative study by neutron diffraction and molecular mechanics simulation. Langmuir 2001, 17(6), 2019–2030. [Google Scholar] [CrossRef]
- Su, Z.; et al. Crystalline, liquid crystalline, and isotropic phases of sodium deoxycholate in water. J. Pharm. Sci. 2011, 100(11), 4836–4844. [Google Scholar] [CrossRef] [PubMed]
- Sakuragi, M. Evaluation of the supramolecular structure of drug delivery carriers using synchrotron X-ray scattering. Polym. J. 2021, 53(12), 1335–1344. [Google Scholar] [CrossRef]
- Zhao, Z.; et al. A novel macromolecular phosphorus-nitrogen containing flame retardant for polycarbonate. Polym. Degrad. Stab. 2024, 220, 110648. [Google Scholar] [CrossRef]
- Saifi, Z.; et al. Bilosomes nanocarriers for improved oral bioavailability of acyclovir: A complete characterization through in vitro, ex-vivo and in vivo assessment. J. Drug Deliv. Sci. Technol. 2020, 57, 101634. [Google Scholar] [CrossRef]
- Abdel-moneum, R.; Abdel-Rashid, R.S. Bile salt stabilized nanovesicles as a promising drug delivery technology: A general overview and future perspectives. J. Drug Deliv. Sci. Technol. 2023, 79, 104057. [Google Scholar] [CrossRef]
- Xu, L.; et al. Engineering the intestinal lymphatic transport of oral nanoparticles to educate macrophages for cancer combined immunotherapy. ACS Nano 2023, 17(12), 11817–11837. [Google Scholar] [CrossRef] [PubMed]
- El-Nabarawi, M.; et al. Liver targeting of daclatasvir via tailoring sterically stabilized bilosomes: fabrication, comparative in vitro/in vivo appraisal and biodistribution studies. Int. J. Nanomed. 2021, 6413–6426. [Google Scholar] [CrossRef] [PubMed]
- Clark, M.A.; et al. Targeting polymerised liposome vaccine carriers to intestinal M cells. Vaccine 2001, 20(1-2), 208–217. [Google Scholar] [CrossRef] [PubMed]
- Obeid, M.A.; et al. Drug delivery systems incorporating bile salts: advancements since the conception of bilosomes. Ther. Deliv. 2025, 16(5), 487–500. [Google Scholar] [CrossRef] [PubMed]
- Shoari, A.; et al. Targeting Invasion: The Role of MMP-2 and MMP-9 Inhibition in Colorectal Cancer Therapy. Biomolecules 2024, 15(1). [Google Scholar] [CrossRef] [PubMed]
- Mudatsir, et al. Relationship between metalloproteinase-9 (MMP-9) expression and clinicopathology in colorectal cancer: a cross-sectional study. Ann. Med. Surg. (Lond) 2023, 85(9), 4277–4282. [Google Scholar] [CrossRef] [PubMed]
- Shaham, S.H.; Vij, P.; Tripathi, M.K. Advances in Targeted and Chemotherapeutic Strategies for Colorectal Cancer: Current Insights and Future Directions. Biomedicines 2025, 13(3). [Google Scholar] [CrossRef] [PubMed]
- Dakowicz, D.; Zajkowska, M.; Mroczko, B. Relationship between VEGF Family Members, Their Receptors and Cell Death in the Neoplastic Transformation of Colorectal Cancer. Int. J. Mol. Sci. 2022, 23(6). [Google Scholar] [CrossRef] [PubMed]
- Ma, Y.; et al. Diagnostic value of carcinoembryonic antigen combined with cytokines in serum of patients with colorectal cancer. Medicine 2022, 101(37), e30787. [Google Scholar] [CrossRef] [PubMed]
- Mesa-López, M.J.; et al. Periodontitis as a field of cancerization: association with carcinoembryonic antigen in colorectal cancer patients. Clin. Oral Investig. 2025, 29(6), 323. [Google Scholar] [CrossRef] [PubMed]
Figure 1.
EE% and yield % of the various CAP-NBL.
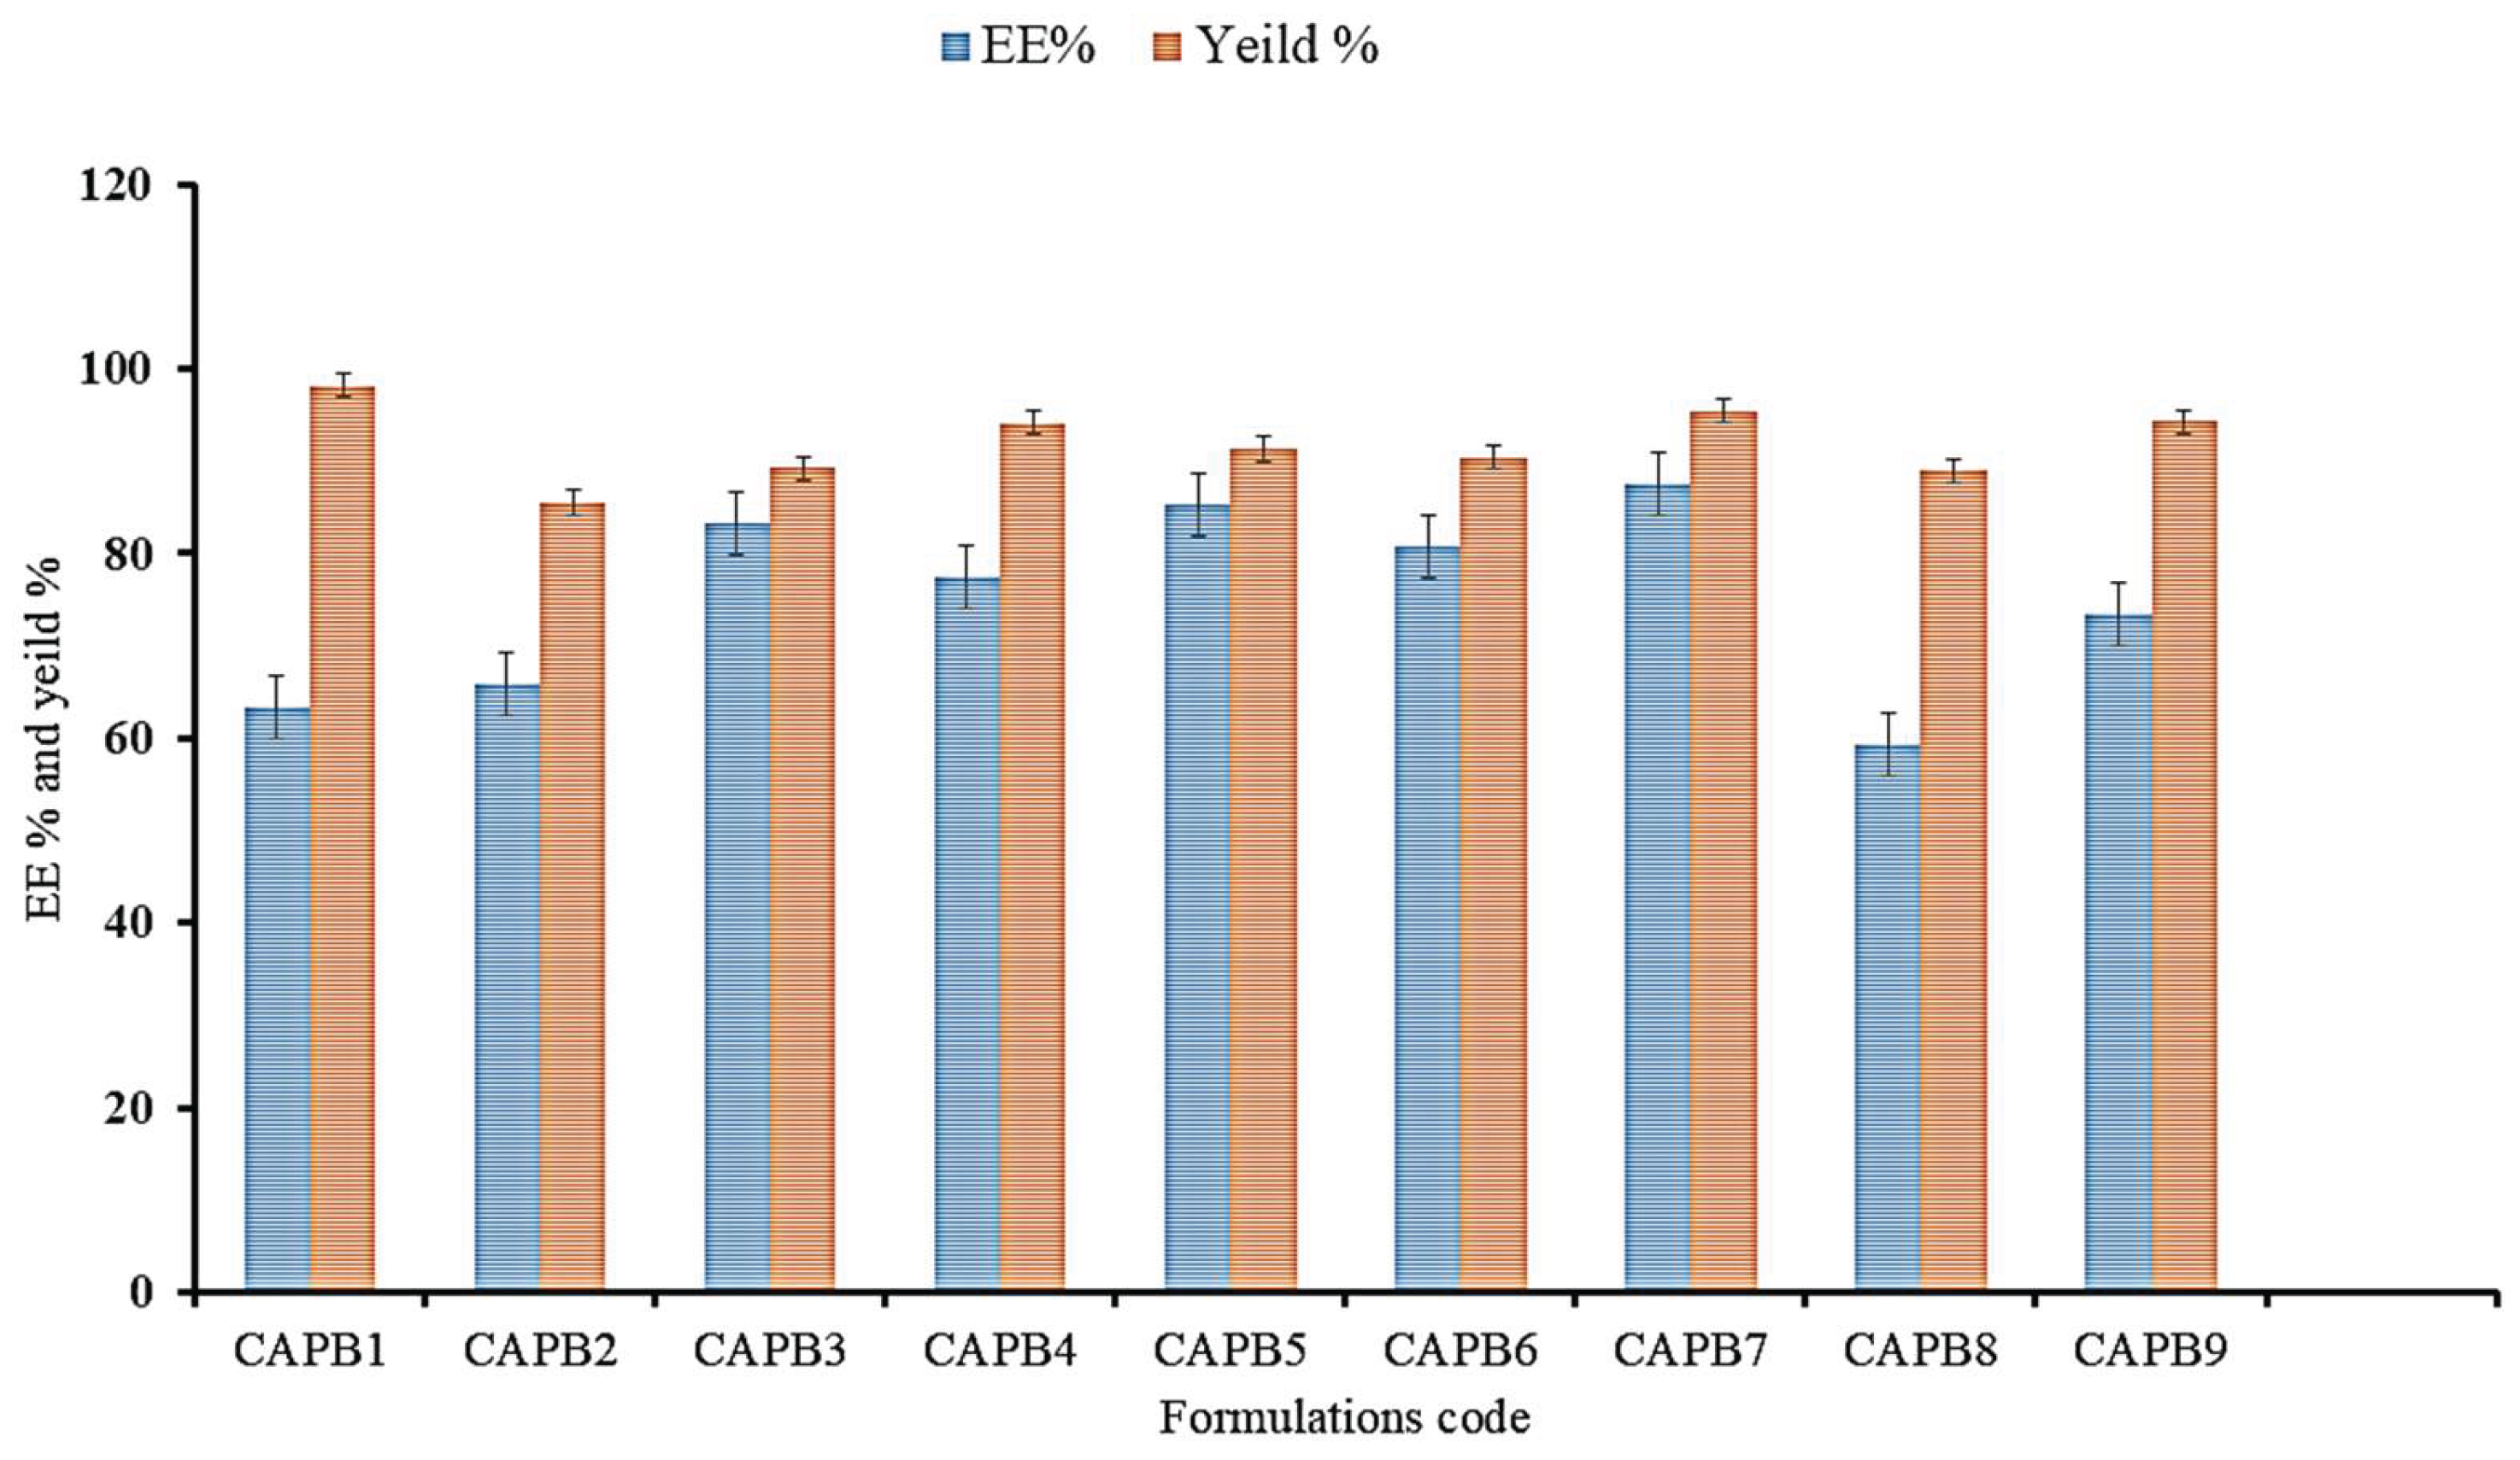
Figure 2.
CAP in vitro release pattern in phosphate buffer, pH 6.8, compared to the pure CAP in the same media.
Figure 2.
CAP in vitro release pattern in phosphate buffer, pH 6.8, compared to the pure CAP in the same media.
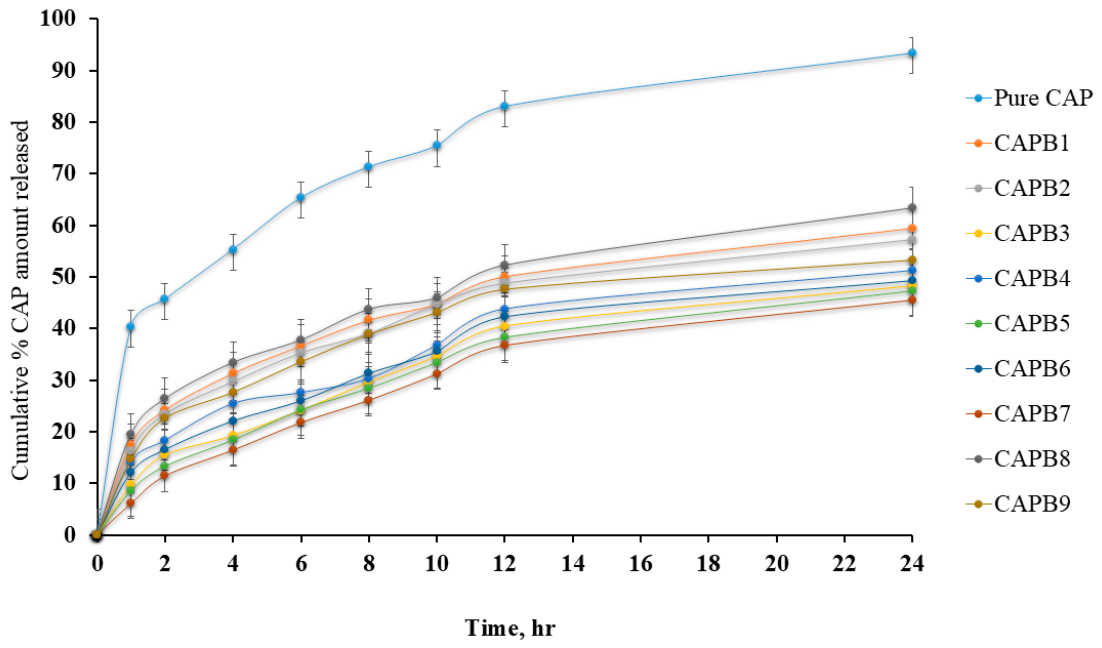
Figure 14.
Effect of the optimized CAP-NBLs on the gene expression level of MMP-9, VEGF A, and CEA and CA19.9 serum levels in different groups. results are shown as mean ± SE (n = 12). a, b, and c showed a significant difference relative to the control, carcinogenic, and treated groups, respectively. a, b, and c demonstrated significant change at p <0.05; aaa, bbb, and ccc demonstrated significant change at p <0.001.
Figure 14.
Effect of the optimized CAP-NBLs on the gene expression level of MMP-9, VEGF A, and CEA and CA19.9 serum levels in different groups. results are shown as mean ± SE (n = 12). a, b, and c showed a significant difference relative to the control, carcinogenic, and treated groups, respectively. a, b, and c demonstrated significant change at p <0.05; aaa, bbb, and ccc demonstrated significant change at p <0.001.
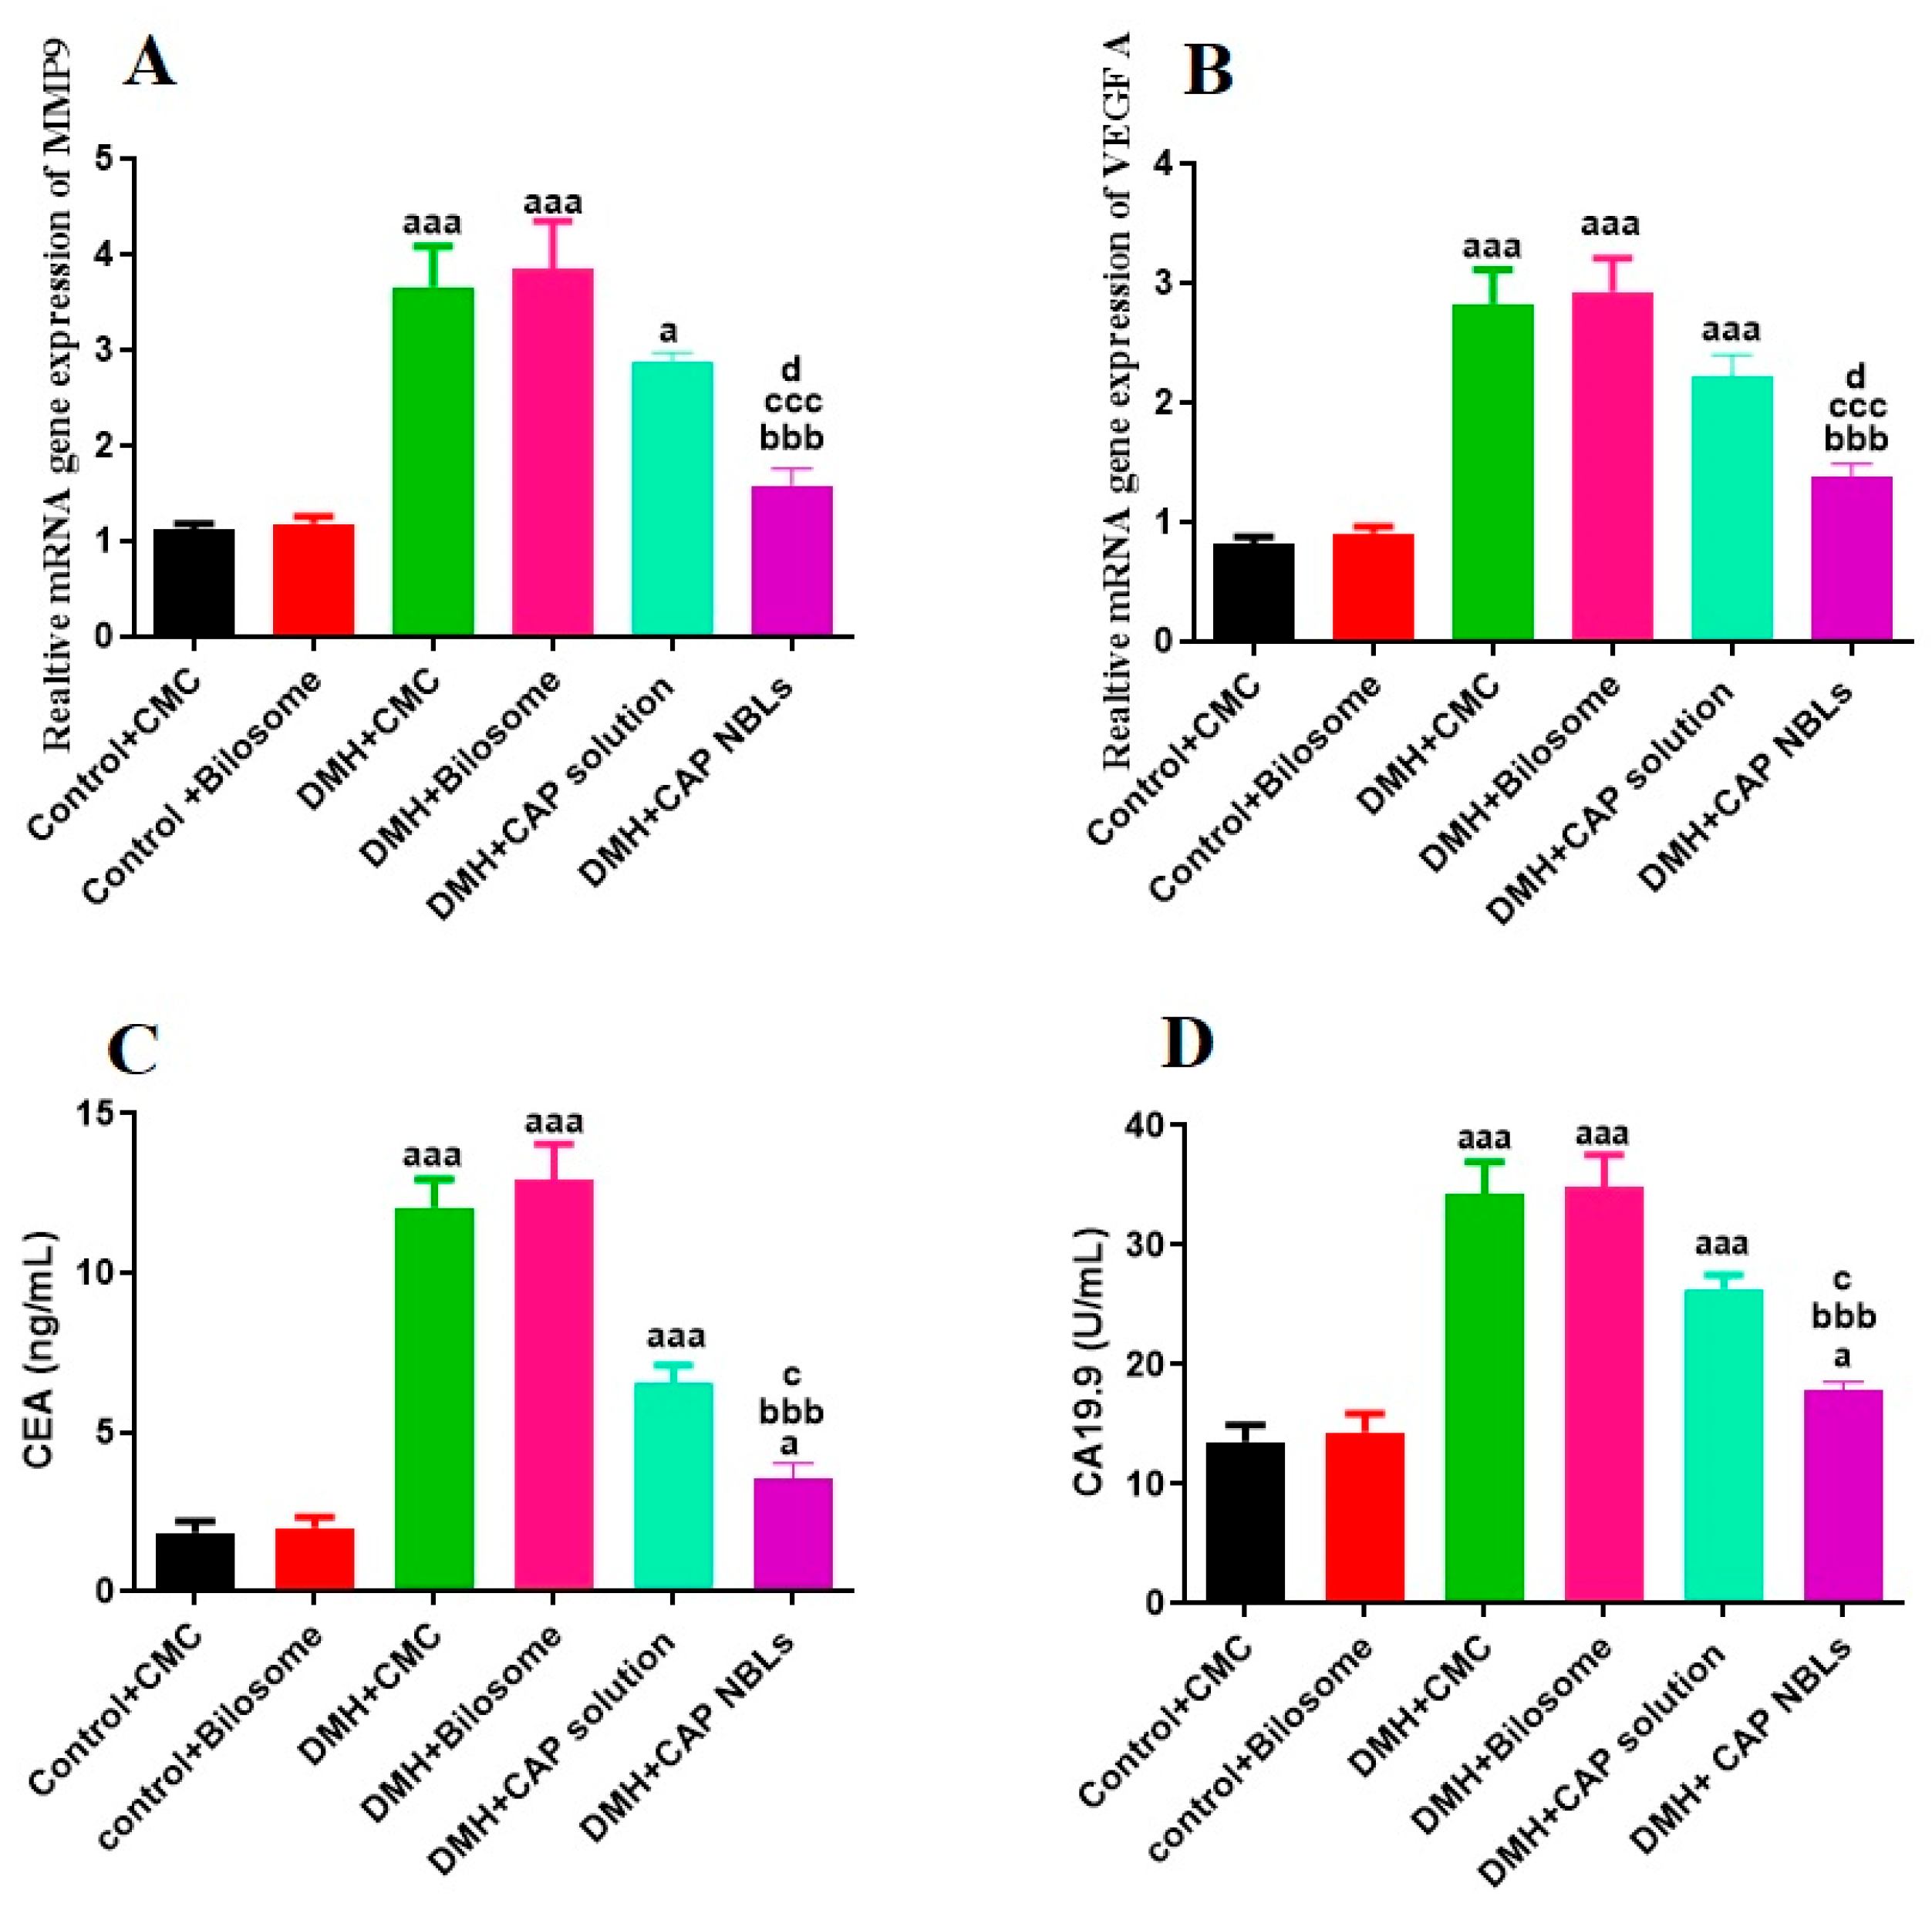
Figure 15.
(A and B) the colon section from normal rats (bunches 1 and 2), normal histoarchitecture, (C and D) the colon section from animals in bunches 3 and 4, showed marked epithelial lining and crypt dysplasia, (E) the colon section from animals in bunch 5, showed decreased epithelial lining and crypt dysplasia, (F) the colon section from animals in bunch 6, displayed almost restoration of colonic features with lesser extent of epithelial lining and crypt dysplasia; scale bar, 100 µm.
Figure 15.
(A and B) the colon section from normal rats (bunches 1 and 2), normal histoarchitecture, (C and D) the colon section from animals in bunches 3 and 4, showed marked epithelial lining and crypt dysplasia, (E) the colon section from animals in bunch 5, showed decreased epithelial lining and crypt dysplasia, (F) the colon section from animals in bunch 6, displayed almost restoration of colonic features with lesser extent of epithelial lining and crypt dysplasia; scale bar, 100 µm.
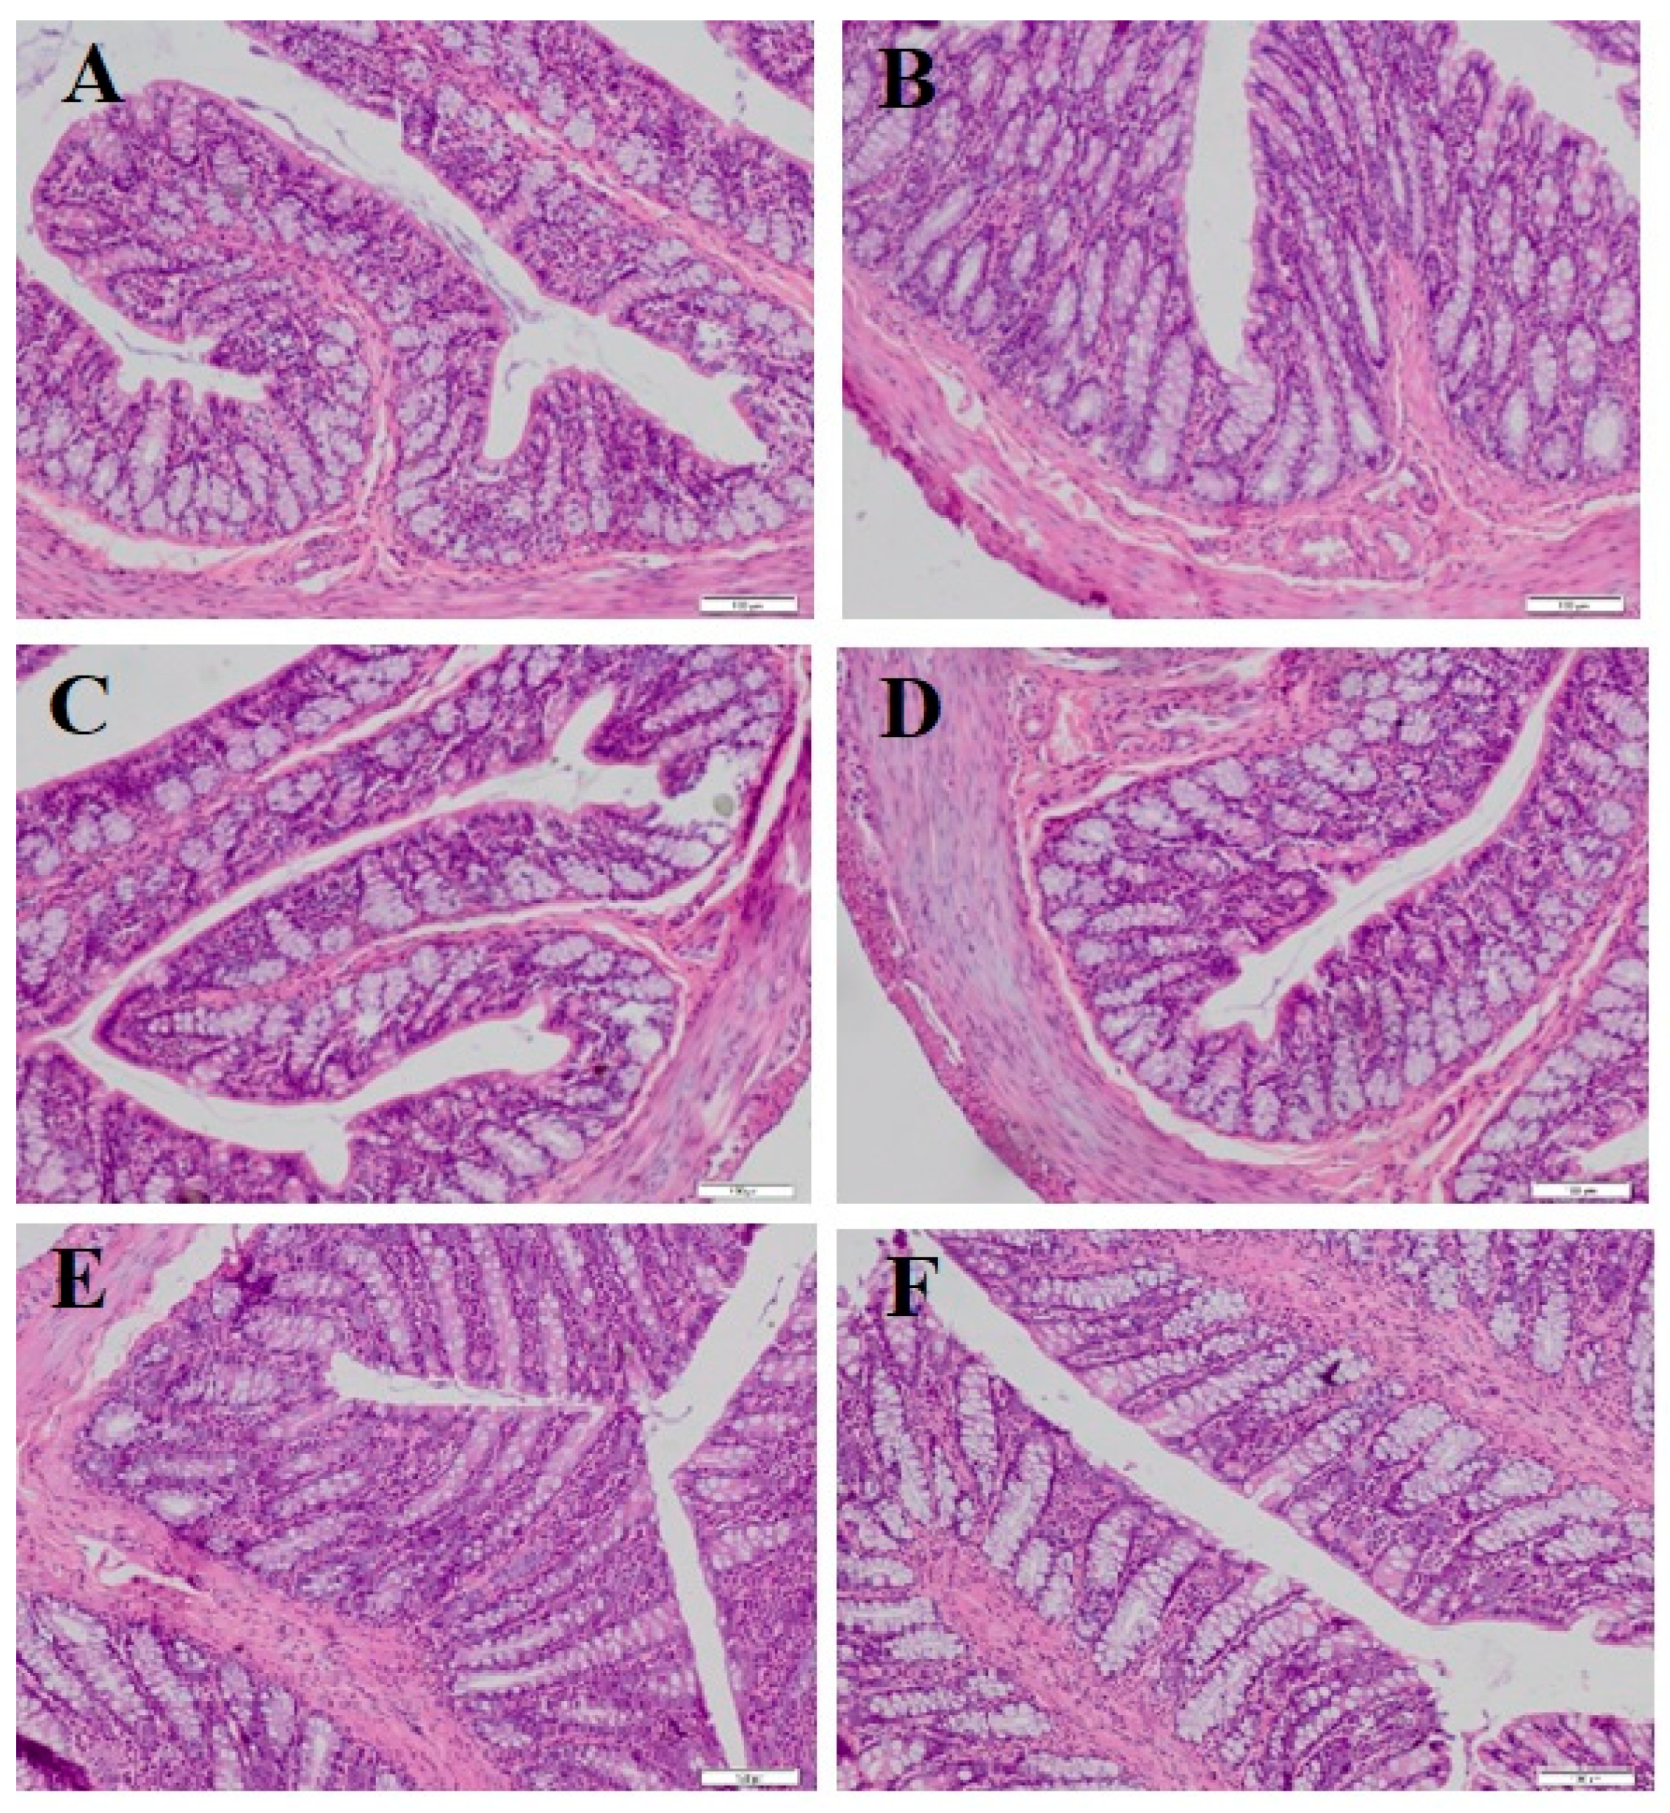

Table 1.
32 Factorial layout CAP-NBLs.
| Variable code | Name of variable | Level of variable | Response name | Aim | ||||||
| -1 | 0 | +1 | ||||||||
| A | Span 60 (mg) | 75 | 100 | 125 | Y1: EE, % | Maximization | ||||
| Y2: Vesicle size, nm. | Minimization | |||||||||
| B | SDC (mg) | 10 | 15 | 20 | Y3: Cumulative % drug amount released at 24 hr, % | Minimization | ||||
| Run code | CAP, mg | PC, mg |
Chol, (mg) | Span 60, (mg) | SDC, (mg) |
Y1 (%) ± SD | Y2 (nm) ± SD | Y3 (%) ± SD | ||
| CBLS1 | 10 | 100 | 25 | 75 | 25 | 63.44±1.222 | 390.23±4.55 | 59.5±4.23 | ||
| CBLS2 | 10 | 100 | 25 | 75 | 10 | 65.77±2.31 | 388.3±3.27 | 57.33±3.67 | ||
| CBLS3 | 10 | 100 | 25 | 125 | 40 | 83.21±2.56 | 299.1±2.26 | 48.2±3.87 | ||
| CBLS4 | 10 | 100 | 25 | 100 | 25 | 77.42±2.34 | 335.7±1.78 | 51.2±2.35 | ||
| CBLS5 | 10 | 100 | 25 | 125 | 25 | 85.33±1.34 | 277.32±4.59 | 47.33±2.69 | ||
| CBLS6 | 10 | 100 | 25 | 100 | 10 | 80.67±2.03 | 322.1±2.31 | 49.32±1.34 | ||
| CBLS7 | 10 | 100 | 25 | 125 | 10 | 87.66±3.45 | 220.32±1.39 | 45.56±3.18 | ||
| CBLS8 | 10 | 100 | 25 | 75 | 40 | 59.44±2.34 | 412.45±3.59 | 63.4±3.26 | ||
| CBLS9 | 10 | 100 | 25 | 100 | 40 | 73.45±2.35 | 370.44±1.27 | 53.31±3.46 | ||
CAP: Capecitabine, PC: phosphatidyl choline, Chol: cholesterol, SDC: sodium deoxycholate.
Table 2.
Characterization parameters of the various CAP-NBLs.
| Run code | CAP content, (%) | VS (nm) | PDI | ZP (mV) |
|---|---|---|---|---|
| CAPB1 | 85.56±2.58 | 390.23±4.55 | 0.243 | –33.4±1.51 |
| CAPB2 | 89.48±1.11 | 388.3±3.27 | 0.139 | –28.9±3.78 |
| CAPB3 | 90.67±3.39 | 299.1±2.26 | 0.381 | –31.6±1.92 |
| CAPB4 | 91.06±2.71 | 335.7±1.78 | 0.422 | –35.5±2.33 |
| CAPB5 | 92.59 ±3.22 | 277.32±4.59 | 0.260 | –33.8±2.21 |
| CAPB6 | 93.98±4.12 | 322.1±2.31 | 0.353 | –34.5±1.08 |
| CAPB7 | 95.22±2.09 | 220.32±1.39 | 0.271 | –37.1±2.18 |
| CAPB8 | 96.00±3.26 | 412.45±3.59 | 0.221 | –36.7±1.35 |
| CAPB9 | 98.2±3.02 | 370.44±1.27 | 0.338 | –35.9±4.27 |
Table 3.
Kinetic analysis of CAP-NBLs release data.
| F. Code | Zero-order, R2 | First-order, R2 | Higuchi-diffusion, R2 | Korsmeyer-Peppas | Fitted-model | |
| R2 | n | |||||
| CAPB1 | 0.877861 | 0.231352 | 0.996992671 | 0.985153 | 0.39091711 | Higuchi-diffusion |
| CAPB2 | 0.877534 | 0.239254 | 0.994897661 | 0.984449 | 0.402202321 | Higuchi-diffusion |
| CAPB3 | 0.922573 | 0.263472 | 0.991695885 | 0.990564 | 0.51890948 | Higuchi-diffusion |
| CAPB4 | 0.905532 | 0.260639 | 0.989901048 | 0.987431 | 0.415700914 | Higuchi-diffusion |
| CAPB5 | 0.92976 | 0.265369 | 0.995379464 | 0.993423 | 0.557861977 | Higuchi-diffusion |
| CAPB6 | 0.910972 | 0.263204 | 0.993672226 | 0.990114 | 0.46313082 | Higuchi-diffusion |
| CAPB7 | 0.93838 | 0.267769 | 0.992308714 | 0.990719 | 0.642869214 | Higuchi-diffusion |
| CAPB8 | 0.882732 | 0.214552 | 0.997750464 | 0.98594 | 0.370924654 | Higuchi-diffusion |
| CAPB9 | 0.862747 | 0.254317 | 0.988279739 | 0.977716 | 0.415257335 | Higuchi-diffusion |
Table 4.
Optimized factor level combination achieving maximum desirability based on response surface methodology.
Table 4.
Optimized factor level combination achieving maximum desirability based on response surface methodology.
| Factor | Low | High | Optimum |
| Span 60, mg | 75 | 125 | 125 |
| SDC, mg | 10 | 40 | 10 |
| Response | Optimum | ||
| Particle size, nm | 244.18 | ||
| EE, % | 89.41 | ||
| Cumulative % drug released at 24 hr | 44.15 | ||
SDC: Sodium deoxycholate, EE: Entrapment efficiency, CAP: Capecitabine.
Table 5.
Permeability parameters of CAP from the optimized CAP-NBLs formulation versus CAP solution (n = 3, mean ± SD).
Table 5.
Permeability parameters of CAP from the optimized CAP-NBLs formulation versus CAP solution (n = 3, mean ± SD).
| Measured parameter | CAP solution | CAP-NBLs |
|---|---|---|
| Total permeated amount of CAP (µg) | 2930 ± 57.50 | 7200 ± 36.10 |
| Cumulative % amount of CAP permeated (%) | 29.3 ± 2.25 | 72.0 ± 1.42 |
| Permeation flux value (Jmax, µg/cm2/hr) | 2.44 ± 1.89 | 6 ± 1.78 |
| APC, cm/min | 2.44 × 10⁻⁴ | 6 × 10⁻⁴ |
| Enhancement ratio (ER) | - | 2.44 |
Table 6.
PKPs of CAP in the optimized CAP-NBLs formulation against CAP solution (n = 3, mean ± SD).
| PKPs | CAP solution | CAP-NBLs |
|---|---|---|
| Cmax (ng/mL) | 4700 ± 105.12 | 15000 ± 272.48 |
| tmax (hr) | 2 ± 0.1 | 6 ± 0.11 |
| AUC0-∞ (ng×hr/mL) | 27703.86 ± 542.32 | 165230.99 ± 616.35 |
| AUMC0-∞ (ng×hr2/mL) | 163042.73 ± 444.44 | 1488673.92 ± 333.56 |
| MRT (hr) | 5.885 ± 0.54 | 9.009 ± 0.67 |
| t1/2 (hr-1) | 2.92 ± 0.32 | 5.00 ± 0.43 |
| Relative bioavailability (%) | - | 596.4 |
Disclaimer/Publisher’s Note: The statements, opinions and data contained in all publications are solely those of the individual author(s) and contributor(s) and not of MDPI and/or the editor(s). MDPI and/or the editor(s) disclaim responsibility for any injury to people or property resulting from any ideas, methods, instructions or products referred to in the content. |
© 2026 by the authors. Licensee MDPI, Basel, Switzerland. This article is an open access article distributed under the terms and conditions of the Creative Commons Attribution (CC BY) license (http://creativecommons.org/licenses/by/4.0/).
Copyright: This open access article is published under a Creative Commons CC BY 4.0 license, which permit the free download, distribution, and reuse, provided that the author and preprint are cited in any reuse.


