

Submitted:
29 July 2026
Posted:
30 July 2026
You are already at the latest version
Abstract
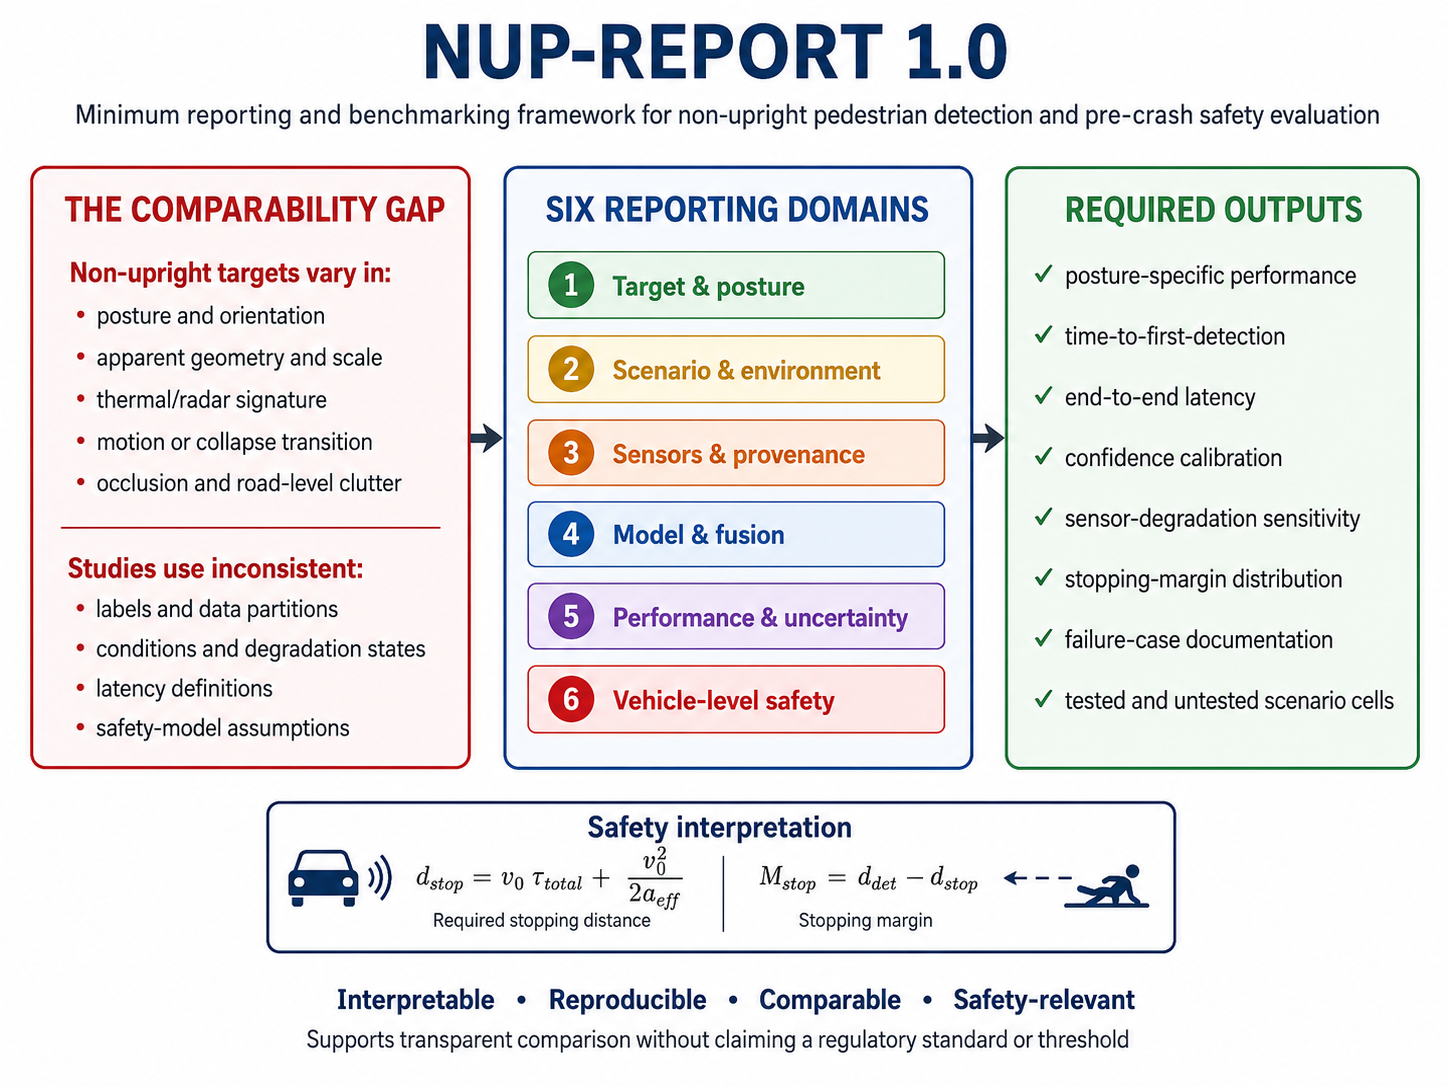
Pedestrian-detection research and vehicle-safety assessment have traditionally concentrated on upright, walking or crossing pedestrians. People who are prone, supine, lateral, seated, crouched, kneeling, partially collapsed or undergoing a fall present different visual, geometric, thermal and kinematic characteristics. These differences can reduce transferability from conventional benchmarks and make apparently similar studies difficult to compare when posture definitions, data provenance, environmental conditions, latency accounting and safety assumptions are reported inconsistently. This article proposes NUP-REPORT 1.0, a minimum reporting and benchmarking framework for non-upright pedestrian detection and pre-crash safety evaluation. The framework was developed through a structured narrative synthesis of five evidence streams: epidemiology of pedestrians lying on the road; pedestrian and multispectral detection benchmarks; uncertainty and calibration methods; scenario-based automated-driving evaluation; and current public safety standards and assessment protocols. A failure-chain decomposition was then used to define six reporting domains: target and posture; scenario and environment; sensors and data provenance; model and fusion architecture; performance and uncertainty; and vehicle-level safety interpretation. NUP-REPORT further proposes a minimum scenario matrix, a core outcome set, explicit timing definitions, stopping-margin equations and a 30-item checklist. The framework distinguishes object-detection accuracy from safety-relevant performance by requiring posture-stratified outcomes, time-to-first-detection, end-to-end latency, confidence calibration, sensor-degradation sensitivity, safety-critical false negatives and transparent vehicle-response assumptions. NUP-REPORT is not a regulatory test protocol, consensus standard or performance threshold. It is a versioned reporting proposal intended to improve interpretability, reproducibility and comparability while supporting future dataset development, inter-laboratory validation and standards engagement.
Keywords:
non-upright pedestrian
; fallen pedestrian
; pedestrian detection
; vulnerable road user
; sensor fusion
; autonomous emergency braking
; safety of the intended functionality
; ISO 21448
; benchmarking
; detection latency
; uncertainty calibration
Highlights
- Defines six minimum reporting domains for non-upright pedestrian detection studies.
- Separates conventional detection accuracy from time-, distance- and vehicle-response-dependent safety outcomes.
- Provides a benchmark scenario matrix, core equations and a 30-item reporting checklist.
- Requires explicit reporting of data provenance, sequence-level splitting, calibration and sensor degradation.
- Maps the proposal to ISO 26262, ISO 21448, ISO 34502, Euro NCAP, UNECE and FMVSS 127 without claiming compliance.
1. Introduction
Road traffic injury remains a major global public-health problem, and pedestrians continue to experience disproportionate risk [1]. Within this population, people lying on the roadway constitute a small but exceptionally severe subgroup. Japanese nationwide data showed that pedestrians lying on the road accounted for 8.3% of pedestrian fatalities but only 0.6% of all pedestrian casualties during 2012–2016 [2]. A subsequent analysis of 2,452 such collisions reported that more than 80% occurred at night and identified impact speed, body-region injury, vehicle type and hit-and-run involvement as important correlates of fatal or severe outcome [3]. These findings establish a clear prevention need but do not, by themselves, specify how vehicle perception systems should be evaluated.
Pedestrian detection has advanced through large datasets, stronger convolutional and transformer architectures, multispectral sensing and multimodal fusion. Canonical benchmarks have improved evaluation of scale, occlusion and urban diversity [4,5,6,7,8,9,10,11]. Behavioural datasets have also enabled modelling of crossing intent and pedestrian action [12,13]. However, the dominant pedestrian representation in these resources remains an upright or approximately upright person. A road-level human body may occupy a wider and lower image region, present weaker conventional shape cues, overlap with debris or shadows, and exhibit a thermal or radar signature that differs from the standing class. The resulting problem is not only lower detection performance. It is also uncertain comparability: two studies may report similar recall while testing different postures, ranges, target surrogates, illumination, sensor states, data partitions and latency boundaries.
Recent work has begun to address fallen-person detection and its safety implications. A multimodal architecture combining long-wave infrared, near-infrared stereo and ultrasonic sensing was evaluated for falling and fallen-person detection [14]. A physics-grounded multimodal framework subsequently addressed kinematic reconstruction and uncertainty propagation after pedestrian impact [15]. Simulation-based research connected non-upright detection to braking and exploratory injury-risk estimation [16], while an integrative preprint linked detection, intervention and forensic reconstruction within a broader prevention architecture [17]. Collectively, these studies suggest that perception, timing, actuation and physical consequences should be interpreted as a chain rather than as isolated results. They do not yet provide a general reporting framework that other research groups can apply independently of a particular architecture.
The need for explicit reporting is reinforced by safety-critical machine-learning research. Modern neural networks can be poorly calibrated [18], predictive uncertainty may degrade substantially under distribution shift [19], and out-of-distribution inputs can remain confidently misclassified [20]. Multimodal systems are also vulnerable to asymmetric sensor degradation, especially in adverse weather [21]. Safety assurance, therefore, requires more than reporting mean average precision or a single overall accuracy. It requires evidence about data provenance, condition-specific failure, calibration, latency and the connection between perception output and vehicle response [22,23,24,25].
This article introduces NUP-REPORT 1.0, a minimum reporting and benchmarking framework for non-upright pedestrian detection and pre-crash safety evaluation. Its objectives are to:
1. Define an operational vocabulary for non-upright targets;
2. specify the minimum information needed to interpret and reproduce a study;
3. distinguish perception accuracy from safety-relevant timing and physical response;
4. propose a minimum benchmark scenario matrix and core outcome set;
5. map the framework to current safety standards and assessment programmes without claiming equivalence or compliance; and
6. Provide a versioned checklist that can be refined through future empirical and multidisciplinary work.
Figure 1 summarises the six-domain NUP-REPORT reporting chain, from target definition to vehicle-level safety interpretation.
2. Scope, Terminology and Framework Development
2.1. Intended Use
NUP-REPORT is intended for research evaluating systems that detect a person in a non-upright configuration in or near a vehicle path. It may be applied to visible-spectrum cameras, thermal imaging, radar, LiDAR, ultrasonic sensing, event cameras, multimodal fusion or other relevant modalities. It is suitable for controlled-track experiments, laboratory studies, naturalistic datasets, simulation, digital twins and hybrid validation programmes.
The framework is designed for a mixed audience comprising computer-vision researchers, automotive engineers, injury-prevention and forensic researchers, test laboratories, consumer-assessment organisations, regulators and standards specialists. It can be used prospectively when designing a study or retrospectively when appraising an existing publication.
NUP-REPORT is not:
- a certification or homologation standard;
- a replacement for Euro NCAP, UNECE, NHTSA or ISO procedures;
- a validated performance threshold;
- evidence that a particular detector is deployment-ready;
- a requirement to test every conceivable scenario; or
- a claim that modelled stopping or injury outcomes represent observed real-world benefit.
2.2. Operational Definition of a Non-Upright Pedestrian
A non-upright pedestrian is defined here as a person whose observable body configuration differs materially from the standing, normally walking or running posture assumed in conventional pedestrian-detection datasets and vehicle test targets. The term describes posture, not cause. It should therefore not be replaced by causal labels such as “intoxicated”, “unconscious” or “medically incapacitated” unless those states are independently established.
Table 1 provides the minimum recommended posture vocabulary. Studies may add subclasses, but they should preserve the observable configuration and orientation information needed for comparison.
2.3. Framework-Development Method
NUP-REPORT was developed as a structured narrative framework, not a systematic review or formal consensus guideline. Source material was selected from five evidence streams through July 2026:
2. canonical pedestrian, traffic-scene and multispectral benchmarks [4,5,6,7,8,9,10,11,12,13,21,26];
5. public standards, regulations and assessment protocols relevant to functional safety, SOTIF, scenarios, pedestrian targets and AEB [30,31,32,33,34,35,36,37,38,39].
A failure-chain decomposition was applied from target representation → sensing and data → model inference → uncertainty and timing → vehicle response → safety interpretation. Candidate reporting items were retained when omission could plausibly:
- prevent independent reproduction;
- invalidate cross-study comparison;
- conceal a safety-critical subgroup failure;
- make a latency claim ambiguous;
- confound measured and modelled evidence; or
- overstate the relationship between perception accuracy and collision avoidance.
The six resulting domains were then mapped against current standards and public assessment materials to clarify complementarity and boundaries. No Delphi panel, formal stakeholder vote or multi-laboratory validation was undertaken. Consequently, Version 1.0 is presented as a testable proposal for community refinement.
3. Why Conventional Reporting Is Insufficient
3.1. Dataset Representation and Hidden Pooling
Pedestrian datasets differ in geographic coverage, camera placement, target scale, occlusion, annotation policy and train/test construction [4,5,6,7,8,9,10,11]. Those differences already complicate comparison for upright detection. Non-upright detection introduces additional variation in torso orientation, projected aspect ratio, limb configuration, contact with the road plane and resemblance to non-human objects.
A study can appear large while containing limited independent evidence. Frame-level random splitting may place adjacent frames from the same sequence, the same actor, the same location or the same rendered scene in both training and testing. This can inflate apparent generalisation. NUP-REPORT therefore treats the sequence, event, actor, location and synthetic seed as relevant units of independence, not merely the image.
Synthetic data are valuable because rare and hazardous scenarios are difficult to collect. However, synthetic and real samples should not be pooled without disclosure. Rendering engine, sensor model, target model, domain randomisation, noise assumptions and the role of synthetic data in training and testing must be reported. A result obtained entirely from simulation should not be presented as real-world validation.
3.2. Pooled Accuracy Can Conceal the Safety-Critical Subgroup
Overall accuracy, precision, recall and mean average precision remain useful, but they can conceal poor performance in rare subgroups. For example, a dataset dominated by upright daytime targets may yield high aggregate recall even if prone nighttime targets are frequently missed. A pooled average also hides whether performance deteriorates under rain, reflective roads, occlusion, sensor contamination or modality loss.
NUP-REPORT therefore requires stratification by the conditions actually tested. At a minimum, posture-specific sample counts and outcomes should be provided. When sample size permits, posture should be crossed with range, illumination, occlusion and sensor state. Untested cells should be visible rather than implicitly treated as covered.
3.3. Confidence Is Not Equivalent to Reliability
A detector confidence score is not automatically a calibrated probability of correctness. Calibration is especially important when confidence controls sensor weighting, temporal confirmation, warning or braking. Expected calibration error, reliability diagrams, Brier score or other appropriate measures should therefore be reported when confidence is safety-relevant [18]. Calibration should be evaluated separately under nominal and shifted conditions because apparently well-calibrated models can degrade under distribution shift [19].
Out-of-distribution detection, selective prediction or abstention mechanisms may be useful, but their own false-negative and latency consequences must be reported. A system that abstains safely in a research benchmark may still leave the vehicle without sufficient time to intervene.
3.4. Inference Time Is Not End-to-End Latency
Studies often report neural-network inference time while omitting sensor exposure, readout, pre-processing, synchronisation, temporal confirmation, fusion, communication and actuator delay. For a moving vehicle, each component consumes distance. A 20 ms inference time does not imply a 20 ms perception-to-brake response.
NUP-REPORT therefore distinguishes:
- time to first detection (TTFD): delay from the first eligible sensor observation to the first valid detection;
- inference latency: model execution time for a defined hardware and input configuration;
- decision latency: additional temporal confirmation, tracking and decision logic;
- actuation latency: command transfer, brake-system delay and force build-up; and
- total response delay: the combined delay relevant to stopping-distance analysis.
Figure 2 illustrates the required separation of detection availability, inference and decision processing, system-response delay and physical deceleration.
4. The Six NUP-REPORT Domains
Table 2 summarises the six domains and identifies minimum and extended items. “Minimum” indicates information normally required to interpret a study. “Extended” indicates information strongly recommended when the corresponding method or claim is present.
4.1. Domain 1: Target and Posture
Every study should state exactly what counts as a positive target. Bounding-box aspect ratio alone is insufficient because a prone person, a bag, a blanket, road debris and a shadow may have similar two-dimensional geometry. The negative dataset should therefore include hard negatives that resemble a road-level human signature in one or more modalities.
Human participants, mannequins, articulated pedestrian targets, digital humans and simplified synthetic objects should be reported separately. When a surrogate is used, the study should describe which properties are human-representative and which are not. A thermally unrepresentative mannequin, for example, cannot establish thermal-detection performance without additional justification.
For falls or collapses, frame-level labels should distinguish the transition from the final stable posture. A prediction claim should identify the event definition and lead time relative to a clearly stated transition point.
4.2. Domain 2: Scenario and Environment
Scenario variables determine both detectability and physical intervention opportunity. Minimum reporting should include vehicle speed, target range, lane position, target orientation, movement state, illumination, weather, road surface, occlusion and background clutter.
Illumination should be quantified when possible rather than described only as “day” or “night”. The weather should distinguish the presence and severity of rain, fog or snow. Wet and reflective road surfaces should be reported because they may alter visible, near-infrared, thermal and LiDAR response. Headlamp state, direct glare and sensor contamination should be reported when relevant.
The initial detection distance should be measured relative to a defined target reference point. When lateral offset or road curvature materially affects the line of sight, a simple longitudinal distance may be insufficient, and the coordinate convention should be stated.
4.3. Domain 3: Sensors and Data Provenance
Sensor reporting should permit another laboratory to understand the physical measurement process. At minimum, studies should state modality, resolution or angular resolution, field of view, frame or scan rate, mounting position, calibration method and synchronisation procedure.
Data provenance should identify the source, collection period, geographic context, annotation procedure and unit of independence. Real, augmented and synthetic data should be separately enumerated. If public datasets are combined, the contribution of each source to training, validation and testing should be stated.
Sequence-level leakage is a major concern. Adjacent frames, repeated actors, near-identical simulations or the same location under minor variation should not be split randomly across training and testing without a sensitivity analysis. The preferred approach is group-wise partitioning by event, actor, location and synthetic seed.
4.4. Domain 4: Model and Fusion Architecture
The study should report model family and version, input resolution, pretraining source, fine-tuning procedure, class definitions, confidence threshold, non-maximum-suppression settings, tracking method, temporal confirmation, and compute hardware.
Multimodal research should include modality-specific baselines. The fused model should not be compared only with a weak or differently trained single-camera baseline. Ablation should remove or degrade one modality at a time while holding other factors constant. Missing-modality handling should also be disclosed: zero-filling, learned masking, fallback model, confidence reweighting and system shutdown are not equivalent strategies.
Latency should be reported for the deployed numerical precision and hardware. Batch-processing throughput is not equivalent to single-sample real-time latency. Warm-up, data transfer and pre/post-processing should be included or explicitly excluded.
4.5. Domain 5: Performance and Uncertainty
At minimum, precision, recall, false-negative count, sample size and uncertainty interval should be provided for each principal posture class. When the task is object detection, the intersection-over-union threshold and matching policy should be specified. For sequence-based detection, the valid-detection persistence criterion should be stated.
A safety-critical false negative is not simply any missed frame. It is a target that remains undetected beyond a pre-defined intervention boundary. Studies should therefore report both frame-level metrics and event-level safety-critical miss rates.
Calibration should be evaluated when confidence affects fusion or intervention. Reliability diagrams and ECE are useful, but binning choices and sample counts should be reported. Calibration should be stratified by posture or condition where practical.
Failure analysis should show representative false negatives and false positives, including modality-specific evidence. Failure cases should not be limited to visually obvious examples. Near-threshold and high-confidence failures are particularly informative.
4.6. Domain 6: Vehicle-Level Safety Interpretation
A detection result becomes safety-relevant only through time, distance and vehicle response. Studies that estimate collision avoidance or mitigation should report initial vehicle speed, detection distance, TTFD, total delay, effective deceleration, friction/gradient assumptions, brake-force build-up and whether steering is considered.
Measured vehicle tests, simulation and analytical calculations must be labelled separately. Modelled residual impact speed or injury probability should not be described as observed effectiveness. Sensitivity analysis should vary the assumptions that dominate the result, especially detection distance, delay and deceleration.
5. Minimum Benchmark Scenario Matrix
The minimum matrix is intended to reveal coverage, not to require a fully factorial experiment. Each study should display tested and untested cells and explain why selected combinations were prioritised. The benchmark dimensions and recommended reporting levels are summarised in Table 3.
Figure 3 visualises how target configuration, operating conditions and sensor state should converge on an explicit condition-stratified coverage map.
6. Core Outcome Set and Equations
6.1. Time-to-First-Detection
Let denote the first time at which the target is eligible for detection according to the study protocol, and the time of the first valid detection that satisfies the stated confidence and persistence rule:
Eligibility must be defined prospectively. It may be based on the field of view, minimum visible area, range or a known simulation onset. The definition should not be chosen after reviewing the model output.
6.2. End-to-End Latency
The total detection-to-brake-force delay should be decomposed as:
where is inference and pre/post-processing latency, is temporal confirmation and decision latency, and is communication, actuator and brake-force build-up delay. Studies may use a more detailed decomposition, but all included and excluded components should be explicit.
6.3. Time to Collision
For a stationary target and constant longitudinal relative speed :
This simple definition is not appropriate when relative speed, curvature or target motion changes materially; the model used in those cases should be stated.
6.4. Required Stopping Distance
Under constant effective deceleration magnitude after the total delay:
The first term is the distance travelled before effective braking, and the second is the idealised braking distance. If brake build-up is modelled explicitly rather than absorbed into or , the resulting piecewise formulation should be provided.
6.5. Stopping Margin
A positive margin indicates physical stopping feasibility under the stated assumptions. It does not prove collision avoidance because steering, road friction, target motion, controller constraints and surrounding traffic may alter the outcome.
6.6. Residual Impact Speed
When the available post-delay distance is insufficient for a full stop, an idealised residual impact speed is:
The equation is valid only when the available braking distance is interpreted consistently, and constant effective deceleration is a reasonable approximation.
6.7. Expected Calibration Error
For confidence bins , empirical accuracy and mean confidence :
ECE should be accompanied by binning rules, sample counts and preferably a reliability diagram. Adaptive or class-conditional alternatives may be appropriate when sample distributions are highly imbalanced.
6.8. Safety-Critical False-Negative Rate
Let when event is not validly detected before a predefined intervention boundary and otherwise. For eligible events:
The intervention boundary may be defined by TTC, stopping distance or a validated control criterion. It must be specified before outcome analysis. Table 4 consolidates the proposed core outcome set and the minimum reporting expectations for each outcome.
7. Reporting Analysis and Uncertainty
7.1. Unit of Analysis
The study should distinguish frame-level, sequence-level and event-level analyses. Frame-level confidence intervals are inappropriate when thousands of correlated frames arise from a small number of independent events. The preferred unit for safety claims is the independent event or scenario replicate.
When uncertainty is estimated by bootstrap, resampling should occur at the highest relevant clustering level, such as event, actor or route. The number of independent clusters and bootstrap replicates should be reported.
7.2. Threshold Selection
Confidence and persistence thresholds should be selected using training or validation data, not the final test set. Threshold sensitivity should be shown when the main conclusion changes materially across plausible settings. A single threshold optimised for the overall F1 score may not be suitable for a safety-critical rare class.
7.3. Missing and Failed Sensor Data
Studies should distinguish data that are absent because a modality was intentionally removed, technically unavailable, corrupted, outside the range or rejected by quality control. Missing data should not be silently replaced by nominal values. The fusion strategy used under missing-modality conditions should be reported and evaluated.
7.4. Statistical Reporting
Principal outcomes should include uncertainty intervals rather than only point estimates. Exact binomial, Wilson or bootstrap intervals may be used as appropriate. Multiple hypothesis testing should be controlled when many subgroup comparisons are presented. Effect sizes and absolute error counts are more informative than isolated p-values. Versioned datasets, models and evaluation artefacts can also reduce the hidden technical debt that otherwise accumulates in machine-learning systems [40].
8. Relationship to Standards, Regulations and Assessment Protocols
NUP-REPORT is intended to organise research evidence that may later inform assurance or protocol development. It does not establish compliance with any standard. Table 5 maps NUP-REPORT to selected standards, regulations and assessment frameworks while clarifying the boundary of the present proposal.
8.1. Functional Failure Versus Performance Insufficiency
A missing camera frame, corrupted sensor stream or failed communication link may be treated as a malfunctioning behaviour relevant to functional safety. A correctly functioning perception stack that fails to recognise a prone person because the target lies outside its training distribution may instead represent a functional insufficiency relevant to SOTIF. NUP-REPORT requires both categories to be reported where applicable, rather than pooling them as generic “errors”.
8.2. Regulatory and Consumer-Test Boundaries
Public vehicle-test programmes necessarily use defined, reproducible targets and scenarios. Research on non-upright postures should therefore avoid implying that an exploratory simulation is equivalent to a regulatory test. The appropriate pathway is staged: transparent reporting, representative data, target development, inter-laboratory reproducibility, threshold research and stakeholder review.
9. Recommended Implementation Pathway
Version 1.0 should be treated as a starting point. A credible path to broader adoption comprises six stages:
1. Framework release: publish the checklist, metric definitions and scenario vocabulary in reusable formats.
2. Dataset audit: quantify the prevalence and quality of non-upright annotations in existing datasets.
3. Open benchmark: release reference scenarios, hard negatives, sequence-level partitions and benchmark cards.
4. Inter-laboratory study: evaluate common scenarios across different sensors, models, laboratories and geographic settings.
5. Threshold research: link perception timing to measured vehicle response and validated injury outcomes.
6. Standards engagement: submit the accumulated evidence to consumer-test, regulatory and ISO stakeholders through established change processes.
Figure 4 presents the proposed staged pathway from framework release to standards engagement.
9.1. Versioning
Future releases should use semantic versioning:
- x: clarification or addition of reporting items without changing the conceptual framework;
- 2.0: major restructuring after external consultation or validation; and
- domain extensions: optional modules for heavy vehicles, low-speed manoeuvring, vulnerable children, wheelchair users or other specialised contexts.
Each version should include a change log and an archived checklist. Publications should cite the version applied.
10. Limitations
NUP-REPORT 1.0 has several important limitations.
First, it is a single-author framework based on structured narrative synthesis rather than a formal systematic review, Delphi process or standards committee. The proposal may therefore omit variables considered essential by other disciplines or regions.
Second, the minimum scenario matrix is intentionally broad and does not define exact parameter values. Appropriate speeds, ranges, illumination levels and degradation severities will depend on the ODD, vehicle class, sensor configuration and intended use.
Third, the framework does not provide validated performance thresholds. Defining acceptable recall, latency, calibration or stopping margin requires representative data, risk analysis and empirical vehicle testing.
Fourth, the stopping equations are simplified. Real braking and steering response may depend on tyre-road friction, brake build-up, anti-lock control, road gradient, vehicle load, curvature, target motion and surrounding traffic. Studies should use higher-fidelity models when these factors are material.
Fifth, reporting quality cannot substitute for dataset representativeness. Rare non-upright events remain difficult to capture ethically and at scale. Synthetic data and surrogates will remain necessary, but their domain gap must be quantified.
Finally, the framework cites prior work by the author and collaborators because those publications directly motivate the detection, uncertainty and safety-integration problem [14,15,16,17]. The present article does not reuse their datasets, case material or unpublished contributions; it proposes an independent reporting structure based on published literature and public standards.
11. Conclusions
Non-upright pedestrians present a distinct perception and pre-crash safety-evaluation problem. Studies cannot be compared reliably when posture labels, target surrogates, data partitions, environmental conditions, sensor states, latency boundaries and vehicle-response assumptions remain implicit.
NUP-REPORT 1.0 provides a six-domain framework covering target and posture; scenario and environment; sensors and data provenance; model and fusion architecture; performance and uncertainty; and vehicle-level safety interpretation. It adds a minimum scenario matrix, core outcome set, explicit timing and stopping-margin equations, standards mapping and a 30-item checklist.
The central principle is that object-detection accuracy is not equivalent to safety performance. A detector must be evaluated in terms of when and where it produces a valid output, how its confidence behaves under shift, how it degrades when sensors fail, and what physical intervention opportunity remains. By making these elements visible, NUP-REPORT can support more reproducible research, more meaningful comparison and a defensible path from exploratory studies to shared benchmarks and, eventually, evidence-based protocol development.
Author Contributions
N.B.: Conceptualisation; methodology; framework development; literature synthesis; visualisation; writing—original draft; writing—review and editing.
Funding
No external funding was received for the preparation of this framework article.
Ethics approval
Not applicable. This article reports no research involving human participants, animals or identifiable personal data.
Data availability
No new dataset was generated or analysed. All sources used are published literature, public standards or publicly available assessment documents.
Conflicts of interest
The author is a named inventor on Japanese Patent Application No. 2025-167440 concerning technology related to fallen-person detection. The framework presented here is a reporting proposal and does not evaluate or endorse a commercial product. The author declares no other competing interests.
Authorship and provenance statement
The manuscript was independently conceptualised and written by N.B. It draws only on published sources and public standards. No unpublished data, case material or uncredited intellectual contributions from prior co-authored studies were used.
Artificial-intelligence-assisted tools
OpenAI ChatGPT was used for language editing, document formatting and figure-layout assistance. The author selected the framework, verified the cited sources, reviewed all equations and retains full responsibility for the accuracy, originality and conclusions of the manuscript.
Abbreviations and Notation
| Term | Definition |
| AEB | Autonomous emergency braking |
| ADAS | Advanced driver-assistance system |
| ECE | Expected calibration error |
| FNR | False-negative rate |
| NUP | Non-upright pedestrian |
| ODD | Operational design domain |
| SOTIF | Safety of the intended functionality |
| TTC | Time to collision |
| TTFD | Time to first detection |
| a_eff | Effective longitudinal deceleration magnitude (m/s²) |
| d_det | Longitudinal distance available at valid detection (m) |
| d_stop | Required stopping distance (m) |
| M_stop | Stopping margin (m) |
| v₀ | Initial vehicle speed (m/s) |
| v_imp | Residual impact speed (m/s) |
| τ_total | Total detection-to-brake-force delay (s) |
Appendix A. NUP-REPORT 1.0 Checklist
The complete 30-item NUP-REPORT 1.0 checklist is provided in Table 6 and may be used prospectively during study design or retrospectively during manuscript appraisal.

Table 6.
Thirty-item NUP-REPORT 1.0 reporting checklist.
| No. | Domain | Minimum reporting item | Reported? / location |
|---|---|---|---|
| 1 | Target | Define every included posture category operationally | |
| 2 | Target | State target orientation relative to the vehicle path | |
| 3 | Target | Distinguish static posture from fall/collapse transition | |
| 4 | Target | Describe a human, mannequin, articulated or digital target | |
| 5 | Target | Report body-size category and relevant thermal/visual properties | |
| 6 | Target | Include and describe difficult negative objects | |
| 7 | Scenario | Report ego speed and target motion state | |
| 8 | Scenario | Report initial range and target lane position | |
| 9 | Scenario | Report illumination and headlamp state | |
| 10 | Scenario | Report weather and road-surface condition | |
| 11 | Scenario | Quantify occlusion and background clutter | |
| 12 | Data | Report sensor modality, resolution/rate and mounting | |
| 13 | Data | Describe calibration and synchronisation | |
| 14 | Data | Separate real, augmented and synthetic samples | |
| 15 | Data | Explain the annotation procedure and quality control | |
| 16 | Data | Use or justify event/actor/location/seed-level partitioning | |
| 17 | Model | Identify architecture, version, pretraining and input resolution | |
| 18 | Model | Report confidence, matching and persistence thresholds | |
| 19 | Model | Describe fusion level, temporal logic and missing-modality handling | |
| 20 | Model | Provide modality-specific baselines and ablation where applicable | |
| 21 | Performance | Report sample counts and posture-specific precision/recall | |
| 22 | Performance | Report false-negative counts and safety-critical FNR | |
| 23 | Performance | Report time-to-first-detection and distance to detection | |
| 24 | Performance | Report end-to-end latency with component decomposition | |
| 25 | Performance | Report confidence calibration when confidence affects decisions | |
| 26 | Performance | Provide uncertainty intervals using the correct unit of analysis | |
| 27 | Performance | Document representative and high-confidence failure cases | |
| 28 | Safety | State braking, friction, gradient and actuator assumptions | |
| 29 | Safety | Distinguish measured, simulated and analytical outcomes | |
| 30 | Safety | Report stopping margin/residual impact speed and sensitivity analysis |
References
- World Health Organization. Global Status Report on Road Safety 2023. Geneva: World Health Organization; 2023.
- Hitosugi M, Kagesawa E, Narikawa T, Nakamura M, Koh M, Hattori S. Hit-and-runs more common with pedestrians lying on the road: analysis of a nationwide database in Japan. Chinese Journal of Traumatology. 2021;24(2):83–87. [CrossRef]
- Koh M, Hitosugi M, Kagesawa E, Narikawa T, Takashima K. Factors influencing fatalities or severe injuries to pedestrians lying on the road in Japan: nationwide police database study. Healthcare. 2021;9(11):1433. [CrossRef]
- Dollár P, Wojek C, Schiele B, Perona P. Pedestrian detection: an evaluation of the state of the art. IEEE Transactions on Pattern Analysis and Machine Intelligence. 2012;34(4):743–761. [CrossRef]
- Dalal N, Triggs B. Histograms of oriented gradients for human detection. In: Proceedings of the IEEE Computer Society Conference on Computer Vision and Pattern Recognition. 2005;1:886–893. [CrossRef]
- Zhang S, Benenson R, Schiele B. CityPersons: a diverse dataset for pedestrian detection. In: Proceedings of the IEEE Conference on Computer Vision and Pattern Recognition. 2017:4457–4465. [CrossRef]
- Braun M, Krebs S, Flohr F, Gavrila DM. EuroCity Persons: a novel benchmark for person detection in traffic scenes. IEEE Transactions on Pattern Analysis and Machine Intelligence. 2019;41(8):1844–1861. [CrossRef]
- Hwang S, Park J, Kim N, Choi Y, Kweon IS. Multispectral pedestrian detection: benchmark dataset and baseline. In: Proceedings of the IEEE Conference on Computer Vision and Pattern Recognition. 2015:1037–1045. [CrossRef]
- Cordts M, Omran M, Ramos S, et al. The Cityscapes dataset for semantic urban scene understanding. In: Proceedings of the IEEE Conference on Computer Vision and Pattern Recognition. 2016:3213–3223. [CrossRef]
- Geiger A, Lenz P, Urtasun R. Are we ready for autonomous driving? The KITTI Vision Benchmark Suite. In: Proceedings of the IEEE Conference on Computer Vision and Pattern Recognition. 2012:3354–3361. [CrossRef]
- Caesar H, Bankiti V, Lang AH, et al. nuScenes: a multimodal dataset for autonomous driving. In: Proceedings of the IEEE/CVF Conference on Computer Vision and Pattern Recognition. 2020:11621–11631. [CrossRef]
- Sun P, Kretzschmar H, Dotiwalla X, et al. Scalability in perception for autonomous driving: Waymo Open Dataset. In: Proceedings of the IEEE/CVF Conference on Computer Vision and Pattern Recognition. 2020:2446–2454. [CrossRef]
- Rasouli A, Kotseruba I, Tsotsos JK. Are they going to cross? A benchmark dataset and baseline for pedestrian crosswalk behavior. In: Proceedings of the IEEE International Conference on Computer Vision Workshops. 2017:206–213. [CrossRef]
- Barua N, Hitosugi M. Advanced multi-modal sensor fusion system for detecting falling humans: quantitative evaluation for enhanced vehicle safety. Vehicles. 2025;7(4):149. [CrossRef]
- Barua N, Hitosugi M. A physics-grounded multi-modal sensor fusion framework for pedestrian impact kinematic reconstruction under uncertainty: Phase 1 design and theoretical evaluation. Sensors. 2026;26(11):3387. [CrossRef]
- Barua N, Hitosugi M. A multi-modal AI system for detecting pedestrians lying on the road: simulation-based safety and injury risk analysis. Vehicles. 2026;8(6):136. [CrossRef]
- Barua N, Hitosugi M. From detection to forensics: an integrated safety architecture for fallen pedestrian protection. Preprints. 2026. [CrossRef]
- Guo C, Pleiss G, Sun Y, Weinberger KQ. On calibration of modern neural networks. In: Proceedings of the 34th International Conference on Machine Learning. 2017;70:1321–1330.
- Ovadia Y, Fertig E, Ren J, et al. Can you trust your model’s uncertainty? Evaluating predictive uncertainty under dataset shift. In: Advances in Neural Information Processing Systems. 2019;32.
- Hendrycks D, Gimpel K. A baseline for detecting misclassified and out-of-distribution examples in neural networks. In: International Conference on Learning Representations. 2017.
- Bijelic M, Gruber T, Mannan F, et al. Seeing through fog without seeing fog: deep multimodal sensor fusion in unseen adverse weather. In: Proceedings of the IEEE/CVF Conference on Computer Vision and Pattern Recognition. 2020:11682–11692. [CrossRef]
- Kendall A, Gal Y. What uncertainties do we need in Bayesian deep learning for computer vision? In: Advances in Neural Information Processing Systems. 2017;30.
- Ashmore R, Calinescu R, Paterson C. Assuring the machine learning lifecycle: desiderata, methods, and challenges. ACM Computing Surveys. 2021;54(5):Article 111. [CrossRef]
- Menzel T, Bagschik G, Maurer M. Scenarios for development, test and validation of automated vehicles. In: 2018 IEEE Intelligent Vehicles Symposium. 2018:1821–1827. [CrossRef]
- Bagschik G, Menzel T, Maurer M. Ontology based scene creation for the development of automated vehicles. In: 2018 IEEE Intelligent Vehicles Symposium. 2018:1813–1820. [CrossRef]
- Rasouli A, Kotseruba I, Kunic T, Tsotsos JK. PIE: a large-scale dataset and models for pedestrian intention estimation and trajectory prediction. In: Proceedings of the IEEE/CVF International Conference on Computer Vision. 2019:6261–6270. [CrossRef]
- Lakshminarayanan B, Pritzel A, Blundell C. Simple and scalable predictive uncertainty estimation using deep ensembles. In: Advances in Neural Information Processing Systems. 2017;30.
- Koopman P, Wagner M. Challenges in autonomous vehicle testing and validation. SAE International Journal of Transportation Safety. 2016;4(1):15–24. [CrossRef]
- Neurohr C, Westhofen L, Butz M, et al. Criticality analysis for the verification and validation of automated vehicles. IEEE Access. 2021;9:18016–18041. [CrossRef]
- International Organization for Standardization. ISO 26262:2018 Road Vehicles—Functional Safety. Geneva: ISO; 2018.
- International Organization for Standardization. ISO 21448:2022 Road Vehicles—Safety of the Intended Functionality. Geneva: ISO; 2022.
- International Organization for Standardization. ISO 34501:2022 Road Vehicles—Test Scenarios for Automated Driving Systems—Vocabulary. Geneva: ISO; 2022.
- International Organization for Standardization. ISO 34502:2022 Road Vehicles—Test Scenarios for Automated Driving Systems—Scenario-Based Safety Evaluation Framework. Geneva: ISO; 2022.
- International Organization for Standardization. ISO 19206-2:2018 Road Vehicles—Test Devices for Target Vehicles, Vulnerable Road Users and Other Objects, for Assessment of Active Safety Functions—Part 2: Requirements for Pedestrian Targets. Geneva: ISO; 2018.
- European New Car Assessment Programme. 2026 Protocols. Euro NCAP; 2026. Accessed 29 July 2026.
- European New Car Assessment Programme. AEB/LSS VRU Systems Test Protocol, Version 4.4. Euro NCAP; June 2023.
- United Nations Economic Commission for Europe. UN Regulation No. 152: Uniform Provisions Concerning the Approval of Motor Vehicles with Regard to the Advanced Emergency Braking System for M1 and N1 Vehicles. Geneva: UNECE.
- National Highway Traffic Safety Administration. Federal Motor Vehicle Safety Standards; Automatic Emergency Braking Systems for Light Vehicles, FMVSS No. 127. Washington, DC: U.S. Department of Transportation; 2024, as amended.
- SAE International. J3016_202104: Taxonomy and Definitions for Terms Related to Driving Automation Systems for On-Road Motor Vehicles. Warrendale, PA: SAE International; 2021.
- Sculley D, Holt G, Golovin D, et al. Hidden technical debt in machine learning systems. In: Advances in Neural Information Processing Systems. 2015;28.
Figure 1.
NUP-REPORT 1.0 six-domain reporting chain. The framework proceeds from target definition to vehicle-level safety interpretation. It specifies reporting content and does not establish pass/fail thresholds.
Figure 1.
NUP-REPORT 1.0 six-domain reporting chain. The framework proceeds from target definition to vehicle-level safety interpretation. It specifies reporting content and does not establish pass/fail thresholds.
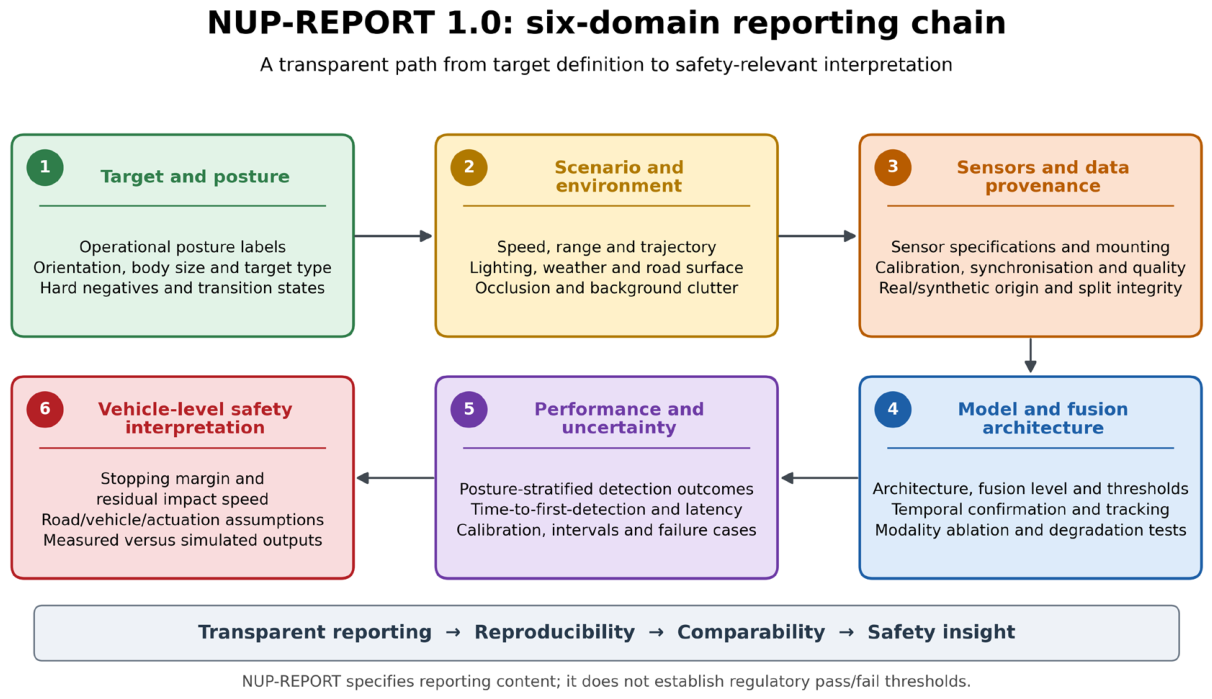
Figure 2.
Safety-relevant timing and stopping-margin decomposition. Time-to-first-detection, inference and decision processing, system-response delay and physical deceleration are reported separately. Stopping feasibility depends on available detection distance, total system delay and effective deceleration under the stated assumptions.
Figure 2.
Safety-relevant timing and stopping-margin decomposition. Time-to-first-detection, inference and decision processing, system-response delay and physical deceleration are reported separately. Stopping feasibility depends on available detection distance, total system delay and effective deceleration under the stated assumptions.
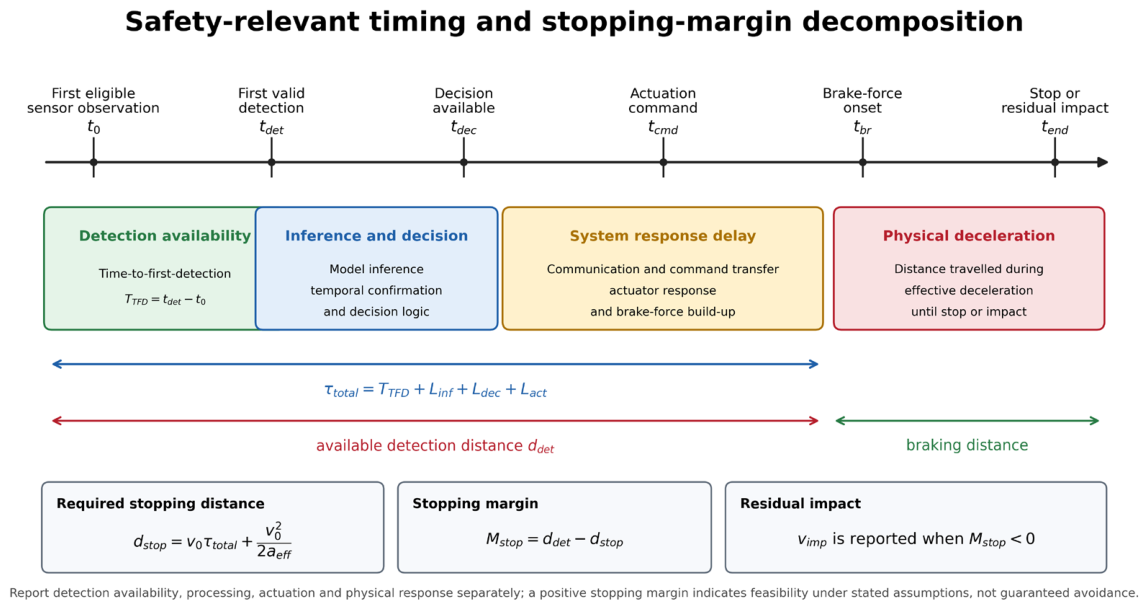
Figure 3.
Minimum benchmark design. Target, operating-condition and sensor-state dimensions converge on a visible coverage map with condition-stratified outcomes. Symbols in the example matrix are illustrative and do not represent performance data.
Figure 3.
Minimum benchmark design. Target, operating-condition and sensor-state dimensions converge on a visible coverage map with condition-stratified outcomes. Symbols in the example matrix are illustrative and do not represent performance data.
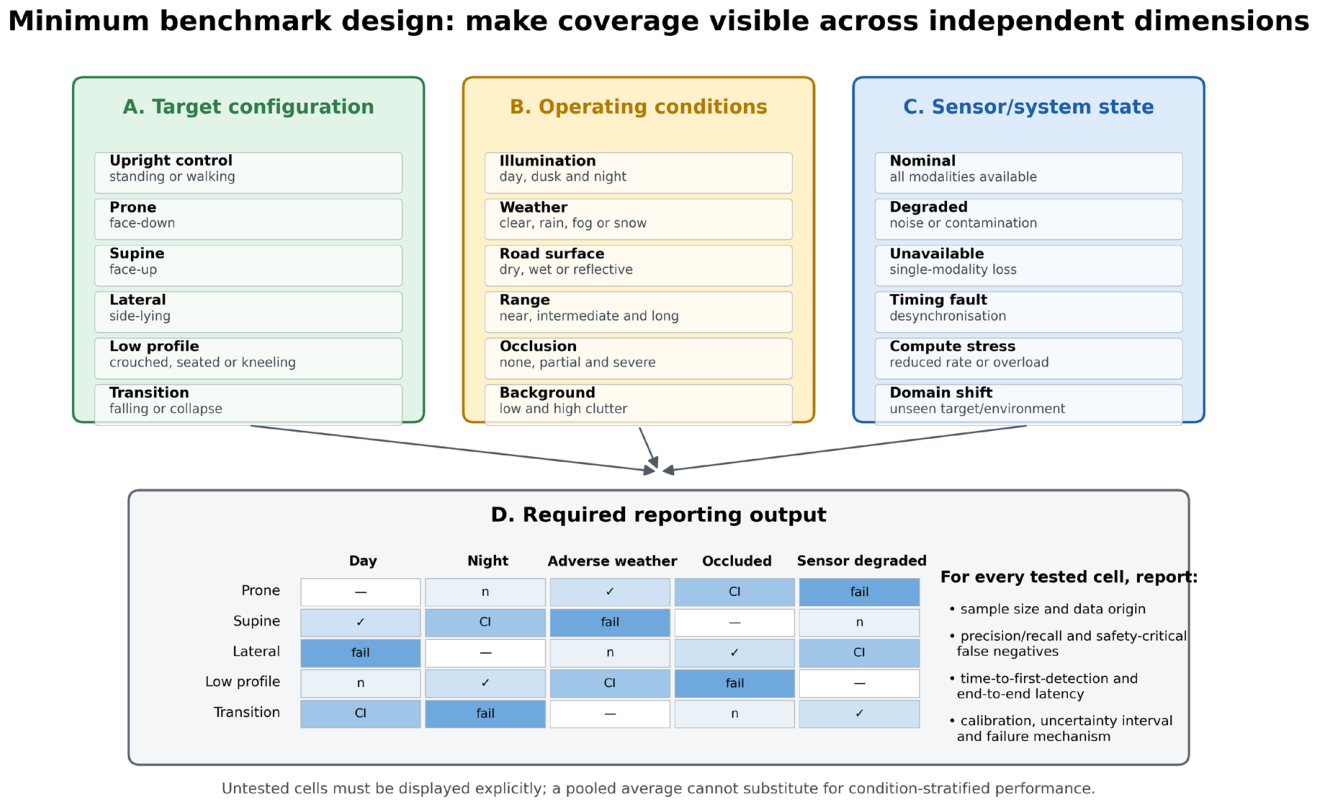
Figure 4.
Proposed adoption and validation pathway. Performance thresholds and protocol changes should follow representative data, inter-laboratory evidence and formal stakeholder review.
Figure 4.
Proposed adoption and validation pathway. Performance thresholds and protocol changes should follow representative data, inter-laboratory evidence and formal stakeholder review.
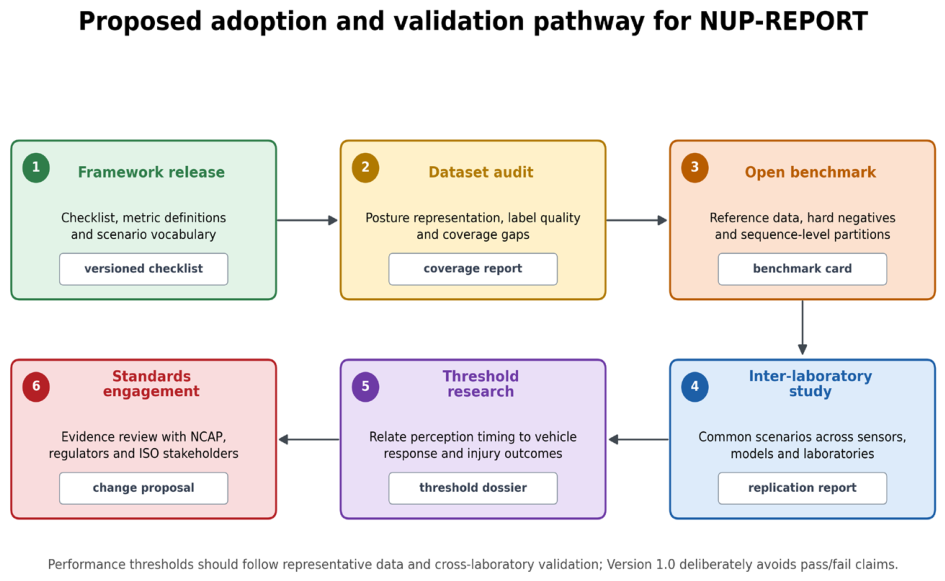
Table 1.
Operational posture vocabulary for NUP-REPORT.
| Category | Minimum operational description | Recommended additional descriptors |
|---|---|---|
| Upright control | Standing, walking or running with a predominantly vertical torso | Gait phase, crossing direction, adult/child target |
| Prone | Torso predominantly horizontal, face or anterior surface toward the road | Head orientation, limb spread, longitudinal/transverse/oblique alignment |
| Supine | Torso predominantly horizontal, face or anterior surface away from the road | Head orientation, limb spread, alignment |
| Lateral | Side-lying or substantially rotated from prone/supine | Left/right side, curled/extended posture |
| Crouched/squatting | Low centre of mass with flexed hips and knees | Stationary/moving, torso angle |
| Seated/kneeling | Road-level seated or kneeling configuration | Upright torso versus collapsed torso |
| Partially collapsed | Intermediate or asymmetric posture not represented by a stable class | Support point, body-region visibility |
| Transition/fall | Time-varying sequence from the upright or mobile state into a non-upright state | Transition onset, fall direction, frame-level posture labels |
Table 2.
Six NUP-REPORT domains and required content.
| Domain | Minimum reporting items | Extended items when applicable |
|---|---|---|
| 1. Target and posture | Operational posture class; orientation; target type; body-size category; static versus transition state; annotation rules | Limb configuration; head orientation; thermal properties; clothing; surrogate fidelity; difficult negatives |
| 2. Scenario and environment | Ego speed; detection range; target location and trajectory; illumination; weather; road surface; occlusion; background clutter | Road curvature/gradient; headlamp state; glare; precipitation intensity; road temperature; traffic context |
| 3. Sensors and data provenance | Modality; resolution/rate; mounting; calibration; synchronisation; data source; annotation method; real/synthetic status; train/validation/test construction | Compression; dropped-frame handling; sensor contamination; inter-annotator agreement; actor/location/seed independence; licensing and release identifiers |
| 4. Model and fusion architecture | Architecture and version; input resolution; pretraining; thresholds; fusion level; tracking/temporal logic; hardware and software | Parameter count; numerical precision; modality-specific baselines; threshold sensitivity; ablation; missing-modality strategy; compute-load tests |
| 5. Performance and uncertainty | Sample counts; precision; recall; false negatives; posture-stratified results; TTFD; end-to-end latency; uncertainty interval; failure cases | Calibration; Brier score; OOD detection; selective prediction; sequence-level bootstrap; degradation curves; subgroup interactions |
| 6. Vehicle-level safety interpretation | Initial speed; detection distance; total delay; deceleration assumption; stopping margin or residual impact speed; measured versus modelled status | Friction, gradient, brake build-up, steering assumptions, surrounding traffic, uncertainty propagation, sensitivity analysis, injury-model provenance |
Table 3.
Minimum benchmark dimensions and recommended levels.
| Dimension | Minimum recommended levels | Rationale |
|---|---|---|
| Posture | Upright control; prone; supine; lateral; crouched/seated/kneeling; transition where relevant | Separates the non-upright effect from the general detector quality |
| Orientation | Longitudinal; transverse; oblique | Changes projected geometry and visible body regions |
| State | Stationary; moving; falling/collapsing where relevant | Distinguishes static detection from temporal anticipation |
| Illumination | Daylight, low light, darkness with headlamps | Addresses a major epidemiological and sensing condition |
| Weather | Clear plus at least one degraded condition | Tests modality asymmetry and domain shift |
| Road surface | Dry plus wet/reflective where feasible | Affects visible, NIR, thermal and LiDAR response |
| Range | Near; intermediate; long | Enables distance-dependent performance and stopping-margin analysis |
| Occlusion | None; partial; severe | Tests low-profile visibility and context dependence |
| Target type | Adult-size; small-stature; at least one hard negative class | Addresses scale and false-activation risk |
| Sensor state | Nominal; one degraded or unavailable modality; timing fault where relevant | Evaluates graceful degradation and fusion robustness |
| Ego speed | Low urban plus higher urban/peri-urban speed | Connects detection timing to physical intervention opportunity |
| Background | Low clutter; high clutter | Tests confusion with roadside or road-surface objects |
Table 4.
Core NUP-REPORT outcomes and minimum reporting expectations.
| Outcome | Unit | Minimum reporting form | Safety interpretation |
|---|---|---|---|
| Posture-specific recall | % | Estimate, numerator/denominator, confidence interval | Reveals subgroup misses hidden by pooled recall |
| Safety-critical FNR | % of events | Boundary definition, event count, interval | Measures failures that persist beyond intervention opportunity |
| TTFD | ms or s | Median, distribution and tail percentile | Captures target availability and temporal confirmation |
| Distance to first valid detection | m | Distribution by posture and condition | Connects detection to the available stopping distance |
| End-to-end latency | ms | Component decomposition and hardware | Prevents inference-only timing claims |
| Detection persistence | % frames or duration | Persistence rule and distribution | Distinguishes isolated detections from stable tracking |
| Calibration | ECE/Brier/reliability | Overall and shifted-condition results | Assesses whether confidence supports safe weighting or decisions |
| Degradation sensitivity | Absolute/relative change | Modality and degradation severity | Evaluates graceful degradation and fusion dependence |
| Stopping margin | m | Distribution with uncertainty propagation | Indicates physical feasibility under stated assumptions |
| Residual impact speed | km/h or m/s | Distribution and assumptions | Estimates mitigation when stopping is not feasible |
Table 5.
Relationship between NUP-REPORT and selected safety frameworks.
| Framework | Relevant contribution | NUP-REPORT relationship and boundary |
|---|---|---|
| ISO 26262:2018 | Functional safety of road-vehicle electrical/electronic systems [30] | NUP-REPORT can document sensor faults, timing failures and fallback behaviour but does not perform HARA, assign ASIL or establish functional-safety compliance |
| ISO 21448:2022 | SOTIF risks from functional insufficiency and foreseeable misuse [31] | Non-upright postures, adverse conditions and distribution shift may serve as triggering conditions; NUP-REPORT supplies structured evidence but not a complete SOTIF argument |
| ISO 34501:2022 | Terms and definitions for automated-driving test scenarios [32] | Provides terminology context for functional, logical and concrete scenarios |
| ISO 34502:2022 | Scenario-based safety-evaluation framework [33] | NUP-REPORT specifies posture- and sensing-related variables that can populate scenario descriptions |
| ISO 19206-2:2018 | Requirements for pedestrian targets used in active-safety testing [34] | NUP-REPORT requires surrogate properties and limitations to be reported; it does not certify a new target |
| Euro NCAP 2026 protocols | Crash-avoidance assessment includes pedestrian and cyclist elements [35] | NUP-REPORT can support exploratory non-upright evidence. Dedicated prone/supine configurations were not identified in the reviewed public protocol materials; the framework does not modify Euro NCAP procedures |
| Euro NCAP AEB/LSS VRU v4.4 | Detailed articulated pedestrian target and VRU test procedures [36] | Provides a mature test-procedure reference while illustrating the need to state the target posture and scenario explicitly |
| UN Regulation No. 152 | AEBS requirements for M1/N1 vehicles [37] | NUP-REPORT is complementary research reporting and does not demonstrate type approval |
| FMVSS No. 127 | Requires AEB, including pedestrian AEB for light vehicles under defined conditions [38] | NUP-REPORT may identify evidence gaps beyond regulated scenarios; it does not alter compliance criteria |
| SAE J3016 | Taxonomy for driving automation [39] | Helps describe system role and human/automation responsibility; it does not define NUP detection performance |
Disclaimer/Publisher’s Note: The statements, opinions and data contained in all publications are solely those of the individual author(s) and contributor(s) and not of MDPI and/or the editor(s). MDPI and/or the editor(s) disclaim responsibility for any injury to people or property resulting from any ideas, methods, instructions or products referred to in the content. |
© 2026 by the authors. Licensee MDPI, Basel, Switzerland. This article is an open access article distributed under the terms and conditions of the Creative Commons Attribution (CC BY) license (http://creativecommons.org/licenses/by/4.0/).
Copyright: This open access article is published under a Creative Commons CC BY 4.0 license, which permit the free download, distribution, and reuse, provided that the author and preprint are cited in any reuse.