

Submitted:
29 July 2026
Posted:
30 July 2026
You are already at the latest version
Abstract
Long-term field trials are important for evaluating the environmental and economic sustainability of crop and soil management practices. The current study evaluated differences in soil organic carbon (SOC), total nitrogen (N), extractable phosphorus (P) and pH across tillage and straw management systems of dryland wheat monocrop after approximately 40 years (1979 - 2018) of experimentation on an acric plinthosol. The study also determined the effects of tillage, straw management and N fertiliser rate on wheat grain yield after every 10 years over 40 years. Treatments consisted of plots under conventional tillage (CT), stubble mulch (SM) and no-tillage (NT), combined with either straw burning (burned) or retention (not burned). Nitrogen fertiliser rates tested were 20, 40 and 60 kg N ha-1. Straw burning (p < 0.05) increased soil pH significantly and Bray-1 extractable P under NT, but not in other tillage systems. The Bray-1 extractable P declined down the profile, regardless of tillage or straw management. Total soil N was higher under NT than other tillage practices but did not vary with straw management, while SOC was not significantly affected by tillage or straw management. Wheat grain yield was significantly increased by higher N fertiliser levels and wetter seasons over the years. The findings suggest that after 40 years of practice, the main driving factors for wheat yield in the low-input dryland monocropping system, under semi-arid conditions, are N fertiliser and seasonal rainfall; hence, farmers may benefit by considering supplementary irrigation during drier years. Furthermore, no-till could be beneficial to improve total N. When combined with straw burning, it also increases soil pH and P, but an alternative strategy for sustainable SOC build-up needs to be sought for this soil type under semi-arid conditions.
Keywords:
carbon
; low-fertiliser input
; nitrogen
; phosphorus
; residue management
1. Introduction
Wheat (Triticum aestivum L.) is an important food crop as it contributes about 20% of the total dietary calories and proteins worldwide [1]. The demand for wheat is increasing in South Africa due to rapid urbanisation and a growing middle-class population. However, dryland wheat production is declining due to challenges such as an increasingly variable climate and rising fertiliser input costs [2]. Current yields of dryland wheat average 2.7 Mg ha-1, yet up to 11.5 Mg ha-1 is attainable with optimal management under irrigation in the country [3]. The lower yields in a large proportion of wheat-producing regions in South Africa could also be attributed to poor soil quality, including soil organic carbon (SOC) levels lower than 10 mg C kg-1 as a result of conventional tillage, monocropping, and burning of straw [3]. Reduced tillage and crop residue retention are sustainable farming practices that could contribute significantly to soil quality and the productivity of dryland wheat and could reduce reliance on fertiliser inputs and improve yield stability in the face of climate change. Recent studies have demonstrated that conservation agriculture can improve the resilience of cereal production systems to climatic stress through enhanced soil health, improved nutrient cycling and the maintenance of crop productivity, although responses remain dependent on local environmental conditions and management practices, particularly in semi-arid environments [4,5]. Sosibo et al. [3] reported that minimum soil disturbance with straw retention (conservation tillage) resulted in higher SOC and lower available P than conventional tillage (intensive soil turning without straw retention). While modern agriculture promotes the use of rotations, dryland wheat monocropping is common under semi-arid conditions, especially on plinthic soils to benefit from moisture stored in the subsoil [6,7]. Rotating wheat with a summer crop could deplete the moisture, making winter wheat production impossible under these conditions. No-tillage and residue retention have been proposed as management practices to improve soil quality and wheat productivity under these conditions. In the same long-term experiment, Sosibo et al. [3] reported differences in soil organic carbon and phosphorus dynamics among contrasting tillage and residue-management systems, highlighting the importance of long-term assessments of soil fertility under dryland wheat production. A thorough understanding of the sustainability of these production practices, especially under semi-arid conditions, on soil quality and wheat crop productivity, requires long-term trials. Data on long-term crop management effects on soil quality in low-fertiliser-input dryland wheat systems are globally scarce, as most field trials are not sustained long enough to draw reliable conclusions. Long-term experiments are increasingly recognised as critical platforms for understanding soil carbon, nitrogen cycling and crop productivity responses to climate variability and management change [8].
The experimental trial established in 1979 in Bethlehem, South Africa, is valuable in this regard. Several previous studies on the long-term dryland wheat trial in South Africa focused mainly on soil fertility parameters and grain yield. In 1989, after 10 years of experimentation, Wiltshire and du Preez [6] studied the effects of tillage and straw management treatments on soil organic carbon (SOC), plant-available N and yield. Soil N and C did not vary with treatments, although SOC in the trial was lower than in natural pasture near the trial. In 1999, after 20 years, Du Preez et al. [9] investigated treatment effects on the same soil fertility indicators. Relative to 1989 results, soil quality parameters and grain yield declined across all treatments. After almost 30 years of the trial, Loke et al. [10] studied the effects of the treatments on SOM indices, soil pH, P, K, Ca, Mg, Na, CEC, Cu, Fe, Mn, and Zn and grain yield [11]. After 30 years of the trial, not burning wheat straw resulted in low SOC but high total N. No-tillage (NT) accumulated more SOC in the topsoil compared to other tillage practices, while both NT and stubble mulching (SM) enhanced N availability in all the sampled depths [10]. No-tillage and SM further improved soil pH and P availability. Extractable P was higher when the straw was burned. Contrary to these findings, the wheat yield was higher under conventional tillage (CT) where straw was not burned [11]. More recently, Motema et al. [12] evaluated soil organic matter indices and humic fractions after 37 years of management and reported greater accumulation of some SOM fractions under conservation-oriented tillage practices, despite limited effects on grain yield. At the conclusion of this trial in 2018, after 40 years of experimentation, it was essential to investigate the differences in soil quality parameters across treatments, and also make statistical comparisons of 2018 wheat grain yield with yields obtained after every 10 years, on the same trial as affected by the various treatments.
The current study, therefore, determined the effects of tillage and straw management on selected soil quality parameters after 40 years, only for treatments where the N fertiliser level was 40 kg ha-1, to relate with findings of previous studies on soil quality parameters in the same trial. Changes in wheat yields after every 10 years, during the 40 years, as affected by tillage, straw management and N fertiliser, needed to be evaluated separately. Global evidence indicates that no-till strongly influences nitrogen cycling and nutrient retention. Leng et al. [8] reported increases in SOC and total N stocks under long-term no-till systems. To determine whether increasing fertiliser rate, in combination with tillage and straw management treatments, could increase wheat grain and potentially straw biomass. While previous work from the trial focused primarily on soil carbon and phosphorus dynamics, less attention has been given to long-term changes in total nitrogen and the relative contribution of management practices, fertiliser rate and seasonal rainfall to grain-yield variability over four decades. The hypotheses were as follows: (1) Long-term no-tillage and residue retention improve soil quality indicators (SOC, total N, pH and available P) relative to conventional tillage in a dryland wheat monocropping system; 2) Long-term no-tillage and residue retention maintain or improve wheat grain yield relative to conventional tillage despite climatic variability while; 3) Seasonal rainfall and nitrogen fertiliser rate have a stronger influence on wheat grain yield than tillage and residue management under semi-arid conditions.
2. Materials and Methods
2.1. Description of the Bethlehem Long-Term Trial
The dryland wheat trial was established at the Agricultural Research Council-Small Grain (ARC-SG) farm, formerly known as Small Grain Institute, near Bethlehem in the Free State Province of South Africa (28°9′S, 28°17′E; 1,680 m.a.s.l). The area is semi-arid with a mean annual rainfall of 743 mm and average temperatures ranging from 7.1˚C to 20.3˚C [13]. Rainfall and temperature characteristics of the site at 10-year intervals during the study period (1979-2018) are presented (Figure 1 and Figure 2). The data were retrieved from the records of a meteorological observatory station at ARC-SG. Bethlehem is a summer-rainfall region, with dryland winter wheat planting between May and June and harvesting in January. The climatic data were categorised as annual, pre-plant (January, February, March, and April), early-mid season (May, June, July, and August) and mid-late season (September, October, November, and December) in relation to the dryland wheat phenology (Table 2 and Table 3). The year 2018 was the driest and warmest year post-wheat planting (Figure 1 and Figure 2). This year, monthly average rainfall was lower than the long-term average, whereas temperatures were higher than the long-term average post-wheat planting. The opposite was true for 1988: monthly average rainfall exceeded the long-term average, whereas temperatures were cooler than the long-term average. This information is further illustrated per season (pre-plant, early-mid and mid-late) in Table 2 (temperature) and Table 3 (rainfall), respectively. The quality of the wheat seasons varied over the years.

Table 1.
Soil properties of the grassland next to the trial in 2018.
| Soil depth (cm) | Carbon (g C kg-1) |
Nitrogen (g N kg-1) |
C: N | pH | Phosphorus (mg kg-1) |
|---|---|---|---|---|---|
| 0 - 20 | 7.00 | 0.60 | 11.7 | 5.6 | 9.1 |
| 20 - 40 | 6.10 | 0.50 | 12.2 | 5.4 | 7.3 |
Carbon, soil organic carbon; Nitrogen, total nitrogen; Phosphorus, Bray-1 extractable phosphorus.
Table 2.
Summary of temperature data at 10-year intervals for the trial site.
| Average temperature (oC) |
Average minimum temperature (oC) | Average maximum temperature (oC) | ||||||||
|---|---|---|---|---|---|---|---|---|---|---|
| Year | Season | µ | σ | CV (%) | µ | σ | CV (%) | µ | σ | CV (%) |
| 1988 | Pre-plant | 18.3 | 3.27 | 17.8 | 12.5 | 3.09 | 24.7 | 24.2 | 3.60 | 14.9 |
| Early-mid | 8.61 | 2.21 | 25.7 | -0.185 | 2.06 | -1113 | 17.4 | 2.51 | 14.4 | |
| Mid-late | 15.2 | 2.51 | 16.5 | 8.34 | 3.13 | 37.6 | 22.0 | 2.01 | 9.14 | |
| 1999 | Pre-plant | 19.1 | 2.26 | 11.8 | 12.5 | 2.70 | 21.7 | 25.8 | 1.83 | 7.09 |
| Early-mid | 9.32 | 1.32 | 14.1 | 0.518 | 1.99 | 384 | 18.1 | 1.02 | 5.64 | |
| Mid-late | 16.6 | 3.25 | 19.6 | 9.29 | 4.24 | 45.7 | 23.9 | 2.85 | 11.9 | |
| 2009 | Pre-plant | 18.2 | 2.64 | 14.5 | 11.7 | 3.71 | 31.7 | 24.8 | 1.75 | 7.05 |
| Early-mid | 8.81 | 2.12 | 24.0 | 0.503 | 2.69 | 536 | 17.1 | 1.97 | 11.5 | |
| Mid-late | 17.2 | 2.48 | 14.4 | 9.53 | 3.28 | 34.4 | 24.9 | 2.01 | 8.10 | |
| 2018 | Pre-plant | 18.8 | 2.32 | 12.4 | 11.7 | 1.87 | 16.0 | 25.9 | 3.14 | 12.1 |
| Early-mid | 9.62 | 1.90 | 19.7 | -0.123 | 2.50 | -2037 | 19.4 | 1.46 | 7.57 | |
| Mid-late | 17.9 | 3.38 | 18.9 | 8.27 | 4.37 | 52.8 | 27.5 | 2.46 | 8.93 | |
| Long-term average | Pre-plant | 18.4 | 2.74 | 14.8 | 11.8 | 3.24 | 27.5 | 25.0 | 2.24 | 8.98 |
| Early-mid | 9.29 | 2.08 | 22.4 | 0.273 | 2.14 | 784 | 18.3 | 2.13 | 11.6 | |
| Mid-late | 17.4 | 2.31 | 13.3 | 9.44 | 3.43 | 36.3 | 25.3 | 1.20 | 4.73 | |
µ, mean; σ, standard deviation from the mean; CV, coefficient of variation; Long term, average over 40 years. The different years for which the data are presented are approximately 10 years apart, to coincide with previous studies on the trial.
Table 3.
Summary of rainfall data at -year intervals (1979 - 2018) and long-term averages for the trial site.
Table 3.
Summary of rainfall data at -year intervals (1979 - 2018) and long-term averages for the trial site.
| Cumulative rainfall (mm) | |||||
|---|---|---|---|---|---|
| µ | σ | CV (%) | Total | ||
| 1988 | Pre-plant | 161 | 84.3 | 52.4 | 644 |
| Early-mid | 11.6 | 7.28 | 62.9 | 46.3 | |
| Mid-late | 92.7 | 34.4 | 37.1 | 371 | |
| 1999 | Pre-plant | 76.1 | 35.7 | 47.0 | 304 |
| Early-mid | 13.0 | 15.8 | 121 | 52.1 | |
| Mid-late | 91.4 | 120 | 120 | 366 | |
| 2009 | Pre-plant | 72.6 | 71.7 | 98.8 | 290 |
| Early-mid | 23.9 | 23.4 | 98.1 | 95.5 | |
| Mid-late | 53.2 | 35.3 | 66.4 | 213 | |
| 2018 | Pre-plant | 130 | 74.1 | 57.2 | 518 |
| Early-mid | 8.76 | 8.87 | 101 | 35.1 | |
| Mid-late | 32.3 | 13.8 | 42.7 | 129 | |
| Long term | Pre-plant | 80.4 | 39.5 | 49.1 | 322 |
| Early-mid | 10.5 | 5.51 | 52.4 | 42.1 | |
| Mid-late | 59.8 | 37.4 | 62.5 | 239 | |
µ, mean; σ, standard deviation from the mean; CV, coefficient of variation. Long-term, average over 40 years. The different years for which the data are presented are approximately 10 years apart, to coincide with previous studies on the trial.
The soil at the trial site was classified as a luvic Avalon soil form, under the Mafikeng family [14]. It is characterised by orthic A, yellow-brown apedal B and soft plinthic B-horizons [15], and can also be classified as an Acric plinthosol [16]. Before the commencement of the trial, the land was under conventional tillage (moldboard plough) for at least 20 years [9]. The soil data for a natural grassland next to the trial are presented in Table 1. This soil is naturally deficient in P, slightly acidic and has very low SOC.
The initial objective was to determine the effects of tillage, straw burning and N fertiliser application rates on wheat grain yields on a Plinthosol. At the beginning of this trial, there were two wheat straw management treatments (burned and not burned), three tillage methods (moldboard ploughing, stubble mulch tillage, and no-tillage), two weed control methods (mechanical and chemical) and three N fertilisation levels (20, 30 and 40 kg N ha-1) in a factorial arrangement. The trial was a randomised complete block design on a 2-3% north-facing slope, with 36 treatments and 3 replicates. A constant amount of P (12.5 kg P ha-1y-1), but no K, was added. A hard red winter wheat cultivar, Betta, was planted. In 2002, Betta was replaced with a new, improved cultivar, Elands. At the same time, the N fertiliser rate was also increased in synchrony with the higher nutrient requirements of the newly introduced Elands cultivar compared to Betta. The original 30 and 40 kg N ha-1 were replaced with 40 and 60 kg N ha-1, respectively. Each plot was 6 × 30 m with a separation distance of 3 m between plots. An inter-row spacing of 450 mm was used in all plots. The intra-row spacing was 30 mm to achieve a seed rate of 74 m-2. Over the years, wheat was consistently planted every year during the last week of June. This planting date was selected to optimise wheat yield potential for this specific environment. After harvesting grain, wheat straw was either burned or retained depending on the straw management treatment. In the stubble mulched treatment, a 50 mm wide chisel plough was used to till the soil without much disturbance to the surface mulch. In the ploughed treatment (conventional tillage), wheat ashes, char or unburned straw were incorporated into the soil using a two-way offset disc up to 150 mm depth. In February of each year, a moldboard plough further incorporated wheat ashes, char or wheat straw up to 250 mm depth in the ploughed treatment. The ploughed treatment is referred to as conventional tillage in this paper. For the ploughed and stubble mulch treatments, a tine tiller was used to control weeds in March of every year before planting. Additionally, two herbicides {glyphosate (N-phosphonomethyl glycine) or paraquat (N, N′-dimethyl-4,4′-bipyridinium dichloride)} were used to control weeds. The herbicides were alternated to avoid the development of herbicide resistance. Fertiliser application and seeding were done using a conventional wheat planter in other treatments, but a no-till planter was used under the no-tillage treatment. The experiment provides a unique opportunity to evaluate long-term land management effects on soil fertility and dryland wheat productivity under semi-arid conditions, contributing to evidence required for sustainable land-use planning and climate adaptation.
2.2. Data Collection, Soil Sampling and Analyses
For soil quality evaluation, soil samples were collected in June 2018, before wheat planting, from the 0 - 20 and 20 - 40 cm depths of plots fertilised with 40 kg N ha-1. This fertiliser rate was selected to relate to previous studies on this trial [6,10,17]. The treatments sampled were conventional (CT), stubble mulch (SM) and no-tillage (NT) systems, where straw was either burned or retained and weeds were chemically controlled. Four random samples were collected from each of the plots and bulked per layer to form a composite sample. Visible debris was removed, and the samples were air-dried, milled (< 2 mm) and analysed for pH (1:5 soil to 1 M KCl suspension). Organic C was analysed using the Walkley-Black method [18]. A dry combustion method was used for total N analysis using the LECO TruMac CNS analyser [19], while plant-available P was extracted using the Bray 1 method and analysed colourimetrically using the molybdenum blue method [20]. The results from this study were discussed in comparison to findings from previous studies in the same plots by [6,9,17,21] and [10,11] to infer trends in soil quality.
To explore the effect of treatments on grain yield over the years, the grain yield data from 10-year intervals within this trial were analysed. The data were obtained from the ARC-Small-Grain long-term trial wheat yield data records.
2.3. Statistical Analyses
To test the significance of differences between treatments, soil quality and yield were analysed by a generalised ANOVA with tillage, straw management and soil depth as factors for soil quality parameters, while year, residue management, tillage and fertiliser level were factors for grain yield. The analyses were done using Genstat 18th edition. Means were separated using Tukey’s test at a 95% confidence level. Descriptive statistics were used to summarise the climatic, soil properties and grain yield data.
3. Results
3.1. Effects of Tillage and Straw Management on Selected Soil Properties After 40 Years
There were relatively narrow ranges of soil pH (4.66 - 5.56), organic C (4.20 - 8.90 g kg-1) and total N (0.50 - 0.80 g kg-1), but the available P ranged from 7.67 - 45.58 mg kg-1. Interaction effects of tillage, straw management and soil depth were significant on soil pH and extractable P only, while total N was significantly affected by tillage (Table 4). Organic C was not significantly affected by tillage, straw management or soil depth.
3.1.1. Soil pH
Burning wheat straw significantly increased soil pH in the 0 - 20 cm depth under NT when compared with straw retention, but there were no differences under CT and SM, and this effect was not significant in the 20 - 40 cm depth (Table 5). For each treatment combination, soil depth did not affect pH.
3.1.2. Extractable Soil Phosphorus
At the 0 - 20 cm soil depth, the soil under no-tillage with burned wheat straw had higher extractable P than the soil under SM or CT treatments, irrespective of straw management (Table 6). Where straw was not burned, there were no significant differences between tillage systems. At 20 - 40 cm, there were no significant differences among all tillage × straw management combinations (Table 6). However, there was evidence of P stratification across all treatments, with more extractable P in the 0 - 20 cm depth.
3.1.3. Soil Organic Carbon and Total Nitrogen
Interaction effects of all factors did not significantly affect SOC and total N (Table 4). Soil organic C and total N concentrations were also similar at the sampling depths of 0 - 20 and 20 - 40 cm (Table 7). Tillage main effects were significant for total N only, with slightly higher total N under NT than other tillage practices (Table 7). Tillage and straw management did not affect the C: N ratio, but the treatments resulted in an average C: N ratio of 12.7 (Table 7).
3.2. Changes in wheat grain yield under different management practices over the years
Grain yield ranged from 0.132 to 3.52 Mg ha-1 over the 40 years (Table 8). On average, 2009 had a higher grain yield, and 2018 had the lowest yield (Table 8). However, the four-way (year × tillage × straw management × N fertiliser) and three-way ((a) year × straw management × N fertiliser, (b) year × tillage × N fertiliser, (c) year × tillage × straw management) interaction effects were not significant on wheat grain yield. The only significant two-way interaction effect on grain yield was that of year × straw management, while all other two-way interactions were not significant (Table 9). Year, tillage, straw management and N fertiliser as the main factors were significant (Table 9).
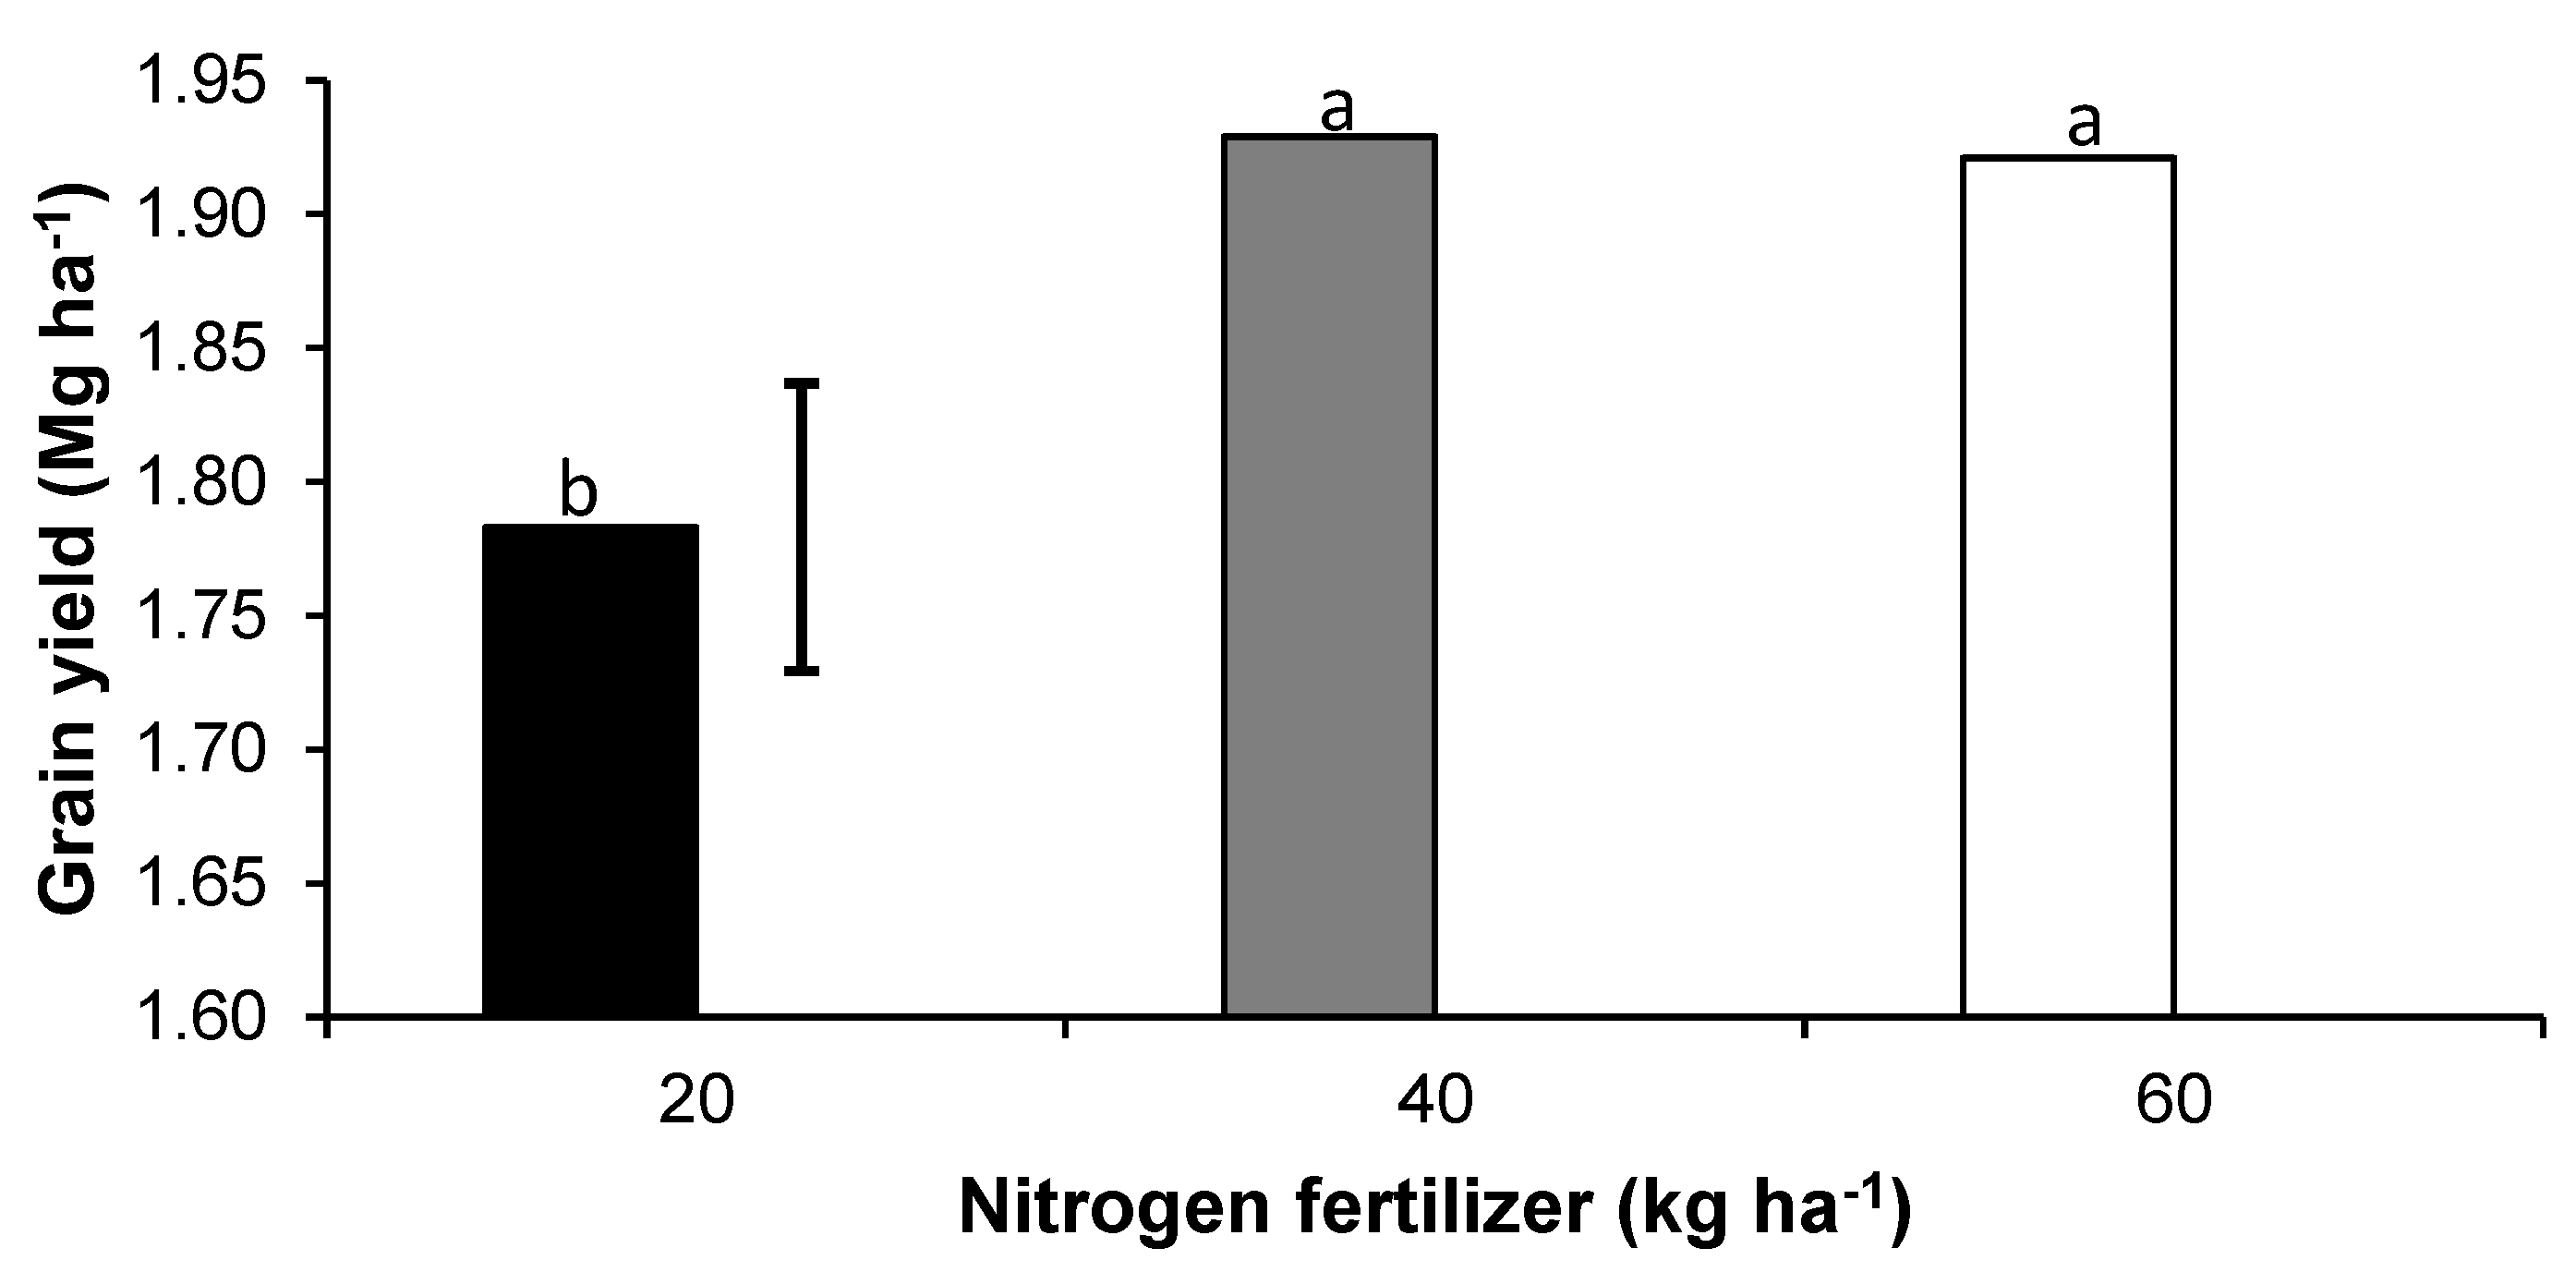
Straw burning increased grain yields compared to not burning only in 1988, but not in the other years studied. Grain yields in 1988 and 2009 were similar and higher than in 1999 and 2018, with the lowest grain yield in the latter. Furthermore, the mean grain yield under NT was similar to both CT and SM (Table 10). Throughout the years, grain yield was lower at the N rate of 20 kg ha-1 level than the higher rates (Figure 4).
Figure 3.
The effect of straw management on wheat grain yield in the long-term trial over years 1988-2018. Error bars and different letters (a-d) in the bars represent significant differences at p<0.05. The different years for which the data are presented are approximately 10 years apart, to coincide with previous studies on the trial.
Figure 3.
The effect of straw management on wheat grain yield in the long-term trial over years 1988-2018. Error bars and different letters (a-d) in the bars represent significant differences at p<0.05. The different years for which the data are presented are approximately 10 years apart, to coincide with previous studies on the trial.
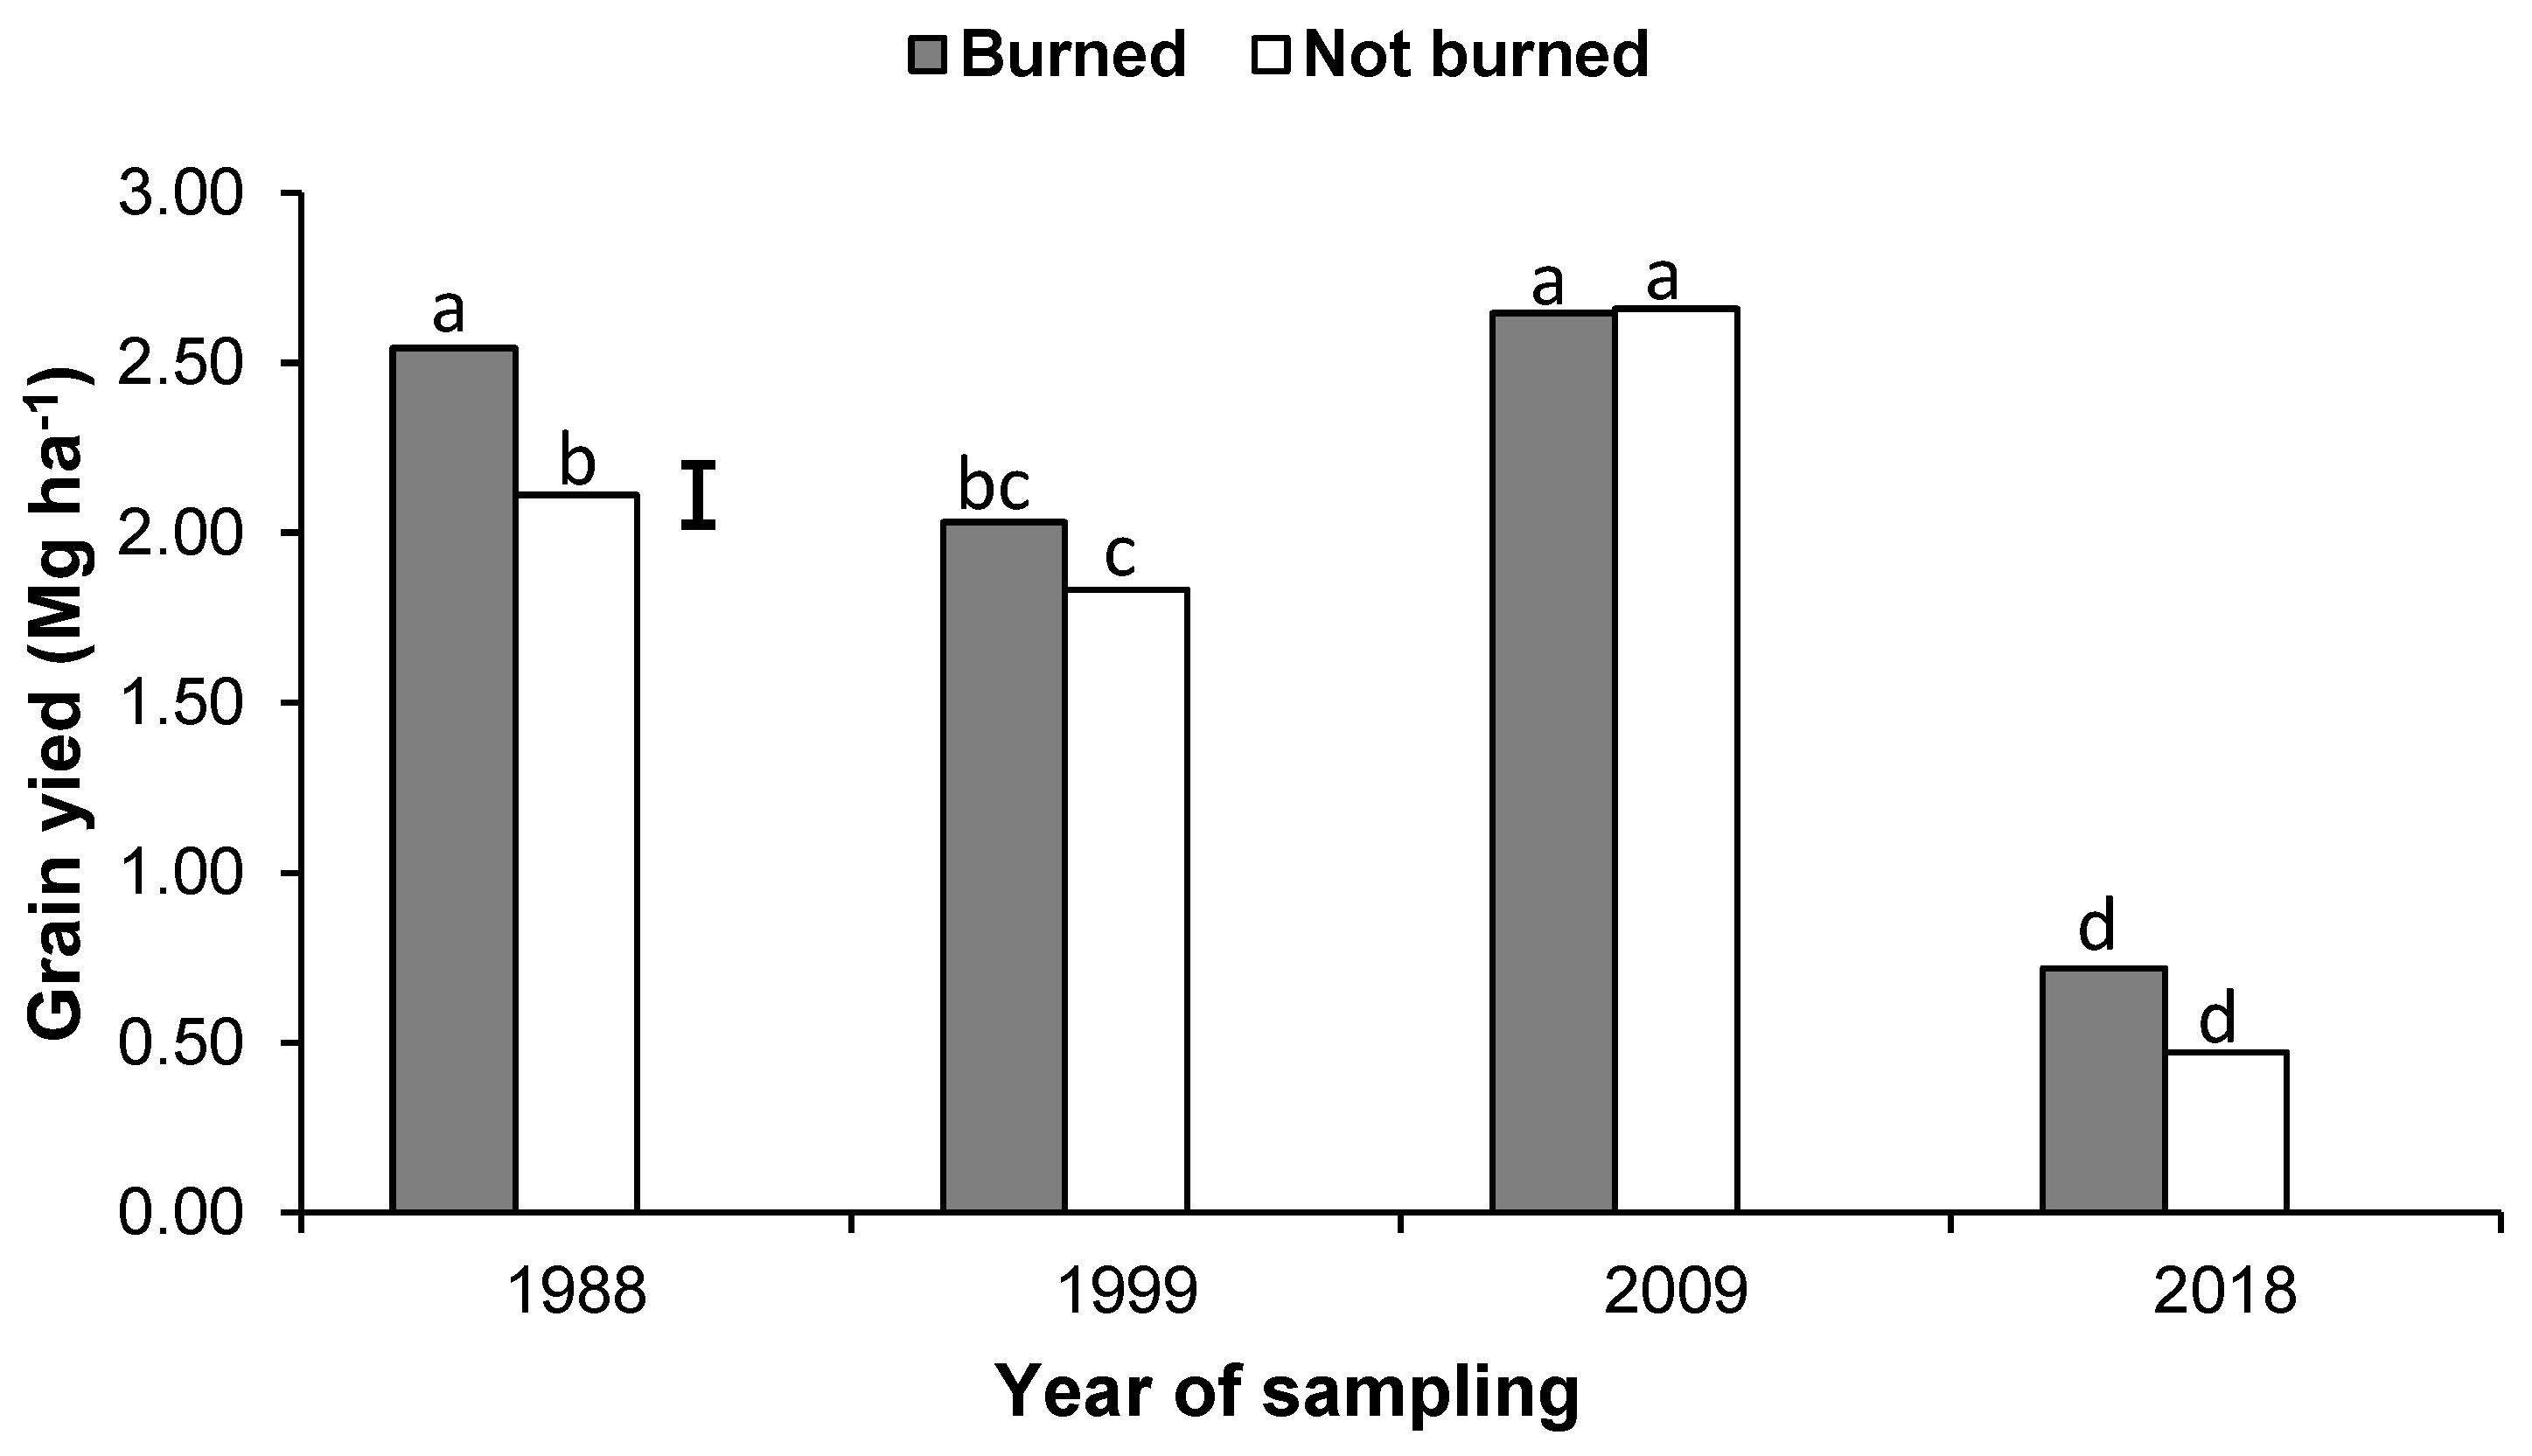
Figure 4.
The effect of nitrogen fertiliser rate on wheat grain yield over the years 1988 to 2018. Error bars and different letters (a-b) in the bars represent significant differences at p<0.05. The two higher rates had 30 and 40 kg N ha-1 till 2002, after which they were increased to 40 and 60 kg N ha-1, respectively.
Figure 4.
The effect of nitrogen fertiliser rate on wheat grain yield over the years 1988 to 2018. Error bars and different letters (a-b) in the bars represent significant differences at p<0.05. The two higher rates had 30 and 40 kg N ha-1 till 2002, after which they were increased to 40 and 60 kg N ha-1, respectively.
4. Discussion
4.1. Changes in Soil pH Across Management Systems
Burning of straw is a common practice in low-input dryland wheat monocropping systems for controlling diseases such as “take all” (Gaeumannomyces graminis var. tritici). Findings of the current study suggest that burning straw under no-till in this production system may increase soil pH and plant-available P, meriting further attention and research. Improved soil pH under straw burning in the no-till treatments may be due to the liming effects of ash produced from fire. Ash is alkaline in nature [22] and is composed of carbonates that are hydrolysed to produce hydroxide ions [23]. Similar increases in soil pH following ash deposition have been reported in ecosystems affected by burning, where ash-derived base cations and carbonates accumulate at the soil surface and exert a liming effect, contributing to base cations at the soil surface, particularly under reduced soil disturbance systems that favour nutrient stratification [23,24]. A comparison of adjacent grassland data (Table 1) with soil quality over the years showed that soil pH at 0 - 20 cm has declined across all treatments. Wheat can tolerate soil acidity to pH 5.5 (KCl) without significantly affecting yield [25]. Based on the pH values from the current study, liming must be considered, but the no-till treatment where the straw was burned will require the least amount of lime.
4.2. Changes in Extractable Phosphorus
After 40 years of wheat monocropping, the higher extractable P in the surface soil of the NT with burned straw treatments (Table 6) than SM and CT (irrespective of trash management) could be explained by nutrient-rich ash, higher soil pH and conversion of organic P to orthophosphate as a result of burning. Higher soil pH reduces P fixation by Fe and Al oxides that are likely to dominate the soil type, i.e Acric Plinthosol, on which the trial is located [15]. Lowering soil pH may precipitate P as plant-unavailable forms with Al and Fe, lowering plant-available P [26,27]. Higher availability of P in the topsoil (0 - 20 cm) than in the deeper layers is attributed to P fertiliser addition and the immobile nature of this nutrient [28]. Phosphorus moves in the soil mainly through diffusion, and because of its low diffusion coefficient, it is considered highly immobile [29]. The lack of differences in tilled treatments where straw was retained (not burned) suggests that the straw generated in this system was insufficient to significantly impact P availability in the 0 - 20 cm layer. This is confirmed by insignificant differences in SOC across all treatments (Table 4). Reduced tillage systems with sufficient organic matter inputs are known to have more organic P in the topsoil because of the slower decomposition of crop residues [30]. Organic compounds from organic matter either compete with P for sorption sites or coat Al/Fe oxides such that these oxides do not fix available P; both these mechanisms result in more plant-available P in the top soils of reduced tillage systems [26]. Stratification of phosphorus under no-tillage is a commonly reported phenomenon resulting from repeated surface fertiliser applications, residue retention and the absence of soil mixing, which promotes the accumulation of plant-available P in the upper soil layers [28,30]. These results support earlier findings from the same trial reported by Sosibo et al. [3], who observed greater phosphorus accumulation in surface soils under reduced tillage systems and highlighted the importance of nutrient stratification under long-term conservation management. Similar trends have also been reported under conservation agriculture systems in South Africa, where no-till increased phosphorus availability relative to conventional tillage [24].
Comparison of the results after 40 years with other sampling intervals [9,11,21] showed that extractable soil P in the topsoil slightly declined across all treatments over 30 years. However, at the 40-year interval, the P level appeared to be higher in the topsoil of NT and SM treatments (Table 6). Because of the lack of soil incorporation in the reduced tillage treatments, there may be a faster build-up of P applied as fertiliser in the topsoil. It should be noted, though, that plant-available P concentration in the 0 - 20 cm soil layer has remained within the requirements of dryland wheat for a water-limited yield potential of 3.5 Mg ha-1 across all treatments [31]. Over the 40 years, this can be ascribed to consistent annual P fertiliser application practices of 12.5 kg P ha-1. Hence, all treatments have not yet developed a P limitation for yield. Considering that the threshold soil P for fertiliser application of wheat is 40 mg P kg-1 [31], the NT with burned straw (38.5 mg P kg-1) would require less than 12.5 kg P ha-1 or no P fertiliser, if soil test-based fertiliser recommendations were used for this production system. This interpretation is consistent with the conclusions of Sosibo et al. [3], who suggested that reduced phosphorus-fertiliser requirements may be possible where no-tillage promotes phosphorus accumulation in the surface soil. The reduction could reduce P fertiliser costs, and possibly increase profitability, on dryland monocrop wheat farms where NT with burned straw are used under semi-arid conditions.
4.3. Changes in Soil Organic Carbon and Total Nitrogen Across Management Systems
Modern sustainable farming tends to encourage crop rotations and diversification and discourage monocropping and straw burning, which causes air pollution, harm to some soil organisms and is thought to accelerate SOC losses [32,33]. Several studies on wheat straw management reported positive effects of straw burning on earthworms, SOC and subsequent crop yield [34,35]. While burning usually results in a decline in SOC, the burning of wheat straw over 40 years did not significantly lower SOC in this study (Table 4). The lack of significant change could be because the SOC in the soils was low (<10 g kg-1) (Table 7), even in the adjacent undisturbed grassland (7.0 g kg-1), as shown in Table 1.
The lack of significant differences in SOC in the present study may partly be associated with sampling depth, as long-term conservation tillage studies have shown that nutrient and carbon stratification are often concentrated in the upper soil layers [36]. Alternatively, the lack of tillage and straw management effects (Table 4) may mean that the equilibrium level of SOC has been reached across all treatments (Table 7). According to Lobe et al. [37], Plinthosols in the Highveld region require about 34 years for SOC to reach equilibrium. The SOC may have equilibrated at low levels of 7.9 g C kg-1 (average) in this system due to the relatively low levels of straw generated annually for SOC input. The organic C levels in the tillage and straw management treatments were generally close to the concentrations (7.0 g kg-1) in the undisturbed grassland adjacent to the trial (Table 1). While the organic C saturation level of the soil was not determined, the similarity of the experimental treatments (7.2 - 8.5 g kg-1) and undisturbed soils (7.0 g kg-1) suggests that the C saturation levels of the soil used are low and could not be significantly increased by the treatments. The annual additions of low dry matter may have been too little to increase the SOC status significantly; thus, it remained constant. The present findings are consistent with those of Motema et al. [12] who reported that despite some differences in soil organic matter fractions, long-term management practices had relatively limited effects on total soil C and N indicators compared with expectations for conservation agriculture systems. Similar observations were reported by Sosibo et al. [3], where conservation-oriented tillage practices showed only modest differences in soil organic carbon, suggesting that low biomass inputs and climatic limitations may constrain carbon sequestration in this system. Similar observations have been reported in other long-term no-tillage systems, where SOC accumulation was concentrated in the surface soil and became difficult to detect when deeper layers were aggregated for analysis. Long-term studies have shown that the magnitude of SOC sequestration under no-tillage is strongly influenced by climate, residue inputs, soil type and sampling depth, resulting in variable responses across environments [8]. More recent long-term studies suggest that SOC gains under no-tillage are frequently concentrated in surface layers and may become difficult to detect when sampling depths are aggregated. This may partly explain the absence of statistically significant SOC differences in the present study.
A trend analysis of SOC across the years also showed that there have been no significant changes in SOC over the years [6,10,17]. Rainfall is the main limiting factor to wheat yield, hence biomass input, in this system [38]. Supplemental irrigation and perhaps high biomass-yielding summer cover crops for rotation, in this and similar systems, may be required to improve SOC. Recent evidence suggests that conservation agriculture systems may improve the resilience of cereal production to climatic stresses through enhanced soil health and nutrient cycling, although yield benefits remain highly site-specific in semi-arid environments and are frequently constrained by water availability [4,5].
However, another possible explanation for the lack of treatment effects could be that sampling at 0 - 20 cm could also have masked the small differences in SOC. Reports of significant benefits of no-till on SOC normally refer to the top 0 - 5 and 5 - 10 cm soil layers. [39,40]. Studies that consider sampling at 0 - 5, 5 - 10 and 10 - 20 cm depths could show differences between the no-till and other tillage treatments. This study and all other studies conducted previously on this trial did not distinguish the SOC between these fine layers [6,10,17]. However, total soil N appeared more sensitive than SOC, as the concentration was significantly increased by no-till. This finding is consistent with recent studies reporting that nitrogen pools and nitrogen cycling processes often respond more rapidly to reduced soil disturbance than SOC, particularly in conservation agriculture systems where organic residues are retained on the soil surface [8].
Higher total N observed under no-tillage may be due to a combination of less soil disturbance and straw retention on the soil surface. Less soil disturbance coupled with straw retention slows SOM decomposition, thus reducing N loss through leaching from the system. [41,42]. These findings are partly similar to Loke et al. [10], who reported higher N under no-tillage due to less decomposition. The higher total soil N in no-till than conventional tillage, while SOC was not affected, in the current study as well as in previous ones on the same trial [6,10,17] suggested that soil N may be more sensitive to management changes [43]. Recent evidence indicates that no-tillage enhances nitrogen retention and cycling through reduced disturbance and greater organic matter protection, supporting the higher total N observed under no-tillage in this study [4,44].
Although total N declined in the first years of cropping, the levels appear to have reached equilibrium at a lower level (0.60 g kg-1) for the past 20 years [6,10,17]. Global evidence increasingly indicates that no-tillage promotes the accumulation and conservation of soil nitrogen through reduced disturbance, enhanced organic matter protection and improved nutrient recycling [8,44]. However, the magnitude of these benefits varies substantially with climate, rainfall distribution, crop residue management, fertiliser inputs and soil properties, highlighting the continuing importance of long-term site-specific experiments such as the present study [8]. Overall, both soil N and P declined over time.
4.4. Trends in Wheat Grain Yield
A significant increase in grain yields due to straw burning in 1988 (Figure 3) can be attributed to the effect of fire that improves soil pH and nutrient availability, hence higher grain yields. There was a higher wheat grain yield across all treatments in 2009 than in 1999 and 2018 (Figure 3). A possible explanation for the higher yield in 2009 than in 1999 could be the change in the cultivar planted. The cultivar Betta, which was used since the commencement of the trial, was replaced by Elands in 2002, which had better pest and disease resistance [10]. Cultivar evaluation from the ARC-SG has consistently shown that Elands had a higher nutrient uptake, hence better yield potential than Betta, and it produced more grain with relatively higher grain density [31]. The lower grain yields in 2018 than in 2009 could also be a result of warmer temperatures (Fig.1) and lower (Fig.2) rainfall compared to other years. The total rainfall received before wheat planting in 2009 was lower than the long-term average, but the rainfall received during the wheat growing season was more than 50% higher than the long-term average (Table 3). A combination of inadequate rainfall and higher temperatures becomes an overriding factor in achieving yield potential under variable P fertility conditions, even when an appropriate wheat cultivar is used. Strategic supplemental irrigation may therefore provide a practical pathway to stabilise dryland wheat productivity under increasingly variable climatic conditions [45]. However, the N rate of 20 kg ha-1 was limiting to yield irrespective of the year, tillage or straw management.
Nitrogen is a vital nutrient for wheat grain development, and this explains the higher yield obtained at 40 and 60 kg N ha-1 (Figure 4). Several studies attest to the importance of N in all stages of cereal grain development. [46]. Higher grain yield corresponds with greater dry matter input, potentially increasing SOC. The higher grain yield in the 40 and 60 kg N ha-1 treatments than in the 20 kg N ha-1 treatment could have been a result of higher biomass production due to higher N availability and uptake. While there were no significant differences in grain yield between the 40 and 60 kg N ha-1 treatments, it would be necessary to understand whether the higher N (60 kg N ha-1) could cause greater dry matter yield and biomass input, which could increase soil organic matter.
From a global perspective, metadata shows that on average, no-till negatively impacts crop yields by 5.7% when compared with conventional tillage, especially in a monocrop system [47]. However, when no-till is combined with residue retention and crop rotation (conservation agriculture), the negative effects on crop yields are reported to be minimised [47,48]. Conventional tillage is thus generally expected to result in higher yield than NT, especially in situations whereby NT is not combined with the other two principles of conservation agriculture; namely, crop rotation and permanent soil cover. However, the current study showed that yields of NT in 40 years were not significantly different from CT for a dryland wheat production system. In this study, burning straw did not significantly increase grain yield except in 1988. The increase in yield due to burning in 1988 could have been a result of the increased availability of nutrients for plant growth [23,40,49], coupled with the higher amount of rainfall when compared to other seasons. Recent studies from semi-arid environments indicate that water availability remains the dominant determinant of wheat productivity, often overriding improvements in soil fertility associated with conservation agriculture practices, with irrigation amount frequently exerting a greater influence on grain yield than other management factors [4,45].
The lack of significant differences in grain yield, even when total N and available P (burned straw) were higher in NT than CT, could be an indication that water availability was more limiting for the dryland wheat monocrop under the semi-arid conditions. Furthermore, the same fertiliser rates were used for the different tillage and straw management practices, and were based on recommendations made at the onset of the trial, and not on current soil analysis, which would have resulted in different rates. For example, the fertiliser P (12.5 kg P ha-1) was enough for such a production system, and any additional P from the soil would not result in a yield increase. The higher and available P in NT with burned straw, and total N in NT, did not translate to a higher yield than the other tillage and straw management practices. The NT system would present a more profitable system because of reduced diesel costs related to tillage and P fertiliser costs if recommendations are based on soil tests. Crop residue burning could also reduce P fertiliser and lime requirements for this NT system, towards improved economic sustainability. Strategic supplemental irrigation may therefore provide a practical pathway to stabilise dryland wheat productivity under increasingly variable climatic conditions and enhance the benefits derived from improved soil fertility under conservation management practices [4,45].
5. Conclusion
The practice of NT increases total soil N but not SOC when compared with CT, while straw burning does not affect both total soil N and SOC in a dryland wheat monocropping system under semi-arid conditions. No-till with burned straw increases soil pH and Bray 1 extractable P, particularly in the surface layer, when compared with CT. Grain yield increases with higher fertiliser N rate and wetter seasons, but not with tillage intensity or straw burning in this system. The findings suggest that supplemental irrigation may be required for optimum wheat production under such semi-arid conditions. The higher soil pH and available P in NT with burned straw suggest that lower fertiliser P would be required in this treatment, and that P fertiliser costs may be reduced when fertiliser recommendations are based on soil tests. The lack of differences between tillage and trash management treatments indicates that an alternative strategy for building SOC on these soils is required, including crop rotations if supplemental irrigation is possible.
Author Contributions
Conceptualization, N.Z.S., E.D. and P.M..; Methodology, N.Z.S., E.D. and P.M..; Software, N.Z.S., E.D. and P.M.; Validation, N.Z.S., E.D. and P.M..; Formal analysis, N.Z.S., E.D. and P.M.; Investigation, N.Z.S.; Resources, N.Z.S., E.D., P.M. and T.J.T.; Data curation, N.Z.S.; Writing-original draft preparation, N.Z.S.; Writing-review and editing, N.Z.S., E.D., P.M. and T.J.T.; Visualization, N.Z.S., E.D., P.M. and T.J.T.; Supervision, P.M. and E.D.; Project administration, N.Z.S. and T.J.T.; Funding acquisition, N.Z.S., E.D., P.M. and T.J.T. All authors have read and agreed to the published version of the manuscript.
Funding
This work was supported by the Agricultural Research Council, the Winter Cereal Trust, and the National Research Foundation of South Africa (grant number: 101472).
Data Availability Statement
Not applicable.
Acknowledgments
The authors are thankful for the contributions of the Production Systems Division of the ARC–Small Grain Institute for maintaining the Bethlehem long-term dryland wheat trial.
Conflicts of Interest
The authors declare no conflict of interest.
References
- Shiferaw, B.; Smale, M.; Braun, H.J.; Duveiller, E.; Reynolds, M.; et al. Crops that feed the world 10. Past successes and future challenges to the role played by wheat in global food security. Food Secur. 2013, 5(3), 291–317. [Google Scholar] [CrossRef]
- Dube, E.; Tsilo, T.J.; Sosibo, N.Z.; Fanadzo, M. Irrigation wheat production constraints and opportunities in South Africa. S. Afr. J. Sci. 2020, 116(1–2), 1–6. [Google Scholar] [CrossRef] [PubMed]
- Sosibo, N.Z.; Muchaonyerwa, P.; Dube, E.; Tsilo, T.J. Soil Carbon and Phosphorus after 40 Years of Contrasting Tillage and Straw Management in Dryland Wheat Production under Semi-Arid Temperate Climate. Land 2022, 11(8), 1305. [Google Scholar] [CrossRef]
- Cheikh M’hamed, H.; Ferchichi, N.; Toukabri, W.; Barbouchi, M.; Moujahed, N.; Rezgui, M.; Bahri, H.; Sassi, K.; Frija, A.; Annabi, M. Conservation Agriculture Boosts Soil Health, Wheat Yield, and Nitrogen Use Efficiency After Two Decades of Practice in Semi-Arid Tunisia. Agronomy 2024, 14(12), 2782. [Google Scholar] [CrossRef]
- Teng, J.; Hou, R.; Dungait, J.A.; Zhou, G.; Kuzyakov, Y.; Zhang, J.; Tian, J.; Cui, Z.; Zhang, F.; Delgado-Baquerizo, M. Conservation agriculture improves soil health and sustains crop yields after long-term warming. Nat. Commun. 2024, 15(1), 8785. [Google Scholar] [CrossRef] [PubMed]
- Wiltshire, G.H.; du Preez, C.C. Long-term effects of conservation practices on the nitrogen fertility of a soil cropped annually to wheat. South Afr. J. Plant Soil 1993, 10(2), 70–76. [Google Scholar] [CrossRef]
- Bennie, A.T.; Hensley, M. Maximising precipitation utilisation in dryland agriculture in South Africa — a review. J. Hydrol. 2001, 241(1–2), 124–139. [Google Scholar] [CrossRef]
- Leng, V.; Cardinael, R.; Tivet, F.; Seng, V.; Mark, P.; Lienhard, P.; Filloux, T.; Six, J.; Hok, L.; Boulakia, S.; Briedis, C.; de Moraes Sá, J.C.; Thuriès, L. Diachronic Assessment of Soil Organic C and N Dynamics under Long-Term No-Till Cropping Systems in the Tropical Upland of Cambodia. SOIL 2024, 10, 699–725. [Google Scholar] [CrossRef]
- Du Preez, C.C.; Kotzé, E.; Loke, P.F. Long-term effects of wheat residue management on some fertility indicators of a semi-arid Plinthosol. Soil Tillage Res. 2001, 63, 25–33. [Google Scholar] [CrossRef]
- Loke, P.F.; Kotzé, E.; du Preez, C.C. Changes in soil organic matter indices following 32 years of different wheat production management practices in semi-arid South Africa. Nutr. Cycl. Agroecosystems 2012, 94(1), 97–109. [Google Scholar] [CrossRef]
- Loke, P.F.; Kotzé, E.; Du Preez, C.C. Impact of long-term wheat production management practices on soil acidity, phosphorus and some micronutrients in a semi-arid Plinthosol. Soil Res. 2013, 51(5), 415–426. [Google Scholar] [CrossRef]
- Motema, T.; Kotzé, E.; Loke, P.F.; du Preez, C.C. Response of soil organic matter indices and fractions after 37 years of wheat production management practices in semi-arid South Africa. South Afr. J. Plant Soil 2020, 37, 136–143. [Google Scholar] [CrossRef]
- ARC-SCW. 2013. Agro-climatology database. Agricultural Research Council- Climate, Soil and Water. Pretoria, South Africa.
- Soil Classification Working Group. 1991. Soil Classification: a taxonomic system for South Africa. Dep. of Agric. Development, Pretoria, South Africa.
- Fey, M. V. Fey, M. V. 2010. Soils of South Africa. Cambridge University Press. Cape Town, South Africa.
- IUSS Working Group WRB. 2015. World Reference Base for Soil Resources 2014, update 2015. International soil classification system for naming soils and creating legends for soil maps.
- Kotzé, E.; du Preez, C.C. Influence of long-term wheat residue management on organic matter in an Avalon soil. South Afr. J. Plant Soil 2007, 24(2), 114–119. [Google Scholar] [CrossRef]
- Combs, S.M.; Nathan, M.V. Soil Organic Matter. Recommended Chemical Soil Test Procedures for the North Central Region; John Wiley & Sons, Inc.: Hoboken, NJ, USA, 1998; pp. 53–58. [Google Scholar]
- LECO. 2012. Manual, TruMaC CNS/NS Determinator. Instruction. (LECO Corporation, 3000 Lakeview Avenue. St Joseph, MI49085, USA.
- Murphy, J.; Riley, J.P.P. A modified single solution method for the determination of phosphate in natural waters. Anal. Chim. Acta 1962, 27(C), 31–36. [Google Scholar] [CrossRef]
- Kotzé, E.; du Preez, C.C. Influence of long-term wheat residue management on acidity and some macronutrients in an Avalon soil. South Afr. J. Plant Soil 2008, 25(1), 14–21. [Google Scholar] [CrossRef]
- Molina, M.; Fuentes, R.; Calderón, R.; Escudey, M.; Avendaño, K.; et al. Impact of forest fire ash on surface charge characteristics of Andisols. Soil Sci. 2007, 172(10), 820–834. [Google Scholar] [CrossRef]
- Heydari, M.; Rostamy, A.; Najafi, F.; Dey, D.C. Effect of fire severity on physical and biochemical soil properties in Zagros oak (Quercus brantii Lindl.) forests in Iran. J. For. Res. 2017, 28(1), 95–104. [Google Scholar] [CrossRef]
- Chauke, P.B.; Nciizah, A.D.; Wakindiki, I.I.C.; Mudau, F.N.; Madikiza, S.; Motsepe, M.; Kgakatsi, I. No-Till Improves Selected Soil Properties, Phosphorus Availability and Utilisation Efficiency, and Soybean Yield on Some Smallholder Farms in South Africa. Front. Sustain. Food Syst. 2022, 6, 1009202. [Google Scholar] [CrossRef]
- Lollato, R.P.; Edwards, J.T.; Zhang, H. Effect of Alternative Soil Acidity Amelioration Strategies on Soil pH Distribution and Wheat Agronomic Response. Soil Sci. Soc. Am. J. 2013, 77(5), 1831–1841. [Google Scholar] [CrossRef]
- Havlin, J.L.; Beaton, J.D.; Tisdale, S.L.; Nelson, W.L. Soil fertility and fertilisers: An introduction to nutrient management; Pearson Prentice Hall: New Jersey, 2005. [Google Scholar]
- Poswa, L.Z. 2016. Factors Affecting Phosphorus Requirements for the Soils of the South African Sugar Industry. Univ. KwaZulu-Natal (Pietermaritzburg, South Africa): 1–82. 2016. Available online: https://pdfs.semanticscholar.org/ce07/b9e2739c3469f7153204aa1359e72700e377.pdf.
- Li, F.; Liang, X.; Liu, Z.; Tian, G. No-till with straw return retains soil total P while reducing the loss potential of soil colloidal P in rice-fallow systems. Agric. Ecosyst. Environ. 2019, 286, 106653. [Google Scholar] [CrossRef]
- Balemi, T.; Negisho, K. Management of soil phosphorus and plant adaptation mechanisms to phosphorus stress for sustainable crop production: a review. J. Soil Sci. Plant Nutr. 2012, (ahead), 0–0. [Google Scholar] [CrossRef]
- Zibilske, L.M.; Bradford, J.M.; Smart, J.R. Conservation tillage induced changes in organic carbon, total nitrogen and available phosphorus in a semi-arid alkaline subtropical soil. Soil Tillage Res. 2002, 66(2), 153–163. [Google Scholar] [CrossRef]
- ARC-Small Grain. Guidelines for the production of small grains in the summer rainfall region; Bethlehem(South Africa), 2018. [Google Scholar]
- Lohan, S.K.; Jat, H.S.; Yadav, A.K.; Sidhu, H.S.; Jat, M.L.; et al. Burning issues of paddy residue management in the north-west states of India. Renew. Sustain. Energy Rev. 2018, 81, 693–706. [Google Scholar] [CrossRef]
- Bhuvaneshwari, S.; Hettiarachchi, H.; Meegoda, J.N. Crop residue burning in India: Policy challenges and potential solutions. Int. J. Environ. Res. Public Health 2019, 16(5). [Google Scholar] [CrossRef] [PubMed]
- Sidhu, B.S.; Beri, V. Effect of crop residue management on the yields of different crops and on soil properties. Biol. Wastes 1989, 27(1), 15–27. [Google Scholar] [CrossRef]
- Virto, I.; Imaz, M.J.; Enrique, A.; Hoogmoed, W.; Bescansa, P. Burning crop residues under no-till in semi-arid land, Northern Spain - Effects on soil organic matter, aggregation, and earthworm populations. Aust. J. Soil Res. 2007, 45(6), 414–421. [Google Scholar] [CrossRef]
- Mühlbachová, G.; Růžek, P.; Kusá, H.; Vavera, R.; Káš, M. Nutrient distribution in the soil profile under different tillage practices during a long-term field trial. Agronomy 2024, 14(12), 3017. [Google Scholar] [CrossRef]
- Lobe, I.; Amelung, W.; Du Preez, C.C. Losses of carbon and nitrogen with prolonged arable cropping from sandy soils of the South African Highveld. Eur. J. Soil Sci. 2001, 52(1), 93–101. [Google Scholar] [CrossRef]
- Dube, E.; Mare-Patose, R.; Kilian, W.; Barnard, A.; Tsilo, T.J. Identifying high-yielding dryland wheat cultivars for the summer rainfall area of South Africa. South Afr. J. Plant Soil 2016, 33(1), 77–81. [Google Scholar] [CrossRef]
- Venzke Filho, S. de P.; Feigl, B.J.; Piccolo, M. de C.; Fante, L., Jr.; Neto, M. Siqueira; et al. Root systems and soil microbial biomass under the no-tillage system. Sci. Agric. 2004, 61(5), 529–537. [Google Scholar] [CrossRef]
- Houshyar, E.; Esmailpour, M. The impacts of tillage, fertiliser and residue management on the soil properties and wheat production in a semi-arid region of Iran. J. Saudi Soc. Agric. Sci. 2020, 19(3), 225–232. [Google Scholar] [CrossRef]
- Balota, E.L.; Kanashiro, M.; Filho, A. Colozzi; Andrade, D.S.; Dick, R.P. Soil enzyme activities under long-term tillage and crop rotation systems in subtropical agro-ecosystems. Braz. J. Microbiol. 2004, 35(4), 300–306. [Google Scholar] [CrossRef]
- Liu, X.; Herbert, S.J.; Hashemi, A.M.; Zhang, X.; Ding, G. Effects of agricultural management on soil organic matter and carbon transformation - A review. Plant Soil Environ. 2006, 52(12), 531–543. [Google Scholar] [CrossRef]
- Hofman, G.; Cleemput, O. Soil and Plant Nitrogen; Int. Fertil. Ind. Assoc. (49): Paris, France, 2004. [Google Scholar]
- Li, G.; Ye, H.; Li, M.; Zhao, Z.; Chen, F.; Meng, Y.; Yu, C.; Xie, H.; Ren, Z.; Li, T.; Liao, Y. A global meta-analysis of soil nitrogen-cycling variables under no-tillage as compared to conventional tillage. Plant Soil 2025, 1–15. [Google Scholar] [CrossRef]
- Wang, Z.; Zhang, B.; Li, J.; Lian, S.; Zhang, J.; Shi, S. Effects of deficit-regulated irrigation on root-growth dynamics and water-use efficiency of winter wheat in a semi-arid area. Water 2024, 16(18), 2678. [Google Scholar] [CrossRef]
- Poffenbarger, H.J.; Sawyer, J.E.; Barker, D.W.; Olk, D.C.; Six, J.; et al. Legacy effects of long-term nitrogen fertiliser application on the fate of nitrogen fertiliser inputs in continuous maize. Agric. Ecosyst. Environ. 2018, 265(February), 544–555. [Google Scholar] [CrossRef]
- Pittelkow, C.M.; Liang, X.; Linquist, B.A.; Van Groenigen, L.J.; Lee, J.; et al. Productivity limits and potentials of the principles of conservation agriculture. Nature 2015a, 517(7534), 365–368. [Google Scholar] [CrossRef] [PubMed]
- Rusinamhodzi, L.; Corbeels, M.; Van Wijk, M.T.; Rufino, M.C.; Nyamangara, J.; et al. A meta-analysis of long-term effects of conservation agriculture on maize grain yield under rain-fed conditions. Agron. Sustain. Dev. 2011, 31(4), 657–673. [Google Scholar] [CrossRef]
- Norouzi, M.; Ramezanpour, H. Effect of fire on soil nutrient availability in forests of Guilan, North of Iran. Carpathian J. Earth Environ. Sci. 2013, 8(1), 157–170. [Google Scholar]
Figure 1.
The minimum and maximum monthly temperatures in the Bethlehem long-term trial at approximately 10-year intervals. The different years for which the data are presented are approximately 10 years apart, to coincide with previous studies on the trial.
Figure 1.
The minimum and maximum monthly temperatures in the Bethlehem long-term trial at approximately 10-year intervals. The different years for which the data are presented are approximately 10 years apart, to coincide with previous studies on the trial.
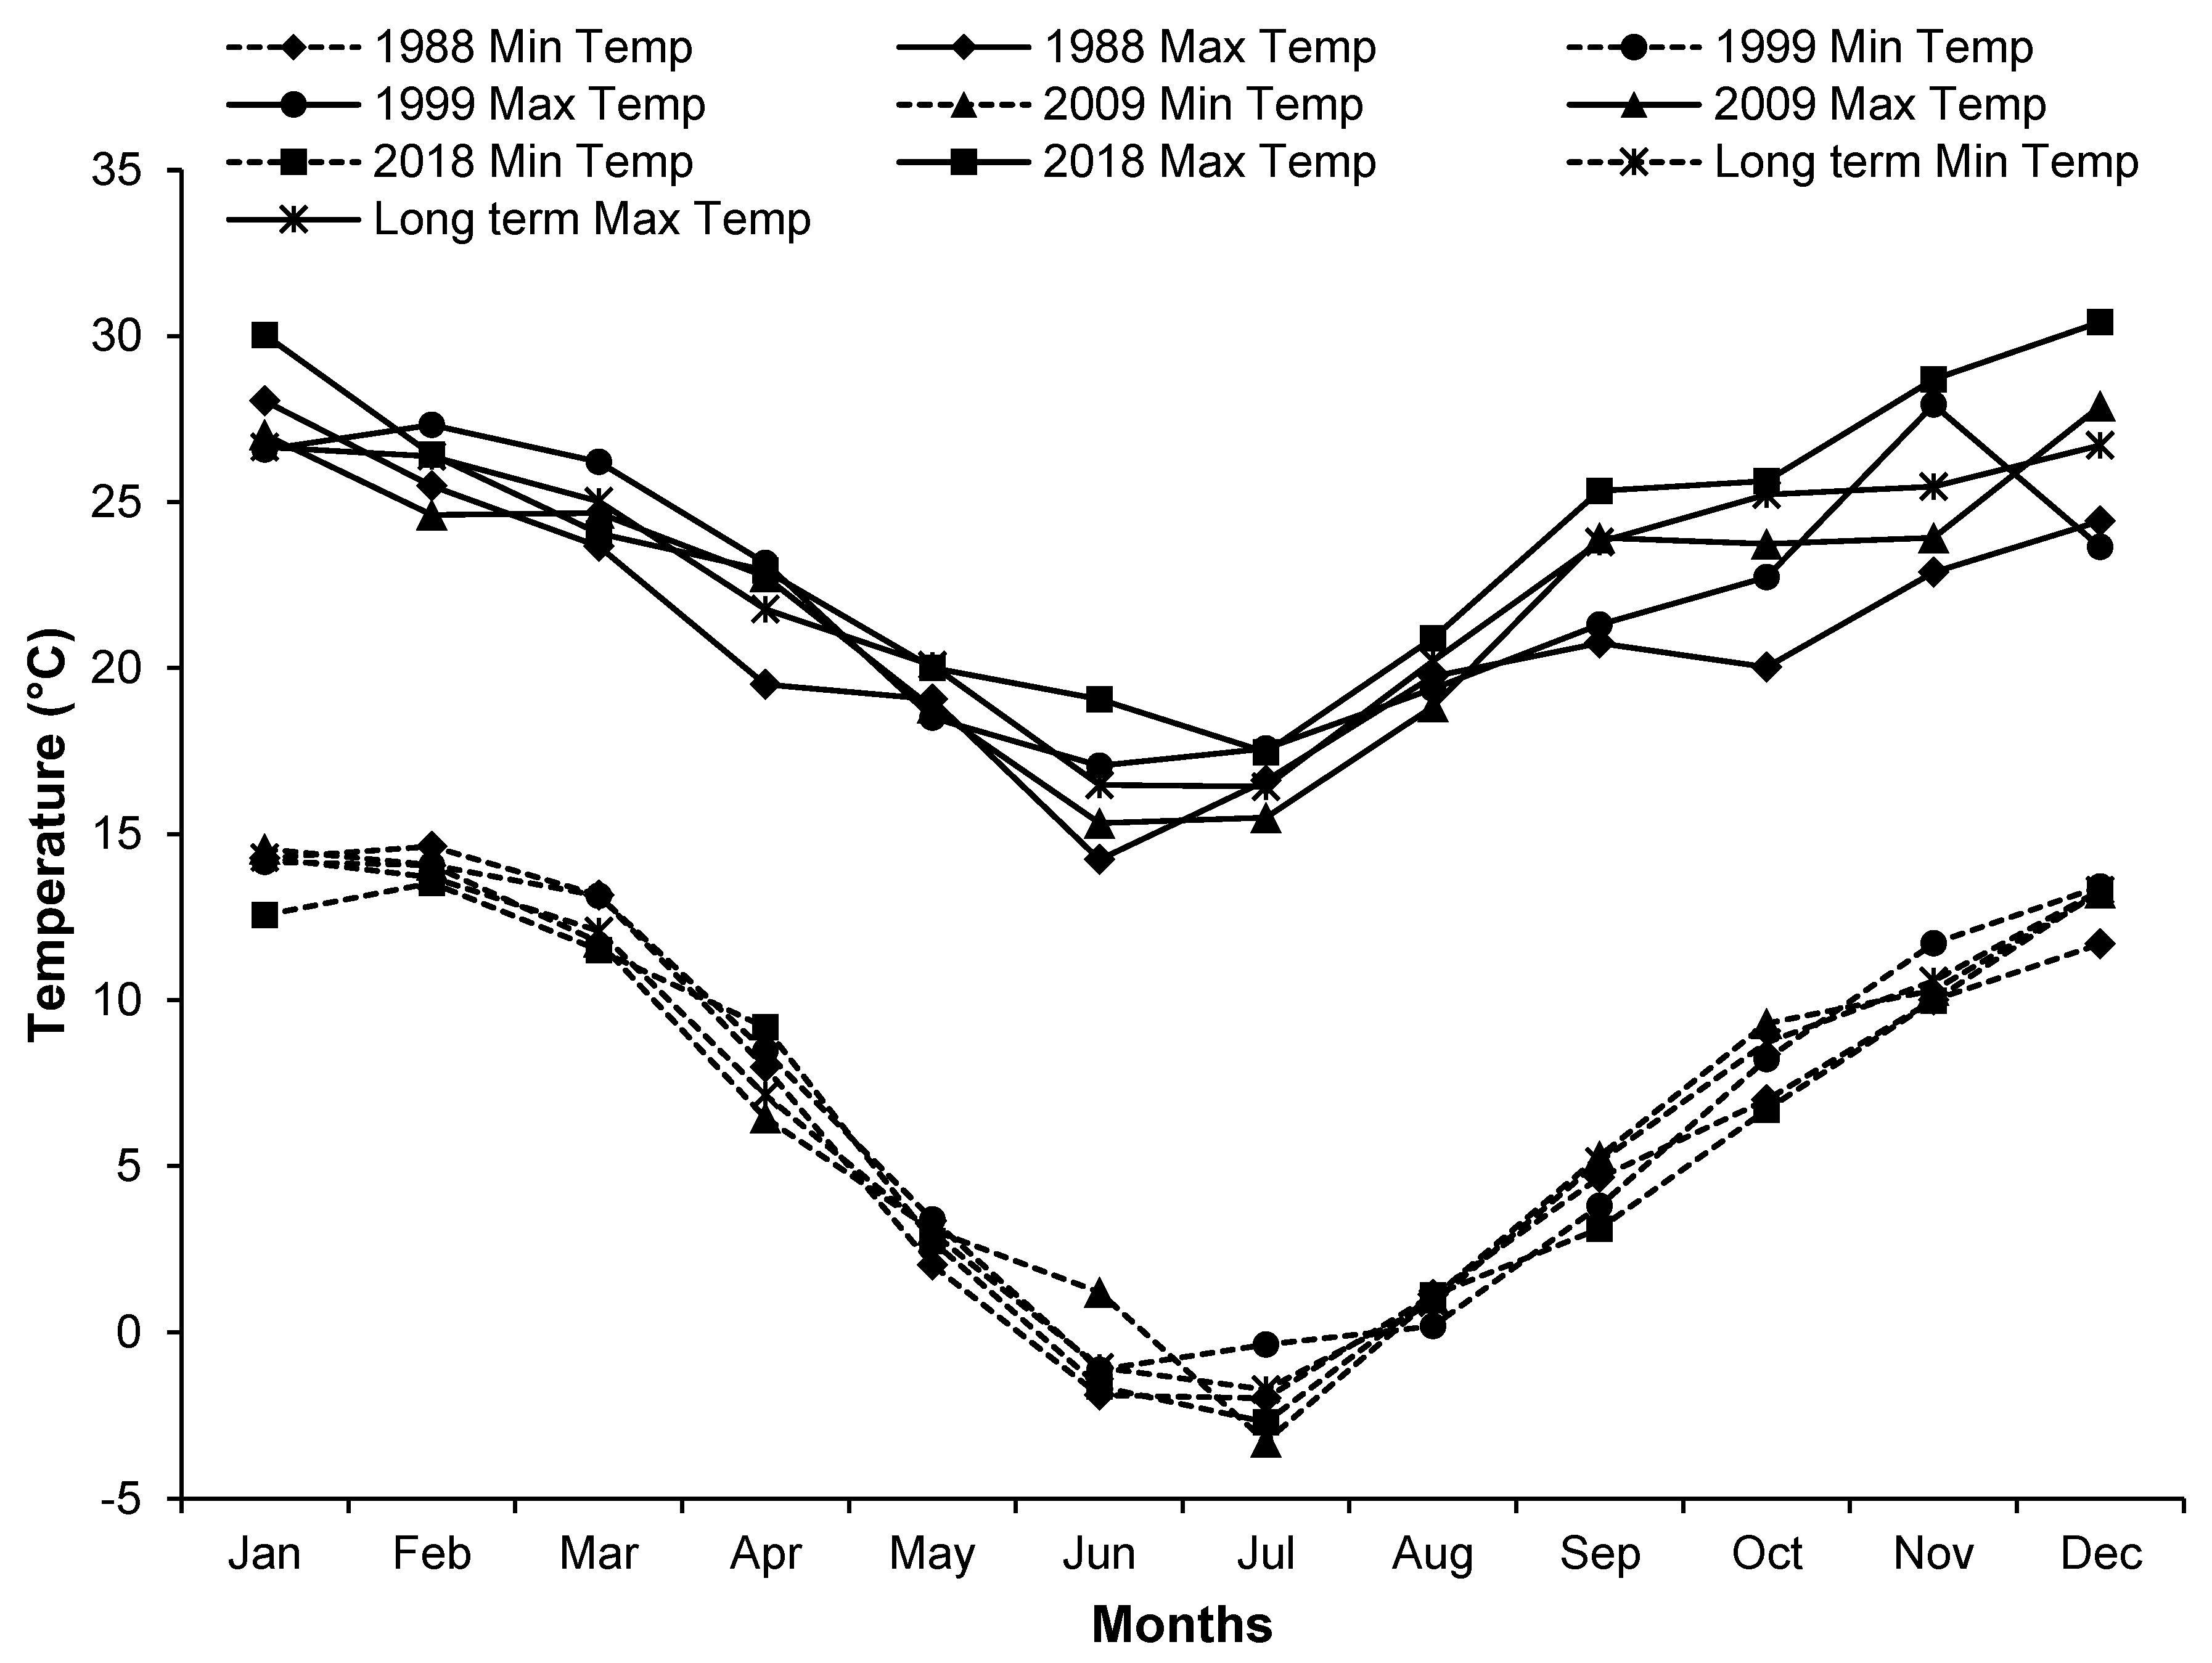
Figure 2.
The monthly rainfall patterns for the Bethlehem long-term trial at 10-year intervals. The different years for which the data are presented are approximately 10 years apart, to coincide with previous studies on the trial.
Figure 2.
The monthly rainfall patterns for the Bethlehem long-term trial at 10-year intervals. The different years for which the data are presented are approximately 10 years apart, to coincide with previous studies on the trial.
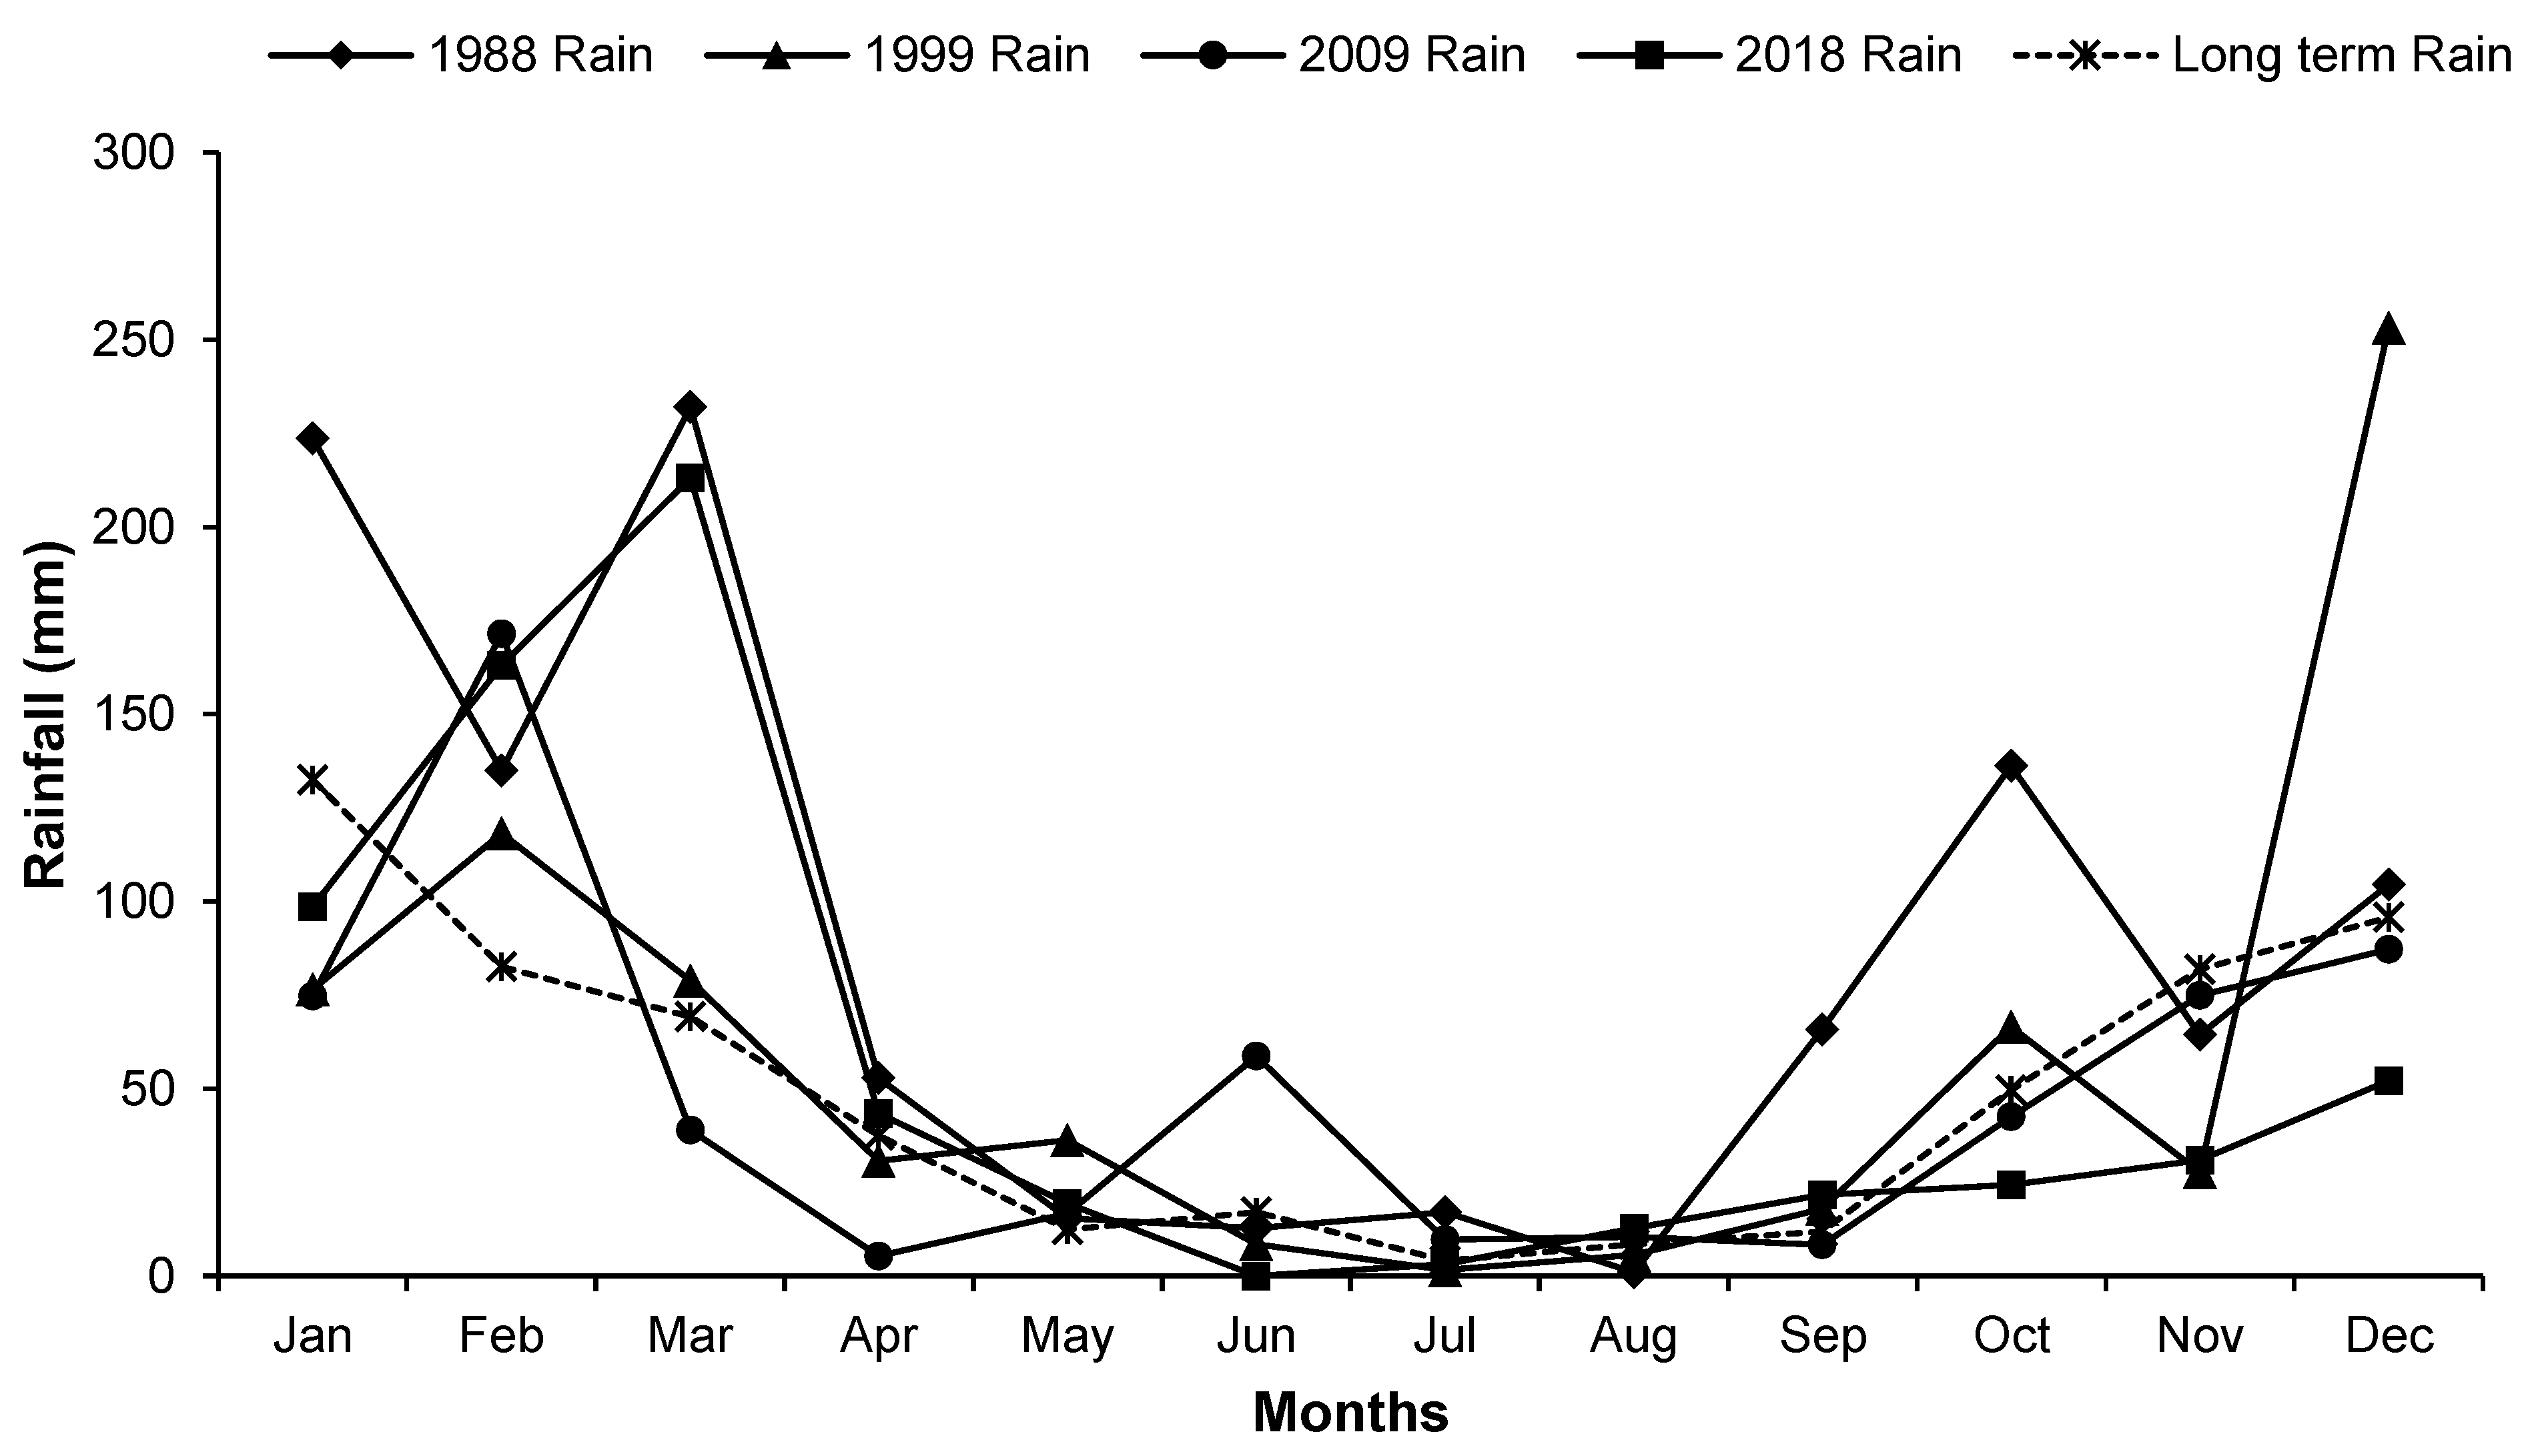
Table 4.
Statistical significance (p-values) of treatment combination effects from general ANOVA.
| Source of variation | P-values | ||||
|---|---|---|---|---|---|
| d.f. | pH | Soil organic Carbon | Total Nitrogen | Extractable Phosphorus | |
| Tillage | 2 | ns | ns | ** | ** |
| Straw management | 1 | * | ns | ns | * |
| Soil depth | 1 | ns | ns | ns | ** |
| Tillage × straw management | 2 | * | ns | ns | * |
| Tillage × soil depth | 2 | ns | ns | ns | * |
| Straw management × soil depth | 1 | ns | ns | ns | * |
| Tillage × straw management × soil depth | 2 | * | ns | ns | * |
*p<0.05; **p<0.001; ns = no significant differences at 95% confidence level (n =36).
Table 5.
The effects of tillage × straw management × depth on soil pH.
| Soil pH | |||
|---|---|---|---|
| Tillage system | Straw management | 0 - 20 cm | 20 - 40 cm |
| No-tillage | Burned | 5.39a | 5.28a |
| Unburned | 4.78b | 4.94ab | |
| Stubble mulch | Burned | 5.03ab | 5.03ab |
| Unburned | 4.98ab | 4.99ab | |
| Conventional tillage | Burned | 5.05ab | 5.02ab |
| Unburned | 5.04ab | 5.19ab | |
Values with different letters (a-b) in the columns represent significant differences at p<0.05.
Table 6.
The effects of tillage × straw management × soil depth on extractable phosphorus.
| Tillage system | Straw management system | Extractable P (mg kg-1) | |
|---|---|---|---|
| 0 - 20 cm | 20 - 40 cm | ||
| No-tillage | Burned | 38.5a | 15.1cd |
| Unburned | 33.1ab | 13.5cd | |
| Stubble mulch | Burned | 31.9b | 12.4d |
| Unburned | 27.5b | 11.8d | |
| Conventional tillage | Burned | 26.2b | 13.9cd |
| Unburned | 23.4bc | 8.65d | |
Values with different letters (a-d) in columns indicate significant differences at p<0.05.
Table 7.
The effect of tillage and straw management on soil organic carbon and total nitrogen.
| Factor | Soil properties | ||
|---|---|---|---|
| Organic carbon (g C kg-1) | Total nitrogen (g N kg-1) | C: N ratio | |
| Tillage system | |||
| No-tillage | 8.50 | 0.70a | 12.10 |
| Stubble mulch | 7.70 | 0.60b | 12.83 |
| Conventional tillage | 7.20 | 0.60b | 12.00 |
| Straw management | |||
| Burned | 7.40 | 0.60 | 12.33 |
| Unburned | 8.20 | 0.60 | 13.66 |
| Soil depth | |||
| 0 - 20 cm | 7.50 | 0.60 | 12.50 |
| 20 - 40 cm | 8.00 | 0.60 | 13.30 |
| Mean | 7.90 | 0.60 | 12.67 |
Values with different letters (a-b) in a column indicate significant differences at p<0.05.
Table 8.
Summary of dryland wheat yield data used in the analysis.
| Yield (Mg ha-1) | |||||
|---|---|---|---|---|---|
| Year | n | Data range | µ | σ | CV (%) |
| 1988 | 54 | 1.23-3.52 | 2.33 | 0.518 | 22.3 |
| 1999 | 54 | 1.34-2.67 | 1.93 | 0.289 | 14.9 |
| 2009 | 54 | 2.00-3.44 | 2.65 | 0.350 | 13.2 |
| 2018 | 54 | 0.132-0.989 | 0.596 | 0.218 | 36.5 |
n, the total number of samples; µ, mean grain yield; σ, standard deviation from the mean; CV, coefficient of variation. The different years for which the data are presented are approximately 10 years apart, to coincide with previous studies on the trial.
Table 9.
The significance of differences as per ANOVA at 95% confidence interval for grain yield data.
Table 9.
The significance of differences as per ANOVA at 95% confidence interval for grain yield data.
| Factors and interactions | d.f. | Grain yield |
|---|---|---|
| Year | 3 | ** |
| Tillage | 2 | * |
| Straw management | 1 | ** |
| Nitrogen fertiliser | 2 | * |
| Year × tillage | 6 | ns |
| Year × straw management | 3 | * |
| Tillage × straw management | 2 | ns |
| Year × nitrogen fertiliser | 6 | ns |
| Tillage × nitrogen fertiliser | 4 | ns |
| Straw management × nitrogen fertiliser | 2 | ns |
| Year × tillage × straw management | 6 | ns |
| Year × tillage × nitrogen fertiliser | 12 | ns |
| Year × straw management × nitrogen fertiliser | 6 | ns |
| Tillage × straw management × nitrogen fertiliser | 4 | ns |
| Year × tillage × straw management × nitrogen fertiliser | 12 | ns |
*p<0.05; **p<0.001; ns, no significant differences.
Table 10.
The effect of year, tillage practice and straw management on grain yield over the years.
| Tillage system | Grain yield (Mg ha-1) |
|---|---|
| No-tillage | 1.86ab |
| Stubble mulch | 1.80b |
| Conventional tillage | 1.97a |
| LSD | 0.108 |
LSD, least significant difference; Values with different letters (a-d) in the columns represent significant differences at p<0.05.
Disclaimer/Publisher’s Note: The statements, opinions and data contained in all publications are solely those of the individual author(s) and contributor(s) and not of MDPI and/or the editor(s). MDPI and/or the editor(s) disclaim responsibility for any injury to people or property resulting from any ideas, methods, instructions or products referred to in the content. |
© 2026 by the authors. Licensee MDPI, Basel, Switzerland. This article is an open access article distributed under the terms and conditions of the Creative Commons Attribution (CC BY) license (http://creativecommons.org/licenses/by/4.0/).
Copyright: This open access article is published under a Creative Commons CC BY 4.0 license, which permit the free download, distribution, and reuse, provided that the author and preprint are cited in any reuse.