

Submitted:
28 July 2026
Posted:
30 July 2026
You are already at the latest version
Abstract
Background: Pelvic organ prolapse (POP) and stress urinary incontinence (SUI) are common pelvic floor disorders with multifactorial etiology. This study aimed to identify demographic, anthropometric, and obstetric factors associated with POP and SUI. Methods: A retrospective cross-sectional study was conducted among 5,477 women attending a tertiary urogynecological outpatient clinic between 2016 and 2025. The study group included 4,333 women diagnosed with POP or SUI, while 1,144 women with other gynecological conditions served as controls. Associations between age, body mass index (BMI), smoking, and obstetric history were evaluated using multivariable logistic regression and the U-Smile predictive method. Results: Increasing age was independently associated with a higher risk of pelvic floor disorders (OR = 1.02; 95% CI: 1.01–1.02; p < 0.0001). Overweight was associated with a reduced likelihood of POP/SUI compared with normal BMI (OR = 0.85; 95% CI: 0.73–1.00; p = 0.0444). Each additional full-term pregnancy was associated with a 35% reduction in the odds of pelvic floor disorders (OR = 0.65; 95% CI: 0.60–0.69; p < 0.0001). Underweight, obesity, preterm birth, miscarriage, and smoking were not independent predictors. Conclusions: Age, overweight status, and the number of full-term pregnancies were the strongest independent predictors of POP and SUI. Further studies are needed to clarify the unexpected protective associations observed for overweight and term pregnancies.
Keywords:
pelvic organ prolapse
; urinary incontinence
; stress
; body mass index
; pregnancy
; urogynecology
1. Introduction
The findings presented in this study represent a continuation of our previously published pilot investigation [1]. Following the completion of the pilot study, our research team continued participant recruitment and performed a more comprehensive statistical analysis of the expanded dataset.
The primary objective of the study was to identify factors predisposing women to various forms of POP and lower urinary tract symptoms (LUTS), with particular emphasis on SUI. Owing to the continuous advancement of urogynecological care and the progressive aging of the population, both POP and LUTS have become increasingly prevalent health conditions associated with substantial healthcare costs. Furthermore, these disorders have a profound impact on intimate relationships, overall quality of life, and body image. The coexistence of POP and LUTS with psychological disorders has been consistently reported by specialists in gynecology, urology, sexual medicine, psychiatry, and clinical psychology [2]. These observations suggest that the etiopathogenesis of these conditions is multifactorial and that their effective management requires an interdisciplinary therapeutic approach.
In addition, our research team sought to validate or refute the conclusions drawn from the pilot study by analyzing a larger study population using more robust statistical methods.
2. Materials and Methods
The research was conducted from January 2016 to December 2025. This was a retrospective study conducted in the Outpatient Clinic, Poznan University of Medical Sciences. The study was exempt from approval by the Bioethics Committee, as it did not meet the criteria for medical experiment.
N
Figure 1.
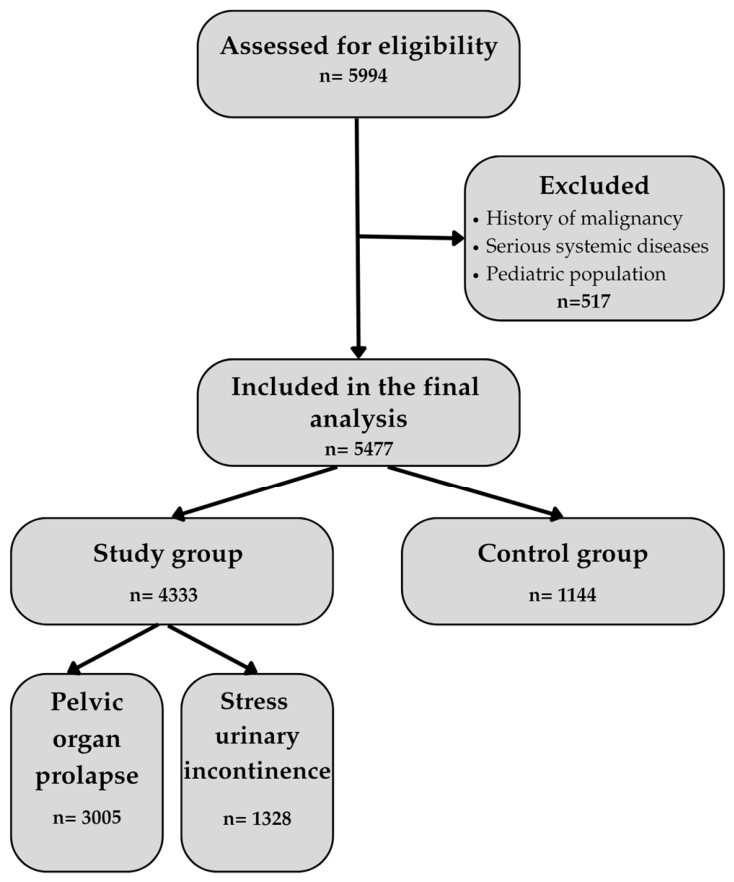
A flowchart of participants recruitment, exclusion and inclusion. The figure illustrates the number of individuals assessed for eligibility, reasons for exclusion, and the final number of participants included in the analysis.
Figure 1.
A flowchart of participants recruitment, exclusion and inclusion. The figure illustrates the number of individuals assessed for eligibility, reasons for exclusion, and the final number of participants included in the analysis.
The aim of this study was to evaluate the association between body mass index (BMI), obstetric history, and comorbidities and the occurrence of pelvic organ prolapse (POP) and urinary incontinence. Data was obtained from medical records, clinical examination and patients questionnaires. The following variables were collected: age, body mass index (BMI), obstetric history and smoking status. Body mass index (BMI) was calculated and categorized according to WHO criteria. Obstetric variables included: full-term pregnancies, preterm births and miscarriages.
Statistical analysis was performed using PQStat software. The level of statistical significance was set at α = 0.05. The study population was characterized using standard descriptive statistical methods, including means, standard deviations, medians with interquartile ranges, and minimum–maximum values for continuous variables, and counts and percentages for categorical variables.
Due to non-normal distribution of most variables, non-parametric statistical tests were applied. Differences between the study and control groups were assessed using the Mann–Whitney U test for continuous and ordinal variables, including age, BMI, BMI categories, and the number of full-term, preterm, and miscarried pregnancies. The smoking status was compared using the chi-square test.
To evaluate independent predictors of stress urinary incontinence and pelvic organ prolapse, a multivariable logistic regression model was constructed. Results were reported as odds ratios (ORs) with 95% confidence intervals (95% CI), and statistical significance of regression coefficients was assessed using the Wald test.
The predictive contribution of individual variables and their combinations was further evaluated using the U-smile method, which allows visual and quantitative assessment of changes in predicted probabilities after adding predictors to a reference logistic regression model. The statistical significance of predictors in this analysis was assessed using the likelihood ratio test [1,2,3].
2.1. Limitations
This study has several limitations that should be acknowledged. First, the absence of a healthy control group limits the ability to directly compare findings with baseline values in the general population. Secondly, the lack of women older than 50 years (postmenopausal) in the control group. The study may also be affected by selection bias, including self-selection bias, as participation relied in part on self-reported data, which may introduce inaccuracies or systematic differences between respondents and non-respondents. Additionally, the social bias cannot be excluded, as some survey questions addressed sensitive topics, such as miscarriages and preterm births, which may have led to underreporting or incomplete disclosure by participants. Furthermore, the age distribution of participants was disproportionate, which may have influenced the results and restricts the extent to which conclusions can be generalized across different age groups.
3. Results
3.1. Characteristics of the Study Group
The research was conducted from January 2016 to December 2025. This was a retrospective study conducted in the Outpatient Clinic, Poznan University of Medical Sciences. The study was exempt from approval by the Bioethics Committee, as it did not meet the criteria for medical experiment.
Female patients aged 26–95 were enrolled in the study. The allocation of patients to groups was based on ICD-10
AGE
A total of 5477 patients were included in the study, of whom 4333 were assigned to the study group and 1144 to the control group. Participants in the study group ranged from 20 to 99 years of age, whereas all participants in the control group were between 50 and 99 years old. The estimated mean age was 62.6 years in the study group and 64.8 years in the control group.
In the study group, the most represented age categories were 70–79 years, accounting for 27.9% of patients (n = 1207), and 60–69 years, accounting for 27.7% (n = 1202). Participants aged 50–59 years constituted 19.9% of the study population (n = 862), whereas individuals younger than 40 years represented only a small proportion of the cohort.
In the control group, the majority of participants were aged 50–59 years, accounting for 37.2% of cases (n = 426), followed by patients aged 60–69 years (29.9%, n = 342) and 70–79 years (26.0%, n = 298).
DIAGNOSIS
The primary criterion differentiating the study and control groups was the clinical diagnosis classified according to the International Classification of Diseases, 10th Revision (ICD-10) [1]. The study group consisted exclusively of patients diagnosed with stress urinary incontinence and pelvic organ prolapse disorders, whereas the control group included patients with heterogeneous gynecological diagnoses unrelated to pelvic floor dysfunction.
In the study group, the most prevalent diagnosis was N39.3 stress urinary incontinence, accounting for 30.7% of cases (n = 1328), followed by N81.1 cystocele, identified in 25.9% of patients (n = 1121). Other commonly observed prolapse-related diagnoses included N81.2 incomplete uterovaginal prolapse (10.2%, n = 442), N81.6 rectocele (10.0%, n = 435), N81.9 female genital prolapse, unspecified (8.7%, n = 379), and N81.3 complete uterovaginal prolapse (8.3%, n = 359).
In the control group, the most frequent diagnoses were N90.9 noninflammatory disorder of vulva and perineum, unspecified (19.1%, n = 219), N63 unspecified lump in breast (13.7%, n = 157), N90.8 other specified noninflammatory disorders of vulva and perineum (13.5%, n = 154), and N90.4 leukoplakia of vulva (13.1%, n = 150) (Table 1).
BMI
Body mass index (BMI) distribution was analyzed as one of the principal anthropometric characteristics of the study population. Participants were categorized according to standard BMI classification into underweight, normal weight, overweight, and obesity groups.
In the study group, overweight was the most prevalent BMI category, accounting for 42.3% of patients (n = 1833), followed by normal weight, observed in 33.42% (n = 1448), and obesity, identified in 23.75% of participants (n = 1029). Underweight patients constituted only 0.53% of the study population (n = 23).
Similarly, in the control group, overweight represented the largest BMI category, accounting for 38.02% of participants (n = 435), followed by normal weight in 35.58% (n = 407) and obesity in 25.52% of patients (n = 292). Underweight individuals accounted for 0.87% of the control group (n = 10) (Table 2).
OBSTETRIC HISTORY
Obstetric history constituted an important clinical characteristic of the analyzed population. In the outpatient clinic where the study was conducted, reproductive history was routinely documented using the Para classification system.
In both groups, the most common obstetric status was a history of two full-term pregnancies, observed in 50.89% of the study group (n = 2205) and 44.67% of the control group (n = 511). One previous full-term pregnancy accounted for 14.95% of the study group (n = 648) and 20.37% of the control group (n = 233), whereas nulliparous women represented 3.23% (n = 140) and 13.02% (n = 149) of the study and control groups, respectively.
The majority of participants had no history of preterm birth, accounting for 93.77% of the study group (n = 4063) and 92.74% of the control group (n = 1061). One previous preterm delivery was observed in 5.05% of the study group (n = 219) and 6.12% of the control group (n = 70).
Similarly, no history of miscarriage was observed in most participants, accounting for 80.34% of the study group (n = 3481) and 82.87% of the control group (n = 948). One miscarriage was documented in 14.54% of the study group (n = 630) and 13.46% of the control group (n = 154).
SMOKING STATUS
Smoking status was analyzed as an additional clinical characteristic of the study population. The majority of participants in both groups reported that they did not smoke. In the study group, non-smoking was reported by 93.3% of patients (n = 4043), whereas 6.7% were smokers (n = 290). Similarly, in the control group, 7.2% of participants reported smoking (n = 82), while non-smokers accounted for 92.8% (n = 1062).
The proportional distribution of smoking status in the study and control groups is presented in Table 6.
The proportional distribution of smoking status in the study and control groups is presented in Table 6.
3.2. Results of Univariate Analysis
Univariate analysis performed using the Mann–Whitney test demonstrated significant differences between the groups with respect to age (p=0.0016) (Table 7), the number of full-term pregnancies (p<0.0001) (Table 8), and the number of miscarriages (p = 0.0412) (Table 9).
No significant differences were observed in BMI values (p=0.2524), BMI category distribution (p=0.6409), the number of preterm births (p=0.2169), or the proportion of tobacco smokers (p=0.5701).
3.3. Results of Multivariate Analysis
Interpretation of the logistic regression model based on the Wald test showed that the independent, statistically significant risk factors were:
- AGE: Each one-year increase in age was associated with a 2% increase in the odds of the disorder (OR = 1.02; 95% CI: 1.01–1.02; p < 0.0001).
- BMI category “overweight”: Compared to individuals with normal BMI, overweight was a protective factor, associated with a 15% reduction in the odds of the disorder (OR = 0.85; 95% CI: 0.73–1.00; p = 0.0444).
- Number of full-term pregnancies: A higher number of full-term pregnancies was a significant protective factor. Each additional full-term pregnancy was associated with a 35% decrease in the odds of the disorder (OR = 0.65; 95% CI: 0.60–0.69; p < 0.0001). In other words, individuals with a lower number of full-term pregnancies had a 54% higher odds of the disorder.
Other factors included in the model, including obesity, underweight, preterm and non-full-term pregnancies, and smoking, did not reach statistical significance, indicating that they were not independent predictors of the studied outcome in the analyzed population (Table 10).
3.4. Assessment of Predictive Value Using U-SmILE Plots
The multivariable model, including all analyzed variables jointly, significantly improved classification ability. The reliability of assignment to the healthy group increased by 5.3%, and to the group with disorders by 3%, indicating a high clinical value of the complementary use of these variables (Figure 2a). Among the individual variables, the number of full-term pregnancies was the strongest predictor. Independently, it increased the reliability of classification to the healthy group by 4%, and to the group with disorders by 2.5% (Figure 2b).
Another significant predictor was age, which independently improved classification to the healthy group by 0.6%, and to the group with disorders by 0.2% (Figure 3).
The remaining variables, considered individually, had only a marginal or statistically non-significant contribution to the improvement of classification:
- BMI categories improved classification to the healthy group by 0.2%, with no significant effect on classification to the group with disorders.
- Smoking improved classification to the healthy group by 0.2%, with no significant effect on classification to the group with disorders.
- Miscarriages improved classification to the healthy group by 0.2%, with no significant effect on classification to the group with disorders.
- Preterm births improved classification to the healthy group only by 0.1%, with no significant effect on classification to the group with disorders.
In summary, the U-smile analysis confirms that the model combining all variables carries the greatest prognostic value, and among the individual factors, the number of full-term pregnancies emerges as the strongest single predictor of pelvic floor dysfunction and pelvic organ prolapse.
4. Discussion
SUI and POP frequently coexist, although POP may mask the presence of SUI by causing urethral kinking or obstruction [1,6]. Conversely, SUI may also develop secondary to POP, particularly following surgical correction of prolapse, when restoration of normal pelvic anatomy unmasks or precipitates urinary incontinence.
4.1. BMI
Numerous scientific reports have highlighted the association between excessive body weight, defined as a body mass index (BMI) exceeding 25 kg/m², and the occurrence of pelvic organ prolapse (POP) and stress urinary incontinence (SUI). The proposed mechanisms underlying this association emphasize the impact of increased intra-abdominal pressure on pelvic floor structures, particularly the anterior compartment [7,8]. Other hypotheses suggest that adipose tissue may contribute to the development of pelvic floor disorders by acting as a source of pro-inflammatory factors, promoting hormonal dysregulation, and increasing susceptibility to autoimmune processes.
In a pilot study preceding the present investigation, no statistically significant association was found between elevated BMI and the prevalence of POP and SUI [1]. However, we indicated that this finding might have resulted from the limited sample size and the presence of other, potentially more relevant variables influencing the occurrence of these conditions.
In the present study, regression analysis demonstrated that overweight individuals had a statistically significantly lower likelihood of developing pelvic organ support disorders and urinary incontinence. Compared with individuals with normal BMI, overweight status appeared to be a protective factor according to the U-Smile assessment method, being associated with a 15% reduction in the odds of pelvic floor disorders (OR = 0.85; 95% CI: 0.73–1.00; p = 0.0444). Therefore, this finding contradicts the results of the pilot study; however, the observed association was in the opposite direction to that initially expected.
In the statistical analysis of patients with BMI ≥30 kg/m² (obesity), no statistically significant association was identified. Thus, the results obtained in the obese subgroup are consistent with those of the pilot study, whereas the overweight subgroup demonstrated a reduced risk of POP and SUI. These findings suggest that increased BMI alone may not represent the primary risk factor for pelvic floor disorders; rather, obesity as a chronic disease and its associated complications may play a more important role. Further studies involving larger populations and more detailed stratification of BMI categories are warranted to better assess the relationship between body weight, metabolic status, and the risk of POP and SUI.
The findings of the present study may be explained by the potential protective role of estrogens [9]. Adipose tissue represents the primary source of estrogen production in postmenopausal women, with estrogens being synthesized through peripheral aromatization. It may be hypothesized that increased estrogen production in overweight patients partially compensates for other adverse consequences associated with excess body weight, such as elevated intra-abdominal pressure, greater elongation of the connective tissues surrounding the urethra and vaginal vestibule [10], and increased levels of pro-inflammatory factors. Conversely, in obese patients, the protective effects of estrogens may be insufficient to counterbalance the cumulative impact of other detrimental consequences associated with excessive body weight.
In both the present study and the preceding pilot study, underweight was not identified as a statistically significant risk factor for POP [1]. This finding was unexpected, as low body weight is associated with hypogonadism, hypoestrogenism, and nutritional deficiencies, all of which may impair collagen synthesis and increase the laxity of connective tissues supporting the pelvic organs.
In contrast, Henok (2017) reported that a BMI below 18.5 kg/m² was an independent risk factor for POP (AOR = 2.37; 95% CI: 1.25–4.51). However, that study was conducted in an African population, in which underweight may more frequently reflect adverse socioeconomic conditions that could themselves contribute to the development of POP. Furthermore, the underweight subgroup in that study was relatively small (n = 56) [11]. It is also important to note that the number of underweight participants in our cohort was limited. Therefore, larger studies are warranted to further investigate the potential association between underweight and the risk of POP.
4.2. Miscarriages
A history of miscarriage was not identified as an independent risk factor for pelvic floor disorders in either the U-Smile analysis or the multivariable regression analysis. Similarly, in the pilot study, no statistically significant association was observed between the number of previous miscarriages and stress urinary incontinence [1].
These findings are consistent with the existing literature. Previous studies have consistently demonstrated associations between pelvic floor disorders and obstetric factors such as multiparity, prolonged labor, and higher neonatal birth weight, whereas a history of miscarriage has not been identified as an independent risk factor [12,13,14,15,16].
4.3. Preterm Births
Preterm birth was not identified as an independent risk factor for pelvic floor disorders in either the U-Smile analysis or the multivariable regression analysis. However, this finding should be interpreted with caution, as women with a history of preterm delivery constituted a relatively small proportion of the study population (less than 7%), thereby limiting the statistical power of the analysis.
Preterm delivery is generally associated with lower neonatal birth weight and smaller head circumference, which may result in a shorter duration of labor and reduced mechanical trauma to the pelvic floor. Consequently, preterm birth may be associated with a lower risk of subsequent POP. Alternatively, the overall number of deliveries and the cumulative obstetric burden may be more important determinants of pelvic floor dysfunction than gestational age at delivery. In our cohort, most women with a history of preterm birth had experienced only a single preterm delivery. Therefore, it remains difficult to determine whether the observed findings reflect a genuinely lower risk associated with preterm birth or are attributable to differences in overall obstetric history. A systematic review by Dai et al. likewise found no significant association between preterm birth and SUI [17].
4.4. Term Births
Among the individual obstetric variables examined, the number of term pregnancies emerged as the strongest predictor of POP in the regression analysis. However, this association was not confirmed in the subsequent multivariable analysis, suggesting that its effect may be influenced by other clinical or obstetric factors.
Each additional term pregnancy was associated with a 35% reduction in the odds of pelvic floor disorders (OR = 0.65; 95% CI: 0.60–0.69; p < 0.0001), while women with fewer term pregnancies had a 54% higher likelihood of developing pelvic floor disorders according to the U-Smile analysis. These findings suggest that the relationship between the number of term pregnancies and the risk of POP is likely to be more complex than a simple linear association and warrants further investigation.
In the pilot study, the number of term deliveries was not significantly associated with POP; however, multiparous women (defined as those with three or more children) were more frequently represented in the POP group than in the control group. An important limitation of both studies is the lack of information regarding the mode of delivery. Consequently, it was not possible to distinguish between cesarean and vaginal births, which may have substantially different effects on pelvic floor integrity [1].
These observations should be interpreted in the context of the existing literature. Multiple cohort studies, systematic reviews, and meta-analyses have consistently identified multiparity, particularly when associated with vaginal delivery, as one of the strongest risk factors for pelvic organ prolapse and stress urinary incontinence [18,19,20].
4.5. Smoking
Smoking was not identified as an independent risk factor for pelvic floor disorders in either the multivariable regression analysis or the U-Smile analysis. It should be noted that the vast majority of participants in the present study were non-smokers, which may have limited the ability to detect a significant association.
Similarly, in the pilot study, 30.64% of participants with urinary incontinence and 32.44% of those with POP were smokers. Although the prevalence of both conditions was slightly higher among smokers, the differences were not statistically significant, suggesting only a weak trend toward an association [1].
Nevertheless, several systematic reviews and cohort studies have suggested that smoking may contribute to the development of pelvic floor disorders. Cigarette smoke contains high concentrations of reactive oxygen species and other toxic compounds that promote chronic inflammation, impair fibroblast function, reduce collagen synthesis, and accelerate the degradation of collagen and elastin fibers, thereby compromising the structural integrity of connective tissue supporting the pelvic organs [21]. In particular, aldehydes present in cigarette smoke, especially acrolein, have been shown to exert direct cytotoxic effects on fibroblasts [22]. Furthermore, chronic smokers frequently experience persistent cough, which may increase intra-abdominal pressure and impose repetitive mechanical stress on the pelvic floor.
Conversely, Rodriguez-Mias et al. (2015), in a cross-sectional study involving 1,042 women, did not identify a statistically significant association between smoking and either POP or SUI and even suggested a possible protective effect [23]. Taken together, the available evidence remains inconsistent, and further studies are needed to clarify the role of smoking in the pathogenesis of pelvic floor disorders.
4.6. Age
Increasing age was identified as a significant predictor of pelvic floor disorders in both the U-Smile analysis and the multivariable regression analysis. According to the U-Smile analysis, each additional year of age was associated with a 2% increase in the odds of developing pelvic floor disorders (OR = 1.02; 95% CI: 1.01–1.02; p < 0.0001).
These findings are consistent with clinical experience, as both POP and SUI are most frequently diagnosed in postmenopausal women. It should be noted, however, that the study population consisted predominantly of older participants, with women over 50 years of age accounting for approximately 82% of the study cohort and all participants in the control group. As the participants were recruited from outpatient clinics, the predominance of older women seeking medical attention for POP and SUI may itself reflect the increased prevalence of these conditions with advancing age.
Several biological mechanisms may explain this association. With increasing age, the regenerative capacity of connective tissue gradually declines, including reduced collagen synthesis and diminished replacement of damaged collagen fibers. Cumulative microtrauma sustained throughout the reproductive years may eventually exceed the repair capacity of the pelvic floor, leading to progressive structural failure. In addition, menopause is associated with a marked decline in estrogen production. Given the recognized role of estrogens in maintaining connective tissue homeostasis and pelvic floor integrity, estrogen deficiency may further contribute to the development and progression of POP [24].
Overall, the present findings are consistent with the majority of the available literature. However, some studies have reported the highest prevalence of POP and SUI among women aged 40–50 years, suggesting that the risk may peak during the perimenopausal period rather than after menopause [25].
5. Conclusions
- In the multivariable logistic regression analysis, overweight was identified as an independent protective factor for pelvic organ prolapse (POP). Compared with women with normal body mass index (BMI), those classified as overweight had a 15% lower likelihood of developing POP (OR = 0.85, 95% CI: 0.73–1.00; p = 0.0444). In contrast, underweight was not significantly associated with the occurrence of POP.
- Neither miscarriage nor preterm delivery emerged as independent risk factors for POP after adjustment for the remaining covariates included in the model. Similarly, smoking status was not independently associated with the presence of POP.
- Among all variables examined, the number of term pregnancies was the strongest independent predictor of POP. Each additional term pregnancy was associated with a 35% reduction in the odds of POP (OR = 0.65, 95% CI: 0.60–0.69; p < 0.0001). Conversely, women with fewer term pregnancies had a substantially greater likelihood of developing POP.
- Increasing age was also identified as an independent risk factor, with each additional year associated with a 2% increase in the odds of POP (OR = 1.02, 95% CI: 1.01–1.02; p < 0.0001).
- The remaining variables included in the regression model, namely obesity, underweight, miscarriage, preterm pregnancy, and smoking, did not reach statistical significance, indicating that they were not independent predictors of POP in the studied population.
Author Contributions
Conceptualization, G.J.B. and J.M..; methodology, B.W.; software, P.M.; validation, P.M., K.P.R. and M.P.K.; formal analysis, A.P., S.K., K.C.; investigation, A.P., S.K., K.C.; resources, J.K.M, W.W.K., W.M.K.; data curation, J.M., J.K.M.; writing—original draft preparation, A.P., S.K., K.C writing—review and editing, A.P., M.M; visualization, J.M.; supervision, G.J.B.; project administration, W.M.K.; funding acquisition, W.M.K. All authors have read and agreed to the published version of the manuscript.
Funding
This research received no external funding.
Institutional Review Board Statement
The study was conducted in accordance with the Declaration of Helsinki. Ethical review and approval were waived for this study due to not meeting the criteria of medical experiment.
Informed Consent Statement
Informed consent was obtained from all subjects involved in the study.
Data Availability Statement
The original data presented in the study are openly available in Zenodo at: https://doi.org/10.5281/zenodo.21651602.
Conflicts of Interest
The authors declare no conflicts of interest.
Abbreviations
The following abbreviations are used in this manuscript:
| POP | Pelvic Organ Prolapse |
| SUI | Stress Urinary Incontinence |
| LUTS | Lower Urinary Tract Symptoms |
| BMI | Body Mass Index |
References
- Jakub Mroczyk, Grażyna Jarząbek-Bielecka, Piotr Merks et al. Analysis of selected factors in pelvic organ prolapse and urinary incontinence and the differentiation of clinical forms – a pilot study, 26 July 2026, PREPRINT (Version 1) available at Research Square.
- Przydacz, M.; et al. Percepcja objawów z dolnego odcinka dróg moczowych (Lower Urinay Tract Symptoms - LUTS) przez lekarzy psychiatrów. [CrossRef]
- Kubiak, K.B.; Więckowska, B.; Jodłowska-Siewert, E.; et al. Visualising and quantifying the usefulness of new predictors stratified by outcome class: The U-smile method. PLoS ONE 2024, 19, e0303276. [Google Scholar] [CrossRef] [PubMed]
- Więckowska, B.; Kubiak, K.B.; Guzik, P. Evaluating the three-level approach of the U-smile method for imbalanced binary classification. PLoS ONE 2025, 20, e0321661. [Google Scholar] [CrossRef] [PubMed]
- Więckowska, B.; Guzik, P. U-smile – nowa metoda oceny zmiennej predykcyjnej bez progu decyzyjnego: wizualizacja i interpretacja za pomocą współczynnika rLR. Kongr. Stat. Pol. 2025. [Google Scholar] [CrossRef]
- World Health Organization. International statistical classification of diseases and related health problems. 10th revision (ICD-10), 5th ed.; World Health Organization: Geneva, 2016. [Google Scholar]
- Dizdaroullar, G.E.; Çam, Ç.; Ayvac?, H.; et al. The Importance of BMI on Prognostic Factors for Urinary Incontinence in Asymptomatic Nulliparous Women. J. Clin. Ultrasound 2025. [Google Scholar] [CrossRef] [PubMed]
- Hamoda, R.E.; Saad, E.A.; Kamel, D.M. Impact of BMI on Vaginal Noise and POP Symptoms. Bull. Fac. Phys. Ther. 2024. [Google Scholar] [CrossRef]
- Taithongchai, A.; Johnson, E.E.; Ismail, S.I.; Wallace, S.A.; Thakar, R. Oestrogen therapy for preventing pelvic organ prolapse in postmenopausal women. Cochrane Database Syst. Rev. 2024, 2024(2), CD015695, Published 2024 Feb 15. [Google Scholar] [CrossRef]
- Dietz, H.P.; Shek, K.L.; Descallar, J. Levator–Urethra Gap and Individualized Cut-Offs. Ultrasound Obstet. Gynecol. 2024. [Google Scholar] [CrossRef] [PubMed]
- Henok, A. Prevalence and Factors Associated with Pelvic Organ Prolapse among Pedestrian Back-Loading Women in Bench Maji Zone. Ethiop. J. Health Sci. 2017, 27(3), 263–272. [Google Scholar] [CrossRef] [PubMed]
- Puri, R. Risk factors for uterine prolapse among women in a hill village of Nepal: A case–control study. J. Obstet. Gynaecol. Res. 2011, 37(10), 1323–1330. [Google Scholar]
- Paudel, R.; Bhandari, S.; Paudel, L.; Thapa, B.; Bista, K.D. Risk factors of uterine prolapse among reproductive age group women in rural Nepal: A community-based case–control study. Int. Urogynecol. J. 2019, 30(10), 1681–1688. [Google Scholar]
- Siahkal, S.F.; Iravani, M.; Mohaghegh, Z.; Rashidi-Fakari, F. Maternal, obstetrical and neonatal risk factors’ impact on female urinary incontinence: a systematic review. Int. Urogynecology J. 2020, 31(12), 2513–2523. [Google Scholar] [CrossRef] [PubMed]
- Kiliç, M. Incidence and risk factors of urinary incontinence in women visiting Family Health Centers. SpringerPlus 2016, 5, 1331. [Google Scholar] [CrossRef] [PubMed]
- Abdullah, B.; Ayub, S.H.; Zahid, A.Z.M.; Noorneza, A.R. Urinary incontinence in primigravida: the neglected pregnancy predicament. Eur. J. Obstet. Gynecol. Reprod. Biol. 2016, 200, 25–29. [Google Scholar] [CrossRef] [PubMed]
- Dai, S.; Chen, H.; Luo, T. Prevalence and factors of urinary incontinence among postpartum: systematic review and meta-analysis. BMC Pregnancy Childbirth 2023, 23(1), 59. [Google Scholar] [CrossRef] [PubMed]
- Workineh, Z. A.; Gashaw, Z. M.; Andargie, T. M.; et al. Symptomatic pelvic floor disorders in community-dwelling women in Central Gondar Zone, Northwest Ethiopia. Int. Urogynecology Journal. 2025. [Google Scholar] [CrossRef] [PubMed]
- Hagen, S.; Sellers, C.; Elders, A.; et al. Urinary incontinence, faecal incontinence and pelvic organ prolapse symptoms 20–26 years after childbirth. BJOG An. Int. J. Obstet. Gynaecol. 2024. [Google Scholar] [CrossRef] [PubMed]
- Schulten, S. F. M.; et al. Pelvic organ prolapse and prolapse recurrence: an updated systematic review and meta-analysis; Expert Reviews, 2022. [Google Scholar] [PubMed]
- Fitz, F.F.; Bortolini, M.A.T.; et al. Lifestyle and comorbidities as risk factors for pelvic organ prolapse: A systematic review. Int. Urogynecol J. 2023. [Google Scholar] [CrossRef] [PubMed]
- Carnevali, S.; Nakamura, Y.; Mio, T.; Liu, X.; Takigawa, K.; Romberger, D. J.; Spurzem, J. R.; Rennard, S. I. Cigarette smoke extract inhibits fibroblast-mediated collagen gel contraction. Am. J. Physiol. 1998, 274(4), L591–L598. [Google Scholar] [CrossRef] [PubMed]
- Rodríguez-Mias, N.L.; et al. Do POP and SUI share the same risk factors? Eur. J. Obstet. Gynecol. Reprod. Biol. 2015. [Google Scholar] [PubMed]
- Bręborowicz, G.H. (Ed.) Położnictwo i ginekologia; PZWL Wydawnictwo Lekarskie: Warszawa, 2021; Vol. 2. [Google Scholar]
- Ansari, M.K.; Sharma, P.P.; Khan, S. Pelvic Organ Prolapse in Perimenopausal and Menopausal Women. J. Obstet. Gynaecol. India 2022, 72(3), 250–257. [Google Scholar] [CrossRef] [PubMed]
Figure 2.
(a) Effect of the Multivariable Model on Classification of Healthy Individuals and Patients. (b) Prognostic Value of the Number of Full-Term Pregnancies in Multivariable Analysis.
Figure 2.
(a) Effect of the Multivariable Model on Classification of Healthy Individuals and Patients. (b) Prognostic Value of the Number of Full-Term Pregnancies in Multivariable Analysis.
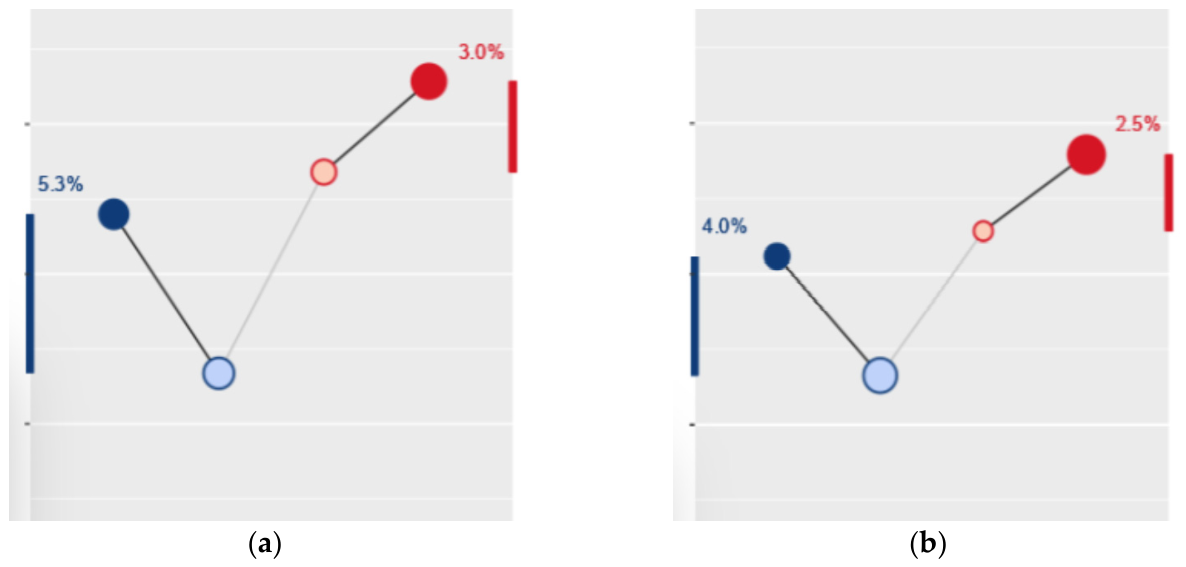
Figure 3.
Prognostic Value of the Number of Full-Term Pregnancies in Multivariable Analysis.
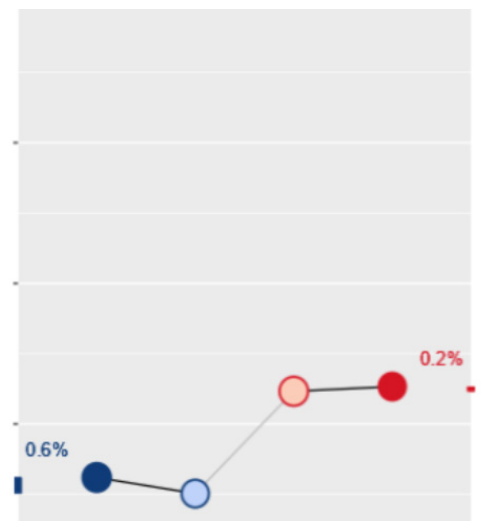

Table 1.
The detailed distribution of ICD-10 diagnoses in both groups.
| ICD-10 | Study Group | Control Group | Total |
|---|---|---|---|
| E28.1. Androgen excess |
0 | 1 | 1 |
| E28.2. Polycystic ovarian syndrome |
0 | 7 | 7 |
| E28.3. Primary ovarian failure |
0 | 14 | 14 |
| E28.8. Other ovarian dysfunction |
0 | 3 | 3 |
| E28.9. Ovarian dysfunction, unspecified |
0 | 1 | 1 |
| N39.3. Stress incontinence |
1328 | 0 | 1328 |
| N63. Unspecified lump in breast |
0 | 157 | 157 |
| N64.3. Galactorrhea not associated with childbirth |
0 | 3 | 3 |
| N64.4. Mastodynia |
0 | 5 | 5 |
| N64.5. Other signs and symptoms in breast |
0 | 10 | 10 |
| N64.8. Other specified disorders of breast |
0 | 9 | 9 |
| N64.9. Disorder of breast, unspecified |
0 | 14 | 14 |
| N76.0. Acute vaginitis |
0 | 85 | 85 |
| N76.1. Subacute and chronic vaginitis |
0 | 8 | 8 |
| N76.2. Acute vulvitis |
0 | 7 | 7 |
| N76.3. Subacute and chronic vulvitis |
0 | 3 | 3 |
| N76.4. Abscess of vulva |
0 | 7 | 7 |
| N76.5. Ulceration of vagina |
0 | 106 | 106 |
| N76.6. Ulceration of vulva |
0 | 14 | 14 |
| N76.8. Other specified inflammation of vagina and vulva |
0 | 33 | 33 |
| N8.1. Cystocele |
1121 | 0 | 1121 |
| N8.2. Incomplete uretrovaginal prolapse |
442 | 0 | 442 |
| N81.3. Complete uterovaginal prolapse |
359 | 0 | 359 |
| N81.4. Uterovaginal prolapse, unspecified |
176 | 0 | 176 |
| N81.5. Vaginal enterocele |
34 | 0 | 34 |
| N81.6. Rectocele |
435 | 0 | 435 |
| N81.8. Other female genital prolapse |
59 | 0 | 59 |
| N81.9. Female genital prolapse, unspecified |
379 | 0 | 379 |
| N90.0. Mild vulvar dysplasia |
0 | 12 | 12 |
| N90.1. Moderate vulvar dysplasia |
0 | 7 | 7 |
| N90.2. Severe vulvar dysplasia, not elsewhere classified |
0 | 27 | 27 |
| N90.3. Dysplasia of vulva, unspecified |
0 | 49 | 49 |
| N90.4. Leukoplakia of vulva |
0 | 150 | 150 |
| N90.5. Atrophy of vulva |
0 | 27 | 27 |
| N90.6. Hypertrophy of vulva |
0 | 9 | 9 |
| N90.7. Vulvar cyst |
0 | 3 | 3 |
| N90.8. Other specified noninflammatory disorders of vulva and perineum |
0 | 154 | 154 |
| N90.9. Noninflammatory disorder of vulva and perineum, unspecified |
0 | 219 | 219 |
| Total | 4333 | 1144 | 5477 |
Table 2.
The detailed BMI distribution of the study and control groups.
| BMI | Study Group | Control Group | Total |
|---|---|---|---|
| Underweight | 23 | 10 | 33 |
| Normal weight | 1448 | 411 | 1859 |
| Overweight | 1833 | 443 | 2276 |
| Obesity | 1029 | 280 | 1309 |
| Total | 4333 | 1144 | 5477 |
Table 3.
Number of full-term pregnancies in the study and control groups.
| Full-term pregnancies | Study Group | Control Group | Total |
|---|---|---|---|
| 0 | 140 | 149 | 289 |
| 1 | 648 | 233 | 881 |
| 2 | 2205 | 511 | 2716 |
| 3 | 936 | 194 | 1330 |
| 4 | 280 | 47 | 327 |
| 5 | 79 | 7 | 86 |
| 6 | 26 | 2 | 28 |
| 7 | 11 | 1 | 12 |
| 8 | 3 | 0 | 3 |
| 9 | 2 | 0 | 2 |
| 10 | 2 | 0 | 2 |
| 12 | 1 | 0 | 1 |
| Total | 4333 | 1144 | 5477 |
Table 4.
Number of preterm births in the study and control groups.
| Preterm births | Study Group | Control Group | Total |
|---|---|---|---|
| 0 | 4063 | 1061 | 5124 |
| 1 | 219 | 70 | 289 |
| 2 | 43 | 12 | 55 |
| 3 | 6 | 1 | 7 |
| 4 | 2 | 0 | 2 |
| Total | 4333 | 1144 | 5477 |
Table 5.
Number of miscarriages in the study and control groups.
| Miscarriages | Study Group | Control Group | Total |
|---|---|---|---|
| 0 | 3481 | 948 | 4429 |
| 1 | 630 | 154 | 784 |
| 2 | 160 | 29 | 189 |
| 3 | 48 | 11 | 59 |
| 4 | 10 | 0 | 10 |
| 5 | 4 | 2 | 6 |
| Total | 4333 | 1144 | 5477 |
Table 6.
Number of smokers in the study and control groups.
| Smoking | Study Group | Control Group | Total |
|---|---|---|---|
| No | 4043 | 1062 | 4429 |
| Yes | 290 | 82 | 784 |
| Total | 4333 | 1144 | 5477 |
Table 7.
Comparison of age between the study and control groups.
| Variable | Measures | Study group | Control group | p-value | test |
|---|---|---|---|---|---|
| Age | 0,001555579 | p (Mann-Whitney) |
|||
| Mean ± SD | 62.72±12.66 | 64.68±9.76 | |||
| Median [Q1; Q3] |
65 [53; 72] |
64 [56; 72] |
|||
| Median [Min; Max] |
65[26; 95] |
64[51; 93] |
Table 8.
Comparison of the number of full-term pregnancies between the study and control groups.
| Variable | Categories | Study group | Control group | p-value | test |
|---|---|---|---|---|---|
| Full-term pregnancies | <0.0001 | p (Mann-Whitney) |
|||
| 0 | 140(3.23%) | 149(13.02%) | |||
| 1 | 648(14.95%) | 233(20.37%) | |||
| 2 | 2205(50.89%) | 511(44.67%) | |||
| 3 | 936(21.6%) | 194(16.96%) | |||
| 4 | 280(6.46%) | 47(4.11%) | |||
| 5 | 79(1.82%) | 7(0.61%) | |||
| 6 | 26(0.6%) | 2(0.17%) | |||
| 7 | 11(0.25%) | 1(0.09%) | |||
| 8 | 3(0.07%) | 0 | |||
| 9 | 2(0.05%) | 0 | |||
| 10 | 2(0.05%) | 0 | |||
| 11 | 0 | 0 | |||
| 12 | 1(0.02%) | 0 |
Table 9.
Comparison of the number of miscarriages between the study and control groups.
| Variable | Categories | Study group | Control group | p-value | test |
|---|---|---|---|---|---|
| Miscarriages | 0.041201596 | p (Mann-Whitney) |
|||
| 0 | 3481(80.34%) | 948(82.87%) | |||
| 1 | 630(14.54%) | 154(13.46%) | |||
| 2 | 160(3.69%) | 29(2.53%) | |||
| 3 | 48(1.11%) | 11(0.96%) | |||
| 4 | 10(0.23%) | 0 | |||
| 5 | 4(0.09%) | 2(0.17%) |
Table 10.
Results of the multivariable logistic regression analysis.
| Category | OR [95%Cl] | Wald test p-value |
|---|---|---|
| Age |
1.02[1.01; 1.02] | <0.0001 |
| BMI category - underweight |
1.75[0.82; 3.78] | 0.1503 |
| BMI category - normal |
reference | reference |
| BMI category - overweight |
0.85[0.73; 1] | 0.0444 |
| BMI category - obesity |
1.03[0.87; 1.23] | 0.7104 |
| Full-term pregnancies |
0.65[0.6; 0.69] | <0.0001 |
| Preterm births |
0.84[0.68; 1.03] | 0.0929 |
| Miscarriages |
0.91[0.81; 1.03] | 0.1252 |
| Smoking | 1.13[0.87; 1.46] | 0.3595 |
Disclaimer/Publisher’s Note: The statements, opinions and data contained in all publications are solely those of the individual author(s) and contributor(s) and not of MDPI and/or the editor(s). MDPI and/or the editor(s) disclaim responsibility for any injury to people or property resulting from any ideas, methods, instructions or products referred to in the content. |
© 2026 by the authors. Licensee MDPI, Basel, Switzerland. This article is an open access article distributed under the terms and conditions of the Creative Commons Attribution (CC BY) license (http://creativecommons.org/licenses/by/4.0/).
Copyright: This open access article is published under a Creative Commons CC BY 4.0 license, which permit the free download, distribution, and reuse, provided that the author and preprint are cited in any reuse.


