
Submitted:
27 July 2026
Posted:
29 July 2026
You are already at the latest version
Abstract
Background: The Middle Corridor has become a strategically important Eurasian transport route, yet limited research has examined the configuration of intermodal networks for hazardous materials transportation under its unique operational and regulatory conditions. This study develops a decision-support framework for optimizing hazardous materials transport along this corridor.
Methods: A multi-objective mixed-integer linear programming (MOMILP) model was formulated to optimize transportation cost, risk, and transit time simultaneously. The model incorporates modal selection, intermodal terminal transfers, infrastructure capacity constraints, border delays, and regulatory compatibility under ADR, RID, and IMDG requirements. A simplified Middle Corridor case study was used to evaluate Pareto-optimal network configurations and sensitivity to safety preferences and infrastructure capacity.
Results: The numerical analysis shows that rail-dominant intermodal configurations consistently achieve the lowest transportation risk while requiring only modest increases in transit time. Sensitivity analysis indicates that assigning moderate weight to safety leads to stable rail-oriented solutions, whereas railway capacity limitations force shifts toward higher-risk road transport under increasing demand.
Conclusions: The proposed framework provides a transparent and mathematically rigorous approach for balancing safety, efficiency, and cost in hazardous materials transportation. It offers practical decision support for infrastructure planning, intermodal terminal development, and policy evaluation along the Middle Corridor.
Keywords:
Middle Corridor
; hazardous materials transportation
; rail–truck intermodal transport
; multi-objective optimization
; transportation risk
; mixed-integer linear programming
; Pareto optimization
; logistics network design
1. Introduction
The transportation of dangerous goods (DG) constitutes one of the most safety-critical components of global logistics networks, given that an accident can lead to catastrophic consequences. Over the past two decades, this concern has generated a substantial body of research addressing risk assessment, regulatory harmonization, and route optimization for hazardous materials transported by road, rail, air, and sea [1,2]. The growth of chemical, petrochemical, and industrial production worldwide has been paralleled by an expansion of dangerous goods flows across borders, intensifying the need for coordinated planning between land-use regulation and transport corridors serving process industries [3].
International regulatory frameworks — most notably the Agreement Concerning the International Carriage of Dangerous Goods by Road (ADR) [4], the Regulations concerning the International Carriage of Dangerous Goods by Rail (RID) under the COTIF Convention [5], and the International Maritime Dangerous Goods (IMDG) Code [6] — provide the legal and technical foundation for classifying, packaging, and transporting hazardous substances across different transport modes. However, these instruments were developed largely independently for each mode, and stakeholder analyses show that the actors involved in the land transport of dangerous goods often operate under fragmented institutional and commercial arrangements, which complicates multimodal coordination [7].
A considerable share of the literature has focused on road transport risk, reflecting its dominance in DG movement and its comparatively higher accident probability. Empirical accident analyses from China, Poland, and other regions consistently identify human factors, infrastructure deficiencies, and inadequate route selection as the leading causes of hazardous material incidents [8,9,10,11,12]. To mitigate these risks, researchers have proposed a range of decision-support and optimization tools, including GIS-based risk mapping [13], fuzzy and Pythagorean fuzzy AHP risk assessment models [14,15], agent-based simulation [16], machine learning–based early warning systems [17], and the classical risk/cost routing frameworks of Abkowitz and Cheng [18]. Tunnel-specific restrictions have received particular attention, given the confined-space hazards that arise when DG is transported through such infrastructure [19,20].
Rail transport, by contrast, is generally associated with lower accident frequency, but incidents that do occur can potentially lead to larger-scale consequences, particularly in terms of population exposure to airborne toxins [21] and safety at highway–rail crossings [22]. This risk profile has driven growing interest in rail–truck intermodal solutions, which combine the safety and capacity advantages of rail for long-haul segments with the flexibility of road transport. Recent studies have examined intermodal capacity selection and congestion management [23], multimodal location-routing models [24], and dedicated rail–truck intermodal network configurations for dangerous goods [25], reflecting the widely held view that intermodal transport can reduce both the probability and the severity of DG-related accidents compared with single-mode alternatives [2].
One of the distinctive features of the Middle Corridor is the presence of a maritime segment — particularly the Baku–Aktau and Baku–Turkmenbashi Caspian Sea ferry lines — which requires successive transshipments of dangerous goods between rail, road, and maritime transport. The classification, packaging, and loading of dangerous goods in maritime transport are regulated by the International Maritime Dangerous Goods (IMDG) Code [6]; however, this regulatory framework was developed primarily in the context of ocean shipping and does not adequately cover the specific risks of short-distance ferry-based DG transport in enclosed water bodies such as the Caspian Sea — for example, the hazards arising during transshipment at port terminals and the coordination difficulties at multimodal transfer points. Overall, the existing literature on dangerous materials transport risk [1] has focused predominantly on road and rail modes; systematic risk assessment studies devoted to the maritime segment, particularly ferry operations in inland/enclosed seas, remain notably scarce.
Despite this expanding body of research, empirical and modeling studies specifically addressing the transportation of dangerous materials along the Middle Corridor — the Trans-Caspian International Transport Route connecting China, Central Asia, the South Caucasus, and Europe — remain scarce. Existing risk assessment and network configuration studies have concentrated predominantly on well-established corridors in China, Europe, and North America [26,27,28], leaving a gap in understanding how rail–truck–maritime intermodal configurations should be designed to manage DG risk under the specific geographic, infrastructural, and multi-jurisdictional conditions of the Middle Corridor, where transit procedures such as TIR, land border crossings, and the Caspian Sea ferry segment intersect with the varying national implementations of ADR and RID.
This study addresses that gap by proposing a configuration framework for rail-truck intermodal networks dedicated to the transportation of dangerous materials along the Middle Corridor. Building on established risk evaluation principles [29] and stakeholder-oriented network analysis [7], the paper aims to identify optimal rail–truck intermodal configurations and strategic transshipment terminals that minimize transportation cost, risk exposure, and transit time while ensuring regulatory compliance for hazardous materials transportation along the Middle Corridor, thereby contributing both to the academic literature on multimodal DG logistics and to practical corridor-level policy planning.
2. Literature review
2.1. Risk Assessment Frameworks for Hazardous Materials Transportation
Research on hazardous materials (HazMat) transportation risk has developed along several parallel tracks since the seminal risk/cost routing framework proposed for truck movements of dangerous goods [18]. This early work established the foundational trade-off between transport cost and population/environmental exposure that continues to underpin routing optimization studies. Building on this, Vrijling, Van Hengel and Houben [29] proposed a broader risk evaluation framework distinguishing individual and societal risk, a distinction still widely used in HazMat risk quantification today.
More recent contributions have applied multi-criteria and fuzzy-logic techniques to route selection. AlRukaibi et al. [30] developed an optimal route risk-based algorithm applied to the Kuwaiti road network, while Ayyildiz and Taskin Gumus [14] used a Pythagorean fuzzy AHP methodology to assess HazMat transport risk in Istanbul, reflecting a broader trend toward incorporating uncertainty and expert judgment into risk scoring. Similarly, Izdebski, Jacyna-Gołda and Gołda [31] focused on minimizing the probability of serious road accidents involving dangerous goods, and Kanj et al. [16] proposed an agent-based simulation model for road transport risk analysis, indicating a shift toward computationally intensive, simulation-driven risk assessment.
Road Transport: Accident Analysis and Regional Studies
A substantial body of literature documents accident patterns and causation in road-based HazMat transport. Studies from China are particularly prominent: Yang et al. [8] surveyed HazMat road accidents from 2000–2008, Ma, Zhou and Yang [11] applied an ordered logit regression model to accident causation, Zhao et al. [9] analyzed hazardous chemical accidents between 2006–2017, and Zhang, Cheng and Gai [10] reviewed both accidents and associated evacuation events from 2012–2020. Complementing this regional focus, Niu and Ukkusuri [27] used geo-location data to assess driver-level risk in China, while Hobeika, Kim and Sethuraman [32] provided an earlier characterization of HazMat accidents in Pennsylvania. European contributions include Poland-focused analyses of road dangerous goods transport [12] and Class 1 (explosives) risk assessment [33]. Machine learning approaches have recently entered this space as well, with Chai et al. [17] applying predictive analytics to accident risk and early warning.
Rail and Air Transport of Dangerous Goods
Compared to road transport, rail-specific HazMat literature is comparatively narrower but growing. Verma and Verter [21] modeled population exposure to airborne toxins from railroad dangerous goods transport, and Lu and Tolliver [22] developed accident prediction models for highway–rail grade crossings, an important consideration for corridor-level rail HazMat safety. Regulatory frameworks for rail transport are codified internationally through the RID appendix to the COTIF convention [5]. Air freight has also received targeted attention, notably through fuzzy AHP-based risk matrices for dangerous goods handling [15] and safety assessment modeling for air carriers [34].
Intermodal and Rail–Truck Transportation
The intermodal dimension most directly relevant to rail-truck configuration problems has been explored by several authors. Jiang et al. [24] proposed a multimodal location-routing model based on multi-commodity flow formulations, while Assadipour, Ke and Verma [23] examined intermodal HazMat transportation incorporating capacity selection and congestion effects—both foundational for network configuration problems combining rail and road legs. More recently, Bhavsar, Hassini and Verma [25] addressed rail–truck intermodal transportation of dangerous goods directly, representing one of the closest antecedents to corridor-level rail-truck configuration research. Wang, Zhu and Li [35] further extended the intermodal supply chain perspective through a blockchain-based platform proposal for collaborative supervision of dangerous goods movement, highlighting emerging interest in digital coordination across modal handoffs.
GIS, Routing, and Infrastructure-Specific Risk
Spatial and infrastructure-based risk analysis constitutes another major strand. Bubbico, Di Cave and Mazzarotta [13] introduced a GIS-based approach to road and rail HazMat risk analysis, later extended to tunnel-specific risk in Bubbico et al. [19]. Tunnel regulation has received further attention from Lundin and Antonsson [20], who examined ADR-based categorization methods for road tunnels. Urban-context routing has been addressed by Conca, Ridella and Sapori [36] and, more recently, Russo and Rindone [37], who examined dangerous goods transport planning specifically within urban areas—a theme with clear relevance to corridor segments passing through populated nodes.
Stakeholders, Regulation, and Security
Beyond technical risk modeling, several studies address the institutional and behavioral dimensions of HazMat transport governance. Flodén and Woxenius [7] conducted a stakeholder analysis of actors and networks involved in land transport of dangerous goods, while Ingvarson [3] examined standardization effects in land-use planning regulations connected to process industries and transport. Security-oriented research is represented by Li et al. [38], who proposed a game-theoretic approach to protecting HazMat transport against terrorism threats. International regulatory frameworks are further anchored by the IMDG Code for maritime transport [6], rounding out the multimodal regulatory landscape relevant to corridor-based movements. Underlying behavioral models of risk perception, such as protection motivation theory [39], also inform how safety interventions and compliance behavior are conceptualized in this literature, though largely outside the transportation-specific corpus.
Reviews and Decision Support Systems
Several review-type contributions synthesize the field. Holeczek [2] offered a classification and state-of-the-art review of HazMat truck transportation problems, while Torretta et al. [1] reviewed decision support systems for HazMat transport risk assessment, and Oggero et al. [26] surveyed historical accidents across both road and rail modes. Van Raemdonck, Macharis and Mairesse [40] proposed an integrated risk analysis system spanning multiple risk dimensions, and Guo, Ma and Ren [41] most recently applied fitness landscape theory and association rule mining to uncover topological risk patterns in HazMat transportation systems—signaling growing methodological sophistication in the field. Goldberg and Hong [28] similarly focused on minimizing highway transport risk from a sustainability-oriented lens. Arifin et al. [42], though focused on confined-space construction hazards, illustrates the broader methodological trend toward systematic literature review as a tool for hazard characterization across safety-critical domains. Pekarčíková et al. [43], addressing RTLS-based simulation optimization in automotive supply, further reflects the diffusion of real-time location and simulation techniques into logistics safety and coordination research more broadly.[23–25
Research Gap
Taken together, this body of literature demonstrates mature, independent streams addressing road-based HazMat risk (predominantly China- and Europe-focused), rail-specific accident and exposure modeling, and a smaller but growing set of studies on rail–truck intermodal configuration [23,24,25]. However, none of the reviewed studies examine intermodal rail–truck network configuration for hazardous materials specifically within the context of the Middle Corridor (Trans-Caspian International Transport Route)—a corridor characterized by distinctive geopolitical, infrastructural, and multimodal transshipment conditions (including Caspian Sea crossings) not present in the Chinese, European, or North American contexts that dominate the existing literature. This gap motivates the present study’s focus on configuring rail-truck intermodal networks for HazMat transport along this specific corridor.
3. Methodology
3.1. Research Framework
This study develops a multi-objective optimization framework for configuring rail–truck intermodal networks for hazardous materials (HazMat) transportation along the Middle Corridor. The proposed methodology formalizes transportation cost, transportation risk, and transit time as a Multi-Objective Mixed Integer Linear Programming (MOMILP) model, enabling a rigorous, reproducible, and quantitatively verifiable decision-support framework rather than a purely descriptive one. The research process consists of five main stages: (i) network representation, (ii) commodity-flow formalization, (iii) parameter estimation for cost, risk, and time, (iv) mathematical model formulation and solution, and (v) sensitivity and scenario analysis.
The methodological framework enables decision-makers to evaluate different transportation alternatives while balancing economic efficiency and safety considerations through explicit, mathematically defined trade-offs rather than qualitative comparison alone.
3.2. Network Representation
The Middle Corridor is represented as a directed multimodal transportation network consisting of nodes and links. Nodes represent logistics facilities, including railway terminals, road terminals, seaports, border crossing points, and intermodal transfer terminals. Links represent railway and highway connections between these facilities.
The transportation network is formally defined as a directed graph
G = (N, A)
Where: N denotes the finite set of transportation nodes and A ⊆ N × N denotes the finite set of directed transportation links (arcs). Each arc (i, j) ∈ A is further indexed by transport mode m ∈ M = {rail, road}, so that a physical corridor served by both modes is represented by two parallel arcs with distinct cost, time, and risk attributes. This dual representation allows the model to select between, or combine, rail and road segments on the same geographical link.
The network spans the principal transportation route extending from China through Kazakhstan, across the Caspian Sea to Azerbaijan, continuing through Georgia and Türkiye before reaching European destinations. Each arc is characterized by a cost coefficient, a travel-time coefficient, an accident probability, an infrastructure capacity, and a set of regulatory compatibility indicators applicable to hazardous materials, all of which are formalized as model parameters in Section 3.4.
3.3. Hazardous Materials Flow Modeling
Hazardous materials shipments are modeled as discrete commodity flows moving through the multimodal network. Each shipment k belongs to a finite set of commodities K, has a known origin node, destination node, quantity, and UN hazard class, and may be routed via railway transport, road transport, or a sequence of both, subject to infrastructure availability and regulatory admissibility.
Route selection is formalized through binary arc-selection variables (Section 3.4.2), and flow-conservation constraints (Section 3.4.4) guarantee that each commodity follows a single continuous path from origin to destination. Modal transfer operations at intermodal terminals — where hazardous materials are moved between railway wagons and road vehicles — are represented by auxiliary binary transfer variables that trigger additional handling cost, transfer time, and transfer risk whenever a mode change occurs at a node.
3.4. Mathematical Model Formulation
To move from a descriptive framework to a verifiable optimization model, the routing problem is formalized below as a MOMILP: sets and indices are defined first, followed by parameters, decision variables, the three objective functions, and the constraint set.
3.4.1. Sets and Indices
N — set of network nodes, indexed by i, j
A ⊆ N × N — set of directed arcs (transportation links), indexed by (i, j)
M = {rail, road} — set of transport modes, indexed by m
K — set of hazardous-material shipments (commodities), indexed by k
B ⊆ N — subset of nodes corresponding to border-crossing points
T ⊆ N — subset of nodes corresponding to intermodal transfer terminals
ok, dk — origin node and destination node of commodity k
3.4.2. Parameters
cijm — unit transportation cost on arc (i, j) using mode m (currency per unit quantity)
tijm — travel time on arc (i, j) using mode m
pijm — accident probability on arc (i, j) using mode m
sij — consequence-severity coefficient of arc (i, j), reflecting population exposure and environmental sensitivity
capijm — capacity of arc (i, j) under mode m
qk — shipment quantity of commodity k
cci, cti, cri — unit transfer cost, transfer time, and transfer risk coefficient at terminal i ∈ T
τi — expected border-waiting time at node i ∈ B
δijmk — regulatory/vehicle-compatibility indicator (1 if commodity k’s hazard class is admissible on arc (i, j) with mode m under ADR / RID / IMDG rules; 0 otherwise)
3.4.3. Decision Variables
xijmk ∈ {0,1} — 1 if commodity k is routed on arc (i, j) using mode m; 0 otherwise
yik ∈ {0,1} — 1 if commodity k undergoes a modal transfer at terminal i ∈ T; 0 otherwise
3.4.4. Objective Functions
The model simultaneously optimizes three conflicting objectives, each expressed as an explicit linear function of the decision variables.
(a) Total logistics cost. The first objective minimizes railway transportation cost, road transportation cost, intermodal transfer cost, and border/port handling charges:
Min Z1 = Σk∈K Σ(i,j)∈A Σm∈M cijm qk xijmk + Σk∈K Σi∈T cci qk yik
(b) Transportation risk. Risk on arc (i, j) with mode m is defined as the product of accident probability and consequence severity, Rijm = pijm · sij (formalized further in Section 3.5). The second objective minimizes the total expected risk exposure of the selected route, including transfer-related risk at intermodal terminals:
Min Z2 = Σk∈K Σ(i,j)∈A Σm∈M Rijm qk xijmk + Σk∈K Σi∈T cri qk yik
(c) Total transportation time. The third objective minimizes travel time, terminal processing/transfer time, and border-waiting time
Min Z3 = Σk∈K Σ(i,j)∈A Σm∈M tijm xijmk + Σk∈K Σi∈T cti yik + Σk∈K Σi∈B τi xijmk
Because Z1, Z2, and Z3 are generally conflicting — the least-risk route is rarely the cheapest or fastest — the model is solved as a genuine multi-objective program (Section 3.6) rather than reduced to a single scalar criterion a priori.
3.4.5. Constraints
Flow conservation. Each commodity must follow a single continuous path from its origin to its destination:
valid for all k ∈ K, i ∈ N.
Σm∈M Σj:(i,j)∈A xijmk − Σm∈M Σj:(j,i)∈A xjimk = { 1, i = ok; −1, i = dk; 0, otherwise }
Infrastructure capacity. The aggregate flow assigned to an arc cannot exceed its operational capacity:
Σk∈K qk xijmk ≤ capijm ∀ (i, j) ∈ A, m ∈ M
Vehicle / regulatory compatibility. A commodity can only be assigned to an arc–mode combination authorized for its hazard class under ADR, RID, or the IMDG Code:
xijmk ≤ δijmk ∀ k ∈ K, (i, j) ∈ A, m ∈ M
Intermodal transfer linking. A transfer variable is activated whenever a commodity’s incoming and outgoing arcs at a terminal use different modes:
yik ≥ xjimk + xilm′k − 1 ∀ k ∈ K, i ∈ T, m ≠ m′
Non-negativity and integrality.
xijmk, yik ∈ {0,1} ∀ i, j, m, k
Together, equations (5)–(9) ensure that every solution represents a physically realizable, regulation-compliant, capacity-feasible route for each shipment, while equations (2)–(4) score that route on cost, risk, and time.
3.5. Risk Quantification Model
Transportation risk is evaluated through a quantitative risk-assessment function rather than a qualitative rating. For each arc, risk is expressed as the product of accident probability and expected consequence severity:
Rijm = pijm · sij
The consequence-severity coefficient sij aggregates population exposure and environmental sensitivity along the arc through a weighted linear combination:
sij = α · Pij + β · Eij + γ · Iij
Where: Pij is the population-exposure index, Eij is the environmental-sensitivity index (proximity to protected areas, water bodies), Iij is a critical-infrastructure exposure index (tunnels, bridges, urban crossings), and α, β, γ ≥ 0 with α + β + γ = 1 are normalized weighting coefficients calibrated from historical accident data or expert elicitation.
The accident probability pijm is estimated from historical accident frequency, traffic density, and arc-specific hazard factors (tunnel crossings, border operations, adverse-weather exposure), consistent with standard HazMat quantitative risk assessment (QRA) practice. The total route risk used in objective (3) is the summation of Rijm over all selected arcs plus terminal transfer risk, allowing the optimization model to favor lower-risk corridors even at moderately higher cost or time.
3.6. Solution Method
The complete model — objectives (2)–(4) subject to constraints (5)–(9) — constitutes a Multi-Objective Mixed Integer Linear Programming (MOMILP) problem, appropriate because route selection, modal choice, and intermodal transfer decisions are inherently discrete while cost, risk, and time accumulate linearly along the path.
Two complementary solution strategies are applied:
(i) Weighted-sum scalarization. Normalized objectives are combined into a single weighted criterion
where Ẑ1, Ẑ2, Ẑ3 are min–max normalized objective values and w1, w2, w3 are decision-maker preference weights, varied systematically to trace the Pareto frontier.
Min Z = w1 Ẑ1 + w2 Ẑ2 + w3 Ẑ3, w1 + w2 + w3 = 1
(ii) ε-constraint method. As a cross-check, cost is minimized while risk and time are bounded as constraints:
with ε2, ε3 parametrically relaxed to generate the efficient (Pareto-optimal) set. The two methods are cross-validated against each other to confirm the non-dominance of the resulting solutions.
Min Z1 s.t. Z2 ≤ ε2, Z3 ≤ ε3
The resulting mixed-integer program is solved with commercial solvers such as IBM ILOG CPLEX or Gurobi Optimizer, which return provably optimal or bounded near-optimal solutions with reported optimality gaps. Sensitivity analysis is then performed by perturbing demand qk, capacity capijm, accident probability pijm, and cost coefficients cijm, and re-solving the model to evaluate the robustness of the resulting network configuration and the stability of the Pareto frontier.
Definition (Pareto optimality). A feasible solution x* is Pareto-optimal if there exists no other feasible solution x such that Z₁(x) ≤ Z₁(x*), Z₂(x) ≤ Z₂(x*), and Z₃(x) ≤ Z₃(x*), with at least one inequality strict. The set of all such solutions constitutes the Pareto frontier referenced throughout Section 3.6 and Section 4; both the weighted-sum and ε-constraint methods generate points on this frontier under the standard convexity conditions that hold for the linear objectives (2)–(4) considered here.
Computational complexity. Because the underlying single-objective routing problem embeds a capacitated, mode-constrained shortest-path selection with binary transfer variables, the MOMILP defined by (2)–(9) is NP-hard in the general case. For network instances of the size typically encountered in corridor-level planning (tens of nodes, a handful of modes), exact enumeration or branch-and-bound solvers such as CPLEX or Gurobi return provably optimal Pareto points within practical run times, as in the case study of Section 4. For substantially larger networks — e.g., a full multi-corridor representation with hundreds of nodes and thousands of commodities — exact enumeration of the efficient set becomes computationally prohibitive, and the framework can instead be coupled with metaheuristic multi-objective solvers (e.g., NSGA-II or MOEA/D) to approximate the Pareto frontier at reduced computational cost, at the expense of the optimality guarantee.
3.7. Case Study
The proposed model is applied to the Middle Corridor connecting China and Europe. The case study network N includes major logistics hubs such as the Kazakhstan railway network, Aktau Port, the Port of Baku, the Azerbaijan railway system, Georgian logistics terminals, the Kars railway junction in Türkiye, and European railway connections, with arc parameters (cijm, tijm, pijm, sij, capijm) populated from operational and historical data for each corridor segment.
Several transportation scenarios are evaluated by re-solving the MOMILP model under varying demand levels qk and operational conditions. Each scenario is scored on Z1 (total transportation cost), Z2 (transportation risk), Z3 (transit time), and infrastructure-utilization indicators derived from the capacity constraints (6).
The resulting Pareto-optimal solutions demonstrate the applicability of the proposed mathematical framework in supporting strategic, quantitatively defensible planning for hazardous materials transportation along the Middle Corridor, making explicit the trade-offs between safety, efficiency, and cost that were previously assessed only qualitatively.
3.8. Model Validation, Assumptions, and Limitations
The methodology formalized in Section 3.1, Section 3.2, Section 3.3, Section 3.4, Section 3.5, Section 3.6 and Section 3.7 rests on a set of simplifying assumptions that should be made explicit before the framework is applied operationally.
- -
- Parameter stationarity. Cost coefficients cᵢⱼₘ, travel times tᵢⱼₘ, and accident probabilities pᵢⱼₘ are treated as fixed, deterministic values for a given planning horizon. In practice these parameters fluctuate with fuel prices, seasonal congestion, and weather, so the model is best interpreted as a snapshot decision-support tool rather than a real-time routing engine; periodic re-estimation and re-solution are recommended.
- -
- Static risk severity. The consequence-severity coefficient sᵢⱼ in Eq. (11) is computed from population, environmental, and infrastructure exposure indices that are assumed time-invariant. Extending the model to time-dependent severity (e.g., rush-hour population exposure) is a natural direction for future refinement but would require the arc set to be time-expanded.
- -
- Deterministic demand. Shipment quantities qₖ are treated as known inputs rather than stochastic demand. A robust or stochastic-programming extension — for example, replacing constraint (6) with a chance constraint on capacity — would allow the framework to account for demand uncertainty explicitly.
- -
- Independence of shipments. Commodities in K are routed independently once regulatory and capacity constraints are enforced; the model does not capture consolidation economies (e.g., shared wagon loads) that could lower cost per unit for correlated shipments.
- -
- Data provenance. As noted in Section 4, the illustrative cost, time, and risk parameters used in the numerical example are calibrated to plausible orders of magnitude rather than audited operator tariffs or accident statistics; before the model is used for investment or policy decisions, arc-level parameters should be replaced with verified data from railway and customs authorities, insurers, and accident registries.
These assumptions bound the scope of the current formulation without undermining its core contribution: a reproducible, mathematically explicit trade-off between cost, risk, and time that replaces qualitative corridor assessment. Section 3.6 and Section 4.3 and Section 4.4 already provide a first layer of robustness checking through sensitivity analysis on the risk weight and on capacity; Table 4 below summarizes the assumptions above alongside the corresponding extension that would relax each one.

Table 1.
Summary of key model assumptions, their limitations, and possible extensions.
| Assumption | Limitation | Possible extension |
| Parameter stationarity | Ignores real-time price/congestion fluctuation | Periodic re-solution; rolling-horizon updating |
| Static risk severity | Does not capture time-of-day exposure variation | Time-expanded network with dynamic severity indices |
| Deterministic demand | No allowance for demand uncertainty | Stochastic or robust MOMILP formulation (chance-constrained capacity) |
| Independent shipments | Misses consolidation economies | Joint routing / load-consolidation extension |
| Illustrative parameters | Not yet validated against audited data | Replace with verified tariff and accident-statistics data |
4. Numerical Results and Case Study Application
The following numerical example applies the model of Section 3 to a simplified representation of the Middle Corridor. Parameter values (distance, cost, time, accident probability, capacity) are illustrative and calibrated to plausible orders of magnitude reported in Middle Corridor logistics studies; they are used to demonstrate the behaviour of the optimization model and should be replaced with verified operator/tariff and accident-statistics data before the results are used for operational decision-making.
4.1. Case-Study Network and Illustrative Parameters
The corridor is represented as a sequential six-link route: Khorgos (CN–KZ border)—Aktau (KZ)—Baku (AZ)—Tbilisi (GE)—Kars (TR)—Istanbul (TR)—Vienna (EU destination). The Aktau–Baku segment is a fixed Caspian Sea crossing; the remaining five segments offer a rail/road mode choice, yielding 2⁵ = 32 feasible mode combinations for a single representative HazMat shipment (UN Class 3, flammable liquids).
Table 2.
Illustrative arc-level parameters used in the numerical example (transfer at each modal interchange: 80 USD/TEU, 6 h, risk +0.00002).
Table 2.
Illustrative arc-level parameters used in the numerical example (transfer at each modal interchange: 80 USD/TEU, 6 h, risk +0.00002).
| Segment | Mode | Dist. (km) | Cost ($/TEU) | Time (h) | p (accident prob.) | s (severity) | Cap. (TEU/wk) |
| Khorgos—Aktau | rail | 3300 | 900 | 96 | 0.00008 | 0.35 | 500 |
| Khorgos—Aktau | road | 3190 | 1400 | 130 | 0.00025 | 0.65 | 150 |
| Aktau—Baku (Caspian Sea) | sea | 450 | 600 | 40 | 0.00015 | 0.30 | 300 |
| Baku—Tbilisi | rail | 580 | 250 | 18 | 0.00003 | 0.35 | 400 |
| Baku—Tbilisi | road | 572 | 320 | 12 | 0.00012 | 0.65 | 200 |
| Tbilisi—Kars (BTK line) | rail | 313 | 200 | 14 | 0.00004 | 0.35 | 250 |
| Tbilisi—Kars (BTK line) | road | 380 | 260 | 9 | 0.00018 | 0.65 | 180 |
| Kars—Istanbul | rail | 1164 | 480 | 30 | 0.00006 | 0.35 | 300 |
| Kars—Istanbul | road | 1429 | 700 | 22 | 0.00022 | 0.65 | 200 |
| Istanbul—Vienna | rail | 1277 | 620 | 40 | 0.00005 | 0.35 | 350 |
| Istanbul—Vienna | road | 1560 | 900 | 28 | 0.00020 | 0.65 | 220 |
4.2. Pareto-Optimal Route Alternatives
Objectives (2)–(4) were evaluated for all 32 mode combinations for a base shipment of q = 50 TEU. Applying the non-dominance test underlying the ε-constraint method (Eq. 13) identifies the following Pareto-optimal (non-dominated) routes:
Table 3.
Pareto-optimal mode-sequence alternatives out of 32 enumerated combinations.
| № | Mode sequence | Transfers | Cost Z₁ ($/TEU) | Time Z₃ (h) | Risk Z₂ |
| 1 | rail → sea → rail → rail → rail → rail | 2 | 3210 | 250 | 0.000176 |
| 2 | rail → sea → road → road → rail → rail | 3 | 3420 | 245 | 0.000367 |
| 3 | rail → sea → rail → rail → rail → road | 3 | 3570 | 244 | 0.000309 |
| 4 | rail → sea → road → road → road → rail | 3 | 3640 | 237 | 0.000489 |
| 5 | rail → sea → rail → rail → road → road | 3 | 3790 | 236 | 0.000431 |
| 6 | rail → sea → road → road → road → road | 2 | 3840 | 219 | 0.000581 |
| 7 | rail → sea → rail → road → road → road | 3 | 3850 | 231 | 0.000534 |
Figure 1.
Cost–risk Pareto front; bubble size denotes transit time. Grey points are dominated routes; red points/line form the non-dominated frontier.
Figure 1.
Cost–risk Pareto front; bubble size denotes transit time. Grey points are dominated routes; red points/line form the non-dominated frontier.
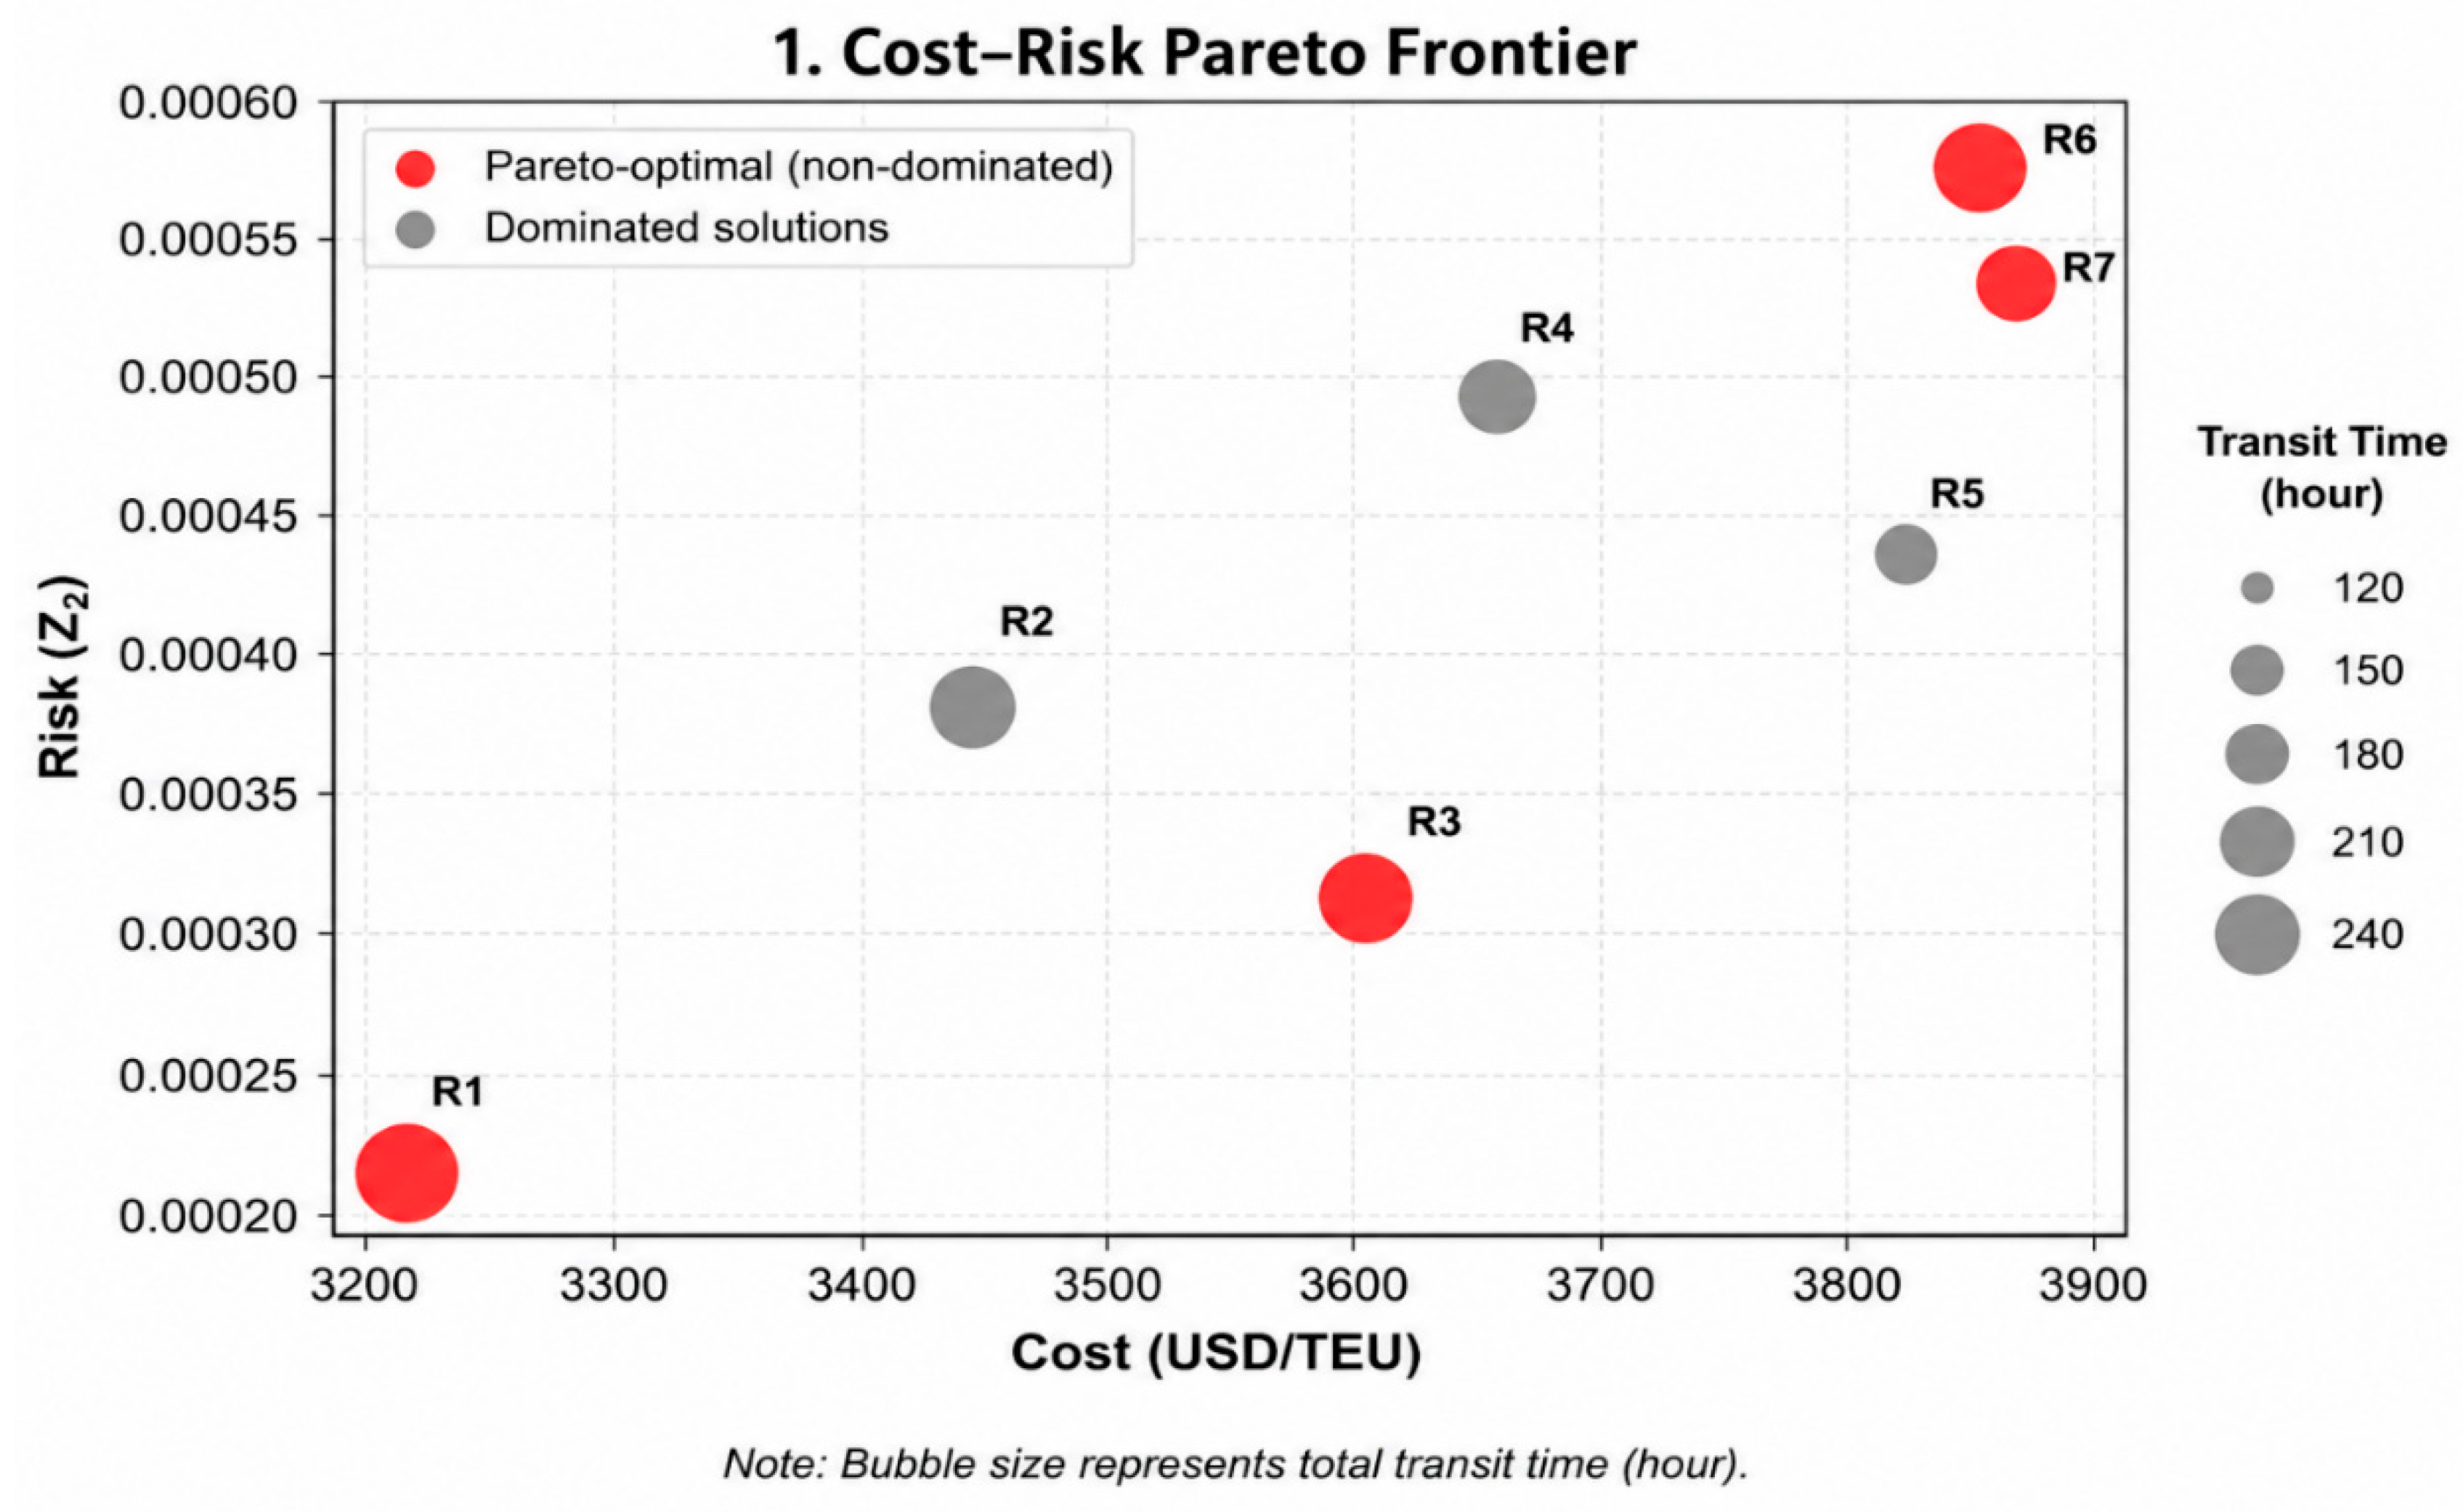
As expected, the all-rail route (Route 1) minimizes both cost and risk simultaneously but is not the fastest; progressively substituting road segments (Routes 2–7) reduces transit time at increasing cost and risk, illustrating the fundamental trade-off formalized in objectives Z₁–Z₃.
4.3. Sensitivity to the Risk-Weight Parameter
Using the weighted-sum scalarization of Eq. (12) with w₁ = w₃ = (1 − w₂)/2, the risk weight w₂ was varied from 0 to 1 in steps of 0.05 and the best-scoring route re-identified at each step.
Figure 2.
Cost (Z₁, left axis) and risk (Z₂, right axis) of the selected route as the risk-weight w₂ increases.
Figure 2.
Cost (Z₁, left axis) and risk (Z₂, right axis) of the selected route as the risk-weight w₂ increases.
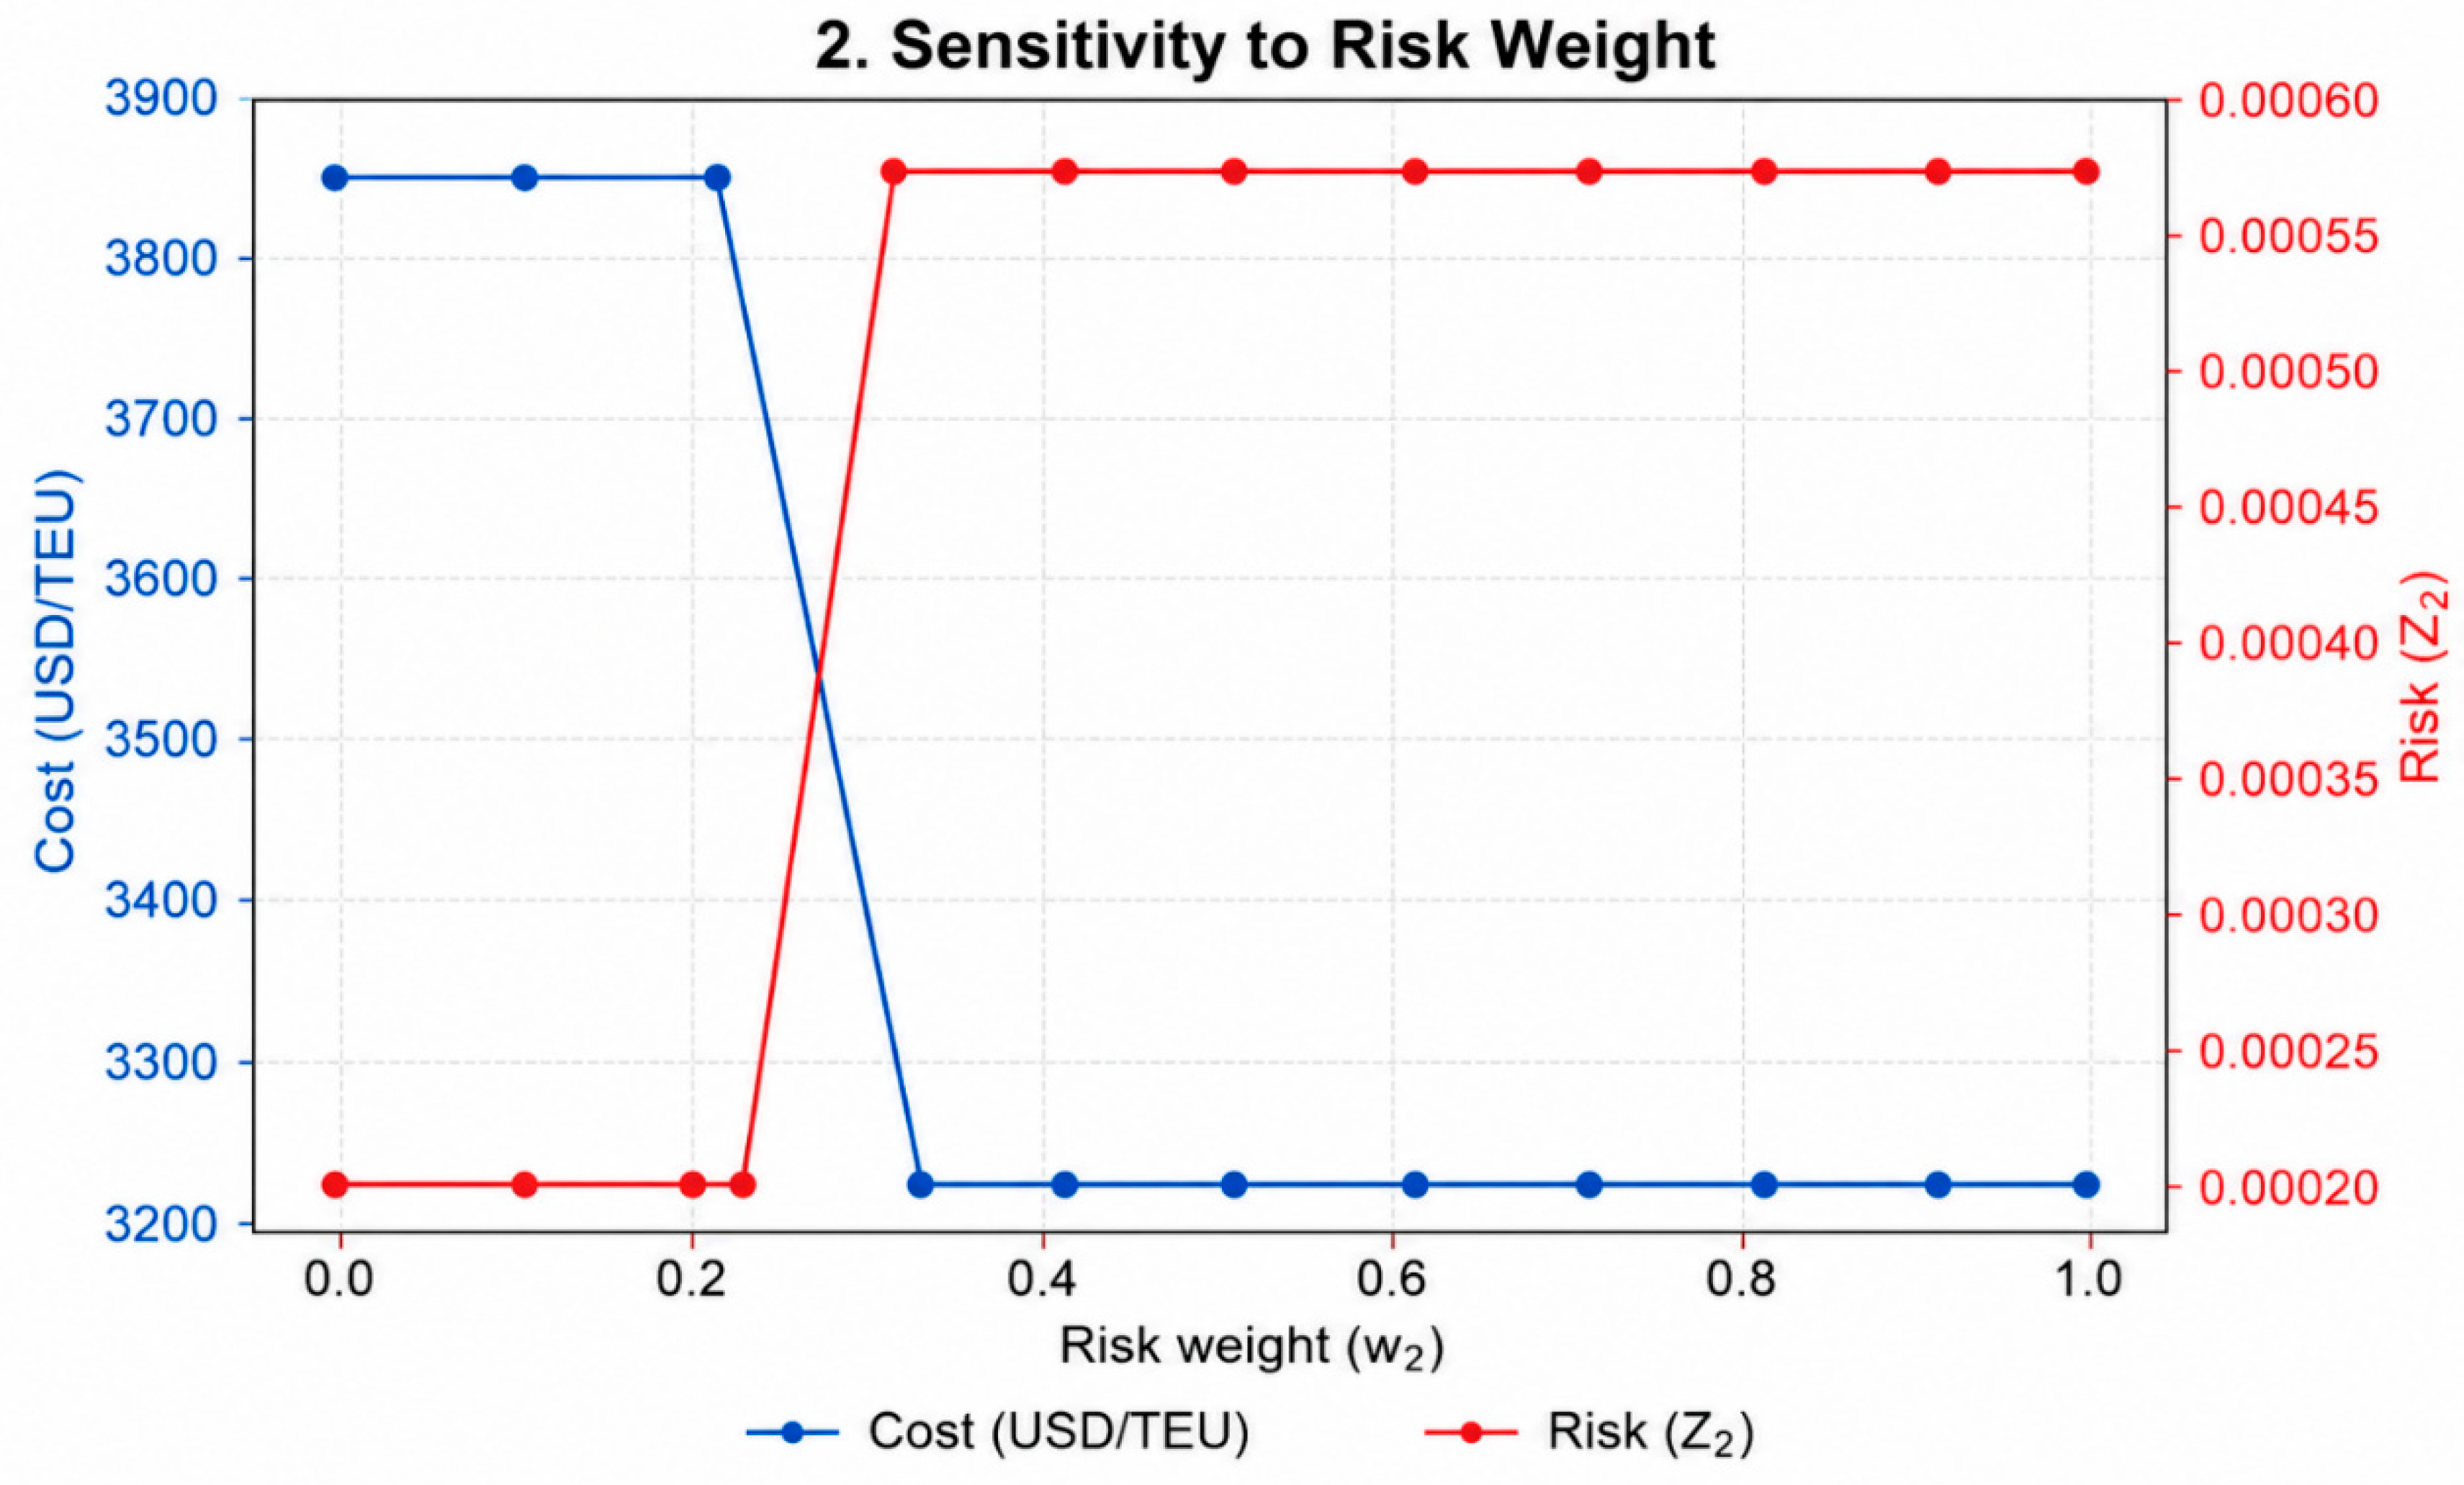
For low w₂ the model selects a faster, road-inclusive route; beyond approximately w₂ ≈ 0.3 the all-rail alternative dominates the weighted score, after which the selected route — and hence Z₁ and Z₂ — remains stable, indicating a robust preference for rail-based routing once safety is given moderate priority.
4.4. Sensitivity to Capacity Constraints
Constraint (6) limits the shipment volume assigned to each arc–mode pair. Holding cost as the primary objective, the minimum-cost feasible route was recomputed for weekly demand q ranging from 10 to 600 TEU/week, using the arc capacities of Table 1.
Figure 3.
Minimum feasible cost per TEU as weekly demand increases; the step reflects a capacity-driven mode switch.
Figure 3.
Minimum feasible cost per TEU as weekly demand increases; the step reflects a capacity-driven mode switch.
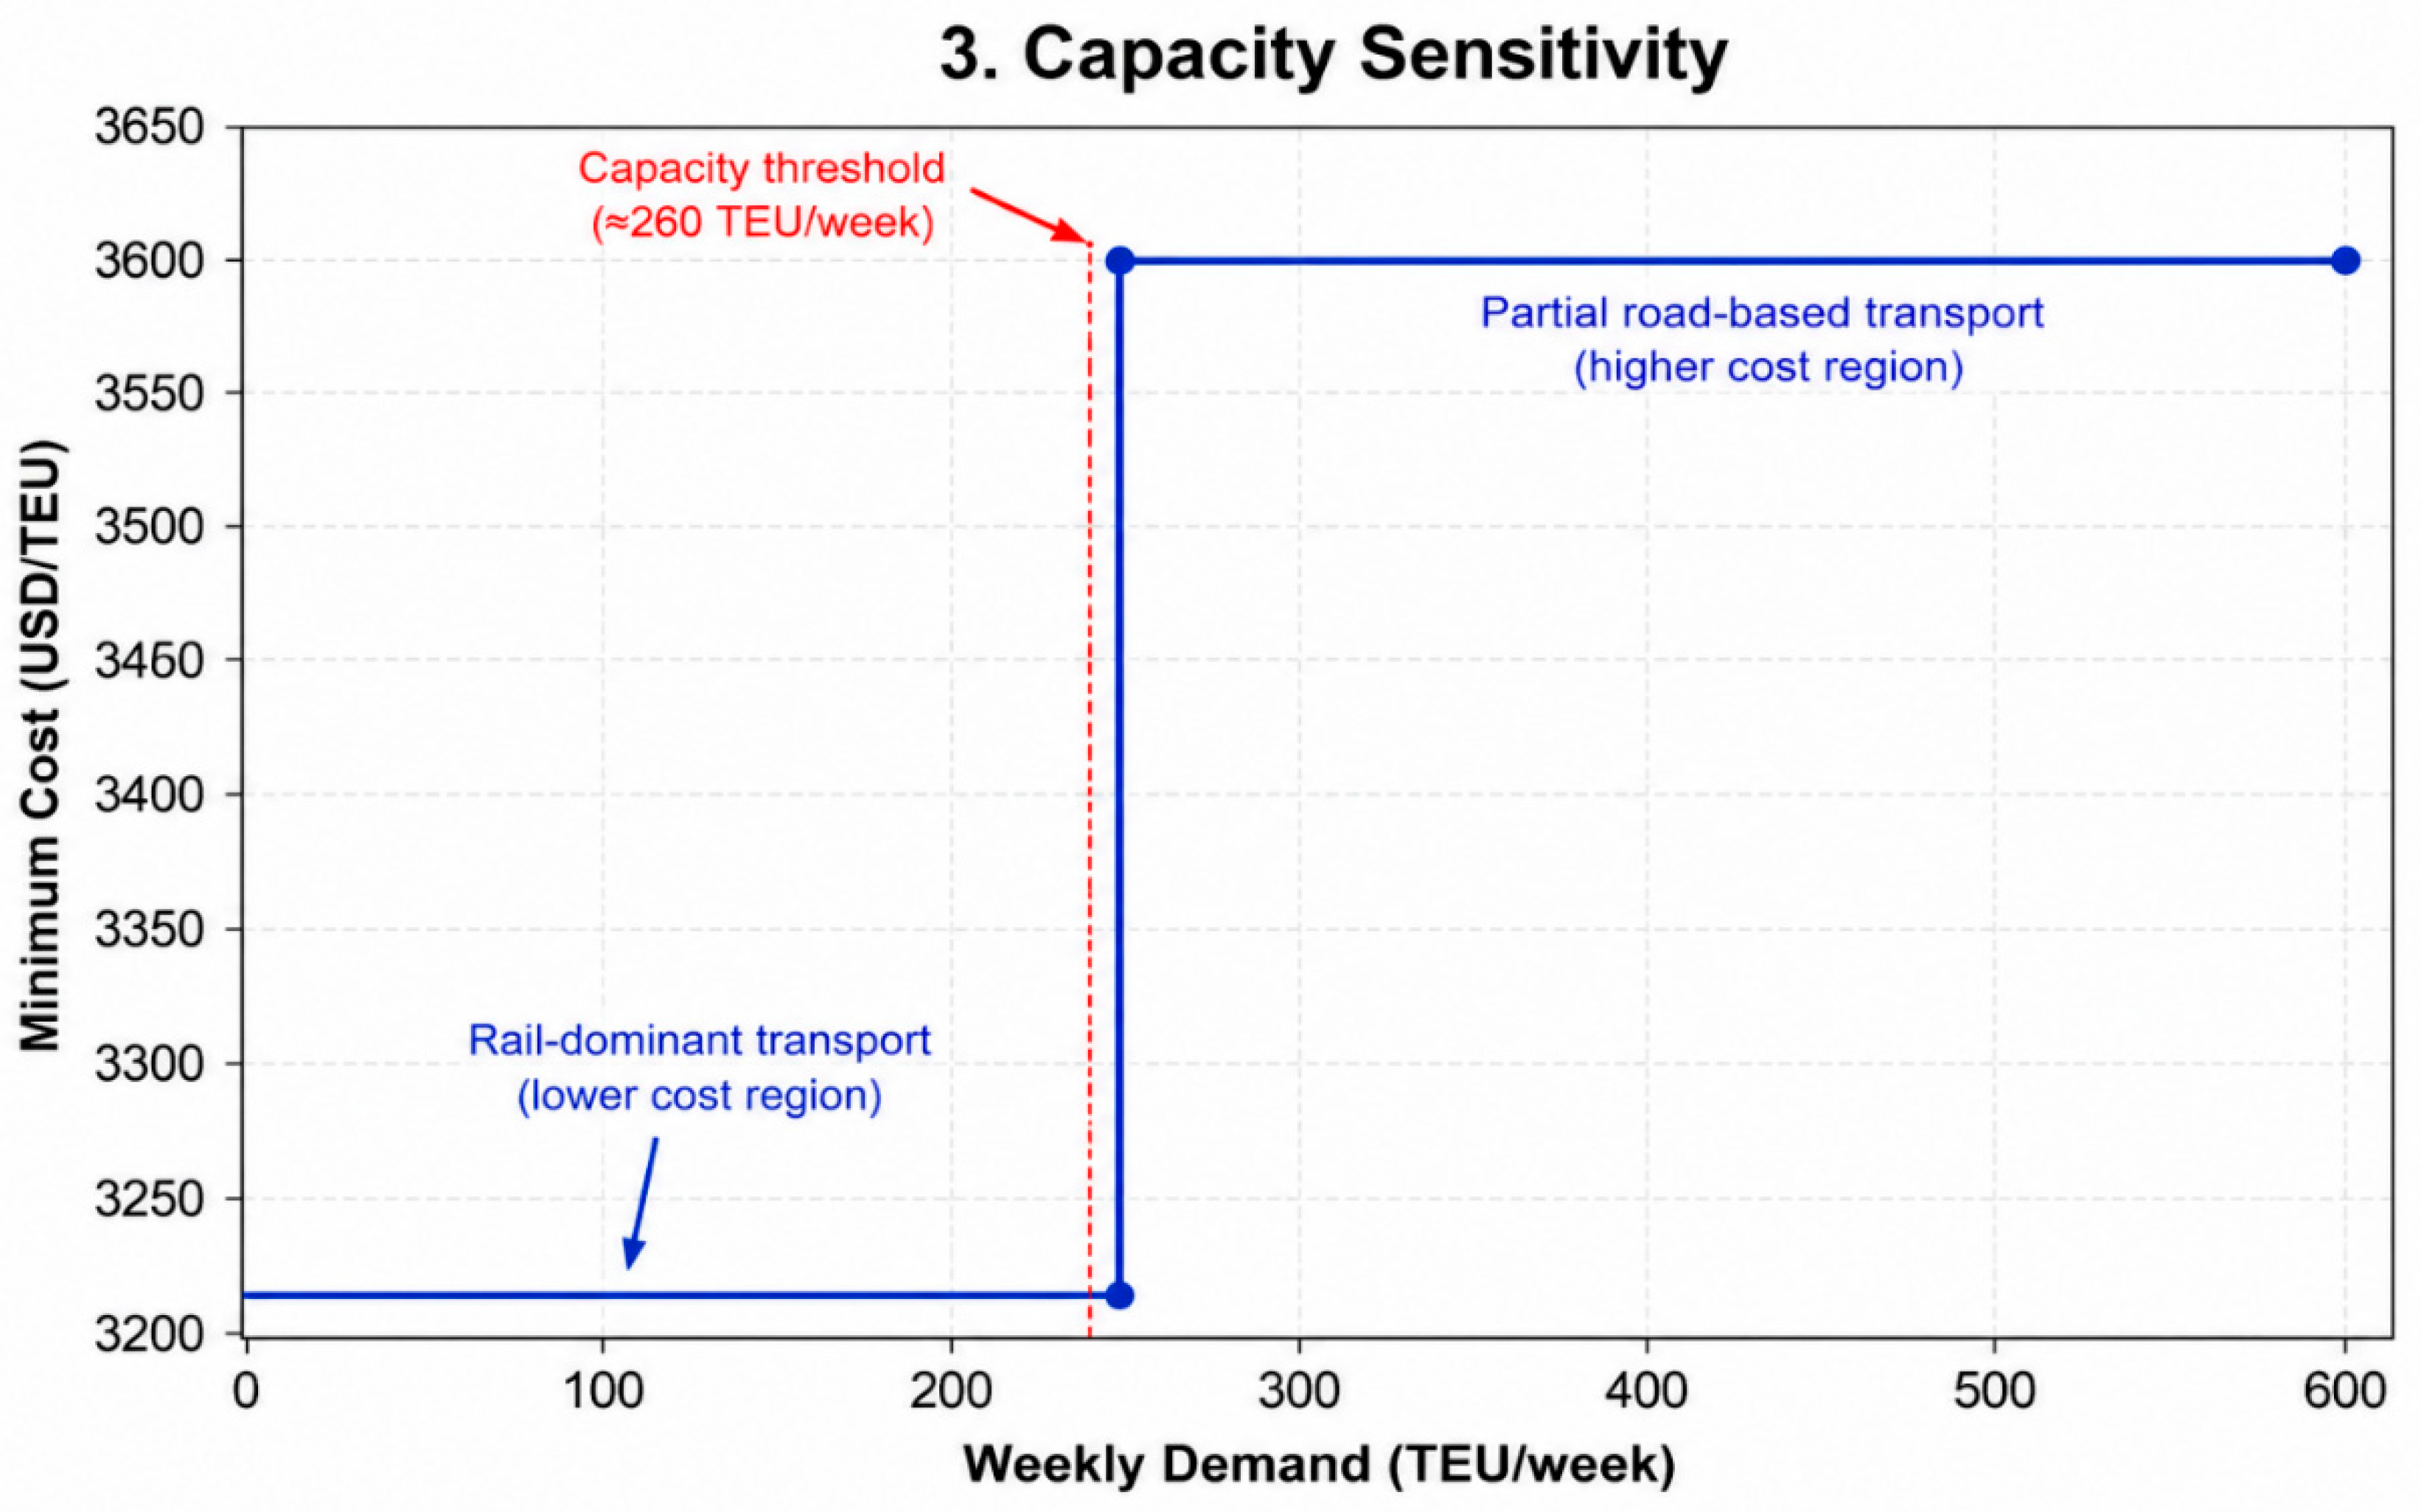
Table 3.
Capacity-driven route switch as weekly demand increases (illustrative capacities ofTable 1).
Table 3.
Capacity-driven route switch as weekly demand increases (illustrative capacities ofTable 1).
| Demand threshold | Minimum-cost feasible mode sequence |
| q ≥ 10 TEU/week | rail → sea → rail → rail → rail → rail |
| q ≥ 260 TEU/week | road → sea → road → rail → road → road |
At low demand the all-rail route (lowest cost and risk) remains feasible; once demand exceeds the binding rail capacity on the Khorgos–Aktau segment (260 TEU/week in this illustrative parameterization), the model is forced onto a partially road-based sequence, producing a step increase in minimum feasible cost. This confirms that capacity constraint (6) is the binding mechanism linking infrastructure investment decisions to achievable cost and risk levels in the corridor.
4.5. Summary of Numerical Findings
Across the illustrative case study, three consistent patterns emerge that align with the model’s structure rather than with the specific parameter values used. First, the all-rail sequence dominates on both cost and risk (Section 4.2), consistent with the lower per-unit cost and severity coefficients assigned to rail in Table 1; this is a structural property of the objective functions (2)–(3), not an artifact of the specific corridor chosen. Second, the risk-weight sensitivity analysis (Section 4.3) shows that the selected route stabilizes once w₂ exceeds roughly 0.3, indicating that moderate weight on safety is sufficient to lock in the lowest-risk corridor — a useful reference point for decision-makers setting policy weights. Third, the capacity sensitivity analysis (Section 4.4) confirms that infrastructure capacity, not cost or risk preference, becomes the binding constraint at high demand, which links the optimization results directly to infrastructure-investment planning (e.g., prioritizing capacity expansion on the Khorgos–Aktau rail segment). Because the underlying parameters are illustrative (Section 3.8), these findings should be read as demonstrations of model behavior rather than as corridor-specific policy conclusions until validated against operator data.
5. Discussion
The findings of this study demonstrate that the proposed multi-objective optimization framework provides an effective decision-support tool for configuring rail–truck intermodal networks for hazardous materials (HazMat) transportation along the Middle Corridor. Unlike traditional routing approaches that primarily minimize transportation cost or travel time, the proposed model explicitly considers the trade-offs among transportation cost, transportation risk, and transit time. This reflects the reality of hazardous materials logistics, where improving safety frequently requires accepting modest increases in operational expenditure or delivery time.
The numerical results indicate that rail-dominant transport configurations consistently outperform road-intensive alternatives in terms of transportation risk. This finding is consistent with previous research reporting that railway transportation generally exhibits lower accident frequencies and lower population exposure than road transportation [2,21]. Although the all-rail solution is not always the fastest alternative, the reduction in expected transportation risk considerably outweighs the relatively small increase in transit time. From a policy perspective, this supports ongoing initiatives aimed at increasing the modal share of rail transport for dangerous goods within Eurasian transport corridors.
The sensitivity analysis further demonstrates that decision-maker preferences significantly influence network configuration. When transportation risk receives only limited importance in the objective function, the optimization algorithm selects mixed rail–road solutions that achieve shorter delivery times. However, once the weight assigned to safety exceeds approximately 30%, the optimization converges toward predominantly rail-based solutions. This result suggests that relatively moderate policy emphasis on safety is sufficient to shift network design toward considerably safer transport configurations without imposing excessive economic penalties.
Infrastructure capacity emerges as another critical determinant of optimal network performance. The capacity analysis shows that railway bottlenecks, particularly on the Khorgos–Aktau section, become binding constraints under increasing freight demand, forcing the optimization model to substitute higher-risk road transport despite its inferior safety performance. Consequently, infrastructure investments targeting railway capacity expansion may generate safety benefits that exceed those obtained solely through stricter regulatory controls. This finding is consistent with previous studies emphasizing the importance of infrastructure capacity in intermodal hazardous materials transportation [23,25].
One important contribution of this study is its explicit consideration of the unique operational characteristics of the Middle Corridor. Unlike transport corridors in North America or Western Europe, the Middle Corridor incorporates multiple international border crossings, diverse national regulatory environments, and mandatory multimodal transfers across the Caspian Sea. These characteristics introduce operational complexities that are largely absent from existing hazardous materials routing models. The inclusion of border delays, transfer operations, regulatory compatibility constraints, and infrastructure capacity limitations enables the proposed framework to better reflect actual corridor operations.
The model also contributes to the growing literature on resilient transport corridors. Recent geopolitical developments have significantly increased the strategic importance of the Middle Corridor as an alternative Eurasian trade route. As hazardous materials traffic continues to expand, balancing operational efficiency with transportation safety will become increasingly important. The optimization framework developed in this study offers corridor operators and policymakers a systematic approach for evaluating alternative infrastructure investments, modal policies, and operational strategies before implementation.
Despite these contributions, several limitations should be acknowledged. First, the numerical case study relies on illustrative parameter values rather than audited operational data. Although the selected values represent realistic orders of magnitude, future applications should employ verified railway tariffs, customs processing times, ferry schedules, infrastructure capacities, and accident statistics obtained from corridor operators and national authorities. Second, the model assumes deterministic transportation demand and static network conditions, whereas actual logistics systems are subject to uncertainty arising from weather disruptions, infrastructure failures, fluctuating demand, and geopolitical events. Incorporating stochastic programming or robust optimization techniques would improve the model’s applicability under uncertainty. Third, the present framework evaluates strategic planning decisions and therefore does not consider real-time operational adjustments based on traffic conditions or dynamic incident information. Integration with intelligent transportation systems, digital twins, and real-time monitoring platforms represents a promising direction for future research.
Future studies could further extend the model by incorporating maritime risk assessment for Caspian ferry operations, carbon emissions, cybersecurity risks within digital logistics systems, and resilience indicators that measure network performance under disruption scenarios. Metaheuristic algorithms such as NSGA-II or MOEA/D may also be employed to solve large-scale corridor networks involving multiple origins, destinations, and hazardous materials classes.
6. Conclusion
This study developed a multi-objective mixed-integer linear programming framework for configuring rail–truck intermodal networks for hazardous materials transportation along the Middle Corridor. The proposed methodology simultaneously optimizes transportation cost, transportation risk, and transit time while incorporating operational constraints associated with railway capacity, intermodal transfer operations, border crossings, and regulatory compatibility under ADR, RID, and IMDG requirements.
The numerical case study demonstrates that rail-oriented transportation configurations provide substantial reductions in transportation risk while requiring only moderate increases in delivery time. The analysis also shows that railway infrastructure capacity is a decisive factor influencing corridor performance, with capacity shortages forcing shifts toward less desirable road-based alternatives. Sensitivity analyses further indicate that assigning moderate priority to transportation safety is sufficient to produce stable and robust rail-dominant network configurations.
From a theoretical perspective, this research extends the hazardous materials transportation literature by integrating multimodal network design, quantitative risk assessment, and multi-objective optimization within the specific context of the Middle Corridor. Unlike previous studies that primarily examined established transport corridors in North America, Europe, or China, the proposed framework explicitly incorporates the geographical, operational, and regulatory characteristics of the Trans-Caspian International Transport Route, including multimodal transfers across the Caspian Sea and multiple international border crossings.
From a practical perspective, the proposed optimization framework provides a valuable decision-support tool for governments, railway operators, logistics service providers, infrastructure planners, and international corridor organizations. The model can assist in evaluating alternative infrastructure investments, identifying strategic intermodal terminal locations, assessing the safety implications of modal policies, and supporting long-term corridor development strategies. Its ability to generate Pareto-optimal solutions enables decision-makers to explicitly evaluate the trade-offs between economic efficiency and transportation safety rather than relying on single-objective optimization.
As the strategic importance of the Middle Corridor continues to increase within Eurasian supply chains, ensuring the safe and efficient movement of hazardous materials will become increasingly critical. The methodology presented in this study provides a transparent, mathematically rigorous, and adaptable framework that can support future corridor planning and policy development. Future research should focus on validating the model with real operational data, incorporating uncertainty through stochastic optimization, and integrating real-time digital information systems to support dynamic hazardous materials transportation management across international multimodal corridors.
References
- Torretta, V.; Rada, E. C.; Schiavon, M.; Viotti, P. Decision support systems for assessing risks involved in transporting hazardous materials: A review. Saf. Sci. 2017, 92, 1–9. [Google Scholar] [CrossRef]
- Holeczek, N. Hazardous materials truck transportation problems: A classification and state-of-the-art literature review. Transp. Res. Part D. Transp. Environ. 2019, 69, 305–328. [Google Scholar] [CrossRef]
- Ingvarson, J. Effects of standardization in risk management regulations for land-use planning related to process industries and transportation of dangerous goods. J. Loss Prev. Process Ind. 2024, 91, 105383. [Google Scholar] [CrossRef]
- United Nations. Agreement concerning the International Carriage of Dangerous Goods by Road (ADR). 2022. [Google Scholar]
- Intergovernmental Organisation for International Carriage by Rail (OTIF). (2023). Convention concerning International Carriage by Rail (COTIF), Appendix C: Regulations concerning the International Carriage of Dangerous Goods by Rail (RID).
- International Maritime Organization (IMO). International Maritime Dangerous Goods (IMDG) Code. 2024. Available online: https://www.imo.org/en/OurWork/Safety/Pages/DangerousGoods-default.aspx (accessed on 3 January 2025).
- Flodén, J.; Woxenius, J. A stakeholder analysis of actors and networks for land transport of dangerous goods. Res. Transp. Bus. Manag. 2021, 41, 100629. [Google Scholar] [CrossRef]
- Yang, J.; Li, F.; Zhou, J.; Zhang, L.; Huang, L.; Bi, J. A survey on hazardous materials accidents during road transport in China from 2000 to 2008. J. Hazard. Mater. 2010, 184(1–3), 647–653. [Google Scholar] [CrossRef] [PubMed]
- Zhao, L.; Qian, Y.; Hu, Q.-M.; Jiang, R.; Li, M.; Wang, X. An analysis of hazardous chemical accidents in China between 2006 and 2017. Sustainability 2018, 10(8), 2935. [Google Scholar] [CrossRef]
- Zhang, W.; Cheng, W.; Gai, W. Hazardous chemicals road transportation accidents and the corresponding evacuation events from 2012 to 2020 in China: A review. Int. J. Environ. Res. Public Health 2022, 19(22), 15182. [Google Scholar] [CrossRef] [PubMed]
- Ma, C.; Zhou, J.; Yang, D. Causation analysis of hazardous material road transportation accidents based on the ordered logit regression model. Int. J. Environ. Res. Public Health 2020, 17(4), 1259. [Google Scholar] [CrossRef] [PubMed]
- Budny, A.; Rokicki, T. Road transport of dangerous goods in Poland. Ekon. I Organ. Logistyki 2021, 6(3), 13–21. [Google Scholar] [CrossRef]
- Bubbico, R.; Di Cave, S.; Mazzarotta, B. Risk analysis for road and rail transport of hazardous materials: A GIS approach. J. Loss Prev. Process Ind. 2004, 17(6), 483–488. [Google Scholar] [CrossRef]
- Ayyildiz, E.; Taskin Gumus, A. Pythagorean fuzzy AHP based risk assessment methodology for hazardous material transportation: An application in Istanbul. Environ. Sci. Pollut. Res. 2021, 28(27), 35798–35810. [Google Scholar] [CrossRef] [PubMed]
- Hsu, W.-K. K.; Huang, S.-H. S.; Tseng, W.-J. Evaluating the risk of operational safety for dangerous goods in air freights: A revised risk matrix based on fuzzy AHP. Transp. Res. Part D. Transp. Environ. 2016, 48, 284–294. [Google Scholar] [CrossRef]
- Kanj, H.; Kulaglic, A.; Aly, W. H. F.; Al-Tarawneh, M. A. B.; Safi, K.; Kanj, S.; Flaus, J. M. Agent-based risk analysis model for road transportation of dangerous goods. Results Eng. 2025, 25, 103944. [Google Scholar] [CrossRef]
- Chai, H.; Dong, K.; Liang, Y.; Han, Z.; He, R. Machine learning-based accidents analysis and risk early warning of hazardous materials transportation. J. Loss Prev. Process Ind. 2025, 95, 105594. [Google Scholar] [CrossRef]
- Abkowitz, M.; Cheng, P. D.-M. Developing a risk/cost framework for routing truck movements of hazardous materials. Accid. Anal. Prev. 1988, 20(1), 39–51. [Google Scholar] [CrossRef] [PubMed]
- Bubbico, R.; Di Cave, S.; Mazzarotta, B.; Silvetti, B. Preliminary study on the transport of hazardous materials through tunnels. Accid. Anal. Prev. 2009, 41(1), 119–128. [Google Scholar] [CrossRef] [PubMed]
- Lundin, J.; Antonsson, L. Road tunnel restrictions: Guidance and methods for categorizing road tunnels according to dangerous goods regulations (ADR). Saf. Sci. 2019, 116, 170–182. [Google Scholar] [CrossRef]
- Verma, M.; Verter, V. Railroad transportation of dangerous goods: Population exposure to airborne toxins. Comput. Oper. Res. 2007, 34(5), 1287–1303. [Google Scholar] [CrossRef]
- Lu, P.; Tolliver, D. Accident prediction model for public highway–rail grade crossings. Accid. Anal. Prev. 2016, 95(Part A), 206–214. [Google Scholar] [CrossRef] [PubMed]
- Assadipour, G.; Ke, G. Y.; Verma, M. Planning and managing intermodal transportation of hazardous materials with capacity selection and congestion. Transp. Res. Part E Logist. Transp. Rev. 2015, 76, 45–57. [Google Scholar] [CrossRef]
- Jiang, Y.; Zhang, X.; Rong, Y.; Zhang, Z. A multimodal location and routing model for hazardous materials transportation based on multi-commodity flow model. Procedia—Social Behav. Sci. 2014, 138, 791–799. [Google Scholar] [CrossRef]
- Bhavsar, N.; Hassini, E.; Verma, M. Rail–truck intermodal transportation for dangerous goods. Transp. Res. Procedia 2025, 82, 2766–2778. [Google Scholar] [CrossRef]
- Oggero, A.; Darbra, R. M.; Muñoz, M.; Planas, E.; Casal, J. A survey of accidents occurring during the transport of hazardous substances by road and rail. J. Hazard. Mater. 2006, 133(1–3), 1–7. [Google Scholar] [CrossRef] [PubMed]
- Niu, S.; Ukkusuri, S. V. Risk assessment of commercial dangerous-goods truck drivers using geo-location data: A case study in China. Accid. Anal. Prev. 2020, 136, 105427. [Google Scholar] [CrossRef] [PubMed]
- Goldberg, D. M.; Hong, S. Minimizing the risks of highway transport of hazardous materials. Sustainability 2019, 11(22), 6300. [Google Scholar] [CrossRef]
- Vrijling, J. K.; Van Hengel, W.; Houben, R. J. A framework for risk evaluation. J. Hazard. Mater. 1995, 43(3), 245–261. [Google Scholar] [CrossRef]
- AlRukaibi, F.; Alrukaibi, D.; Alkheder, S.; Alojaiman, S.; Sayed, T. Optimal route risk-based algorithm for hazardous material transport in Kuwait. J. Loss Prev. Process Ind. 2018, 52, 40–53. [Google Scholar] [CrossRef]
- Izdebski, M.; Jacyna-Gołda, I.; Gołda, P. Minimisation of the probability of serious road accidents in the transport of dangerous goods. Reliab. Eng. Syst. Saf. 2022, 217, 108093. [Google Scholar] [CrossRef]
- Hobeika, A. G.; Kim, S.; Sethuraman, R. Characteristics of hazardous-material accidents in Pennsylvania. J. Transp. Eng. 1993, 119(2), 226–238. [Google Scholar] [CrossRef]
- Fikus, J.; Przybylska, E. Risk assessment for the transport of Class 1 hazardous materials by road. Organ. Manag. Sci. Q. 2021, 56(4), 5–19. [Google Scholar] [CrossRef]
- Zhao, H.; Zhang, N.; Guan, Y. Safety assessment model for dangerous goods transport by air carrier. Sustainability 2018, 10(5), 1306. [Google Scholar] [CrossRef]
- Wang, A.; Zhu, G.; Li, J. Collaborative supervision of dangerous goods supply chain: A blockchain-based conceptual platform. Comput. Ind. Eng. 2025, 200, 110818. [Google Scholar] [CrossRef]
- Conca, A.; Ridella, C.; Sapori, E. A risk assessment for road transportation of dangerous goods: A routing solution. Transp. Res. Procedia 2016, 14, 2890–2899. [Google Scholar] [CrossRef]
- Russo, F.; Rindone, C. Transport of dangerous goods in urban areas: Planning for a sustainable future. Sustain. Futur. 2025, 5, 100649. [Google Scholar] [CrossRef]
- Li, Y.; Wu, J.; Yuan, W.; Santibanez Gonzalez, E. D. R. Securing transportation of hazardous materials against terrorism: A novel game-based approach. Comput. Ind. Eng. 2022, 169, 108156. [Google Scholar] [CrossRef]
- Maddux, J. E.; Rogers, R. W. Protection motivation and self-efficacy: A revised theory of fear appeals and attitude change. J. Exp. Soc. Psychol. 1983, 19(5), 469–479. [Google Scholar] [CrossRef]
- Van Raemdonck, K.; Macharis, C.; Mairesse, O. Risk analysis system for the transport of hazardous materials. J. Saf. Res. 2013, 45, 55–63. [Google Scholar] [CrossRef] [PubMed]
- Guo, J.; Ma, K.; Ren, H. Topological analysis of risks in hazardous materials transportation systems using fitness landscape theory and association rules mining. Reliab. Eng. Syst. Saf. 2025, 264(Part B), 111396. [Google Scholar] [CrossRef]
- Arifin, K.; Ahmad, M. A.; Abas, A.; Mansor Ali, M. X. Systematic literature review: Characteristics of confined space hazards in the construction sector. Results Eng. 2023, 18, 101188. [Google Scholar] [CrossRef]
- Pekarčíková, M.; Kliment, M.; Kronová, J.; Trebuňa, P.; Hovana, A. Simulation-based optimization of material supply in automotive production using RTLS data. Appl. Sci. 2025, 15(16), 9102. [Google Scholar] [CrossRef]
Disclaimer/Publisher’s Note: The statements, opinions and data contained in all publications are solely those of the individual author(s) and contributor(s) and not of MDPI and/or the editor(s). MDPI and/or the editor(s) disclaim responsibility for any injury to people or property resulting from any ideas, methods, instructions or products referred to in the content. |
© 2026 by the authors. Licensee MDPI, Basel, Switzerland. This article is an open access article distributed under the terms and conditions of the Creative Commons Attribution (CC BY) license (http://creativecommons.org/licenses/by/4.0/).
Copyright: This open access article is published under a Creative Commons CC BY 4.0 license, which permit the free download, distribution, and reuse, provided that the author and preprint are cited in any reuse.


