

Submitted:
27 July 2026
Posted:
29 July 2026
You are already at the latest version
Abstract
In laser phase transformation hardening and laser cladding processes, the inherent thermodynamic limitations of conventional intensity distributions severely restrict the uniformity of metallurgical reaction. Although programmable beam shaping devices offer flexibility in profile reconstruction, their transmissive structure results in a low laser-induced damage threshold (LIDT), making them unsuitable for long-term stable operation at kilowatt-level power. This study proposes a reflective freeform mirror design method based on the principle of zonal energy mapping. The method constructs energy mapping relations that correlate the irradiance distribution in every sub-region of the incident Gaussian beam with the desired M-shaped irradiance profile. Relying on such mappings, the local surface generatrices of all sub-regions are solved separately; these generatrices are subsequently assembled to yield an integrated mirror surface. Optical performance was verified through Zemax non-sequential ray tracing simulations. The mirror was precisely machined using single-point diamond turning (SPDT). The experimental results show that the measured intensity distribution on the observation screen exhibits a typical M-shaped profile, with a peak-to-valley ratio of 1.28, which is in good agreement with the design target. This method provides a technically feasible and engineering-robust solution for complex thermal flux control requirements in high-power laser material processing.
Keywords:
beam shaping
; freeform mirror
; energy mapping
; M-shaped irradiance profile
; high-power laser processing
1. Introduction
Laser transformation hardening (LTH) and laser cladding have emerged as pivotal surface engineering technologies for enhancing the wear and fatigue resistance of metallic components without compromising bulk properties [1,2,3]. However, the attainment of a uniform case depth remains fundamentally constrained by the mismatch between the incident laser irradiance profile and the transient thermal boundary conditions. Conventional TEM00 Gaussian modes exhibit a pronounced central energy density, which inevitably induces martensite overheating or even melting at the scan center, while leaving the peripheral regions insufficiently austenitized [4,5,6]. Conversely, homogenized top-hat profiles, though mitigating central peaks, fail to counteract lateral heat dissipation into the colder substrate. This thermodynamic asymmetry leads to a characteristic "crescent-shaped" hardness trajectory and poor process repeatability [1].
To tailor the spatial energy distribution, programmable devices such as liquid crystal spatial light modulators (LC-SLMs) [7] and diffractive optical elements (DOEs) have been employed to generate complex profiles, including the theoretically optimal M-shaped irradiance distribution [8,9,10,11]. Nevertheless, these transmissive optical elements suffer from intrinsically low laser-induced damage thresholds (LIDT) and energy losses, rendering them impractical for high-power industrial applications. Reflective integrator mirrors, characterized by their robustness and capability for active water-cooling, represent the mainstream alternative. However, traditional mirror designs rely solely on simple beam splitting and superposition, thus inherently facing difficulties in achieving customized gradient control of light intensity distribution [12,13,14,15].
To address this technical gap, this study proposes a freeform mirror design method that combines adherence to the law of energy conservation with the intensity superposition approach. Unlike traditional beam-splitting methods, our approach establishes a continuous and one-to-one energy mapping relationship between the energy distribution in each subregion of the incident Gaussian beam and the corresponding local intensity target. Based on this mapping relationship and the law of reflection, we achieved precise control over the peak-to-valley ratio of the intensity distribution. This paper presents a geometric optics mapping model for M-shaped beam generation. Using non-sequential ray tracing, we quantitatively simulated beam shaping and achieved M-shaped intensity profiles. We fabricated mirror prototypes and experimentally confirmed their stable, precise conversion of Gaussian input into the target M-shaped profile—enabling intensity control in laser material processing.
2. Design of the Energy-Conserving Freeform Mirror
2.1 Theoretical Framework and Energy Mapping Principle
Unlike conventional integral mirrors that rely on beam splitting and superposition, the proposed freeform mirror design takes the law of energy conservation as the core constraint, establishing a quantitative mapping relationship between the incident Gaussian irradiance and the target output irradiance. This enables an inverse design workflow from the desired energy distribution to the mirror geometry, breaking the inherent limitation of traditional integrators that only produce uniform output profiles.
As illustrated in Figure 1, a Cartesian coordinate system is defined with the incident beam propagating along the +z direction. The incident beam is assumed to be a TEM₀₀ Gaussian beam with a waist radius of w₀, whose irradiance distribution along the y-axis is given by:
where is the peak irradiance at the beam center, and y denotes the coordinate along the direction of the incident cross-section.
To enable numerical implementation, the incident beam aperture along the y-axis is discretized into equal segments with a segment length of , where is the effective incident beam aperture. The n-th segment spans the interval, with .
Let the intensity distribution of the target spot in the x-direction be . is the predefined target irradiance profile (e.g., uniform, M-shaped, or other customized distributions for laser thermal processing). This function is defined over the entire target domain and satisfies the normalization constraint, with the integral evaluated over the complete target region.
where x₀ and x₁ represent the spatial boundary coordinates of the target spot in the x-direction, i.e., the left and right endpoints of its defined interval.
The output spot intensity distribution corresponding to the n-th subregion of the incident beam is denoted as , defined along the x-direction on the target plane, representing the local contribution of this subregion to the final synthesized intensity.
The total output intensity distribution along the target x-axis satisfies the superposition relation as follows:
According to the law of energy conservation, the optical energy carried by each incident sub-region must be fully coupled into the same overlapping interval on the target plane's x-axis. The constraint is mathematically expressed as:
and is the target interval. The origin of the target x-axis is aligned with the left edge of the desired spot, such that x0 = 0 marks the starting position of the output profile. A sufficient condition for Equation (5) is derived from differential energy conservation [15], i.e.,
where y is the vertical coordinate in the input plane and x is the horizontal coordinate in the output plane, . To ensure that the cumulative energy at position x in the output equals exactly the cumulative energy at position y in the input, a nonlinear mapping of the output coordinates is required:
where m(y) is a differentiable scaling function. Equations (6) and (7) can be combined to yield:
Given that the incident irradiance profile is divided into n subregions along the y-axis, the n-th subregion starts at y(0)= (n−1)L, integrating the above expression yields:
Since the intensity of the outgoing light spot equals zero at x0=0, i.e., , we can obtain:
Solving for the coordinate mapping relation x = M(y) that satisfies cumulative energy conservation between the incident intensity distribution and the output intensity distribution . This mapping directly determines the local curvature and normal deflection angle required for the integrating mirror, thereby providing a theoretical basis for the quantitative design of the mirror's optical surface profile.
2.2 Design of Free-Form Surface Reflectors
Based on the aforementioned coordinate mapping between output and input positions, the geometric profile of the integrating mirror can be determined pointwise. As illustrated in Figure 2, a collimated beam incident along the y-direction at position y is reflected at a mirror surface point (xm, ym) and precisely directed onto the output position on the target plane. The lateral coordinate xm and vertical height ym of this reflection point are jointly constrained by the law of reflection and the mapping relation, thereby uniquely determining the local surface normal vector and curvature required at that location.
To facilitate the numerical implementation, the incident light intensity is discretized into equal segments along the mirror generatrix. According to the energy conservation law, the optical energy carried by each incident segment is fully transferred to an overlapping region on the target plane. This bijective mapping relationship establishes the foundation for deriving the continuous surface generatrix.
Let x denote the x-coordinate of the output plane corresponding to the incident beam coordinate y of the n-th subsegment, which reads:
where x₀ is the displacement constant selected for the working surface, and .
According to the law of reflection and the geometric relationship shown in Figure 2, we obtain yₘ = y; from this, a series of equations can be derived.
From the relationships among trigonometric functions, we can derive:
Let , then we have:
Let , from which we can derive:
Since tanθ1/2 and tanθ1 have the same sign, t and k also have the same sign. Solving Equation (18) yields:
Given that, substituting Equations (12) and (19) into Equation (16), and after algebraic simplification, we obtain:
where, y represents the longitudinal coordinate (i.e., the height of the incident point) of the incident ray at the reflecting surface, and x represents the transverse coordinate of the reflected ray at the image plane. From equation (11), x can be expressed as an explicit function of y, and thus can be completely eliminated in subsequent derivations.
In the xOy plane, the coordinates of two adjacent sampling points in the longitudinal subregion of the incident Gaussian beam are denoted as y₁ and y₂; their corresponding reflection points on the freeform mirror have the same longitudinal coordinates, i.e., satisfying yₘ₁ = y₁ and yₘ₂ = y₂.
The relationship between the coordinates yₘ₁ and yₘ₂ of adjacent points can be expressed as:
where Δyₘ is a sufficiently small increment to ensure adequate accuracy of the constructed mirror generatrix.
Based on the geometric constraints of the mirror slope at the reflection point, we obtain:
where (xm1, ym1) represents the coordinate of the reflection point on the mirror corresponding to the starting boundary of the incident sub-region; xₘ₁ is uniquely determined by the relative spatial position between the mirror and the target spot, as well as the law of reflection, and its value is independent of the output intensity distribution Iout,n of the target spot. According to formulas (21) and (22), (xₘ₂, yₘ₂) can be obtained.
Starting from the point (xₘ₂, yₘ₂), successive numerical iterations using formulas (21) and (22) yield the adjacent discrete point (xₘ₃, yₘ₃) on the mirror surface. By continuing this recursive process, subsequent coordinate points are generated step by step, ultimately forming a discrete set of generatrix points corresponding to the longitudinal subregion.
For the remaining longitudinal subregions of the incident beam, the same iterative procedure is applied independently to construct their respective mirror generatrices. All adjacent generatrices meet continuity conditions at their connecting points. Subsequently, the set of discrete generatrix points is fitted with a polynomial, and the resulting fitted curve is then translated and stretched along the direction perpendicular to the xOy plane, thereby generating an overall three-dimensional freeform mirror surface.
3. Simulation and Experiment
3.1 Simulation and Analysis
The mirror's generatrix equation fitted by the method described in this paper is imported into the SolidWorks software, where a three-dimensional mirror surface geometry model was created by extruding along the z-direction. The model was then exported in STEP format and precisely loaded into Zemax using the "Import CAD" function. A Gaussian beam with a wavelength of 632.8 nm and a beam waist radius of 15 mm was set as the light source. Based on this model and light source parameters, simulation analyses of intensity distributions were conducted for both uniform and M-shaped spot patterns.
3.1.1. Simulation of UNIFORM LIGHT SPOT in the x-direction
The incident light field is a Gaussian beam with a waist radius of 15 mm, and the beam center is located at y₀ = 115 mm along the y-direction. The corresponding normalized intensity distribution expression is:
The working distance of the freeform mirror is 300 mm; the output beam shaped by this mirror exhibits a uniform intensity distribution in the x direction. The spatial width of the target spot in the x-direction is 30 mm, meaning the length of its defined interval |x₁ − x₀| = 30 mm. The normalized intensity distribution of the target spot in the x-direction is:
The incident Gaussian beam is equally divided into three subdomains of identical width along the y-direction, and the generatrix of the freeform mirror is segmented into three matching subdomains accordingly. Based on the design method proposed in this paper, we calculate the discrete point coordinates of the reflective surface generatrix, and finally construct a complete generatrix profile comprising 301 data points. The spacing (step size) between adjacent data points is 0.1 mm. The polynomial expression obtained by fitting the mirror generatrix is expressed as:
The polynomial coefficients are shown in Table 1. The fitted polynomial was translated by setting its constant term to zero.
As shown in Figure 3(a), the generatrix of the freeform mirror exhibits a three-segment geometric profile characterized by "concave–convex–concave." This structure is designed to match the intensity distribution of the incident Gaussian beam (strong at the center and weak at the edges): the concave regions enhance the convergence of low-intensity edge rays, while the central convex region causes divergence. Combined, these geometric features yield uniform output irradiance along the x-direction. The fitted generatrix equation is imported into SolidWorks and extruded horizontally to construct the three-dimensional geometric model of the freeform reflective mirror, as shown in Figure 3(b).
The surface profile data of the freeform mirror are imported into Zemax for non-sequential ray-tracing simulations (the optical path is illustrated in Figure 4(a)). In non-sequential mode, the incoherent irradiance distribution of the incident beam is recorded using detector 1. Figures. 4(b) and (c) respectively depict the two-dimensional cross-sectional incoherent irradiance distribution of the incident Gaussian beam and its intensity profile along the x-direction, both of which exhibit excellent agreement with the theoretical Gaussian distribution.
Intensity data from detector 2 are exported, and the incoherent irradiance distribution of the shaped beam is presented in Figure 5. It can be seen that the incident Gaussian distribution beam in the x-direction has been effectively reshaped into an approximately uniform profile.
The quantitative indicators for measuring beam uniformity are uniformity and steepness. According to the international standard (ISO 13694:2018) [16], the beam uniformity is calculated using the following formula:
where, is the spot intensity, is the threshold (), is the average value of intensities greater than , is the area where intensity exceeds , and is the maximum intensity of the spot. The smaller the uniformity of the spot, the lower the root-mean-square deviation of the intensity from its average, indicating better spot uniformity.
The edge steepness of the target spot is also an important parameter for describing beam shaping performance. According to the international standard (ISO 13694:2018) [16], the edge steepness of the spot is calculated using the following formula:
where, is the area where the light intensity exceeds 0.1 times the maximum intensity, and is the area where the light intensity exceeds 0.9 times the maximum intensity. s approaching zero indicates that the edge of the intensity distribution becomes increasingly vertical.
The output beam spot in the x-direction exhibits an intensity uniformity of 4.33% and an edge steepness of 5.88%. In contrast, the y-direction retains its original Gaussian distribution characteristics.
It is important to note that the shaping design relies on a freeform surface profile generated via 7th-order B-spline curve fitting in SolidWorks. Insufficient fitting order introduces surface deviations, which subsequently induce local intensity distortions (i.e., "overshoot" and "undershoot" phenomena) at both ends of the x-direction. This issue stems from a systematic modeling error rather than simulation or measurement inaccuracies.
3.1.2. Simulation of M-Shaped Light Spot
To verify the effectiveness of the proposed method and its parameter control capability, we set the target output irradiance distribution to an M-shape and systematically define three sets of significantly different M-shaped spot peak-to-valley ratios, namely 9, 4.5, and 1.5. The mathematical expression for is given below:
The irradiance distribution of is presented in Figure 6. The peak-to-valley ratios corresponding to the three M-shaped profiles exhibit a clear decreasing trend.
The beam waist radius and center position of the incident Gaussian beam remain consistent with those in Section 3.1.1. The output intensity distribution adopts three sets of M-shaped intensity functions defined by Equations (28), (29), and (30). Based on the design method proposed in this paper, the generatrix of the mirror is obtained. The polynomial coefficients of the mirror's generatrix are listed in Table 1.
As shown in Figure 7, the generatrix is divided with convex curves and concave curves alternating. This structure effectively spreads the high energy from the central area of the incident Gaussian beam outward to both sides, while guiding the edge beam to converge moderately, thereby collaboratively forming the required M-shaped light spot.
The generatrix equation was imported into SolidWorks using the same method to construct a freeform surface, then exported for non-sequential ray tracing simulation in Zemax. The optical path configuration used in ray tracing and the intensity distribution of the incident Gaussian beam are both consistent with those shown in Figure 4.
Detector 2 is enabled for intensity sampling, and the output beam profiles are illustrated in Figure 8. Along the x-direction, the intensity exhibits a bimodal structure, with peak-to-valley ratios of 7.95, 4.96, and 1.56, showing a stepwise decreasing trend. In contrast, along the y-direction, the intensity distribution retains its original Gaussian characteristics without any modulation. Although fitting errors lead to discrepancies between the design parameters and the actual peak-to-valley ratio of the output spot, this deviation does not affect the overall trend accuracy—the variation pattern of the M-shaped spot's peak-to-valley ratio is still correctly reflected. This gradient peak-to-valley ratio confirms the effectiveness of the proposed method: by predefining a target M-shaped intensity function, the peak-to-valley ratio of the output beam can be effectively controlled, enabling the generation of M-shaped spots with arbitrary specified peak-to-valley ratios.
3.2 Experiment
3.2.1 Freeform Mirror Design and Fabrication
To verify the effectiveness of the proposed design method, an integrator mirror with a diameter of 30 mm was developed based on this method. The working distance (defined as the distance from the integrator mirror to the target spot plane) was set at 300 mm, and the peak-to-valley ratio of the target output beam spot was 1.5. The initial toolpath is generated using a SolidWorks macro program, followed by tool radius compensation and kinematic correction in the computer-aided manufacturing (CAM) software DIFFSYS.
The freeform mirror is fabricated from 7075 aerospace Al–Mg alloy and precision-machined on a Moore 250UP ultra-precision single-point diamond turning (SPDT) machine under a constant ambient temperature of 20±0.5∘C. The machining parameters were set as follows: spindle speed = 2000 rpm, feed rate = 5 mm/min, and axial cutting depth = 2 μm. Interferometric measurements (ZYGO) revealed a surface roughness Sa of 12.3 nm across the entire aperture (as shown in Figure 9).
3.2.2 Optical Setup and Characterization
The light source is a helium–neon laser (wavelength λ = 632.8 nm). Its output beam is expanded and collimated to yield a Gaussian beam of 15 mm waist radius, maintaining a Gaussian irradiance distribution prior to incidence on the freeform mirror. The experimental optical path is illustrated in Figure 10(a). The collimated Gaussian beam irradiates the freeform reflector at an incident angle of 45°, with a fixed working distance of 300 mm between the mirror and the observation screen.
3.2.3 Results
The light spot images obtained from the experiment are converted into grayscale images. After baseline correction and linearization processing, the normalized light intensity distribution is calculated. Figure 11(a) shows the three-dimensional distribution of light intensity on the observation screen; Figure 11(b) presents the normalized light intensity profile curve along the cross-sectional direction (x-axis). The results indicate that the maximum and minimum normalized light intensities on this section are 0.996 and 0.778, respectively, corresponding to a peak-valley ratio of 1.28. Compared with the simulation results, the peak-valley ratio in the x-direction of the measured light spot slightly decreases, and the light intensity distribution in the y-direction deviates slightly from the ideal Gaussian contour.
4. Discussion
The difference between the design values and simulation results arises from surface fitting errors. The discrepancies between simulated and experimental results mainly result from the following four types of systematic errors: (1) interpolation error introduced during conversion of freeform surface shape data to the tool path; (2) processing errors caused by machine tool motion inaccuracy, tool wear, and thermal deformation during single-point diamond turning; (3) inherent aberrations of beam-expanding and collimating optical elements (e.g., lenses); and (4) axial and angular misalignment of optical components—such as mirrors and lenses—during optical path alignment. These factors collectively cause deviation between the measured light field and the theoretical expectation.
This study proposes a freeform mirror design that overcomes the limitations of conventional integrator optics—which can generate only uniform beam profiles. The proposed method supports one-dimensional intensity profile control and is extendable to laser cladding, welding, and additive manufacturing. Future work will focus on realizing two-dimensional arbitrary intensity profile generation, integrating high-order NURBS modeling with experimentally measured laser M² values to enhance industrial robustness.
5. Conclusions
This study proposes an energy-conserving freeform mirror design method for high-power industrial applications, addressing thermal distribution mismatches in laser phase-transformation hardening and cladding processes. The proposed method adopts a zonal energy mapping strategy: it divides the incident Gaussian beam into multiple subregions, independently redistributes irradiance within each subregion to form localized M-shaped distributions with identical peak-to-valley ratios, and finally superimposes them to generate the desired spot profile. Compared to conventional full-aperture energy redistribution approaches, this segmented shaping strategy significantly suppresses error accumulation during numerical inversion, thereby enhancing spatial accuracy and consistency in beam shaping. This design paradigm is particularly suitable for complex industrial scenarios requiring stringent control over irradiance uniformity, thermal flux, and scanning adaptability. Subsequent work will extend this method to generate arbitrary two-dimensional irradiance intensity distributions, supporting the engineering implementation of complex laser heat treatment.
Author Contributions
Conceptualization, Y.H. and X.Z.; methodology, Y.H.; software, Y.T.; validation, X.Z., Y.T., and B.C.; formal analysis, Y.H., X.Z.; investigation, B.C.; resources, B.C.; data curation, Y.H.; writing—original draft preparation, Y.H.; writing—review and editing, Y.T.; visualization, Y.T.; supervision, X.Z.; project administration, X.Z.; funding acquisition, B.C. All authors have read and agreed to the published version of the manuscript.
Funding
This research was funded by National Natural Science Foundation of China (62275187, 62375196, 61875145); The Natural Science Foundation of the Jiangsu Higher Education Institutions of China (22KJA140002); Suzhou Industrial Foresight and Key Core Technology Project (SYC2022145); Jiangsu Province ‘14th Five-Year Plan’ key discipline Project (2021135); Suzhou Key Laboratory of Optical Precision Testing Technology (SZS201202); Graduate Research and Innovation Projects of Jiangsu Province (KYCX243429).
Data Availability Statement
The original contributions presented in this study are included in the article. Further inquiries can be directed to the corresponding authors.
Conflicts of Interest
The authors declare no conflicts of interest.
References
- Yu, G.; Wang, H.; He, X.L. Laser surface hardening technology with specific intensity distribution. Chin. J. Lasers 2009, 36(2), 480–486. [Google Scholar] [CrossRef]
- Chen, X.; Deng, J.; Cheng, Y.; Geng, J.; Zhou, J. Study on the microstructure and high-temperature friction properties of Ni-Co alloy high-speed laser cladding for turbine valve stem. J. Therm. Spray. Technol. 2026, 35, 1667–1688. [Google Scholar] [CrossRef]
- Zhou, C.; Yang, H.; Li, H.; Zhu, C.; Guo, H.; Liu, H.; Liu, H.; Hao, J. Effect of dilution rate control on the wear resistance of laser-cladded Fe-Mn-C alloy coatings. Surf. Coat. Technol. 2026, 534, 133691. [Google Scholar] [CrossRef]
- Wu, G.; Chen, B.S. Effects of laser scanning parameters on the uniformity of hardened case distribution. Trans. Mater. Heat Treat. 2003, 24(3), 84–87. [Google Scholar]
- Li, L.; Huai, Y.; Wang, X. Analysis of simulation process in laser additive manufacturing. Manuf. Technol. Mach. Tool. 2019, 6, 6. [Google Scholar]
- Nasrollahi, V.; Penchev, P.; Batal, A.; et al. Laser drilling with a top-hat beam of micro-scale high aspect ratio holes in silicon nitride. J. Mater. Process. Technol. 2020, 277(3), 116636. [Google Scholar] [CrossRef]
- Wu, W.; Wang, C.; Pivnenko, M.; Chang, X.; Chu, D. Liquid-crystal-based diffractive optical elements with high Pancharatnam-Berry phase accuracy for holographic displays fabricated using an optimized liquid crystal on silicon device. Appl. Opt. 2025, 64, B13–B19. [Google Scholar] [PubMed]
- Zhou, G.Y.; Yuan, X.C.; Dowd, P. Design of diffractive phase elements for beam shaping: Hybrid approach. J. Opt. Soc. Am. 2001, 18(4), 791–799. [Google Scholar] [CrossRef]
- Liu, J.S.; Taghizadeh, M.R. Iterative algorithm for the design of diffractive phase elements for laser beam shaping. Opt. Lett. 2002, 27(16), 1463–1465. [Google Scholar] [CrossRef] [PubMed]
- Lin, Y.; Hu, J.S.; Wu, K.N. Algorithm for the design of diffractive optical elements for laser beam shaping. Acta Opt. Sin. 2007, 27(9), 1682–1686. [Google Scholar]
- Soria-Garcia, A.; Sanchez-Brea, L.M.; del Hoyo, J.; Torcal-Milla, F.J.; Gomez-Pedrero, J.A. Fourier series diffractive lens with extended depth of focus. Opt. Laser Technol. 2023, 164, 109491. [Google Scholar] [CrossRef]
- Liu, C.; Guo, Y.L. Flat-top line-shaped beam shaping and system design. Sensors 2022, 22(11), 4199. [Google Scholar] [CrossRef] [PubMed]
- Shen, X.H.; Kong, L.B.; An, J.T. Beam shaping for two-dimensional laser array by a computational model. Opt. Lasers Eng. 2023, 169, 107755. [Google Scholar] [CrossRef]
- He, Y.; Chen, B.H.; Wu, Q.Y.; Tang, Y.H. Design of parabolic rotational surface array integral mirrors. Chin. J. Lasers 2026, 53(6), 0605006. [Google Scholar]
- Shealy, D. L.; Chao, S. H. Geometric optics-based design of laser beam shapers. Opt. Eng. 2003, 42(11), 3123–3138. [Google Scholar] [CrossRef]
- Organization for Standardization. ISO 13694:2018; Optics and Photonics—Lasers and Laser-Related Equipment—Test Methods for Laser Beam Power (Energy) Density Distribution. ISO copyright office: Vernier, Geneva, Switzerland, 2018.
Figure 1.
Schematic of the energy mapping relationship between the incident Gaussian beam and the target plane: the beam intensity distribution along the y-axis is divided into four equal subregions, each of which projects onto the same position on the x-axis in the target plane, thereby establishing a deterministic mapping relationship between the y-coordinate of the incident beam and the x-coordinate of the target spot.
Figure 1.
Schematic of the energy mapping relationship between the incident Gaussian beam and the target plane: the beam intensity distribution along the y-axis is divided into four equal subregions, each of which projects onto the same position on the x-axis in the target plane, thereby establishing a deterministic mapping relationship between the y-coordinate of the incident beam and the x-coordinate of the target spot.
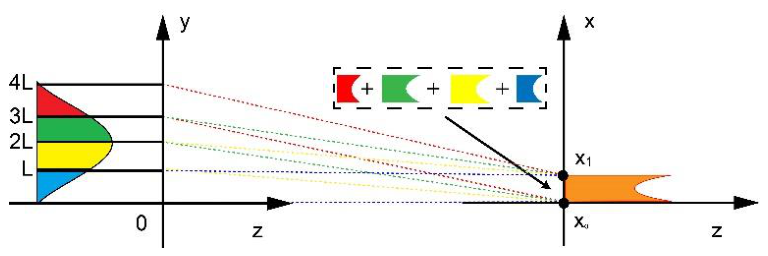
Figure 2.
Schematic illustration of the coordinate-mapping-based freeform mirror design principle.
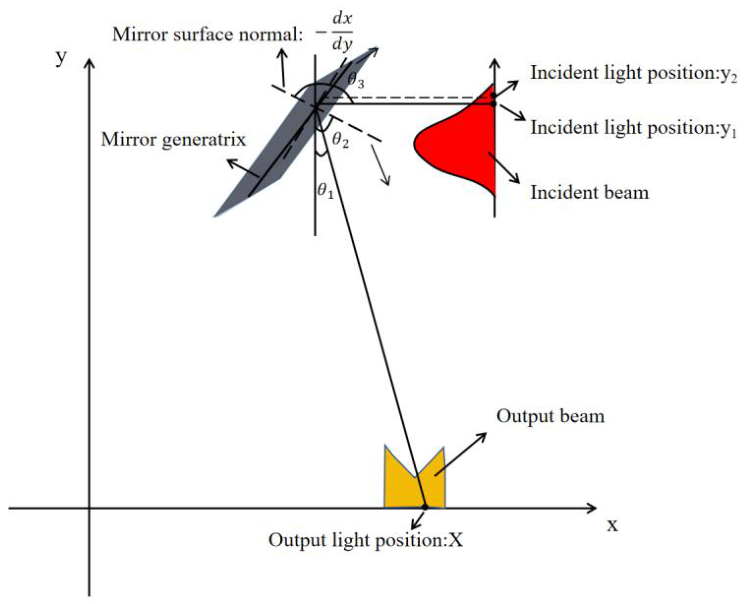
Figure 3.
Generatrix and three-dimensional model of a freeform mirror for achieving uniform beam distribution in the x-direction: (a) the mirror generatrix curve, where the red segment is convex (second derivative greater than zero) and the blue segment is concave (second derivative less than zero); (b) the three-dimensional model of the freeform mirror generated by horizontally stretching this generatrix.
Figure 3.
Generatrix and three-dimensional model of a freeform mirror for achieving uniform beam distribution in the x-direction: (a) the mirror generatrix curve, where the red segment is convex (second derivative greater than zero) and the blue segment is concave (second derivative less than zero); (b) the three-dimensional model of the freeform mirror generated by horizontally stretching this generatrix.
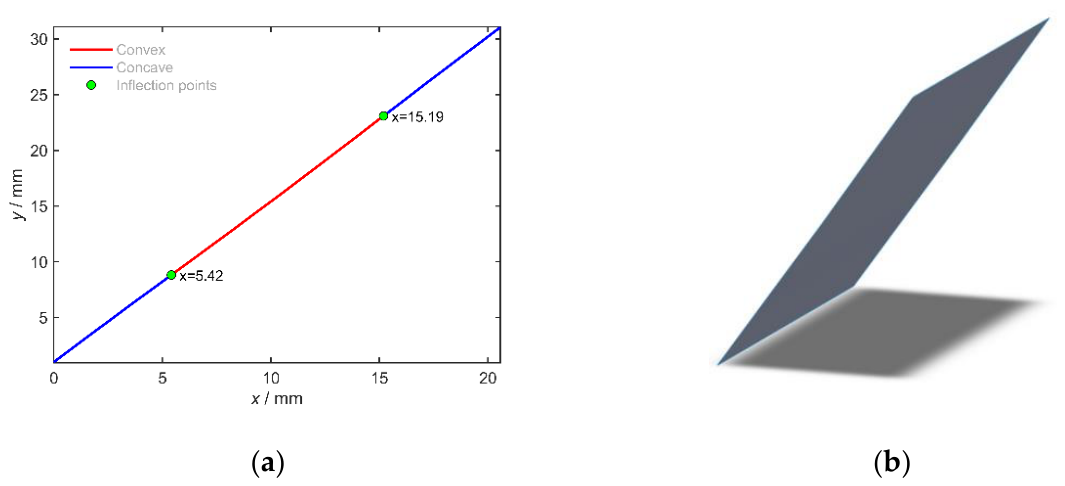
Figure 4.
Simulated optical path and incoherent irradiance distribution of Gaussian beam cross-section: (a) non-sequential ray tracing diagram of the freeform mirror beam shaping system; (b) incoherent irradiance distribution of the incident Gaussian beam in a two-dimensional cross-section; (c) incoherent irradiance profile along the x-direction in this cross-section.
Figure 4.
Simulated optical path and incoherent irradiance distribution of Gaussian beam cross-section: (a) non-sequential ray tracing diagram of the freeform mirror beam shaping system; (b) incoherent irradiance distribution of the incident Gaussian beam in a two-dimensional cross-section; (c) incoherent irradiance profile along the x-direction in this cross-section.
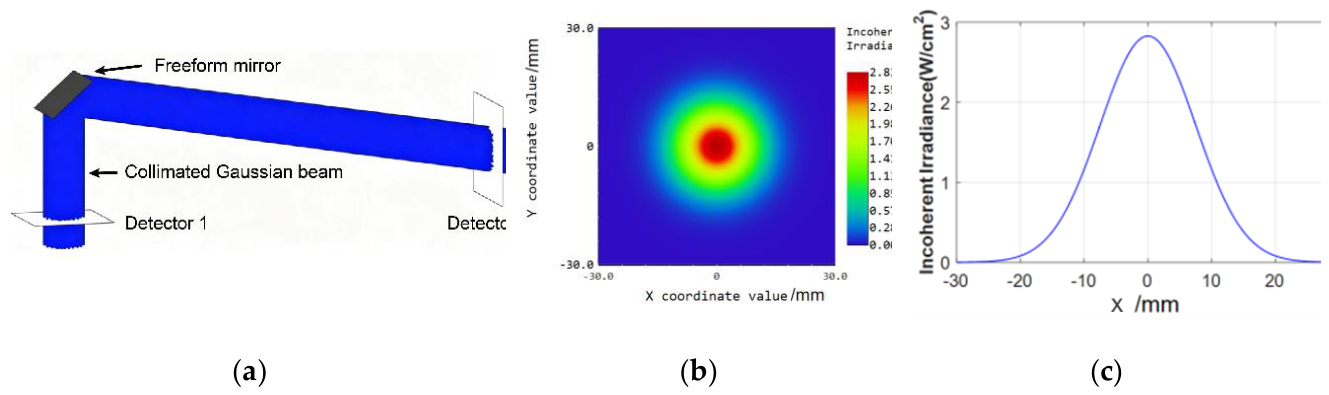
Figure 5.
Incoherent irradiance distribution of the shaped Gaussian beam on detector 2: (a) three-dimensional intensity distribution of the output spot; (b) incoherent irradiance profile in the x direction; (c) incoherent irradiance profile in the y direction.
Figure 5.
Incoherent irradiance distribution of the shaped Gaussian beam on detector 2: (a) three-dimensional intensity distribution of the output spot; (b) incoherent irradiance profile in the x direction; (c) incoherent irradiance profile in the y direction.
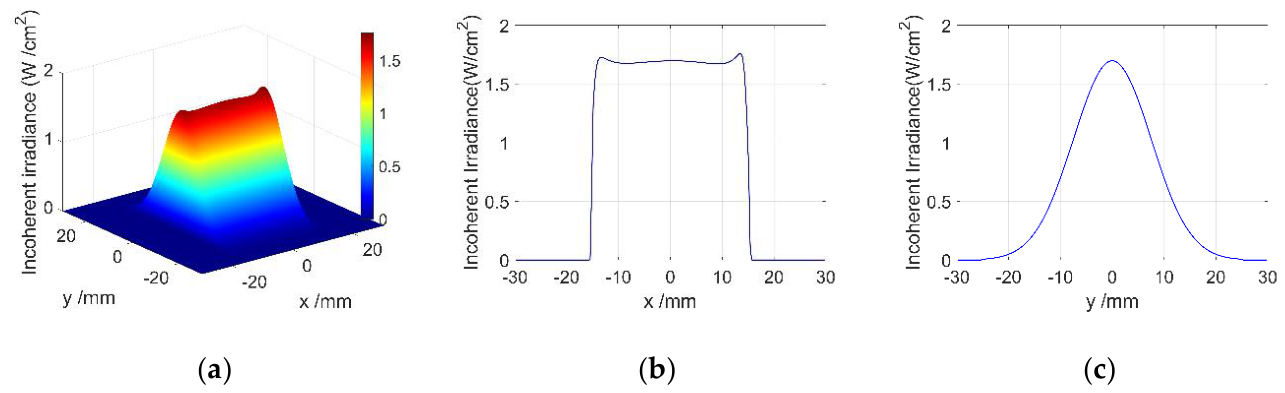
Figure 6.
Output M-shaped beam energy distribution curves: (a) M-shaped beam energy distribution curve with a peak ratio of 9; (b) M-shaped beam energy distribution curve with a peak ratio of 4.5; (c) M-shaped beam energy distribution curve with a peak ratio of 1.5.
Figure 6.
Output M-shaped beam energy distribution curves: (a) M-shaped beam energy distribution curve with a peak ratio of 9; (b) M-shaped beam energy distribution curve with a peak ratio of 4.5; (c) M-shaped beam energy distribution curve with a peak ratio of 1.5.
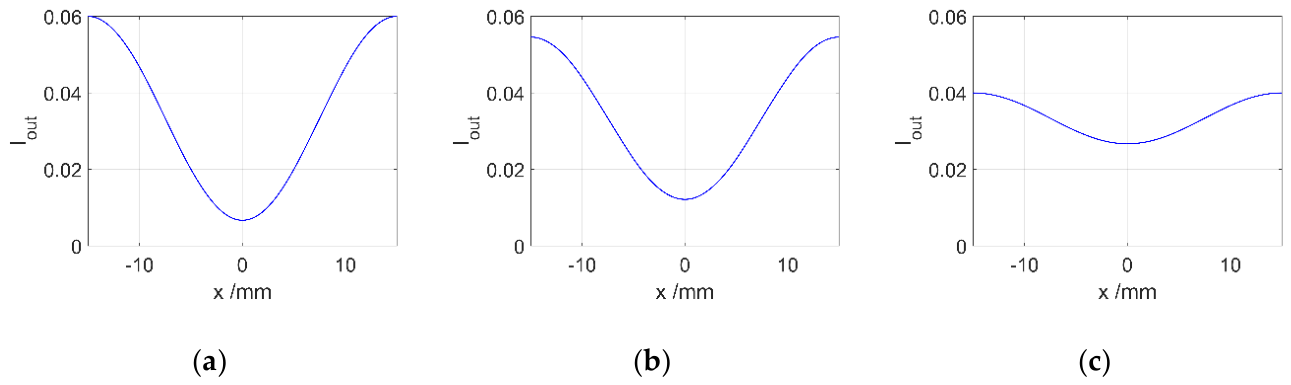
Figure 7.
Generatrix of the M-shaped spot mirror surface: (a) generatrix of an M-shaped spot mirror surface with a peak ratio of 9; (b) generatrix of an M-shaped spot mirror surface with a peak ratio of 4.5; (c) generatrix of an M-shaped spot mirror surface with a peak ratio of 1.5.
Figure 7.
Generatrix of the M-shaped spot mirror surface: (a) generatrix of an M-shaped spot mirror surface with a peak ratio of 9; (b) generatrix of an M-shaped spot mirror surface with a peak ratio of 4.5; (c) generatrix of an M-shaped spot mirror surface with a peak ratio of 1.5.
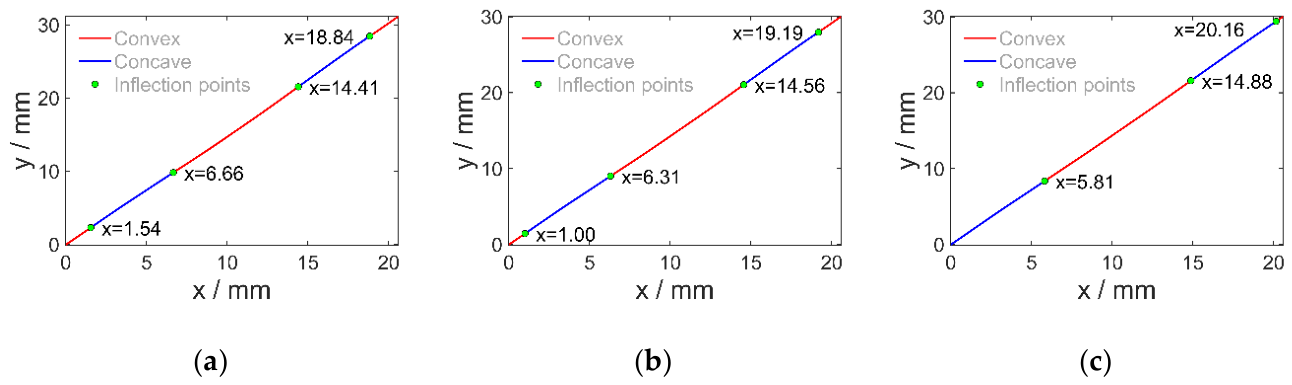
Figure 8.
Simulation results of the energy distribution for an M-shaped beam spot: (a)–(c) show the three-dimensional energy distribution, x-direction cross-sectional energy distribution curve, and y-direction cross-sectional energy distribution curve corresponding to a peak ratio of 7.95; (d)–(f) present the same for a peak-to-valley ratio of 4.96; (g)–(i) present the same for a peak-to-valley ratio of 1.56.
Figure 8.
Simulation results of the energy distribution for an M-shaped beam spot: (a)–(c) show the three-dimensional energy distribution, x-direction cross-sectional energy distribution curve, and y-direction cross-sectional energy distribution curve corresponding to a peak ratio of 7.95; (d)–(f) present the same for a peak-to-valley ratio of 4.96; (g)–(i) present the same for a peak-to-valley ratio of 1.56.
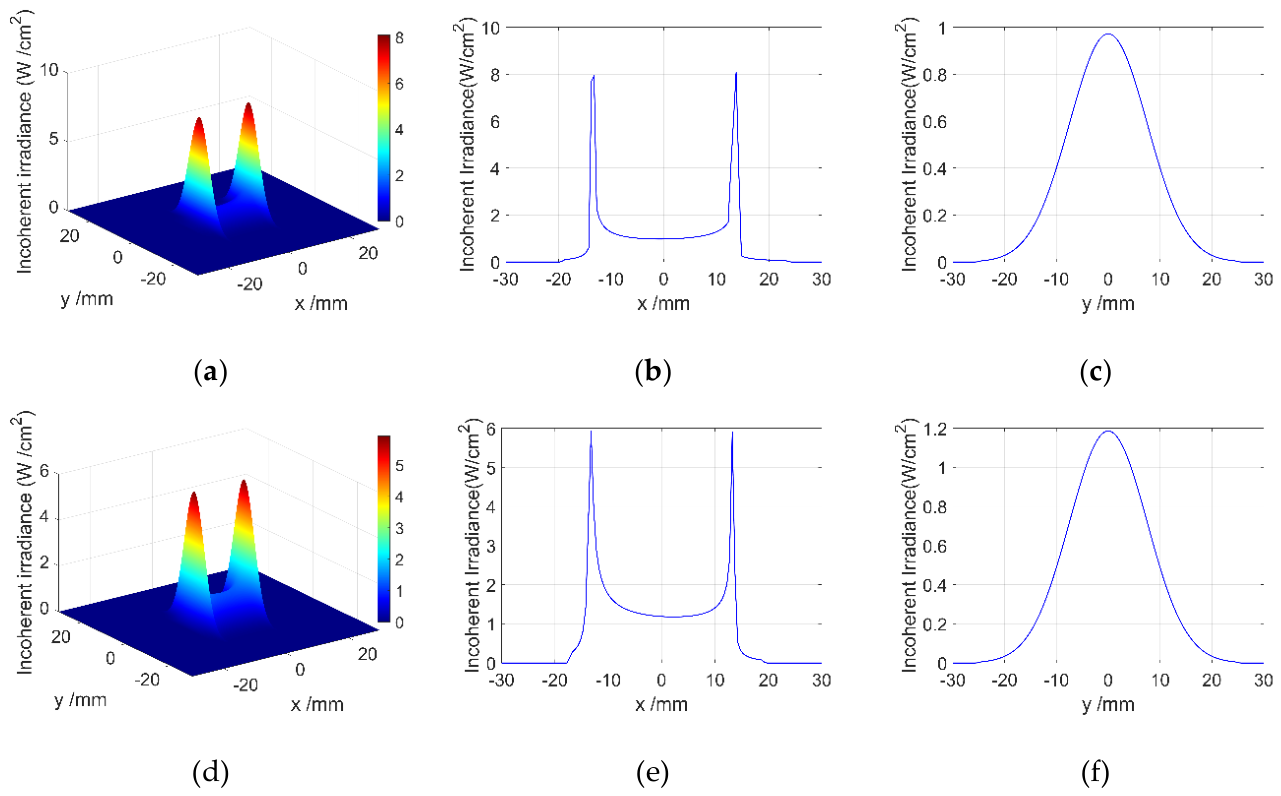
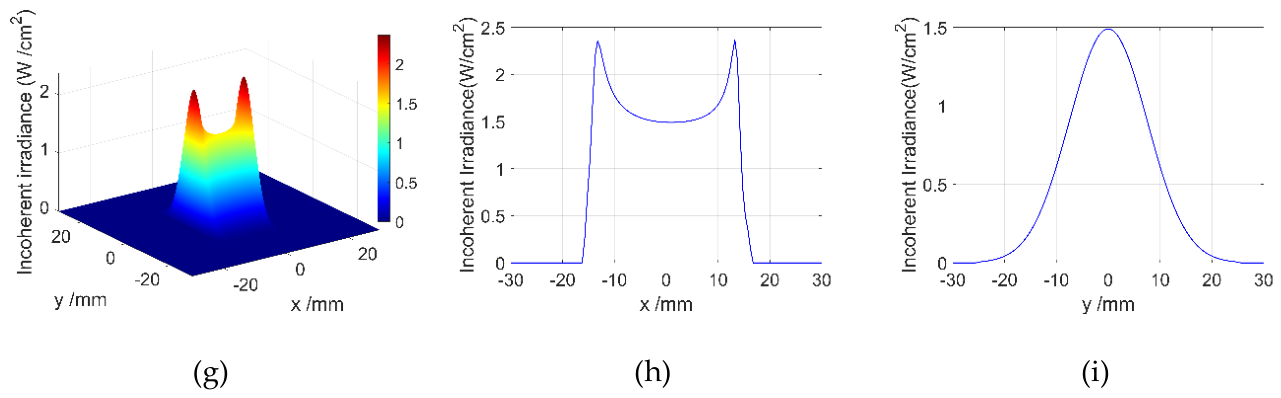
Figure 9.
A freeform mirror with a peak-to-valley ratio of 1.5 for the target output beam spot after processing.
Figure 9.
A freeform mirror with a peak-to-valley ratio of 1.5 for the target output beam spot after processing.
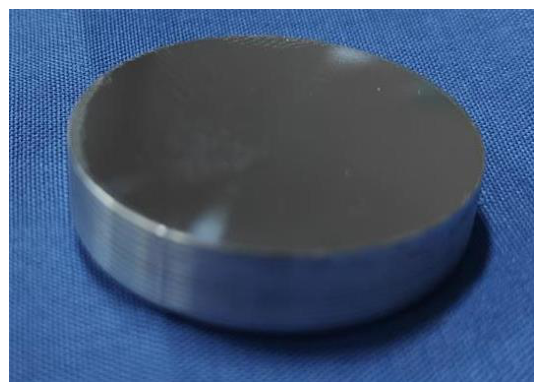
Figure 10.
Experimental optical setup and the shaped beam spot: (a) experimental optical setup; (b) beam spot on the observation screen.
Figure 10.
Experimental optical setup and the shaped beam spot: (a) experimental optical setup; (b) beam spot on the observation screen.
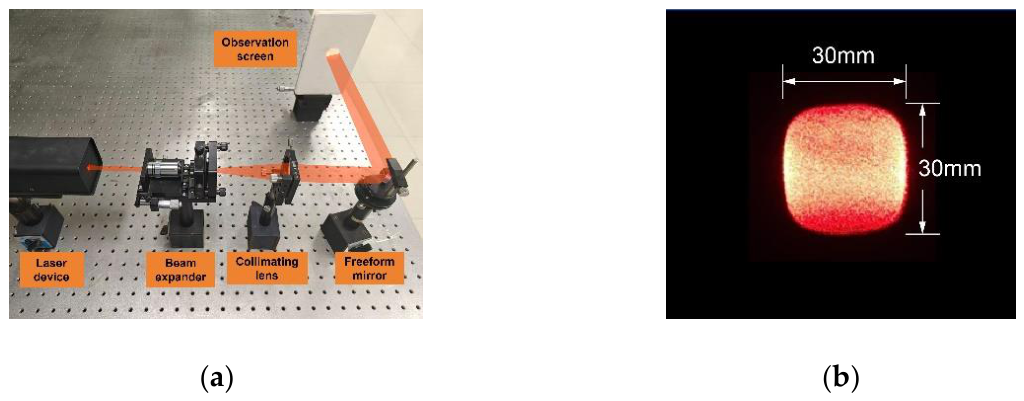
Figure 11.
Normalized intensity distribution of the spot on the observation screen experimentally measured: (a) three-dimensional normalized intensity distribution of the output spot; (b) normalized intensity profile along the x-axis; (c) normalized intensity profile along the y-axis.
Figure 11.
Normalized intensity distribution of the spot on the observation screen experimentally measured: (a) three-dimensional normalized intensity distribution of the output spot; (b) normalized intensity profile along the x-axis; (c) normalized intensity profile along the y-axis.
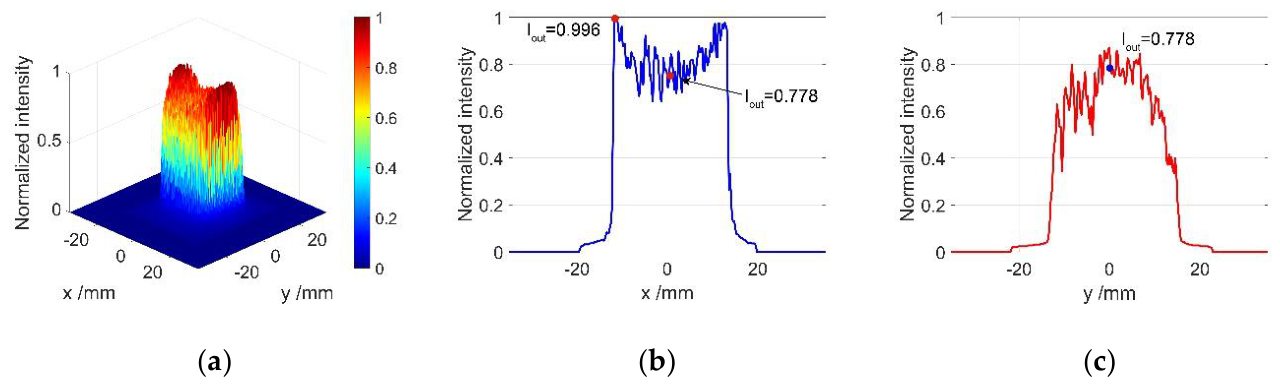

Table 1.
Polynomial coefficients for fitting the generatrix of a freeform mirror surface.
| Polynomial coefficients | Uniform distribution in the x direction | M-shaped intensity distribution with a peak ratio of 9 | M-shaped intensity distribution with a peak ratio of 3 | M-shaped intensity distribution with a peak ratio of 1.5 |
|---|---|---|---|---|
| a0 | 0 | 0 | 0 | 0 |
| a1 | 1.474782 | 1.474782 | 1.445977 | 1.466788 |
| a2 | -7.236737×10⁻³ | 2.4577×10⁻² | 1.022099×10⁻² | -2.208489×10⁻³ |
| a3 | -2.757161×10⁻⁶ | -7.069193×10⁻³ | -4.24821×10⁻³ | -1.359362×10⁻³ |
| a4 | 7.135102×10⁻⁵ | 5.980609×10⁻⁴ | 4.409266×10⁻⁴ | 2.021627×10⁻⁴ |
| a5 | -3.545972×10⁻⁶ | -8.603938×10⁻⁶ | -1.329364×10⁻⁵ | -8.103409×10⁻⁶ |
| a6 | 1.989075×10⁻⁸ | -8.02189×10⁻⁷ | -1.558743×10⁻⁷ | 2.779391×10⁻⁸ |
| a7 | 1.00007×10⁻⁹ | 2.392583×10⁻⁸ | 9.453538×10⁻⁹ | 2.667635×10⁻⁹ |
Disclaimer/Publisher’s Note: The statements, opinions and data contained in all publications are solely those of the individual author(s) and contributor(s) and not of MDPI and/or the editor(s). MDPI and/or the editor(s) disclaim responsibility for any injury to people or property resulting from any ideas, methods, instructions or products referred to in the content. |
© 2026 by the authors. Licensee MDPI, Basel, Switzerland. This article is an open access article distributed under the terms and conditions of the Creative Commons Attribution (CC BY) license.
Copyright: This open access article is published under a Creative Commons CC BY 4.0 license, which permit the free download, distribution, and reuse, provided that the author and preprint are cited in any reuse.