

Submitted:
28 July 2026
Posted:
29 July 2026
You are already at the latest version
Abstract
Winam Gulf, a shallow bay of Lake Victoria Kenya is increasingly affected by anthropogenic activities that alter the water quality of the Gulf. The purpose of the study was to understand the key environmental drivers of the phytoplankton communities of Winam Gulf of Lake Victoria, Kenya. Environmental variables such as temperature, dissolved oxygen, pH, total dissolved solids, water transparency, and electrical conductivity were determined in-situ, while nutrients such as Total Phosphorus, Total Nitrogen, Nitrates, Nitrites and Ammonia were analyzed in the laboratory using standard methods. Phytoplankton samples were collected, identified and counted under a microscope, and various indices, such as the Shannon-Wiener diversity index, were calculated. Statistical analyses, including Repeated analysis of variance, Principal Component Analysis, Canonical Correspondence Analysis, and Non-Metric Multidimensional Scaling, were performed to understand the spatial and temporal differences of the environmental variables and phytoplankton. The data were further subjected to Spearman's correlation and Mantel tests to explore the relationship between phytoplankton and environmental variables. Influence category had a highly significant effect on water depth TDS, EC, dissolved oxygen, biochemical oxygen demand, pH, Secchi depth and total nitrogen. Season significantly influenced temperature, TDS), EC dissolved oxygen, BOD, pH, Secchi depth, nitrite, nitrate, ammonia nitrogen, soluble reactive phosphorus, and total nitrogen. Significant interaction effects between influence category and season were detected for TDS, dissolved oxygen, pH, Secchi depth, and total nitrogen). These interactions indicate that the magnitude of seasonal changes differed among influence categories. In this study, 34 phytoplankton genera belonging to 5 different phyla were recognized. These include Cyanophyta, Bacillariophyta, Chlorophyta, Charophyta and Dinophyta, with Cyanophyta accounting for the largest percentage of phytoplankton at 44.1%. The order of dominance was Cyanophyta > Chlorophyta > Bacillariophyta > Charophyta > Dinophyta. The results showed considerable spatial and temporal variation in environmental factors as well as phytoplankton populations. Nutrient levels, especially total phosphorus, electrical conductivity, dissolved oxygen, pH and temperature, are among the key drivers of phytoplankton communities in the Winam Gulf of Lake Victoria, Kenya.
Keywords:
phytoplankton
; environmental variables
; Winam Gulf
; Lake Victoria
; eutrophication
INTRODUCTION
Phytoplankton assemblages constitute one of the most diverse taxa, consisting of more than 20,000 living species inhabiting aquatic habitats (Kruk et al., 2017). These microorganisms are tiny in size and constitute the base of the aquatic food web, sustaining other organisms with respect to energy and material input, hence significantly contributing to global primary production (Adhiambo, 2017; Yongo et al., 2023). They serve as primary producers in aquatic environments, fixing carbon and releasing oxygen through photosynthesis, and thereby playing an important role in biogeochemical cycles and ecosystem stability (X. Liu et al., 2026). Thus, alterations in the phytoplankton community will inevitably affect the community structure of higher trophic levels (Wu et al., 2012). The composition, diversity and abundance of phytoplankton communities are greatly affected by environmental factors, which makes them bioindicators of ecosystem condition (Aura et al., 2020). This is due to their short generation times (Miruka et al., 2021) and sensitivity to changes in environmental factors such as nutrient concentrations, temperature and light availability, which may alter phytoplankton dominance and further affect the whole food web (Škaloud et al., 2025). Phytoplankton community structure results from both stochastic and deterministic processes (Yi et al., 2024). Stochastic processes capture existence through chance and include dispersal limitation, ecological drift, and local extinctions; the role of randomness is higher when the environment is not selective (Isabwe et al., 2018). Deterministic processes, on the other hand, act as a natural sieve, whereby environmental variables such as temperature and nutrient availability determine which species survive; the species that competes well for resources and tolerates prevailing conditions thrives (Kraft et al., 2015). Interactions among environmental variables control phytoplankton community structure (Olokotum et al., 2021). Nitrogen and phosphorus limit algal growth in freshwater systems, whereas silica influences diatom populations. Temperature impacts metabolic rate and water stratification (Suba et al., 2024), while water transparency impacts euphotic zone depth. Seasonal variations in rainfall in tropical lakes can result in dramatic changes in these parameters, favoring cyanobacteria, which multiply in warm, nutrient-rich and stratified waters. The availability of light for phytoplankton depends on water transparency, mixing layer depth, and solar radiation (Q. Liu et al., 2025).
Lake Victoria is the second largest freshwater lake globally and the largest in Africa. It is an important source of food, energy, and water for drinking, irrigation and agriculture, as well as a dumping ground for human, agricultural and industrial wastes (Lawrence et al., 2023). The lake has undergone several ecosystem changes over the past decades that have affected its ecological system and climate-sensitive operations (Outa et al., 2020), mainly due to anthropogenic and climatic changes in East Africa, making these interactions an important concern since the early 21st century (Aura et al., 2022). The lake has undergone nutrient accumulation, leading to a change in its trophic state from oligotrophic to eutrophic, and in some regions, such as Winam Gulf, to hypereutrophic (Musinguzi et al., 2019). Eutrophication is one of the major environmental concerns because it results in biodiversity changes in the lake (Nyakeya et al., 2022).
The persistent deterioration of ecological processes in Lake Victoria has significant long-term impacts on the ecosystem services it provides, including its role as a site of high biological diversity, and affects the socio-economic wellbeing of people living in nearby countries. Notable changes in the lake include increased phytoplankton productivity (Hecky & Bugenyi, 1992) and the dominance of cyanobacteria over diatoms in the planktonic algae (Kling et al., 2001), which leads to the production of toxic cyanotoxins (Brown et al., 2024a). These transformations of the phytoplankton community result from eutrophication caused by deforestation and agricultural intensification in the Lake Victoria basin, including the Kenyan part of the lake (Hecky & Bugenyi, 1992).
In the Kenyan part of Lake Victoria, the Winam Gulf is a case of a freshwater ecosystem under considerable anthropogenic pressure (Roegner et al., 2023). The gulf receives untreated and poorly treated sewage water from urban areas such as Kisumu City, as well as agricultural runoff from intensive farming in its catchment area (Brown et al., 2024b). These nutrient loads stimulate the occurrence of harmful algal blooms, mostly consisting of cyanobacteria. Despite growing recognition of Winam Gulf's water quality problems, quantitative understanding of how specific environmental factors drive phytoplankton community dynamics remains limited. This study therefore aimed to explore the role of environmental variables in shaping phytoplankton community dynamics in Winam Gulf of Lake Victoria, Kenya, specifically examining spatiotemporal variations in phytoplankton diversity and abundance in relation to key environmental variables, including nutrients, temperature, transparency, and dissolved oxygen. By identifying the primary environmental drivers of phytoplankton dynamics, this research seeks to inform water quality management strategies aimed at mitigating harmful algal blooms and improving the ecological health of Winam Gulf.
MATERIALS AND METHODS
Study Area and Sampling Stations
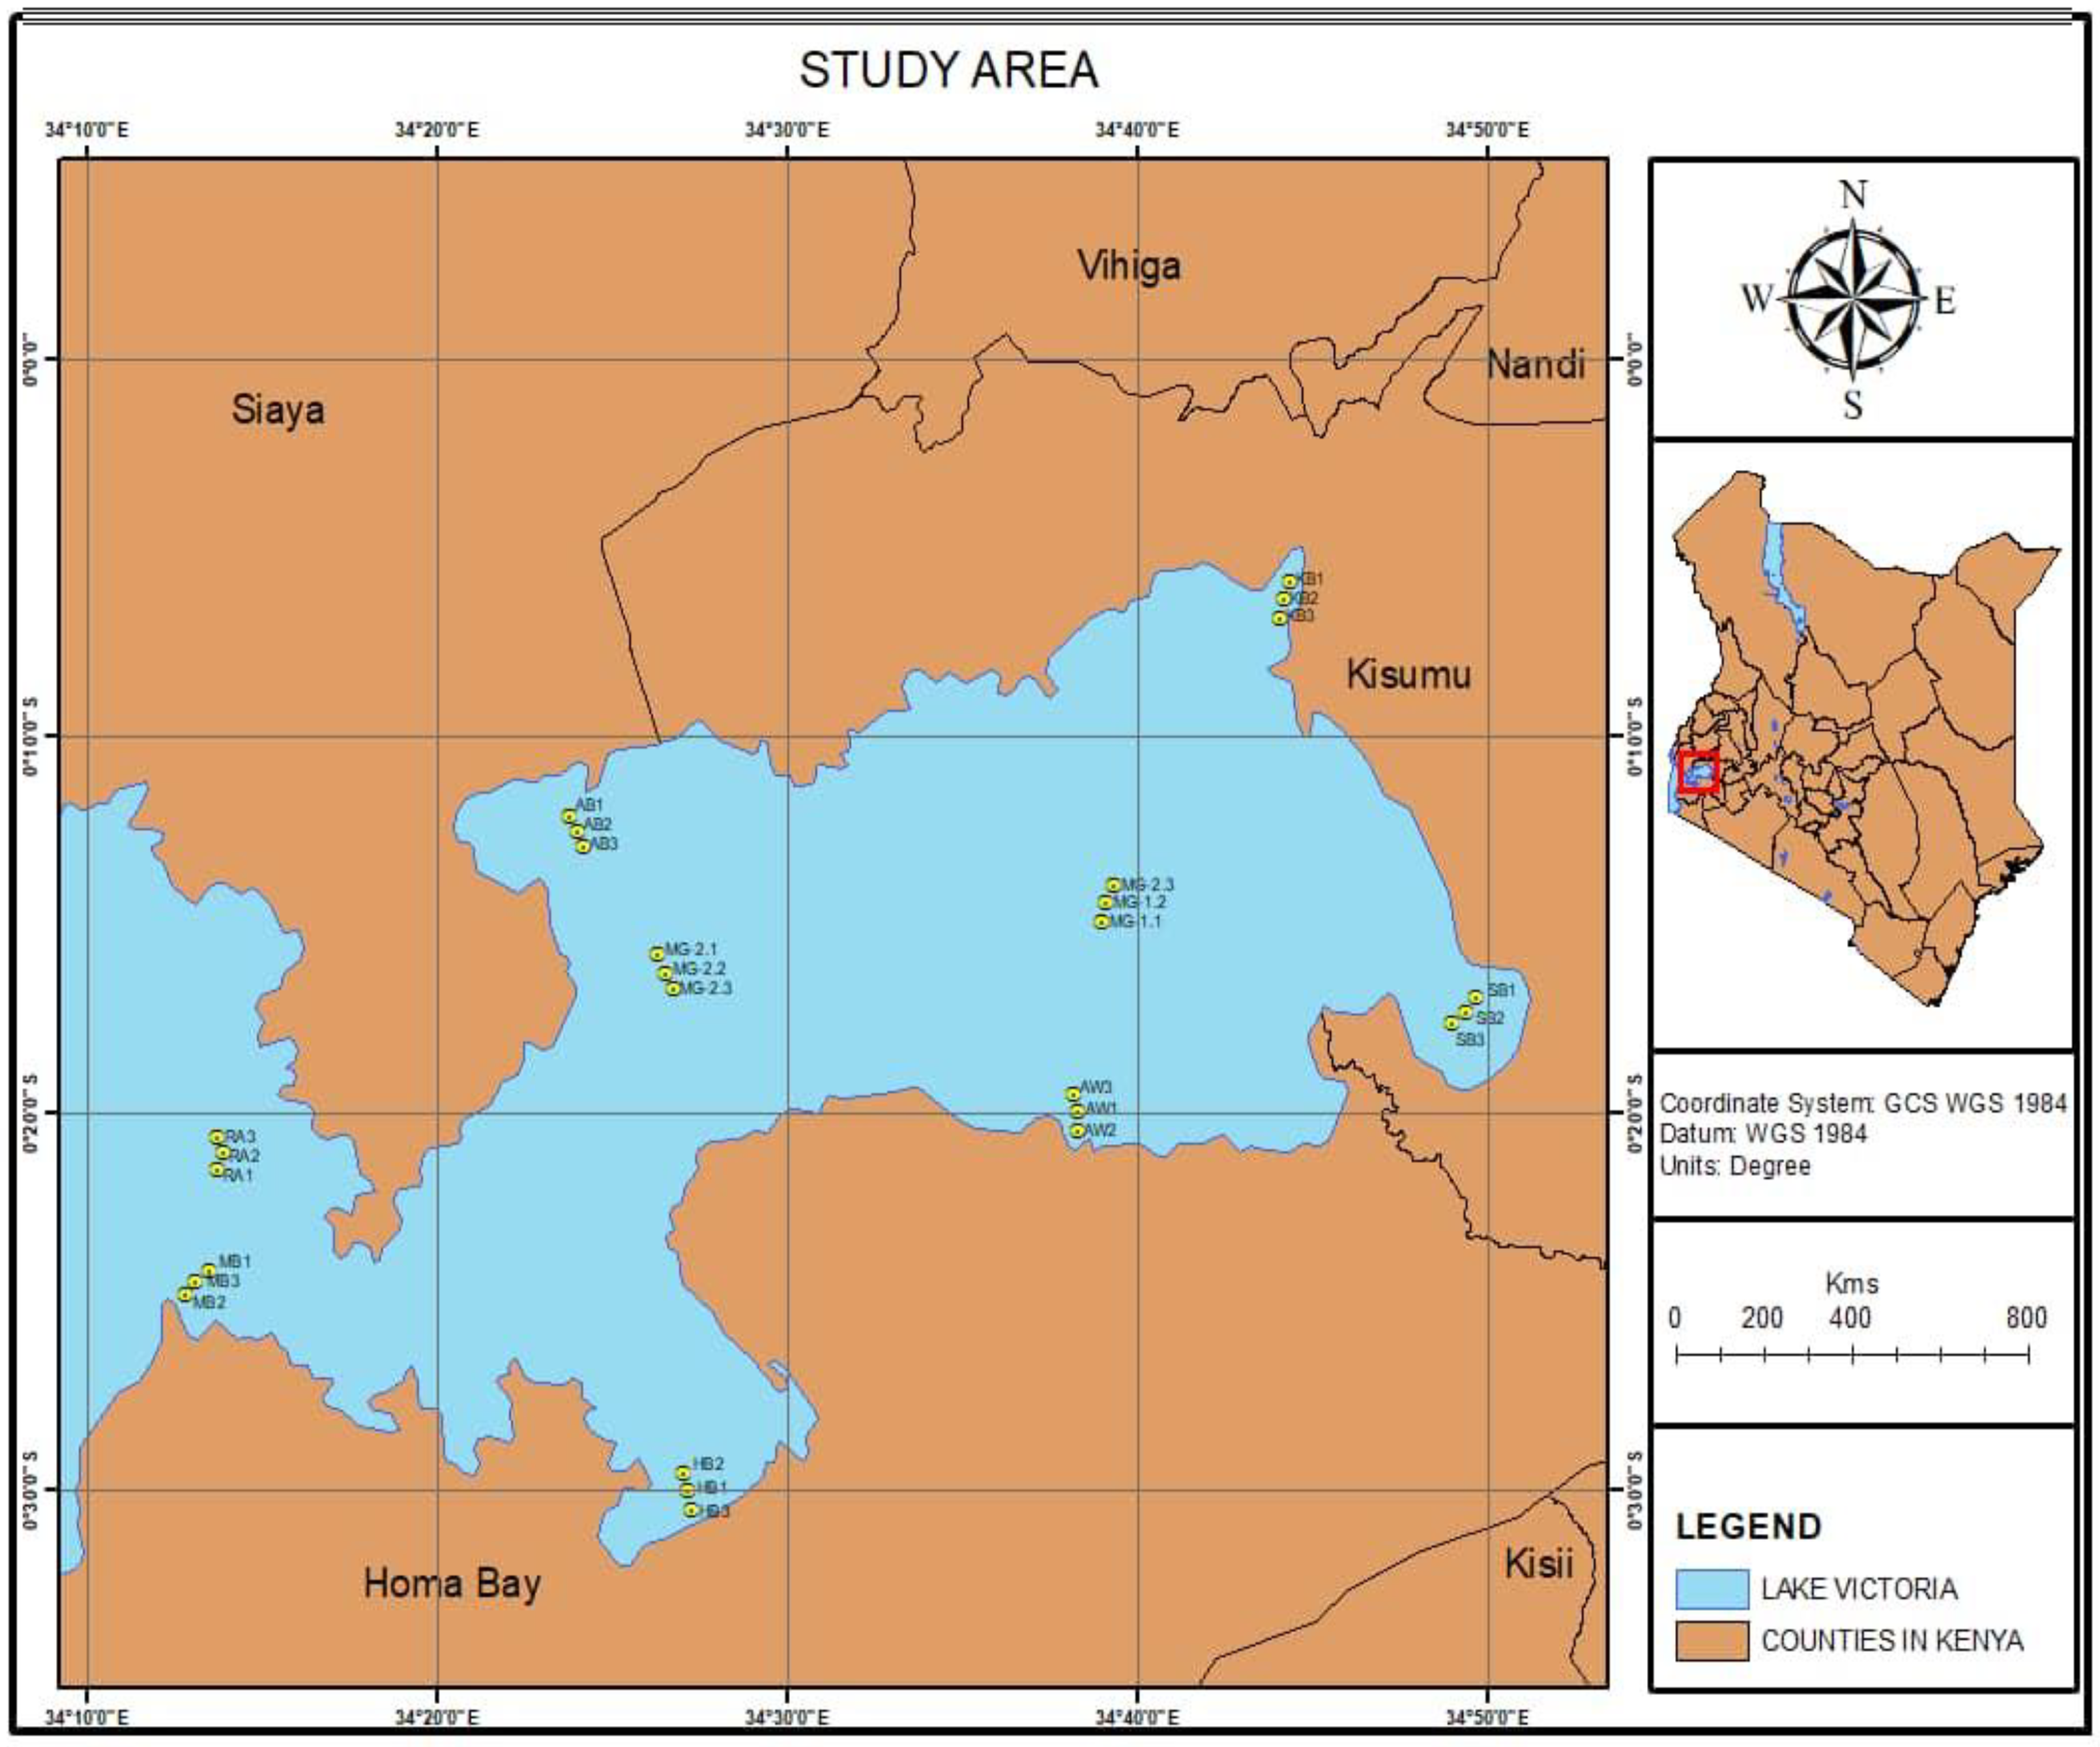
The section of Lake Victoria in Kenya lies south of the equator, between 00°6'S/00°32'S and 34°13'E/34°52'E, at an altitude of 1,134 m above sea level. This section occupies an area of 3,600 km², constituting 6% of the entire lake. Of this, 1,400 km² is taken up by the Winam Gulf, which occupies the northeastern part of the Kenyan section of the lake (Hart et al., 2025). The catchment area, also 3,600 km², is drained by five major rivers (Nzoia, Kuja, Nyando, Yala, and Sondu), which together account for about 30% of the total riverine inflow to Lake Victoria. The gulf is linked to the rest of Lake Victoria through the Rusinga Channel, which is 3 miles (4.8 km) wide (Roegner et al., 2023). The gulf is approximately 40 miles (64 km) long from the channel toward the eastern direction, with a width of 16 miles (25 km). It is a shallow depression with a mean depth of approximately 10 m and lies at an elevation of 1,134 m above sea level. The area has a tropical rainforest climate and receives ample rainfall, averaging 1,991 mm per year. In this study, nine stations were selected for sampling: Kisumu Bay, Sango Bay, Mid Gulf One, Mid Gulf Two, Asembo Bay, Awach, Homa Bay, Rusinga, and Mbita Bay, with three sampling sites at each station. The criteria for the selection of these sampling sites included land use and the source of pollution, including cropland, industrial, municipal and domestic waste disposal.
Figure 1.
Map of study area showing sampling sites.
Sampling Methods
Physical water quality parameters
Water quality parameters, including pH, dissolved oxygen, electrical conductivity, total dissolved solids and temperature, were analyzed in-situ at the selected sites using portable multi-parameter probes on each sampling day. Secchi depth was determined at all sites using a Secchi disk (APHA, 2017). Sub-surface water samples for nutrient analysis were collected in triplicate using water collectors at each sampling site and kept in 500 mL polypropylene containers acidified with 0.15 mL of concentrated sulfuric acid to preserve sample integrity. BOD samples were collected in airtight BOD bottles and incubated at 20°C in the dark for five days to avoid photosynthetic oxygen production. For phytoplankton samples, sub-surface water was collected in triplicate using a conical phytoplankton net with a 25 μm mesh size and a 30 cm aperture, and kept in 500 mL polypropylene containers. Phytoplankton samples were fixed using 10 mL of Lugol's iodine solution to preserve cell structure for microscopic identification. All collected samples were kept in a cooler box and transported to the University of Eldoret laboratory for analysis (APHA, 2017).
Laboratory analysis
Phytoplankton were identified to the lowest possible taxonomic level (genus) using taxonomic keys and then counted. Soluble reactive phosphorus (SRP) content in water was tested by the ascorbic acid method, while total phosphorus (TP) was determined following acid persulfate digestion and analysis using the same method (APHA, 2017). Ammonium (NH4+-N) was tested using the salicylate-isocyanurate method (APHA, 2017). Nitrite (NO2-N) content was determined colorimetrically, while nitrate (NO3-N) was determined following the cadmium reduction method (APHA, 2017). BOD was determined using the 5-day biochemical oxygen demand test (APHA, 2017).
Determination of Phytoplankton Diversity and Dominance
Shannon-Wiener's Diversity Index (H), Pielou's Evenness Index (J), Margalef's Richness Index (D), and Simpson's Dominance Index were employed to assess the ecological properties of the phytoplankton community:
H = −Σ(Pi ln Pi), i = 1 to S
J = H / Hmax
D = (S − 1) / ln N
Where Ni is the number of individuals of species i in the samples, N is the total number of individuals of all species in the samples, fi is the frequency of occurrence of a specific species, Pi is the proportion of individuals of species i, Hmax is the maximum species diversity (Hmax = log₂S), and S is the total number of species in the samples.

Table 1.
Criteria for grouping influence categories of the sampling sites.
| S/N | Influence categories | Stations | Dominant Land Use / Human Activity |
|---|---|---|---|
| 1 | Urban | Kisumu Bay, Homa Bay | Urban settlements, municipal discharge, fish landing beaches, domestic waste input, industrial and commercial activities |
| 2 | River-influenced | Sango Bay, Asembo Bay, Awach | River inflow zones, agricultural runoff, catchment erosion, small-scale farming, rural settlements |
| 3 | Transitional | Mid Gulf One, Mid Gulf Two | Mixed land use, moderate fishing activity, scattered settlements, transitional nearshore-offshore influence |
| 4 | Offshore | Mbita Bay, Rusinga Channel | Open-water conditions, limited direct catchment influence, relatively low anthropogenic disturbance, offshore fisheries activity |
Statistical Analysis
The spatial distributions of environmental variables, phytoplankton density and diversity were interpolated using ArcGIS 10.8 (ESRI, Redlands, CA, USA). Data were subjected to tests for normality (Shapiro-Wilk test) and homogeneity of variances (Levene's test). Environmental variable data were found not to be normally distributed and were therefore transformed to satisfy the assumption of normality. Variations in the spatial and seasonal distributions of environmental variables by repeated measures ANOVA phytoplankton density and diversity were assessed using one-way analysis of variance (ANOVA). Count data on phytoplankton were subjected to log(x + 1) transformation, while all other response variables were log-transformed to satisfy the assumptions of normality. Non-metric multidimensional scaling (NMDS) was applied to visualize patterns of similarity or dissimilarity between phytoplankton communities. The seasonal distribution of the phytoplankton community was visualized using principal component analysis (PCA). Canonical correspondence analysis (CCA) was used to examine the effects of environmental variables on phytoplankton species composition, and the data were further subjected to Spearman's correlation and Mantel tests to examine the relationships between diversity indices, phytoplankton, and environmental factors.
RESULTS
Environmental Variables
The repeated measures ANOVA evaluated the effects of influence category, season, and their interaction on water quality parameters .Influence category had a highly significant effect on water depth (F = 20.05, p < 0.001), TDS (F = 54.93, p < 0.001), EC (F = 68.13, p < 0.001), dissolved oxygen (F = 42.41, p < 0.001), biochemical oxygen demand (F = 14.45, p < 0.001), pH (F = 4.46, p = 0.008), Secchi depth (F = 84.33, p < 0.001), and total nitrogen (F = 4.79, p = 0.006). In contrast, influence category had no significant effect on temperature, nitrite, ammonia nitrogen, total phosphorus, or soluble reactive phosphorus, while nitrate showed only a marginal effect (p = 0.053). Season significantly influenced most physicochemical variables. Highly significant seasonal effects were observed for temperature (F = 13.21, p < 0.001), TDS (F = 798.81, p < 0.001), EC (F = 7.21, p = 0.010), dissolved oxygen (F = 24.56, p < 0.001), BOD (F = 5.15, p = 0.028), pH (F = 29.67, p < 0.001), Secchi depth (F = 4.95, p = 0.031), nitrite (F = 7.87, p = 0.007), nitrate (F = 369.94, p < 0.001), ammonia nitrogen (F = 10.64, p = 0.002), soluble reactive phosphorus (F = 42.26, p < 0.001), and total nitrogen (F = 43.51, p < 0.001). No seasonal differences were detected for water depth (p = 1.000), while total phosphorus was not significantly affected by season (p = 0.055). Significant interaction effects between influence category and season were detected for TDS (F = 6.50, p < 0.001), dissolved oxygen (F = 5.57, p = 0.002), pH (F = 7.09, p < 0.001), Secchi depth (F = 9.71, p < 0.001), and total nitrogen (F = 9.66, p < 0.001). These interactions indicate that the magnitude of seasonal changes differed among influence categories. Conversely, no significant interaction effects were observed for water depth, temperature, EC, BOD, nitrite, ammonia nitrogen, total phosphorus, or soluble reactive phosphorus. The repeated measures ANOVA indicates that both spatial influence and seasonal variability strongly affected the physicochemical characteristics of Winam Gulf, with TDS, EC, dissolved oxygen, Secchi depth, and total nitrogen showing the greatest sensitivity to both spatial gradients and seasonal changes. Depth remained spatially structured but unchanged between seasons, whereas total phosphorus was comparatively stable across both influence categories and sampling
Table showing effect of influence category, season and interaction between season and influence on environmental variables repeated measures
| Variable | Influence_F | Influence_P | Season_F | Season_P | Interaction_F | Interaction_P |
| Depth | 20.05 | 0.0000 | 0.00 | 1.0000 | 0.00 | 1.0000 |
| Temp | 0.89 | 0.4516 | 13.21 | 0.0007 | 1.01 | 0.3956 |
| TDS | 54.93 | 0.0000 | 798.81 | 0.0000 | 6.50 | 0.0009 |
| EC | 68.13 | 0.0000 | 7.21 | 0.0100 | 0.04 | 0.9874 |
| DO | 42.41 | 0.0000 | 24.56 | 0.0000 | 5.57 | 0.0024 |
| BOD | 14.45 | 0.0000 | 5.15 | 0.0280 | 1.90 | 0.1432 |
| pH | 4.46 | 0.0078 | 29.67 | 0.0000 | 7.09 | 0.0005 |
| SecchiDepth | 84.33 | 0.0000 | 4.95 | 0.0311 | 9.71 | 0.0000 |
| NO2 | 1.23 | 0.3106 | 7.87 | 0.0073 | 0.51 | 0.6772 |
| NO3 | 2.76 | 0.0529 | 369.94 | 0.0000 | 2.71 | 0.0560 |
| NH3_N | 0.74 | 0.5344 | 10.64 | 0.0021 | 0.35 | 0.7872 |
| TP | 1.04 | 0.3825 | 3.87 | 0.0551 | 0.94 | 0.4287 |
| SRP | 1.37 | 0.2635 | 42.26 | 0.0000 | 1.16 | 0.3361 |
| TN | 4.79 | 0.0055 | 43.51 | 0.0000 | 9.66 | 0.0000 |
The spatial distribution maps (Figure 2) show that physicochemical parameters vary greatly across different areas of Winam Gulf. Urban and river-influenced sites showed high nutrient concentrations (TN, TP, SRP, NH₃-N, NO₂-N and NO₃-N) and, consequently, higher EC and BOD values, implying greater organic content and pressure toward eutrophication. In contrast, offshore sites had relatively lower nutrient concentrations and better water quality. The observed spatial trends underscore the effect of human activities on the ecosystem status of Winam Gulf.
Relationship between Physicochemical Variables and Sampling Sites
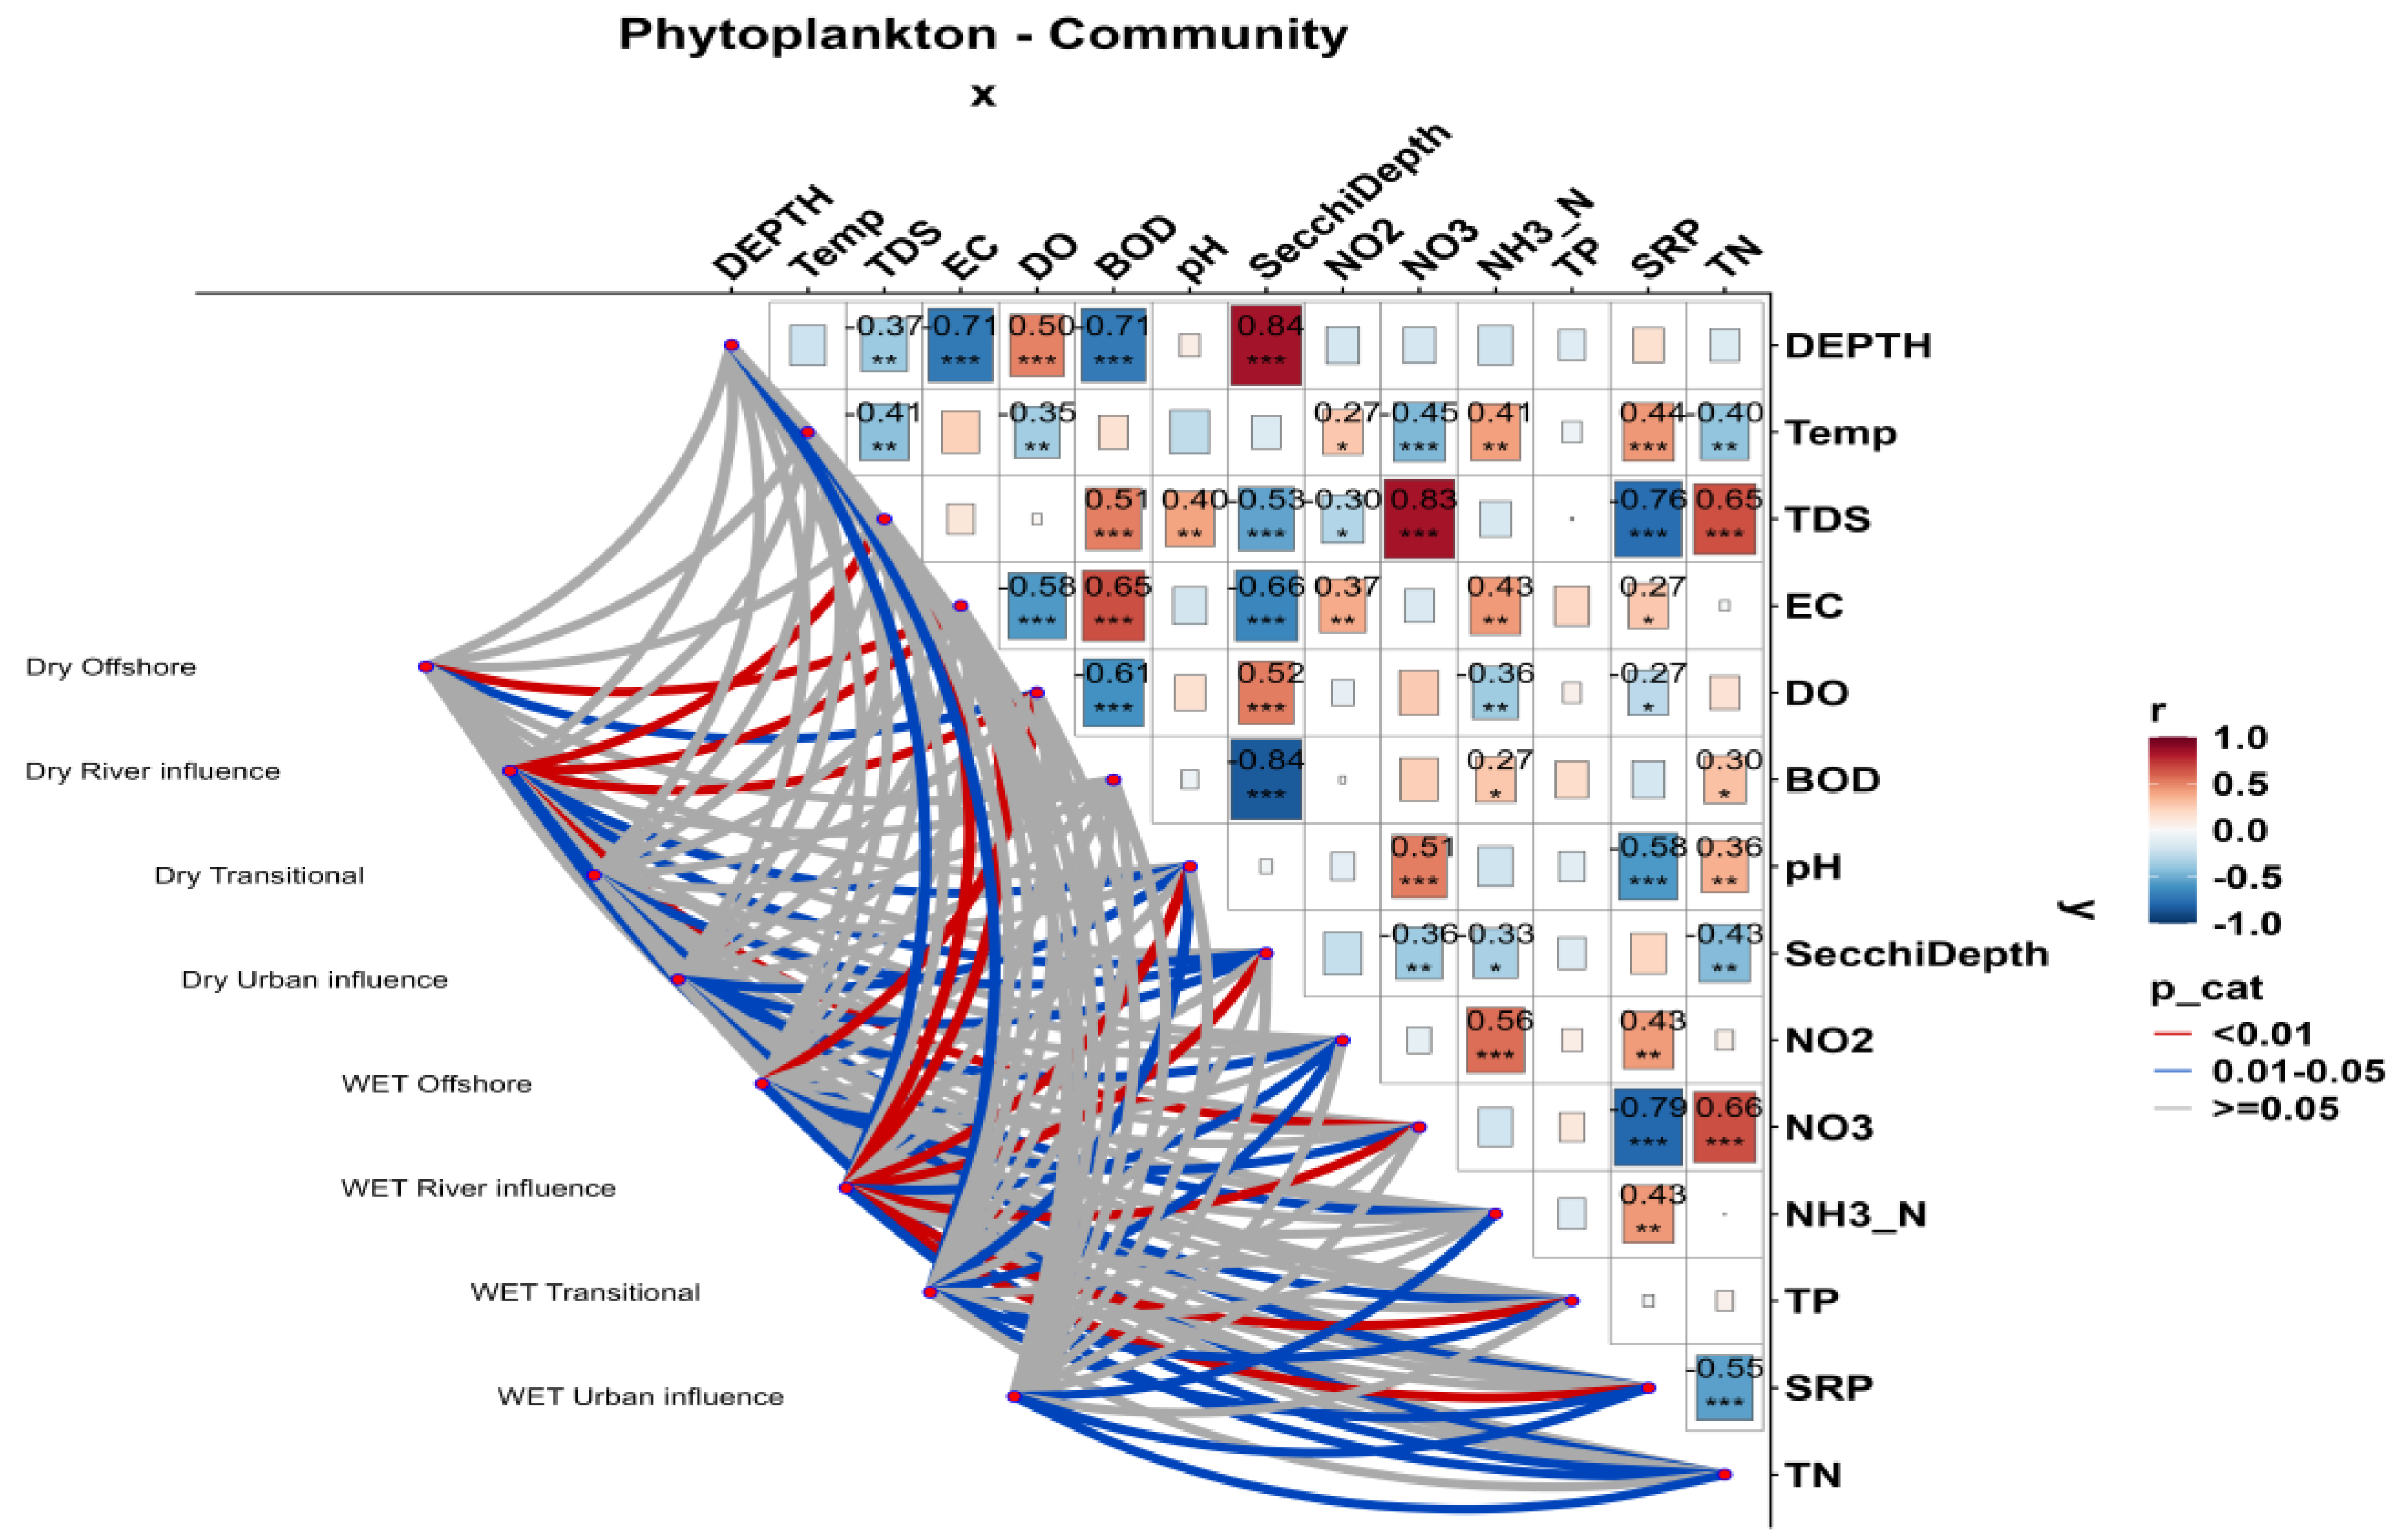
Principal component analysis (PCA) revealed clear spatial variation in environmental variables among the four habitat zones during the dry and wet seasons (Figure 4). During the dry season, the principal components explained 56.80% of the total variation in environmental conditions, with PC1 accounting for 37.71% and PC2 for 19.09%. Offshore stations were predominantly distributed along the positive side of PC1 and were closely associated with greater water depth, higher dissolved oxygen concentrations, and increased water transparency, as indicated by Secchi depth. In contrast, river-influenced stations were mainly located on the negative side of PC1 and were associated with elevated concentrations of nitrate (NO₃⁻N), nitrite (NO₂⁻N), total phosphorus (TP), and total dissolved solids (TDS). Urban-influenced stations clustered within the upper-left quadrant of the ordination and showed strong associations with biological oxygen demand (BOD) and temperature. Transitional stations were concentrated near the center of the ordination space, reflecting intermediate environmental conditions between offshore and nearshore habitats. Environmental vectors indicated that water depth, dissolved oxygen, and Secchi depth were positively correlated with PC1, whereas TDS, electrical conductivity (EC), TP, NO₃⁻N, and NO₂⁻N were negatively correlated with this axis. Along PC2, temperature and BOD exhibited positive loadings, while total nitrogen (TN) and dissolved oxygen showed negative loadings.
The wet season principal components explained 56.82% of the total environmental variation, with PC1 accounting for 38.85% and PC2 for 17.97%. A stronger separation among habitat zones was observed compared with the dry season. Offshore stations were clearly separated along the positive side of PC1 and were strongly associated with higher dissolved oxygen concentrations, greater water depth, and increased Secchi depth. River-influenced stations were concentrated around the central-left region of the ordination and were associated with elevated nutrient concentrations. Urban-influenced stations were located on the negative side of PC1 and showed strong associations with EC, TDS, TN, and BOD. Transitional stations occupied the upper-right quadrant and were strongly associated with soluble reactive phosphorus (SRP). Ordination vectors revealed that SRP contributed positively and dominantly to PC2, while dissolved oxygen, water depth, and Secchi depth contributed positively to PC1. Conversely, NO₃⁻N, NO₂⁻N, pH, TP, and NH₄⁺-N were negatively correlated with PC2, while EC, TDS, TN, and BOD exhibited negative correlations with PC1. The PCA ordinations demonstrated a pronounced environmental gradient extending from nutrient-rich, anthropogenically influenced nearshore habitats to deeper, clearer, and more oxygenated offshore waters.
Phytoplankton Community Structure
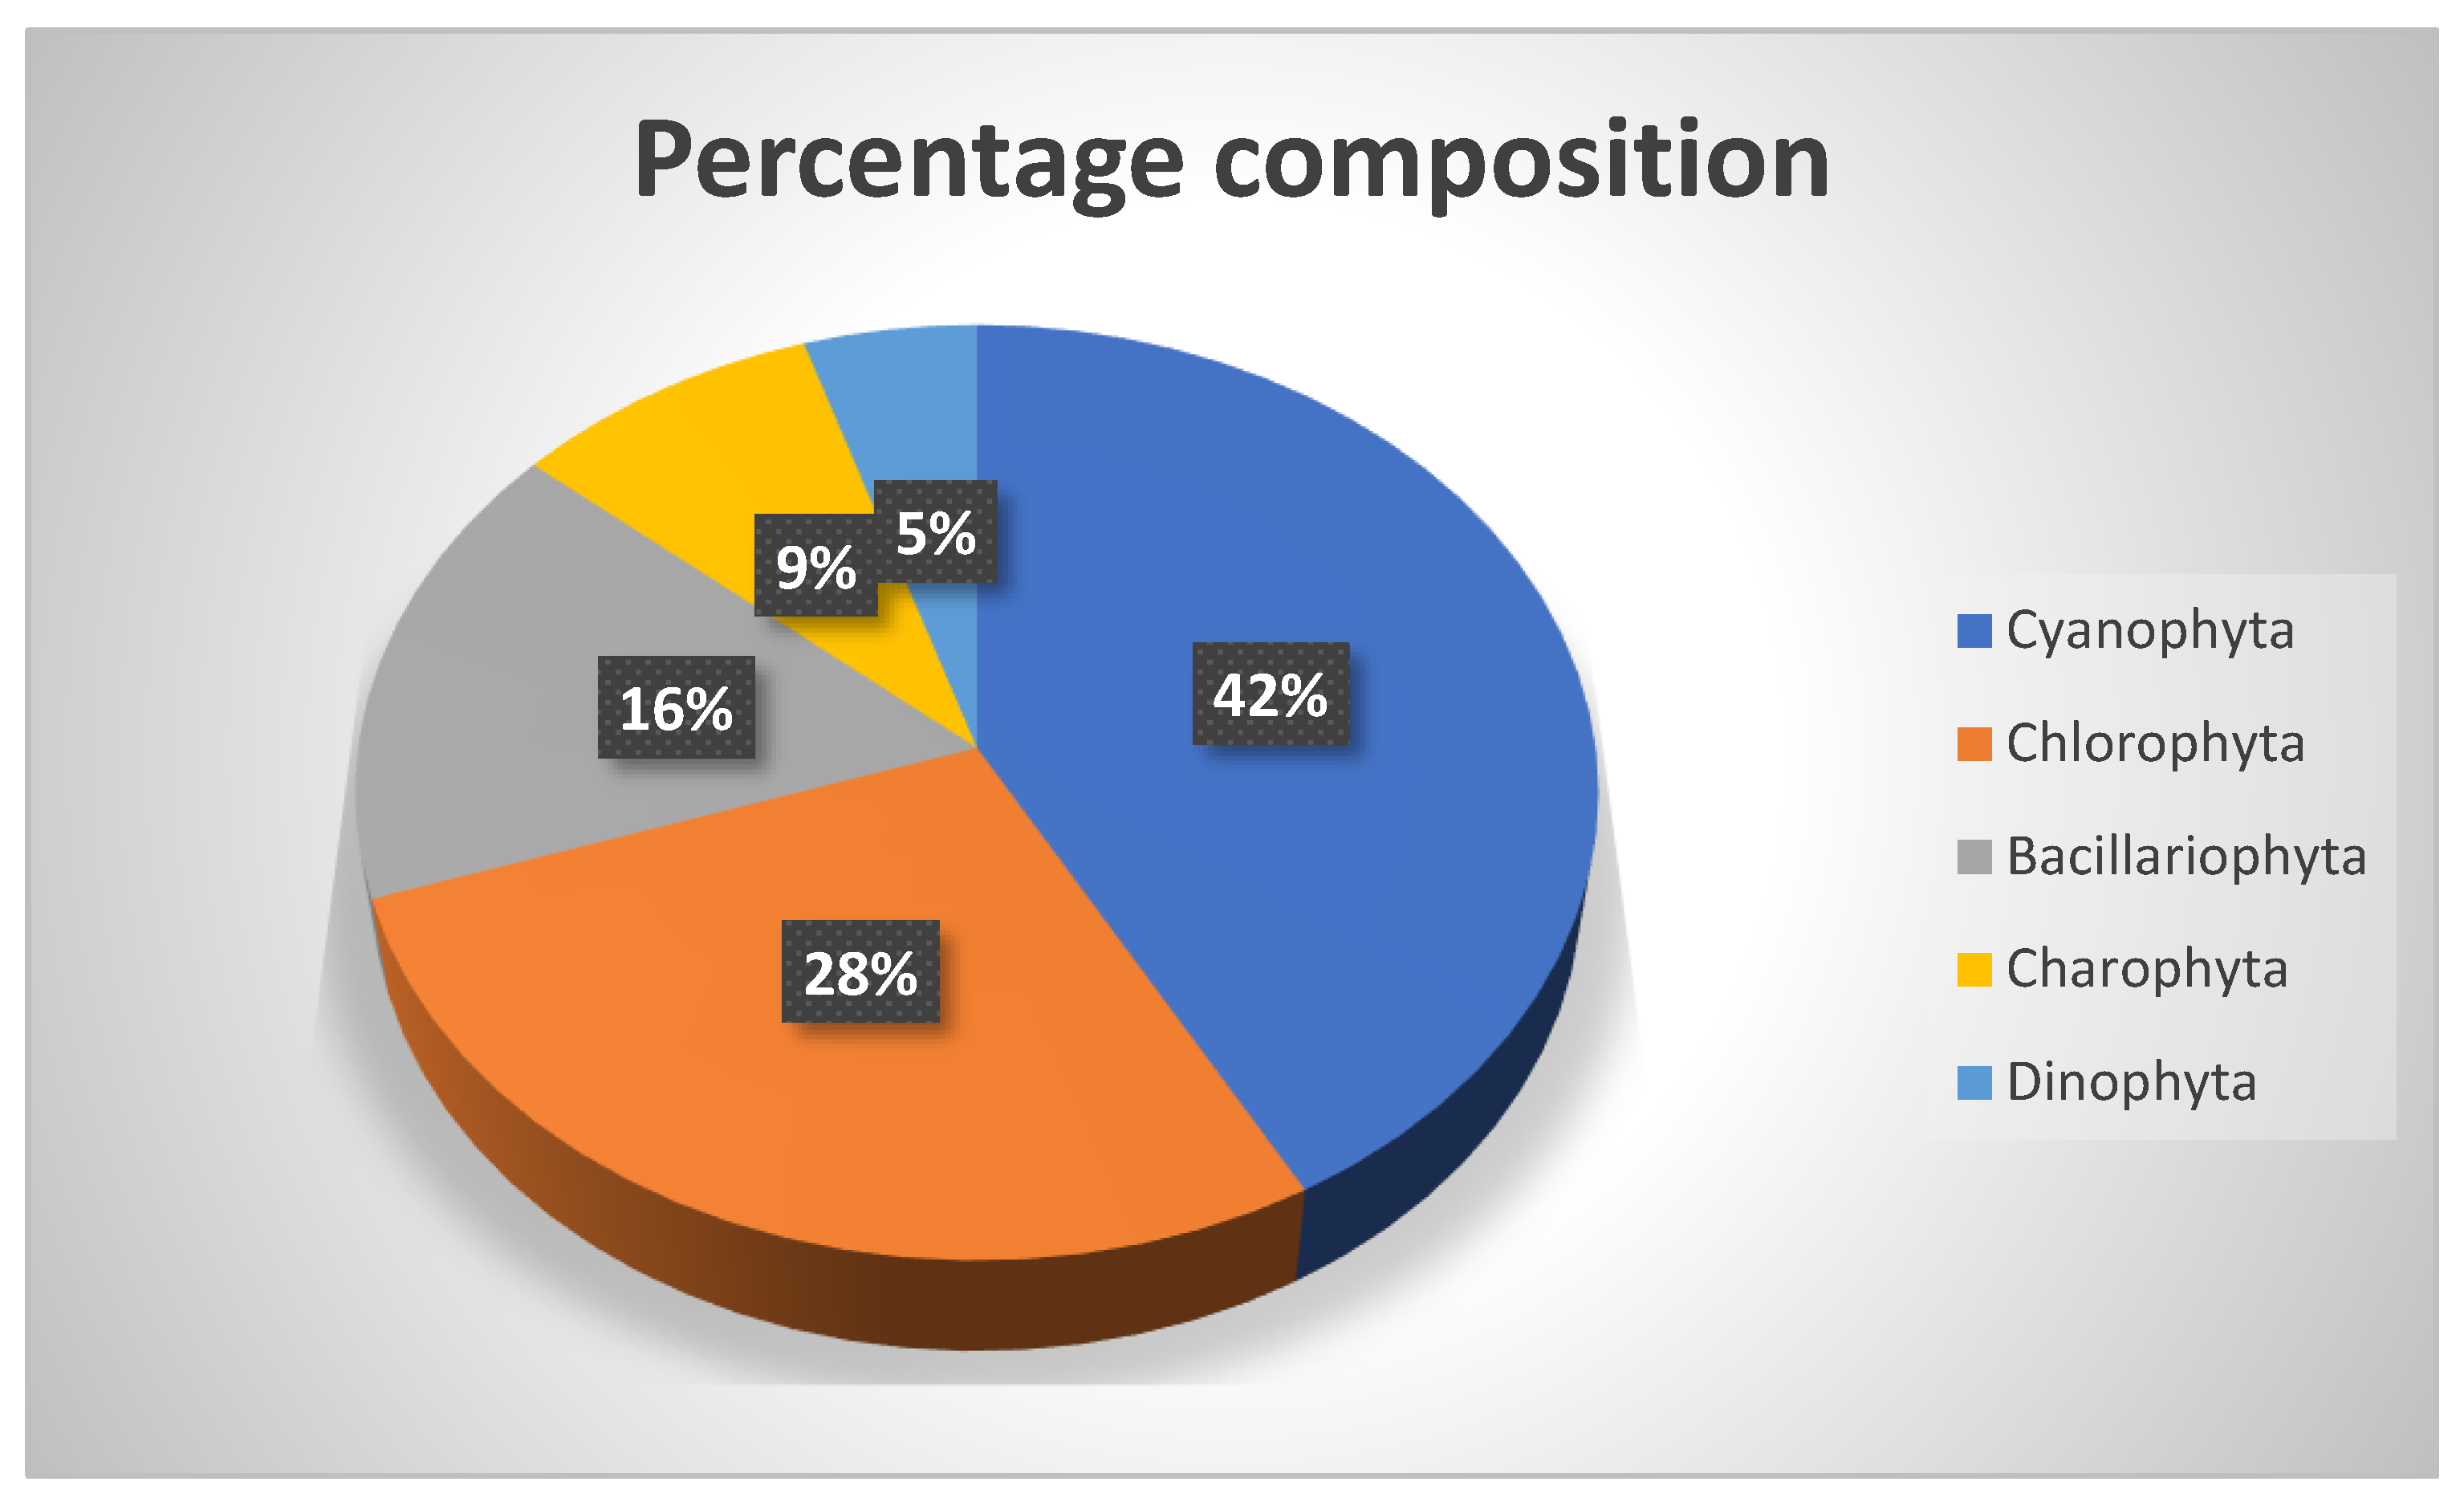
This study revealed 34 genera of phytoplankton belonging to 5 phyla: Cyanophyta, Bacillariophyta, Chlorophyta, Charophyta and Dinophyta. Cyanophyta formed the largest proportion of phytoplankton, accounting for about 44.1% of the total, indicating that Cyanophyta is the most dominant phylum in Winam Gulf. Chlorophyta formed the second largest phylum, accounting for about 29.41% of the total phytoplankton, followed by Bacillariophyta at about 17.2%. Charophyta accounted for 9.29%, while Dinophyta formed a small percentage of the total, about 5.2%.
Figure 5.
The percentage composition of the phylum of phytoplankton observed in the Winam Gulf.
Phytoplankton cell density
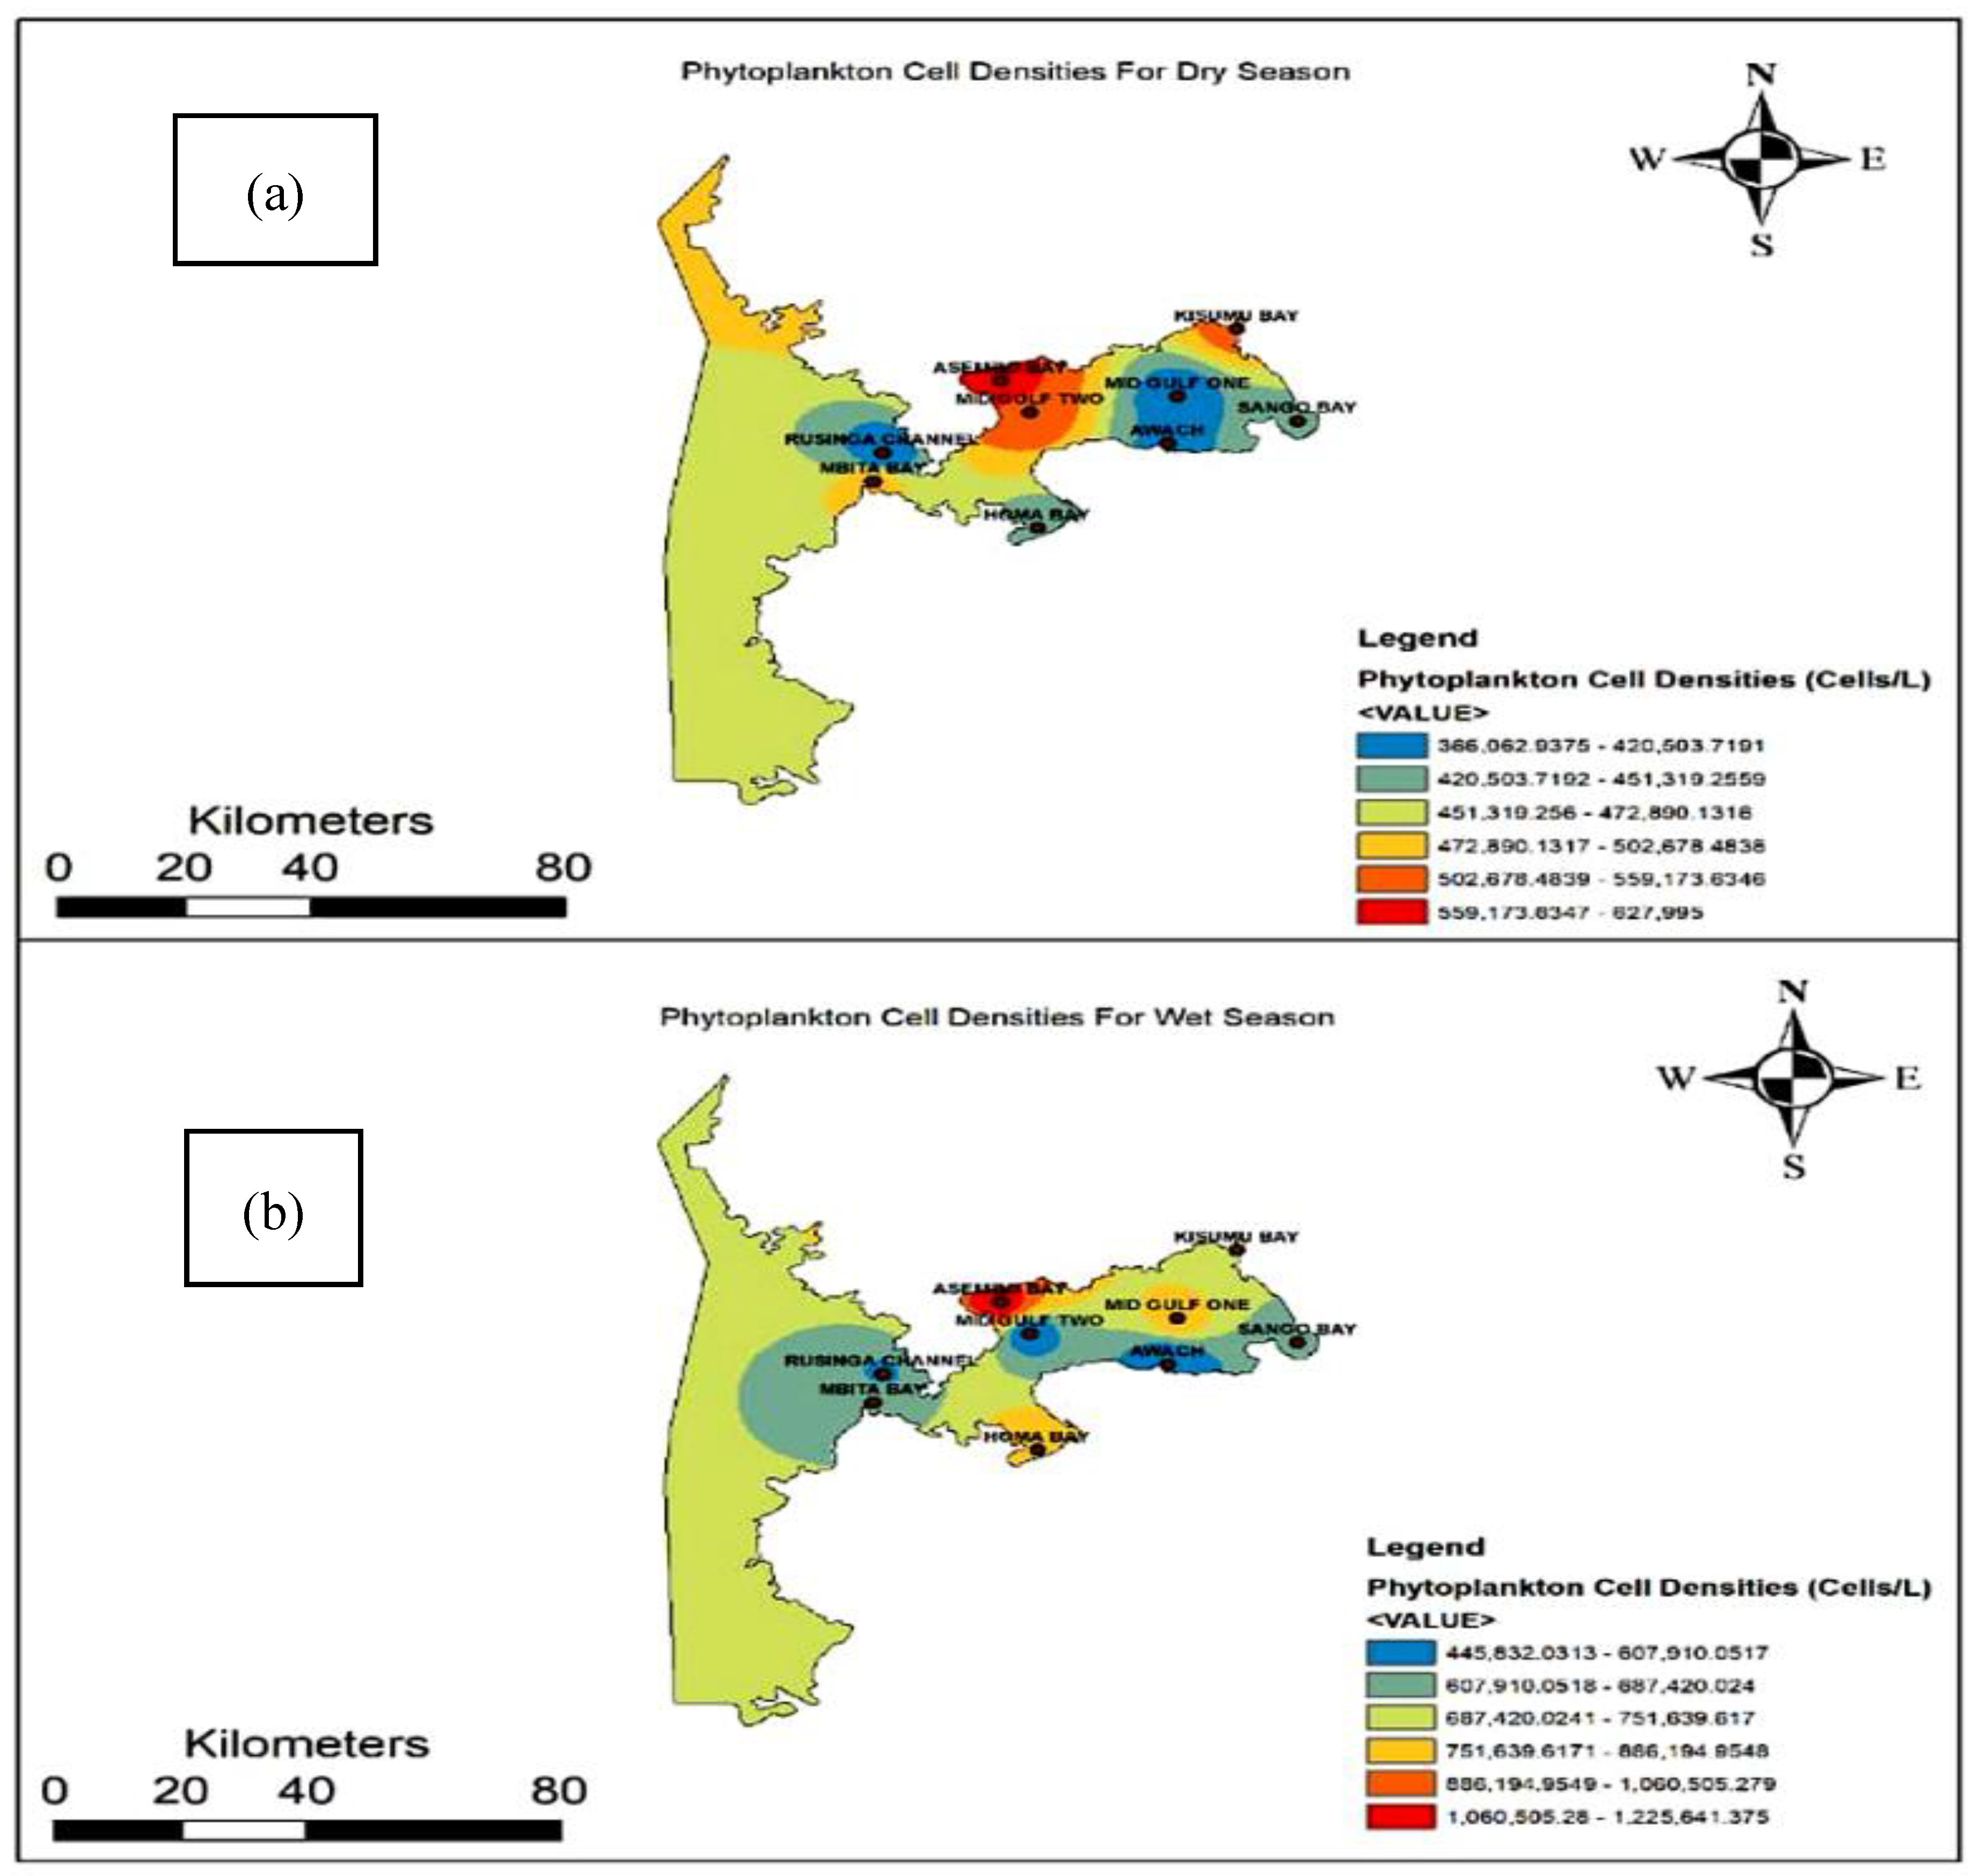
The spatial distribution maps illustrate clear seasonal and spatial variation in phytoplankton cell densities across the nine sampling stations in Winam Gulf. In both seasons, phytoplankton abundance was not evenly distributed but instead formed distinct hotspots. During the dry season, phytoplankton cell densities ranged from approximately 3.66 × 10⁵ to 6.28 × 10⁵ cells L⁻¹. The highest cell densities were concentrated around Asembo Bay, extending towards Mid Gulf Two and Kisumu Bay. In contrast, relatively lower densities (blue shades) occurred in Mbita Bay, Rusinga Channel, Awach, and Mid Gulf One, while Sango Bay and Homa Bay exhibited intermediate values. The wet season showed a marked increase in phytoplankton abundance across the gulf, with cell densities ranging from approximately 4.46 × 10⁵ to 1.23 × 10⁶ cells L⁻¹, almost doubling the maximum values observed during the dry season. Asembo Bay remained the area with the greatest phytoplankton density, while elevated abundances also extended towards Mid Gulf Two, Kisumu Bay, and Homa Bay. Lower densities persisted around Awach, Mbita Bay, Rusinga Channel, and Sango Bay. Compared with the dry season, the wet season displayed a broader spatial extent of high-density areas, indicating that seasonal rainfall enhanced phytoplankton production throughout much of the gulf. The spatial maps demonstrated that phytoplankton density increased substantially during the wet season, while the spatial pattern of distribution remained relatively consistent.
Figure 5.
Spatial distribution maps for phytoplankton cell densities per litre in the dry (a)season, wet (b)season, and overall.
Figure 5.
Spatial distribution maps for phytoplankton cell densities per litre in the dry (a)season, wet (b)season, and overall.
Phytoplankton Relative Abundances
Phytoplankton relative abundances varied both seasonally and spatially as represented in Figure 6. Phytoplankton communities during the dry season were relatively diverse. Microcystis, Anabaena, Synedra, and Protococcus contributed greatly to the community structure. Communities in the offshore area had a more even distribution, while river-influenced and urban-influenced stations had a greater presence of Microcystis and Synedra. Taxon richness varied from about 12 to 15 taxa, with the maximum in the river-influenced area and the minimum in the urban-influenced area. In the wet season, a clear change in community structure was observed. Microcystis became highly prevalent, especially in river-influenced and urban-influenced areas. The maximum taxon richness of 20 taxa was observed in offshore and river-influenced areas, while richness decreased considerably in transitional and urban-influenced areas, reaching about 11 taxa in the latter. Phytoplankton communities differed by season in their dominant taxa; some groups, including Spirogyra, Pediastrum, Scenedesmus, and Protococcus, maintained moderate contributions across habitats, while others, such as Ankistrodesmus and Ceratium, contributed relatively smaller amounts. The wet season showed greater dominance by some groups and lower evenness than the dry season.
Non-metric Multidimensional Scaling (NMDS) of Phytoplankton Communities
Non-metric Multidimensional Scaling (NMDS) ordinations of phytoplankton communities during the dry season and wet season across four habitat zones of Offshore, River Influence, Transitional, and Urban Influence. The ellipses represent the dispersion of samples within each habitat type, while species names indicate taxa associated with particular environmental conditions and habitat zones. The NMDS stress values were 0.13 for the dry season and 0.158 for the wet season, indicating acceptable ordination quality and reliable representation of community patterns in two-dimensional space as shown in Figure 7. During the dry season (Stress= 0.13), phytoplankton assemblages showed moderate separation among habitat zones. Offshore stations clustered around the central-right region of the ordination and were associated with taxa such as Botryococcus, Merismopedia, Microspora, and Tetraspora. Transitional stations overlapped partially with offshore stations but showed stronger associations with Microspora and Merismopedia. River-influenced stations formed a distinct cluster toward the left side of the ordination and were associated with diatoms and green algae, including Gonatozygon, Synedra, Diatoma, and Coelastrum. Urban-influenced stations occupied an intermediate position and showed considerable overlap with riverine and transitional stations, indicating similarities in community composition. Several taxa, such as Cladophora, Richterella, and Sorastrum, occurred at the periphery of the ordination space, suggesting habitat specialization or restricted occurrence.
During the wet season (Stress = 0.158), habitat-related separation became more pronounced. Offshore stations formed a compact cluster on the right side of the ordination and were associated with Coelosphaerium, Dictyosphaerium, Botryococcus, and Navicula. River-influenced stations exhibited a vertically elongated cluster around the center of the ordination and were associated with taxa such as Ulothrix, Crucigenia, Nitzschia, and Ankistrodesmus. Transitional stations clustered near the center-right region and showed associations with Staurastrum, Botryococcus, and Selenastrum. Urban-influenced stations formed a broad cluster extending across the negative side of NMDS1 and were associated with Zygnema and Spirulina. The larger ellipse for urban stations indicates greater variability in phytoplankton composition during the wet season.
Phytoplankton Diversity
Phytoplankton diversity provides an indication of water quality: a high value indicates less polluted water, while a low value indicates more polluted water. The Shannon index ranged between 1.33 and 1.95 in the dry season and between 1.08 and 2.34 in the wet season. Offshore stations had the highest Shannon index values in both the dry and wet seasons (1.95 ± 0.10 and 2.34 ± 0.11, respectively), while the minimum value was recorded in the urban area during the wet season (1.08 ± 0.55). ANOVA revealed highly significant spatial variation in both the dry (F = 9.90, p = 0.000221) and wet seasons (F = 16.95, p = 4.97 × 10⁻⁶). Simpson diversity values ranged between 0.57 and 0.81 in the dry season and between 0.54 and 0.88 in the wet season, with the highest values recorded at offshore sites and the lowest at urban stations, especially during the wet season. Significant variation among habitats was found in both the dry (F = 8.28, p = 0.000649) and wet seasons (F = 9.68, p = 0.000255). The highest species richness (Margalef's index) was observed in offshore habitats in both seasons, ranging from 10.83 ± 0.41 in the dry season to 14.17 ± 1.47 in the wet season, while the urban zone recorded the lowest richness, especially in the wet season (6.17 ± 3.54); these differences were significant in both seasons (dry: F = 8.52, p = 0.000548; wet: F = 12.69, p = 4.23 × 10⁻⁵). Simpson's Dominance Index values ranged between 2.38 and 5.40 in the dry season and between 2.52 and 8.30 in the wet season, with highly significant differences among habitats in both seasons (dry: F = 8.74, p = 0.000474; wet: F = 17.71, p = 3.53 × 10⁻⁶).
Table 5.
Variation in phytoplankton diversity indices in the dry and wet seasons in Winam Gulf. Different superscript letters within a row indicate significant differences between habitat zones (p < 0.05).
Table 5.
Variation in phytoplankton diversity indices in the dry and wet seasons in Winam Gulf. Different superscript letters within a row indicate significant differences between habitat zones (p < 0.05).
| Index | Season | Offshore | River | Transitional | Urban | ANOVA (F) | P-value |
|---|---|---|---|---|---|---|---|
| Shannon | Dry | 2.03 ± 0.06ᵃ | 1.51 ± 0.35ᵇᶜ | 1.99 ± 0.18ᵃᵇ | 1.57 ± 0.1ᶜ | 9.61 | <0.001 |
| Wet | 2.4 ± 0.17ᵃ | 1.94 ± 0.17ᵇᶜ | 2.12 ± 0.21ᵃᵇ | 1.24 ± 0.69ᶜ | 11.12 | <0.001 | |
| Simpson | Dry | 0.83 ± 0.02ᵃ | 0.66 ± 0.14ᵇ | 0.84 ± 0.04ᵃ | 0.7 ± 0.05ᵇ | 8.23 | <0.001 |
| Wet | 0.89 ± 0.03ᵃ | 0.8 ± 0.04ᵇ | 0.86 ± 0.03ᵃ | 0.57 ± 0.25ᵇ | 8.32 | <0.001 | |
| Richness | Dry | 10.83 ± 0.41ᵃ | 8.56 ± 1.42ᵇ | 9 ± 0.63ᵇ | 8.5 ± 0.55ᶜ | 8.52 | <0.001 |
| Wet | 14.17 ± 1.47ᵃ | 10.67 ± 1.41ᵇ | 11.17 ± 2.4ᵇ | 6.17 ± 3.54ᶜ | 12.69 | <0.001 | |
| Evenness | Dry | 0.85 ± 0.01ᵃ | 0.71 ± 0.14ᵇ | 0.91 ± 0.06ᵃ | 0.73 ± 0.06ᵇ | 6.91 | 0.001747 |
| Wet | 0.91 ± 0.03ᵃ | 0.82 ± 0.05ᵇ | 0.88 ± 0.05ᵃ | 0.74 ± 0.22ᵇ | 2.73 | 0.067282 |
Spatial distribution of diversity indices in the winam gulf
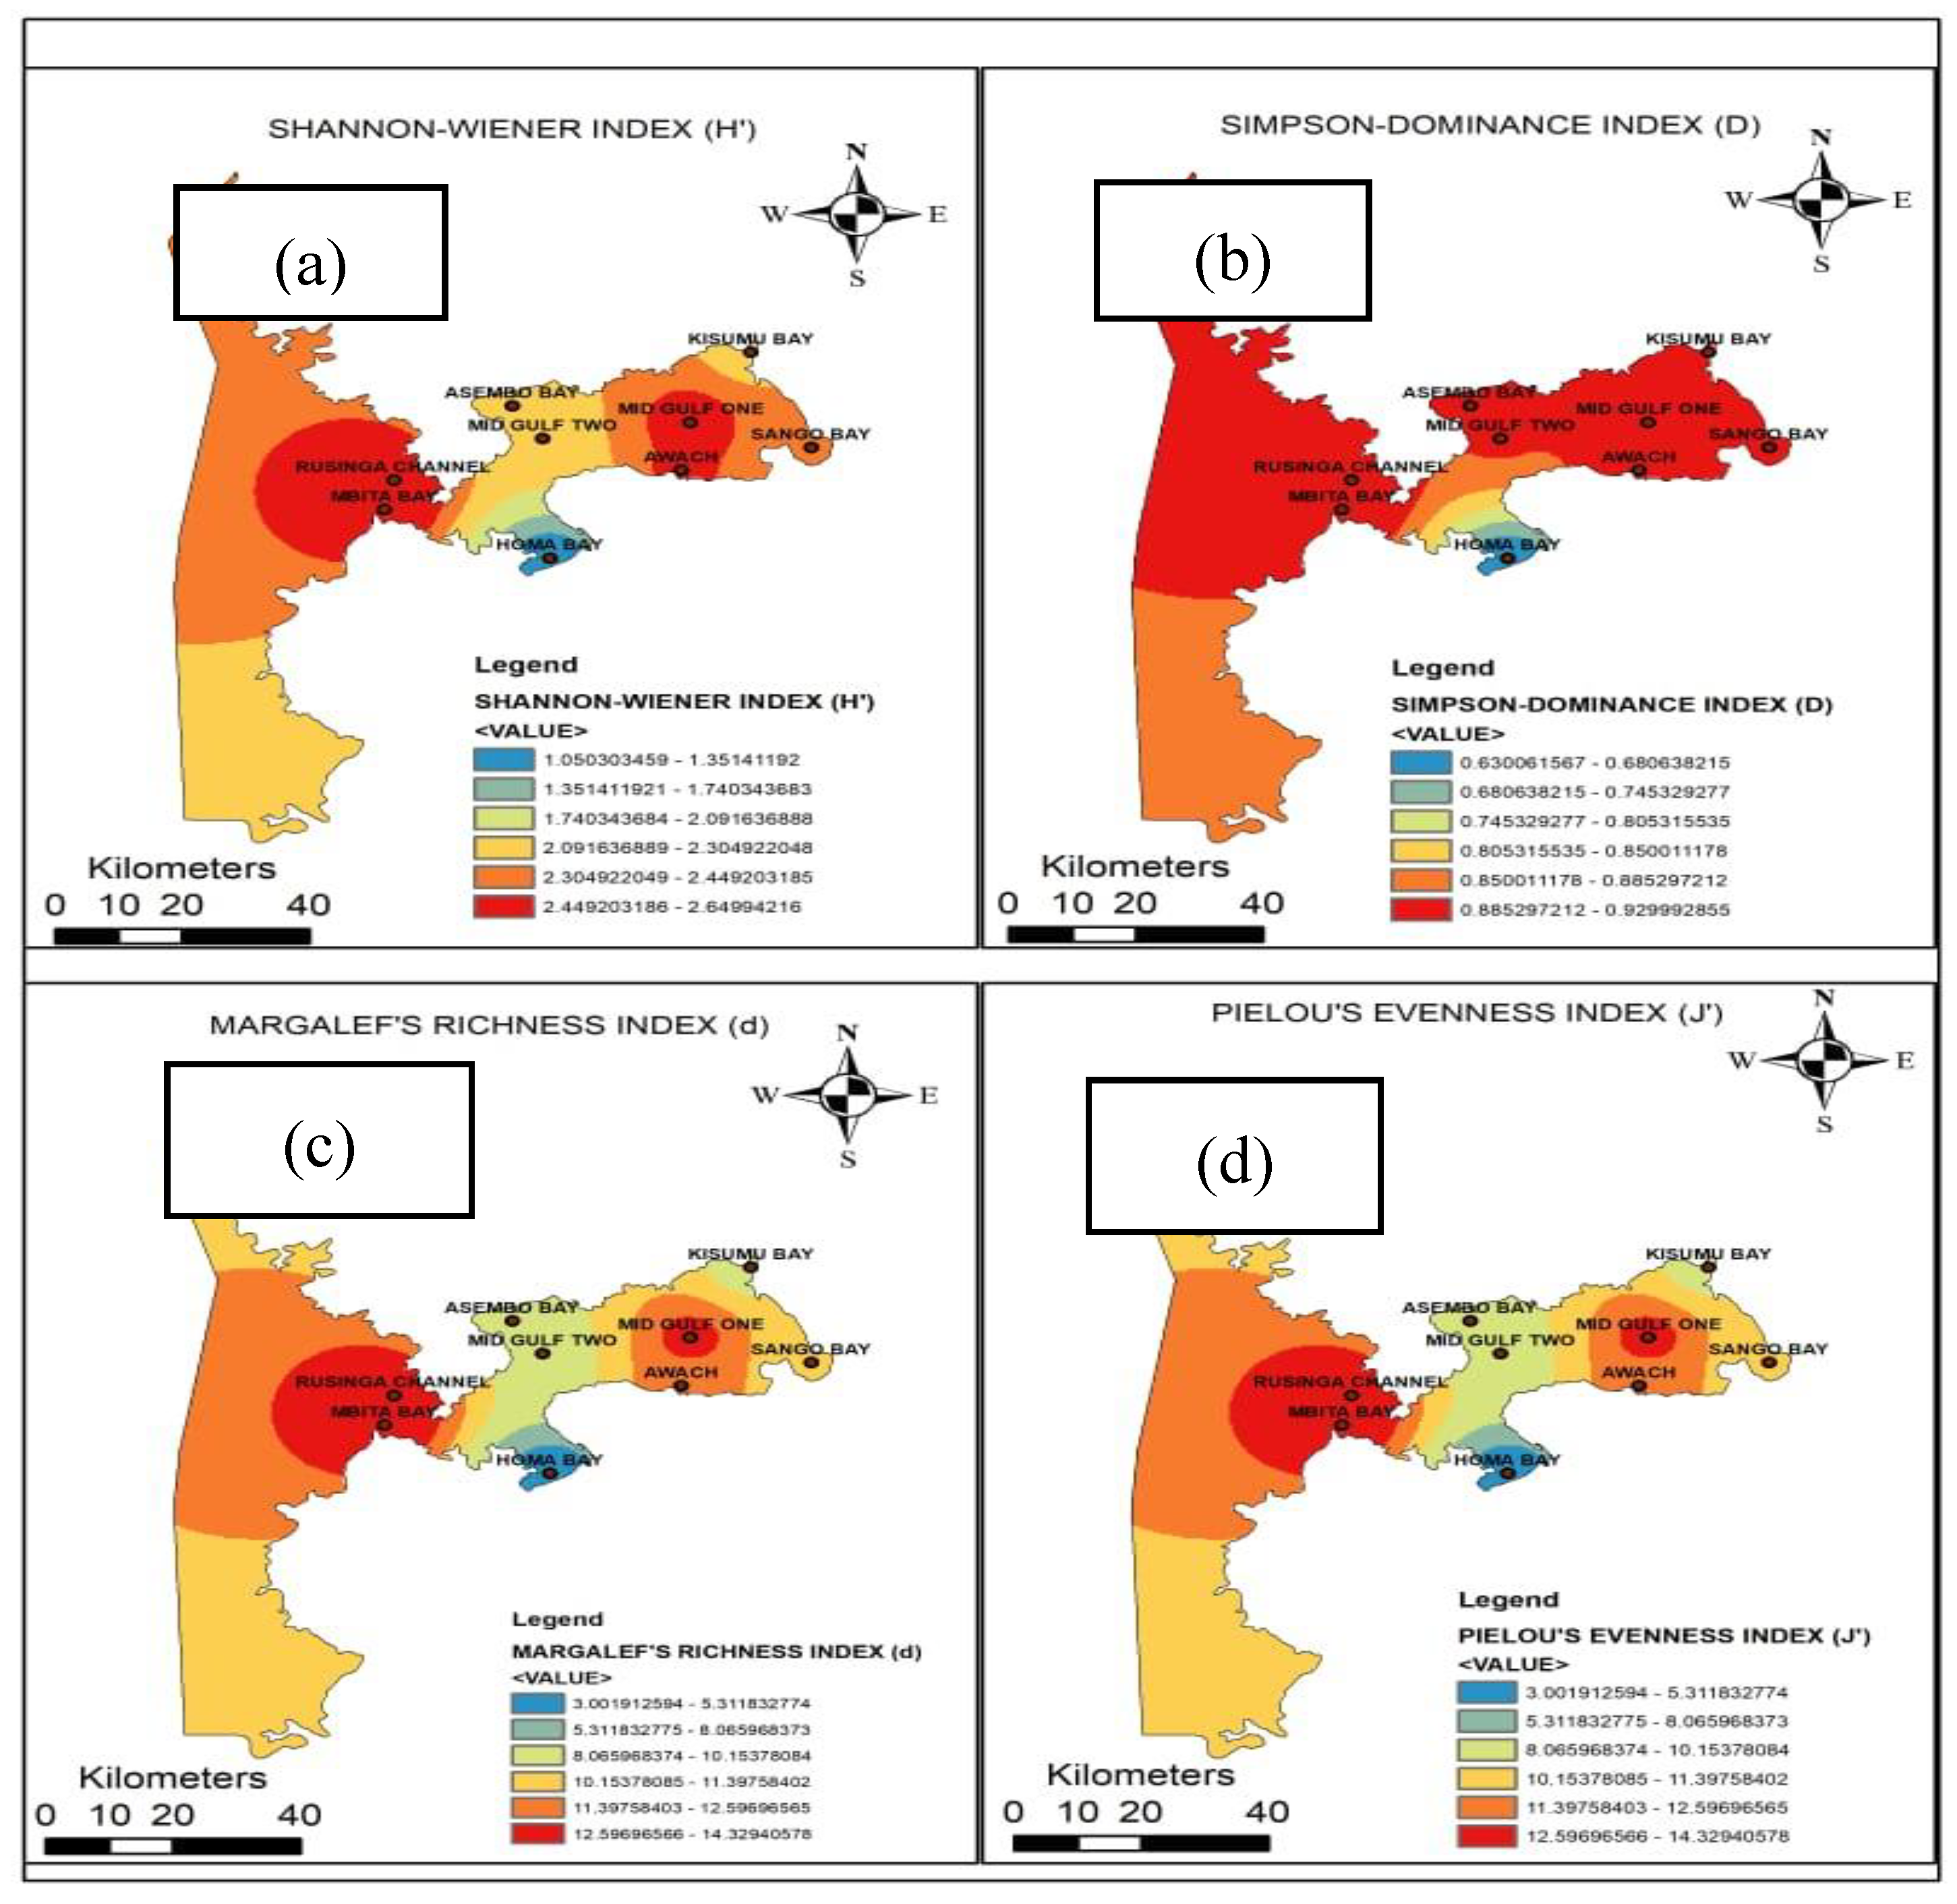
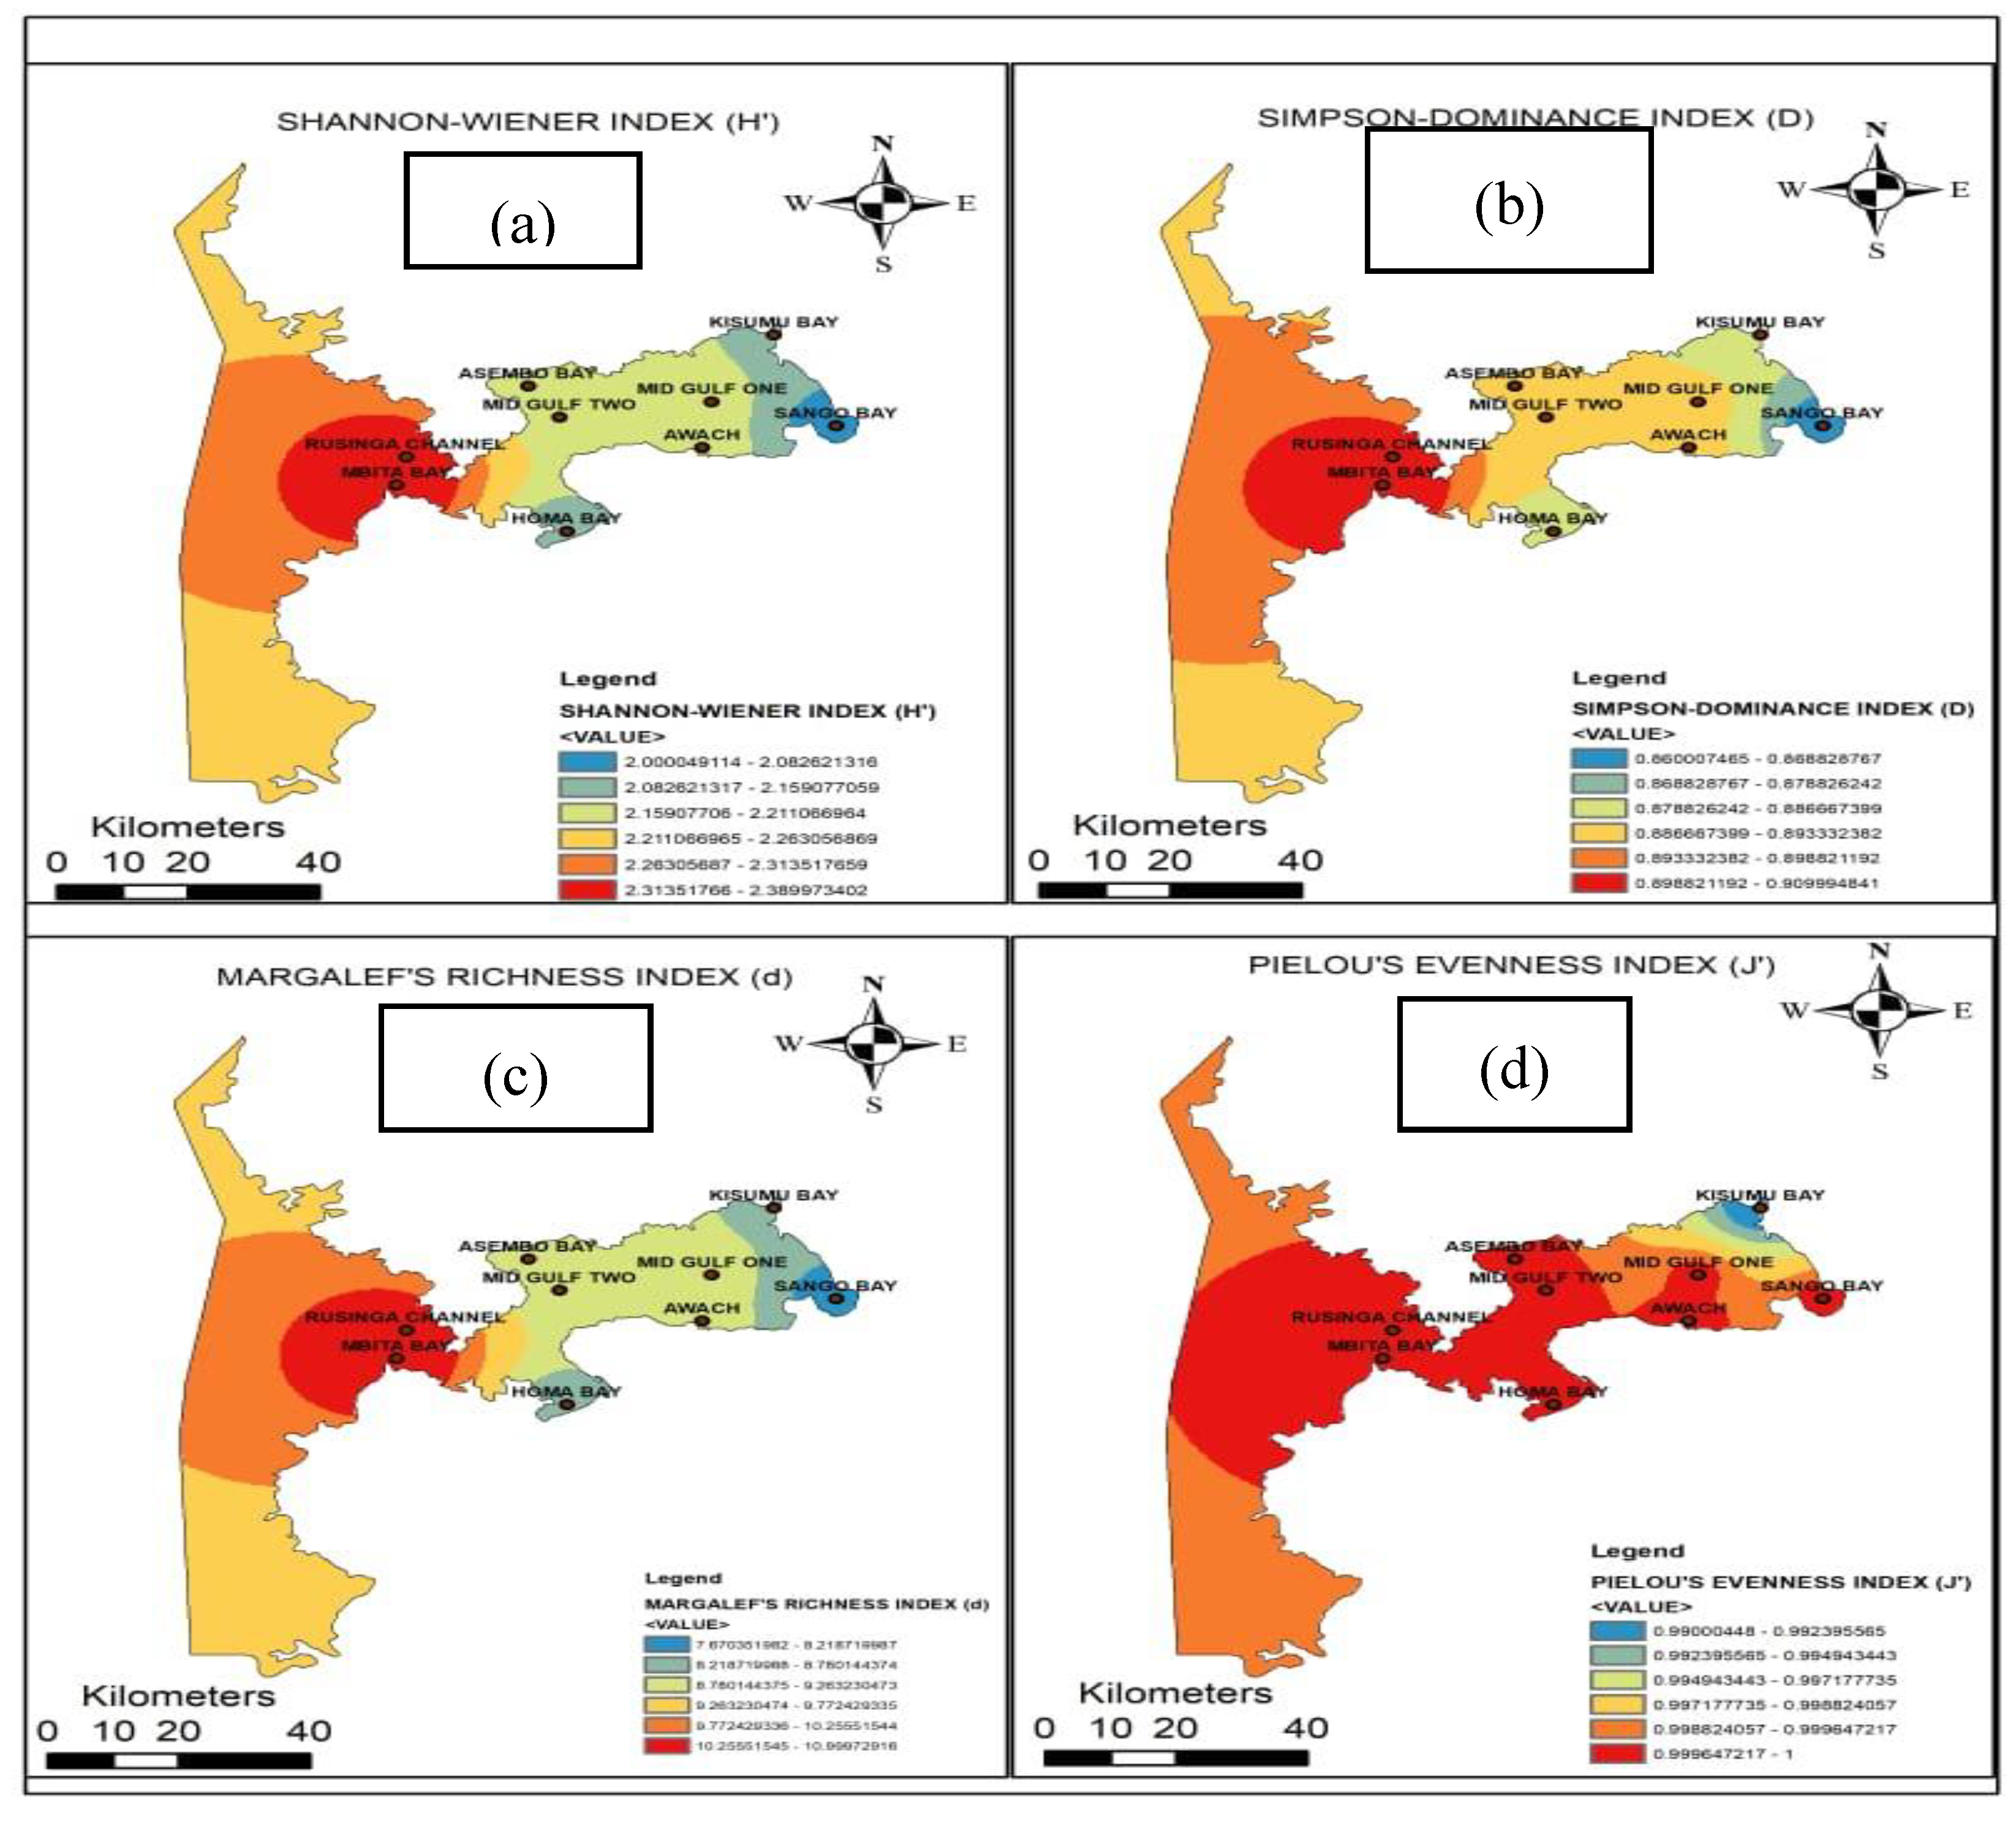
Figure 8A illustrates the spatial variation in phytoplankton community structure across Winam Gulf in the dry season using four complementary diversity metrics: the Shannon-Wiener diversity index (H′), Simpson's dominance index (D), Margalef's richness index (d), and Pielou's evenness index (J′). Together, these indices reveal distinct spatial patterns in species diversity, richness, dominance, and the distribution of individuals among species.
The Shannon-Wiener index showed that phytoplankton diversity varied considerably across the gulf. The highest diversity values were recorded around Rusinga Channel and Mbita Bay, with relatively high diversity also observed at Asembo Bay. Intermediate values characterized Mid Gulf One, Mid Gulf Two, Kisumu Bay, Awach, and Sango Bay, whereas Homa Bay consistently exhibited the lowest diversity. These patterns suggest that phytoplankton communities were more heterogeneous in the western and central sections of the gulf than in the southern embayment’s similar spatial trend was evident for Margalef's richness index, which identified Rusinga Channel and Mbita Bay as the areas supporting the greatest phytoplankton richness. Species richness gradually declined towards the eastern stations, with Homa Bay recording the lowest richness values. The close correspondence between Shannon diversity and Margalef richness indicates that areas with more species also tended to exhibit higher overall diversity. Simpson’s dominance index highlighted marked differences in the extent to which a few taxa dominated local communities. Higher dominance values were observed across the western shoreline, particularly around Rusinga Channel, Mbita Bay, and Asembo Bay, while lower values occurred in Homa Bay. This pattern indicates that although these western sites supported relatively diverse communities, a limited number of phytoplankton taxa contributed disproportionately to total abundance. The spatial distribution of Pielou's evenness index largely mirrored that of the Shannon index. Higher evenness values were observed around Rusinga Channel, Mbita Bay, and parts of Asembo Bay, indicating a relatively balanced distribution of individuals among species. In contrast, lower evenness in Homa Bay suggests that phytoplankton assemblages at this site were characterized by fewer dominant taxa and a less equitable distribution of individuals across species. The four diversity metrics consistently identified the western and central regions of Winam Gulf as supporting more diverse and species-rich phytoplankton communities, whereas Homa Bay exhibited comparatively lower diversity, richness, and evenness.
(A) Dry season
Figure 8b presents the spatial distribution of four phytoplankton diversity metrics across Winam Gulf in the wet season the Shannon-Wiener diversity index (H′), Simpson's dominance index (D), Margalef's richness index (d), and Pielou's evenness index (J′). Collectively, these indices reveal pronounced spatial heterogeneity in phytoplankton community structure throughout the gulf.The Shannon–Wiener index showed marked spatial variation, with the highest diversity occurring in the western section of the gulf, particularly around Rusinga Channel and Mbita Bay. Relatively high diversity was also observed around Asembo Bay, whereas intermediate values characterized Mid Gulf One, Mid Gulf Two, Awach, and Kisumu Bay. The lowest diversity was recorded at Homa Bay and Sango Bay, indicating comparatively simpler phytoplankton assemblages at these locations. A similar spatial pattern was observed for Margalef's richness index. Species richness was greatest in Rusinga Channel and Mbita Bay, gradually declining towards the central and eastern portions of the gulf. Homa Bay consistently exhibited the lowest richness values, while Mid Gulf One, Mid Gulf Two, Awach, Kisumu Bay, and Sango Bay supported moderate numbers of taxa.
The Simpson dominance index highlighted areas where phytoplankton communities were dominated by relatively few taxa. Higher dominance values were concentrated in the western part of the gulf, especially around Rusinga Channel, Mbita Bay, and Asembo Bay, whereas lower dominance values occurred in Homa Bay and parts of the eastern gulf.In contrast, Pielou's evenness index exhibited a broader distribution of high values across the study area. High evenness extended from the western stations through the central gulf and into the eastern stations, suggesting that, despite differences in species richness and diversity, individuals were relatively evenly distributed among species across much of Winam Gulf. Slightly lower evenness was observed around Mid Gulf Two, Mid Gulf One, Awach, and Kisumu Bay, indicating localized variation in community structure. the diversity maps demonstrate that phytoplankton community composition varies considerably across Winam Gulf in the wet season, with the western region supporting richer and more diverse assemblages than several of the central and southern stations.
(B) Wet season
Figure 8.
Spatial maps showing the diversity indices, (a) Shannon-weiner, (b) Simpson- Dominance, (c) Margalef Richness (d) Pielou’s Eveness for (A) dry season and (B) wet season.
Figure 8.
Spatial maps showing the diversity indices, (a) Shannon-weiner, (b) Simpson- Dominance, (c) Margalef Richness (d) Pielou’s Eveness for (A) dry season and (B) wet season.
Correlation between Phytoplankton Communities and Environmental Variables
The Mantel analysis revealed significant relationships between phytoplankton community composition and environmental variables across habitat categories and seasons in Winam Gulf (Figure 9). Numerous significant associations were observed between phytoplankton assemblages and physicochemical variables, with the strongest associations found for nutrient-related variables, particularly total nitrogen (TN), total phosphorus (TP), soluble reactive phosphorus (SRP), nitrate (NO₃⁻), nitrite (NO₂⁻), and ammonium nitrogen (NH₃-N). Significant relationships were also observed with water depth, dissolved oxygen (DO), electrical conductivity (EC), total dissolved solids (TDS), pH, and Secchi depth, although the magnitude of these relationships varied among habitats and seasons. Wet season communities generally displayed stronger associations with nutrient variables, whereas dry season communities showed additional relationships with water transparency and electrical conductivity. The environmental correlation matrix revealed significant interrelationships among environmental variables: water depth was positively correlated with Secchi depth (r = 0.84, p < 0.001) and dissolved oxygen (r = 0.50, p < 0.001), but negatively correlated with TDS (r = −0.71, p < 0.001) and EC (r = −0.71, p < 0.001). Nitrate showed a strong positive correlation with TN (r = 0.66, p < 0.001) and a strong negative relationship with SRP (r = −0.79, p < 0.001). Similarly, TDS and EC exhibited strong positive associations with nutrient concentrations.
Influence of Environmental Factors on Phytoplankton
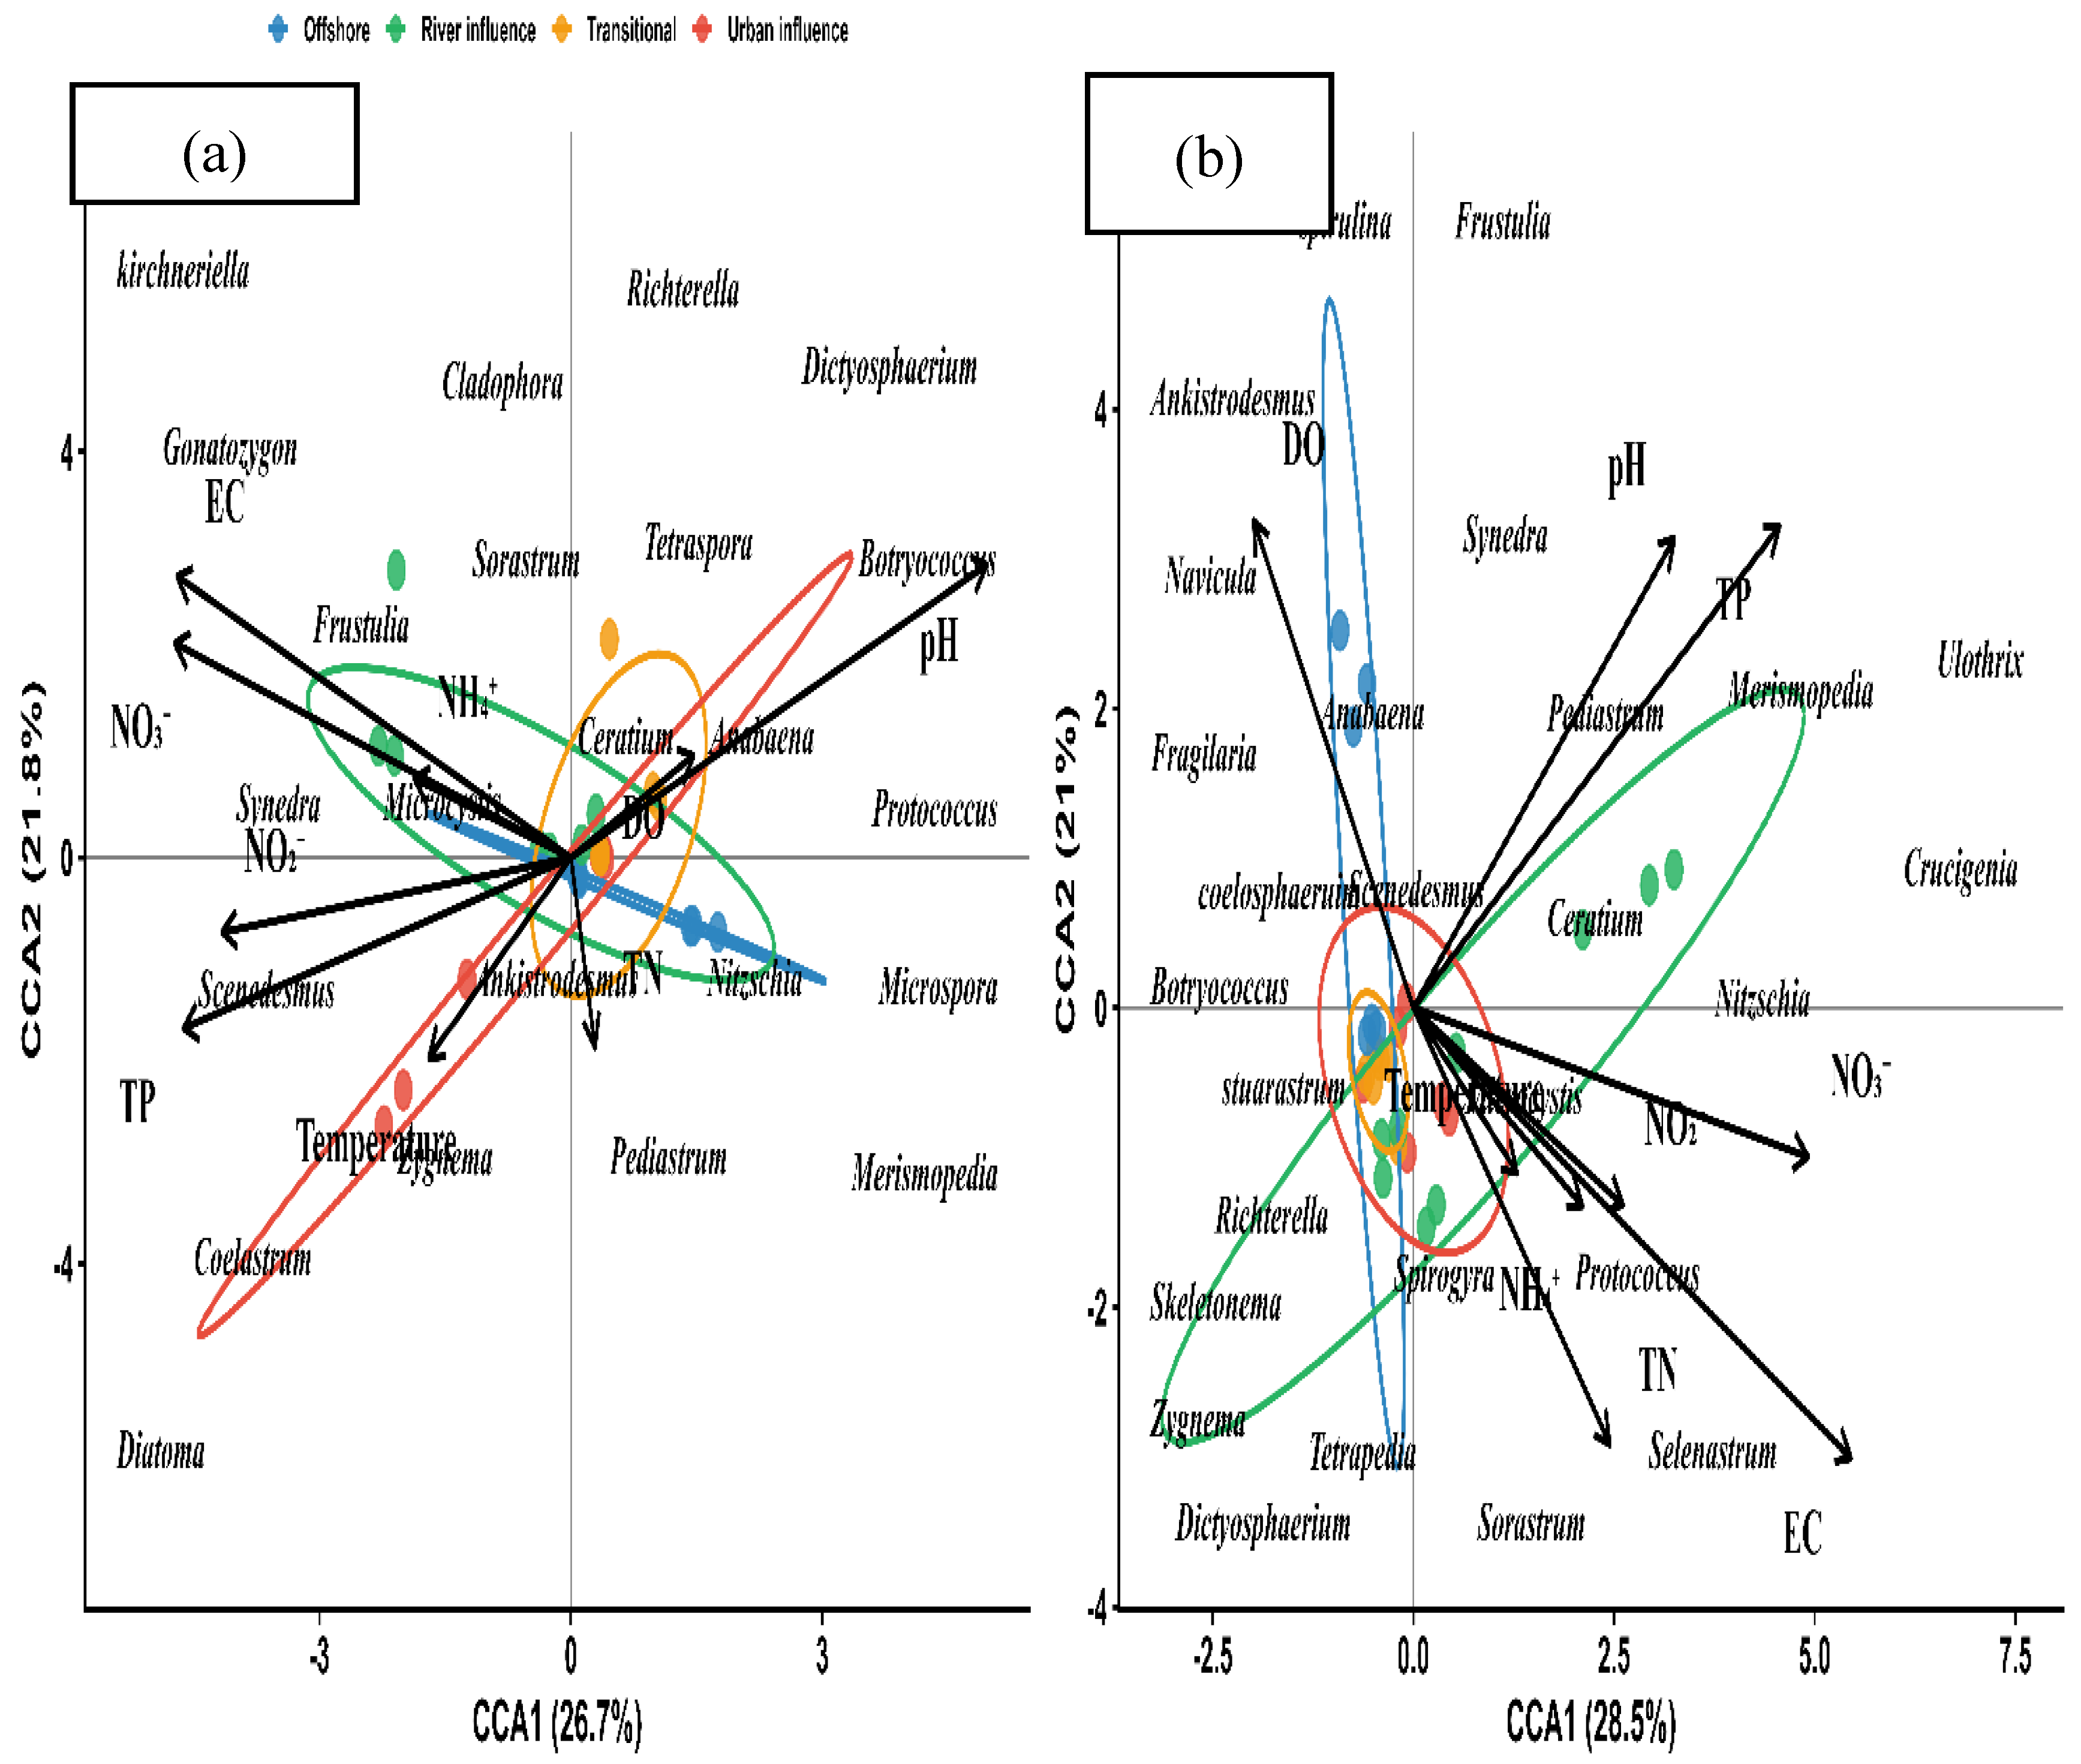
Canonical Correspondence Analysis (CCA) was used to identify the environmental variables most strongly associated with phytoplankton distribution patterns. During the dry season, offshore stations clustered on the positive side of CCA1 and were associated with taxa such as Microspora, Merismopedia, Nitzschia, Pediastrum, and Botryococcus. These taxa were positively correlated with increasing pH and moderately associated with total nitrogen (TN). River-influenced stations clustered primarily on the negative side of CCA1 and were associated with elevated nutrient concentrations, particularly NO₃-N, NO₂-N, NH₄⁺-N, and EC, with taxa including Frustulia, Synedra, Microspora, and Scenedesmus. Urban stations occupied a broad gradient extending from negative to positive CCA1 values and showed strong associations with temperature, with species such as Coelastrum, Zygnema, and Ankistrodesmus positioned near the temperature vector. Transitional stations occurred near the center of the ordination and overlapped with offshore and river-influenced habitats, with taxa such as Ceratium and Anabaena associated with these intermediate environmental conditions. During the wet season, environmental gradients became more pronounced. Offshore stations formed a compact cluster near the center-left of the ordination and were strongly associated with dissolved oxygen (DO), with species such as Anabaena, Ankistrodesmus, Navicula, and Fragilaria positioned near the DO vector. River-influenced stations clustered on the positive side of CCA1 and were associated with elevated pH and total phosphorus (TP), with taxa such as Merismopedia, Pediastrum, Ceratium, and Nitzschia closely aligned with these variables. Urban and transitional stations were concentrated near the center of the ordination and were associated with temperature, NH₄⁺-N, TN, EC, and NO₂-N, with species such as Spirogyra, Protococcus, Selenastrum, Sorastrum, and Richterella occurring in this region. NO₃-N and EC exhibited strong positive loadings along CCA1 and were associated with several nutrient-tolerant taxa, indicating the influence of runoff and nutrient enrichment during the wet season.
Figure 10.
Canonical Correspondence Analysis (CCA) plots illustrating the relationship between phytoplankton communities and environmental variables during the dry (a) and wet (b)seasons.
Figure 10.
Canonical Correspondence Analysis (CCA) plots illustrating the relationship between phytoplankton communities and environmental variables during the dry (a) and wet (b)seasons.
DISCUSSION
Seasonal and Spatial Variability of Environmental Conditions
The significant seasonal variation in nutrient concentrations (SRP, nitrate, nitrite), dissolved oxygen (DO), biochemical oxygen demand (BOD), electrical conductivity (EC), and water transparency indicates that hydrological change is the primary regulator of water quality in Winam Gulf. Elevated nutrient concentrations during the wet season reflect increased catchment runoff, which transports fertilizers, organic matter, and suspended sediments into the gulf. Similar seasonal nutrient enrichment linked to rainfall-driven hydrology has been reported in Winam Gulf, where catchment inputs strongly regulate phytoplankton dynamics and water quality variability (Suba et al., 2024).
The concurrent increase in BOD and decline in Secchi depth during the wet season suggest enhanced organic loading and reduced light penetration, both characteristic of eutrophic systems. These conditions favor microbial decomposition and phytoplankton proliferation, which further influence oxygen dynamics. Spatially, river-influenced and urban stations consistently exhibited higher nutrient concentrations, EC, and BOD compared with offshore sites, reflecting the influence of agricultural runoff, wastewater discharge and urban effluents. In contrast, offshore waters were characterized by higher dissolved oxygen and improved transparency, indicating comparatively less anthropogenic disturbance. The relatively weak seasonal variation in ammonia and total phosphorus suggests that internal nutrient recycling may complement external loading in sustaining nutrient availability, a pattern common in eutrophic systems that contributes to persistent nutrient enrichment even during periods of reduced runoff. Overall, the physicochemical patterns demonstrate strong spatial gradients driven by land-use intensity and seasonal hydrological variability, consistent with previous observations in Lake Victoria's nearshore environments (Brown et al., 2024; Olokotum et al., 2021).
Phytoplankton Responses to Nutrient Enrichment and Habitat Gradients
Phytoplankton community composition was dominated by Cyanophyta, followed by Chlorophyta and Bacillariophyta, indicating sustained eutrophic conditions in Winam Gulf. Cyanobacterial dominance is widely associated with nutrient enrichment, high temperatures, and prolonged water residence times, all of which characterize Lake Victoria's nearshore ecosystems (Suba et al., 2024; Brown et al., 2024). The increased phytoplankton abundance during the wet season reflects enhanced nutrient loading from catchment runoff, which stimulates primary productivity.
Spatially, inner-gulf and river-influenced zones supported higher phytoplankton abundance, likely due to nutrient accumulation and reduced water exchange. In contrast, urban-influenced habitats exhibited lower diversity and were dominated by a few tolerant taxa, reflecting environmental stress associated with pollution inputs. The widespread occurrence of Microcystis during the wet season is particularly significant, as this genus is a well-known indicator of eutrophication and has been linked to harmful algal blooms in Winam Gulf (Miruka et al., 2021; Brown et al., 2024). Diversity and richness declined along the offshore-urban gradient, indicating increasing environmental stress; offshore habitats consistently supported more diverse assemblages due to better water quality, higher oxygen availability, and improved light conditions. These findings align with community assembly theory, which predicts that environmental filtering under high nutrient stress reduces diversity and promotes dominance by tolerant taxa (Kraft et al., 2015; Isabwe et al., 2018). Thus, phytoplankton communities in Winam Gulf respond strongly to nutrient enrichment through shifts in both abundance and taxonomic structure.
Environmental Drivers of Phytoplankton Community Structure
Multivariate analyses (NMDS and CCA) revealed that phytoplankton community structure is primarily governed by nutrient gradients, particularly total phosphorus (TP) and dissolved inorganic nitrogen. The clear separation of offshore, river-influenced, and urban habitats reflects strong environmental filtering along nutrient and water quality gradients. Similar patterns have been reported in Winam Gulf, where nutrient enrichment strongly influences phytoplankton succession and community differentiation (Suba et al., 2024; Aura et al., 2020). Among all variables, total phosphorus emerged as the dominant driver of community composition, particularly during the wet season. Phosphorus-rich habitats were strongly associated with cyanobacterial dominance, indicating that phosphorus availability promotes bloom-forming taxa. Nitrogen compounds (nitrate, nitrite, ammonium) also played a key role, especially in river-influenced zones, where catchment inputs enhanced nutrient availability and supported opportunistic phytoplankton growth. The combined influence of nitrogen and phosphorus highlights the synergistic role of macronutrients in regulating phytoplankton succession in eutrophic tropical systems.
Secondary drivers included dissolved oxygen, water transparency, EC, and temperature. Offshore habitats were characterized by higher DO and transparency, supporting more diverse assemblages, whereas nutrient-rich habitats exhibited reduced light penetration and lower oxygen levels. The inverse relationship between nutrients and Secchi depth indicates that phytoplankton biomass and suspended sediments jointly reduce light availability, reinforcing competitive advantages for cyanobacteria under turbid conditions. Temperature acted as a seasonal modifier, enhancing metabolic activity and nutrient cycling and thereby indirectly influencing phytoplankton growth rates; however, compared with nutrient availability, temperature played a secondary role in structuring communities. Collectively, the NMDS and CCA results confirm that phytoplankton communities are structured by environmental filtering along nutrient and water quality gradients, consistent with findings from other Lake Victoria studies (Olokotum et al., 2021; Hart et al., 2025).
Ecological and Management Implications
The dominance of cyanobacteria and the strong nutrient-community relationships indicate that eutrophication remains the principal ecological challenge in Winam Gulf. River-influenced and urban habitats consistently exhibited elevated nutrient concentrations and supported phytoplankton communities dominated by eutrophic and bloom-forming taxa, suggesting persistent anthropogenic pressure on the ecosystem. The frequent occurrence of Microcystis highlights the risk of harmful algal blooms, which have been linked to reduced water quality, biodiversity loss, and public health concerns in Lake Victoria (Miruka et al., 2021; Brown et al., 2024).
Phytoplankton community composition proved to be more sensitive to environmental gradients than total abundance, indicating that community-based indicators are more effective for ecological assessment. The integration of diversity metrics with NMDS and CCA provided a robust framework for detecting habitat-specific responses to environmental change. Similar approaches have been recommended for Lake Victoria monitoring to improve early detection of eutrophication impacts (Aura et al., 2020; Yongo et al., 2023).
Effective management of Winam Gulf will require reduction of external nutrient inputs from agriculture, urban runoff, and wastewater discharge. Since phosphorus emerged as the dominant driver of phytoplankton community structure, targeted phosphorus control should be prioritized. In addition, continuous monitoring of cyanobacterial dynamics is essential for managing bloom risks and protecting ecosystem services. Strengthening catchment management strategies is therefore critical for improving ecological integrity and sustaining the productivity of the gulf.
CONCLUSION
This study demonstrates that phytoplankton community structure in Winam Gulf is primarily controlled by spatial and seasonal variability in nutrient availability and associated water quality conditions. Nutrient enrichment, driven by catchment runoff and anthropogenic activities, strongly influences phytoplankton composition, leading to cyanobacterial dominance and reduced diversity in impacted habitats. Multivariate analyses confirmed that total phosphorus, nitrogen compounds, dissolved oxygen, conductivity, and water transparency are the key environmental drivers structuring phytoplankton communities. Although seasonal hydrology modulates nutrient inputs, spatial differences in land use exert a stronger long-term influence on ecosystem condition. Offshore habitats maintain relatively stable and diverse phytoplankton communities, while river-influenced and urban zones are characterized by eutrophic conditions and simplified assemblages. These findings highlight the importance of community-based indicators in detecting ecological change and demonstrate that phytoplankton are effective bioindicators of water quality in Winam Gulf. The study confirms that eutrophication remains the dominant ecological pressure in the system. Effective management should prioritize nutrient reduction, particularly phosphorus control, alongside long-term monitoring of phytoplankton community structure, to mitigate the risk of harmful algal blooms and support the sustainable use of Lake Victoria's resources.
REFERENCES
- Adhiambo, W.-K. P. J. Status of phytoplankton community of Kisumu Bay, Winam Gulf, Lake Victoria, Kenya. Int. J. Eng. Sci. 2017, 6(05), 22–28. [Google Scholar] [CrossRef]
- APHA. Standard methods for the examination of water and wastewater; American Public Health Association, 2017. [Google Scholar]
- Aura, C. M.; Odoli, C.; Nyamweya, C. S.; Njiru, J. M.; Musa, S.; Miruka, J. B.; Owili, M. O.; Omondi, R.; Raburu, P.; Manyala, J.; Mwamburi, J.; Ogari, Z.; Mbaru, E. K. Application of phytoplankton community structure for ranking the major riverine catchments influencing the pollution status of a lake basin. Lakes Reserv. Sci. Policy Manag. Sustain. Use 2020, 25(1), 3–17. [Google Scholar] [CrossRef]
- Aura, C. M.; Roegner, A.; Owiti, H.; Birungi, D.; Fiorella, K. J.; Corman, J.; Kayanda, R.; Mbullo, P.; Nyamweya, C. S.; Mchau, G.; Daniels, M.; Abila, R. O. Mind the gaps for the best practices: Enhancing the management of Lake Victoria fisheries resources. Lakes Reserv. Sci. Policy Manag. Sustain. Use 2022, 27(3), e12411. [Google Scholar] [CrossRef]
- Brown, K. M.; Barker, K. B.; Wagner, R. S.; Ward, C. S.; Sitoki, L.; Njiru, J.; Omondi, R.; Achiya, J.; Getabu, A.; McKay, R. M.; Bullerjahn, G. S.; Consortium; the N.-I. L. V. R. Bacterial community and cyanotoxin gene distribution of the Winam Gulf, Lake Victoria, Kenya. Environ. Microbiol. Rep. 2024a, 16(3), e13297. [Google Scholar] [CrossRef] [PubMed]
- Brown, K. M.; Barker, K. B.; Wagner, R. S.; Ward, C. S.; Sitoki, L.; Njiru, J.; Omondi, R.; Achiya, J.; Getabu, A.; McKay, R. M.; Bullerjahn, G. S.; Consortium; the N.-I. L. V. R. Bacterial community and cyanotoxin gene distribution of the Winam Gulf, Lake Victoria, Kenya. Environ. Microbiol. Rep. 2024b, 16(3), e13297. [Google Scholar] [CrossRef] [PubMed]
- Hart, L.; Zepernick, B.; Natwora, K.; Brown, K.; Obuya, J.; Lomeo, D.; Barnard, M.; Okech, E.; Kiledal, A.; Den Uyl, P.; Olokotum, M.; Wilhelm, S.; McKay, R.; Drouillard, K.; Sherman, D.; Sitoki, L.; Achiya, J.; Getabu, A.; Otiso, K.; Dick, G. Metagenomics reveals spatial variation in cyanobacterial composition, function, and biosynthetic potential in the Winam Gulf, Lake Victoria, Kenya. Appl. Environ. Microbiol. 2025, 91. [Google Scholar] [CrossRef] [PubMed]
- Hecky, R. E.; Bugenyi, F. W. B. Hydrology and chemistry of the African Great Lakes and water quality issues: Problems and solutions. SIL Commun. 1992, 1953-1996(23(1)), 45–54. [Google Scholar] [CrossRef]
- Isabwe, A.; Yang, J. R.; Wang, Y.; Liu, L.; Chen, H.; Yang, J. Community assembly processes underlying phytoplankton and bacterioplankton across a hydrologic change in a human-impacted river. Sci. Total Environ. 2018, 630, 658–667. [Google Scholar] [CrossRef] [PubMed]
- Kraft, N. J. B.; Adler, P. B.; Godoy, O.; James, E. C.; Fuller, S.; Levine, J. M. Community assembly, coexistence and the environmental filtering metaphor. Funct. Ecol. 2015, 29(5), 592–599. [Google Scholar] [CrossRef]
- Kruk, C.; Devercelli, M.; Huszar, V. L. M.; Hernández, E.; Beamud, G.; Diaz, M.; Silva, L. H. S.; Segura, A. M. Classification of Reynolds phytoplankton functional groups using individual traits and machine learning techniques. Freshw. Biol. 2017, 62(10), 1681–1692. [Google Scholar] [CrossRef]
- Lawrence, T. J.; Achieng, A. O.; Chavula, G.; Haninga Haambiya, L.; Iteba, J.; Kayanda, R.; Kaunda, E.; Ajode, M. Z.; Muvundja, F. A.; Nakiyende, H.; Nyamweya, C.; Obiero, K.; Plisnier, P. D.; Phiri, H.; Sibomana, C.; Smith, S. Future success and ways forward for scientific approaches on the African Great Lakes. J. Gt. Lakes Res. 2023, 49(6), 102242. [Google Scholar] [CrossRef]
- Liu, Q.; Mutethya, E.; Yongo, E.; Liu, X.; Ye, C.; Lu, Z.; Guo, Z. Spatio-temporal dynamics of phytoplankton community structure in response to environmental drivers in Xiaohai Lagoon, Hainan Island, China. Water 2025, 18(1). [Google Scholar] [CrossRef]
- Liu, X.; Liu, Q.; Chen, B.; Jiang, X.; Atif, S.; Yongo, E.; Fu, Q.; Guo, Z.; Zhu, W. Community assembly mechanism of phytoplankton in drinking water sources of tropical island, China. Front. Ecol. Evol. 2026, 14, 1742583. [Google Scholar] [CrossRef]
- Miruka, J. B.; Getabu, A.; Sitoki, L.; James, O.; Mwamburi, J.; George, O.; Chrisphine, N.; Odoli, C. Water quality, phytoplankton composition and microcystin concentrations in Kisumu Bay (Kenya) of Lake Victoria after a prolonged water hyacinth infestation period. Lakes Reserv. Sci. Policy Manag. Sustain. Use 2021, 26(4), e12380. [Google Scholar] [CrossRef]
- Musinguzi, L.; Lugya, J.; Rwezawula, P.; Kamya, A.; Nuwahereza, C.; Halafo, J.; Kamondo, S.; Njaya, F.; Aura, C.; Shoko, A. P.; Osinde, R.; Natugonza, V.; Ogutu-Ohwayo, R. The extent of cage aquaculture, adherence to best practices and reflections for sustainable aquaculture on African inland waters. J. Gt. Lakes Res. 2019, 45(6), 1340–1347. [Google Scholar] [CrossRef]
- Nyakeya, K.; Masese, F. O.; Gichana, Z.; Nyamora, J. M.; Getabu, A.; Onchieku, J.; Odoli, C.; Nyakwama, R. Cage farming in the environmental mix of Lake Victoria: An analysis of its status, potential environmental and ecological effects, and a call for sustainability. Aquat. Ecosyst. Health Manag. 2022, 25(4), 37–52. [Google Scholar] [CrossRef]
- Olokotum, M.; Troussellier, M.; Escalas, A.; Hamlaoui, S.; Okello, W.; Semyalo, R.; Humbert, J.-F.; Bernard, C. High nutrient loading and climatic parameters influence the dominance and dissimilarity of toxigenic cyanobacteria in northern bays of Lake Victoria. J. Gt. Lakes Res. 2021, 47(4), 985–996. [Google Scholar] [CrossRef]
- Outa, J. O.; Kowenje, C. O.; Avenant-Oldewage, A.; Jirsa, F. Trace elements in crustaceans, mollusks and fish in the Kenyan part of Lake Victoria: Bioaccumulation, bioindication and health risk analysis. Arch. Environ. Contam. Toxicol. 2020, 78(4), 589–603. [Google Scholar] [CrossRef] [PubMed]
- Roegner, A. F.; Corman, J. R.; Sitoki, L. M.; Kwena, Z. A.; Ogari, Z.; Miruka, J. B.; Xiong, A.; Weirich, C.; Aura, C. M.; Miller, T. R. Impacts of algal blooms and microcystins in fish on small-scale fishers in Winam Gulf, Lake Victoria: Implications for health and livelihood. Ecol. Soc. A J. Integr. Sci. Resil. Sustain. 2023, 28(1), 49. [Google Scholar] [CrossRef] [PubMed]
- Škaloud, P.; Tučková, K.; Čablová, R.; Jadrná, I.; Černajová, I. High-frequency sampling unveils biotic and abiotic drivers of rapid phytoplankton morphological changes. New Phytol. 2025, 248(5), 2528–2541. [Google Scholar] [CrossRef] [PubMed]
- Suba, V.; Khan, M.; Babu, M.; Sikuku, L.; Mwangi, B.; Oluoch, E.; Nyongesah, M.; Otieno, D.; Li, Y. Seasonal phytoplankton ecosystem dynamics in response to environmental variables in Winam Gulf, Lake Victoria, Kenya. Aquat. Sci. 2024, 87. [Google Scholar] [CrossRef]
- Wu, N.; Schmalz, B.; Fohrer, N. Development and testing of a phytoplankton index of biotic integrity (P-IBI) for a German lowland river. Ecol. Indic. 2012, 13(1), 158–167. [Google Scholar] [CrossRef]
- Yi, M.; Li, L.; Li, H.; Liu, C.; Deng, Y.; Wu, Z.; Li, Y. Spatiotemporal variations of plankton communities in different water bodies of the Yellow River: Structural characteristics, biogeographic patterns, environmental responses, and community assembly. J. Hydrol. 2024, 640, 131702. [Google Scholar] [CrossRef]
- Yongo, E.; Mutethya, E.; Zhang, P.; Lek, S.; Fu, Q.; Guo, Z. Comparing the performance of the water quality index and phytoplankton index of biotic integrity in assessing the ecological status of three urban rivers in Haikou City, China. Ecol. Indic. 2023, 157, 111286. [Google Scholar] [CrossRef]
Figure 2.
Spatial distribution maps showing how physico chemical parameters varied, (a) temperature, (b) Total Dissolved Solids, (c) Ammonia Nitrogen, (d) Electrical Conductivity, (e) Biological Oxygen Demand, (f) Secchi Depth, (g) Ph, (h) Nitrite, (i) Nitrate, (j) Dissolved Oxygen, (k) Total Nitrogen, (l) Soluble Reactive Phosphorus, (m) Total Phosphorus. The sites that were the hot spots sites that represented intermediate amounts and site that represented lower quantities of the physico-chemical parameters in the Winam Gulf.
Figure 2.
Spatial distribution maps showing how physico chemical parameters varied, (a) temperature, (b) Total Dissolved Solids, (c) Ammonia Nitrogen, (d) Electrical Conductivity, (e) Biological Oxygen Demand, (f) Secchi Depth, (g) Ph, (h) Nitrite, (i) Nitrate, (j) Dissolved Oxygen, (k) Total Nitrogen, (l) Soluble Reactive Phosphorus, (m) Total Phosphorus. The sites that were the hot spots sites that represented intermediate amounts and site that represented lower quantities of the physico-chemical parameters in the Winam Gulf.
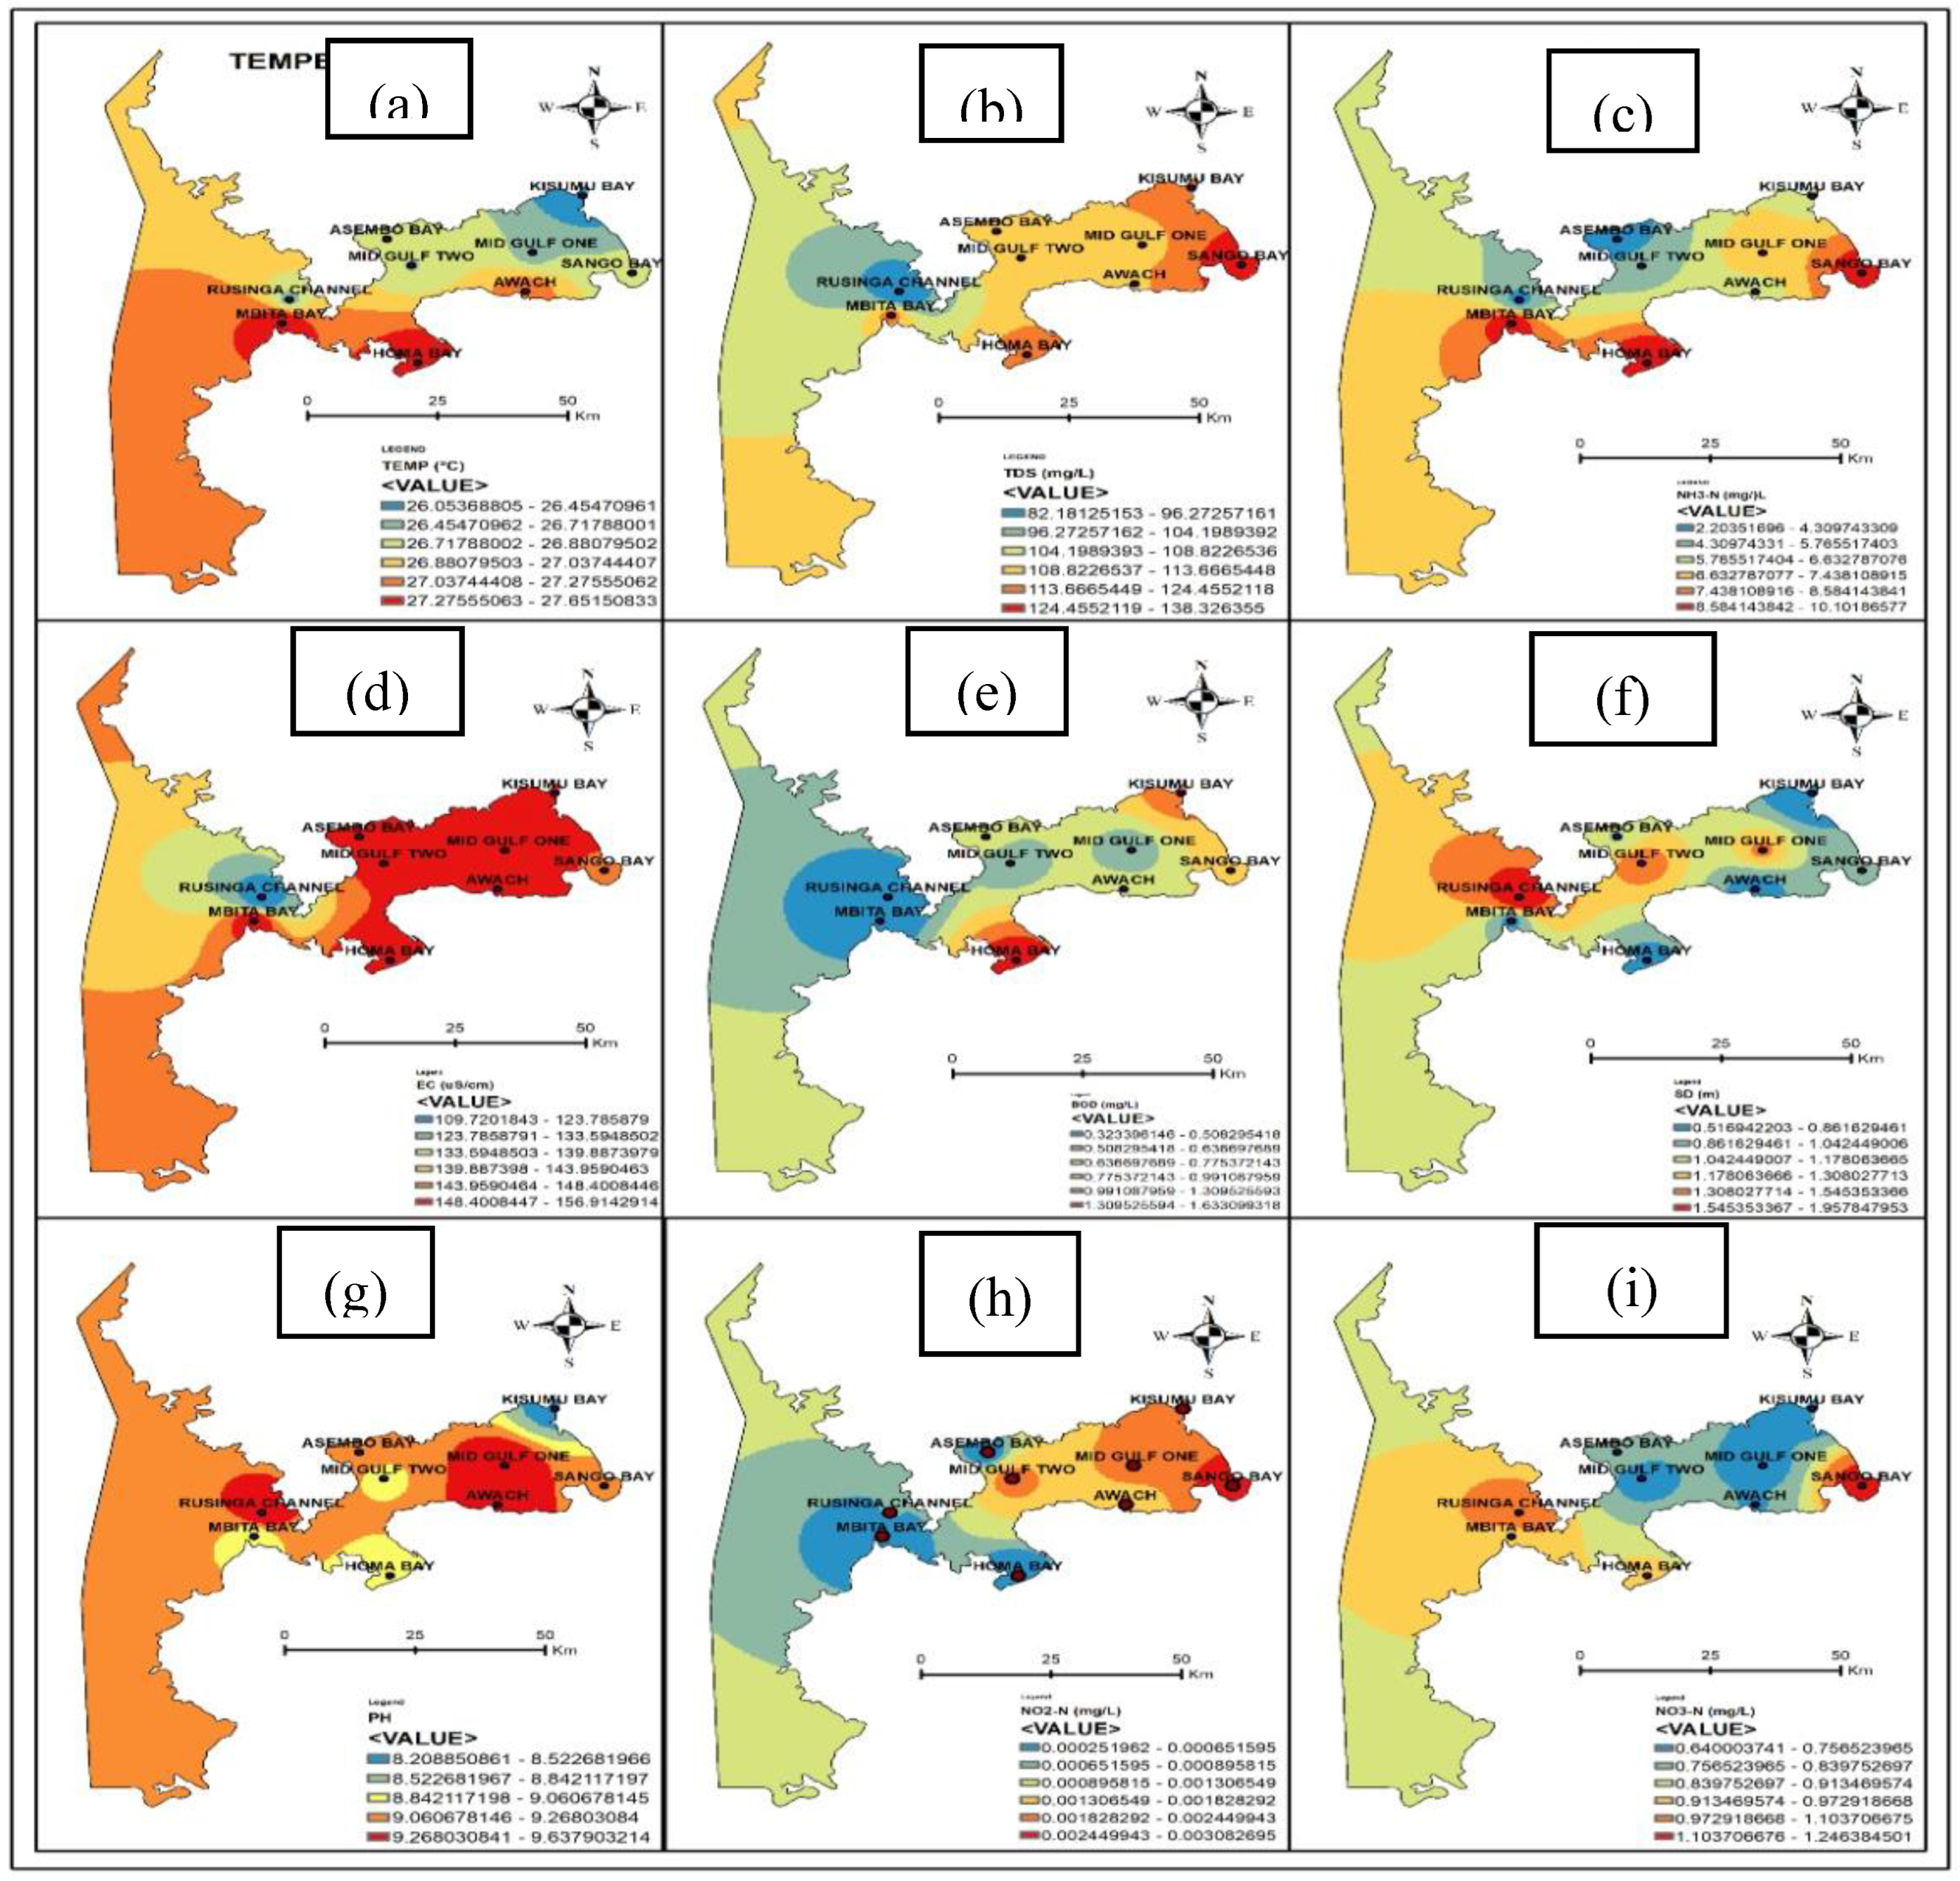
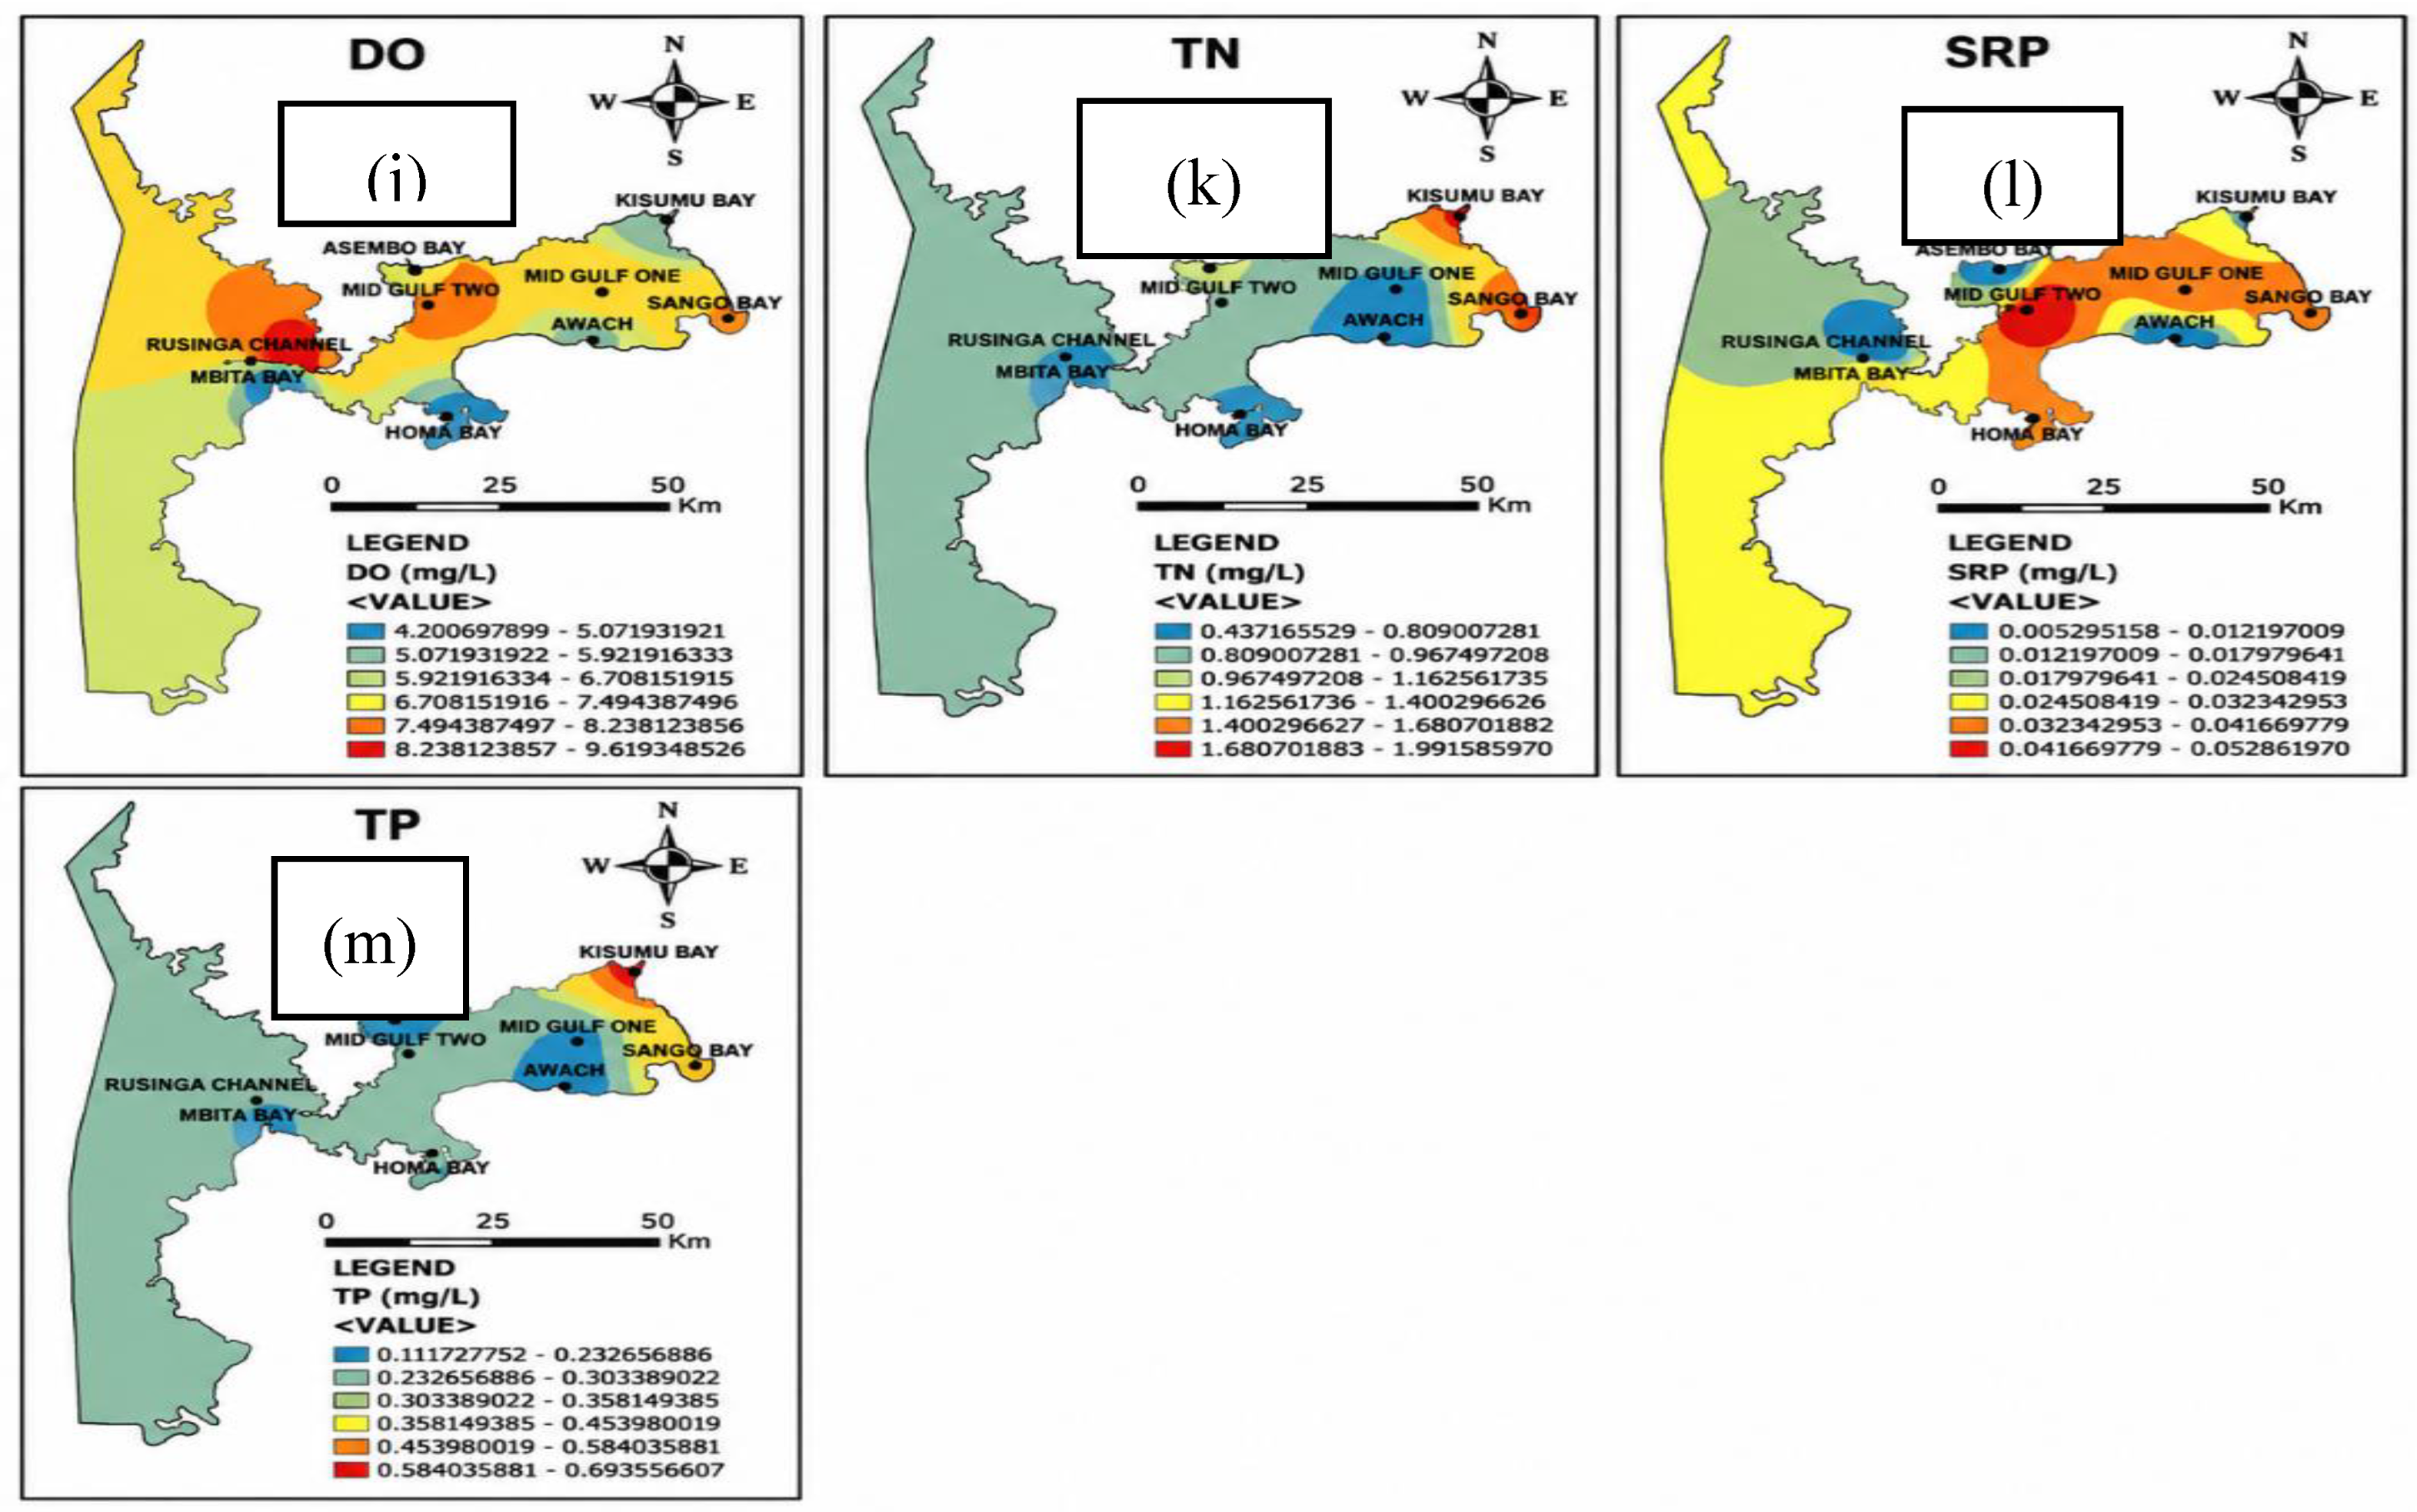
Figure 4.
Principal Component Analysis (PCA) biplots illustrating the spatial distribution of sampling habitats in relation to environmental variables during the dry (a) and wet (b) seasons.
Figure 4.
Principal Component Analysis (PCA) biplots illustrating the spatial distribution of sampling habitats in relation to environmental variables during the dry (a) and wet (b) seasons.
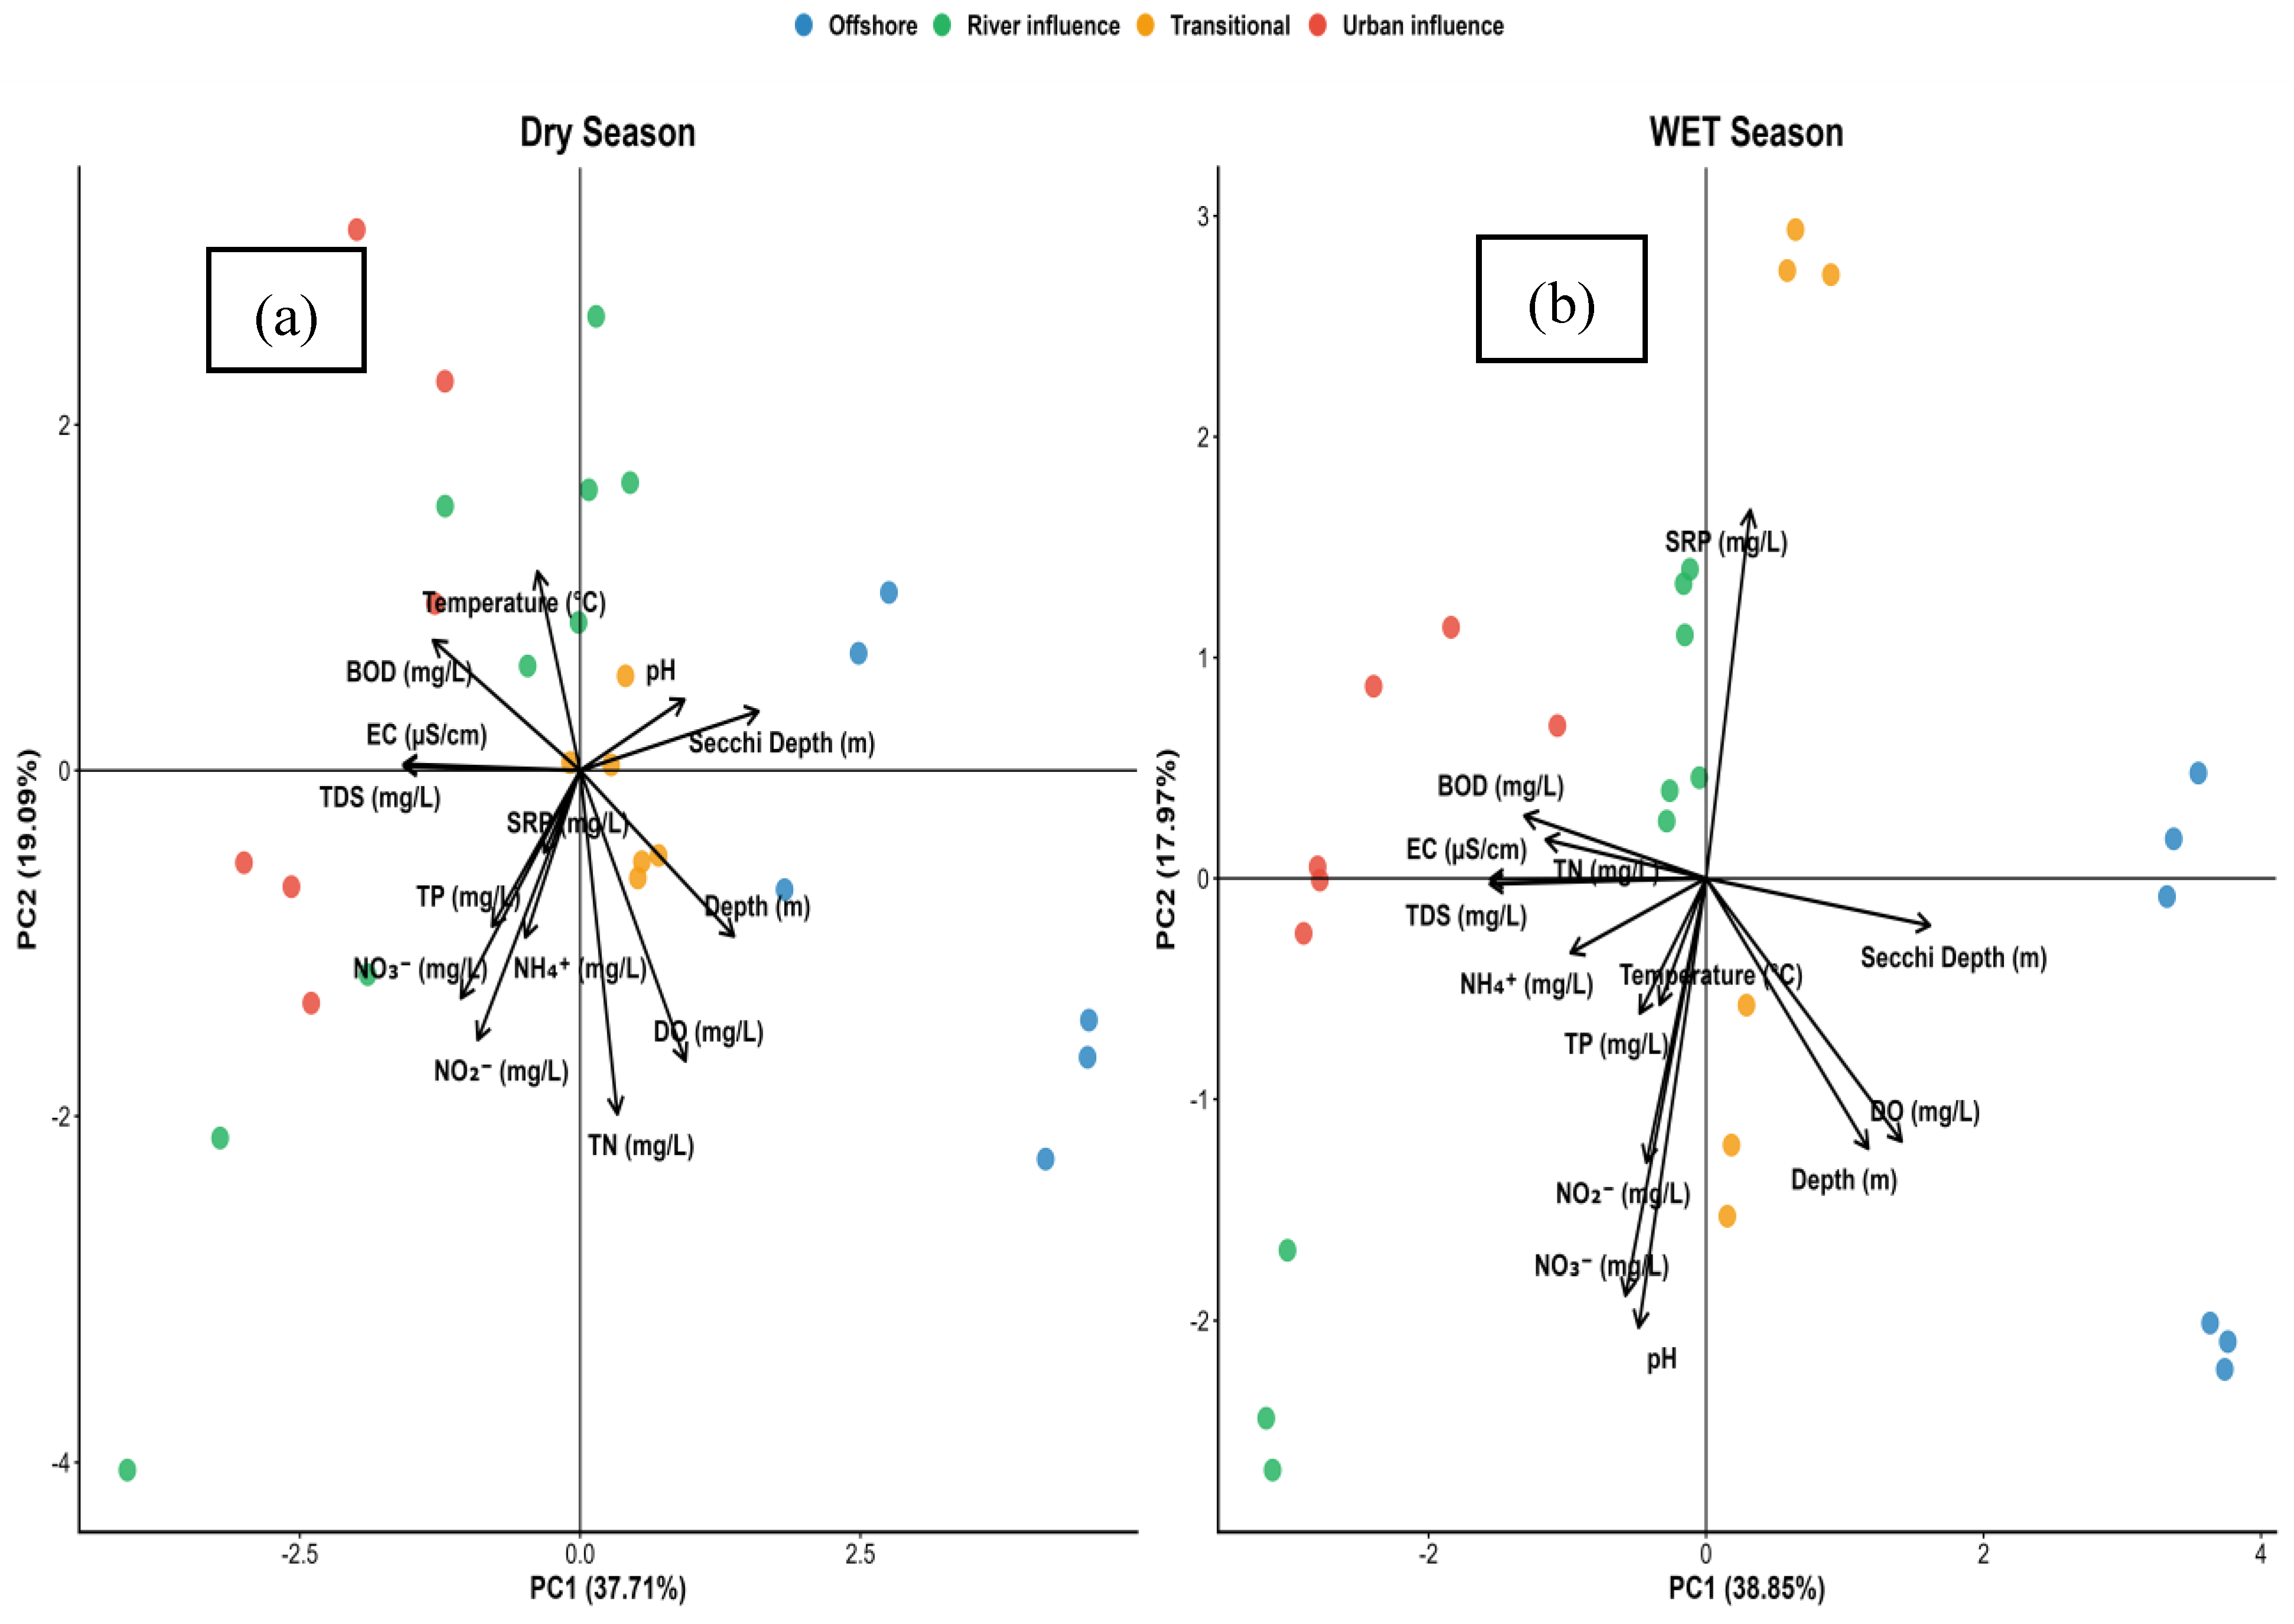
Figure 6.
Relative abundance (%) of phytoplankton genera across four ecological zones during the dry (a)and wet (b)seasons, together with genus richness.
Figure 6.
Relative abundance (%) of phytoplankton genera across four ecological zones during the dry (a)and wet (b)seasons, together with genus richness.
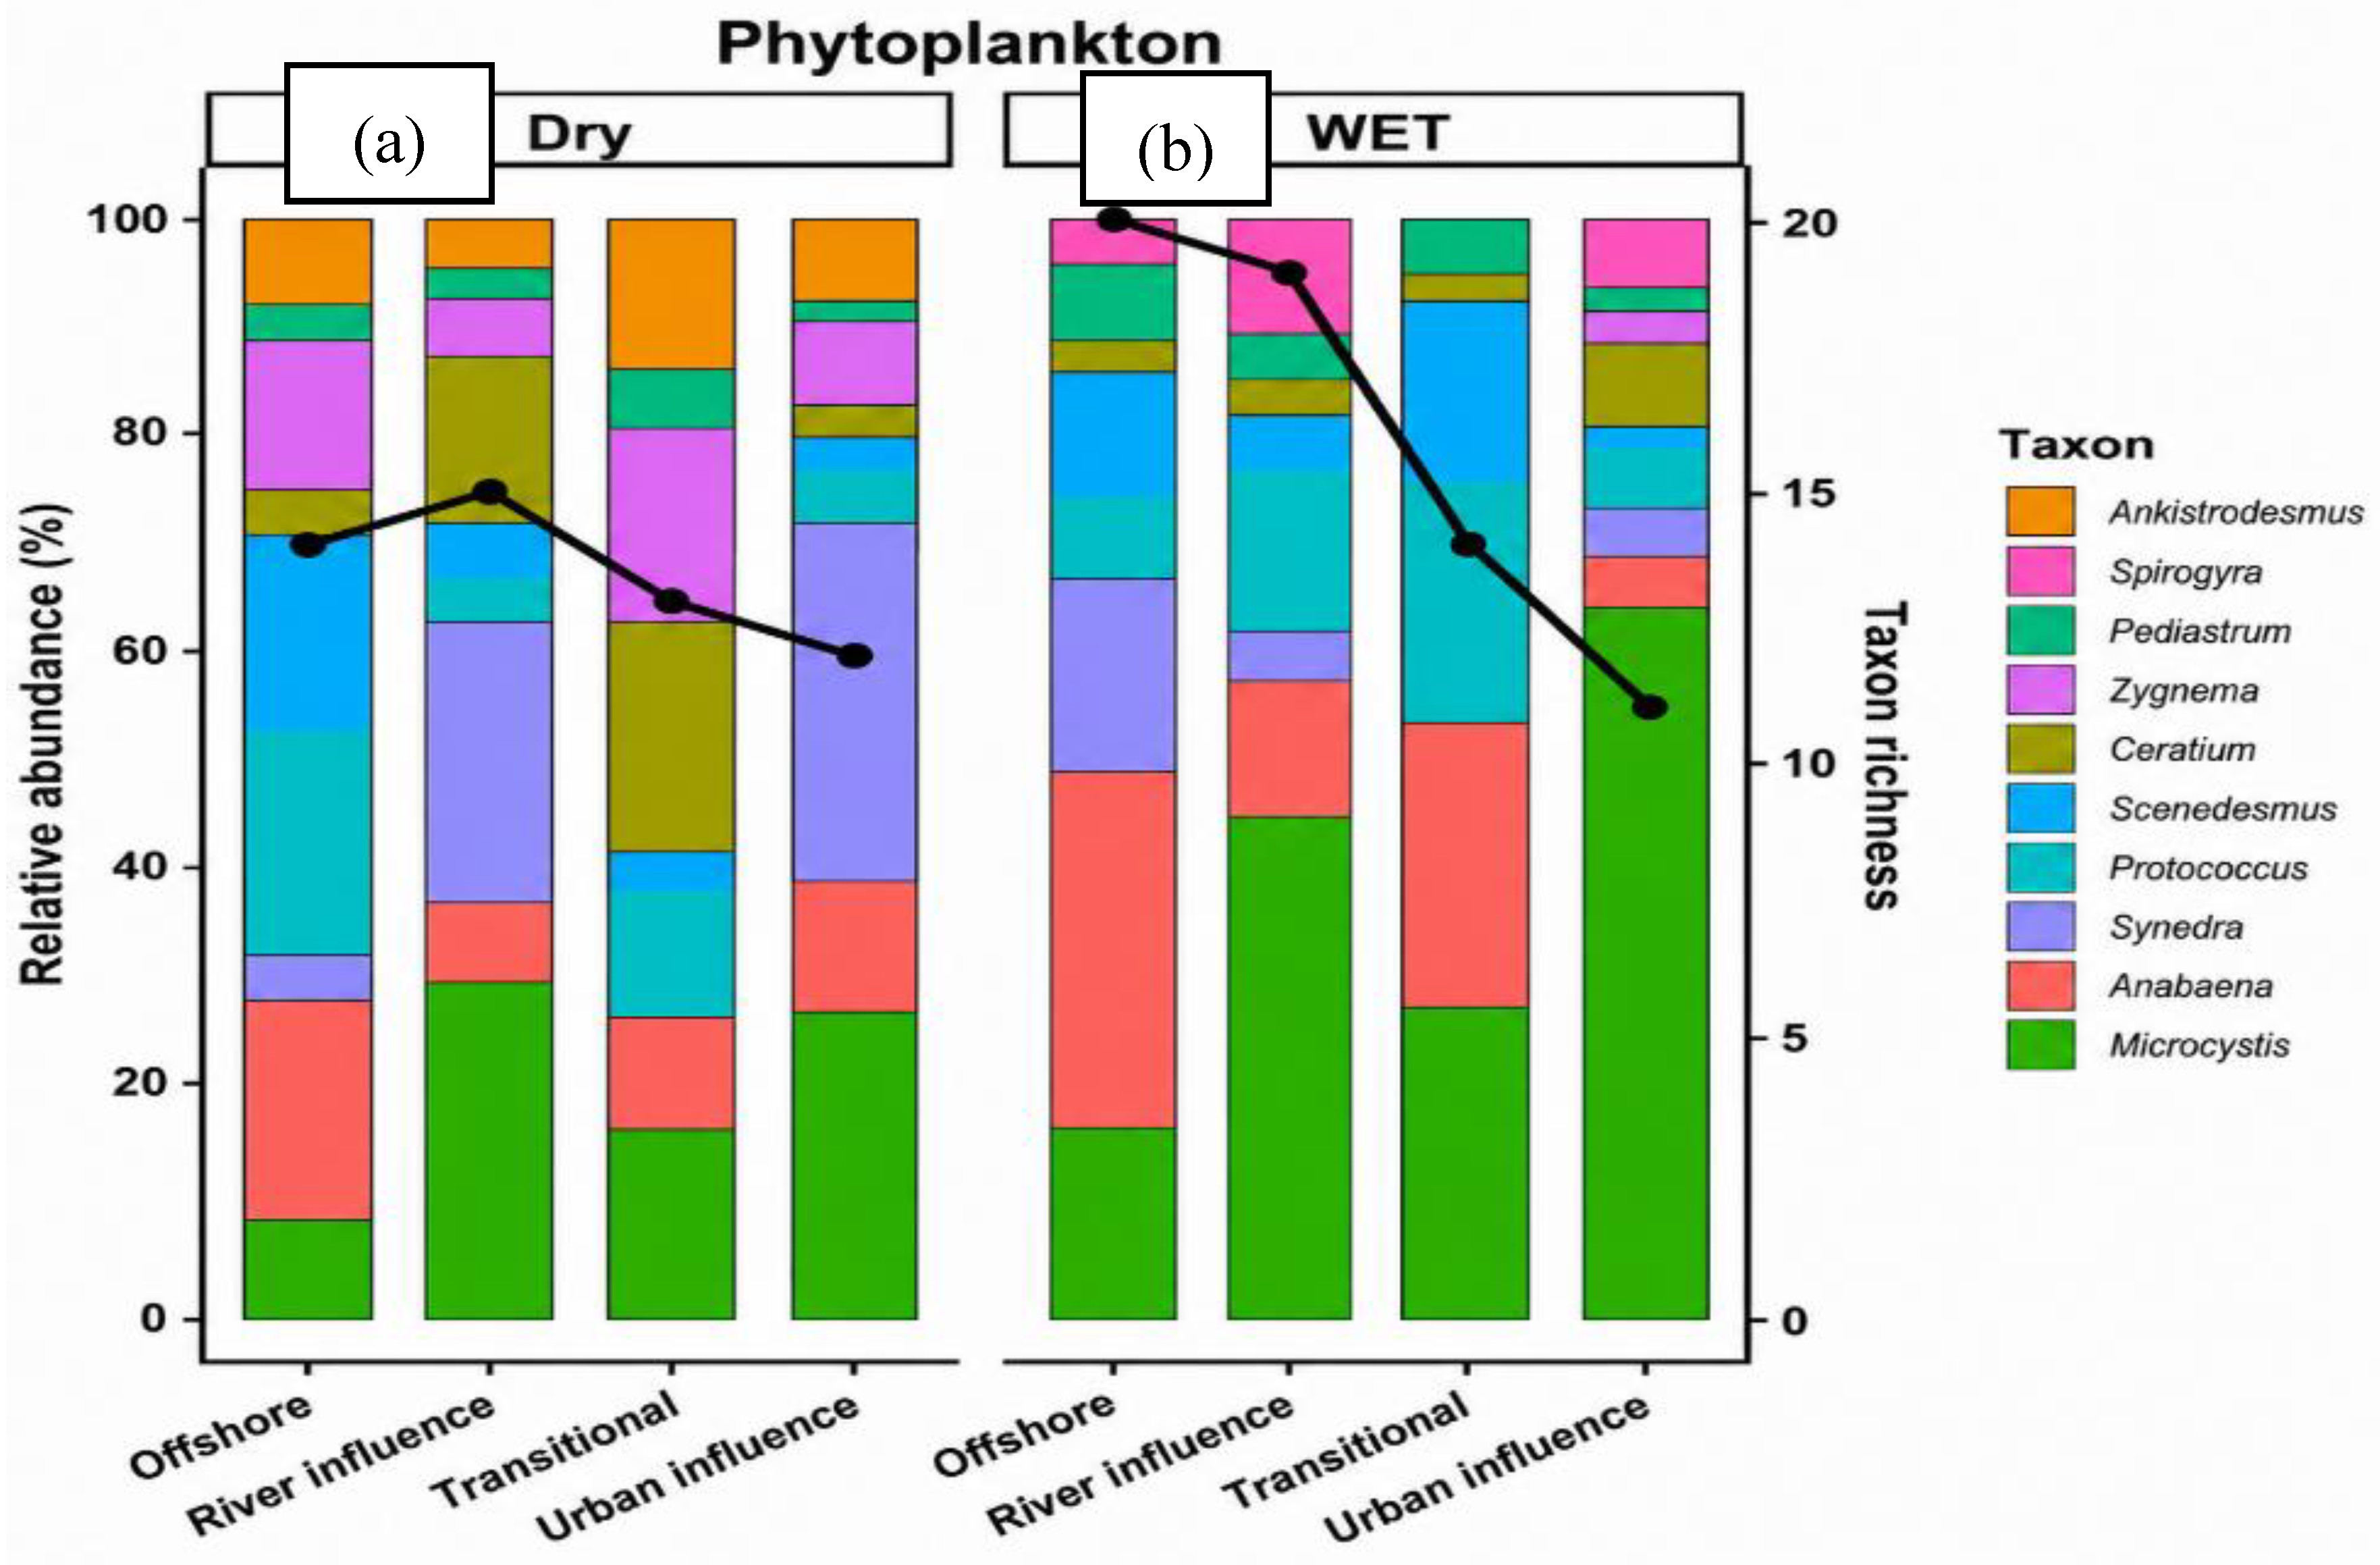
Figure 7.
Non-metric Multidimensional Scaling (NMDS) of phytoplankton communities in the different ecological zones during the dry (a)and wet (b)seasons in Winam Gulf.
Figure 7.
Non-metric Multidimensional Scaling (NMDS) of phytoplankton communities in the different ecological zones during the dry (a)and wet (b)seasons in Winam Gulf.
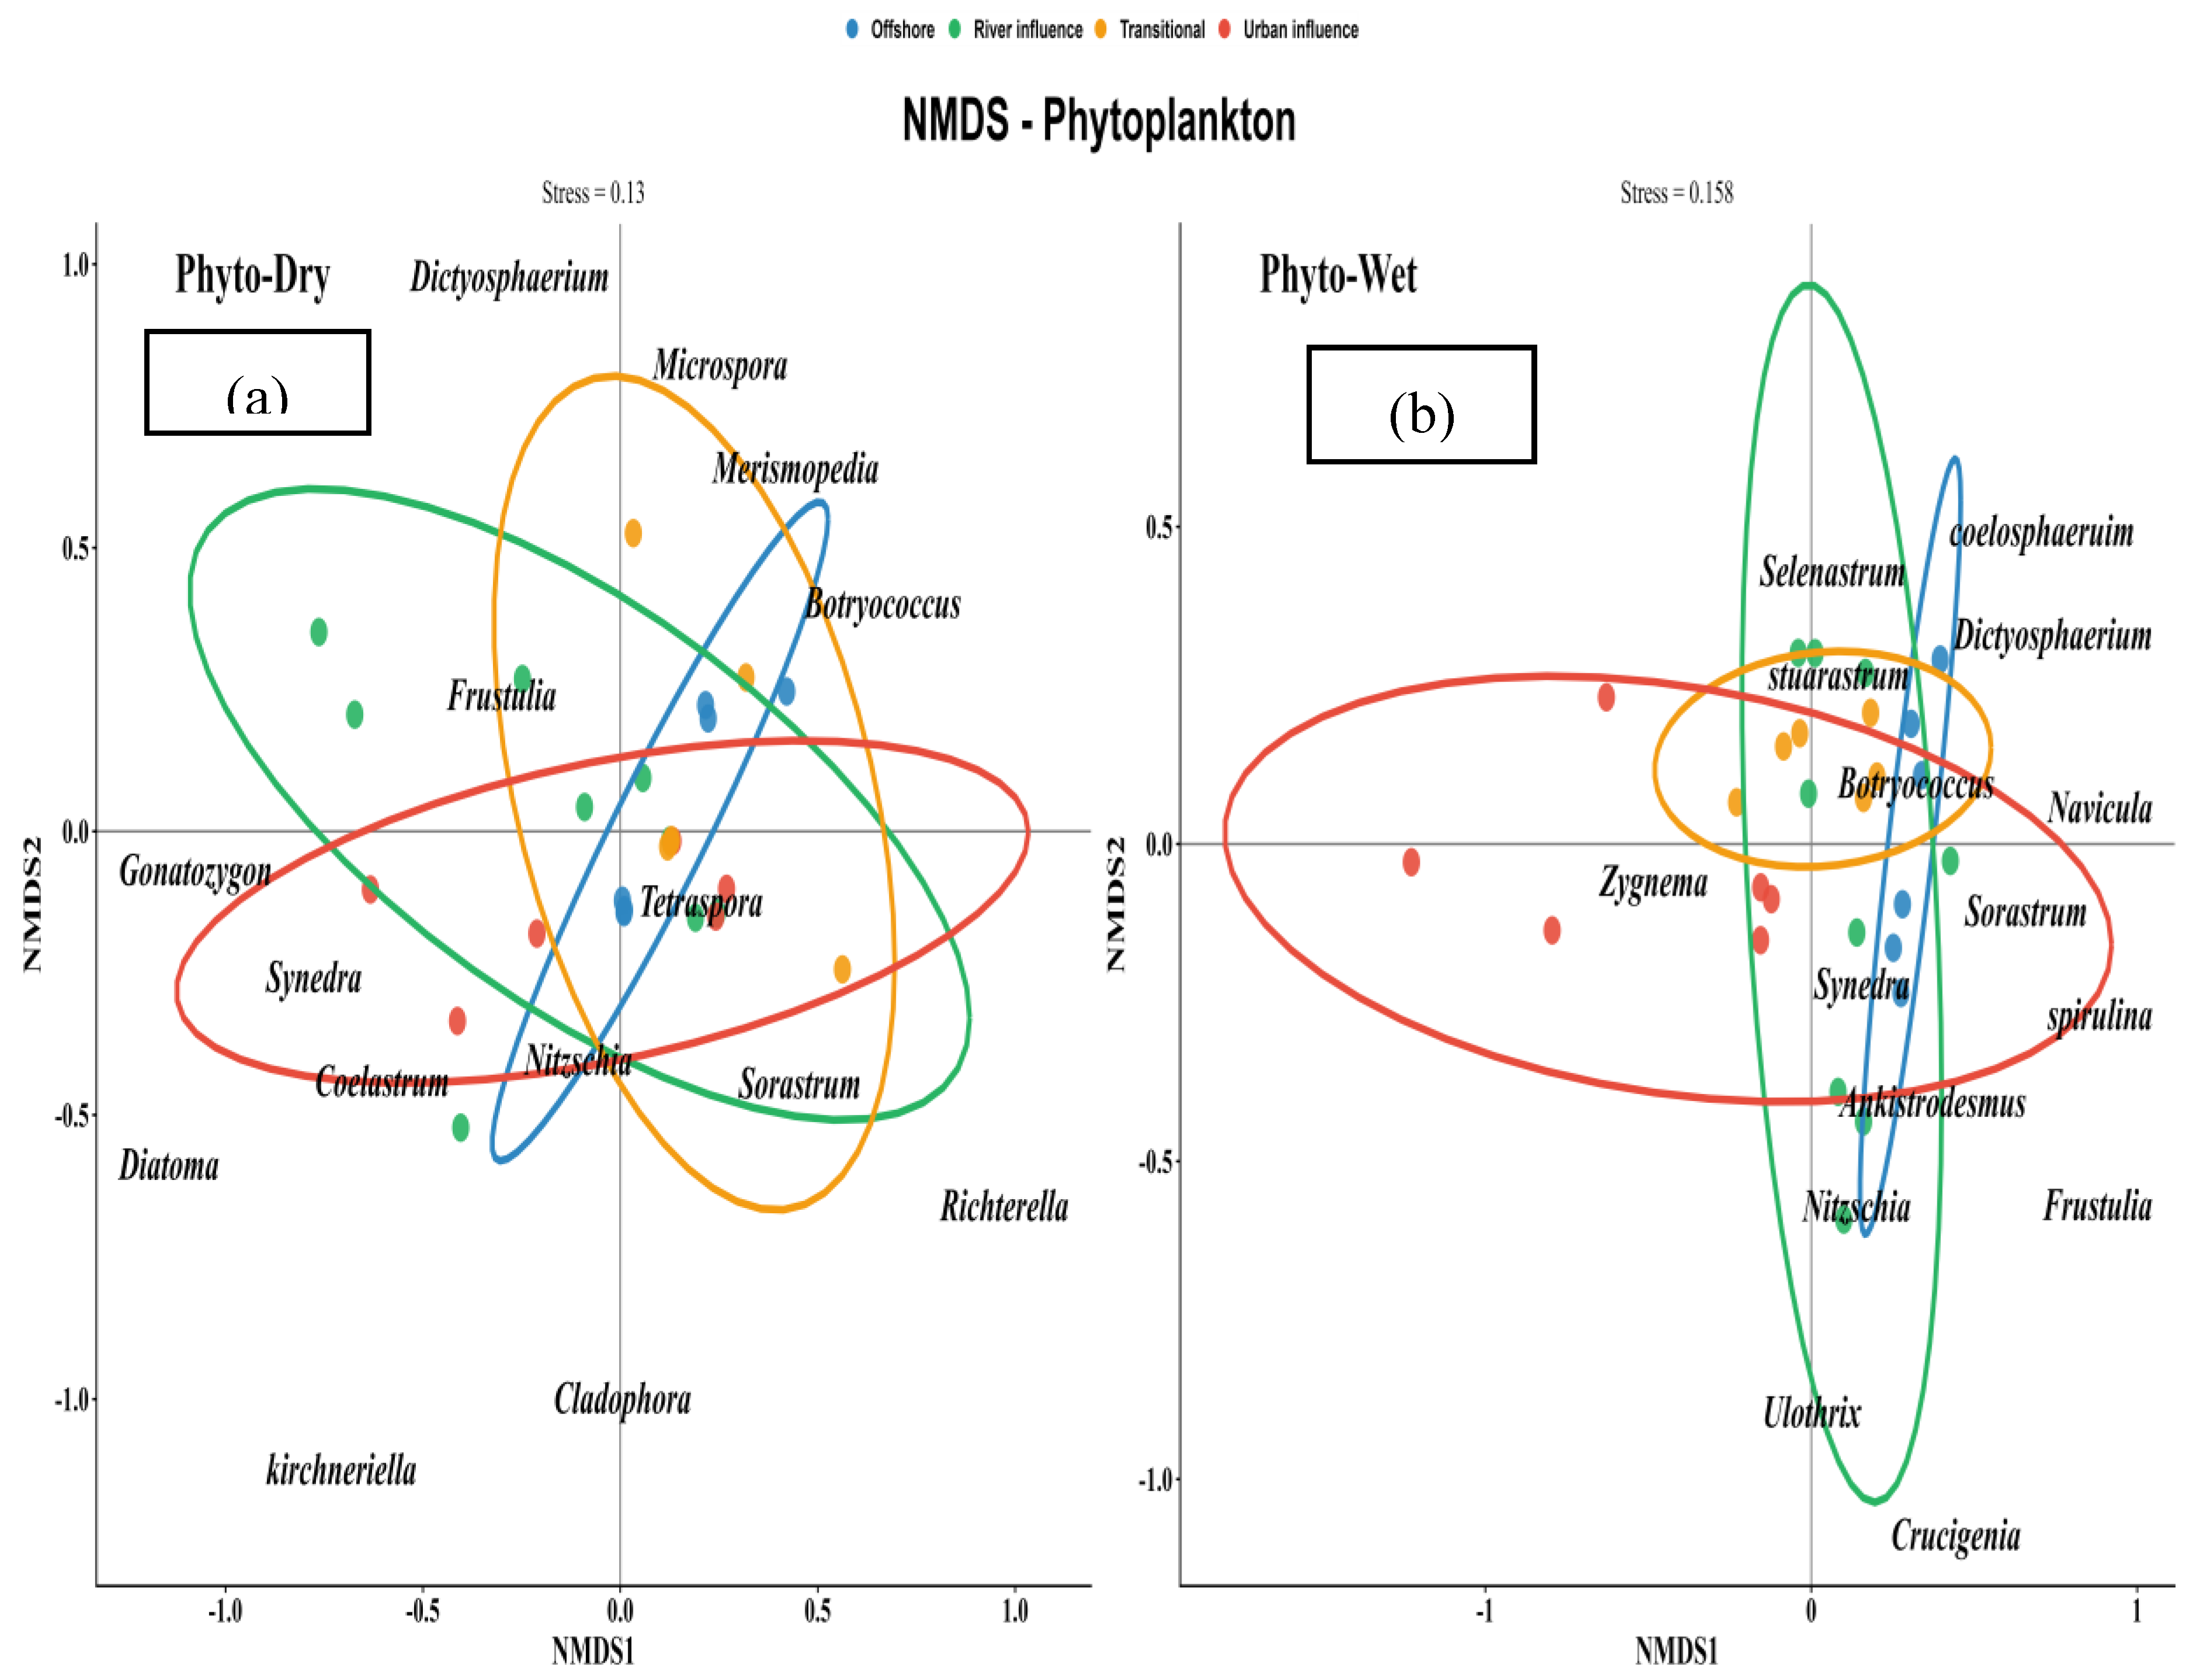
Figure 9.
Correlation between phytoplankton community composition and the physicochemical parameters of Winam Gulf.
Figure 9.
Correlation between phytoplankton community composition and the physicochemical parameters of Winam Gulf.
Disclaimer/Publisher’s Note: The statements, opinions and data contained in all publications are solely those of the individual author(s) and contributor(s) and not of MDPI and/or the editor(s). MDPI and/or the editor(s) disclaim responsibility for any injury to people or property resulting from any ideas, methods, instructions or products referred to in the content. |
© 2026 by the authors. Licensee MDPI, Basel, Switzerland. This article is an open access article distributed under the terms and conditions of the Creative Commons Attribution (CC BY) license (http://creativecommons.org/licenses/by/4.0/).
Copyright: This open access article is published under a Creative Commons CC BY 4.0 license, which permit the free download, distribution, and reuse, provided that the author and preprint are cited in any reuse.