
Submitted:
28 July 2026
Posted:
29 July 2026
You are already at the latest version
Abstract
Network pharmacology has become a central paradigm in modern drug discovery, replacing the reductionist "one drug, one target" view with a systems-level understanding of how compounds engage networks of proteins that are linked to disease. Despite its impact, a typical network-pharmacology study remains fragmented and technically demanding: researchers must query several independent databases, install and reconcile multiple standalone tools for target collection, network construction, hub-gene ranking and pathway enrichment, and then manually bridge the results into structure-based follow-up such as molecular docking. This fragmentation is a persistent barrier, particularly for experimental and non-specialist users. Here we present the network-pharmacology module of Drug Design Studio (DDS) 2.0, a unified, user-friendly platform that automates the entire workflow — disease-target retrieval, compound-target prediction, shared-target identification, protein–protein interaction (PPI) network construction, hub-gene ranking and gene ontology/pathway enrichment — within a single guided interface, removing the burden of assembling disparate packages. Crucially, DDS 2.0 links the resulting hub genes directly to the docking and virtual-screening engine introduced in the previous DDS release: representative experimental structures are selected automatically and streamed into a docking-ready workspace, including for covalent binders. We validate the module by reproducing a published curcumin–triple-negative-breast-cancer (TNBC) study, confirming that DDS recovers the key targets, hubs and pathways. DDS 2.0 thus delivers an integrated route from systems-level analysis to structure-based drug design. DDS 2.0 is freely and publicly accessible via (http://soliman.ukzn.ac.za/DDS2.aspx). Comprehensive user documentation is built directly into DDS and can be accessed at any time from the Documentation panel.
Keywords:
network pharmacology
; drug discovery
; protein–protein interaction network
; hub genes
; molecular docking
; virtual screening
; covalent inhibitors
; integrated software platform
1. Introduction
Drug discovery has historically been guided by the "one drug, one target, one disease" model. Although this reductionist framework has produced many successful therapeutics, it fails to capture the polypharmacological reality that most bioactive small molecules engage multiple proteins, and that complex diseases arise from the perturbation of interconnected molecular networks rather than single genes [1,2]. Network pharmacology emerged as a response to this limitation, integrating systems biology, network science and cheminformatics to model drug action at the level of the interactome [1,2,3]. By mapping how a compound (or a combination of compounds) interacts with a network of targets, and how those targets connect to a disease, network pharmacology enables the identification of key regulatory proteins ("hub genes"), the rationalisation of multi-target mechanisms, and the prioritisation of candidates for experimental follow-up. It has become especially prominent in the study of natural products and multi-component formulations, where multi-target action is the rule rather than the exception [3,4].
Despite its conceptual power, executing a network-pharmacology study in practice is fragmented, laborious and error-prone. A standard workflow requires the researcher to (i) collect disease-associated genes from resources such as Open Targets [5], DisGeNET [6], GeneCards or the Comparative Toxicogenomics Database (CTD) [7]; (ii) collect or predict compound targets from databases such as the Drug–Gene Interaction Database (DGIdb) [8], ChEMBL [9], SwissTargetPrediction [10] or TCMSP [11]; (iii) reconcile gene identifiers across sources, which frequently disagree on symbols and synonyms; (iv) compute the intersection of compound and disease targets; (v) build a protein–protein interaction (PPI) network, typically by exporting the shared genes to STRING [12] and importing the result into Cytoscape [13]; (vi) rank hub genes using a centrality plug-in such as cytoHubba [14]; and (vii) perform gene ontology (GO) [15] and KEGG pathway [16] enrichment through a separate tool such as Enrichr [17], DAVID or clusterProfiler. Each of these steps lives in a different web service, desktop application or scripting environment, each with its own input format, identifier conventions and output layout. The user must install, learn and maintain several packages, manually transfer intermediate files between them, and stitch the results together by hand. This tooling burden slows research, hampers reproducibility, and places a particularly high barrier in front of experimental biologists and medicinal chemists who are not computational specialists.
A second, deeper gap follows the analysis itself. Network pharmacology identifies which proteins matter, but it does not, on its own, take the researcher to the next logical step — structure-based investigation of how the compound engages those proteins. Bridging hub genes to molecular docking requires yet another manual chain: mapping each gene to a protein, searching the Protein Data Bank (PDB) [18], judging which of the many available structures is the most suitable representative (a decision that usually demands a literature search), downloading and preparing it, and configuring a docking box. This hand-off is tedious and is rarely automated, so the systems-level and structure-based halves of a drug-discovery campaign remain disconnected in most workflows.
Drug Design Studio (DDS) was introduced as a cross-platform desktop application that unifies structure-based drug design — receptor preparation, molecular docking, covalent and non-covalent virtual screening, and protein–ligand interaction analysis — behind a single guided interface, removing the need to assemble separate command-line tools for a docking campaign. Building on that foundation, we here present a substantial extension: a complete network-pharmacology module in DDS 2.0. The module automates the full network-pharmacology protocol — from disease and compound target assembly, through PPI network construction and hub-gene ranking, to GO/KEGG enrichment — inside the same application, so that a study that previously spanned half a dozen tools is completed in one guided, five-to-six step workflow. More importantly, the module is not a standalone add-on: its hub-gene output is integrated directly with the docking and virtual-screening engine of the earlier DDS release. Representative experimental structures for the top hub genes are selected automatically and delivered, docking-ready, into the DDS docking workspace — including the covalent-docking protocols — thereby closing the loop from network-level analysis to structure-based design. To our knowledge, this end-to-end integration of an automated network-pharmacology pipeline with an automated, covalent-aware docking and virtual-screening workflow, in a single user-installable application, is not offered by existing tools.
2. Methods: Software Architecture and Implementation
This section describes the design of the DDS 2.0 network-pharmacology module in detail: the overall architecture, each analysis stage and the method, algorithm and data source used to implement it.
2.1. Overall Architecture and Design
DDS is a cross-platform desktop application composed of two layers. The user interface is a web-technology front end (React) that presents a guided, step-based workflow mirroring the layout of the DDS docking module, so that users familiar with one module can immediately use the other. Compute is handled by a local Python engine exposed as a lightweight web service (FastAPI/uvicorn); the same engine hosts the docking functionality of the previous DDS release, which is what makes the network-pharmacology-to-docking integration native rather than an external bridge. Long-running analyses execute as background jobs so the interface remains responsive and results persist while the user moves between steps and modules. Whereas the docking engine runs entirely offline, the network-pharmacology module is online by design: it queries public, programmatically accessible biological databases in real time. All queried resources are free and require no registration key, so the module works out of the box. Network operations use the NetworkX library [19]; interactive networks are rendered with Cytoscape.js [20]; charts and figures are generated natively and exported as high-resolution PNG (transparent, white or dark background) or vector SVG; and tabular data and reports are packaged for download.
The workflow is organised as a sequence of steps, each feeding the next: (1) Disease targets, (2) Compound targets, (3) Network (shared targets + PPI), (4) Hub genes, (5) Enrichment, and (6) Structures for docking.
2.2. Disease-Associated Target Retrieval
Disease-associated genes are retrieved from the Open Targets Platform through its GraphQL API [5], which returns, for a queried disease, its associated targets together with an evidence-based association score (0–1) aggregating genetic, genomic, transcriptomic, pathway and literature evidence. Results are paginated exhaustively so that the full associated-gene set is obtained rather than a truncated top slice. Optionally, curated gene–disease associations from CTD [7] can be included. Retrieved genes are ranked by association score and can be filtered by a user-defined minimum-score cutoff. Importantly, users are not restricted to the built-in sources: a custom gene list from any external resource (e.g. GeneCards, OMIM, DisGeNET or a manually curated set) can be pasted or uploaded and is unioned with the database results, allowing the target library to be broadened as the study requires.
2.3. Compound-Target Prediction and Library Assembly
Compound targets are assembled from two complementary, key-free sources. Curated drug–gene interactions are obtained from DGIdb via its GraphQL API [8], and experimentally measured bioactivities are obtained from ChEMBL via its web-services API [9]; ChEMBL target resolution is parallelised to keep query times short. Each predicted target is assigned a normalised confidence score (0–1) reflecting the strength of the supporting evidence, and targets are ranked by confidence with a user-adjustable cutoff. As with disease targets, users may broaden the compound-target library by pasting or uploading externally predicted targets, for example from SwissTargetPrediction [10] or TCMSP [11], which are merged with the database-derived set. The compound can be specified by name or by SMILES string.
2.4. Gene-Symbol Normalisation
Because different databases report gene identifiers inconsistently, all retrieved genes are normalised to official HGNC gene symbols using an internal alias table (for example, HER2 to ERBB2 and COX2 to PTGS2). Normalisation is applied before any set operation, so that combined libraries are clean, de-duplicated lists and cross-source intersections never miss a target owing to a synonym mismatch.
2.5. Shared-Target Identification
The shared targets — the intersection of the compound-target set and the disease-gene set — are computed and presented as an auto-labelled, exportable Venn diagram reporting the size of each region. These shared targets constitute the candidate therapeutic targets that are carried forward into the network analysis.
2.6. Protein–Protein Interaction (PPI) Network Construction
The shared-target set is submitted to the STRING database API [12] to retrieve experimentally supported and predicted protein–protein interactions at a user-selectable confidence threshold (default 0.4). The resulting interactions are assembled into a graph with NetworkX [19] and rendered as an interactive, concentric, degree-ranked network using Cytoscape.js [20], with node colour and size scaled to connectivity and an accompanying colour-scale legend.
2.7. Hub-Gene Identification
Hub genes are the most topologically central nodes of the PPI network and represent the most probable key regulators for downstream investigation. Centrality is computed with NetworkX [20]. The default metric is Maximal Clique Centrality (MCC), the method popularised by the cytoHubba Cytoscape plug-in [14], computed as the sum over all maximal cliques containing a node of (|C| − 1)!, where |C| is the clique size; maximal cliques are enumerated using the Bron–Kerbosch procedure. Degree, betweenness and closeness centrality are also provided and can be selected by the user. The top-ranked nodes are reported both on the network and as a ranked, cytoHubba-style concentric figure in which the most central hub sits at the centre and node colour and size scale with the centrality score.
2.8. Functional Enrichment
The shared-target set is submitted to Enrichr [17] for over-representation analysis against Gene Ontology [15] (Biological Process, Molecular Function and Cellular Component) and KEGG pathways [16]. For each enriched term, DDS records the p-value, the Benjamini–Hochberg adjusted p-value (FDR), the Enrichr combined score, and the member genes. Enrichment results are presented as GO dot plots (term versus enrichment strength, with dot size scaled to the number of member genes and colour to −log10 FDR), a KEGG hub-gene-to-pathway Sankey diagram combined with a pathway lollipop/bubble plot, and a concentric compound–target–pathway network.
2.9. Multi-Compound and Multi-Disease Modes
Two batch modes extend the single-compound, single-disease workflow, with a deliberate semantic distinction. In multi-compound mode, several compounds are analysed together and their targets are pooled as a union, with each target annotated by how many compounds engage it, so that broadly engaged targets rank higher; this is appropriate for multi-ingredient formulations or drug combinations. In multi-disease mode, several diseases are analysed together and DDS takes the intersection of their gene sets — the shared, potentially comorbid-mechanism targets — which then proceed through the standard workflow. In both modes the downstream analysis (shared targets, PPI, hub genes, enrichment) is unchanged; only the assembly of the target sets differs.
2.10. Covalent-Targetable Annotation
To connect network pharmacology with the covalent-docking capability of DDS, every target is cross-referenced against a curated reference of covalently ligandable proteins (proteins bearing targetable cysteine, catalytic serine/cysteine or other reactive nucleophilic residues) and flagged accordingly. Both the disease-target and compound-target libraries can be filtered to covalent-targetable proteins only, allowing a covalent-focused network-pharmacology analysis that feeds naturally into the DDS covalent-docking protocols.
2.11. Automated Structure Selection and Docking Integration
The distinguishing feature of DDS 2.0 is the automated hand-off from hub genes to structure-based docking. For each top hub gene, DDS resolves a representative experimental structure through the following pipeline: the gene symbol is mapped to its reviewed human UniProt accession [21]; the cross-referenced PDB entries [18] are retrieved together with their experimental method, resolution, chain coverage and bound ligands (the latter via the RCSB PDB data API). Candidate structures are then ranked for docking suitability by a composite score that rewards X-ray and cryo-electron-microscopy structures over NMR ensembles, higher resolution, broader coverage of the mapped domain, and — most importantly — the presence of a bound drug-like ligand, since a co-crystallised ligand both marks the true binding pocket and provides a natural centre for the docking search box. Common crystallisation additives, ions and buffers are excluded from the ligand assessment. The top-ranked structure is recommended and shown with its metadata and alternatives; when no experimental structure is available for a target, the corresponding AlphaFold [22] predicted model is offered as a fallback and is clearly labelled as such.
With a single action, the selected structure is streamed into the DDS docking module: the receptor is fetched and prepared automatically, and the docking search box is pre-centred on the co-crystallised ligand, so the structure arrives docking-ready in the workspace shared with the covalent and non-covalent docking and virtual-screening protocols of the previous DDS release. This removes the manual literature search, structure selection, preparation and box-configuration steps that normally separate network pharmacology from docking. All structure data derive from public, key-free resources (UniProt, RCSB PDB and AlphaFold DB). Molecular docking itself is performed by the DDS engine using AutoDock Vina [23].
2.12. Visualisation, Reporting and Export
All networks and figures are interactive and exportable. Networks (PPI, compound–target–pathway, hub-gene) and figures (Venn diagrams, GO dot plot, KEGG Sankey/bubble figure) can be exported as high-resolution PNG (transparent, white or dark background) or vector SVG for direct use in publications. A one-click report export produces (i) a full PDF report containing a summary, methods and protocol description, the disease- and compound-target tables, the shared-target set, the hub-gene ranking, the enrichment tables and references; and (ii) a compressed archive of comma-separated-value (CSV) files containing every analysis table (target libraries, intersections, PPI nodes and edges, hub genes and enrichment results) with descriptive file names, ready for spreadsheet analysis or archival as supplementary data.
3. Results and Discussion
3.1. Overview
The DDS 2.0 network-pharmacology module implements the complete network-pharmacology protocol described above within a single guided application, and connects it directly to the DDS docking and virtual-screening engine. In practice, a study that would conventionally require the user to visit and reconcile Open Targets, DGIdb, ChEMBL, STRING, cytoHubba, Enrichr, the PDB and a docking package — installing and learning several tools and manually transferring intermediate files — is completed inside one interface, with every intermediate and final result available for interactive inspection and one-click export. The overall workflow and the module interface are shown in Figure 1 and Figure 2. The figures presented here illustrate the wide range of DDS features and do not necessarily correspond to the benchmarking analysis; the exact methods used in the benchmark are provided in the accompanying data sheets (Supplementary Material, SM1) and the generated network-pharmacology report (Supplementary Material, SM2), both generated automatically by DDS.
To verify that this automation does not compromise scientific validity, we did not re-derive a new method; instead we benchmarked the module against an independent, previously published network-pharmacology study, checking that DDS reproduces its principal findings when applied to the same system.
3.2. Benchmark Case Study: Curcumin in Triple-Negative Breast Cancer
As a benchmark, we reproduced a published network-pharmacology analysis of curcumin in triple-negative breast cancer (TNBC) [24], a well-studied system for the multi-target action of a natural product. The same disease (TNBC) and PPI resource (STRING) as the reference study were used, so that the comparison is consistent. The analysis was run end-to-end in DDS using its default settings (Open Targets for disease genes; DGIdb and ChEMBL for compound targets; STRING confidence 0.4 for the PPI network; Enrichr for GO/KEGG enrichment), and is available in the module as a one-click validation case.
Target retrieval and shared targets. DDS retrieved a comprehensive set of TNBC-associated genes from Open Targets and a curated/measured set of curcumin targets from DGIdb and ChEMBL, and computed their intersection as the candidate therapeutic targets. Notably, the target-retrieval scale matched the reference study closely (2490 vs 2060 disease targets; 134 vs 118 curcumin targets), despite the two workflows drawing on different source databases. The summary counts are given in Table 1, and the intersection is shown as a Venn diagram in Figure 3.
PPI network and hub genes. The 84 shared targets were submitted to STRING and assembled into a PPI network of 81 nodes and 688 edges. Topological ranking identified a set of highly connected hub genes dominated by well-established TNBC and curcumin-responsive signalling regulators. The top hub genes by degree centrality are listed in Table 2; the PPI network and the cytoHubba-style hub-gene figure are shown in Figure 4 and Figure 5.
Ranked by degree centrality, the recovered hubs— including EGFR, HIF1A, STAT3, JUN, EP300, NFKB1 and PTGS2 — are consistent with the central mediators reported for curcumin activity in TNBC in the reference study [25] and in the wider literature, confirming that DDS recovers the biologically meaningful core of the network. Directly comparing the two studies, six of the ten hub genes reported by the reference study (STAT3, EGFR, EP300, PTGS2, MMP9 and NFE2L2) are recovered within the DDS shared-target network, four of them (STAT3, EGFR, EP300, PTGS2) among the DDS top ten. DDS additionally offers MCC, betweenness and closeness centrality; for this system the MCC ranking is skewed by a tubulin paralog clique introduced by the ChEMBL bioactivity data — a known behaviour of clique-based centrality on paralog-rich sets — so degree centrality gives the more biologically representative hub set here.
Functional enrichment. GO and KEGG enrichment of the shared-target set returned terms consistent with the known pharmacology of curcumin in cancer, including the regulation of transcription, programmed cell death and response to oxidative stress at the GO level, and cancer-associated signalling pathways at the KEGG level. Representative enriched terms are summarised in Table 3, and the enrichment figures (GO dot plot and KEGG hub-to-pathway Sankey/bubble figure) are shown in Figure 6 and Figure 7. Complete enrichment tables, with p-values, adjusted p-values (FDR), combined scores and member genes for every term and every library, are provided in the Supplementary Material (SM1).
Reproducibility assessment. Running the same disease (TNBC) through the DDS pipeline, the target-retrieval scale, the shared-target set, the top hub genes and the enriched GO/KEGG terms all agree closely with the published reference study [25]. A detailed side-by-side comparison of the key parameters is given in Table 4. The disease- and compound-target counts are of the same order (2490 vs 2060 and 134 vs 118, respectively); the modestly larger DDS intersection (84 vs 40) reflects the different source databases (Open Targets and DGIdb/ChEMBL vs OMIM/TTD/DisGeNET and SwissTargetPrediction/ETCM) rather than a difference in method; and six of the reference study’s ten hub genes are recovered by DDS, together with the same principal cancer pathways (PI3K–Akt signalling and microRNAs in cancer). This concordance demonstrates that consolidating the workflow into a single automated platform preserves the scientific results while eliminating the manual, multi-tool overhead.
Automated structure selection and docking hand-off. Finally, we exercised the network-pharmacology-to-docking integration on the benchmark hubs. For each top hub gene, DDS automatically resolved a representative experimental structure and, where a suitable holo structure existed, pre-centred the docking box on the co-crystallised ligand; representative selections are given in Table 5. Selecting "send to docking" delivered the prepared receptor into the DDS docking workspace ready for docking of curcumin, with no manual PDB searching, preparation or box configuration required (Figure 8). For hub genes lacking a suitable experimental structure (e.g. largely disordered transcription factors), DDS instead offered the corresponding AlphaFold model, ensuring that even difficult targets have a defined starting point.
Taken together, the benchmark confirms that DDS 2.0 reproduces an established network-pharmacology result and, uniquely, carries that result forward into a docking-ready, covalent-aware structure-based workspace within the same application.
3.3. Comparison with Existing Approaches and Limitations
Existing network-pharmacology practice relies on chaining several independent resources and tools, each requiring separate installation, identifier handling and manual data transfer, and stops short of structure-based follow-up. DDS 2.0 consolidates the entire protocol into one guided application and, distinctively, automates the hand-off to docking and virtual screening, including for covalent binders. Because the module queries live public databases, its results reflect the current content of those resources and require network access; this is a deliberate design choice that keeps target and interaction data up to date without bundling static snapshots, and users may supplement or override any library with their own uploaded data. As with all network-pharmacology analyses, the biological interpretation of hubs and pathways should be informed by domain knowledge, and the automatically selected structures should be reviewed for suitability before production docking — a step that DDS supports by surfacing structure metadata, alternatives and coverage caveats.
4. Conclusions
Network pharmacology is now a mainstream strategy in drug discovery, yet the way it is carried out remains fragmented: researchers must assemble and reconcile a chain of separate databases and single-purpose tools to move from a compound and a disease to a ranked set of hub genes and enriched pathways, and there is typically no straightforward route from that systems-level output to structure-based follow-up such as docking, virtual screening or molecular dynamics. This fragmentation is a real and recurring obstacle, especially for experimental scientists and non-specialists, and it undermines both efficiency and reproducibility.
DDS 2.0 addresses this gap by delivering the complete network-pharmacology workflow — disease- and compound-target assembly, gene-symbol normalisation, shared-target identification, PPI network construction, hub-gene ranking and GO/KEGG enrichment, together with multi-compound and multi-disease batch modes and covalent-targetable annotation — inside a single, guided, user-friendly platform, with every result available for interactive inspection and one-click export as publication-ready figures, a full PDF report and CSV data. Above all, DDS 2.0 unifies this network-pharmacology capability with the docking and virtual-screening engine of the previous DDS release: hub genes are automatically mapped to representative experimental structures and streamed, docking-ready, into a workspace that already supports both non-covalent and covalent protocols, with the search box pre-centred on the co-crystallised ligand. In doing so, DDS removes the manual burden of installing and bridging multiple tools and, for the first time in a single user-installable application, closes the loop from systems-level network analysis to covalent-aware structure-based drug design. We anticipate that this integration will lower the barrier to network-pharmacology-driven discovery and make the transition from target-network analysis to structure-based optimisation routine rather than exceptional.
Supplementary Materials
The following supporting information can be downloaded at the website of this paper posted on Preprints.org.
Author Contributions
Mahmoud E. Soliman: Conceptualization; methodology; software; validation; visualization; writing – original draft; writing – review and editing. The author read and approved the final manuscript.
Data Availability Statement
DDS is a cross-platform desktop application. Full analysis tables and the automatically generated report for the benchmark case study are provided as Supplementary Material SM1 (CSV data archive and PDF report). DDS 2.0 is freely and publicly accessible via (http://soliman.ukzn.ac.za/DDS2.aspx). Comprehensive user documentation is built directly into DDS and can be accessed at any time from the Documentation panel.
AI Use Declaration
During the development of the software and the preparation of this manuscript, the author used generative AI–assisted tools to help scaffold and write portions of the source code and to draft and edit text; all AI-assisted outputs were reviewed, tested, corrected and validated by the author, who directed the work throughout and takes full responsibility for the scientific content, the correctness of the software and the integrity of this article.
Conflicts of Interest
The author declares no conflicts of interest.
References
- Hopkins, A.L. Network Pharmacology: The next Paradigm in Drug Discovery. Nature Chemical Biology 2008 4:11 2008, 4, 682–690. [CrossRef]
- Barabási, A.L.; Gulbahce, N.; Loscalzo, J. Network Medicine: A Network-Based Approach to Human Disease. Nat. Rev. Genet. 2011, 12, 56. [CrossRef]
- Zhang, R.; Zhu, X.; Bai, H.; Ning, K. Network Pharmacology Databases for Traditional Chinese Medicine: Review and Assessment. Front. Pharmacol. 2019, 10, 123. [CrossRef]
- Boezio, B.; Audouze, K.; Ducrot, P.; Taboureau, O. Network-Based Approaches in Pharmacology. Mol. Inform. 2017, 36, 1700048. [CrossRef]
- Ochoa, D.; Hercules, A.; Carmona, M.; Suveges, D.; Baker, J.; Malangone, C.; Lopez, I.; Miranda, A.; Cruz-Castillo, C.; Fumis, L.; et al. The Next-Generation Open Targets Platform: Reimagined, Redesigned, Rebuilt. Nucleic Acids Res. 2023, 51, D1353–D1359. [CrossRef]
- Piñero, J.; Ramírez-Anguita, J.M.; Saüch-Pitarch, J.; Ronzano, F.; Centeno, E.; Sanz, F.; Furlong, L.I. The DisGeNET Knowledge Platform for Disease Genomics: 2019 Update. Nucleic Acids Res. 2019, 48, D845. [CrossRef]
- Davis, A.P.; Wiegers, T.C.; Johnson, R.J.; Sciaky, D.; Wiegers, J.; Mattingly, C.J. Comparative Toxicogenomics Database (CTD): Update 2023. Nucleic Acids Res. 2022, 51, D1257. [CrossRef]
- Freshour, S.L.; Kiwala, S.; Cotto, K.C.; Coffman, A.C.; McMichael, J.F.; Song, J.J.; Griffith, M.; Griffith, O.L.; Wagner, A.H. Integration of the Drug–Gene Interaction Database (DGIdb 4.0) with Open Crowdsource Efforts. Nucleic Acids Res. 2020, 49, D1144. [CrossRef]
- Zdrazil, B.; Felix, E.; Hunter, F.; Manners, E.J.; Blackshaw, J.; Corbett, S.; de Veij, M.; Ioannidis, H.; Lopez, D.M.; Mosquera, J.F.; et al. The ChEMBL Database in 2023: A Drug Discovery Platform Spanning Multiple Bioactivity Data Types and Time Periods. Nucleic Acids Res. 2024, 52, D1180–D1192. [CrossRef]
- Daina, A.; Michielin, O.; Zoete, V. SwissTargetPrediction: Updated Data and New Features for Efficient Prediction of Protein Targets of Small Molecules. Nucleic Acids Res. 2019, 47, W357. [CrossRef]
- Ru, J.; Li, P.; Wang, J.; Zhou, W.; Li, B.; Huang, C.; Li, P.; Guo, Z.; Tao, W.; Yang, Y.; et al. TCMSP: A Database of Systems Pharmacology for Drug Discovery from Herbal Medicines. J. Cheminform. 2014, 6, 13. [CrossRef]
- Szklarczyk, D.; Kirsch, R.; Koutrouli, M.; Nastou, K.; Mehryary, F.; Hachilif, R.; Gable, A.L.; Fang, T.; Doncheva, N.T.; Pyysalo, S.; et al. The STRING Database in 2023: Protein–Protein Association Networks and Functional Enrichment Analyses for Any Sequenced Genome of Interest. Nucleic Acids Res. 2022, 51, D638. [CrossRef]
- Shannon, P.; Markiel, A.; Ozier, O.; Baliga, N.S.; Wang, J.T.; Ramage, D.; Amin, N.; Schwikowski, B.; Ideker, T. Cytoscape: A Software Environment for Integrated Models of Biomolecular Interaction Networks. Genome Res. 2003, 13, 2498–2504. [CrossRef]
- Chin, C.H.; Chen, S.H.; Wu, H.H.; Ho, C.W.; Ko, M.T.; Lin, C.Y. CytoHubba: Identifying Hub Objects and Sub-Networks from Complex Interactome. BMC Syst. Biol. 2014, 8, S11-. [CrossRef]
- Carbon, S.; Douglass, E.; Good, B.M.; Unni, D.R.; Harris, N.L.; Mungall, C.J.; Basu, S.; Chisholm, R.L.; Dodson, R.J.; Hartline, E.; et al. The Gene Ontology Resource: Enriching a GOld Mine. Nucleic Acids Res. 2020, 49, D325. [CrossRef]
- Kanehisa, M.; Furumichi, M.; Sato, Y.; Kawashima, M.; Ishiguro-Watanabe, M. KEGG for Taxonomy-Based Analysis of Pathways and Genomes. Nucleic Acids Res. 2022, 51, D587. [CrossRef]
- Kuleshov, M. V.; Jones, M.R.; Rouillard, A.D.; Fernandez, N.F.; Duan, Q.; Wang, Z.; Koplev, S.; Jenkins, S.L.; Jagodnik, K.M.; Lachmann, A.; et al. Enrichr: A Comprehensive Gene Set Enrichment Analysis Web Server 2016 Update. Nucleic Acids Res. 2016, 44, W90. [CrossRef]
- Burley, S.K.; Bhikadiya, C.; Bi, C.; Bittrich, S.; Chen, L.; Crichlow, G. V.; Christie, C.H.; Dalenberg, K.; Di Costanzo, L.; Duarte, J.M.; et al. RCSB Protein Data Bank: Powerful New Tools for Exploring 3D Structures of Biological Macromolecules for Basic and Applied Research and Education in Fundamental Biology, Biomedicine, Biotechnology, Bioengineering and Energy Sciences. Nucleic Acids Res. 2020, 49, D437. [CrossRef]
- Albert, R.; Barabási, A.L. Statistical Mechanics of Complex Networks. Rev. Mod. Phys. 2002, 74, 47. [CrossRef]
- Franz, M.; Lopes, C.T.; Huck, G.; Dong, Y.; Sumer, O.; Bader, G.D. Cytoscape.Js: A Graph Theory Library for Visualisation and Analysis. Bioinformatics 2015, 32, 309. [CrossRef]
- Bateman, A.; Martin, M.J.; Orchard, S.; Magrane, M.; Ahmad, S.; Alpi, E.; Bowler-Barnett, E.H.; Britto, R.; Bye-A-Jee, H.; Cukura, A.; et al. UniProt: The Universal Protein Knowledgebase in 2023. Nucleic Acids Res. 2022, 51, D523. [CrossRef]
- Jumper, J.; Evans, R.; Pritzel, A.; Green, T.; Figurnov, M.; Ronneberger, O.; Tunyasuvunakool, K.; Bates, R.; Žídek, A.; Potapenko, A.; et al. Highly Accurate Protein Structure Prediction with AlphaFold. Nature 2021 596:7873 2021, 596, 583–589. [CrossRef]
- Eberhardt, J.; Santos-Martins, D.; Tillack, A.F.; Forli, S. AutoDock Vina 1.2.0: New Docking Methods, Expanded Field, and Python Bindings. J. Chem. Inf. Model. 2021, 61, 3891–3898. [CrossRef]
- Deng, Z.; Chen, G.; Shi, Y.; Lin, Y.; Ou, J.; Zhu, H.; Wu, J.; Li, G.; Lv, L. Curcumin and Its Nano-Formulations: Defining Triple-Negative Breast Cancer Targets through Network Pharmacology, Molecular Docking, and Experimental Verification. Front. Pharmacol. 2022, 13, 920514. [CrossRef]
Figure 1.
Overview of the Drug Design Suite (DDS) 2.0 network-pharmacology workflow and its integration with the docking and virtual-screening engine. Disease-associated genes (Open Targets, CTD, or user-uploaded lists) and predicted compound targets (DGIdb, ChEMBL, or user-uploaded lists) are assembled and intersected to give the shared targets, from which a STRING protein–protein interaction network is built; hub genes are ranked by centrality (MCC or degree) and the shared-target set is submitted for GO/KEGG functional enrichment. Single, multi-compound (union) and multi-disease (intersection) modes are supported. The top hub genes are automatically resolved to a representative experimental structure (UniProt → RCSB PDB, with an AlphaFold fallback) and handed off, docking-ready, to the DDS docking and virtual-screening engine (AutoDock Vina; covalent and non-covalent), with the search box pre-centred on the co-crystallised ligand, producing docked poses, interaction analyses and molecular-dynamics-ready exports.
Figure 1.
Overview of the Drug Design Suite (DDS) 2.0 network-pharmacology workflow and its integration with the docking and virtual-screening engine. Disease-associated genes (Open Targets, CTD, or user-uploaded lists) and predicted compound targets (DGIdb, ChEMBL, or user-uploaded lists) are assembled and intersected to give the shared targets, from which a STRING protein–protein interaction network is built; hub genes are ranked by centrality (MCC or degree) and the shared-target set is submitted for GO/KEGG functional enrichment. Single, multi-compound (union) and multi-disease (intersection) modes are supported. The top hub genes are automatically resolved to a representative experimental structure (UniProt → RCSB PDB, with an AlphaFold fallback) and handed off, docking-ready, to the DDS docking and virtual-screening engine (AutoDock Vina; covalent and non-covalent), with the search box pre-centred on the co-crystallised ligand, producing docked poses, interaction analyses and molecular-dynamics-ready exports.
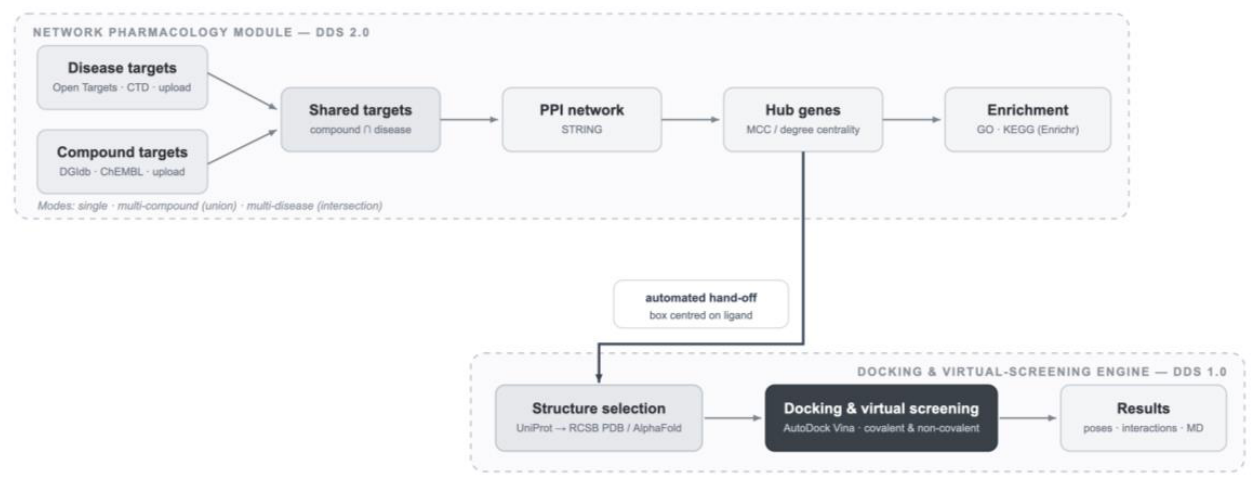
Figure 2.
The Drug Design Suite (DDS) 2.0 network-pharmacology module interface, shown at the Disease-targets step of the curcumin × triple-negative breast cancer workflow. Left: the six-step guided workflow rail (Disease targets → Compound targets → Network → Hub genes → Enrichment → Structures). Centre: the retrieved disease-associated genes — here 2 490 triple-negative breast carcinoma genes from Open Targets, each ranked by evidence-based association score, with the 110 covalent-targetable proteins flagged. Right: the controls for the step, including a one-click validation case, a Single/Multi-disease toggle, the selectable source databases (Open Targets, CTD), an optional paste/upload field to broaden the target list from external resources (GeneCards, OMIM, DisGeNET, TTD), a minimum-association-score cut-off, and a covalent-targetable-only filter. The top bar provides the Run analysis, New run and Switch module controls, and the banner indicates that the module queries public databases (Open Targets, ChEMBL, STRING, Enrichr) live.
Figure 2.
The Drug Design Suite (DDS) 2.0 network-pharmacology module interface, shown at the Disease-targets step of the curcumin × triple-negative breast cancer workflow. Left: the six-step guided workflow rail (Disease targets → Compound targets → Network → Hub genes → Enrichment → Structures). Centre: the retrieved disease-associated genes — here 2 490 triple-negative breast carcinoma genes from Open Targets, each ranked by evidence-based association score, with the 110 covalent-targetable proteins flagged. Right: the controls for the step, including a one-click validation case, a Single/Multi-disease toggle, the selectable source databases (Open Targets, CTD), an optional paste/upload field to broaden the target list from external resources (GeneCards, OMIM, DisGeNET, TTD), a minimum-association-score cut-off, and a covalent-targetable-only filter. The top bar provides the Run analysis, New run and Switch module controls, and the banner indicates that the module queries public databases (Open Targets, ChEMBL, STRING, Enrichr) live.
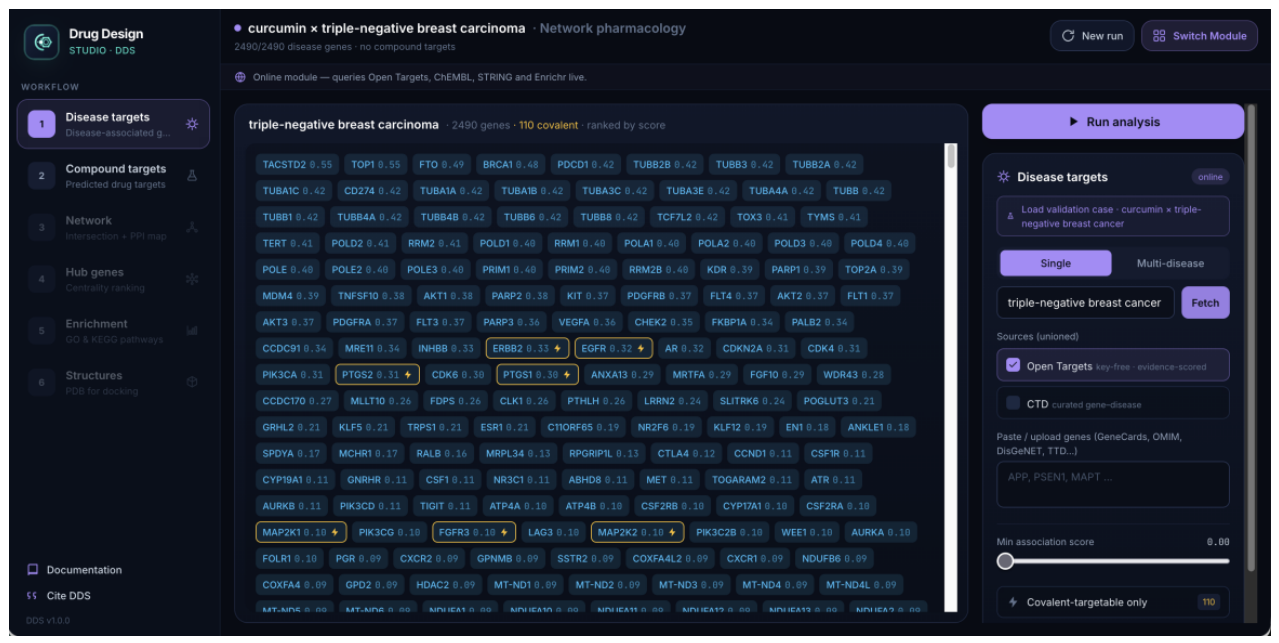
Figure 3.
Compound-target prediction and shared-target identification in the DDS 2.0 network-pharmacology module (curcumin × triple-negative breast cancer). The central Venn diagram shows the intersection of the curcumin target set with the triple-negative breast carcinoma disease-gene set: 134 curcumin targets (from DGIdb and ChEMBL) and 2 490 disease genes give 84 shared targets (compound ∩ disease; 3.3 % overlap) — the candidate therapeutic targets carried forward into the network analysis — of which 13 are covalent-targetable. Below the diagram, the ranked curcumin target list is shown with per-target confidence scores and covalent-targetable flags. Right: the compound-target controls — a Single/Multi-compound toggle, name or SMILES input, the source databases (DGIdb curated interactions; ChEMBL measured bioactivity), an optional paste/upload field to add externally predicted targets (SwissTargetPrediction, TCMSP), a minimum-confidence cut-off, and a covalent-targetable-only filter. The Venn diagram is exportable as PNG (transparent / white / dark) or vector SVG.
Figure 3.
Compound-target prediction and shared-target identification in the DDS 2.0 network-pharmacology module (curcumin × triple-negative breast cancer). The central Venn diagram shows the intersection of the curcumin target set with the triple-negative breast carcinoma disease-gene set: 134 curcumin targets (from DGIdb and ChEMBL) and 2 490 disease genes give 84 shared targets (compound ∩ disease; 3.3 % overlap) — the candidate therapeutic targets carried forward into the network analysis — of which 13 are covalent-targetable. Below the diagram, the ranked curcumin target list is shown with per-target confidence scores and covalent-targetable flags. Right: the compound-target controls — a Single/Multi-compound toggle, name or SMILES input, the source databases (DGIdb curated interactions; ChEMBL measured bioactivity), an optional paste/upload field to add externally predicted targets (SwissTargetPrediction, TCMSP), a minimum-confidence cut-off, and a covalent-targetable-only filter. The Venn diagram is exportable as PNG (transparent / white / dark) or vector SVG.
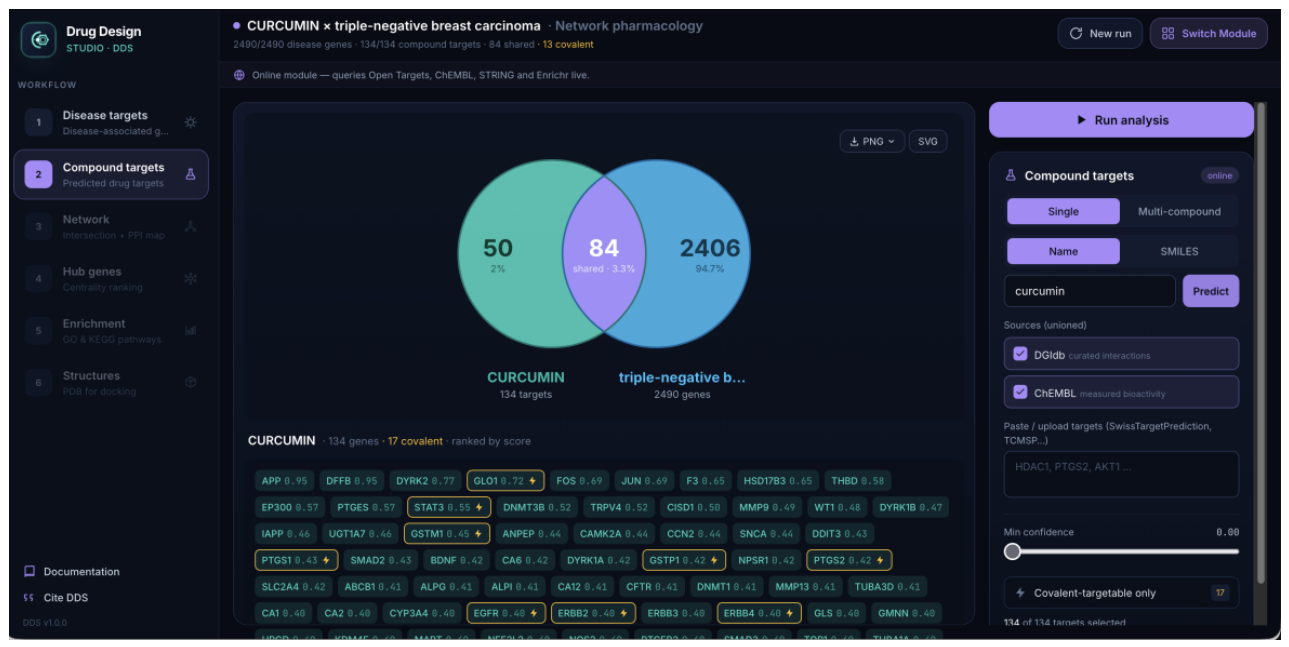
Figure 4.
Protein–protein interaction (PPI) network of the shared targets in the DDS 2.0 network-pharmacology module (curcumin × triple-negative breast cancer). The 84 shared targets were submitted to STRING (confidence ≥ 0.40), producing a network of 81 connected nodes and 688 edges (12 covalent-targetable). Nodes are arranged concentrically and both coloured and sized by degree (number of connections), so the most-connected proteins — the candidate hub genes — occupy the centre (e.g. EGFR, HIF1A, STAT3, JUN, EP300, NFKB1) while low-degree peripheral proteins lie toward the edge, as indicated by the colour-scale legend. The interactive network supports fit / re-layout and high-resolution PNG export; the STRING confidence threshold can be adjusted and the network rebuilt from the right-hand panel.
Figure 4.
Protein–protein interaction (PPI) network of the shared targets in the DDS 2.0 network-pharmacology module (curcumin × triple-negative breast cancer). The 84 shared targets were submitted to STRING (confidence ≥ 0.40), producing a network of 81 connected nodes and 688 edges (12 covalent-targetable). Nodes are arranged concentrically and both coloured and sized by degree (number of connections), so the most-connected proteins — the candidate hub genes — occupy the centre (e.g. EGFR, HIF1A, STAT3, JUN, EP300, NFKB1) while low-degree peripheral proteins lie toward the edge, as indicated by the colour-scale legend. The interactive network supports fit / re-layout and high-resolution PNG export; the STRING confidence threshold can be adjusted and the network rebuilt from the right-hand panel.
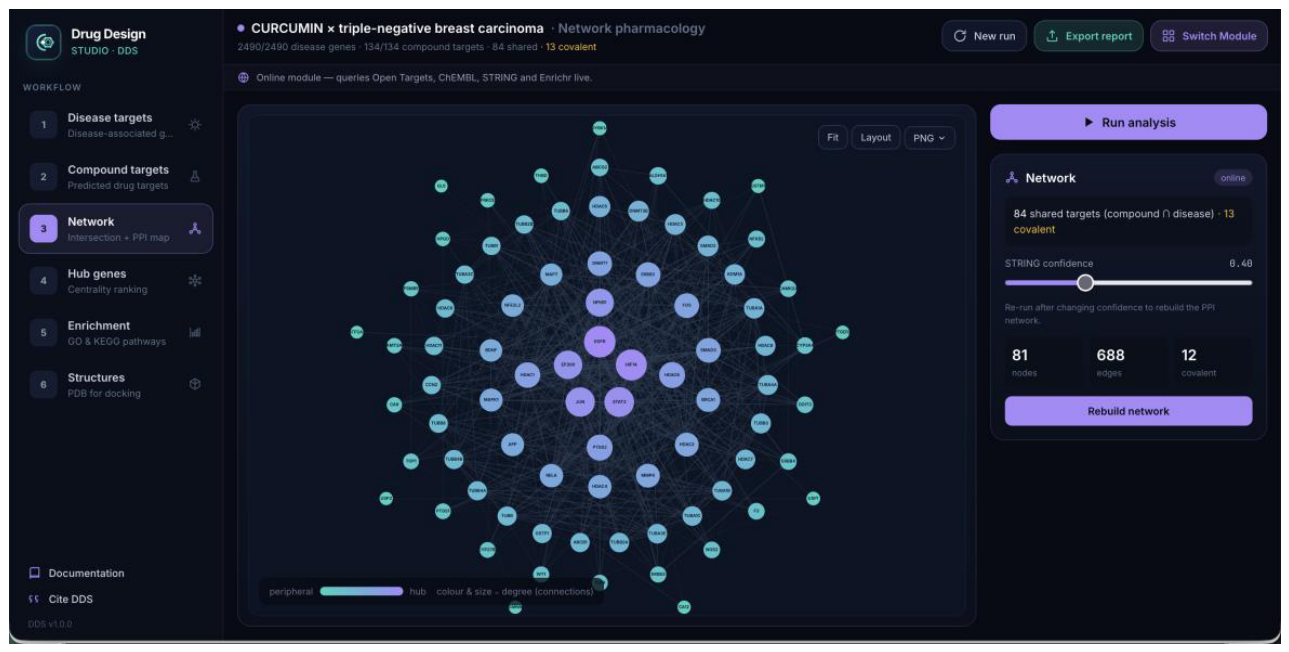
Figure 5.
Figure 5. Top-10 hub genes ranked by Maximal Clique Centrality (MCC, cytoHubba); degree, betweenness and closeness centrality are also user-selectable. Shown for illustrative purposes only — this panel does not reflect the benchmarking data; see the Supplementary Material (SM1) for the exact method used in the benchmark.
Figure 5.
Figure 5. Top-10 hub genes ranked by Maximal Clique Centrality (MCC, cytoHubba); degree, betweenness and closeness centrality are also user-selectable. Shown for illustrative purposes only — this panel does not reflect the benchmarking data; see the Supplementary Material (SM1) for the exact method used in the benchmark.
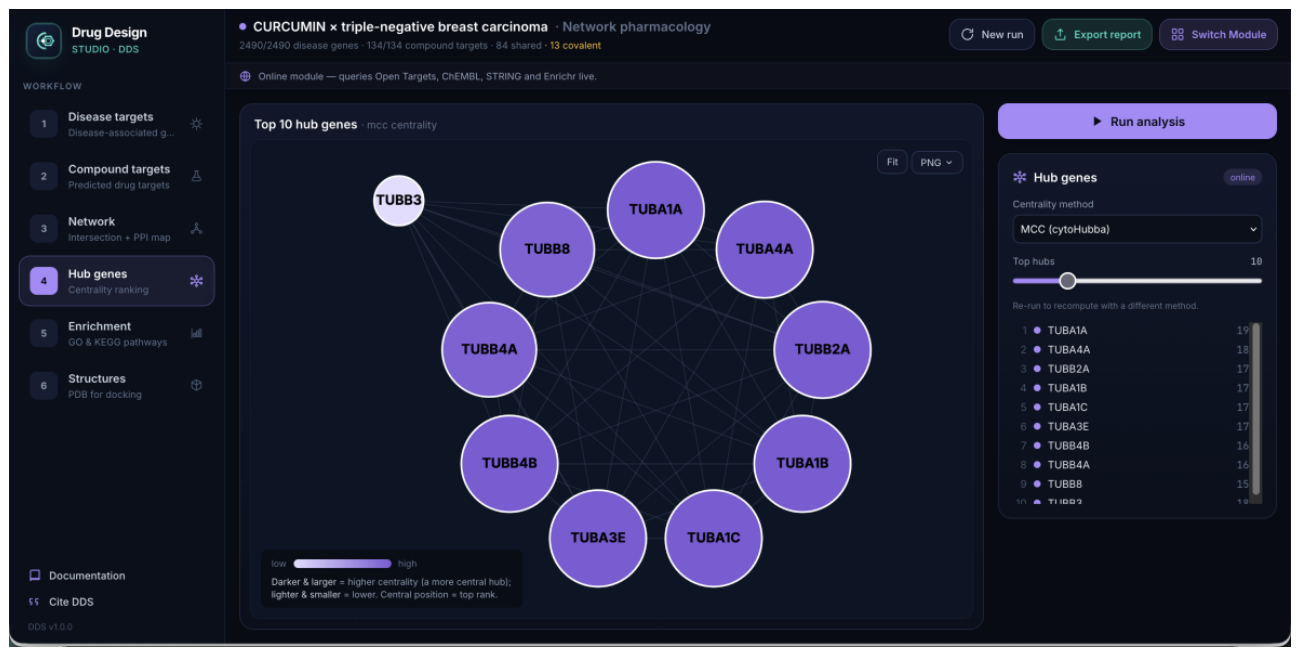
Figure 6.
Gene Ontology (Biological Process) enrichment of the curcumin × triple-negative breast cancer shared-target set, shown as a dot plot in the DDS 2.0 module. GO-BP terms are ranked by Enrichr combined score (x-axis); dot size is proportional to the number of member genes and dot colour encodes −log10(FDR) (blue → green, per the legend). The enriched processes are dominated by the regulation of transcription and gene expression (positive and negative regulation of RNA-polymerase-II– and DNA-templated transcription; regulation of gene expression), histone and protein deacetylation, and the cellular response to reactive oxygen species — biological processes consistent with the established anticancer activity of curcumin in triple-negative breast cancer. The GO Molecular Function and Cellular Component libraries can be added from the right-hand panel, and the figure is exportable as high-resolution PNG or vector SVG.
Figure 6.
Gene Ontology (Biological Process) enrichment of the curcumin × triple-negative breast cancer shared-target set, shown as a dot plot in the DDS 2.0 module. GO-BP terms are ranked by Enrichr combined score (x-axis); dot size is proportional to the number of member genes and dot colour encodes −log10(FDR) (blue → green, per the legend). The enriched processes are dominated by the regulation of transcription and gene expression (positive and negative regulation of RNA-polymerase-II– and DNA-templated transcription; regulation of gene expression), histone and protein deacetylation, and the cellular response to reactive oxygen species — biological processes consistent with the established anticancer activity of curcumin in triple-negative breast cancer. The GO Molecular Function and Cellular Component libraries can be added from the right-hand panel, and the figure is exportable as high-resolution PNG or vector SVG.
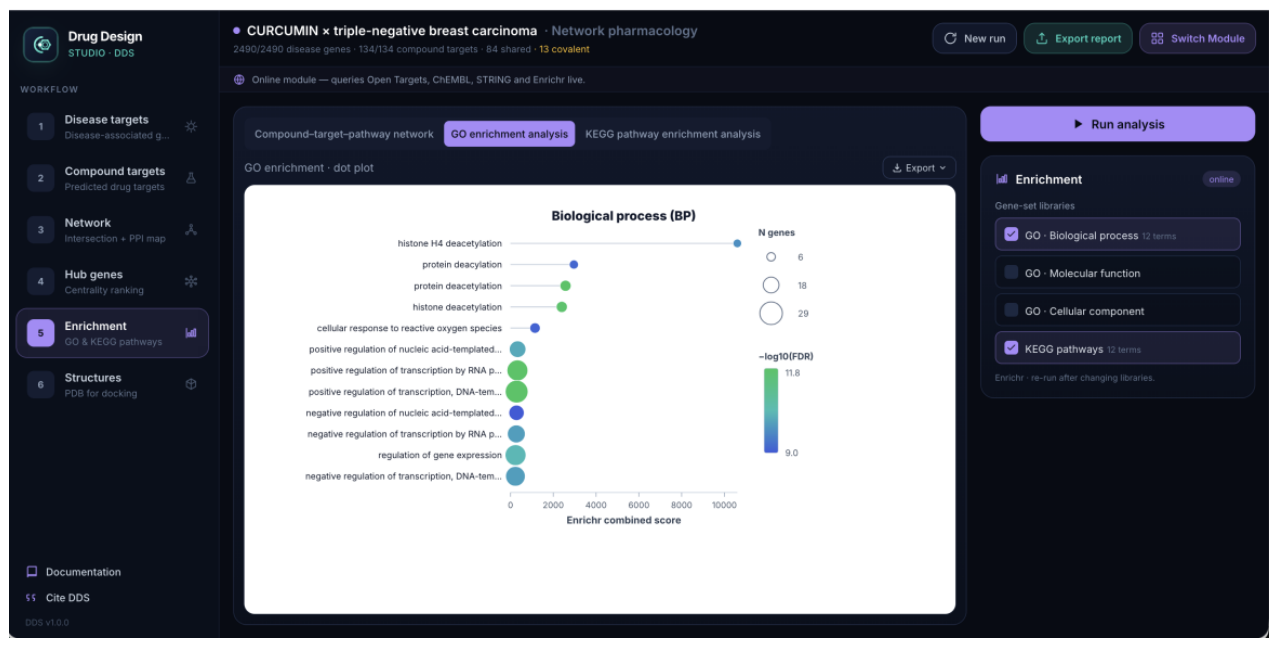
Figure 7.
KEGG pathway enrichment of the curcumin × triple-negative breast cancer shared-target set in the DDS 2.0 module. (A) Sankey diagram of the flow from target genes (left) to enriched KEGG pathways (right); coloured ribbons trace genes that contribute to multiple pathways. (B) Pathway-enrichment bubble plot: pathways ranked by Enrichr combined score (x-axis), with dot size proportional to the number of member genes and dot colour to −log10(FDR). The most strongly enriched terms include microtubule/cytoskeleton- and neurodegeneration-associated pathways alongside cancer pathways (MicroRNAs in cancer, Pathways in cancer), reflecting the substantial tubulin content of the curcumin shared-target set. The figure is exportable as high-resolution PNG or vector SVG.
Figure 7.
KEGG pathway enrichment of the curcumin × triple-negative breast cancer shared-target set in the DDS 2.0 module. (A) Sankey diagram of the flow from target genes (left) to enriched KEGG pathways (right); coloured ribbons trace genes that contribute to multiple pathways. (B) Pathway-enrichment bubble plot: pathways ranked by Enrichr combined score (x-axis), with dot size proportional to the number of member genes and dot colour to −log10(FDR). The most strongly enriched terms include microtubule/cytoskeleton- and neurodegeneration-associated pathways alongside cancer pathways (MicroRNAs in cancer, Pathways in cancer), reflecting the substantial tubulin content of the curcumin shared-target set. The figure is exportable as high-resolution PNG or vector SVG.
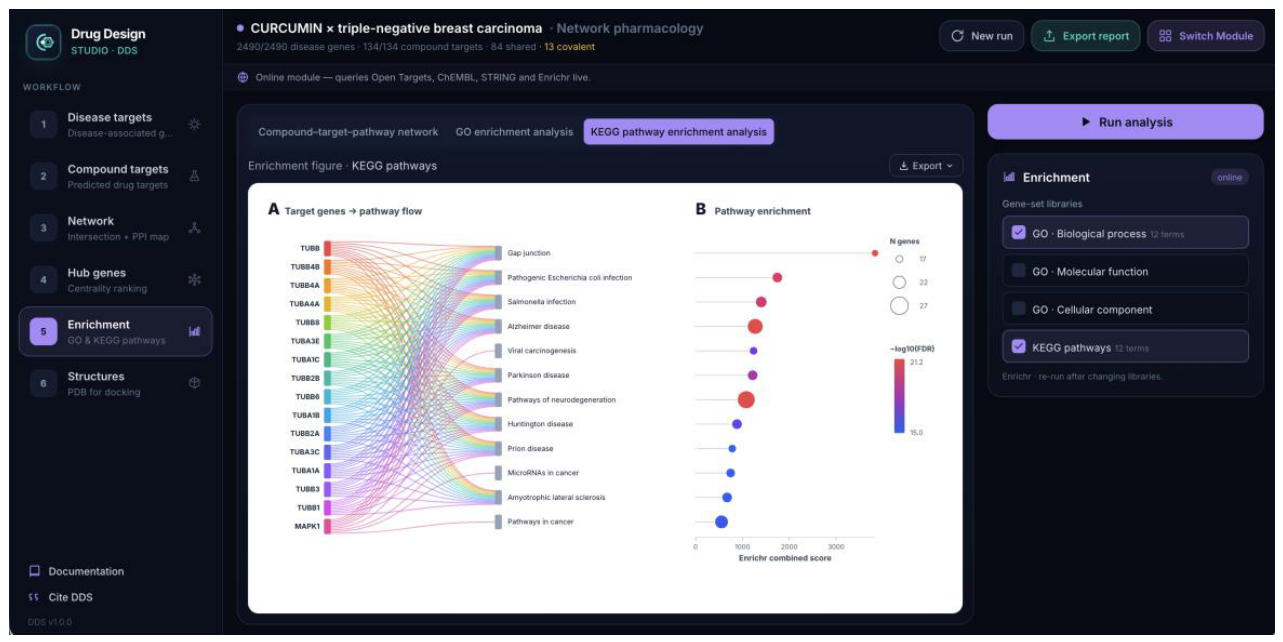
Figure 8.
Automated representative-structure selection for docking in the DDS 2.0 Structures step, shown for the top hub genes of the curcumin × triple-negative breast cancer network. For each hub gene, DDS resolves the gene to its reviewed human UniProt entry and ranks the available PDB structures for docking suitability by experimental method, resolution, domain coverage and bound ligand. Each card lists the recommended structure with its metadata badges (method, resolution, % domain coverage, bound ligand) and a short description, together with a one-click Send to docking hand-off to the DDS docking module, a set of ranked alternatives, and the corresponding AlphaFold model as a fallback. Representative examples: TUBA1A → 8SH7 (cryo-EM, 2.8 Å, 100 % coverage, GTP-bound); TUBB2A → 7NVN (cryo-EM, 3 Å, 100 % coverage, ADP-bound); and TUBA4A, for which no suitable experimental structure exists and the AlphaFold model (AF-P68366-F1) is offered instead.
Figure 8.
Automated representative-structure selection for docking in the DDS 2.0 Structures step, shown for the top hub genes of the curcumin × triple-negative breast cancer network. For each hub gene, DDS resolves the gene to its reviewed human UniProt entry and ranks the available PDB structures for docking suitability by experimental method, resolution, domain coverage and bound ligand. Each card lists the recommended structure with its metadata badges (method, resolution, % domain coverage, bound ligand) and a short description, together with a one-click Send to docking hand-off to the DDS docking module, a set of ranked alternatives, and the corresponding AlphaFold model as a fallback. Representative examples: TUBA1A → 8SH7 (cryo-EM, 2.8 Å, 100 % coverage, GTP-bound); TUBB2A → 7NVN (cryo-EM, 3 Å, 100 % coverage, ADP-bound); and TUBA4A, for which no suitable experimental structure exists and the AlphaFold model (AF-P68366-F1) is offered instead.
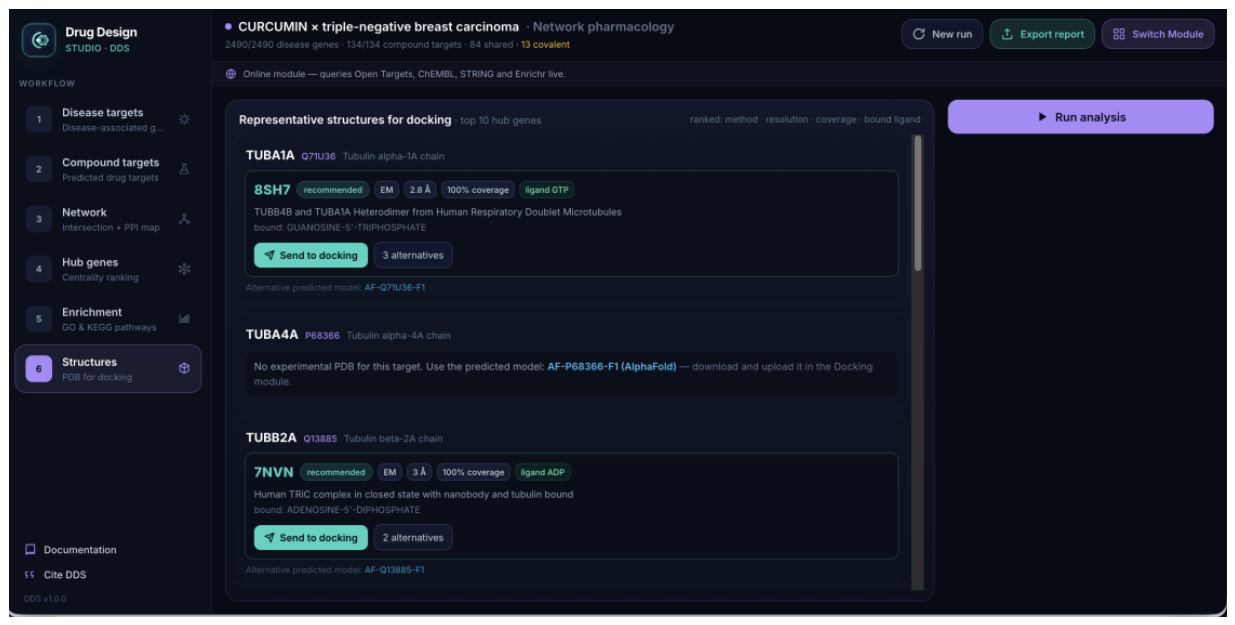

Table 1.
Target retrieval and shared-target summary for the curcumin–TNBC benchmark.
| Quantity | Value |
|---|---|
| TNBC-associated genes (Open Targets) | 2490 |
| Curcumin targets (DGIdb + ChEMBL) | 134 |
| Curcumin targets that are covalent-targetable | 17 |
| Shared targets (curcumin ∩ TNBC) | 84 |
| Shared targets that are covalent-targetable | 13 |
Table 2.
Top hub genes for the curcumin–TNBC benchmark (degree centrality). Full centrality tables for all metrics are provided in the Supplementary Material SM1.
Table 2.
Top hub genes for the curcumin–TNBC benchmark (degree centrality). Full centrality tables for all metrics are provided in the Supplementary Material SM1.
| Rank | Gene | Degree |
|---|---|---|
| 1 | EGFR | 45 |
| 2 | HIF1A | 44 |
| 3 | STAT3 | 41 |
| 4 | JUN | 40 |
| 5 | EP300 | 38 |
| 6 | NFKB1 | 37 |
| 7 | HDAC6 | 32 |
| 8 | PTGS2 | 32 |
| 9 | HDAC1 | 31 |
| 10 | DNMT1 | 29 |
Table 3.
Representative enriched terms for the curcumin–TNBC benchmark. Complete statistics are provided in the Supplementary Material.
Table 3.
Representative enriched terms for the curcumin–TNBC benchmark. Complete statistics are provided in the Supplementary Material.
| Category | Representative enriched terms |
|---|---|
| GO Biological Process | positive/negative regulation of transcription; regulation of gene expression; response to reactive oxygen species; regulation of programmed cell death |
| KEGG pathways | pathways in cancer; PI3K–Akt signalling; microRNAs in cancer; proteoglycans in cancer |
Table 4.
Benchmark comparison of the DDS 2.0 network-pharmacology workflow against the published reference study [25] for curcumin in triple-negative breast cancer.
Table 4.
Benchmark comparison of the DDS 2.0 network-pharmacology workflow against the published reference study [25] for curcumin in triple-negative breast cancer.
| Parameter | Reference study [25] | DDS 2.0 (this work) |
|---|---|---|
| Disease studied | Triple-negative breast cancer (TNBC) | Triple-negative breast cancer (TNBC) |
| Disease targets retrieved (source) | 2060 (OMIM, TTD, DisGeNET) | 2490 (Open Targets, evidence-scored) |
| Curcumin targets retrieved (source) | 118 (SwissTargetPrediction 110; ETCM 8) | 134 (DGIdb curated; ChEMBL bioactivity) |
| Shared targets (intersection) | 40 | 84 |
| PPI network | STRING | STRING (conf. 0.4); 81 nodes, 688 edges |
| Hub-gene ranking method | Cytoscape cytoHubba, MCC | Degree centrality (MCC/betweenness/closeness also available) |
| Top 10 hub genes | STAT3, AKT1, TNF, PTGS2, MMP9, EGFR, PPARG, NFE2L2, EP300, GSK3B | EGFR, HIF1A, STAT3, JUN, EP300, NFKB1, HDAC6, PTGS2, HDAC1, DNMT1 |
| Reference hubs recovered by DDS | (reference set) | 6/10 in network (STAT3, EGFR, EP300, PTGS2, MMP9, NFE2L2); 4/10 in DDS top-10 (STAT3, EGFR, EP300, PTGS2) |
| Key enriched pathways | PI3K–Akt; EGFR TKI resistance; JAK–STAT; PD-L1/PD-1 checkpoint; microRNAs in cancer; chemical carcinogenesis–receptor activation | pathways in cancer; PI3K–Akt; microRNAs in cancer; proteoglycans in cancer |
Table 5.
Representative automatically selected structures for benchmark hub genes. Full structure tables are provided in the Supplementary Material SM1.
Table 5.
Representative automatically selected structures for benchmark hub genes. Full structure tables are provided in the Supplementary Material SM1.
| Hub gene | UniProt | PDB | Method | Res. (Å) | Bound ligand |
|---|---|---|---|---|---|
| EGFR | P00533 | 8A27 | X-ray | 1.07 | kinase inhibitor |
| STAT3 | P40763 | 6NJS | X-ray | 2.7 | SD36 (drug-like) |
| PTGS2 | P35354 | 5F19 | X-ray | 2.04 | COX inhibitor |
Disclaimer/Publisher’s Note: The statements, opinions and data contained in all publications are solely those of the individual author(s) and contributor(s) and not of MDPI and/or the editor(s). MDPI and/or the editor(s) disclaim responsibility for any injury to people or property resulting from any ideas, methods, instructions or products referred to in the content. |
© 2026 by the authors. Licensee MDPI, Basel, Switzerland. This article is an open access article distributed under the terms and conditions of the Creative Commons Attribution (CC BY) license (http://creativecommons.org/licenses/by/4.0/).
Copyright: This open access article is published under a Creative Commons CC BY 4.0 license, which permit the free download, distribution, and reuse, provided that the author and preprint are cited in any reuse.


