
Submitted:
24 July 2026
Posted:
29 July 2026
You are already at the latest version
Abstract
Mackinac Island in the state of Michigan is one of the most visited destinations during summertime in the United States. The island attracts over a million tourists in the short period of 5 months. The only commute to the island is using ferries that travel to the island from Mackinaw City and St. Ignace. In 2022, a study was conducted on the potential bene-fits of electrification of the ferry from a technical, environmental and economic standpoint. The results from the study concluded that while the retrofitting of the Mackinac Island ferry to an electric ferry was feasible based on components available in the market, electri-fication would lead to an increase in the CO2 emissions. The economic analysis showed that the electric ferry would result in significant financial losses to any company operating the ferry. The overarching conclusion was that an electric ferry powered by Michigan’s electric grid was not the optimum solution for that time based on both carbon emissions as well as Total Cost of Ownership (TCO).
This study builds on the work completed in 2022 to determine whether an electric ferry powered by local solar energy can help reduce CO2 emissions. The analysis includes siz-ing the solar array based on the solar radiation received by Mackinaw City, the CO2 emis-sions in the manufacture of solar panels and the addition of battery energy storage as a means of energy storage between ferry trips. Ferry data used for this analysis is the same as that collected for the original study, although the appropriate parameters relating to Michigan’s electricity grid and emissions from battery manufacturing have been updated based on technological changes and the addition of different energy sources on the Mich-igan grid. The study also includes economic considerations for all potential electri-fication scenarios discussed in this work.
Keywords:
solar energy
; photovoltaics
; Mackinac island ferry
; electrification
; electric ferry
; emissions
1. Introduction
Substantial research is being conducted on propulsion systems for land, water and air based vehicles to decarbonize the means of transportation. In a bid to reduce the CO2 emissions from water-based transportation, the International Maritime Organization (IMO) set its 2023 GHG strategy with the following goals [1].
- To reduce the total annual GHG emissions from international shipping by at least 20%, striving for 30%, by 2030, compared to 2008; and
- To reduce the total annual GHG emissions from international shipping by at least 70%, striving for 80%, by 2040, compared to 2008.
Significant progress has been made in ferry electrification and hybridization in the past few years. There are around 100 fully electric and hybrid electric ferries in-service as of April 2024 (41 fully electric, 59 hybrid) [2]. Of those, 56 operate in Norway (28 fully electric, 28 hybrid electric). Norway has led the charge for ferry electrification since the last decade [3]. The first well documented electric ferry, the MF Ampere, began operation in Norway in 2014 [3,4]. Norway’s push for ferry electrification makes sense from an emissions standpoint, since 99% of Norway’s electricity generation is from renewable sources of energy as shown in Figure 1a [5]. The United States is making progress towards decarbonizing its electric grid. But even though electricity generation from nuclear and renewable sources increased by 3% from 2022 to 2024, a little over 57% of the United States’ electricity is still generated from the burning of fossil fuels (primarily natural gas at 42% followed by coal at 15.2%) as shown in Figure 1b [6].
In considering the effectiveness of electrification (full BEV or or hybrid) in reducing greenhouse gas (GHG) emissions, it is important to take into account the distribution of electricity generation, since there is a possibility that the emissions may actually increase with electrification due to the grid mix. For a country like Norway, that is not a point of contention, since the electricity generation is nearly completely free of fossil fuels. For a country like the United States, a analysis needs to be conducted on a case-by-case basis, depending on the location of the project and the state grid.
Gopujkar and Worm [7] conducted an engineering assessment of the potential benefits of retrofitting the Mackinac Island Ferry from a diesel engine ferry to a battery electric ferry. This analysis was based on a project done for the Mackinac Economic Alliance (MEA), which was funded by the Michigan Economic Development Corporation (MEDC). The project focused on three key areas.
- Feasibility of retrofitting the diesel engine powered ferry to convert it to a battery electric ferry
- Change in the CO2 emissions based on a well-to-wheel (WTW) analysis of the two architectures
- Economic projections for the two architectures
The project concluded that while the equipment required to retrofit the ferry was commercially available, electrification of the ferry would lead to a 48% increase in the overall CO2 emissions per trip from Mackinaw City to the Mackinac Island and back on a WTW basis, and a 30% increase in emissions if only the energy used to propel the ferry from the island and back to the mainland was considered [7]. The primary reason for this is the Michigan state grid, which in June 2022, produced 65.7% of its electricity by burning natural gas and coal. In addition to that, the project noted that the diesel engine ferry runs at a high efficiency of 41% for the majority of the drive cycle.
This paper provides an engineering analysis for the same vessel, the Voyager, that was the focus of the study in 2022. The question in 2022 was whether it would be better to rebuild the Voyager with new diesel engines, or to retrofit it as an electric ferry. The comparison is between a diesel engine ferry (referred to as the internal combustion (IC) engine ferry) and the electric ferry (referred to as the BEV ferry). The two architectures are compared on an emissions and economic basis for two different scenarios
- (i)
- The BEV ferry powered by energy generated through photovoltaics
- (ii)
- The BEV ferry powered by energy from the updated Michigan state grid from June 2025
The paper looks at the goals and motivation for the project, describes the methodology and results. The ‘Discussion’ section includes the authors thoughts on what the results point to and any assumptions that were made in the analysis are clearly stated.
2. Goals and Motivation
Mackinac Island is one of the most popular summer destinations in the United States. The only access to Mackinac Island, which is a state park to the East of mainland Michigan in Lake Huron, is via ferries from the mainland.
Improvement in Solar Photovoltaic Technology
Globally, the installed photovoltaic capacity has seen an exponential rise in the last two decades [8], as shown in Figure 2. The global installed capacity went up from 3.34 GW in 2004 to 1866.31 GW in 2024. Although the majority of new installed capacity has been in China (0.08 GW in 2004 to 887.10 GW in 2024), other countries are beginning to see the potential.
Research into photovoltaic materials, improved efficiency and increased demand and installations have resulted in a staggering reduction in the cost of solar photovoltaic modules. Inflation adjusted, the installation cost per Watt for solar photovoltaics has gone down from $128.26 per Watt in 1975 to $0.26 per Watt in 2024 [9]. The reduction over the years in cost per Watt over the years is shown in Figure 3. The estimate is that every time installed capacity doubled, the price reduced by 20% [10].
In addition to the increase in installed capacity and reduction in price, the efficiency of solar photovoltaic cells has improved as well. Since the first practical silicon solar cell was developed at Bell Labs in 1954 with an efficiency of approximately 6%, modern commercial solar cells now commonly exceed 20% efficiency, while research-grade multijunction cells have reached efficiencies above 40% [11].
Together, the growth in installed capacity, the fall in price, and the gains in efficiency have moved solar photovoltaics from a niche technology to a near-ubiquitous source of electricity — the motivation for examining whether a solar-powered BEV architecture is a sensible way to propel the Mackinac Island ferry. The previous analysis determined the Michigan Grid was so fossil fuel dependent, that it increased the emissions from the BEV ferry. For electricity generated using photovoltaics, for a comprehensive analysis, the GHG emissions from the mining of the material used to make the photovoltaics and the GHG emissions from manufacture of the solar panels have to be considered. But after installation, all electricity generated from the panels is, for all practical purposes, emissions free during their time of operation. The emissions from disposal or recycling are built into the lifecycle assessment (LCA) of the solar panels.
Decarbonization of the Michigan State Electricity Grid
When the analysis was first conducted in 2022, the grid mix used to support the calculations was from June 2022. The month of June was specifically chosen, and not the annual average of the Michigan state electricity grid, since the Mackinac Island Ferry operates from April to September, and the peak tourist traffic is during the months of June and July. The grid mix does change depending on the season, since wind energy output is higher during the winter months and solar energy output is higher during the summer months. Table 1 shows the change in the distribution of electricity generation by source in Michigan from June 2022 to June 2025 [12]. Figure 4 shows the comparative changes in percentage for each type of power plant.
The major change in the distribution from June 2022 to June 2025 is the reduction in the electricity generated by coal, which has been taken mainly by natural gas. On the flip side, even though electricity generated from nuclear energy and renewable energy has increased in absolute terms, there is reduction seen in their slice of the pie, which is also made up for by the significant increase in electricity from natural gas power plants (nuclear power plants, like renewables, are emissions free after installation). Natural gas power plants produce significantly lower CO2 emissions as compared to coal fired power plants for each kilowatt-hour (kWh) of energy sent to the grid (450.9 g/kWh for natural gas power plants as compared to 1065.8 g/kWh based on EIA efficiency numbers for the two types of power plants [13]).
The change in the grid mix has reduced the CO2 emissions for Michigan from 481.4 g/kWh to 452.9 g/kWh (approximately a 5.92% reduction). The discussion in the original paper submitted around this project was that the analysis needs to be rerun every few years to reflect the updated numbers. Michigan’s grid has undergone notable changes from 2022 to 2025, which serves as the motivation for the second goal for the project.
Based on the motivations described above, the goals for this work can be stated as follows:
- Conduct an engineering analysis to determine whether electrifying the Voyager and using solar photovoltaic technologies to provide the energy to propel the ferry has potential to reduce the CO2 emissions as compared to rebuilding the ferry with modern diesel engines.
- Rerun the analysis done by Gopujkar and Worm [7] in the original study in 2022 to determine if Michigan’s updated electric grid mix justifies electrification of the Voyager if the ferry is to be charged from the grid.
No new data from the operation of the ferry was collected for this paper. Data collected for the original study for the operation of the diesel engine propelled ferry was reutilized.
3. Methodology
The drive cycle from Mackinaw City to Mackinac Island is a well-defined drive cycle, which is shown in Figure 5 [7]. The route was recorded on the workout tracking application Strava.
The velocity profile for the Liberty II and Voyager, which is shown in Figure 6, was recorded using multiple GPS sensors (both Android and Apple devices) to ensure accuracy of the data. As Figure 6 shows, the performance of the Voyager was not up to the mark as compared to the Liberty II, which is why rebuilding the Voyager was being considered in 2022.
Engine load and fuel consumption data was obtained through engine ECU based parameters. The ferries adopt a very aggressive approach, where the engine is controlled to very high load after leaving the dock, which can be seen from the velocity profile of the two ferries. The engine operates at a high load and high efficiency condition for the majority of the drive cycle. The ferry captains revealed that the ferries use a ‘turn-and-burn’ approach, where the halt at the island is as minimum as possible, meaning charging at the island was not a possibility (feasibility of setting up a charger on the island would be another challenge in itself). The required battery for the BEV ferry was sized based on the total energy required for propelling the ferry to and from the island, the inefficiencies in charging, power electronics, discharging and the propulsion motors, a 80% depth of discharge (DoD) and a 20% factor of safety. The 80% DoD was based on discussion with a marine battery manufacturer, as detailed in the original study [7]. The relevant numbers calculated for the ferry drive cycle are shown in Table 2. For the battery gravimetric capacity, an assumption of 20% improvement was made from the value used in 2022. This assumption is based on the conversations with a marine battery manufacturer in 2022, in which there were discussions regarding significant improvements to marine battery gravimetric capacity in the near future.
Emissions from the Manufacture of Monocrystalline Photovoltaic Solar Panels
For a WTW comparison of emissions, the CO2 emissions from the manufacture of solar panels have to be considered. The Argonne National Lab (ANL) GREET 2022 model [14] was used to estimate the CO2 emissions for commercial monocrystalline panels. The calculation included the emissions in mounting the panels, manufacture and installation of the inverter and the end of life treatment for the panels. To estimate the emissions, data from the SolarWorld 320W monocrystalline monofacial panels was used.
Characterization of the Solar Resource
Test panels are installed at the Advanced Power Systems Research Center (APSRC) at Michigan Technological University, which serves as the US Department of Energy’s (DoE) Northern Regional Test Center (RTC). The average monthly output from three years of data is shown in Figure 7. The average annual output of the panels in Calumet, Michigan was 192.4 kWh/m2. The National Laboratory of the Rockies’ (NLR) PVWatts tool was calibrated to match the output of the solar panels, and the location was changed to Mackinaw City, Michigan. The results were within 3%, showing that numbers from the data collected in Calumet, MI could be used estimate numbers in Mackinaw City, MI.
Based on a 25 year estimate for the panel life, the CO2-eq emissions from panel manufacturing were estimated to be 38.5 g/kWh. As a sense check, this number is close to the median emissions number of 43 g of CO2-eq/kWh published by NLR in 2012 [15]. The number used for calculation in this work is 38.5 g/kWh.
Solar Powered BEV Ferry
Powering the BEV ferry with solar energy can be done through two systems.
- (i)
- Electricity generated from solar energy is used to charge a stationary battery, which is used to charge the ferry battery. In this pathway, the solar panels will have to be oversized to compensate for the fact that the solar output is intermittent, and the stationary battery will have to have excess capacity towards the start and end of the day when the electricity generation from the photovoltaics is not high. The additional energy generated from the panels when the stationary battery is full can be sold to the grid. A simple schematic for this pathway is shown in Figure 8a.
- (ii)
- Electricity generated from solar energy generated is ‘stored on the grid’, and the ferry battery is charged from the grid. In this pathway, the energy consumed by the ferry is simply offset by the energy from the solar panels. Because of this, the ferry does not have to be concerned about the intermittent output from the solar panels, and the solar array does not need to be oversized. A simple schematic for this pathway is shown in Figure 8b.
Solar Powered Ferry Pathway 1: Charging an onshore battery with solar energy, which is then used to charge the ferry.
Solar energy is intermittent and weather dependent (and hence, unpredictable). To have sufficient energy generated by solar photovoltaics for propelling the ferry for the day, a stationary battery will be required, which will be a buffer against the sporadic generation of electricity from the solar array. The stationary (onshore) battery will need to have a higher capacity to store excess energy during the times of high intensity of solar radiation incident on the solar array.
The array has to be sized for the month of operation with the lowest average daily solar energy. The Mackinac Island Ferry runs from April to September. Based on the PVWatts calibrated model, September has the lowest solar radiation at 5.07 kWh/m2-day. Based on the SolarWorld 320W output, that translates to 1.1389 kWh/m2-day of electrical energy output. The electric ferry will travel to the island and back eight times in one day. Each ferry trip requires 2160 kWh of energy (rounded up to 2200 kWh). Eight trips per day is a requirement of 17760 kWh of energy from the solar array on a daily basis. The solar array is sized based on Equation 1.
Solar array area = 15594 m2 (3.85 acres)
Approximately, a 125 m x 125 m of solar panels is required to generate the daily energy required to propel the electric ferry. In terms of power, this amounts to approximately a 2495 kW solar photovoltaic capacity installation. For ground mounted solar, that is a significant land requirement. Creative solutions such as solar photovoltaics on top of parking spaces can be considered, although that is out of the scope of this study.
For pathway one, however, a slightly oversized array will be required to ensure the stationary battery has the required amount of stored energy to fully charge the ferry before each trip. Since the battery is optimally modelled to complete one ferry round trip, a partial charge is not an option. A simple model was developed using Microsoft Excel to determine the required oversizing of the solar panels and the stationary battery size. The data collected at the DoE Northern RTC for three years for the month of September was used to determine the distribution of the energy output through the day. This is shown in Figure 9. Based on the model, the solar array multiplier was calculated at 1.5 and the stationary battery size multiplier was calculated at 3.
- To generate sufficient energy from the solar array through the daily change in solar intensity, the solar array will require 50% more area (23391 m2) than the calculated area that generates the same amount of energy as the daily ferry requirement.
- To ensure the additional energy generated at high solar intensity times of the day is stored for the lower intensity times of the day, the onshore battery will need to be 3 times in terms of usable capacity than the ferry battery.
The 1.5x solar array area multiplier will mean that the stationary battery throughput is 50% higher than the ferry battery. The excess energy can be sold to the grid, which is an additional reduction in CO2 emissions.
The stationary battery uses the same NMC chemistry as the onboard ferry pack, per the maritime battery supplier's specification. Unlike the ferry pack, which is mass-constrained and therefore run at an aggressive 80% depth of discharge (DoD) with a single-season (approximately 1400 cycles) replacement interval, the stationary unit carries no weight or volume penalty, allowing DoD to be used as a longevity lever. It is sized to 5.7 MWh usable (three times the ferry's per-trip usable energy) to buffer the mismatch between intermittent photovoltaic supply and the ferry's discrete high-power charging events; at 50% usable DoD this gives a 11.4 MWh nominal capacity.
Battery life is governed by energy throughput to end-of-life rather than a fixed cycle count, since the usable capacity acts as a variability buffer and is only partially cycled on most days. Solar oversizing (1.5× the ferry's net demand, to cover cloudy-day deficits and round-trip losses) raises throughput to roughly 4200 MWh per season, or approximately12600 MWh over the three-season target life. For NMC cells, lifetime throughput scales approximately linearly with installed capacity [16], so the 11.4 MWh pack clears the three-season target with modest margin; the 50% DoD was therefore chosen to comfortably meet the replacement interval under elevated solar-driven throughput, not as a precisely binding value. This linear-throughput treatment is a conservative first-order approximation — physics-based models indicate degradation scales with the square of the lithiation swing, making shallow cycling somewhat more favorable [17] — and it excludes calendar aging over the seven-month idle season and Upper Peninsula winter temperatures, which act independently of DoD and warrant refinement against in-situ data [18].
Solar Powered Ferry Pathway 2: Energy from solar photovoltaics used to offset energy from the grid.
Pathway 2 is much more straightforward, with the solar array sized exactly to match the requirement of the ferry, which is 15594 m2. All the energy generated from the solar panels is sent to the grid, and the grid is used to charge the ferry. The cleaner solar energy is “stored on the grid”, and the grid acts as the buffer or electrical flywheel to smooth out the undulations from the photovoltaic electricity generation.
Pathway 2 does require buying electricity from the grid, and if the price of electricity is higher than the price at which the local supplier will buy it from consumers, there will be a net electricity cost, unlike pathway 1. However, pathway 2 saves on the cost and the GHG emissions that results from the onshore battery.
3.2. Updated Analysis Based on Michigan’s Grid Mix for 2025
For the final portion of this work, the analysis conducted in the original study was repeated with the updated grid mix for Michigan in June 2025. Other than the grid mix, the majority of the numbers for the analysis are the same as what was used by Gopujkar and Worm [7]. The numbers that were changed are shown below.
- CO2 emissions from Li-ion battery manufacturing reduced from 162 kg/kWh based on GREET 2020 to 150 kg/kWh based on GREET 2022 [14].
- Assumption of a 20% improvement in gravimetric battery capacity from 0.101 kWh/kg to 0.12 kWh/kg. This number is higher, around 0.26 kWh/kg, for automotive Li-ion batteries, but that isn’t the case for marine Li-ion batteries, based on conversations with a marine battery manufacturer.
4. Results
Based on the methodology laid out in the previous section, the results for CO2 emissions for the two scenarios were completed, which are provided in two separate subsections. While a comprehensive economic analysis was out of the scope of this work, certain economic considerations have been laid out based on the price of the solar panels and the ferry and onshore Li-ion batteries.
4.1. Solar Powered BEV Ferry
The solar powered BEV ferry can be achieved through two separate pathways as outlined in the ‘Methodology’ section. The results for the two pathways are shown separately below.
4.1.1. Pathway 1: With Onshore (Stationary) Battery
For pathway 1 with the onshore battery, the WTW emissions from the manufacture of the ferry battery and the onshore battery are considered. The ferry battery is designed to last for one season (approximately 1400 trips) to ensure the ferry does not have to stop operations in the middle of the season. The onshore battery is sized 3 times the usable capacity ferry, with a 50% DoD to ensure a battery life of three seasons.
Figure 10 shows the CO2 emissions for the BEV and IC engine configurations of the ferry. The BEV configuration has an offset at 0 ferry trips because of the emissions from the manufacture of the solar panels and the two Li-ion batteries. The solar panels for this configuration are oversized to ensure the onshore battery has enough energy to charge the ferry for all times of the day, during all operational seasons. The oversized panels generate excess energy during peak sunlight hours (excess in the sense energy is generated even when the onshore battery is full). This excess energy is sold to the grid The electricity from the photovoltaics that is sold to the grid has net CO2 reduction impact, since the CO2 emissions per kWh from solar panels is less than 10% than the grid mix.
The BEV configuration takes approximately 9200 ferry trips (approximately seven years) for the emissions from the IC engine ferry to match the emissions from the BEV ferry. After 7 seasons, the operation of the BEV ferry reduces the CO2 footprint of the ferry. This pathway does require the regular replacement of two batteries. Over a 25 year period, the potential reduction in CO2 emissions is 19500 tonnes. To put it into perspective, that is equivalent to the annual CO2 footprint of 1373 US citizens (based on 2024 numbers) [19].
4.1.2. Pathway 2: Energy from Solar Photovoltaics Used to Offset Energy from the Grid
Figure 11 shows the CO2 emissions for the IC engine ferry, and the solar powered BEV ferry. The emissions for the BEV ferry are shown in two formats – emissions from the solar panels considered as a one time offset, and the emissions amortized over a lifetime of usage.
For this pathway, the solar array size is smaller than pathway 1. That combined with the lack of an onshore battery results in much lower emissions at the start. The solar power BEV ferry matches the ICE ferry CO2 emissions in 5000 ferry trips (approximately 3.5 years of operation). Over a 25 year period, there is a potential reduction of 20,800 tonnes of CO2 emissions. To put it into perspective, that is equivalent to the annual CO2 footprint of 1426 US citizens (based on 2024 numbers) [19].
4.2. BEV Ferry Powered by the Michigan State Grid – Updated Analysis
In the primary project conducted to consider electrification of the Voyager, the results showed that the BEV ferry has higher WTW CO2 emissions as well as higher operational CO2 emissions than the IC engine ferry. In the ‘Discussion’ section, the authors suggested repeating the exercise every few years to determine whether the analysis had skewed towards electrification.
Figure 12 (WTW CO2 emissions) and Figure 13 (CO2 emissions from the operation of the ferry) show that while the Michigan state grid has decarbonized to an extent as compared to 2022 (for the month of June), the overall picture is still not in favor of electrification if the ferry is charged from the grid. From June 2022 to June 2025, the CO2 emissions per kilowatt-hour of energy on the grid reduced by 5.92%. For the BEV ferry to have lower operational CO2 emissions than the IC engine ferry, the CO2 emissions from the grid will need to go down by 24%.
4.3. Economic Considerations
Although a comprehensive economic analysis was out of the scope of this study, the cost of solar panels and the two Lithium-ion batteries are shown in Table 3 for thought provoking discussion.
- The cost of solar panels is estimated based on numbers provided by Greenstone Renewable Energy LLC, and is approximately 0.6 $/W. This does not include installation or transportation of the panels. For pathway 1, this cost will be 1.5x what is shown in Table 3.
- The cost of the ferry battery is based on discussions with a marine battery manufacturer. The price mentioned in discussions in 2022 was 700 $/kWh since it is a marine battery and a specialized application (so not an off the shelf component).
- The stationary battery will have fewer restrictions than the marine battery. Even though it is not an off the shelf component, its price was estimated using the average Li-ion battery price in 2020 of 137 $/kWh [20].
Gopujkar and Worm [7] showed through a basic economic analysis that the BEV ferry, even if it were beneficial in CO2 emissions reduction, would cause a substantial reduction in profits due to two main reasons.
- (i)
- Cost of regularly replacing the Li-ion battery on the ferry.
- (ii)
- Reduction in the maximum passenger capacity due to the battery mass.
The same is true for the solar powered ferry. Revenue will be down by the same reduction in passenger capacity, and while the one-time investment in solar panels is reasonable considering the 25-year lifespan (not taking into account repairs and replacement of damaged solar panels), the cost of Li-ion batteries is extremely high. The ferry battery in particular costs more than the 2495 kW solar panel array, but requires changing every year.
5. Discussion
5.1. CO2 Emissions
The results show that the solar powered BEV configuration of the ferry has strong potential for CO2 reduction. The 38.5 g/kWh number for electricity generation from photovoltaics makes it an extremely clean source of energy compared to the Michigan grid. Amongst the two pathways for the solar powered BEV ferry discussed, having an onshore battery results in slightly higher emissions than sending the generated energy on the grid and charging the ferry through the grid. The onshore battery increases emissions and cost from having to replace an additional Li-ion battery every third year. The onshore battery will also bring additional complications due to cooling requirements, additional failure points that could lead to downtime and repairs, and will increase strain on the supply chain. Pathway 2 is the cleaner, cost effective and practical solution.
When it comes to charging the ferry from the June 2025 Michigan grid without solar panels in the equation, the conclusions are still the same as June 2022, in that the emissions from the power plants cause the BEV ferry to have higher WTW and operational CO2 emissions than the IC engine ferry. Similar results have been reported by Jeong et al. [21] and Borja-Marrugo et al. [22]. For this solution to be impactful, significantly higher decarbonization of the Michigan grid is necessary.
Figure 14 shows the CO2 emissions for each of three ferry configurations on per passenger per trip basis. The weight of the battery reduces the maximum capacity of the ferry from 330 people to 95 people (based on updated numbers). The grid powered BEV ferry has emissions over three times the emissions as compared to the IC engine ferry. The solar powered BEV ferry has the lowest emissions, even though the number of passengers on the ferry is lowered due to the battery weight.
5.2. Economic Impediments
The energy density and especially cost of specialized Li-ion batteries are the main impediments in the electrification of the Mackinac Island ferry. An annual expenditure of $1.67 million on the battery is difficult to justify. For any trip where the number of passengers can be higher than 95 (which is typically on the weekends), the company operating the ferry will lose revenue. For the current scenario, electrification is not an economically viable option for the Mackinac Island ferry.
This picture, however, could change over the course of the next few years. The reducing cost of solar photovoltaic installations shown in Figure 3 is testament to the fact that as the adoption of a technology increases, the price can reduce exponentially. Significant research is being done on a global scale on multiple Li-ion chemistries to improve their energy density and cost, which could lead to the possibility (not a guarantee) of a considerable price reduction in the years to come.
Finally, it is worth noting that the conclusion favoring the solar-powered BEV over the IC engine ferry rests on a self-imposed constraint: that the solar-generated energy must be used to charge the ferry. If the constraint is instead framed at the system level — that all present activities in Michigan, including travel to Mackinac Island, continue with minimum total carbon emissions — a different solution emerges. The same solar array could be built and grid-tied, displacing carbon-intensive generation on the Michigan grid, while the ferry retains modern IC engines. Because each solar-generated kWh delivered to the grid offsets electricity at the grid's marginal carbon intensity, whereas the same kWh routed through charging losses and battery replacement cycles serves the ferry at a higher effective carbon and financial cost, the grid-tied array with an IC engine ferry yields the greatest net emissions reduction of the configurations considered. The solar-BEV pathway should therefore be understood as the cleanest way to electrify this ferry, not as the optimal use of the solar resource itself.
6. Conclusions
This study revisited the 2022 electrification analysis of the Mackinac Island ferry and extended it to include locally generated solar energy. Charging the BEV ferry from the Michigan grid remains counterproductive: grid emissions per kWh still result in higher well-to-wheel CO₂ emissions than a modern IC engine ferry, and meaningful grid decarbonization is a prerequisite for grid-charged electrification. In contrast, a solar-powered BEV ferry reduces CO₂ emissions substantially, with direct grid-tied charging (Pathway 2) outperforming the onshore-battery configuration by avoiding the emissions and cost of an additional Li-ion battery replaced every third year. Economically, however, electrification remains unviable: the annual ferry battery expenditure of approximately $1.67 million and the reduction in passenger capacity from 330 to 95 outweigh the fuel savings, and these conclusions are insensitive to the solar addition. As battery costs, energy densities, and grid carbon intensity continue to improve, the analysis should be repeated periodically, as the balance among these configurations is expected to shift.
Author Contributions
Conceptualization, S.G., R.W. and J.W.; Methodology, S.G.; Software, S.G.; Formal analysis, S.G.; data curation, S.G.; Writing—original draft preparation, S.G.; Writing—review and editing, R.W. and J.W.; supervision, R.W. and J.W.; project administration, S.G.; funding acquisition, S.G and R.W. All authors have read and agreed to the published version of the manuscript.
Funding
The analysis conducted on the solar energy numbers from the US DoE Northern RTC at Michigan Technological University was funded by the Michigan Tech Center for Innovation in Sustainability and Resilience (CISR).
Conflicts of Interest
The authors declare no conflicts of interest.
Acknowledgments
Will be added later.
Abbreviations
The following abbreviations are used in this manuscript:
| ANL | Argonne National Laboratory |
| APSRC | Advanced Power Systems Research Center |
| BEV | Battery Electric Vehicle |
| CO₂ | Carbon Dioxide |
| DoD | Depth of Discharge |
| DoE | Department of Energy |
| EIA | Energy Information Administration |
| GHG | Greenhouse Gas |
| GPS | Global Positioning System |
| GREET | Greenhouse gases Regulated Emissions and Energy use in Technologies |
| IC | Internal Combustion |
| IEA | International Energy Agency |
| IMO | International Maritime Organization |
| LCA | Life-cycle Assessment |
| Li-ion | Lithium-ion |
| MEA | Mackinac Economic Alliance |
| MEDC | Michigan Economic Development Corporation |
| NMC | Nickel Manganese Cobalt (Oxide) |
| NLR | National Laboratory of the Rockies |
| PV | Photovoltaic |
| RTC | Regional Test Center |
| TCO | Total Cost of Ownership |
| WTW | Well-to-Wheel |
References
- International Maritime Organization (IMO). Available online: https://www.imo.org/en/ourwork/environment/pages/2023-imo-strategy-on-reduction-of-ghg-emissions-from-ships.aspx (accessed on 26th June 2026).
- McGookin, C.; Balazadeh, N.; Cullis Watson, A.; Hosseini, V.; Niet, T.; McTaggart-Cowan, G. Reviewing Ferry Electrification Trends; State of the Art, Challenges, and Key Gaps. [CrossRef]
- Sæther, S.R.; Moe, E. A green maritime shift: Lessons from the electrification of ferries in Norway. Energy Res. Soc. Sci. 2021, 81, 102282. [Google Scholar] [CrossRef]
- Aditya, K.; Pradhan, S.; Munsi, A. Feasibility study on megawatt-level fast charging system for shore power supply using wireless power transfer technology. Electr. Eng. 2024, 106(2), 1569–1583. [Google Scholar]
- International Energy Agency. Available online: https://www.iea.org/countries/norway/electricity (accessed on 26th June 2026).
- International Energy Agency. Available online: https://www.iea.org/countries/united-states/electricity (accessed on 26th June 2026).
- Gopujkar, S.; Worm, J. Assessing the Benefits of Electrification for the Mackinac Island Ferry from an Environmental and Economic Perspective. Sustainability 2024, 16(10), 4297. [Google Scholar] [CrossRef]
- Our World in Data. Available online: https://ourworldindata.org/grapher/installed-solar-pv-capacity (accessed on 26th June 2026).
- Our World in Data. Available online: https://ourworldindata.org/grapher/solar-pv-prices?yScale=linear (accessed on 26th June 2026).
- Our World in Data. Available online: https://ourworldindata.org/cheap-renewables-growth (accessed on 26th June 2026).
- Lazaroiu, A.C.; Gmal Osman, M.; Strejoiu, C.V.; Lazaroiu, G. A comprehensive overview of photovoltaic technologies and their efficiency for climate neutrality. Sustainability 2023, 15(23), 16297. [Google Scholar] [CrossRef]
- US Energy Information Administration. Available online: https://www.eia.gov/electricity/data/browser/ (accessed on 26th June 2026).
- US Energy Information Administration. Available online: https://www.eia.gov/electricity/annual/html/epa_08_01.html (accessed on 26th June 2026).
- GREET®. Life-Cycle Assessment Tool; Argonne National Lab: Chicago, IL, USA, 2022. [Google Scholar]
- Stages, L.C. Life cycle greenhouse gas emissions from solar photovoltaics. J. Ind. Ecol. 2012, 16, S122. [Google Scholar] [CrossRef]
- Preger, Y.; Barkholtz, H.M.; Fresquez, A.; Campbell, D.L.; Juba, B.W.; Romàn-Kustas, J.; Ferreira, S.R.; Chalamala, B. Degradation of commercial lithium-ion cells as a function of chemistry and cycling conditions. J. Electrochem. Soc. 2020, 167(12), 120532. [Google Scholar] [CrossRef]
- Deshpande, R.D.; Uddin, K. Physics inspired model for estimating ‘cycles to failure’as a function of depth of discharge for lithium ion batteries. J. Energy Storage 2021, 33, 101932. [Google Scholar] [CrossRef]
- Cui, Y.; Du, C.; Yin, G.; Gao, Y.; Zhang, L.; Guan, T.; Yang, L.; Wang, F. Multi-stress factor model for cycle lifetime prediction of lithium ion batteries with shallow-depth discharge. J. Power Sources 2015, 279, 123–132. [Google Scholar] [CrossRef]
- Our World in Data. Available online: https://ourworldindata.org/grapher/co-emissions-per-capita (accessed on 26th June 2026).
- Bajolle, H.; Lagadic, M.; Louvet, N. The future of lithium-ion batteries: Exploring expert conceptions, market trends, and price scenarios. Energy Res. Soc. Sci. 2022, 93, 102850. [Google Scholar] [CrossRef]
- Jeong, B.; Jang, H.; Lee, W.; Park, C.; Ha, S.; Kim, D. K.; Cho, N. K. Is electric battery propulsion for ships truly the lifecycle energy solution for marine environmental protection as a whole? J. Clean. Prod. 2022, 355, 131756. [Google Scholar] [CrossRef]
- Borja-Marrugo, V.; Aguirre-Restrepo, Y.; Paipa-Sanabria, E. G.; Castro-Faccetti, C. F.; Quiñones-Bolaños, E. Assessment of the emissions of a low draught ship powered by batteries for river passenger transport, using a life cycle methodology. Int. J. Environ. Stud. 2025, 82(2), 842–858. [Google Scholar] [CrossRef]
Figure 1.
Distribution of electricity generation by source for (a) Norway and (b) the United States.
Figure 1.
Distribution of electricity generation by source for (a) Norway and (b) the United States.
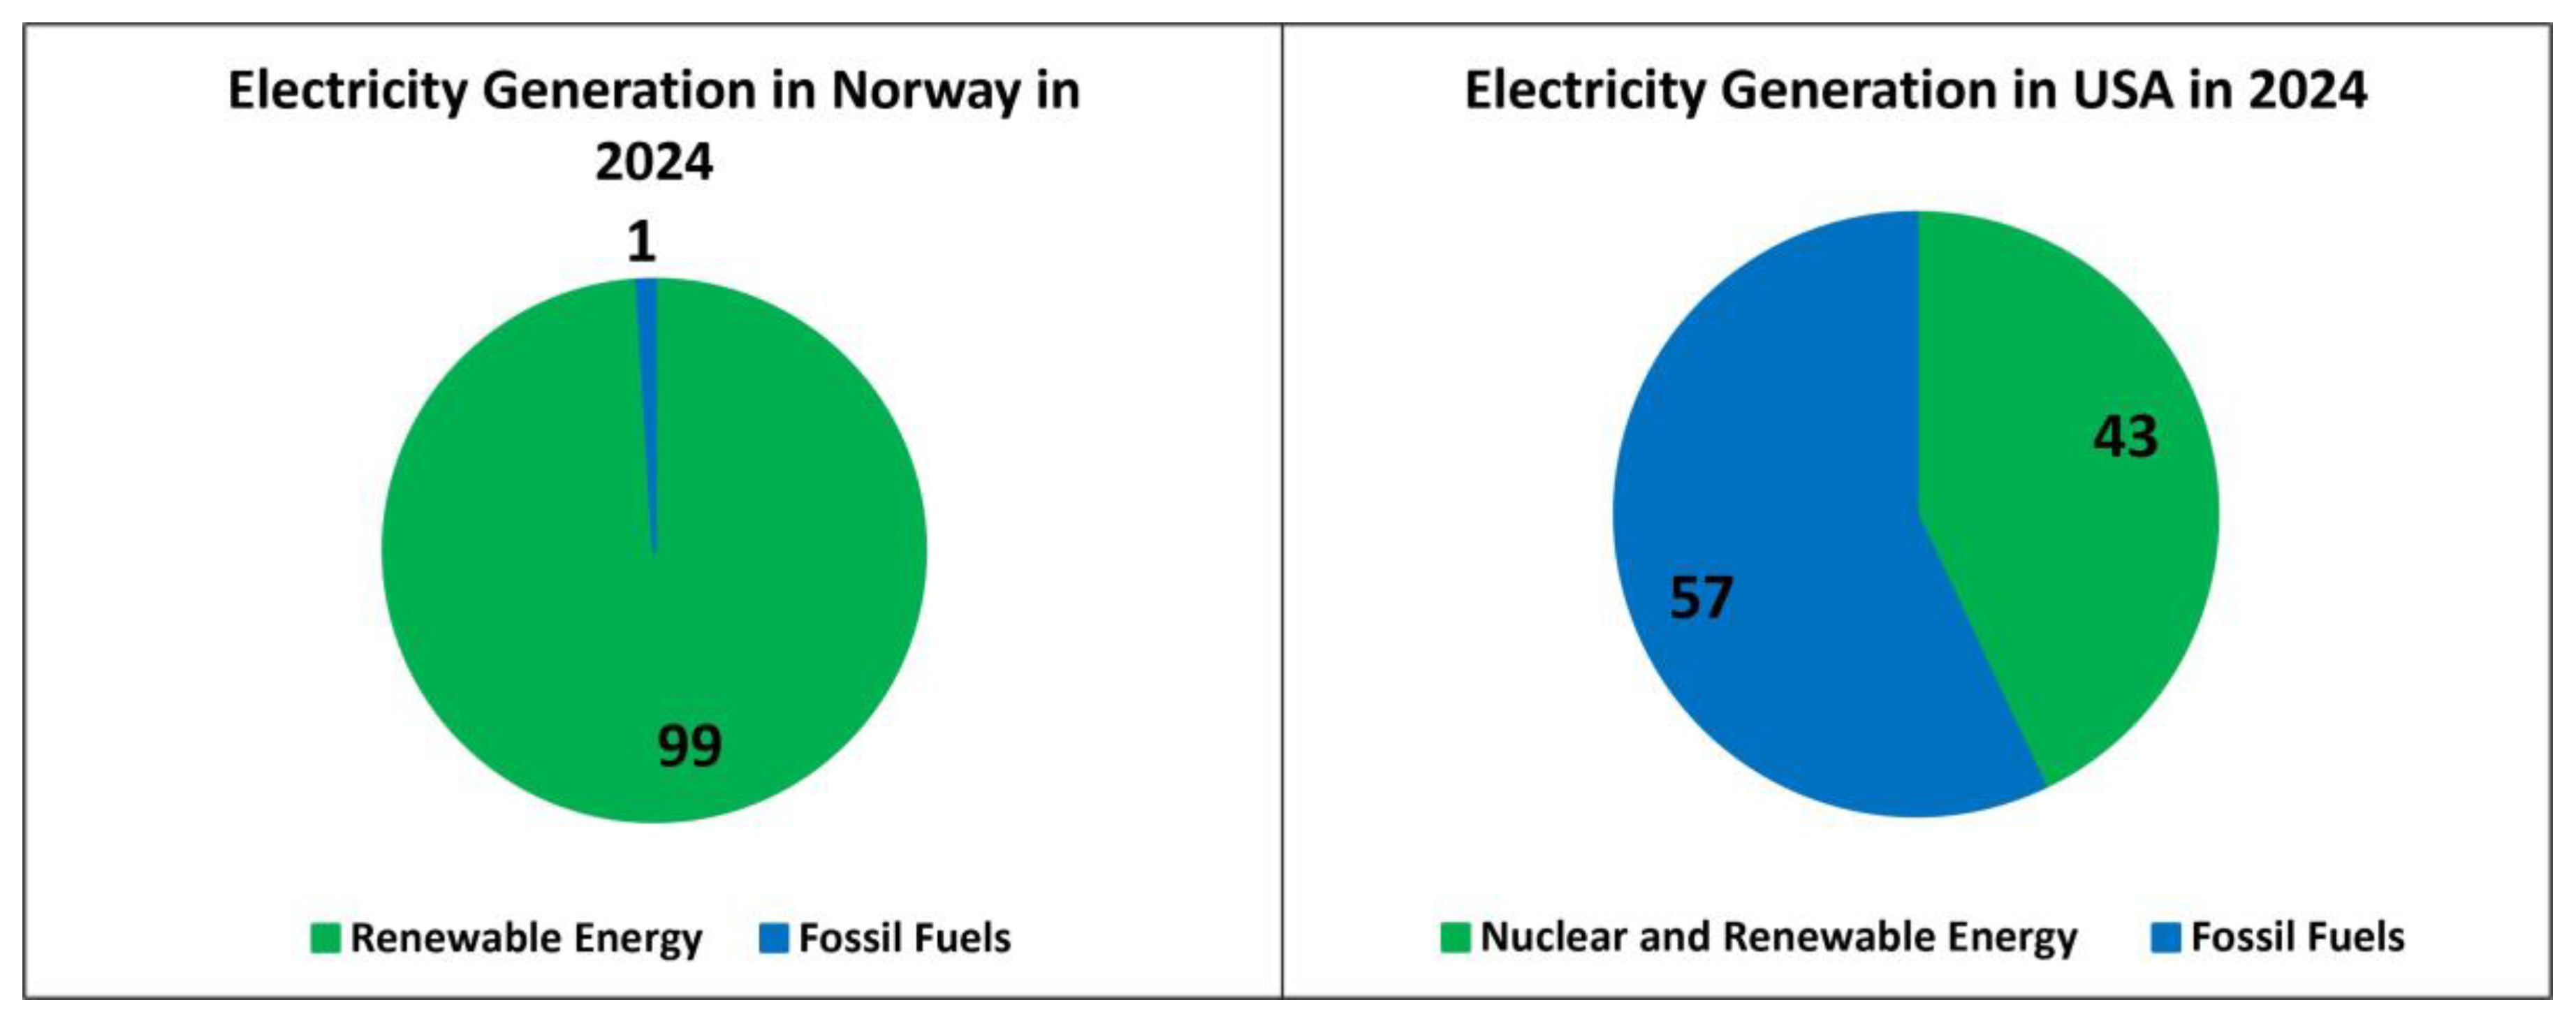
Figure 2.
Installed Solar Photovoltaic Capacity from 2004 to 2024.
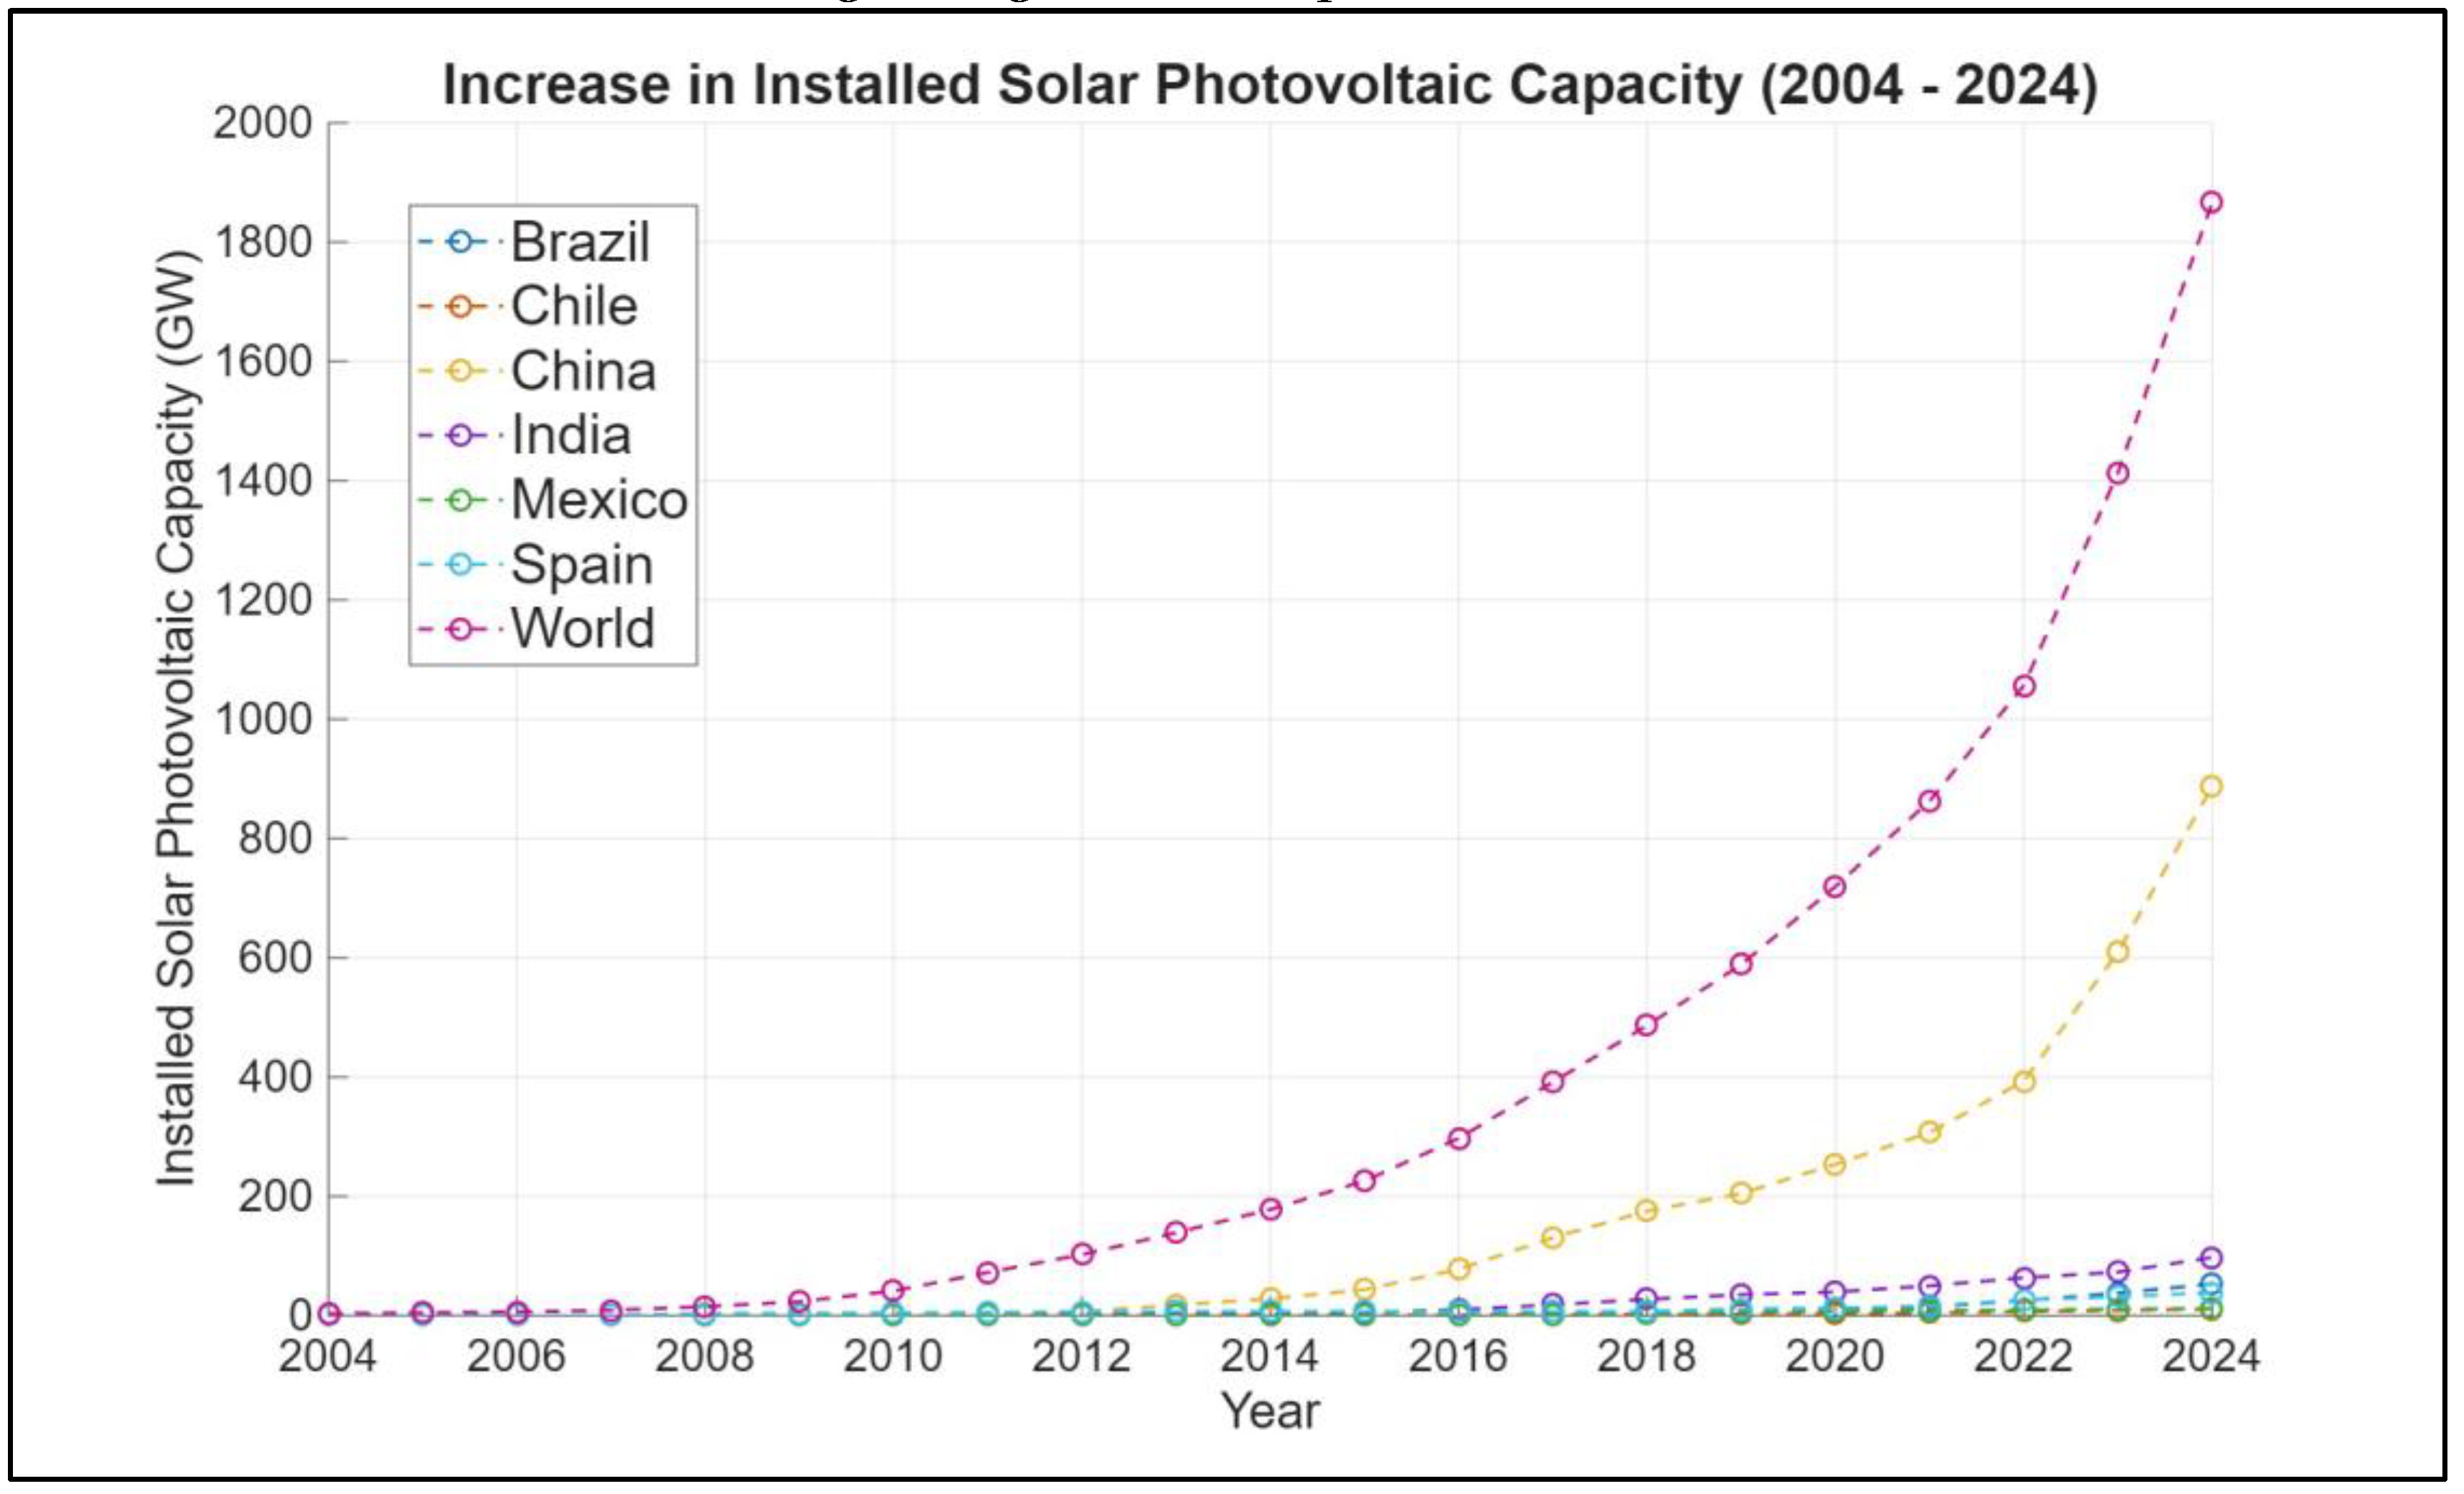
Figure 3.
Change in Solar Photovoltaic Module Cost from 1975 to 2024.
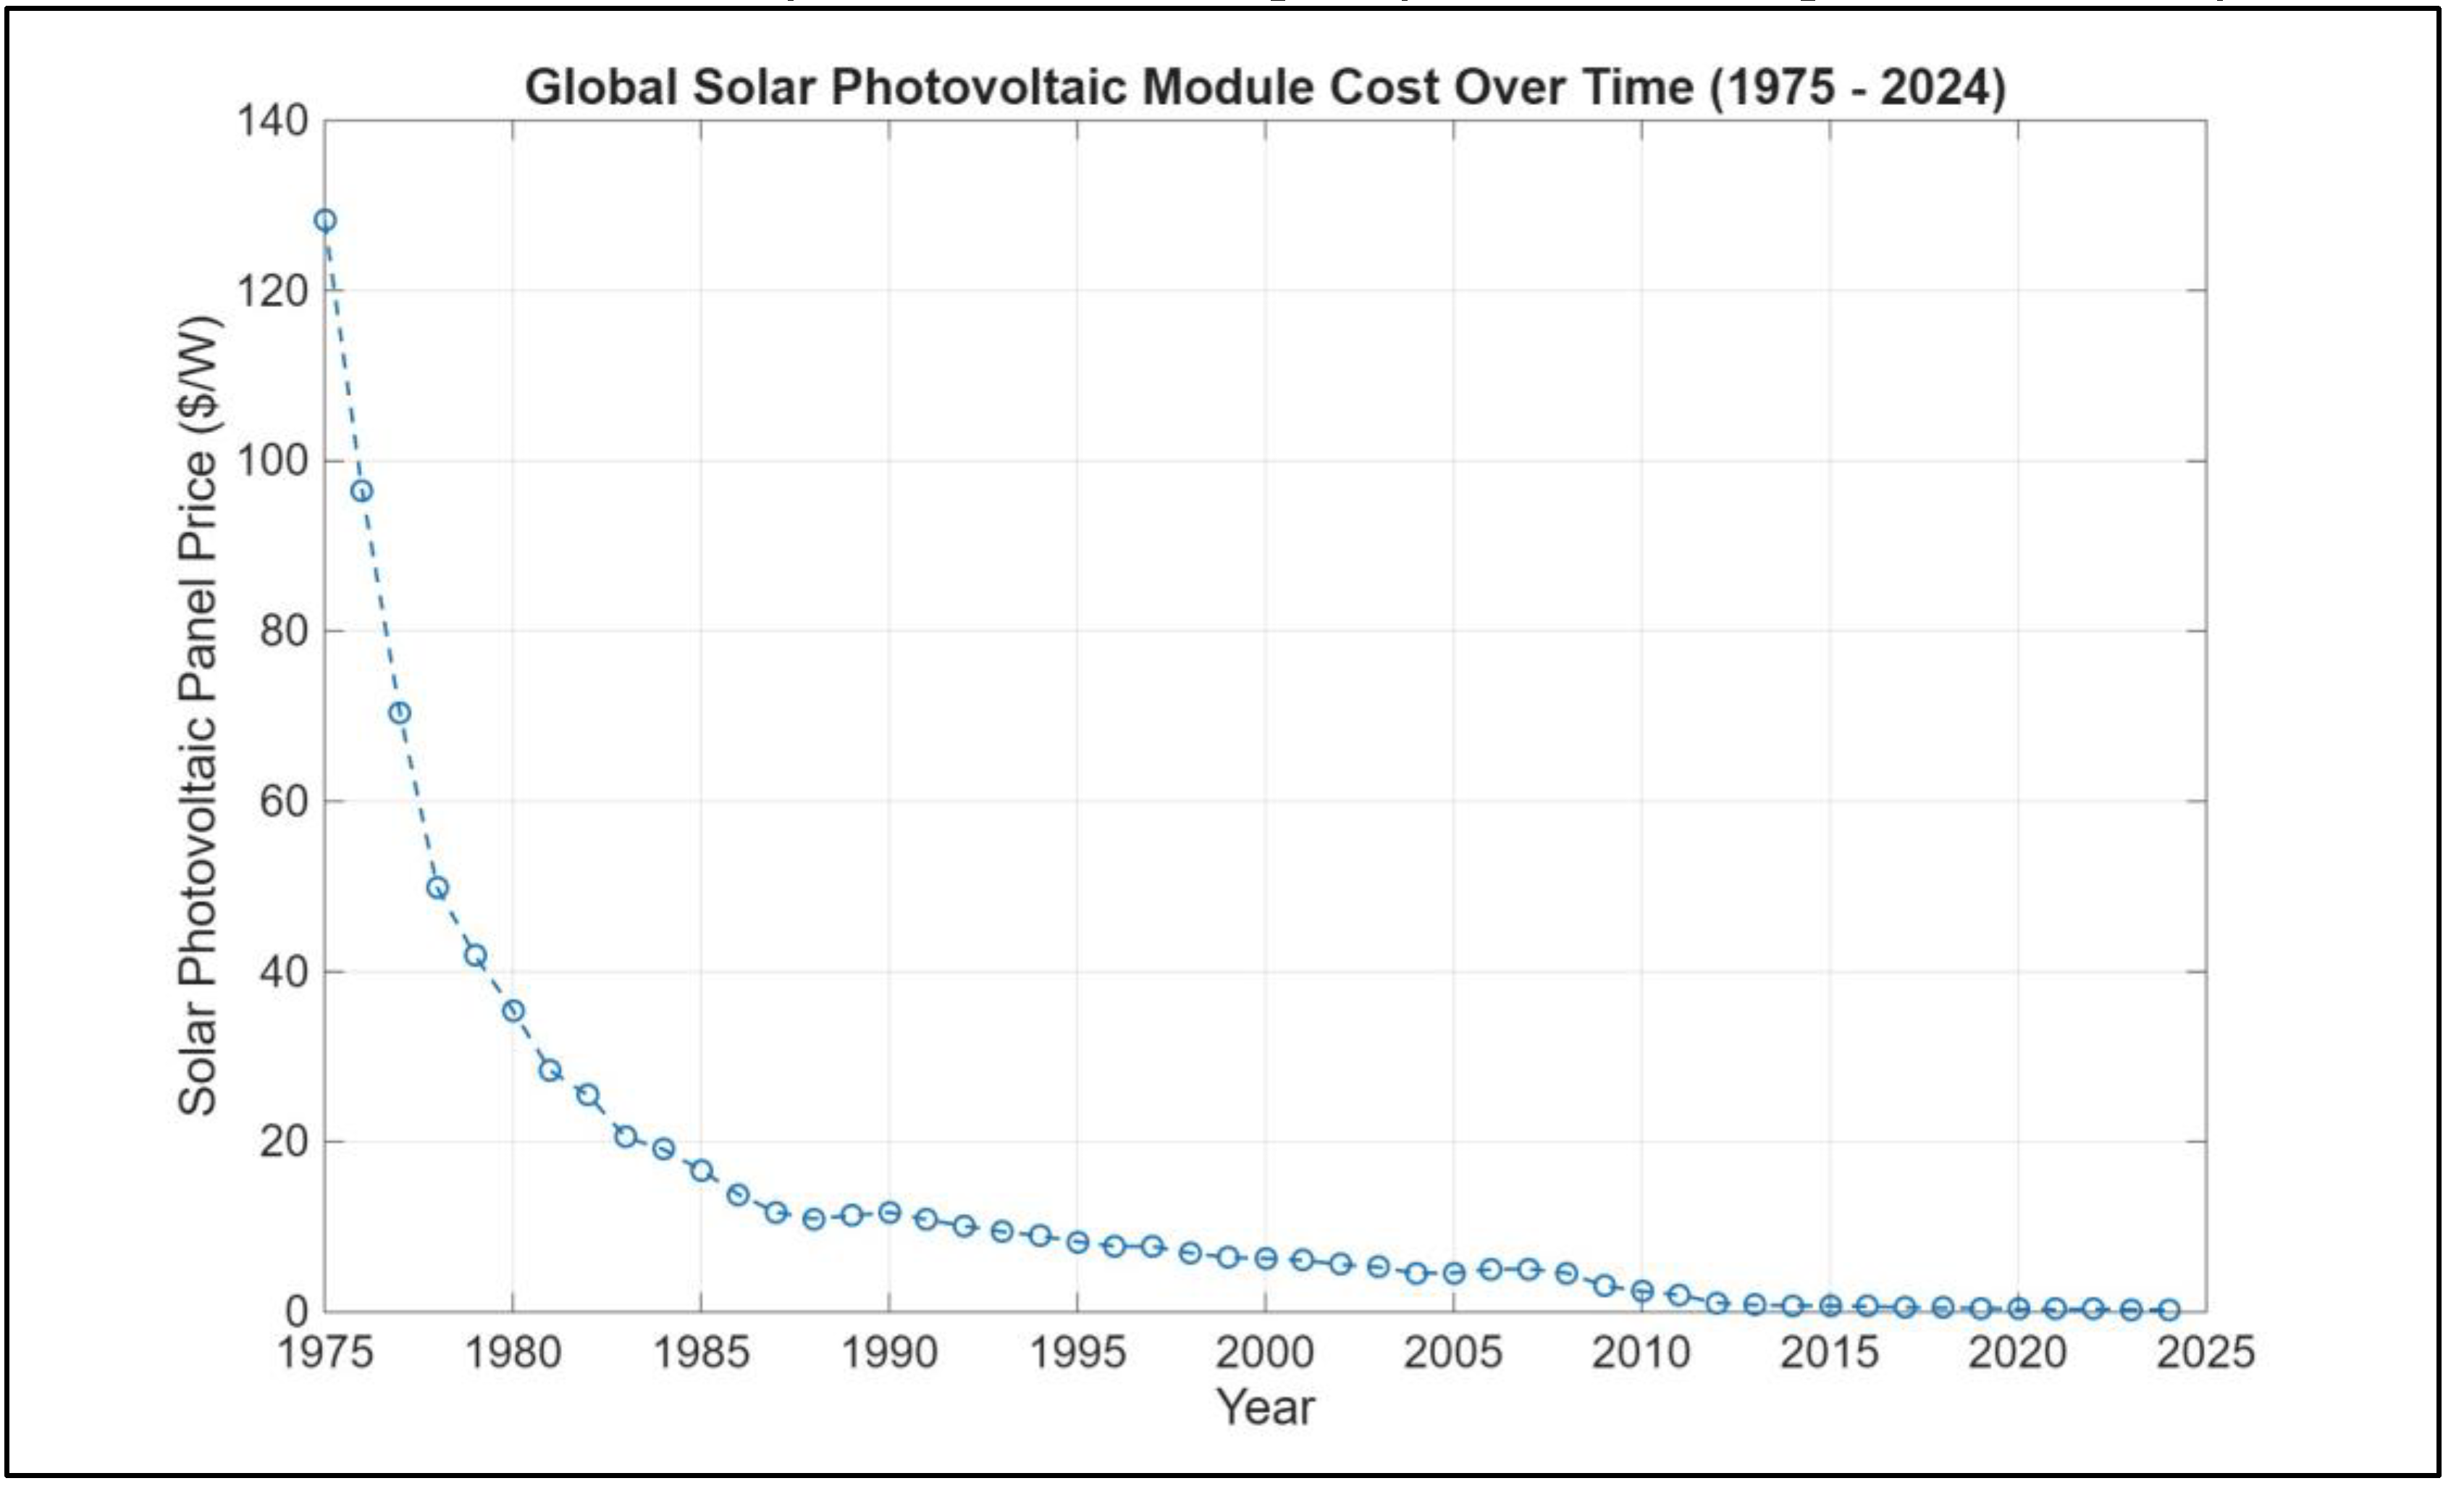
Figure 4.
Distribution of electricity generation in Michigan (June 2022 and June 2025).
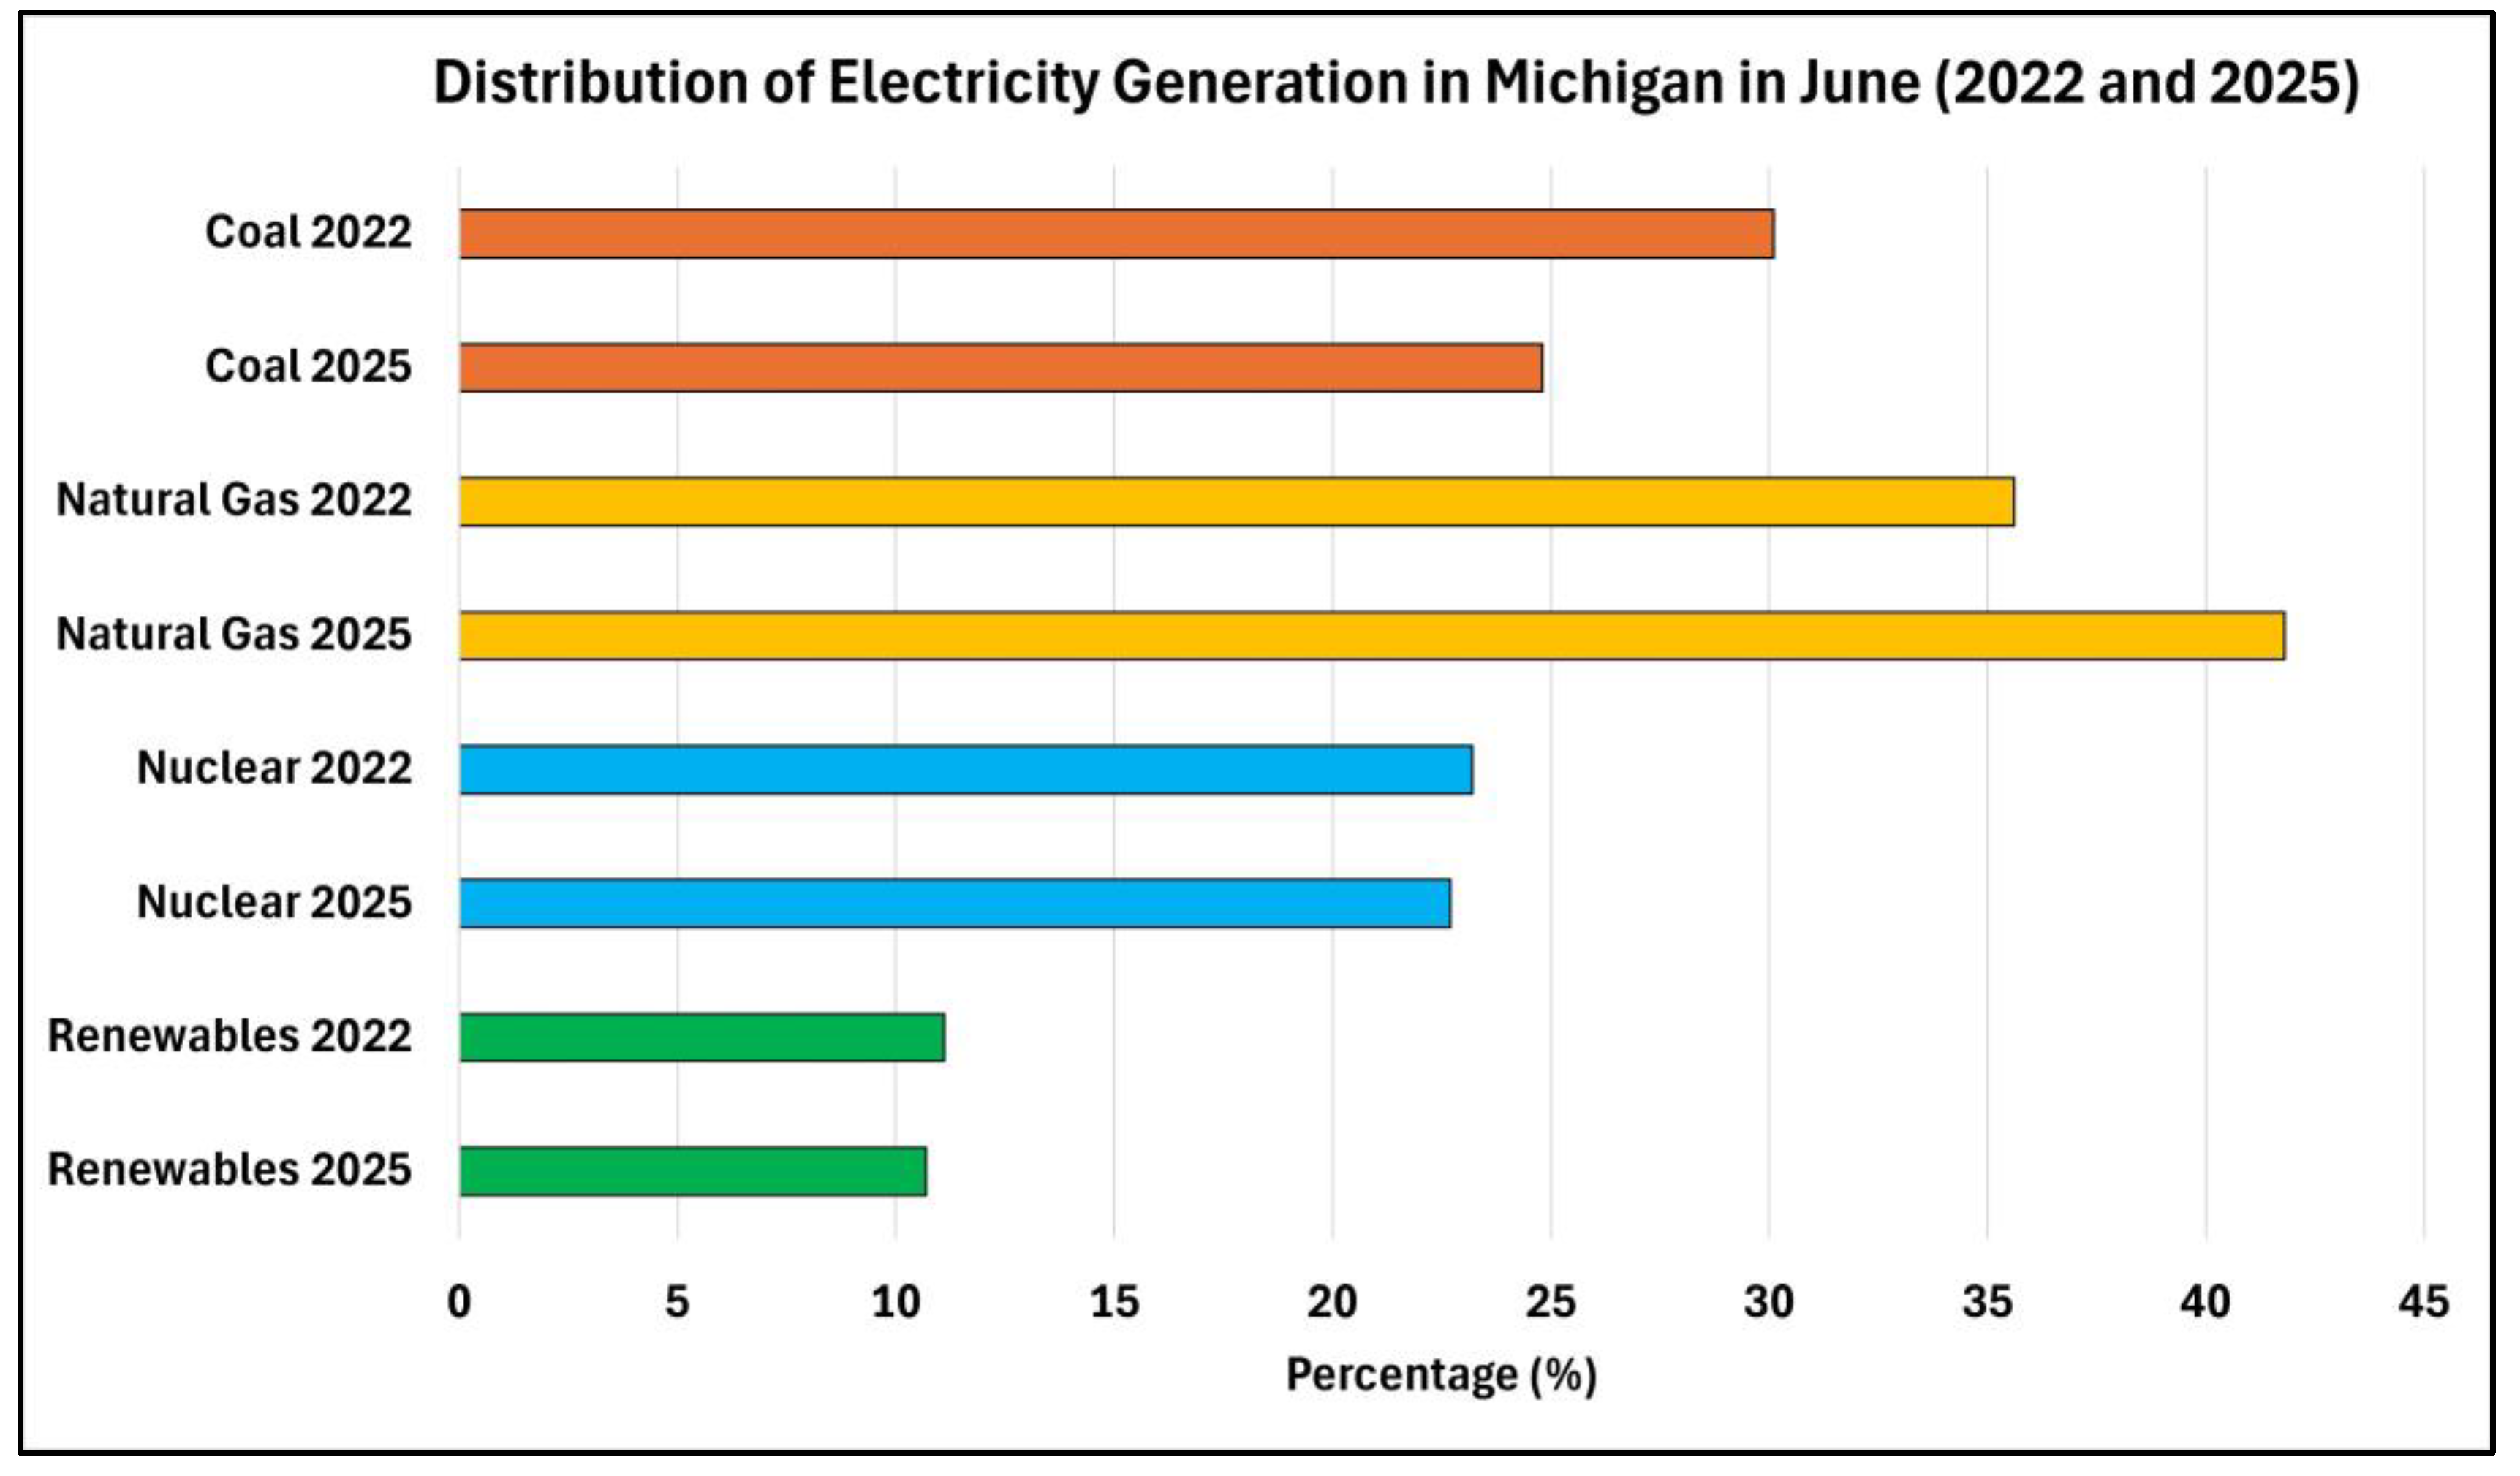
Figure 5.
Ferry route from Mackinaw City to Mackinac Island captured using the Strava application [7].
Figure 5.
Ferry route from Mackinaw City to Mackinac Island captured using the Strava application [7].
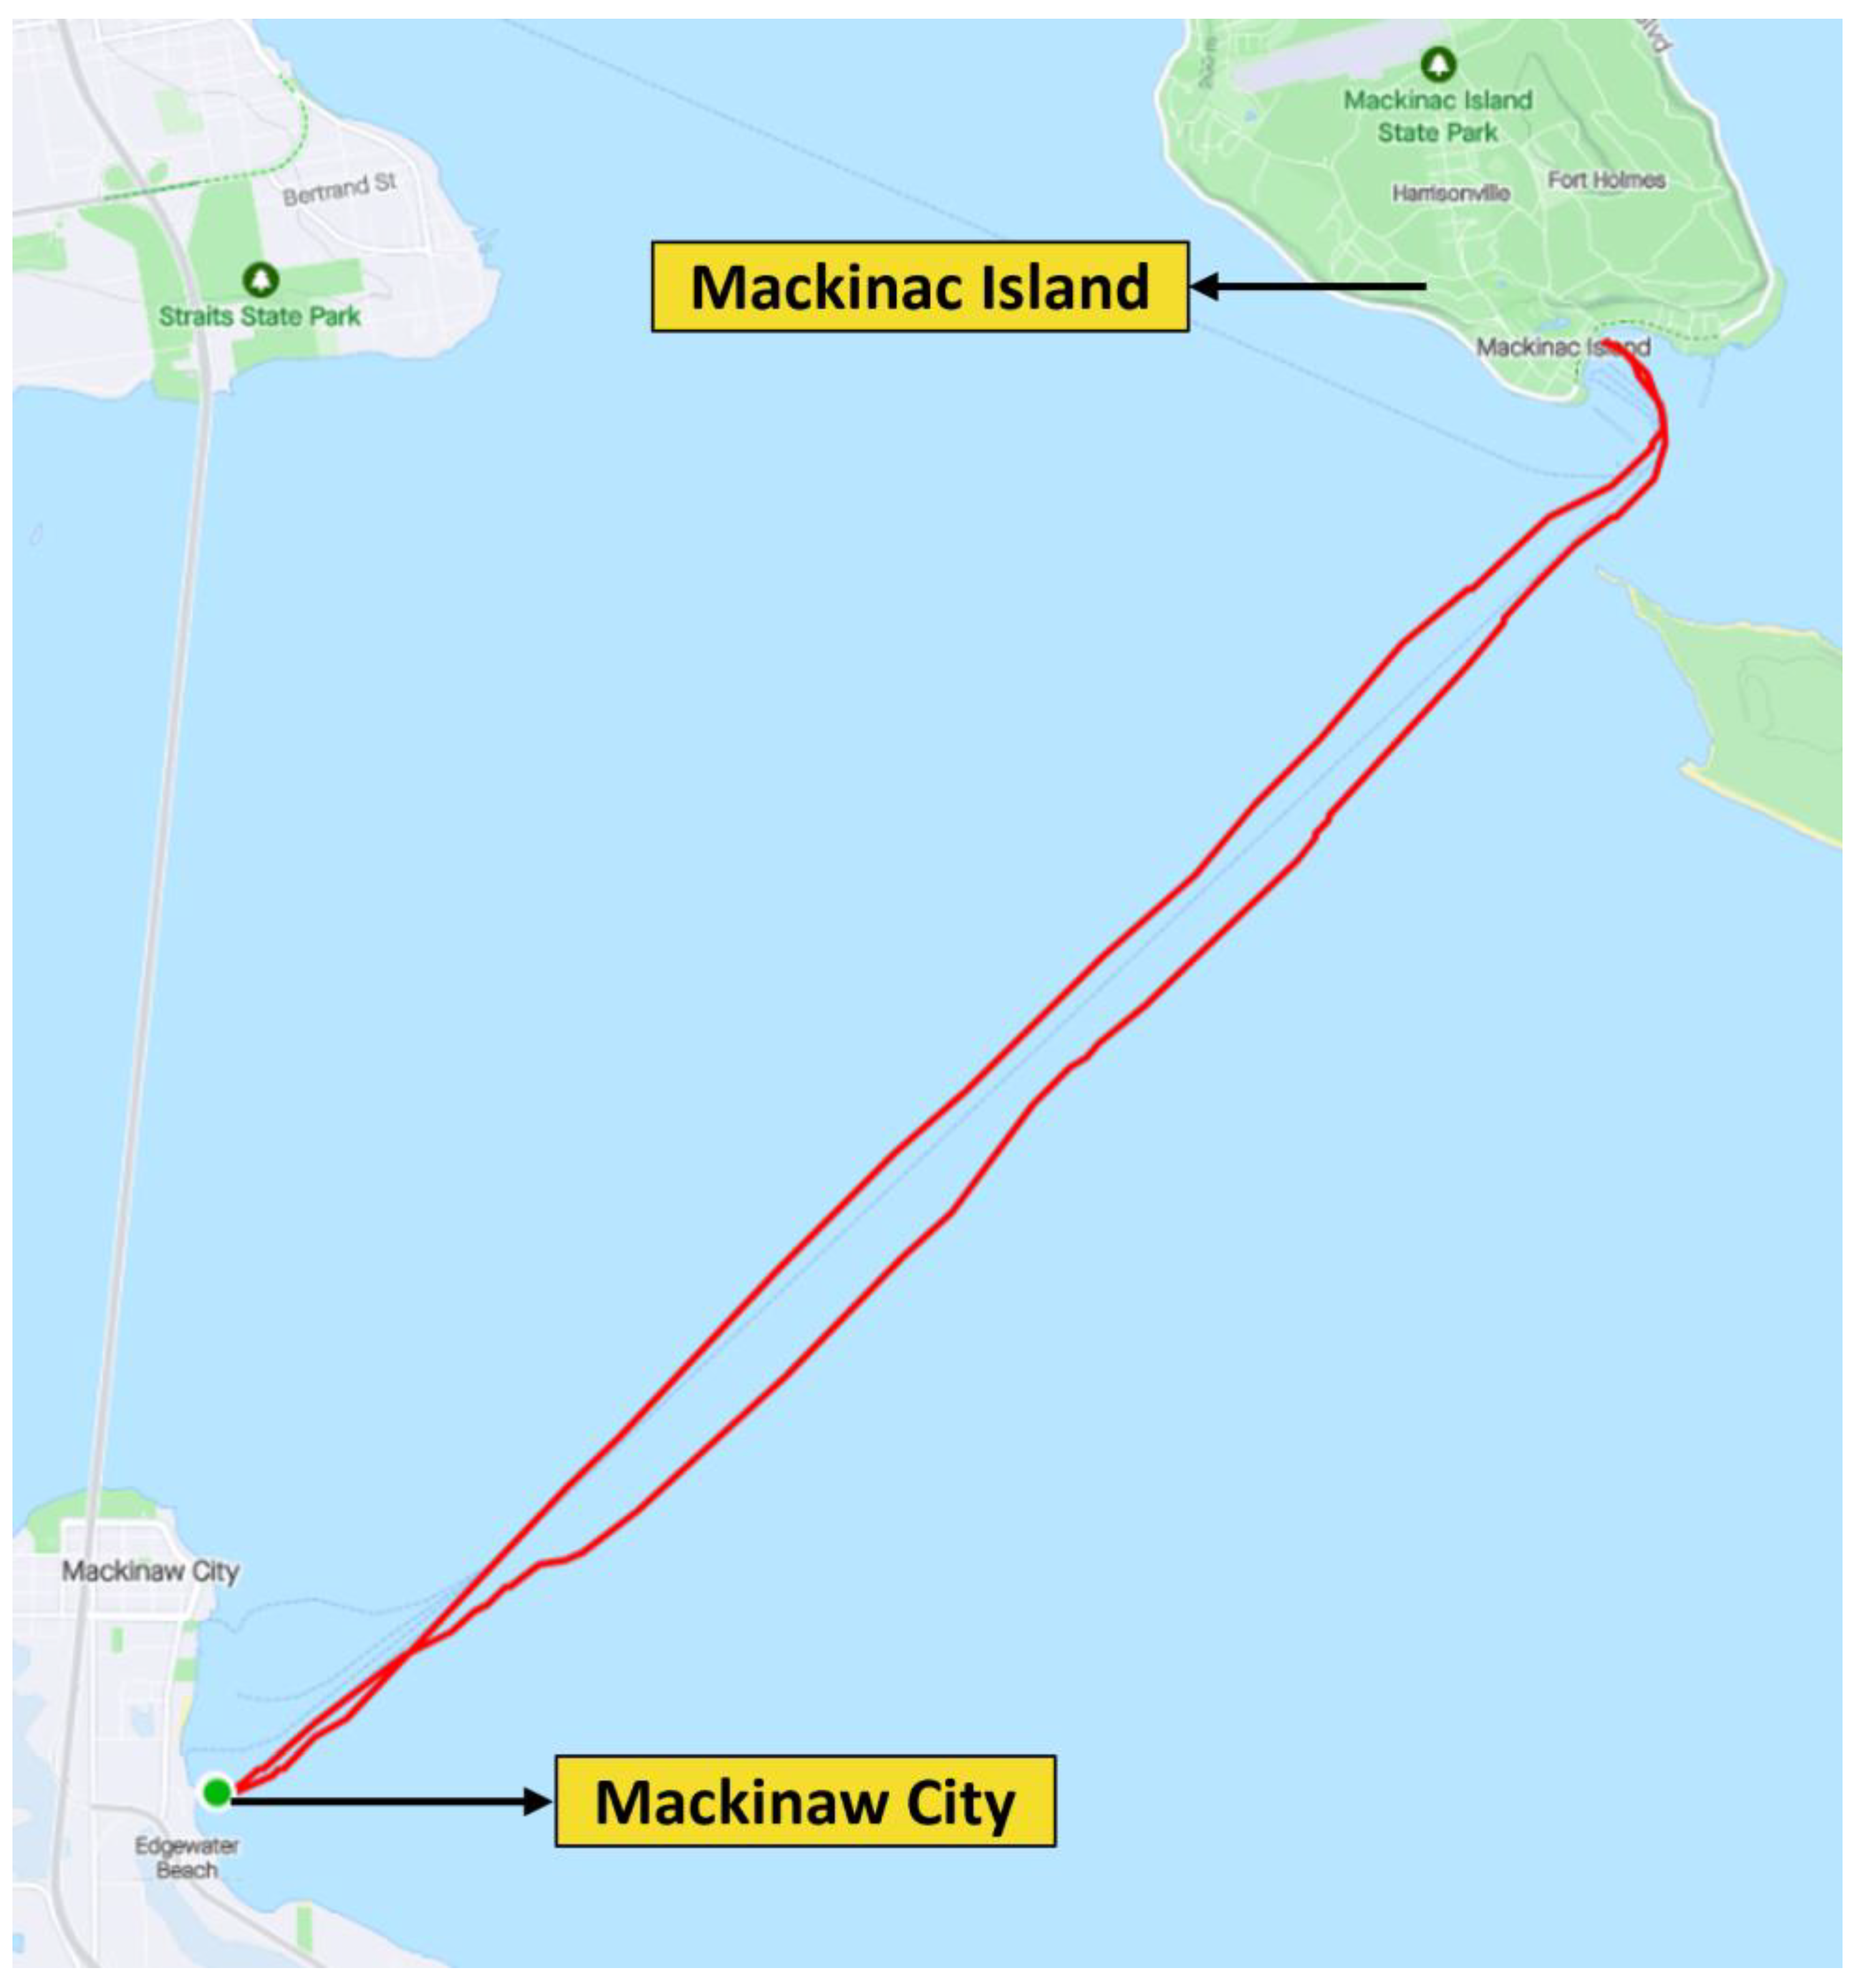
Figure 6.
Speed vs time data for Voyager and Liberty II ferries from Mackinaw City and Mackinac Island and back [7].
Figure 6.
Speed vs time data for Voyager and Liberty II ferries from Mackinaw City and Mackinac Island and back [7].
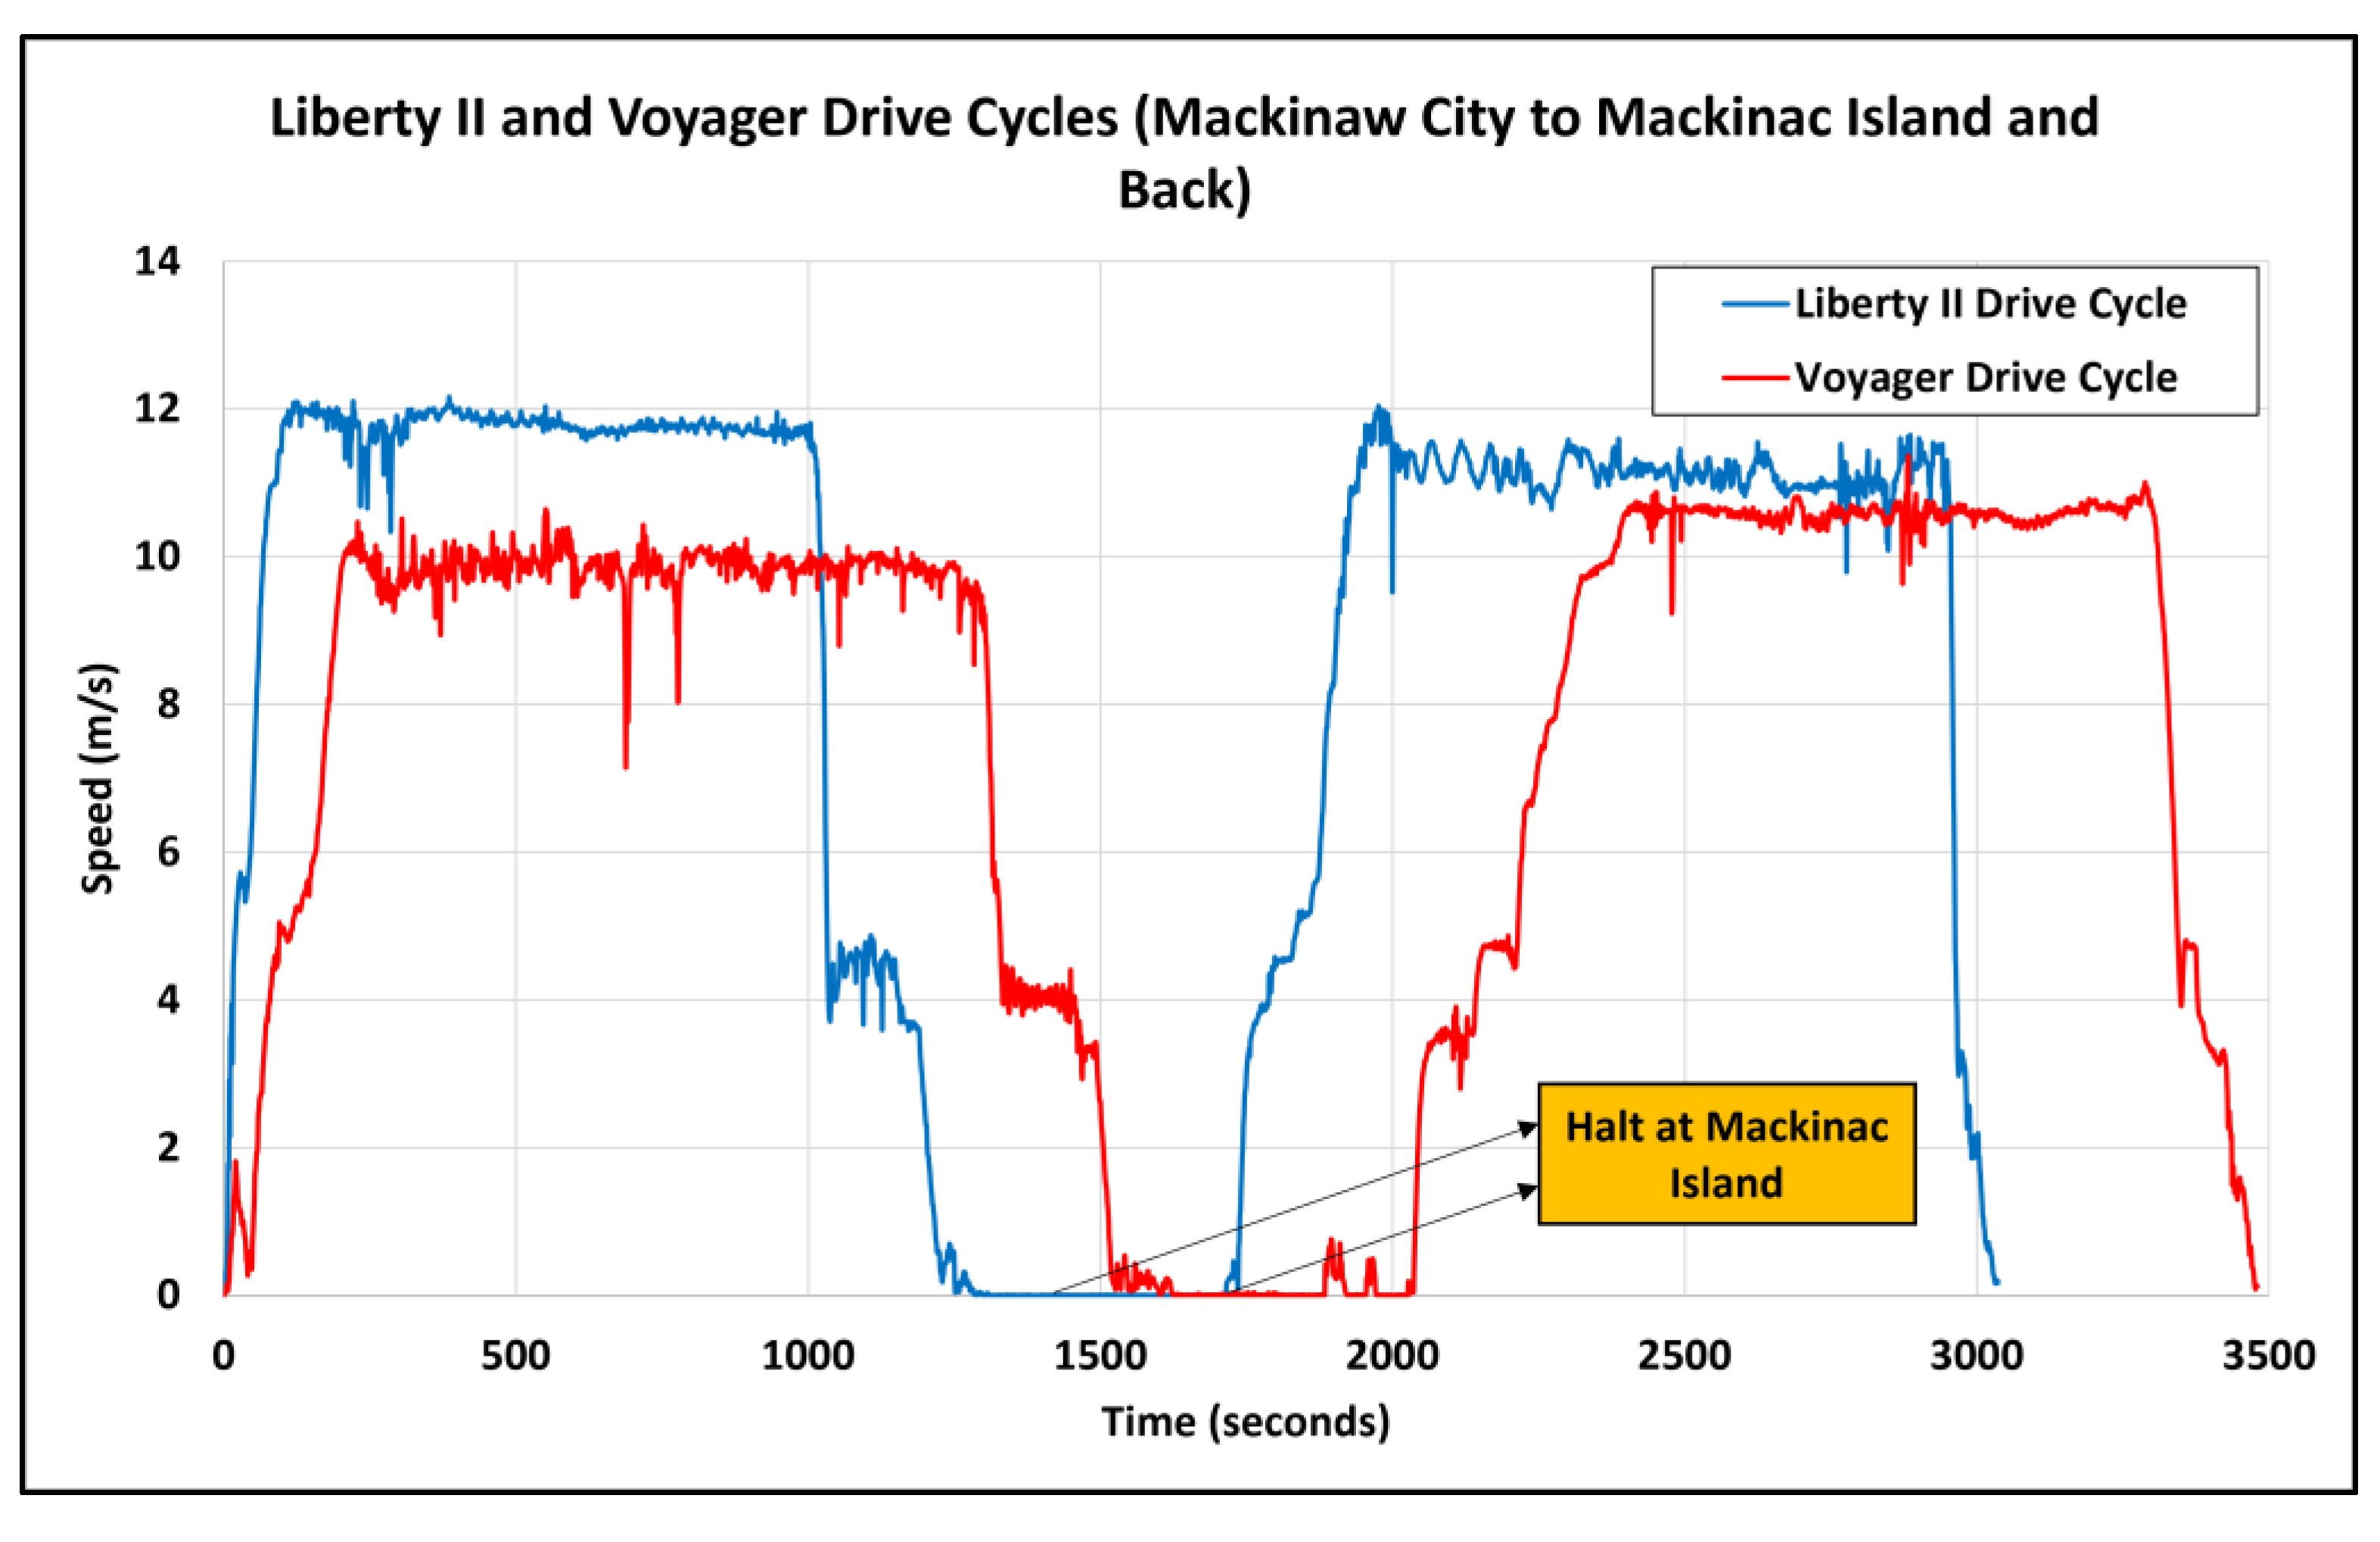
Figure 7.
Average monthly energy output for a SolarWorld 320W monocrystalline monofacial solar panels (2023 to 2025) at the APSRC (US DoE Northern RTC).
Figure 7.
Average monthly energy output for a SolarWorld 320W monocrystalline monofacial solar panels (2023 to 2025) at the APSRC (US DoE Northern RTC).
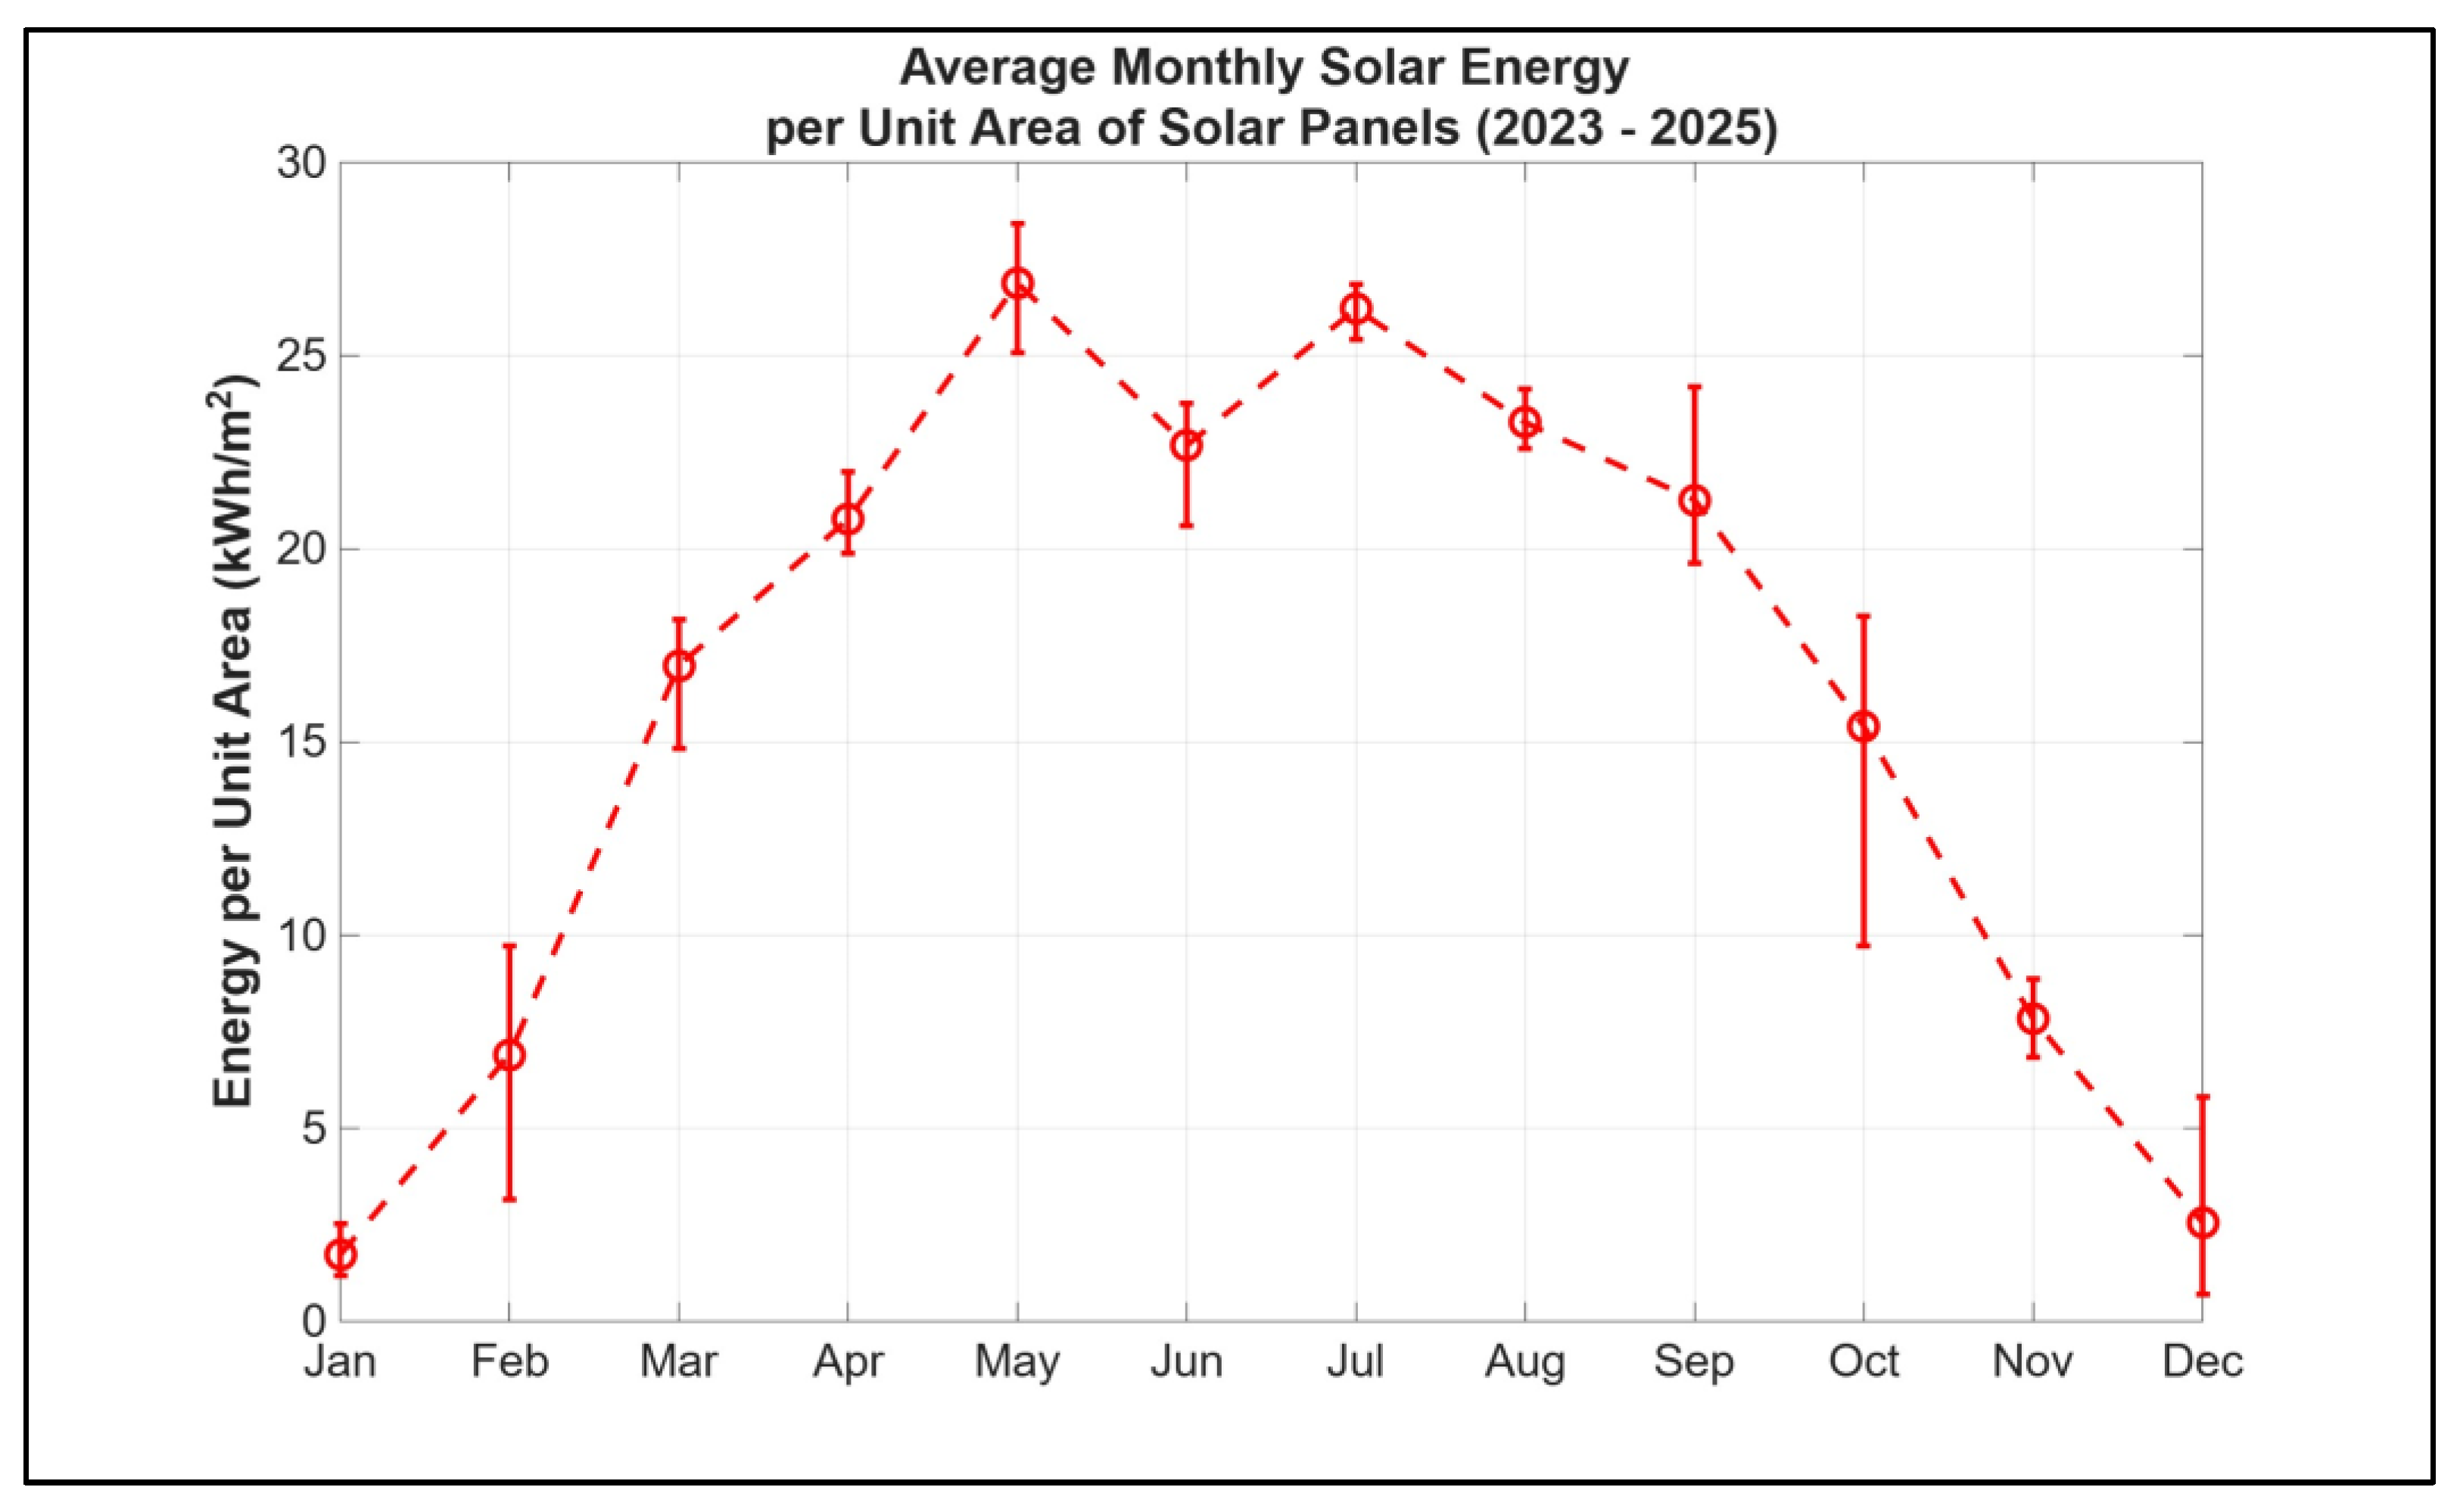
Figure 8.
Schematics for solar powered ferry pathways.
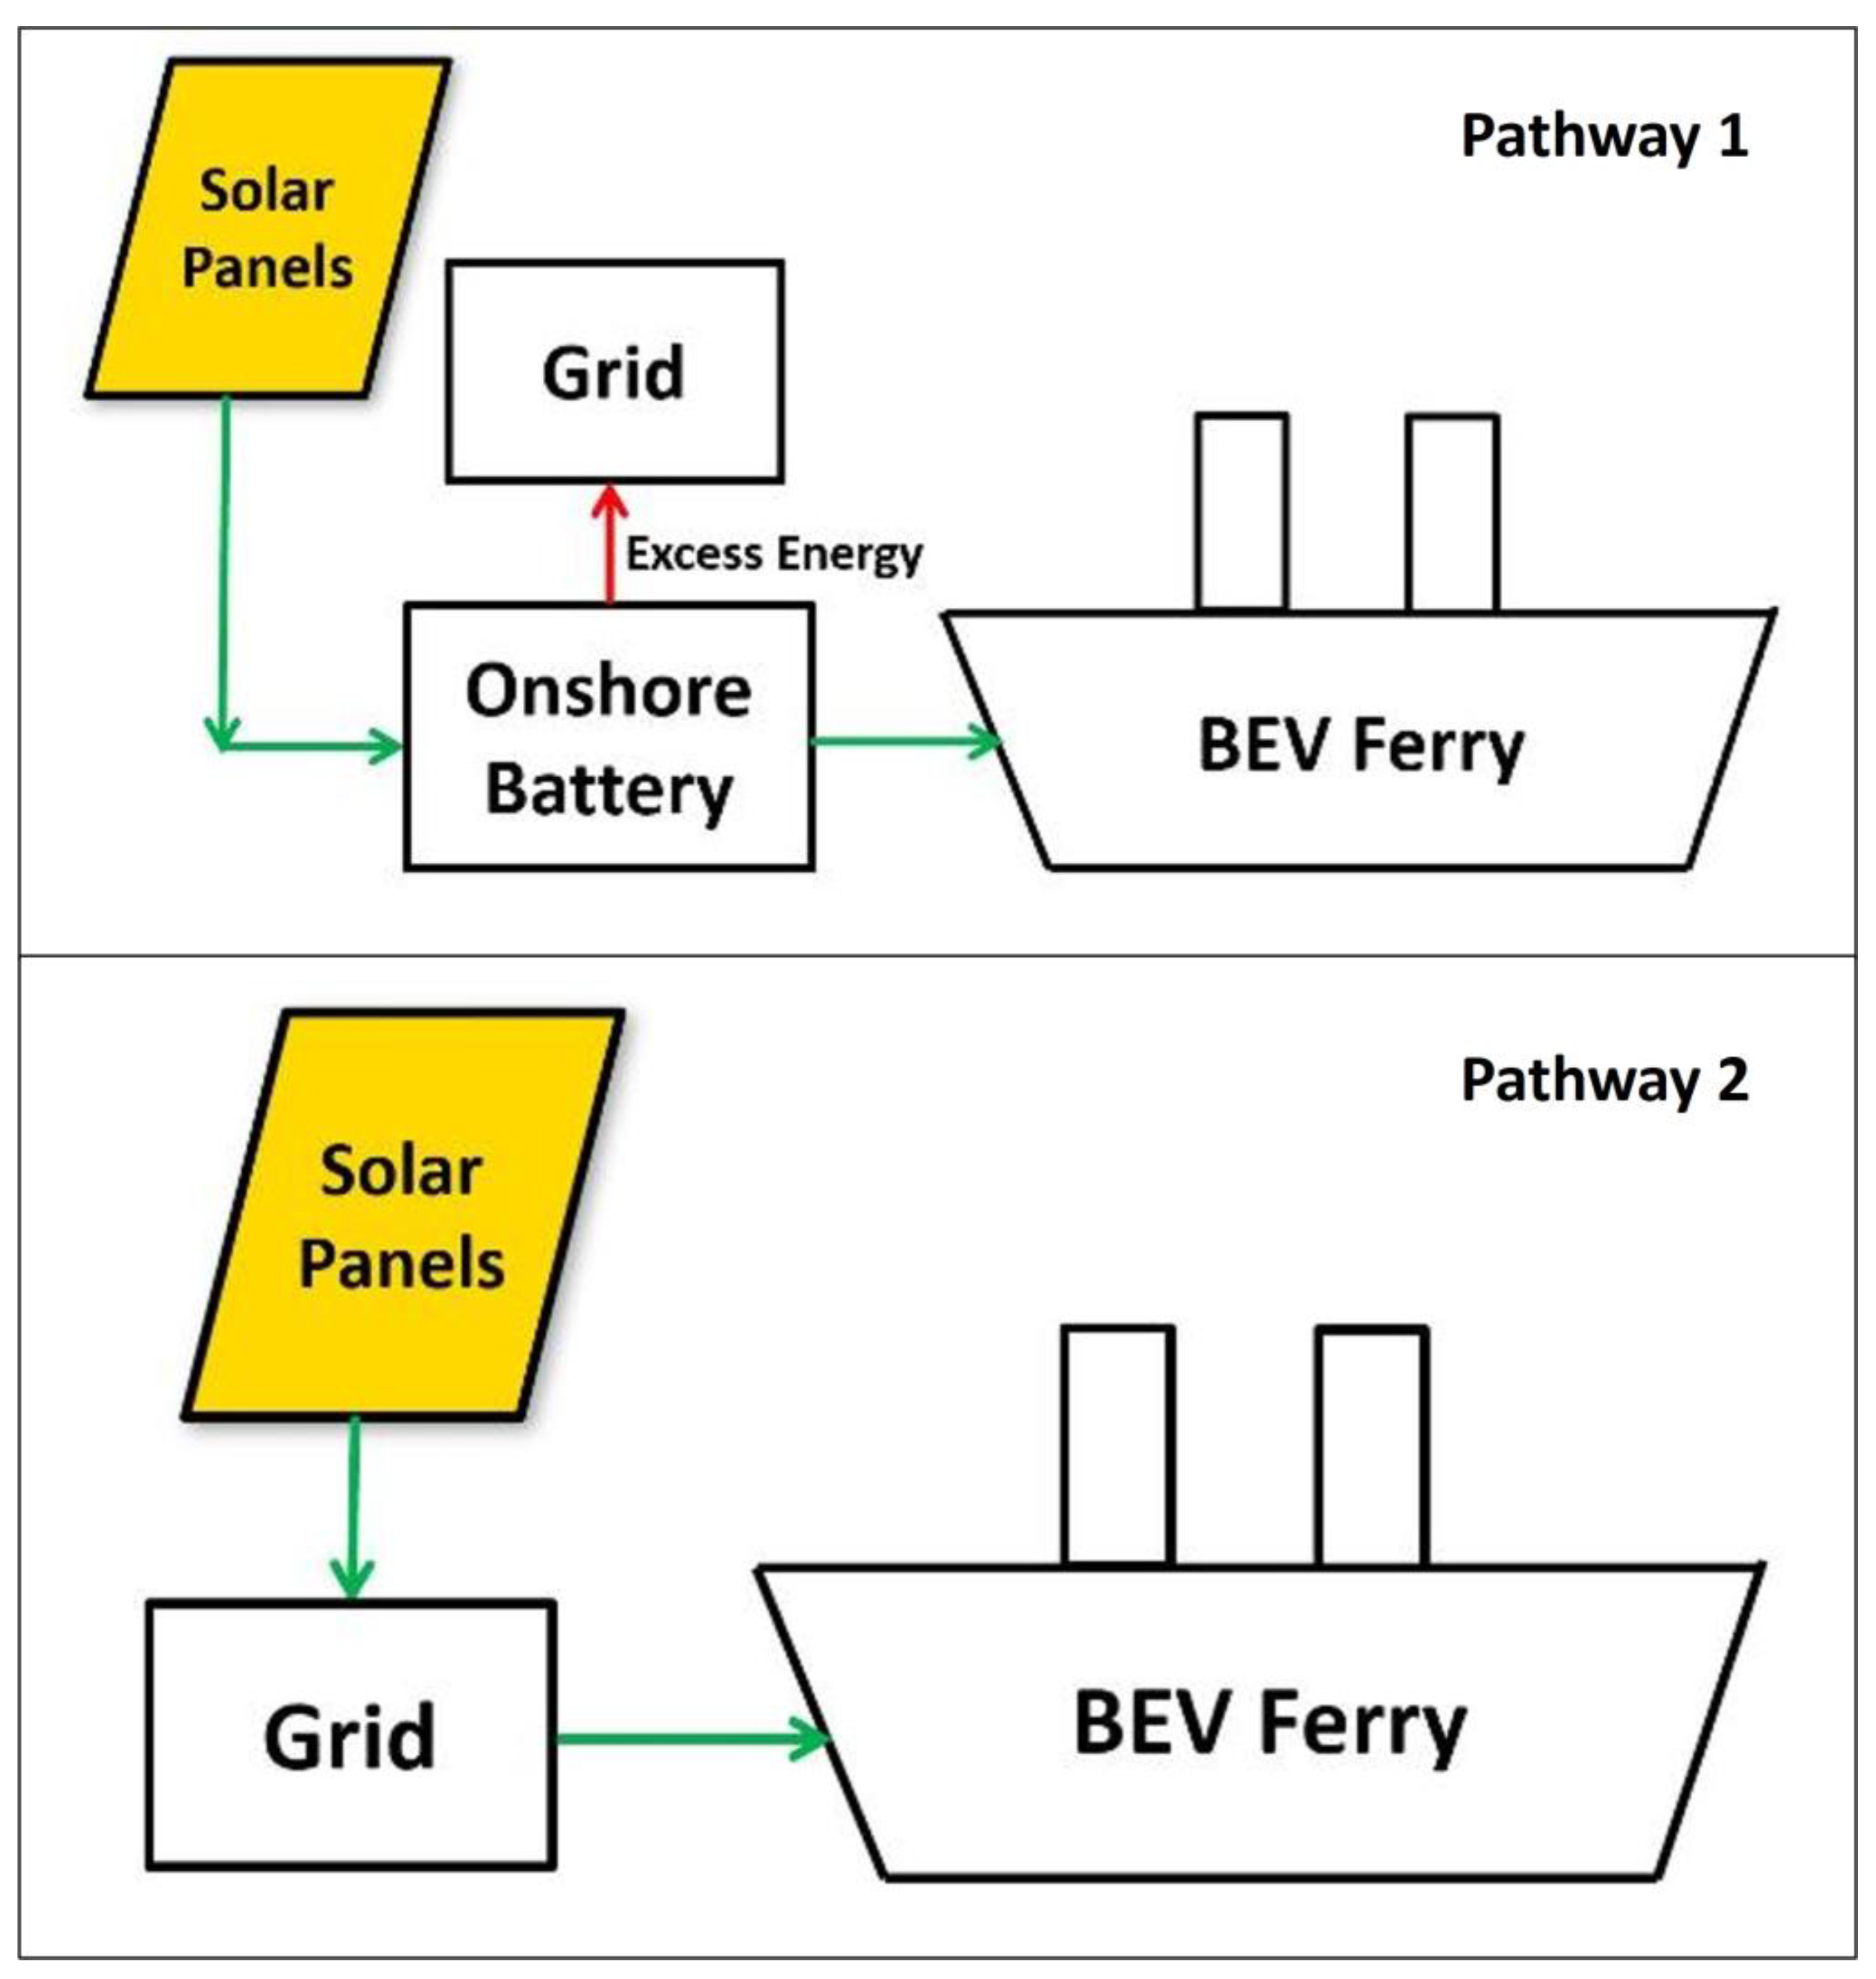
Figure 9.
Hourly distribution of solar energy for September.
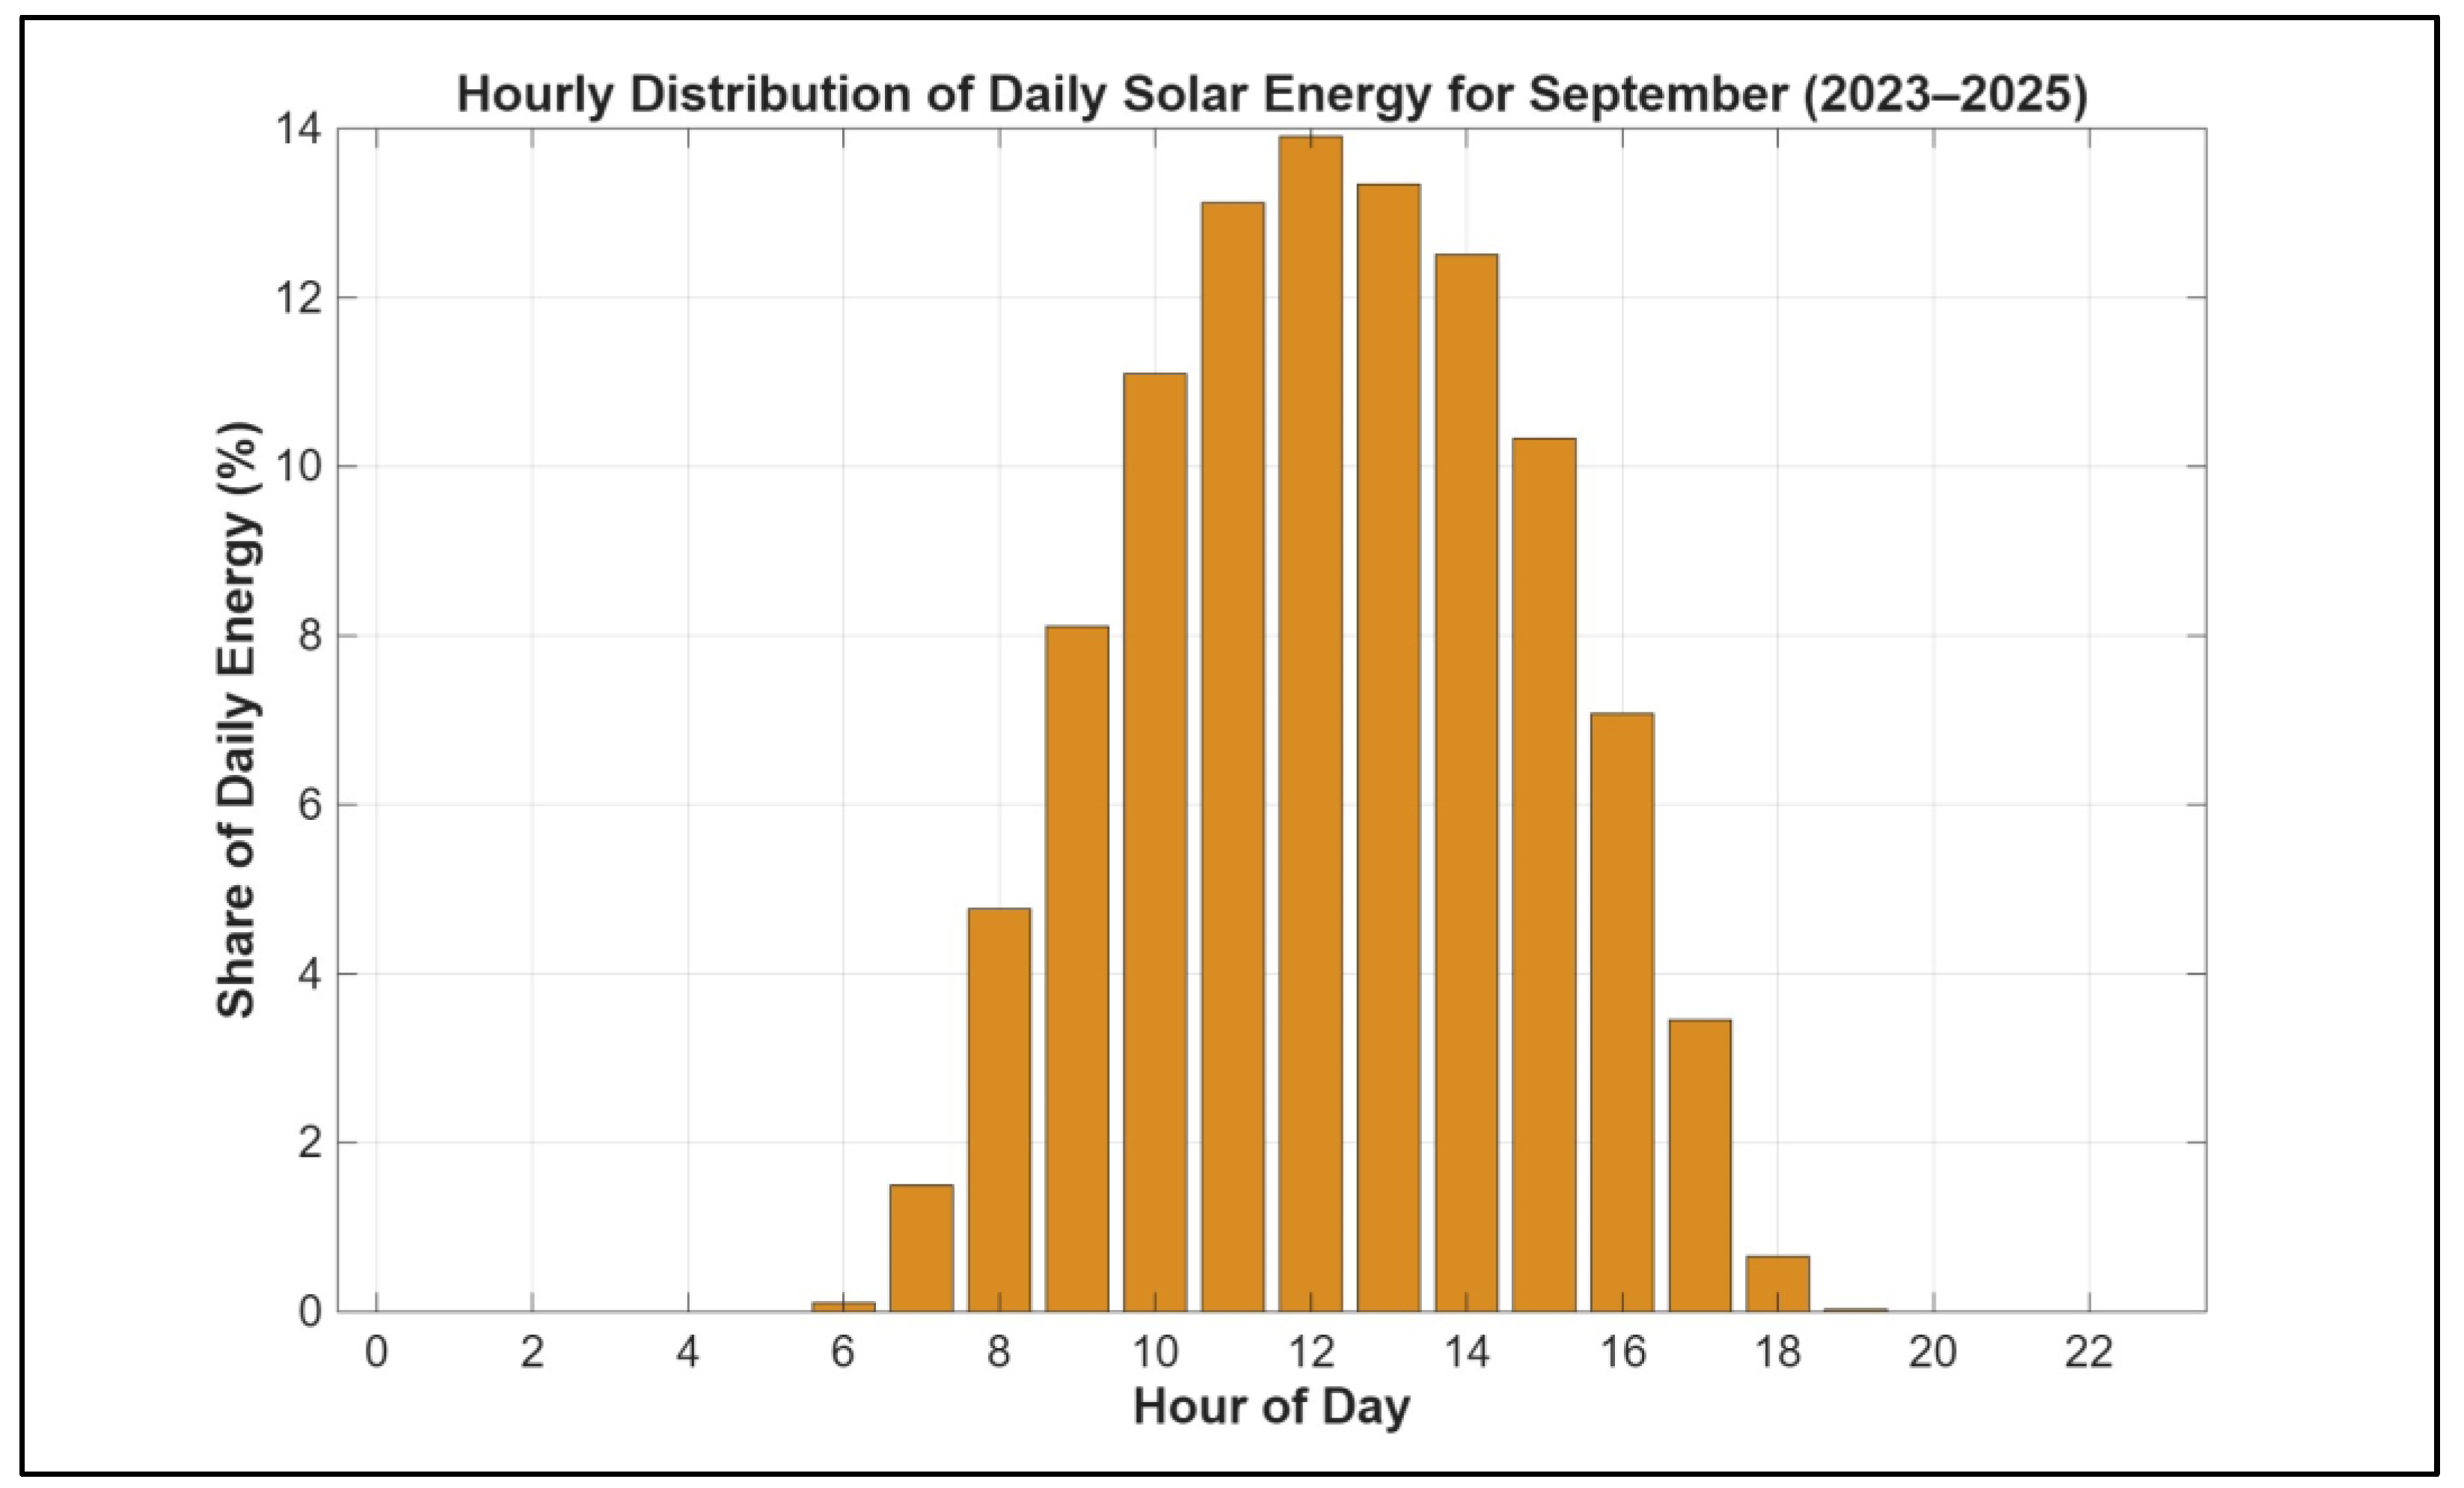
Figure 10.
CO2 from the solar powered BEV and IC Engine configurations (with an onshore battery).
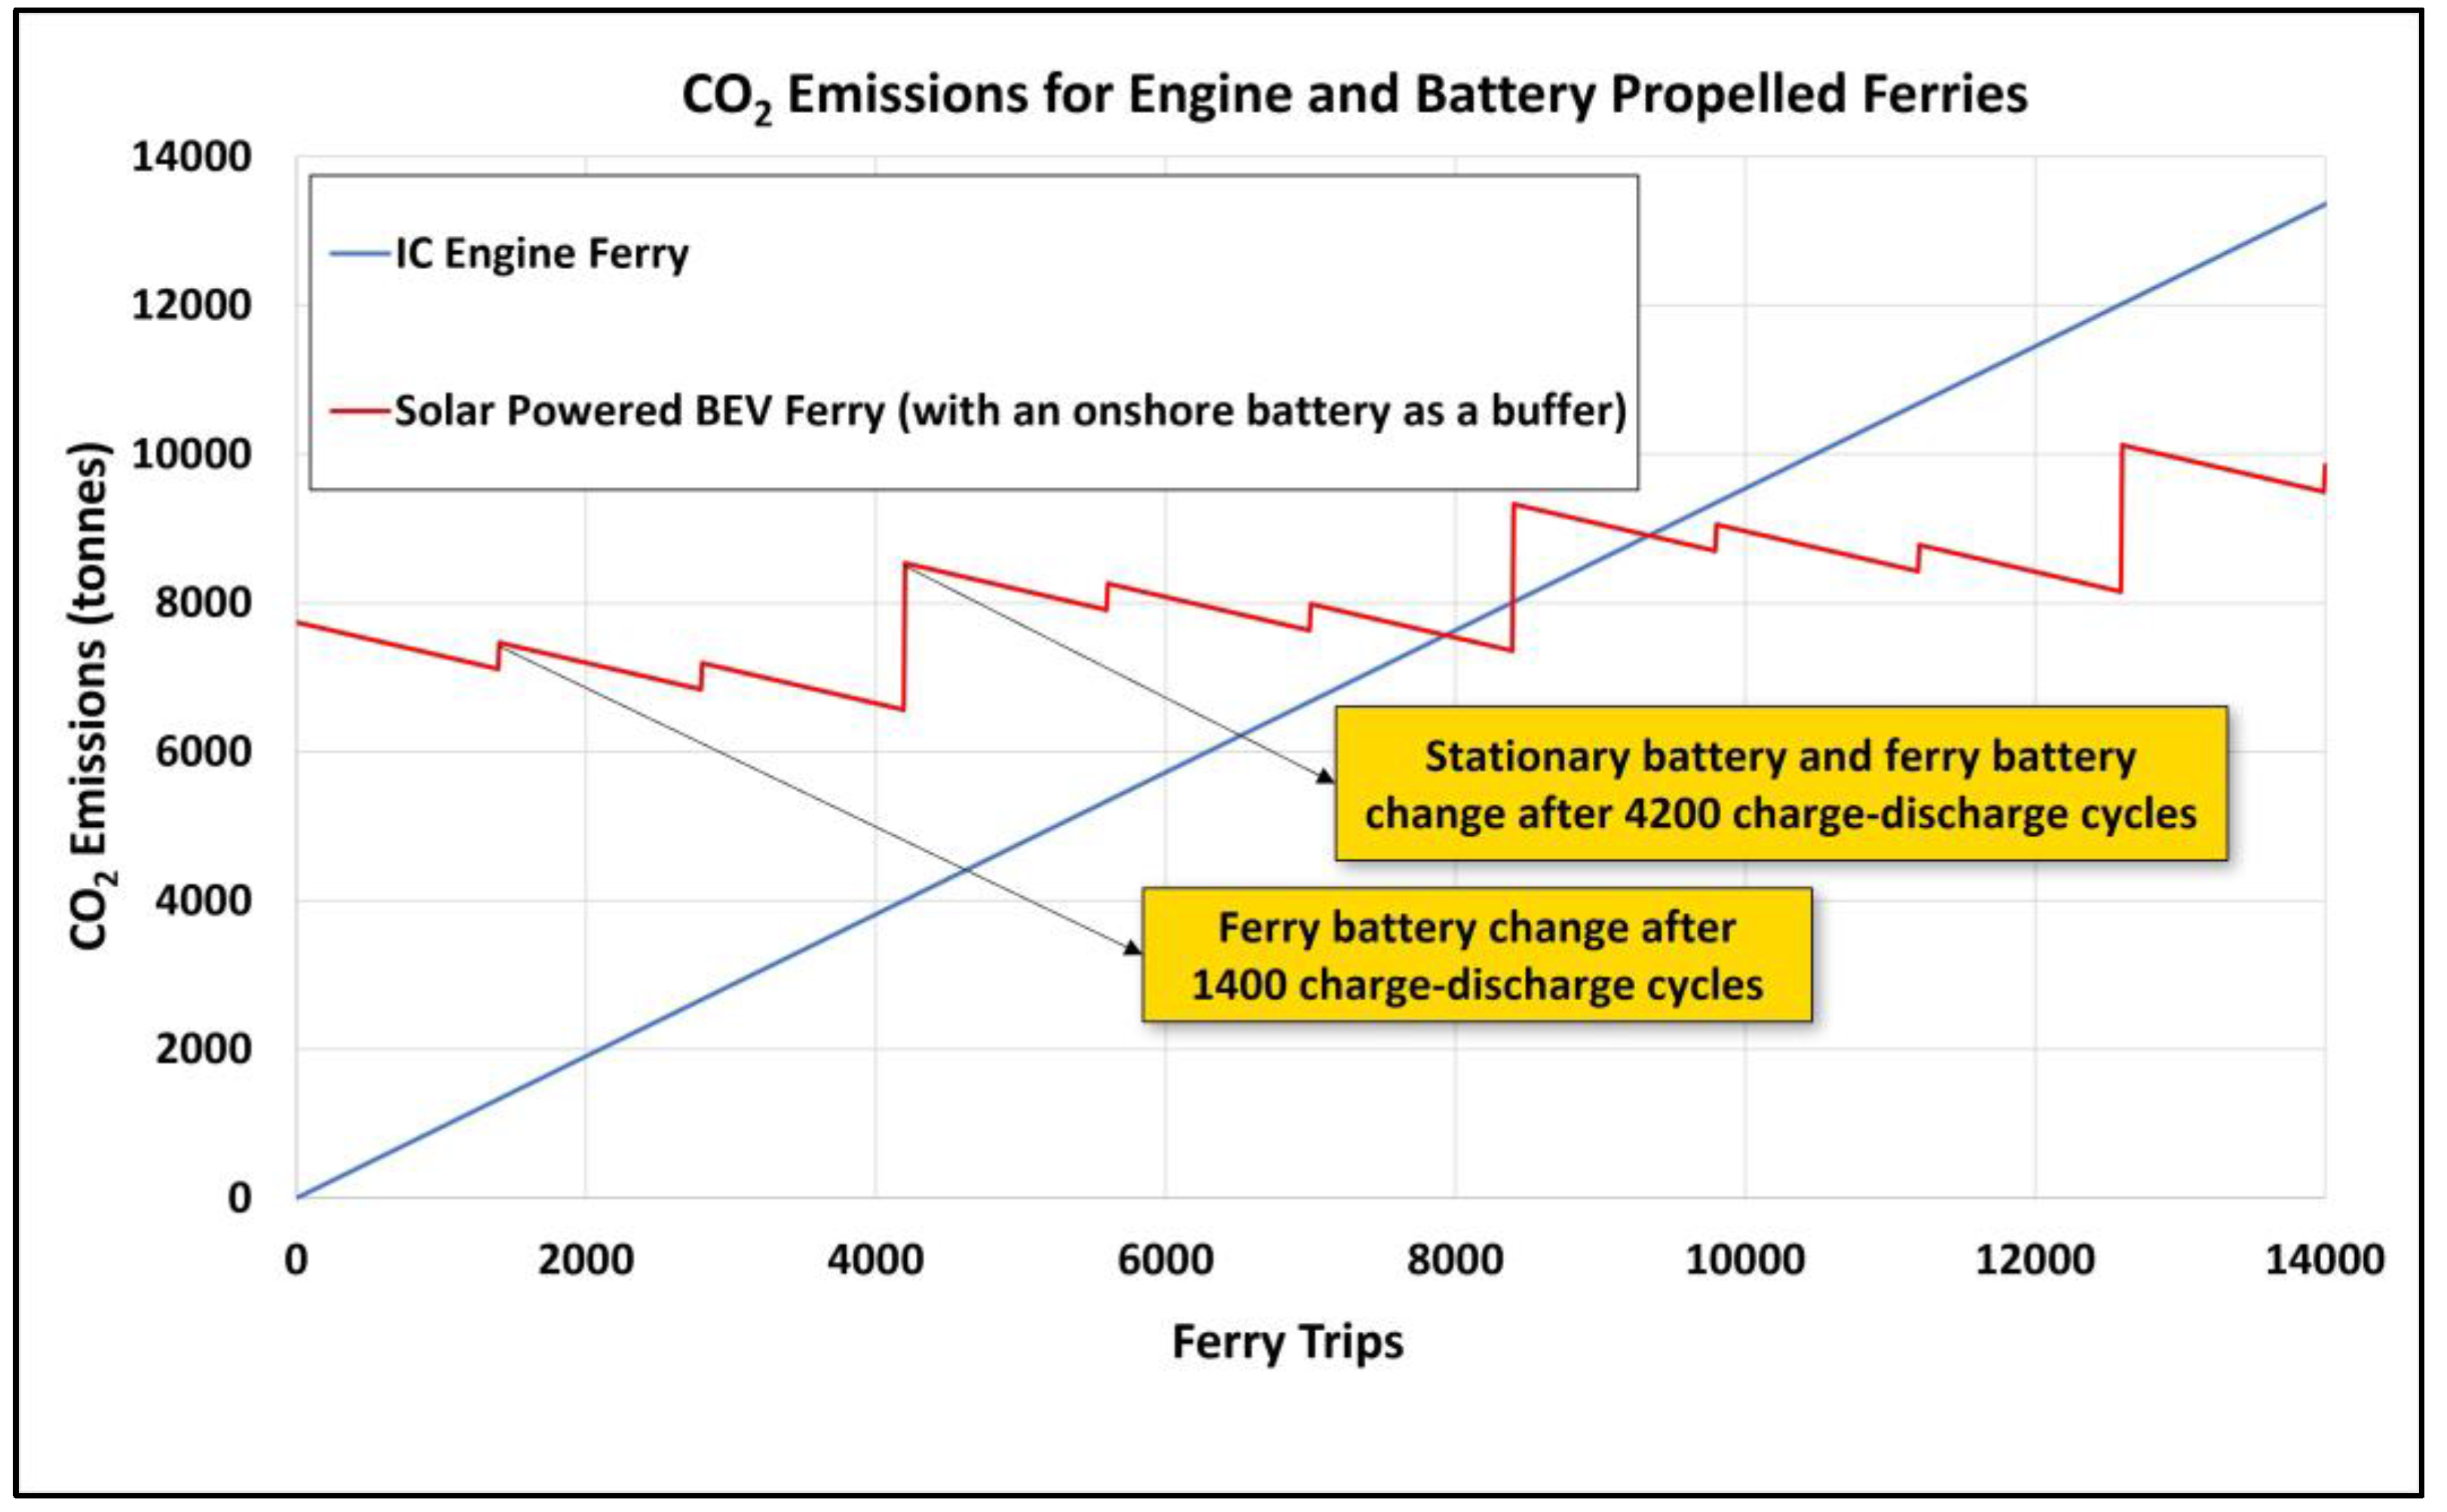
Figure 11.
CO2 from the solar powered BEV and IC Engine configurations (without an onshore battery).
Figure 11.
CO2 from the solar powered BEV and IC Engine configurations (without an onshore battery).
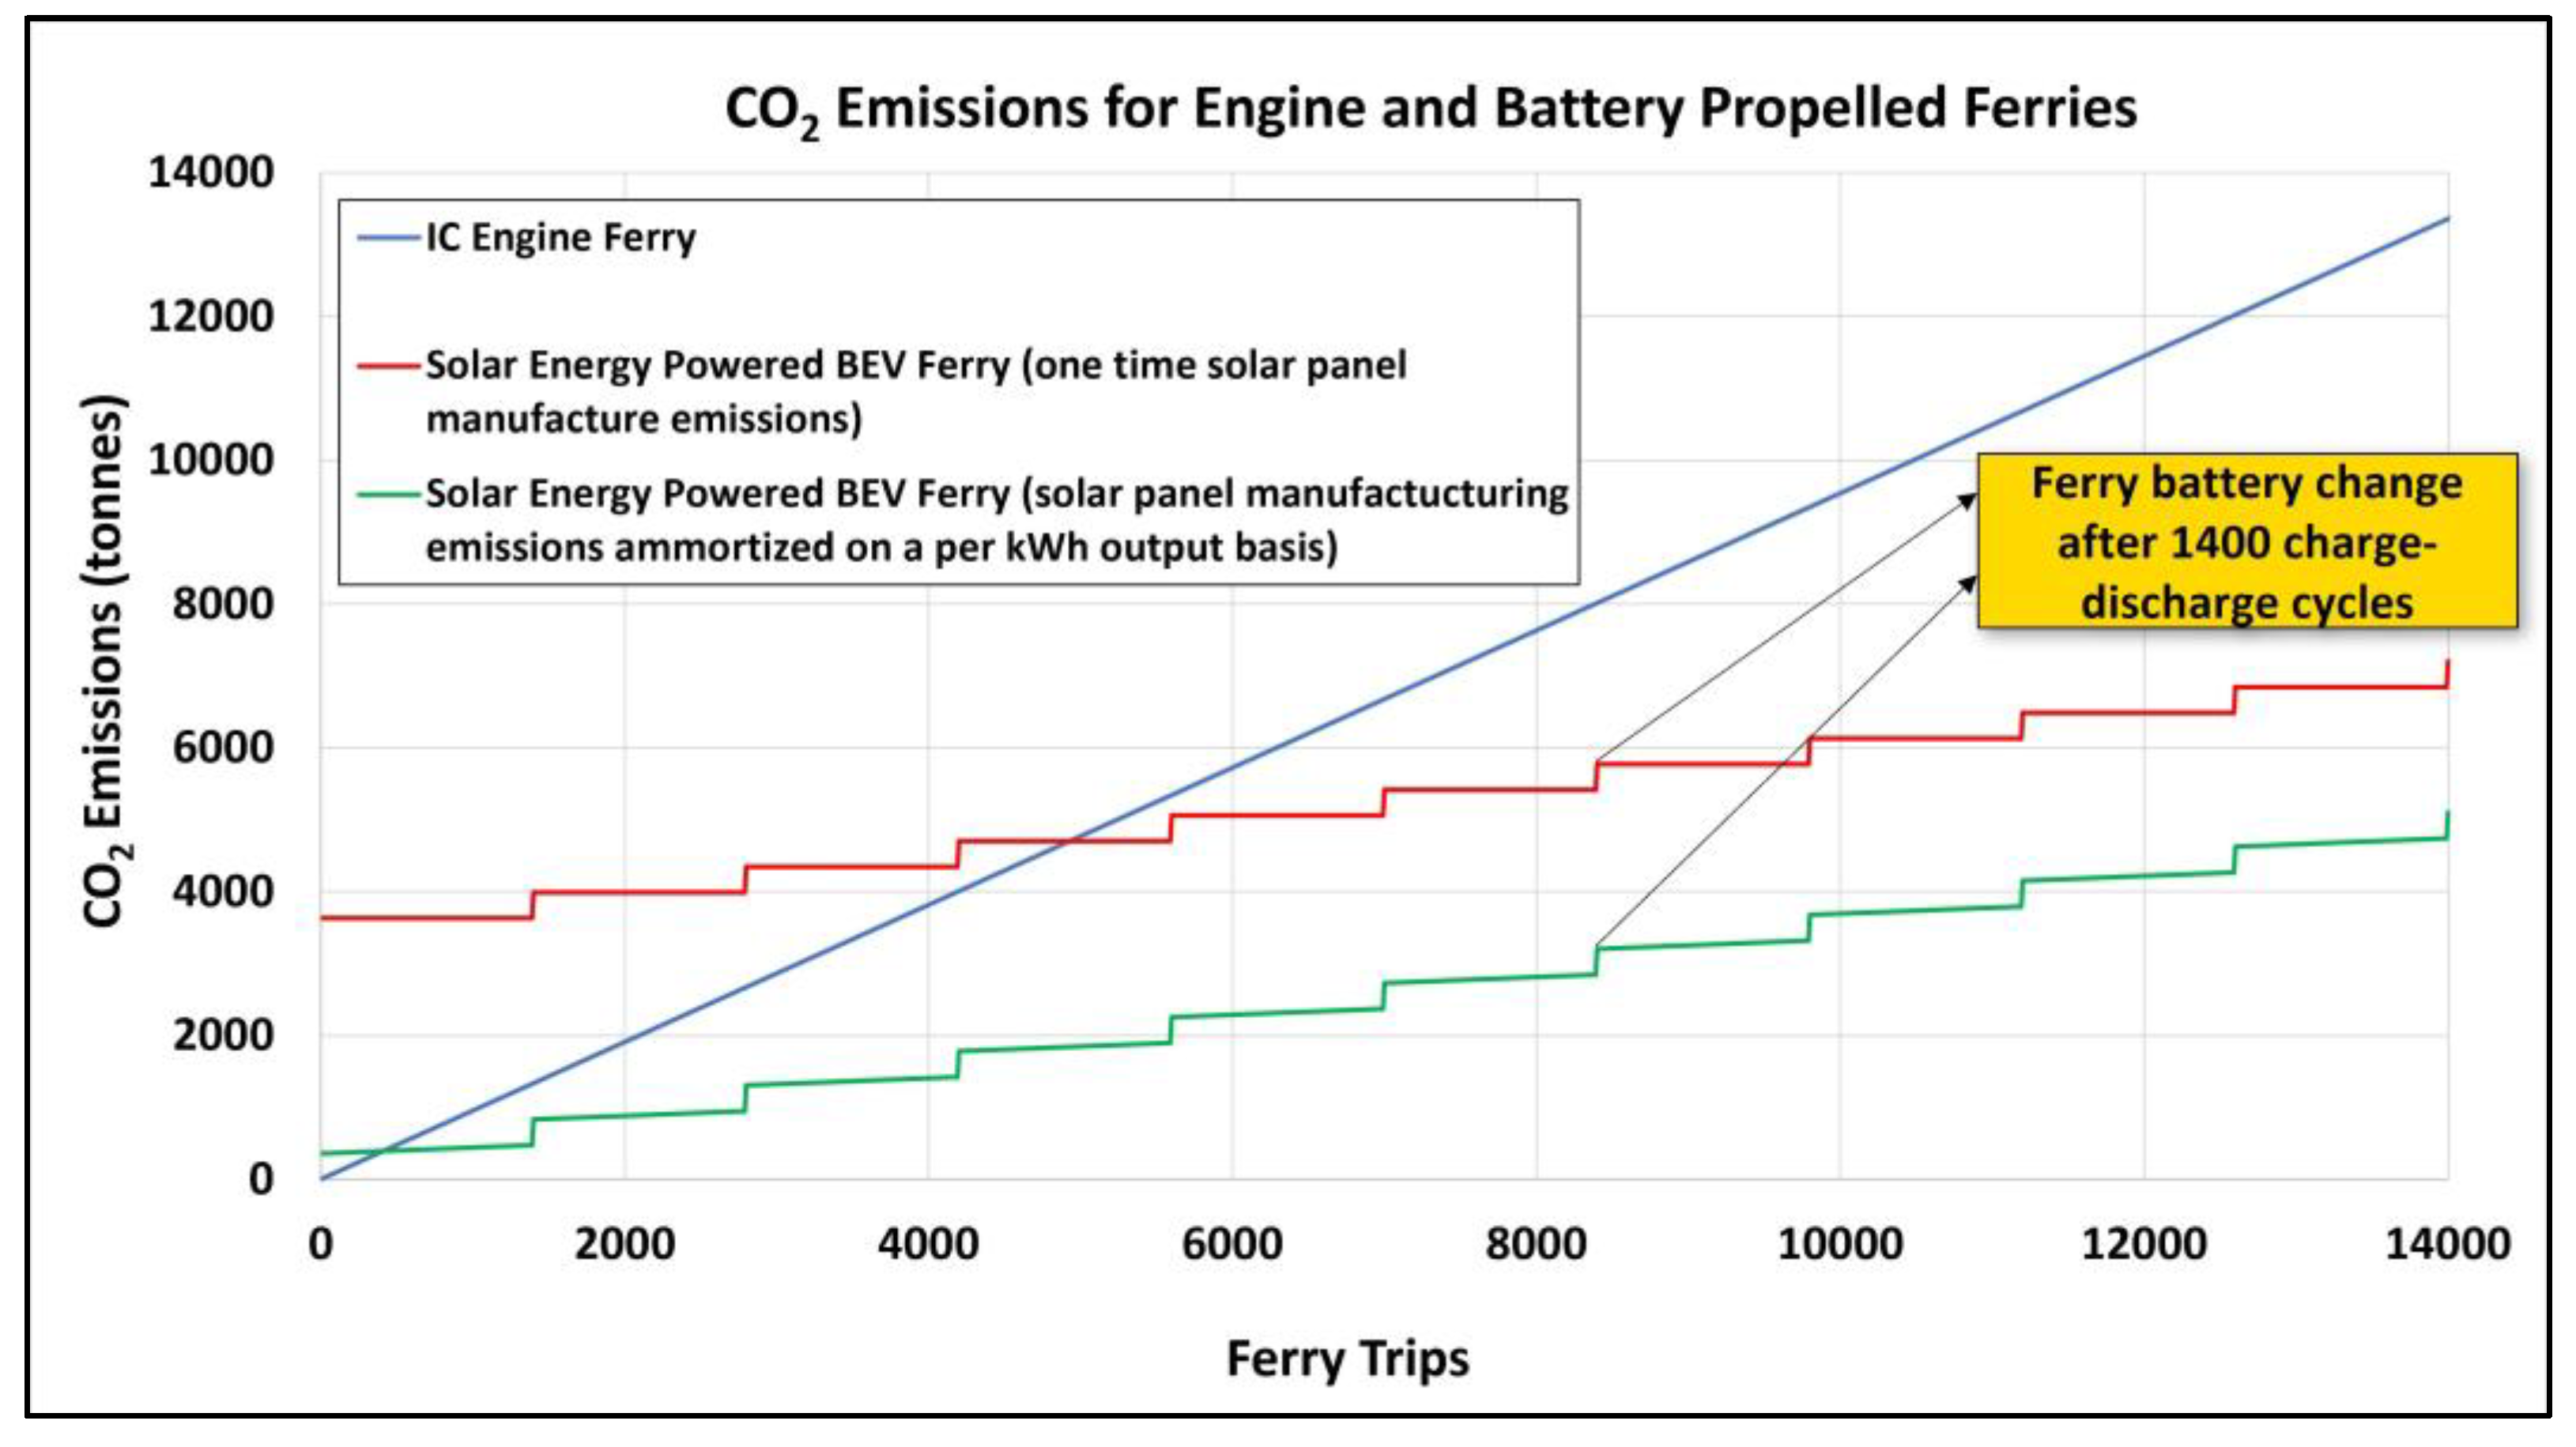
Figure 12.
CO2 emissions for BEV and IC engine configurations of the Mackinac Island ferry (based on the June 2025 Michigan grid mix).
Figure 12.
CO2 emissions for BEV and IC engine configurations of the Mackinac Island ferry (based on the June 2025 Michigan grid mix).
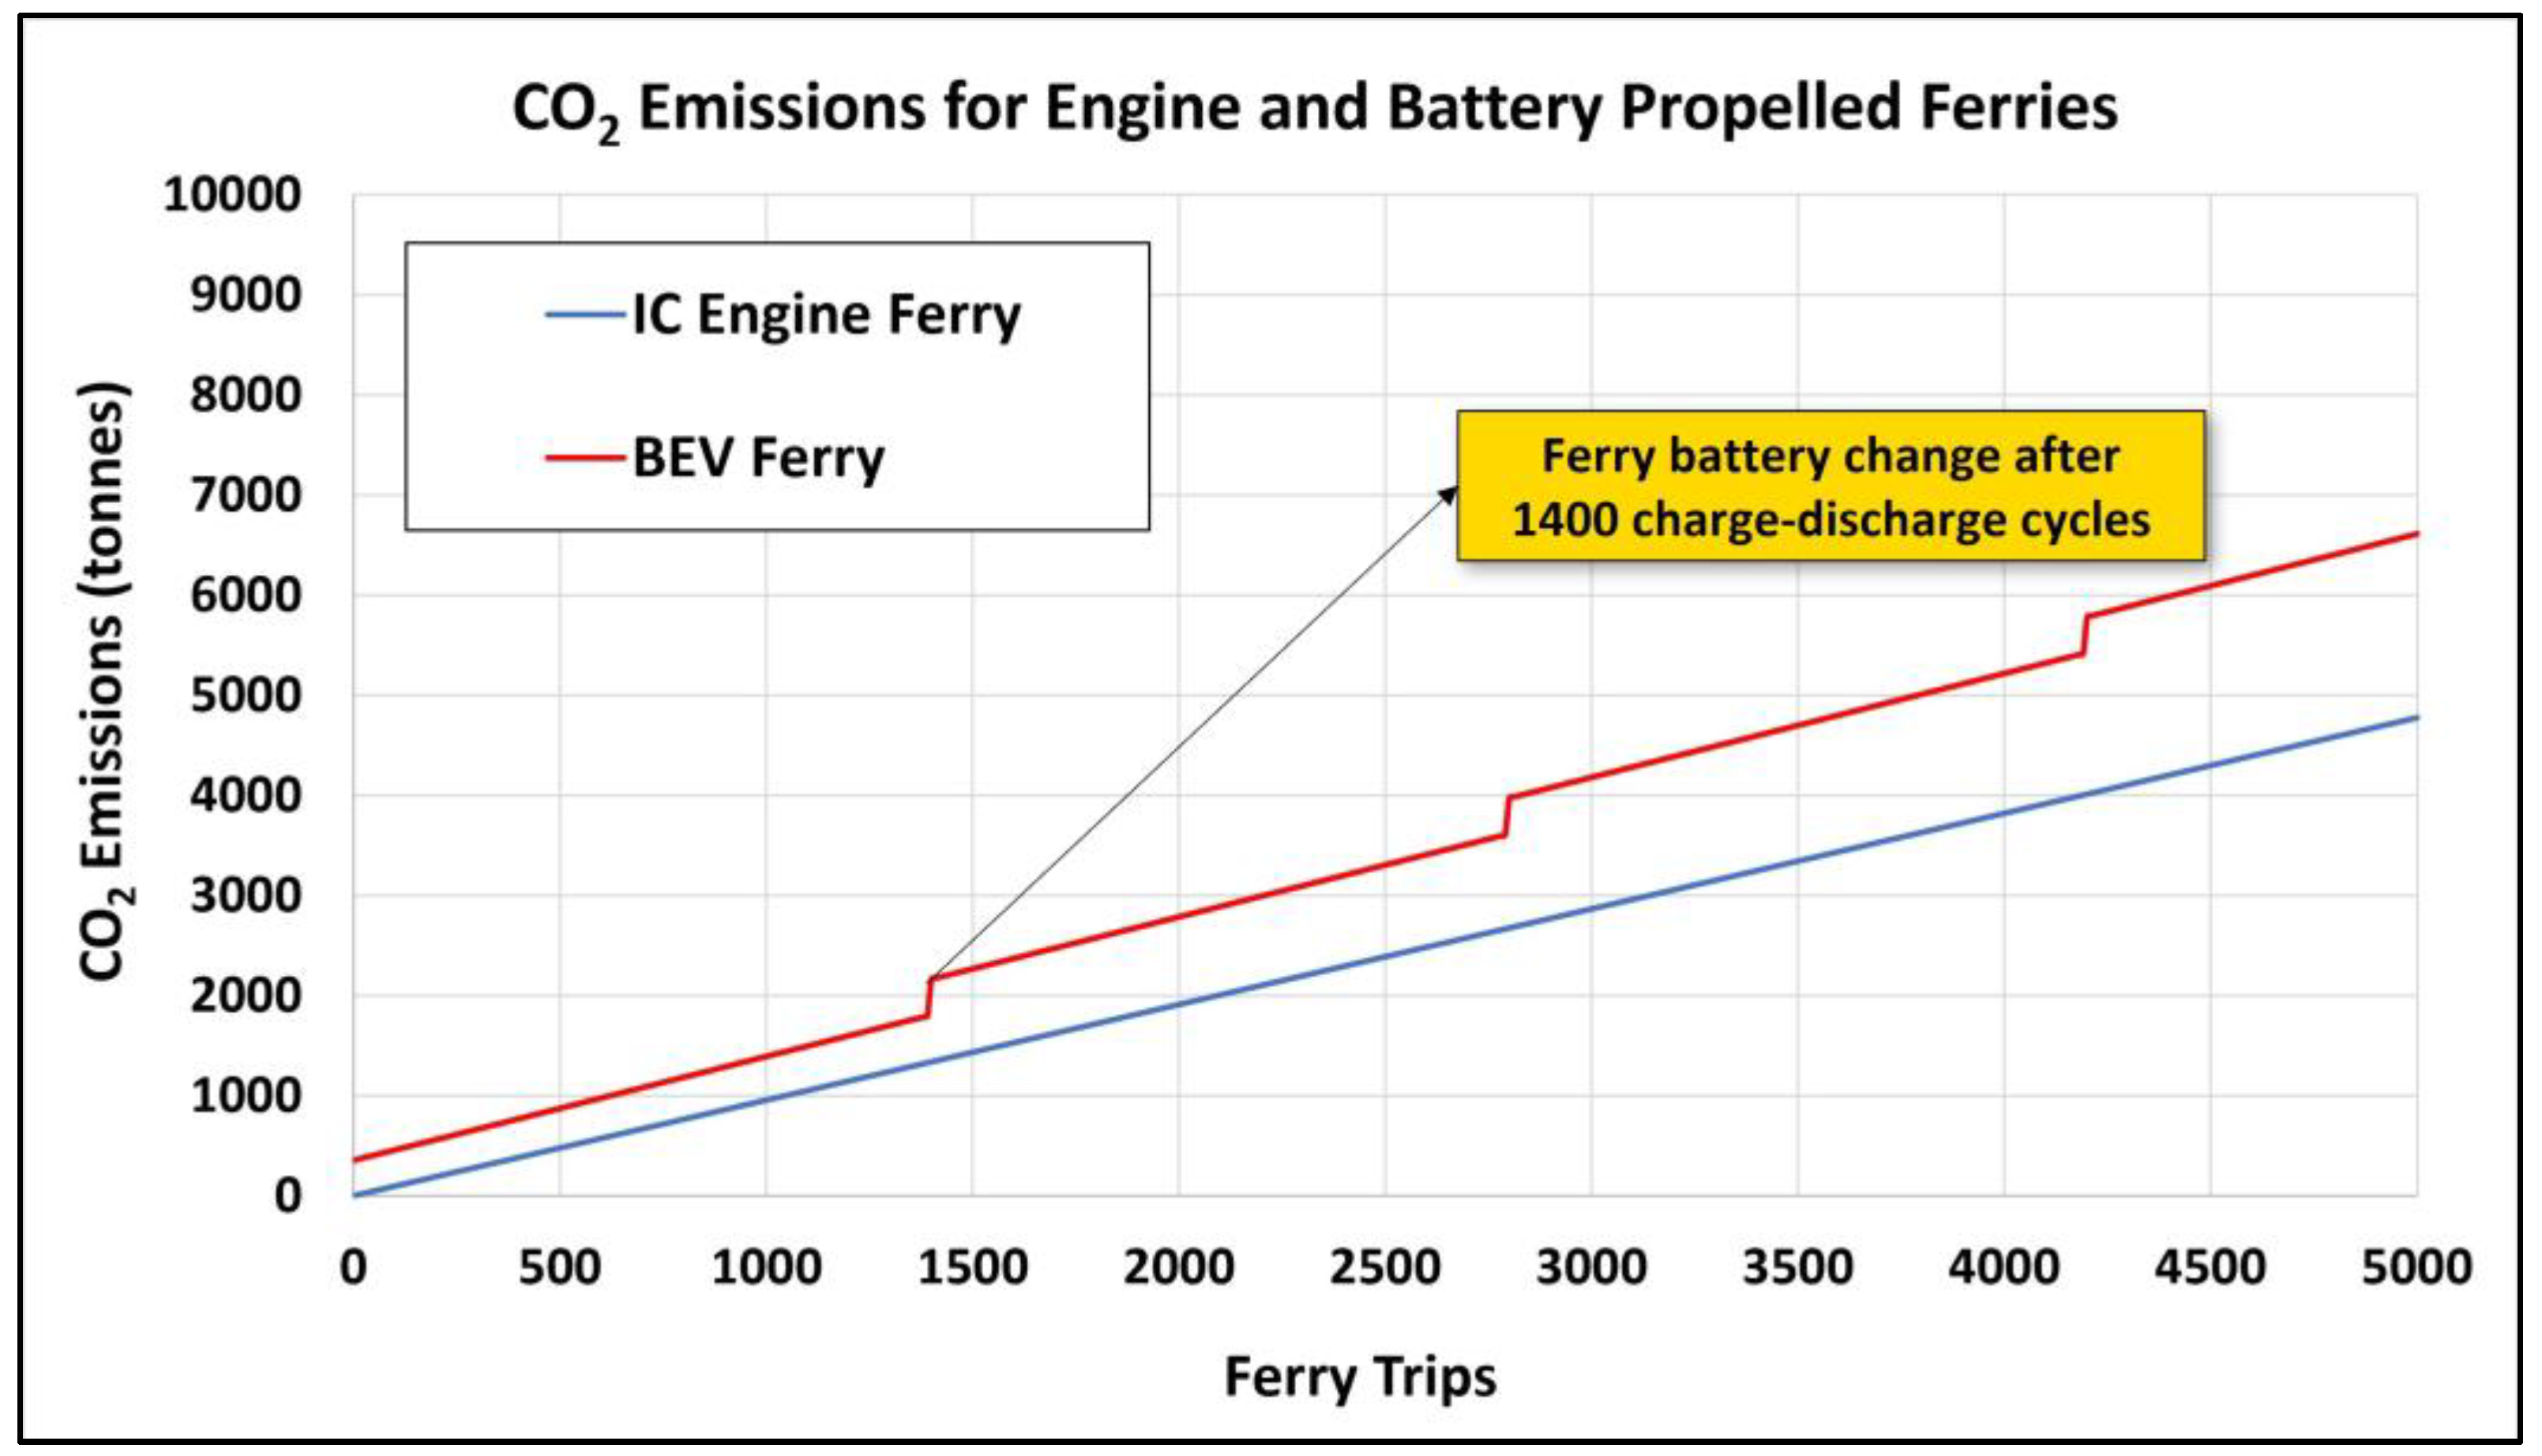
Figure 13.
CO2 emissions from ferry operation for BEV and IC engine configurations of the Mackinac Island ferry.
Figure 13.
CO2 emissions from ferry operation for BEV and IC engine configurations of the Mackinac Island ferry.
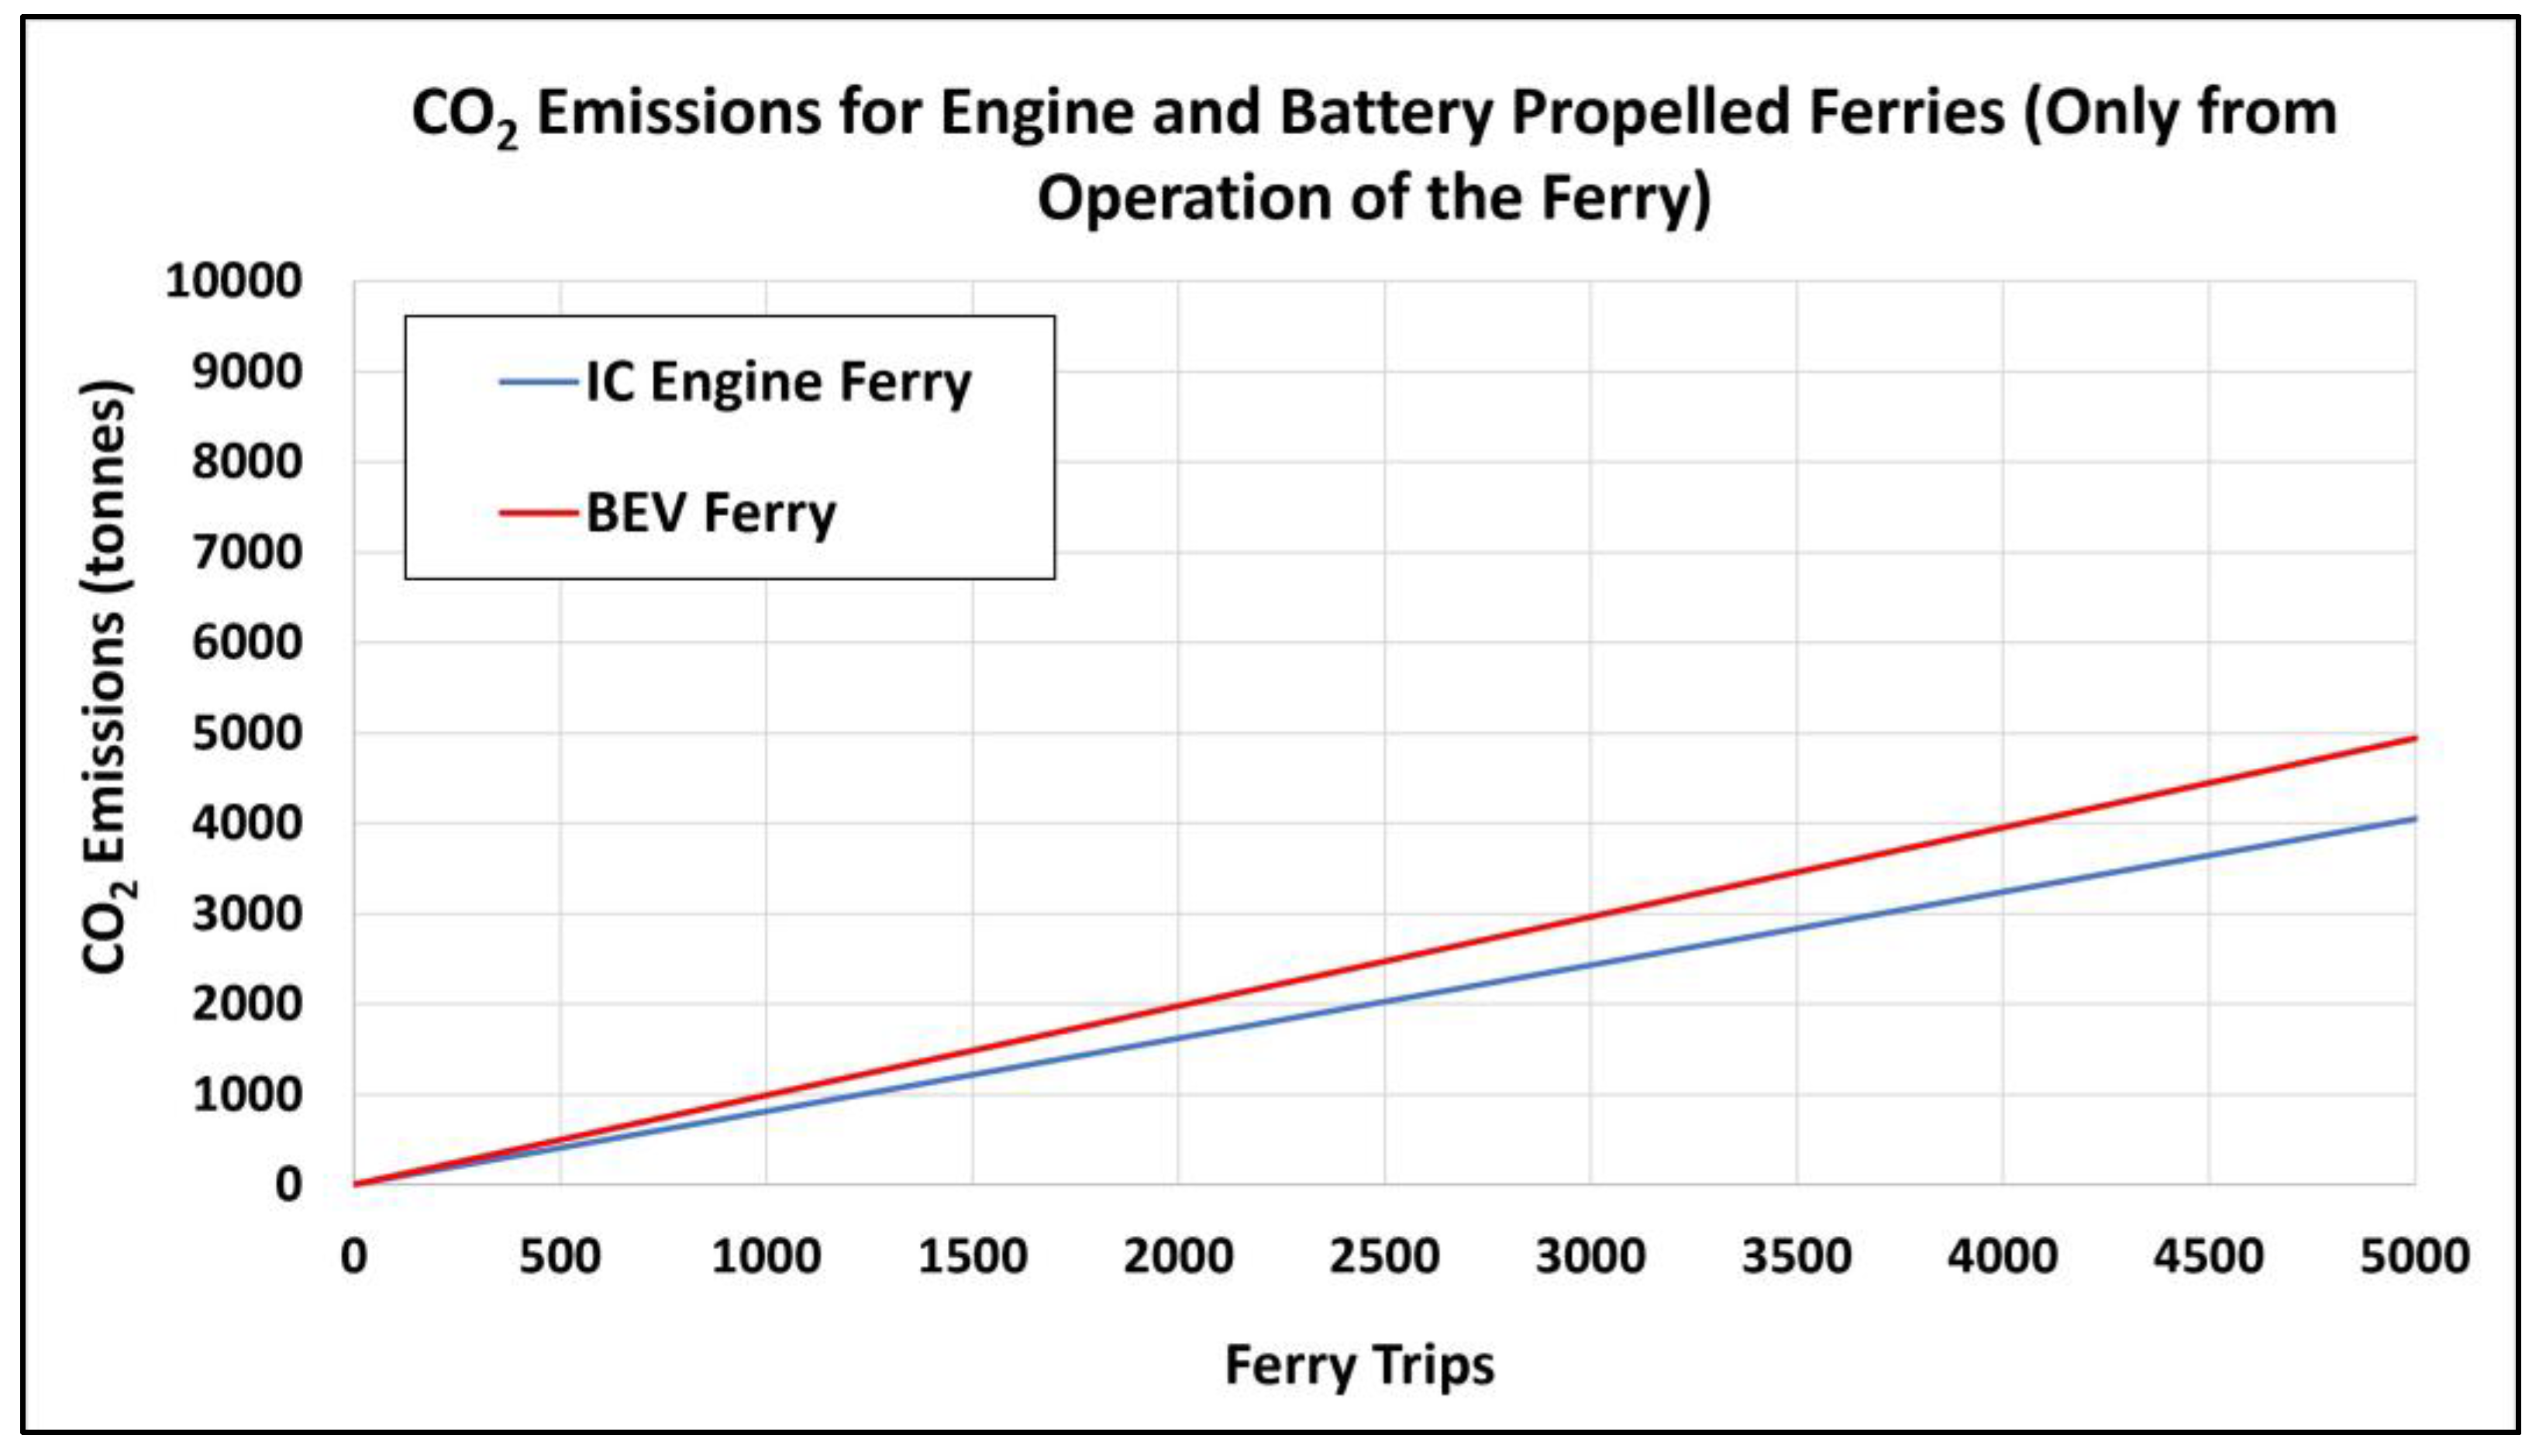
Figure 14.
CO2 emissions per passenger per trip for maximum passenger capacity for the Mackinac Island ferry.
Figure 14.
CO2 emissions per passenger per trip for maximum passenger capacity for the Mackinac Island ferry.
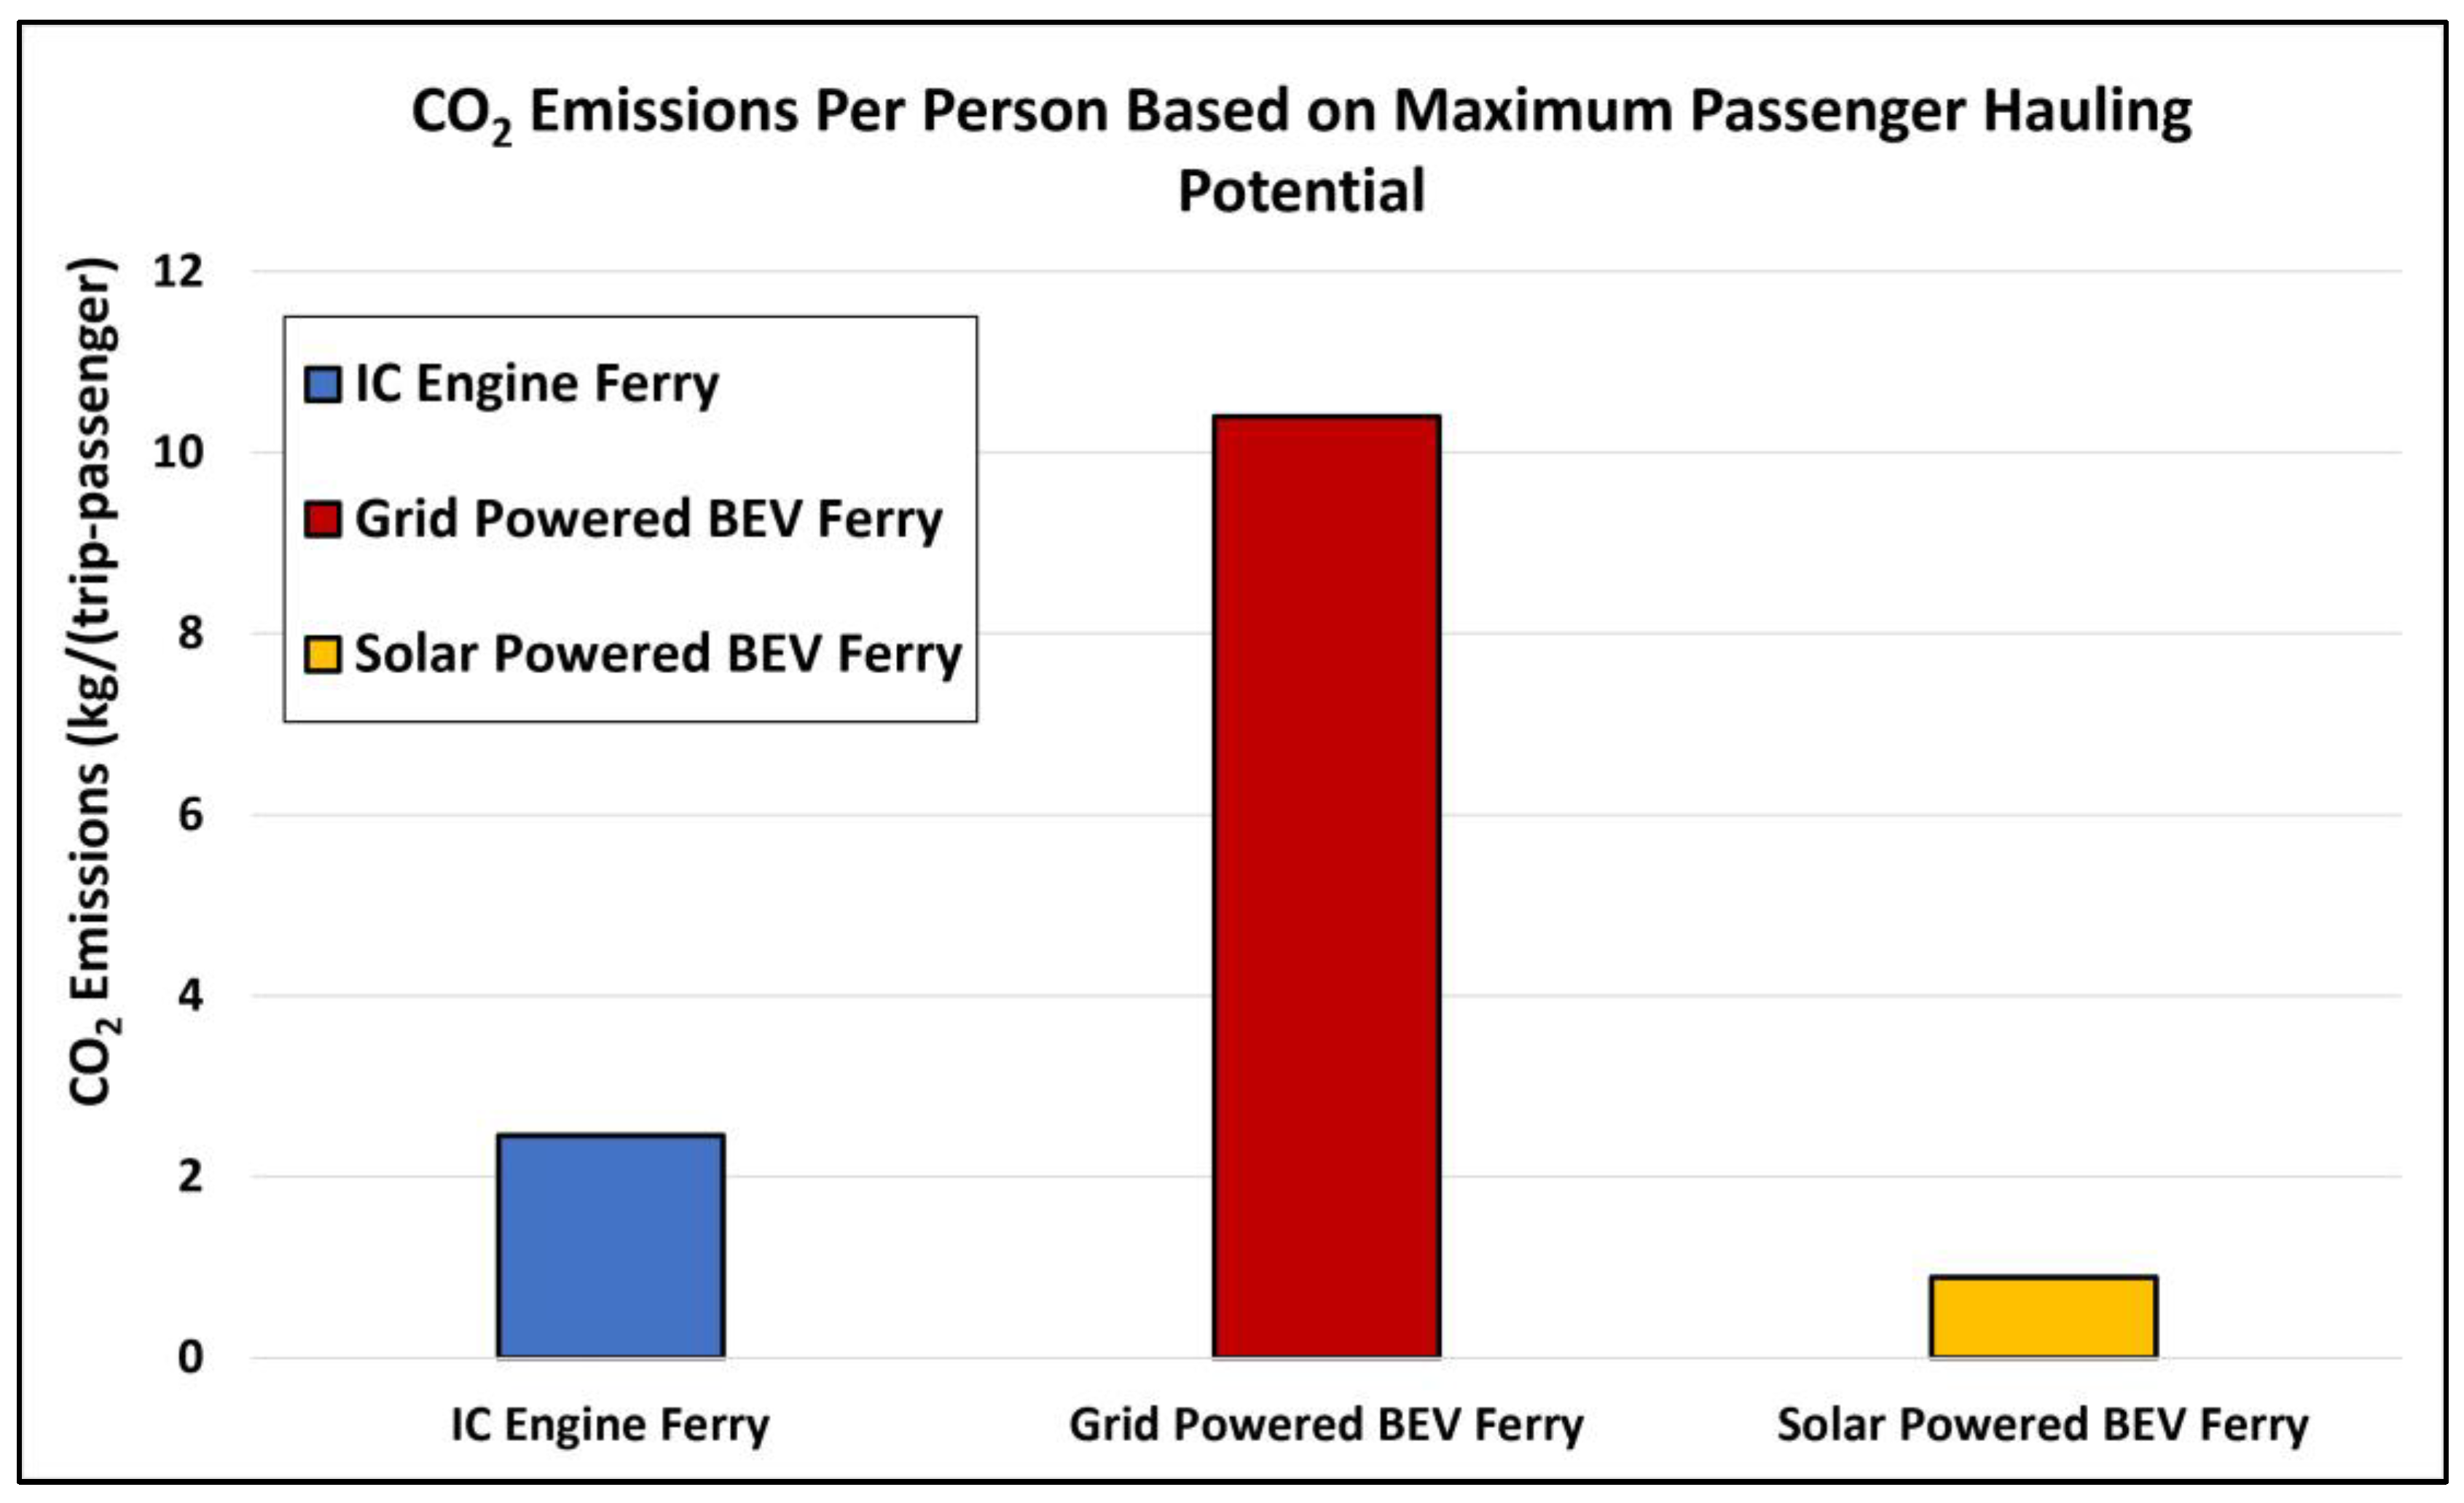

Table 1.
Electricity generation in Michigan by source (June 2022 and June 2025).
| June 2022 | June 2025 | |||||
| Type of Power Plant | Electricity Generation (GWh) | Percentage (%) | Type of Power Plant | Electricity Generation (GWh) | Percentage (%) | |
| Natural Gas | 3523 | 35.6% | Natural Gas | 4434 | 41.8% | |
| Coal | 2984 | 30.1% | Coal | 2629 | 24.8% | |
| Nuclear | 2296 | 23.2% | Nuclear | 2402 | 22.7% | |
| Renewable | 1104 | 11.1% | Renewable | 1136 | 10.7% | |
| Total | 9907 | Total | 10601 | |||
Table 2.
Relevant numbers for ferry drive cycle.
| Parameter | Value | Units |
| Diesel energy requirement per trip | 3204.8 | kWh |
| Energy required for the ferry propulsion for one trip | 1313.9 | kWh |
| CO2 emissions in battery manufacturing [14] | 150.0 | kg/kWh |
| Battery gravimetric capacity | 0.12 | kWh/kg |
| Battery DoD for lasting 1400 trips (1 season) | 80 | % |
| Required battery capacity | 2378.9 | kWh |
| Battery mass | 19824.3 | kg |
Table 3.
Cost of relevant components for electrification.
| Component | Cost ($ million) |
|---|---|
| Solar panels (1x) | 1.50 |
| Ferry battery | 1.67 |
| Stationary battery | 1.57 |
Disclaimer/Publisher’s Note: The statements, opinions and data contained in all publications are solely those of the individual author(s) and contributor(s) and not of MDPI and/or the editor(s). MDPI and/or the editor(s) disclaim responsibility for any injury to people or property resulting from any ideas, methods, instructions or products referred to in the content. |
© 2026 by the authors. Licensee MDPI, Basel, Switzerland. This article is an open access article distributed under the terms and conditions of the Creative Commons Attribution (CC BY) license (http://creativecommons.org/licenses/by/4.0/).
Copyright: This open access article is published under a Creative Commons CC BY 4.0 license, which permit the free download, distribution, and reuse, provided that the author and preprint are cited in any reuse.


