
Preprint
Article

This version is not peer-reviewed.

Plant Extract as the Booster of the Bioactive Properties of Manganese Doped Ceramics

Submitted:

28 July 2026

Posted:

28 July 2026

You are already at the latest version

Abstract

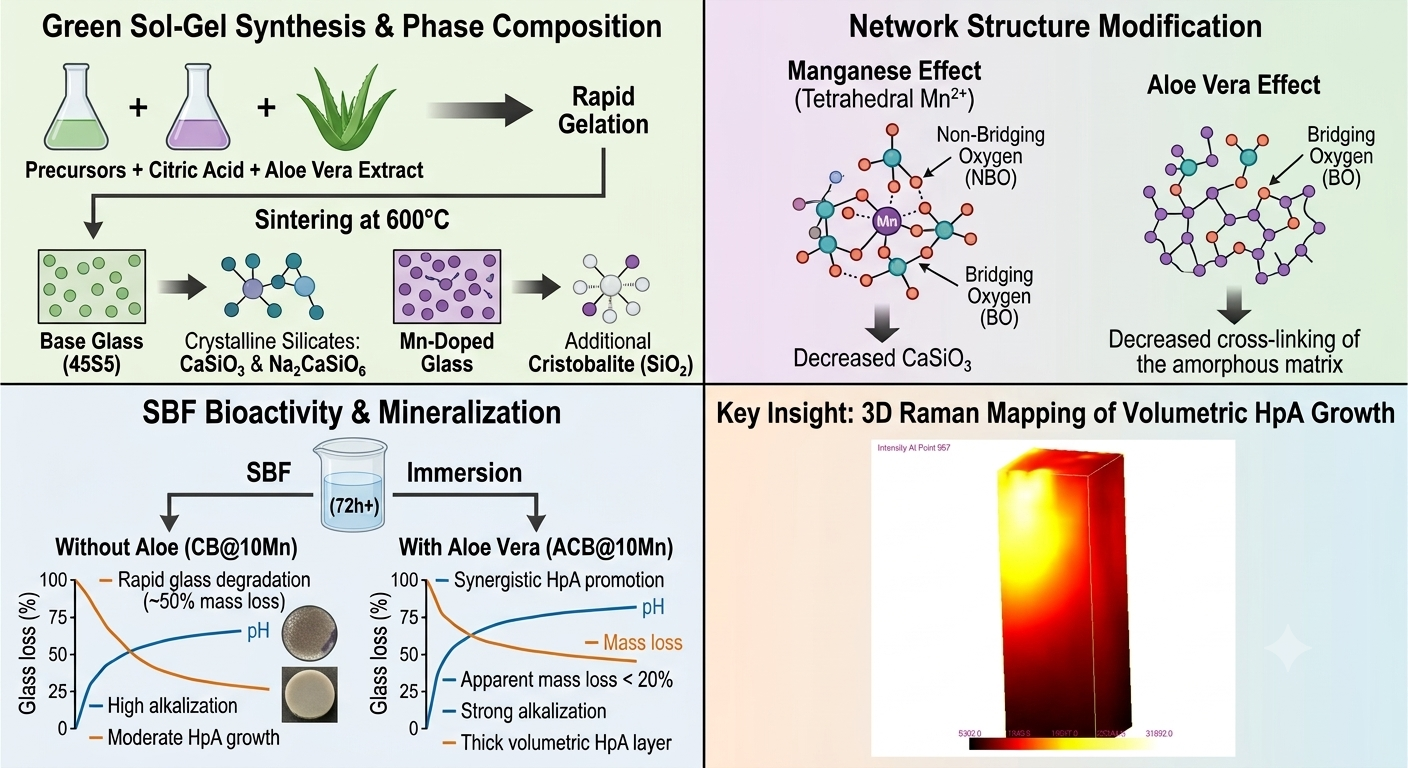
The series of ceramics with a host composition corresponding to popular 45S5 bioglass doped with manganese ions was prepared using the modified sol-gel technique with a citric acid as a catalyst. The same line of ceramics, for the first time in the case of bioactive glasses or ceramics, was obtained in the procedure applying an addition of a plant extract – aloe vera one -as a surfactant to get more porous material. The structure and properties of the glasses were characterized with SEM, XRD, DSC, Raman and IR spectroscopy. All samples, regardless the Mn ions concentration, are bioactive as it was shown by in vitro immersion in artificial plasma – increase of manganese content improves the bioactivity of the material. The addition of aloe vera gel leads to a significant increase in the surface porosity of the samples; its scale is correlated with content of the aloe vera. Studies reveal that Mn exists in tetrahedral positions coordinating oxygen and reducing concentration of NBO. An addition of aloe vera change this situation lowering cross-linking of the ceramic glassy host. Amount of aloe vera in the presence of Mn dopant plays an important role in speeding the growth of phosphate compounds layers. The phosphorous layer growth during immersion in SBF is both quicker and more intense in the case of material prepared with the plant extract. This study reveal, using Raman 3D mapping, that the HpA is not located only at the surface of the samples but also in the volume and that its volume concentration is bigger than the surface one.
Keywords: 
;  ;  

1. Introduction

Nowadays, the green chemistry aspect of popular processes and materials is the trending subject of studies in many fields. Green chemistry focuses on the synthesis of chemical compounds and chemical engineering processes based on natural materials. Despite the widespread development of technology and materials (including its nano field), only recently he “greener” aspect of bioglasses and bioceramics, for applications in bone tissue regeneration, was presented, together with the glasses preparation method that suits improvement of bone production and remodeling as well as of projecting drug delivery system [1,2]. The main aim of the paper is thereby to show the results of sol-gel preparation of glass ceramics with the main composition corresponding to the popular 45S5 glass – 45SiO2-24.5CaO-24.5Na2O-6P2O5 – with the addition of manganese ions as a dopant and way of glass preparation. The glasses were obtained within modified sol-gel method with citric acid as a catalyst [3], without using inorganic acids or base. Other modification is addition of a plant extract to the sol, before gelation, to increase a porosity of the product. Usage of the plant extracts is widely known, especially in a synthesis of nanoparticles of titanium and zinc oxides for a photocatalitic purposes [4,5,6,7] but, up to our knowledge, there have been no studies with bioactive glass particles.
Products of bioglasses or ceramics degradation regulate gene activation resulting in osteogenesis and fabrication of the growth factors, as hydroxyapatite and silicon have a key role in the bone mineralization and gene expression [2,8,9,10]
Manganese is an important metal for human health – it plays an essential role in bone and connective tissue growth as well in regulation of cellular energy and blood [11,12,13,14]. On the other hand, its excessive exposure or intake may lead to a condition known as manganism [15]
Two other chemicals characteristic for the method of glass preparation we used, citric acid and aloe vera extract, may stay in the final product only as remains, probably strongly decomposed. But that is not dangerous as they are known for their biocompatibility and healing properties.
Aloe vera is known for its health properties since it was discovered thousands of years ago, as it contains bioactive compounds with antioxidant/antimicrobial properties [16]. Thereby it is widely used in biomedical and pharmaceutical applications; recently it has received attention for tissue engineering because is biodegradable, biocompatible and has low toxicity [17]. Some studies reveal that aloe vera could exhibit anticancer, antioxidant, antimicrobial, anti-inflammatory and immunomodulatory effects that promote cell migration, proliferation, as well as regeneration and growth of tissues [18,19,20,21,22,23,24,25,26,27,28]. It contains more than 75 biologically active (and natural) compounds working in association with human body compounds to deliver health benefits [21,29] as aloe vera can infiltrate into the tissues and increase the transport and activities of biological factors associated with tissue regeneration such as nutrients, enzymes, oxygen content, blood circulation [30,31]. Additionally, it was found [32] that one of the components of aloe vera – acemannan – increases bone mineral density and bone healing, which was confirmed with in vitro and in vivo studies.
The biocompatible nature of citric acid and its multifunctional chemistry have attracted attention of researchers from different fields of science and engineering. Citric acid is widely used in biomaterials as cross-linker, which is called citrate-based biomaterials (CBB), that make them suitable for various biomedical applications as they have tunable mechanical properties, as well exhibit biofunctionality and biocompatibility, since citric acid is a nontoxic and inexpensive material [33]. CBBs can be also conjugated with other bioactive compounds to produce multipurpose materials [34]. What is important, CBBs regulate and stabilize the biomineralization of bone apatite and enhance the production of alkaline phosphatase in bone tissue engineering[35]. Additionally, citric acid has been used with hydroxyapatite nanoparticles for fabrication of multifunctional nontoxic nanocarriers for drug delivery applications [36].
All these components should allow creation of bone-friendly environment and accelerate bone regeneration.

2. Materials and Methods

2.1. Materials

Manganese (II) nitrate hydrate and tetraethyl ortosilicate (TEOS) were purchased from Aldrich. Sodium nitrate and tris(hydroxynethyl)aminomethane (TRIS) were purchased from Sigma Aldrich. Triethyl phosphate (TEP) was purchased from Aldrich Chemistry. Citric acid (anhydrous), manganese (II) chloride tetrahydrate, potassium chloride, sodium bicarbonate, dipotassium phosphate, magnesium chloride and calcium chloride were purchased from Chempur (Poland). Calcium nitrate tetrahydrate, sodium chloride and sodium sulfate were purchased from Eurochem BGD (Poland). Hydrochloric acid was purchased from STANLAB (Poland). 99% Aloe vera gel was purchased from HolikaHolika (South Korea).

2.1.1. Synthesis of Ceramics

26 ml of citric acid was mixed with 11.6 ml of TEOS and 1 ml of TEP in beaker put on magnetic stirrer in room temperature, then 4.66 g of sodium nitrate was added slowly to obtain full dissolution. 7.15 g of calcium nitrate tetrahydrate was slowly added into the solution and was stirred for one hour to obtain a sol. After that (i) solution was put to polycondensation to obtain basis glass 45S5, or before step (i), relevant amount of manganese (II) chloride tetrahydrate was added to obtain glasses with Mn ions dopant. After ~2 days obtained gel was dried in 60°C for 12 hours and after that was kept in a muffled furnace in 200°C for 5 hours and then in 600°C for 2 hours. The obtained ceramics were put in agate mortar to form a fine powder, as shown in Figure 1.
The content of Mn dopant was 0.2-1.0 weight %; base ceramics composition was altering in equal contributions of CaO and Na2O, as shown in Table 2.1.

2.1.2. Ceramics with Aloe Vera Extract

The ceramic with 0.2% of Mn ions, CB@02Mn, was chosen to test an aloe vera influence on its properties. The aloe vera gel was added in the final state of synthesis of the glasses. The volume of 5-30% of the volume of the other components(with the step of 5%, which is equal to 1.55 mL) of aloe vera extract was tested – the SEM (Figure 7) and XRD (Figure 3.17) measurements (as well as results of immersion in SBF solution – Figure 13A) showed that the most promising properties are exhibited by the samples with 25% of aloe vera gel. Thereby all the samples indicated in Table 1 were prepared with 25% of aloe vera extract. The samples are in the following labeled as ACB@xxMn.

2.1.3. Simulated Body Fluid Preparation

Simulated Body Fluid (SBF) was prepared, according the receipt by Kokubo [37] and kept at temperature of 36.6°C during the entire course of immersion. To obtain pH of 7.4 as in blood plasma (the pH value is also important for producing nano-hydroxyapatite particles rather than brushite plate-like particles characteristic for pH=5 [38]) relevant amount of HCl was added.

2.2. Methods

Scanning Electron Microscopy pictures were recorded with TESCAN VEGA 3 microscope working in secondary electrons mode. EDS analysis was done with Oxford Instruments camera integrated to SEM microscope.
DSC scans were recorded on Netzsch STA 409C analyzer; heating rate was 10K/min; alumina crucibles were used.
XRD measurements were performed on the Rigaku diffractometer with molybdenyum lamp.
IR spectra were obtained using Perkin Elmer Spectrum Two FT-IR with UATR in the range 7800 – 400 cm-1 with resolution 4 cm-1.
Raman spectra were recorded with Renishaw inViaQontor spectrometer; excitation with 532 nm laser, resolution 1 cm-1.
The changes of solution pH were controlled by SevenCompact Mettler Tolledo pH-meter.
Powders of ceramics formed as tablets having 1 cm diameter were put into test tubes as well as the relevant amount of SBF volume (number of SBF milliliters was equal to 10 times ceramics tablet surface in square millimeters) and were left in water bath (in 36.6°C) for 1, 3, 7 and 14 days. After the proper period, samples were removed from SBF and carefully dried.

3. Results and Discussion

3.1. Ceramics Before Immersion

3.1.1. Morphology of the Samples

On the Figure 2A and Figure 2B there are the SEM picture of the CB@00Mn sample surface. It is rather compact, with island structures visible at higher magnifications. These islands have a solid, smooth surface, with linear dimensions not exceeding a dozen µm. The few cracks on the surface have dimensions up to 10 µm.
The addition of manganese significantly changes the surface structure of the sample. With an admixture of just 0.2 wt%, the surface loses its compact nature. It appears to be "covered" with blocks of material with linear dimensions of around 200 µm. Between them, many much smaller grains are visible, with linear dimensions in the range of 10-15 µm.
Observation of the surface at 10kx magnification (Figure 3B) reveals that the surface of these small grains is also covered with "clumps" or nodules. Their linear size can be estimated at around 500 nm.
An increase in the admixture content to 0.4 wt% (Figure 4) slightly alters the surface image: the number of large blocks decreases, while the number of grains with dimensions of several µm increases. At higher magnifications, channels extending deep into the material become visible.
A series of images in Figure 5 shows the surface of a ceramic sample containing 0.7 wt% Mn. It is evident that the grains filling the space between the larger blocks become smaller, and their shape also changes. They can be perceived as spherical, which is particularly clear at 2kx magnification. Many deep channels into the volume of the sample are also visible on the surface.
The surface of a material sample containing 1 wt% Mn is visible in the images in Figure 6. The surface shows a further increase in porosity, and the number and size of the channels into the sample also grow; the linear size of the grains is smaller, around 500 nm.
The impact of aloe (AV) extract addition was analysed in two stages. In the first step, CB@02Mn ceramics were created by adding aloe gel in amounts ranging from 5% to 30% of the volume of the remaining ingredients. This step aimed to determine the optimal amount of extract to add to achieve an acceptable surface area development. Images of the surfaces of the obtained samples are visible in Figure 7A–F.
Figure 7. SEM pictures of CB@02Mn prepared with addition of an aloe vera extract (AV): 5%AV –A, 10%AV-B, 15%AV-C, 20%AV-D,25%AV-E,30%AV-F. Magnification 10k.
Preprints 225341 g007
As shown in Figure 7, the addition of AV significantly changes the sample's structure. Even a 5% AV addition leads to an increase in surface area. The reference point here is the image in figure 3.2B. An increase in the amount of AV results in a greater number of pores, cavities, and channels leading into the sample. A large, developed surface should accelerate the formation of an apatite layer and provide favourable conditions for osteoblast proliferation. Based on the evaluation of surface porosity and the course of the sample's degradation in artificial plasma, further work was conducted with a material containing 25% AV—Figure 7E. Its surface is already very porous, yet the sample retains a compact character. A further increase in the amount of AV would risk creating a very brittle material.
Figure 8. SEM pictures of the samples with a different dopant content and 25%AV addition: ACB@02Mn-A;ACB@04Mn –B;ACB@07Mn –C; ACB@10Mn –D.
Preprints 225341 g008

3.1.2. Thermal and Structural Studies

Differential Scanning Calorimetry (DSC) records are presented in Figure 9. The onsets of glass transition temperatures for host glass of the studied ceramics are in the range 524.8-539.5°C; generally, the presence of Mn ions causes lowering of Tg in relation to the base glass having value of 534.0°C, which is in accordance with data (524°C) shown by Baranowska et al. [39]. On the other hand, Lin et al.[40] report 540°C as glass Tg, which indicates that temperature of calcination (600°C) of the studied glasses was sufficiently high and caused partial crystallization of the samples; to avoid this effect lower temperature should be maintained – below 500°C. These conclusions are supported with XRD spectra shown in Figure 10.
Identification of XRD peaks is not fully certain. In the literature of ICDD cards there is some information that peak at 2θ=29° is associated with wollastonite – form of calcium silicate CaSiO3 (ICDD no. 84-0654) or sodium-calcium silicate Na2CaSiO6 (ICDD no. 77-2189). In the case of ceramics with Mn dopant, there is additional peak at 2θ=33° which is classified as characteristic for SiO2 in Crystoballite form (ICDD no. 82-0512) [41]. Thereby in all studied samples, the crystals of silicon compounds are present and as a result they may be considered as ceramics.

3.1.3. IR and Raman Analysis

IR spectra of the studied ceramics are given in Figure 10A and Figure 10B. As it can be seen, there are broad bands around 980-1100 cm-1 and 900-950 cm-1 associated with asymmetrical stretching vibrations of Si-O-Si BO and NBO atoms in silica, respectively; bending vibrations of Si-O-Si are found for 820-890 cm-1. There are also Si-O vibrations in SiO4 tetrahedral units seen in the range 420-550 cm-1, indicating presence of amorphous silicon.
Figure 10. A FT-IR spectrum of glass ceramics with different Mn content. Figure 10B FT-IR spectrum of Mn doped glass ceramics prepared with an addition 25% of aloe vera gel.
Preprints 225341 g011
In the range 570-620 cm-1 there are weak bands of asymmetric bending P-O vibrations in PO43- , in crystalline phosphate. In the range 1320-1480 cm-1 asymmetric stretching vibrations of C-O in carbonate groups as the residues of precursors can be found. Small band around 1620 cm-1 is associated with bending H-O-H vibrations of water molecules [3,41,42,43,44,45,46,47]
Addition of Mn ions causes intensification of band intensities with one exception – decreasing intensity of C-O vibrations in the range 1350-1440 cm-1. Similar effect is achieved using aloe vera extract, however Mn ion and aloe vera extract concentrations do not influence the band intensities of C-O bands. Mn-O lattice vibrations should be found as bands in the region 400-800 cm-1, layered manganese oxides should have medium strong bands around 427-, 482- and 514 cm-1 [48]. Vibrations of Mn3+-O bond should be present as bands around 1150- and 1085 cm-1 [49]. Their possible presence is not obvious as it is covered by Si-O vibrations. Vibrations of Mn with other valences have not been found in literature, hence it is difficult to determine valence of Mn ions on the base of the IR spectra of the studied ceramics. What is interesting, the intensity of all the bands but that connected with C-O vibrations, is much higher in the case of ceramics prepared with aloe vera gel – there are different scales in the graphs 3.9A and 3.9B. The P-O vibrations bands which for some Mn contents have a form of shoulders are staying separate peaks after the extract was used.
In Figure 11 Raman spectra for selected samples before immersion in SBF are presented, as an example. For the CB@00Mn ceramic there are five well-formed peaks in the spectrum. Those below 500 cm-1 are connected with symmetrical bending of four and five elements containing rings of silicon network and with asymmetrical bending vibrations of P-O bonds in PO4-3 groups. The one at 721 cm-1 as well as the band at 1385 cm-1 are interpreted as connected with Si-O-Si vibrations in SiO2 units, asymmetric bending and asymmetric stretching respectively [42]. The band recorded at 1068 cm-1 represents an energy of symmetrical stretching vibrations of a P-O bond in PO4-3 units [50,51].
Addition of Mn ions causes formation of small band at 957 cm-1 associated with symmetrical stretching PO43- vibrations and stretching vibrations in Si-O-NBO [42]. This band however almost disappear when the Mn ions content is growing. The same effect has an addition of the aloe vera gel. That band is staying much weaker. There is also another, new band around 853 cm-1, which is interpreted in literature as bending vibrations of the ring containing two SiO2 units [52]; in the same range of frequencies stretching vibrations of the chains containing two nonbridging oxygen atoms, Si-O-2NBO are expected [42,52]. The presence of dopant ions is connected with the decrease of the 1385 cm-1 band and the vanishing of the 721 cm-1 band. As was mentioned above that bands are manifestations of bending and stretching in the Si-O-Si groups. The change in the Raman spectrum shape when Mn ions are added supports prediction that dopant leads to braking Si-O-Si bonds and generation of a chains with NBO. For the ceramics with high content of Mn ions (1.0%) there are present bending vibrations of rings containing three SiO2 units (for 1% of Mn ions as 691 cm-1)[53], Si-O-Si torsional vibrations (497 cm-1), bending vibrations in PO43- (437 cm-1) and bending vibrations of rings containing five or more silicon units below 400 cm-1 [42,53,54].
Usage of aloe vera gel causes similar effect as high concentrations of Mn ions with the similarity to a few cm-1 in positions of bands. What change, is the presence of bands related to asymmetric stretching in Si-O-Si (1386 cm-1 ) for ACB@04Mn and symmetric stretching in phosphorous groups (1065 cm-1) in both presented spectra. The band characteristic for asymmetric stretching of Si-BO in Si-O-Si disappears in ABC@10Mn. Instead we find a new band located at 1225 cm-1. It means that increasing amount of dopant content leads to a breaking of silicon-oxygen bonds within the network. The appearance of the new band may be seen as manifestation of Mn(II) ions connection to nonbridging oxygens. Vibrations of Mn oxides have low Raman activity and exhibit very weak signals of Raman –; thereby three main regions of MnOx can be found: 200-450 cm-1 (skeletal vibrations), 450-550 cm-1 (Mn-O-Mn chains in octahedral lattice), 550-750 cm-1 (Mn-O bonds in MnO6 octahedra). Only for high content of Mn ions some new bands in these regions appear, they differ in relevant proportions of Mn-O bonds, which indicates that aloe vera extract presence changes way of bonding the Mn ions with glass matrix. The effect is stronger for glasses with 0.4% of Mn ions – addition of aloe vera gel causes the exposure of MnOx vibrations which are not seen in the sample without it.

3.2. In Vitro Studies

Immersion in Simulated Body Fluid – pH and Mass Changes of the Samples.==
A standard test for potential bioactivity of the investigated material is an immersion in the simulated body fluid (SBF), solution with ionic composition same as in human blood plasma [37]. Figure 13 presents changes in manganese doped samples mass and in pH of the SBF solutions caused by samples immersion. Two remarks are important at front of that data interpretation. It is necessary to remember that the SBF is kept without any change during the entire course of the experiment (14 days). This are different conditions than in a human or animal body where we have fluids flow. Due to that the observed increase of pH to alkaline values which may be lethal for cells is not worrisome; the pH is treated only as the sign of alkali ions accumulation in restricted SBF volume. The other thing we should remember is that the changes in the samples mass are the result of the two competing processes: the sample degrade losing ions to the solution but on the other side ions from the solution are built in the growing apatite layer, increasing the mass of the sample.
Figure 12. A Mass changes of the ceramic samples doped with manganese during immersion in SBF. Figure 3.11B pH changes of the SBF solution during immersion of the ceramic samples doped with manganese.
Preprints 225341 g013
For all the CB@xxMn samples, the final mass decrease is observed, see Figure 3.11A, but the detailed behavior depends on manganese ions content. The same is seen for the pH changes ( Figure 3.11B). All the investigated ceramics without aloe vera shows initial decrease in pH after 1 day of immersion – the biggest in value for the CB@00Mn ceramic, on the other hand the smallest for the CB@02Mn. This indicate that release of the alkali ions, Na+, to the solution is not sufficiently quick to balance transfer of the Ca2+ ions to the sample volume. That picture suggest that the beginning hydroxyapatite (HA) growth is quicker than degradation of the sample. The results are in accordance with morphology analysis performed in Section 3.1.1. After 3 days pH increased above initial value of pH which is in accordance with literature for bioactive glasses [55] and can be assigned as ionic exchange of Na+ with H+ [56]. After 14 days pH was in the range 7.8 (CB@04Mn)-8.5 (CB@10Mn). These results can be used for projection of specific morphological and crystallographic characteristics of hydroxyapatite, as it was found in [57] that there is an increase in the formation of the monoclinic phase and a decrease of the hexagonal phase when pH changes from 9.6 to 7 (pH=7 favors monoclinic phase). Quite unique behavior is shown by the CB@00Mn ceramics – during first 3 days (so for two days longer time period than for ceramics with Mn dopant) pH is still decreasing, reaching 6.9, and then after 7 days it finally increased to pH=7.8; after 14 days pH became slightly more alkaline (pH=8.2). Doped samples exhibit pH increase above the beginning level -7.4 -after this first, one day period. For all the doped samples but CB@04Mn, pH is growing with the time of immersion. In the CB@04Mn case firstly pH decreased slightly, after 7 days it rapidly growths to pH=8 and then it slightly decreased to pH=7.8 after 14 days, which is the smallest value of all studied samples. The biggest degradation of the mass is found for the CB@10Mn ceramics – after 3 days in SBF half of the sample was degraded and moved to the solution, after 7 days there was some increase (10%) of the mass and then mass changes only slightly; with pH changes analysis it shows that it is a result of creation some new material – it occurs to be hydroxyapatite. The rest of studied samples shows more steady character: small change of mass – from 5% for CB@04Mn to over 40% for CB@10Mn during 2 weeks. Most of the samples show small increase of mass after 7 days; as this is correlated with pH increase this indicate the new material location on the samples surface and in their volume overcoming beginning samples mass degradation.
Figure 3.12. A Mass changes of the CB@02Mn ceramic prepared with different amounts of AV extract when immersed in SBF. Figure 3.12B SBF solution pH changes when the CB@02Mn ceramics prepared with different amounts of AV extract were immersed.
Preprints 225341 g014
Results of an immersion of the ceramic CB@02Mn prepared with different amounts of AV are summarized in Figure 3.12A and Figure 3.12B. This samples show steady behavior in SBF during pH measurements: increase of SBF pH during time, which is expected [58,59,60,61], up to 8.8 (the smallest value was found for 30% aloe vera content – pH of 8.4). However, they differ considerably, when mass degradation is analyzed. Samples for 5 and 30% of AV volume show opposite behavior to each other and differ significantly in relation to other samples: when one is decreasing, the other shows increase of mass. The other four samples have similar course of mass changes: they lose mass within first period of immersion – the higher AV content, higher porosity the higher loss of the mass is observed. The same is seen in pH increase. This support a picture of very rapid alkali ions transfer to the solution, not compensated by the solid phosphates growth on the samples surface. Next six days in SBF results in mass growth, most rapid for the A20CB@02Mn sample. During that time the covering with the new solid phase overcome ceramic degradation. After a week in SBF, tendency turns, degradation of the ceramics occurs more influential than ions move to the solid sample. For further studies 25% of AV was chosen. Albeit mass increase is larger in the 30% of AV addition case, the pH change indicate that degradation of the sample is superior when 25% AV was added. High results in both that abilities decided that 25% of AV is the better solution.
In Figure 3.13A and Figure 3.13B results of the immersion of the samples with different content of Mn iones, prepared with an usage of 25% AV are depicted. The conclusions are as follows: all the ceramics but ACB@07Mn during the first three days behave in the same way – mass is decreasing manifesting strong material dissolution. At the same time pH is systematically rising. Mass decrease is the smallest for ACB@10Mn when pH increase in that case is the highest, it means that the growth of solid phosphorous layer on that very porous surface goes very quickly. Finally, after a week in SBF that ceramics is the only one with still growing mass. As pH indicate continuous degradation of all the samples it looks as the synergy of both the high manganese content and rise of porosity due to AV give the best results – ceramics with high, probably also volume, growth of HAp and degradation of the material.
Figure 3.13. A Mass changes of the ceramics with different amount of Mn dopant, prepared with 25% of AV, when immersed in SBF. Figure 3.13B SBF solution pH changes in a course of immersion of the ceramics with different amount of Mn dopant, prepared with 25% of AV.
Preprints 225341 g015

3.3. Morphology of the Samples After Immersion

3.3.1. XRD Patterns

XRD for the samples after immersion in SBF were recorded to reveal eventual presence of HAp. XRD scans analysis of the ceramics after immersion in SBF shows that for all the samples the HAp (ICDD no. 09-0432) is present within the soak material (Figure 3.14 and Figure 3.15). The strong peak at 2θ=29° was also recorded for ceramics before immersion and was assigned as from CaSiO3. The growing with Mn content peak at 2θ=32° is connected with reflexes of (211) plane of HAp but it should be remembered that a presence of crystoballite is manifested at the same region, 2θ=33°; to complicate the picture a little bit more it is worth to mention that at 2θ=31.5° is located peak from (112) plane of carbon hydroxyapatite (HAC) - Ca10(PO4)6(CO3)0.5OH, (ICDD no. 01-089-4405)[46]. The other peaks- 2θ=40°, 2θ=46°, 2θ=49° - are connected with the planes (310), (222) and (213) the HAp, respectively. With the increasing content of Mn ions there is decreasing intensity of the signal intensity from CaSiO3 – for concentration 0.7% of Mn and 1.0% of Mn it is not seen at all; on the other hand, there is a broad hallo with center at 2θ=20°, characteristic for the amorphous state. It means the Mn ions cause loss of crystal phase of the ceramics, when immersed in SBF. The intensity of HAp/HAC signals increases with higher content of Mn ions as well as with the time interval in SBF solution. For 0.7% and 1.0% of Mn ions in the ceramics the peaks for 2θ=32° have the highest intensities and are more complex in shape which can be interpreted as simultaneous presence of HA and HAC; for 0.7% of Mn ions there are additional peaks at 2θ=24° and 2θ=26° characteristic for HAC. The location of the reflexes as originating from HAp and HAC is in accordance with the earlier reports [14,62,63,64,65,66,67]. As is clearly seen from the graphs in the Figure 3.15 the XRD scans are very similar, both in shape and in intensity of the particular peaks, despite the time of an immersion. This indicate that the precipitation of a calcium phosphates is quick and just after one day almost the final concentration is reached.
Figure 3.14. XRD patterns of ceramics with different manganese ions content, after 7 days in artificial plasma.
Preprints 225341 g016
Figure 3.15. XRD scans for the CB@10Mn ceramic after different time in SBF.
Preprints 225341 g017
In the Figure 3.16 there are the XRD recordings for the ceramics prepared with the different amount of AV gel. The crystal phase from the samples disappears even when we consider material with the lowest concentration of manganese ions. On the other hand, intensity of the manifestation of the reflexes typical for the HAp/HAC apparently growths with AV content, especially the structure of the peak around 2θ=31° is staying complicated, indicating also the presence of HAC, when AV amount is 25%. The spectrum for the A25CB@02Mn reveals peaks at 2θ=32° - plane (211) of HAp, 2θ=26° - (002) plane of HAp and also (002) of HAC, 2θ=49°- (213) plane of HA, 2θ=46° - plane (222) of HA.
Figure 3.17 shows XRD spectra for the samples prepared with 25% of AV, having different manganese content, immersed for 7 days in SBF. Some additional peaks occurred, at 2θ=54° , 56°,57° and at 65°. This is manifestation of a reflection from the planes (104),(322),(313) and (511) of HAp respectively [68]. Importantly, the intensity of the signal registered at individual angles is almost independent of the Mn ion content. The use of AV during synthesis develops the surface to such an extent that the previously observed effect of doping (Figure 3.14) is dominated by the much more significant effect of AV on the conditions for HAp precipitation.
Figure 3.17. XRD for the samples with different amount of Mn, prepared with 25% AV, after 7 days in SBF.
Preprints 225341 g019

3.3.2. IR and Raman Analysis

Analysis of IR spectra of Mn-doped glass ceramics (Figure 3.18 and Figure 3.19) shows that there are low energy bending vibrations in SiO4 units of amorphous silicon (440 cm-1) as well as vibrations characteristic for HAp and carbonate hydroxyapatite (HAC): in the range 570-600 cm-1 -there are bending vibrations of P-O of crystalline phosphate indicating the presence of HAp; at 880 cm-1 and 1410 cm-1 there are sharp bands of bending and stretching vibrations of C-O in CO32- groups of HAC respectively. Intensive bands in the range 1000-1050 cm-1 are associated with asymmetric stretching P-O vibrations of crystalline apatite and with vibrations within Si-O-Si group [53,54,66,67,69]. What is clearly seen comparing spectra from figure 3.9A and 3.9B with those recorded after immersion are higher intensities of the bands connected with phosphates, indicating growth of both forms of hydroxyapatite. The longer is immersion the higher are bands indicating carbonate hydroxyapatite presence.
Addition of aloe vera extract leads to similar spectra as those with Mn ions only, examples are in Figure 3.20 and Figure 3.21 . There are very distinct bands related to hydroxyapatite and carbonate hydroxyapatite: we have manifestation of the P-O bending vibrations presence of the vibrations at 590-610 cm-1 , bending vibrations of C-O in CO32- as well as the stretching ones in the same group(880 cm-1, 1410 cm-1). New band appears at 920 cm-1, which can be interpreted as NBO oxygen atoms stretching vibrations (Si-O) of Si-O-Si and nonsymmetrical stretching vibrations P-O of hydroxyapatite ortho-phosphate. Bending Si-O vibrations bands of SiO4 are less intensive than for glasses without AV – what indicate plant extract influence on silicon network degradation. It is worth to note, that all presented IR spectra are in accordance with IR spectrum of HA nano-particles [38].
Figure 3.22 compares the Raman spectra for two exemplary samples, which differ in Mn content, and their changes related to the immersion time in SBF (Simulated Body Fluid).
For the sample with a lower dopant content of 0.4 wt%, an initial significant increase in the intensity of a weak and broad band in the range of 590−700 cm−1 was observed. This band is associated with the vibrations of rings containing three SiO2 units [53]. Additionally, a small but clearly delineated band around 465 cm−1 was noted, whose intensity increases with the immersion time—these vibrations are linked to twisting strains of the Si-O-Si chains.
A series of bands located around 326, 390, 848, and 953 cm−1 can be attributed to vibrations involving non-bridging oxygens (NBOs) in the silica network structure. Two of these, approximately 400 cm−1 and 953 cm−1, also correspond to vibrations within the phosphate group (PO43−). Thus, the presence of the 953 cm−1 vibration may signify stretching vibrations in the Si-O-NBO system but also the symmetric stretching vibrations within the PO43− group [42].
The intensity of these vibrations is greatest after seven days of immersion; after two weeks, both peaks almost disappear. However, an intense signal appears at 1084 cm−1. The natural, immediately apparent interpretation is the asymmetric P-O stretching vibration in PO43− [50,68]. Vibrations in the same energy range can also be linked to bridging oxygens (BO) in silicone chains. The formation of BO has been suggested previously [70] in the context of Al doping – the presence of aluminum, due to the tetrahedral coordination of this element's atoms, causes the conversion of NBO (non-bridging oxygens) to BO. A similar process is worth considering in the material discussed here – manganese atoms are tetravalent and tetrahedrally coordinate oxygen [71].
On the other hand, changes of structure of glass with greater content of Mn ions (1.0%) are less dynamic: similarly as for 0.4% of Mn, the bands around 330 cm-1 and 580-670 cm-1 are decreasing in time – showing decrease of NBO of silicon compounds in time – , the bands in the region 390-485 cm-1 become one broad band – which indicates mixing of PO43- vibrations with Si-O-Si vibrations – with the maximum at 430 cm-1 associated, as in the previous case, with SiO4 vibrations or skeletal vibrations of MnOx. After 2 weeks two sharp bands at 950 cm-1 and 1063 cm-1 (with the greatest intensity) appear, which were present as residual traces of bands for shorter periods of time and can be identified as Si-O-Si-BO and NBO vibrations in silica with dominant share of bridging atoms as well as symmetric and asymmetric stretching vibrations in the phosphate group. It may be read as a sign of HAp presence rather than as confirmation of the increase of NBO type oxygen concentration – in the same time we have decrease of the NBO origin 390-485 cm-1 bands. This confirms the hypothesis that NBO atoms are necessary for efficient ion exchange and formation of SiO2-rich layer mainly in the primary step of bioactive process [72].
The examples illustrating the influence of aloe vera extract on Raman spectra are presented in Figure 23. Let's start by comparing the spectra recorded for CB@10Mn (Figure 3.22) and ACB@10Mn (Figure 3.23) ceramics after two weeks in SBF. As can be easily noticed, the spectrum of CB@10Mn is significantly more complicated. In the spectrum of the material obtained with the AV additive, only the bands related to the vibrations of Si-NBO—315 cm-1, 382 cm-1—the vibrations in the Si-O-Si group (460 cm-1), and an intense, broad band (648 cm-1) related to the vibrations of rings composed of three SiO2 units [53], are visible. The asymmetry of this band suggests that the intense signal associated with the SiO2 groups overlaps the band at approximately 605 cm-1, which is related to the vibrations in the phosphate group and is visible at lower manganese ion concentrations. This band is clearly isolated for ACB@04Mn and ACB@07Mn. In the case of these latter two ceramics, the 856 cm-1 band, associated with Si-NBO vibrations, is also isolated, along with the bands at 961 cm-1 and 1085 cm-1, which are a manifestation of the symmetric and asymmetric P-O stretching vibrations in the phosphate group, respectively. The change in the spectrum with the change in dopant concentration leads to the conclusion that an increase in the amount of manganese in the ceramics causes a reduction in the amount of non-bridging oxygens; these become tetrahedrally coordinated by Mn ions. Simultaneously, the amount of ring structures built from SiO2 increases. More surprising is the disappearance of the bands associated with vibrations in the phosphate group. This is clearly correlated with the amount of dopant and the presence of AV. In the CB@10Mn case even after two weeks in SBF peaks at 430 cm-1, 950 cm-1 and 1062 cm-1 are revealed indicating presence of phosphorous groups.
A look at the spectra registered after 7 days in SBF reveals a distinct peak located around 850 cm⁻¹, visible regardless of the dopant concentration in the sample – this indicates a significant presence of Si-NBO bonds. Simultaneously, there is an absence of vibration manifestations in the Si-O-Si group (around 460 cm⁻¹). This can be interpreted as a symptom of the ceramic's far-reaching depolymerization. NBOs dominate the material; their concentration decreases with increasing immersion time, to completely disappear after 14 days. This is a manifestation of the coordinating action of manganese ions. We can also observe vibrations originating from the bonds in the phosphate group – ~400 cm⁻¹, 955 cm⁻¹, and a barely outlined band at ~1040 cm⁻¹. The latter becomes better defined after longer immersion and shifts towards slightly higher energies (1080 cm⁻¹), while the first two gradually disappear. This seems to suggest the absence of calcium phosphate on the sample surface. To investigate this issue in more detail, a three-dimensional map based on Raman spectra was prepared for selected samples. The surface area scanned was 6 µm x 6 µm and 35 µm deep. The registration of over 2600 spectra was required to produce one map. The results for the ACB@10Mn sample are presented in Figure 3.24. Figure 3.24A shows the spatial distribution of the 957 cm⁻¹ vibration sources in the sample after 7 days in SBF. As can be seen, if we assume that this vibration is associated with the HAp phosphate group, the distribution of apatite in the sample is not uniform – it is localized rather in the subsurface layer than on the surface itself.
Figure 3.24C, created based on spectra collected for the same sample, this time for the 1086 cm-1 vibration, leads to similar conclusions. The distribution of the area where we observe the highest intensities is similar to that visible in Figure 3.24A. This supports the thesis that both vibrations are related to the same group, the phosphate group. The situation after 14 days of immersion is illustrated in Figure 3.24B. As can be seen, the largest clusters of HAp are localized deep beneath the surface. The surface here should be understood in a strictly geometric sense; the porosity of the material means that the actual surface area is expanded (or developed) and allows SBF (Simulated Body Fluid) to penetrate deep into the material.

4. Conclusions

A series of ceramics was synthesized using the sol-gel method, with citric acid employed as a catalyst for the gelation process. This catalyst proved equally effective for both the 45S5 glass composition and manganese-doped glasses. Furthermore, the addition of aloe vera extract did not hinder rapid gelation.
Sintering the samples at 600°C is sufficient to obtain ceramics in which the crystalline phases consist of silicates: calcium silicate (CaSiO3) and sodium-calcium silicate (Na2CaSiO6). Manganese doping causes the additional precipitation of SiO2 crystals in the form of cristobalite.
The introduction of manganese ions slightly alters the structural properties of the material. There is a reduction in the number of non-bridging oxygens (NBO), which is attributed to the tetrahedral coordination of Mn ions. The concentration of bridging oxygens (BO) increases significantly as the dopant concentration rises. Manganese ions also lead to a decrease in the amount of calcium silicates. The reduction in the formation of CaSiO3 is correlated with the increase in BO concentration within the sample.
The addition of aloe vera extract also induces structural changes—the BO concentration decreases; this effect is visible regardless of the amount of manganese added. The impact of the extract on the structure can be defined as a reduction in the degree of cross-linking within the amorphous matrix.
Manganese ion doping, through these generated structural changes, also influences the course of the immersion process in Simulated Body Fluid (SBF). Comparing the sample mass changes and the pH variations of the SBF relative to the dopant concentration leads to the conclusion that at higher concentrations (0.7%, 1%), sample degradation occurs significantly faster. For the CB@10Mn sample, mass loss reaches a maximum value of ~50% after 72 hours. However, this is not correlated with the maximum increase in pH. The alkalinity of the solution continues to rise even as the mass loss decreases (eventually reaching ~40%). This can be explained by assuming that during the initial immersion period, the rapid decomposition of the ceramic—coupled with the release of sodium ions into the solution—is accompanied by the formation of surface hydroxyapatite (HpA), involving the migration of Ca2+ ions from the solution into the solid phase. The former process strongly alkalizes the solution, while the latter reduces its alkalinity. In subsequent stages, the mass loss associated with material degradation is more than compensated for by the increase in the mass of phosphates. During the formation of calcium phosphates, Ca ions from the ceramic structure itself, and not just only from the artificial plasma, are incorporated into the apatite layer.
The addition of aloe vera extract intensifies HpA growth. The change in sample mass is markedly smaller; at higher Mn ion contents, it is more than twice as small—40% of the original mass for CB@10Mn versus below 20% for ACB@10Mn. This is accompanied by strong alkalization of the SBF solution; despite the degradation of the original sample, the mass does not drop, indicating the formation of a phosphate layer.
The effect of faster and more significant HpA growth (in terms of mass) is observed regardless of the manganese ion concentration, though it is more pronounced at higher concentrations of this element.
3D Raman mapping revealed the volumetric nature of HpA growth. As immersion time increases, the highest concentration of phosphates is observed not on the surface, but within the bulk of the sample.

Author Contributions

All authors read and approved the final manuscript. Katarzyna Mszyca: Realization, Validation. Paulina Kapuśniak: Realization, Validation. Justyna Barzowska: Realization, Validation. Jaroslaw Jędryka: Realization, Validation. Ilona Radkowska: Writing – original draft, Realization, Validation. Piotr Brągiel: Conceptualization, Supervision, Final Validation, Writing – review & editing, Michal Piasecki: Organization, Validation, Final Supervision.

Funding

This research received no external founding.

Institutional Review Board Statement

Not applicable.

Data Availability Statement

Data available on request’.:

Conflicts of Interest

The authors declare that they have no known competing financial interests or personal relationships that could have appeared to influence the work reported in this paper.

References

  1. Galbreath, S.; Krueger, B.; Frazier, T.; Goswami, T. Effectiveness of mesoporous bioglass in drug delivery. J. Pharm. Biopharm. Res. 2022, 4, 271–282. [Google Scholar] [CrossRef]
  2. Ansari, M. Bone tissue regeneration: biology, strategies and interface studies. Prog. Biomater. 2019, 8, 223–237. [Google Scholar] [CrossRef] [PubMed]
  3. Faure, J.; Drevet, R.; Lemelle, A.; Ben Jaber, N.; Tara, A.; El Btaouri, H.; Benhayoune, H. A new sol-gel synthesis of 45S5 bioactive glass using an organic acid as catalyst. Mater. Sci. Eng. C. 2015, 47, 407–412. [Google Scholar] [CrossRef] [PubMed]
  4. Agarwal, H.; Venkat Kumar, S.; Rajeshkumar, S. A review on green synthesis of zinc oxide nanoparticles – An eco-friendly approach. Resour. Technol. 2017, 3, 406–413. [Google Scholar] [CrossRef]
  5. Santhoshkumar, T.; Rahuman, A.A.; Jayaseelan, C.; Rajakumar, G.; Marimuthu, S.; Kirthi, A.V.; Velayutham, K.; Thomas, J.; Venkatesan, J.; Kim, S.K. Green synthesis of titanium dioxide nanoparticles using Psidium guajava extract and its antibacterial and antioxidant properties. Asian Pac. J. Trop. Med. 2014, 7, 968–976. [Google Scholar] [CrossRef] [PubMed]
  6. Kosmala, K.; Szymanska, R. Green synthesis of TiO2 nanoparticles using leaf extract of Jatropha curcas L. for photocatalytic degradation of tannery wastewater. Kosmos 2016, 65, 386–396. [Google Scholar] [CrossRef]
  7. Rajakumar, G.; Abdul Rahuman, A.; Priyamvada, B.; Khanna, V. Gopiesh; D. Kishore Kumar, P. Sujin, Eclipta prostrata leaf aqueous extract mediated synthesis of titanium dioxide nanoparticles. Mater. Lett. 2012, 68, 115–117. [Google Scholar] [CrossRef]
  8. Xynos, I.D.; Hukkanen, M.V.J.; Batten, J.J.; Buttery, L.D.; Hench, L.L.; Polak, J.M. Bioglass ®45S5 stimulates osteoblast turnover and enhances bone formation in vitro: Implications and applications for bone tissue engineering. Calcif. Tissue Int. 2000, 67, 321–329. [Google Scholar] [CrossRef] [PubMed]
  9. Xynos, I.D.; Edgar, A.J.; Buttery, L.D.K.; Hench, L.L.; Polak, J.M. Gene-expression profiling of human osteoblasts following treatment with the ionic products of Bioglass® 45S5 dissolution. J. Biomed. Mater. Res. 2001, 55, 151–157. [Google Scholar] [CrossRef]
  10. Xynos, I.D.; Edgar, A.J.; Buttery, L.D.K.; Hench, L.L.; Polak, J.M. Ionic products of bioactive glass dissolution increase proliferation of human osteoblasts and induce insulin-like growth factor II mRNA expression and protein synthesis. Biochem. Biophys. Res. Commun. 2000, 276, 461–465. [Google Scholar] [CrossRef] [PubMed]
  11. Barrioni, B.R.; Oliveira, A.C.; de Fátima Leite, M.; de Magalhães Pereira, M. Sol–gel-derived manganese-releasing bioactive glass as a therapeutic approach for bone tissue engineering. J. Mater. Sci. 2017, 52. [Google Scholar] [CrossRef]
  12. Barrioni, B.R.; Naruphontjirakul, P.; Norris, E.; Li, S.; Kelly, N.L.; Hanna, J. V.; Stevens, M.M.; Jones, J.R.; Pereira, M. de M. Effects of manganese incorporation on the morphology, structure and cytotoxicity of spherical bioactive glass nanoparticles. J. Colloid Interface Sci. 2019. [Google Scholar] [CrossRef] [PubMed]
  13. Westhauser, F.; Wilkesmann, S.; Nawaz, Q.; Schmitz, S.I.; Moghaddam, A.; Boccaccini, A.R. Osteogenic properties of manganese-doped mesoporous bioactive glass nanoparticles. J. Biomed. Mater. Res.-Part A. 2020. [Google Scholar] [CrossRef] [PubMed]
  14. Nawaz, Q.; Rehman, M.A.U.; Burkovski, A.; Schmidt, J.; Beltrán, A.M.; Shahid, A.; Alber, N.K.; Peukert, W.; Boccaccini, A.R. Synthesis and characterization of manganese containing mesoporous bioactive glass nanoparticles for biomedical applications. J. Mater. Sci. Mater. Med. 2018, 29. [Google Scholar] [CrossRef] [PubMed]
  15. Avila, D.S.; Puntel, R.L.; Aschner, M. Manganese in health and disease. Interrelations between essential metal ions and human diseases. In Essent. Met. Ions Hum. Dis. -Metal Ions Life Sci.; Sigel, A., H. Sigel, S. R., Eds.; Springer: Dortrecht, 2013; Vol. 13, pp. 199–227. [Google Scholar] [CrossRef]
  16. Solaberrieta; Jiménez, A.; Cacciotti, I.; Garrigós, M.C. Encapsulation of bioactive compounds from aloe vera agrowastes in electrospun poly (ethylene oxide) nanofibers. Polymers 2020, 12. [Google Scholar] [CrossRef] [PubMed]
  17. Rahman, S.; Carter, P.; Bhattarai, N. Aloe Vera for Tissue Engineering Applications. J. Funct. Biomater. 2017, 8, 6. [Google Scholar] [CrossRef] [PubMed]
  18. Baruah; M. Bordoloi, H.P. Deka Baruah, Aloe vera: A multipurpose industrial crop. Ind. Crops Prod. 2016, 94, 951–963. [Google Scholar] [CrossRef]
  19. Hamman, J.H. Composition and applications of Aloe vera leaf gel. Molecules 2008, 13, 1599–1616. [Google Scholar] [CrossRef] [PubMed]
  20. Suganya, S.; Venugopal, J.; Mary, S. Agnes; Ramakrishna, S.; Lakshmi, B.S.; Giri Dev, V.R. Aloe vera incorporated biomimetic nanofibrous scaffold: A regenerative approach for skin tissue engineering, Iran. Polym. J. (Engl. Ed. 2014, 23, 237–248. [Google Scholar] [CrossRef]
  21. Reynolds, T.; Dweck, A.C. Aloe vera leaf gel: A review update. J. Ethnopharmacol. 1999, 68, 3–37. [Google Scholar] [CrossRef] [PubMed]
  22. Banu; Sathyanarayana, B.C.; Chattannavar, G. Efficacy of fresh Aloe vera gel against multi-drug resistant bacteria in infected leg ulcers. Australas. Med. J. 2012, 5, 305–309. [Google Scholar] [CrossRef] [PubMed]
  23. Langmead, L.; Makins, R.J.; Rampton, D.S. Anti-inflammatory effects of aloe vera gel in human colorectal mucosa in vitro. Aliment Pharmacol. Ther. 2004, 19, 521–527. [Google Scholar] [CrossRef] [PubMed]
  24. Hu, Y.; Xu, J.; Hu, Q. Evaluation of Antioxidant Potential of Aloe vera (Aloe barbadensis Miller) Extracts. J. Agric. Food Chem. 2003, 51, 7788–7791. [Google Scholar] [CrossRef] [PubMed]
  25. Jithendra, P.; Rajam, A.M.; Kalaivani, T.; Mandal, A.B.; Rose, C. Preparation and characterization of aloe vera blended Collagen-Chitosan composite scaffold for tissue engineering applications. ACS Appl. Mater. Interfaces. 2013, 5, 7291–7298. [Google Scholar] [CrossRef] [PubMed]
  26. Mary, S. Agnes; Dev, V.R. Giri. Electrospun herbal nanofibrous wound dressings for skin tissue engineering. J. Text. Inst. 2015, 106, 886–895. [Google Scholar] [CrossRef]
  27. Chithra, P.; Sajithlal, G.B.; Chandrakasan, G. Influence of Aloe vera on collagen characteristics in healing dermal wounds in rats. Mol. Cell. Biochem. 1998, 181, 71–76. [Google Scholar] [CrossRef] [PubMed]
  28. Gupta, V.; Malhotra, S. Pharmacological attribute of Aloe vera: Revalidation through experimental and clinical studies. AYU (An Int. Q. J. Res. Ayurveda) . 2012, 33, 193. [Google Scholar] [CrossRef] [PubMed]
  29. Habeeb, F.; Shakir, E.; Bradbury, F.; Cameron, P.; Taravati, M.R.; Drummond, A.J.; Gray, A.I.; Ferro, V.A. Screening methods used to determine the anti-microbial properties of Aloe vera inner gel. Methods 2007, 42, 315–320. [Google Scholar] [CrossRef] [PubMed]
  30. Choi, S.; Chung, M.H. A review on the relationship between aloe vera components and their biologic effects. Semin. Integr. Med. 2003, 1, 53–62. [Google Scholar] [CrossRef]
  31. Tarameshloo, M.; Norouzian, M.; Zarein-Dolab, S.; Dadpay, M.; Mohsenifar, J.; Gazor, R. Aloe vera gel and thyroid hormone cream may improve wound healing in Wistar rats. Anat. Cell Biol. 2012, 45, 170. [Google Scholar] [CrossRef] [PubMed]
  32. Boonyagul, S.; Banlunara, W.; Sangvanich, P.; Thunyakitpisal, P. Effect of acemannan, an extracted polysaccharide from Aloe vera, on BMSCs proliferation, differentiation, extracellular matrix synthesis, mineralization, and bone formation in a tooth extraction model. Odontology 2014, 102, 310–317. [Google Scholar] [CrossRef] [PubMed]
  33. Salihu, R.; Abd Razak, S.I.; Ahmad Zawawi, N.; Abdul Kadir, M. Rafiq; Izzah Ismail, N.; Jusoh, N.; Mohamad, M. Riduan; Mat Nayan, N. Hasraf. Citric acid: A green cross-linker of biomaterials for biomedical applications. Eur. Polym. J. 2021, 146, 110271. [Google Scholar] [CrossRef]
  34. Tran, R.T.; Yang, J.; Ameer, G.A. Citrate-Based Biomaterials and Their Applications in Regenerative Engineering. Annu. Rev. Mater. Res. 2015, 45, 277–310. [Google Scholar] [CrossRef] [PubMed]
  35. Rhee, S.H.; Tanaka, J. Effect of citric acid on the nucleation of hydroxyapatite in a simulated body fluid. Biomaterials 1999, 20, 2155–2160. [Google Scholar] [CrossRef] [PubMed]
  36. Verma, G.; Barick, K.C.; Shetake, N.G.; Pandey, B.N.; Hassan, P.A. Citrate-functionalized hydroxyapatite nanoparticles for pH-responsive drug delivery. RSC Adv. 2016, 6, 77968–77976. [Google Scholar] [CrossRef]
  37. Oyane, H.-M.; Kim; Furuya, T.; Kokubo, T.; Miyazaki, T.; Nakamura, T. Preparation and assessment of revised simulated body fluids. J. BioMed Mater. Res. 2003, 65, 188–195. [Google Scholar] [CrossRef] [PubMed]
  38. Neves, J.G.; Navarro da Rocha, D.; Lopes, C.C.; Prado da Silva, M.H.; Sinhoreti, M.A.C.; Correr-Sobrinho, L.; Fraga, M.A.A.; Correr, A.B. Effect of pH level and calcination on the production of calcium phosphates by acidic route of wet precipitation. Ceramica 2021, 67, 236–243. [Google Scholar] [CrossRef]
  39. Baranowska; Leśniak, M.; Kochanowicz, M.; Zmojda, J.; Mikulski, P.; Dorosz, D. Crystallization Kinetics and Structural Properties of the 45S5 Bioactive Glass and Glass-Ceramic Fiber Doped with Eu3+. Materials 2020, 13, 1281. [Google Scholar] [CrossRef] [PubMed]
  40. Lin, C.C.; Huang, L.C.; Shen, P. Na2CaSi2O6-P2O5 based bioactive glasses. Part 1: Elasticity and structure. J. Non. Cryst. Solids. 2005, 351, 3195–3203. [Google Scholar] [CrossRef]
  41. Cacciotti; Lombardi, M.; Bianco, A.; Ravaglioli, A.; Montanaro, L. Sol-gel derived 45S5 bioglass: Synthesis, microstructural evolution and thermal behaviour. J. Mater. Sci. Mater. Med. 2012, 23, 1849–1866. [Google Scholar] [CrossRef] [PubMed]
  42. Aguiar, H.; Serra, J.; González, P.; León, B. Structural study of sol-gel silicate glasses by IR and Raman spectroscopies. J. Non. Cryst. Solids. 2009, 355, 475–480. [Google Scholar] [CrossRef]
  43. Karmakar, B.; Rademann, K.; L. Stepnov, A. Glass Nanocomposite: Synthesis, Properties and Applications; Elsevier, 2016. [Google Scholar]
  44. Li, R.; Clark, A.E.; Hench, L.L. An investigation of bioactive glass powders by sol-gel processing. J. Appl. Biomater. 1991, 2, 231–239. [Google Scholar] [CrossRef] [PubMed]
  45. Pirayesh, H.; Nychka, J.A. Sol-gel synthesis of bioactive glass-ceramic 45S5 and its in vitro dissolution and mineralization behavior. J. Am. Ceram. Soc. 2013, 96, 1643–1650. [Google Scholar] [CrossRef]
  46. MačKović, M.; Hoppe, A.; Detsch, R.; Mohn, D.; Stark, W.J.; Spiecker, E.; Boccaccini, A.R. Bioactive glass (type 45S5) nanoparticles: In vitro reactivity on nanoscale and biocompatibility. J. Nanoparticle Res. 2012, 14. [Google Scholar] [CrossRef]
  47. Qian, J.; Kang, Y.; Wei, Z.; Zhang, W. Fabrication and characterization of biomorphic 45S5 bioglass scaffold from sugarcane. Mater. Sci. Eng. C. 2009, 29, 1361–1364. [Google Scholar] [CrossRef]
  48. Kang, L.; Zhang, M.; Liu, Z.H.; Ooi, K. IR spectra of manganese oxides with either layered or tunnel structures. Spectrochim. Acta-Part A Mol. Biomol. Spectrosc. 2007, 67, 864–869. [Google Scholar] [CrossRef] [PubMed]
  49. Cui, H.; Liu, F.; Feng, X.; Tan, W.; Wang, M.K. Aging promotes todorokite formation from layered manganese oxide at near-surface conditions. J. Soils Sediments. 2010, 10, 1540–1547. [Google Scholar] [CrossRef]
  50. de Siqueira, L.; Campos, T.M.B.; Camargo, S.E.A.; Thim, G.P.; Trichês, E.S. Structural, crystallization and cytocompatibility evaluation of the 45S5 bioglass-derived glass-ceramic containing niobium. J. Non. Cryst. Solids. 2021, 555, 1–8. [Google Scholar] [CrossRef]
  51. Bragiel, P.; Ficek, P.; Prochwicz, W.; Radkowska, I.; Veeraiah, N. Are the phosphorus-rich Na2O-CaO-B2O3-SiO2-P2O5 glasses bioactive and what is an influence of doping with manganese oxide? Mater. Sci. Pol. 2017, 35, 760–766. [Google Scholar] [CrossRef]
  52. Borrajo, J.P.; Liste, S.; Serra, J.; González, P.; Chiussi, S.; León, B.; Pérez-Amor, M.; Ylänen, H.O.; Hupa, M. Influence of the Network Modifier Content on the Bioactivity of Silicate Glasses. Key Eng. Mater. 2004, 254–256, 23–26. [Google Scholar] [CrossRef]
  53. Posset, U.; Löcklin, E.; Thull, R.; Kiefer, W. Vibrational spectroscopic study of tetracalcium phosphate in pure polycrystalline form and as a constituent of a self-setting bone cement. J. Biomed. Mater. Res. 1998, 40, 640–645. [Google Scholar] [CrossRef]
  54. Geissberger, A.E.; Galeener, F.L. Raman studies of vitreous SiO2 versus fictive temperature. Phys. Rev. B. 1983, 28, 3266–3271. [Google Scholar] [CrossRef]
  55. Cortés, D.A.; Medina, A.; Escobedo, S.; López, M.A. Biomimetic apatite formation on a CoCrMo alloy by using wollastonite, bioactive glass or hydroxyapatite. J. Mater. Sci. 2005, 40, 3509–3515. [Google Scholar] [CrossRef]
  56. Sepulveda, P.; Jones, J.R.; Hench, L.L. In vitro dissolution of melt-derived 45S5 and sol-gel derived 58S bioactive glasses. J. Biomed. Mater. Res. 2002, 61, 301–311. [Google Scholar] [CrossRef] [PubMed]
  57. López-Ortiz, S.; Mendoza-Anaya, D.; Sánchez-Campos, D.; Fernandez-García, M.E.; Salinas-Rodríguez, E.; Reyes-Valderrama, M.I.; Rodríguez-Lugo, V. The pH Effect on the Growth of Hexagonal and Monoclinic Hydroxyapatite Synthesized by the Hydrothermal Method. J. Nanomater. 2020. [Google Scholar] [CrossRef]
  58. Wójcik, N.A.; Sinitsyna, P.; Ali, S.; Hupa, L.; Jonson, B. In vitro dissolution of Na-Ca-P-oxynitrides. Materials (Basel) 2021, 14, 1–16. [Google Scholar] [CrossRef] [PubMed]
  59. Souza, M.T.; Crovace, M.C.; Schröder, C.; Eckert, H.; Peitl, O.; Zanotto, E.D. Effect of magnesium ion incorporation on the thermal stability, dissolution behavior and bioactivity in Bioglass-derived glasses. J. Non. Cryst. Solids. 2013, 382. [Google Scholar] [CrossRef]
  60. Yu, Y.; Bacsik, Z.; Edén, M. Contrasting in vitro apatite growth from bioactive glass surfaces with that of spontaneous precipitation. Materials (Basel) 2018, 11, 20–22. [Google Scholar] [CrossRef] [PubMed]
  61. Goh, Y.F.; Alshemary, A.Z.; Akram, M.; Abdul Kadir, M.R.; Hussain, R. Bioactive Glass: An In-Vitro Comparative Study of Doping with Nanoscale Copper and Silver Particles. Int. J. Appl. Glas. Sci. 2014, 5. [Google Scholar] [CrossRef]
  62. Chen, J.; Zeng, L.; Chen, X.; Liao, T.; Zheng, J. Preparation and characterization of bioactive glass tablets and evaluation of bioactivity and cytotoxicity in vitro. Bioact. Mater. 2018, 3, 315–321. [Google Scholar] [CrossRef] [PubMed]
  63. Ashok, M.; Sundaram, N. Meenakshi; Kalkura, S. Narayana. Crystallization of hydroxyapatite at physiological temperature. Mater. Lett. 2003, 57, 2066–2070. [Google Scholar] [CrossRef]
  64. Ravarian, R.; Moztarzadeh, F.; Hashjin, M.S.; Rabiee, S.M.; Khoshakhlagh, P.; Tahriri, M. Synthesis, characterization and bioactivity investigation of bioglass/hydroxyapatite composite. Ceram. Int. 2010, 36, 291–297. [Google Scholar] [CrossRef]
  65. Vadera, N.; Ashokan, A.; Gowd, G.S.; Sajesh, K.M.; Chauhan, R.P.; Jayakumar, R.; Nair, S. V.; Koyakutty, M. Manganese doped nano-bioactive glass for magnetic resonance imaging. Mater. Lett. 2015, 160, 335–338. [Google Scholar] [CrossRef]
  66. Rapacz-Kmita; Paluszkiewicz, C.; Ślósarczyk, A.; Paszkiewicz, Z. FTIR and XRD investigations on the thermal stability of hydroxyapatite during hot pressing and pressureless sintering processes. J. Mol. Struct. 2005, 744–747, 653–656. [Google Scholar] [CrossRef]
  67. Merry, J.C.; Gibson, I.R.; Best, S.M.; Bonfield, W. Synthesis and characterization of carbonate hydroxyapatite. J. Mater. Sci. Mater. Med. 1998, 9, 779–783. [Google Scholar] [CrossRef] [PubMed]
  68. Koutsopulos, S. Synthesis and characterization of hydroxyapatite crystals: A review study on the analytical methods. J. Biomed. Mater. Res. 2002, 62, 600–612. [Google Scholar] [CrossRef] [PubMed]
  69. Karakuzu-Ikizler, B.; Terzioglu, P.; Oduncu-Tekerek, B.S.; Yucel, S. Effect of selenium incorporation on the structure and in vitro bioactivity of 45S5 bioglass. J. Aust. Ceram. Soc. 2020, 56, 697–709. [Google Scholar] [CrossRef]
  70. Benoit, M.; Ispas, S.; Tuckerman, M.E. Structural properties of molten silicates from ab initio molecular-dynamics simulations: Comparison between (formula presented) and (formula presented). Phys. Rev. B-Condens. Matter Mater. Phys. 2001, 64, 1–10. [Google Scholar] [CrossRef]
  71. Delicat, U.; Radaev, S.F.; Trömel, M.; Behrens, P.; Kargin, Y.F.; Mar’in, A.A. Tetrahedral coordination of mn(iv) by oxygen in manganese sillenite bi12mno20. J. Solid State Chem. 1994, 110, 66–69. [Google Scholar] [CrossRef]
  72. Serra, J.; González, P.; Liste, S.; Chiussi, S.; León, B.; Pérez-Amor, M.; Ylänen, H.O.; Hupa, M. Influence of the non-bridging oxygen groups on the bioactivity of silicate glasses. J. Mater. Sci. Mater. Med. 2002, 13, 1221–1225. [Google Scholar] [CrossRef] [PubMed]
Figure 1. Bioactive 45S5 ceramics with different amounts of Mn dopant: On the left/right: without/with aloe vera extract; A – 0.2% Mn, B – 0.4% Mn,C–0.7%Mn, D – 1.0% Mn.
Preprints 225341 g001
Figure 2. A SEM picture of the CB@00Mn sample; magnification 500x. Figure 2B SEM picture of the CB@00Mn sample; magnification 10k.
Preprints 225341 g002
Figure 3. A SEM picture of the CB@02Mn sample; magnification 2k. Figure 3B SEM picture of the CB@02Mn sample; magnification 10k.
Preprints 225341 g003
Figure 4. A SEM picture of the CB@04Mn sample; magnification 2k. Figure 4B SEM picture of the CB@04Mn sample; magnification 10k.
Preprints 225341 g004
Figure 5. A SEM picture of the CB@07Mn sample; magnification 2k. Figure 5B SEM picture of the CB@07Mn sample; magnification 10k.
Preprints 225341 g005
Figure 6. A SEM picture of the CB@10Mn sample; magnification 2k. Figure 6B SEM picture of the CB@10Mn sample; magnification 10k.
Preprints 225341 g006
Figure 9. Changes of Tg with different amounts of Mn dopant.
Preprints 225341 g009
Figure 10. XRD spectra of the base material and samples with different amounts of the dopant.
Preprints 225341 g010
Figure 11. A. Raman spectrum of the three selected ceramics, prepared without AV, before immersion in SBF. Figure 11B. Raman spectrum of the selected ceramics, prepared with addition of AV, before immersion in SBF.
Preprints 225341 g012
Figure 3.16. XRD recordings for the samples prepared with the different amount of AV, after 7 days in SBF.
Preprints 225341 g018
Figure 3.18. FT-IR spectrum of glasses with 0.2% of Mn dopant after immersion in SBF.
Preprints 225341 g020
Figure 3.19. FT-IR spectrum of glasses with 0.7% of Mn dopant after immersion in SBF.
Preprints 225341 g021
Figure 3.20. FT-IR spectrum of ceramics with 0.2% of Mn dopant and 25% of aloe vera extract after immersion in SBF.
Preprints 225341 g022
Figure 3.21. FT-IR spectrum of ceramics with 0.7% of Mn dopant and 25% of aloe vera extract after immersion in SBF.
Preprints 225341 g023
Figure 3.22. Raman spectrum of the samples with two, example, Mn ions content, after different time in SBF.
Preprints 225341 g024
Figure 3.23. Raman spectra of the different samples obtained with AV, after week (left) and two weeks ( right) in SBF.
Preprints 225341 g025
Figure 3.24. A 3D distribution of the source of the 957 cm-1 band. Sample,ACB@10Mn, after 7 days in SBF. Figure 3.24B 3D distribution of the source of the 957 cm-1 band. Sample,ACB@10Mn, after 14 days in SBF. Figure 3.24C 3D distribution of the source of the 1086 cm-1 band. Sample, ACB@10Mn, after 7 days in SBF.
Preprints 225341 g026
Table 2.1. Composition of prepared bioactive ceramics (in wt.%).
Dopant content Label SiO2 Na2O CaO P2O5 MnCl2
Base ceramic CB@00Mn 45.0 24.5 24.5 6.0 0.0
0.2% Mn CB@02Mn 45.0 24.4 24.4 6.0 0.2
0.4% Mn CB@04Mn 45.0 24.3 24.3 6.0 0.4
0.7% Mn CB@07Mn 45.0 24.15 24.15 6.0 0.7
1.0% Mn CB@10Mn 45.0 24.0 24.0 6.0 1.0
Disclaimer/Publisher’s Note: The statements, opinions and data contained in all publications are solely those of the individual author(s) and contributor(s) and not of MDPI and/or the editor(s). MDPI and/or the editor(s) disclaim responsibility for any injury to people or property resulting from any ideas, methods, instructions or products referred to in the content.
Copyright: This open access article is published under a Creative Commons CC BY 4.0 license, which permit the free download, distribution, and reuse, provided that the author and preprint are cited in any reuse.