
Submitted:
27 July 2026
Posted:
28 July 2026
You are already at the latest version
Abstract
This article presents a summary of recent theoretical investigations on the residence time distribution (RTD) of particles in laminar flow tubes, based on stochastic simulation of particles trajectories, and also a formerly unpublished comparison of the numerical simulation results with experimental data. The RTD depends on the flow velocity profile of the fluid. For the two extreme flow types, plug or uniform flow (UF) and fully developed or parabolic flow (PF), the RTD is a function of two dimensionless numbers: the particle diffusivity, D, and the tube aspect ratio, a. A third additional dimensionless variable, the Reynolds number, Re, should also be considered when the stationary fluid velocity profile gradually develops along the tube (steady transition flow, TF). The role of D can be split up into two contributions: one due to diffusion along the main fluid flow direction, the other to cross-stream diffusion; the first moment of the RTD depends on the product aD in the first case, but only on D in the second one. In the ideal case in which the fluid velocity is constant throughout the tube (plug flow) and particle axial diffusion is absent, the particle RTD coincides with that of the fluid. In any other circumstances the RTD of the particles shifts to smaller residence times in comparison with the RTD of the fluid: the mean particle residence time in the tube is smaller than that of the fluid. This surprising outcome is explained in terms of the particle survival probability, the mean particle radial coordinate and the mean axial displacement of the particles per unit time along the tube. In the last section of the paper, theoretical particle survival probability and residence time distribution are both favorably compared with the presently available experimental results.
Keywords:
aerosol residence time distribution
; aerosol penetration
; particle trajectory simulation
1. Introduction
The study of the distribution of residence times (RTD) in flow systems can be traced back to the pioneering work of Danckwerts [1]. In addition to the transport equations, the RTD has since been successfully applied to the design of vessels in the chemical and process industry [2]. A recent review on the subject can be found in Rodrigues [3]. The focus has traditionally been placed on the RTD of the fluid, and comparatively very little attention has been devoted to the particles that may be suspended in the flow, e.g. aerosols. In general, it has been taken for granted that the residence time distribution of the aerosol particles is the same as that of the fluid [4]. Snellman et al. [5] measured experimentally the RTD of particles in an evaporator but they did not measure the RTD of the fluid and, therefore, the widely assumed equality between the RTDs of particles and fluid was not tested.
In the last few years the author and his colleagues have undertaken a theoretical research on the RTD of aerosol particles (RTDp in the sequel) flowing in laminar regime in a circular straight tube without any constrain or disturbance of the flow. Selection of this simple geometry led to important conclusions regarding the behavior of particles suspended in a flowing fluid media. The theoretical calculation of the RTDp was carried out by computing the trajectories of the particles using the diffusion limit of Langevin’s equation. It was shown that the RTDp may substantially differ from the RTD of the fluid (RTDf hereafter), in such a manner that particles need, on average, less time to reach the tube outlet than the fluid, and this occurs in a most natural manner in the absence of any external force field acting upon the particles. It is an unavoidable consequence of the particles Brownian motion superimposed onto the deterministic motion governed by the fluid flow [6].
Laminar flow of aerosols in a tube occurs in many instances of aerosol processing and characterization, e.g. tubular reactors, electrical charging, and measurement of particle size, concentration and chemical composition [7]. The actual time spent by the particles in the tube may have a crucial effect on some properties of the aerosol: particle size and electrical charge distributions, concentration, and also chemical composition (as may occur in an aerosol of ion clusters undergoing simultaneous decomposition into smaller units and growth by attachment of water molecules or of any other chemical species present in trace amounts in the system).
In the first part of the present article, the main results obtained in our previous investigations will be summarized and discussed. In the second and final part, a comparison will be made between experimental results and those obtained through simulation of particles trajectories. All the plots to be presented in the brief review of past developments (section 2) are new. The second part of the article (section 3) has not been published before.
2. Brief Review of Previous Developments
2.1. Trajectory Simulation Method
Two approaches were followed in our previous works, namely, the numerical solution of the advection-diffusion equation (ADE), and a Monte Carlo (MC) simulation of Brownian trajectories of particles in the tube. Discussions concerning the ADE will be omitted in the present paper, which is exclusively devoted to the results obtained by the MC method.
Three types of fluid velocity profiles were considered, plug or uniform flow (UF), fully developed or parabolic flow (PF), and a stationary transition flow starting from UF at the inlet and steadily developing along the tube (TF). Depending on the operating conditions (the tube aspect ratio, a, and the Reynolds number, Re) the fluid velocity profile could eventually attain full development before the tube end but, in many other instances, it could not. The evolution along the tube of several flow-related aerosol properties was studied: penetration, residence time distribution, particle radial position distribution, and particle mean axial velocity. It was already shown in our previous investigations [6,8,9,10] that the results obtained for transition flow (TF) lied in all cases between those obtained for uniform (UF) and parabolic (PF) flow, in such a manner that UF and PF could be regarded as extreme flow types, between which the flow-related aerosol properties under any other possible fluid flow velocity profile must lie. In the present work, the results for TF will be not be considered, and attention will only be given to the two extreme flow types, UF and PF, so that the radial component of the fluid velocity vector, , is zero and only the axial component must be considered.
For the simulation of particles trajectories the following main assumptions were made:
- (i)
- steady, incompressible, axisymmetric laminar flow
- (ii)
- sufficiently dilute aerosol so as to neglect interactions among particles
- (iii)
- constant diffusion coefficient of particles
- (iv)
- time scales much larger than the particle relaxation time, i.e. negligible particle inertia: the particles attains instantaneously the local fluid velocity
- (v)
- perfectly absorbing tube wall: once a particle collides with the wall it sticks irreversibly onto it and is lost from the system, i.e. sticking probability one
- (vi)
- the tube axis behaves as a perfectly reflecting boundary
- (vii)
- no flow slip at the wall
- (viii)
- (Uniform concentration of aerosol particles at the tube entrance
There seems to be too many assumptions, in such a manner that, at first glance, one would be tempted to say that this is a mere academic exercise of little practical value. However, in the last section of the article it will be shown that the results of the theoretical model built upon this set of assumptions are in fairly good agreement with the experimental results so far reported in the literature.
In each simulation run, N particles were sequentially released from the tube inlet () with probability density , where r is the radial coordinate, and is the x-component of the fluid velocity at . During a time t the particle undergoes radial and axial displacements given by
All the variables in the above equations are dimensionless: r is referred to the tube radius, x to the tube length, and t to the mean residence time of the fluid. The velocity is referred to the mean axial fluid flow velocity, a is the tube aspect ratio (radius/length), and D is the dimensionless diffusion coefficient of the aerosol particles, given by , where L, D and Q are, respectively, the tube length, the particle diffusivity, and the aerosol flow rate through the tube, and where primes denote, as in our former papers, dimensional variables. s is a number sampled from a normal distribution of (pseudo-) random numbers of zero mean and unit variance.
If the displacements given by (1) and (2) drive the particle beyond the tube axis, , the particle is given the new radial coordinate (reflecting barrier). If the particle moves into or beyond the tube wall (absorbing barrier), it disappears from the simulation and a new one is released from the entrance of the tube. If , the surviving particle counter is increased in one unit, is taken as the particle residence time, and a new one is released from the tube inlet.
When the trajectories of the N particles have been simulated in this manner, the surviving probability (referred to as particle penetration P in the aerosol literature), and the RTDp are calculated. In contrast with our former works, in which the RTD was expressed as the distribution density, in the present one the RTD has been determined as the cumulative distribution function. To this end, particle age at the tube outlet was subdivided into 200 intervals of constant width in such a manner that the k-th interval spans particle ages between and . When the j-th particle appears at the exit of the tube after having spent a time since it was released from the inlet, the counters of all the age intervals satisfying were increased in one unit. After the trajectories of the N particles had been simulated, the counter of the k-th interval, , was divided by the maximum value among all the 200 counters, . The resulting value is , the fraction of particles which have spent a time equal or greater than to reach the tube exit. In the new simulations reported below, 10 different seeds were used for the computer built-in random number generator, and 104 particles for each seed, amounting to a total of particles per simulation. A time step was used for the calculation of particle displacements by eqs. (1) and (2) (see [11] for a justification of this selection).
2.2. Calculated Residence Time Distribution Functions and Particle Penetration
Figure 1 and Figure 2 illustrate how the RTD depends on the particle diffusivity and the tube aspect ratio for uniform and parabolic fluid velocity profiles. The RTDf, represented as a full line in the plots, is given by
The maximum fluid velocity (in dimensionless units) is 1 in UF and 2 in PF and, since the tube length is unity, the minimum residence time of the fluid is 1 in UF and 1/2 in PF.
A non-diffusive particle travels through the tube following the same fluid streamline with which it started its journey so that its radial coordinate remains constant all along its trajectory, and the RTDp must be equal to the RTDf. The equality between the two distributions when can indeed be observed in the six plots shown.
A diffusive particle behaves in a different manner. Consider first the case in which axial diffusion is negligible, which occurs when (see eq. (2)). As soon as it undergoes a random radial displacement the particle is transferred to a different streamline, which results in a different axial velocity if the fluid flow is not uniform, i.e. if depends on the spatial coordinates. Hence, the RTDp should differ from the RTDf in parabolic flow, but the two distributions should be equal for a uniform flow velocity profile. This is observed in Figure 1 and Figure 2: for (infinitely long tube) RTDp = RTDf in UF, but RTDp ≠ RTDf in PF except when . Furthermore, in UF the equality between the distributions for particles and fluid is attained no matter how large is the particle diffusivity, as long as the tube aspect ratio is 0.
For a fixed value of D, the relative contribution of axial diffusion increases with a. Figure 1 shows that even for such a small value of the effective axial diffusion coefficient as 10-4 (, ) the RTD for particles, represented as red solid circles, is slightly different from that of the fluid in UF. Differences between the RTD for particles and fluid increases with a and D for whatever type of flow.
The most important fact arising from Figure 1 and Figure 2 is perhaps that the RTDp is, in comparison with the RTDf, displaced to shorter residence times; this shift strengthens as the tube aspect ratio and/or the particle diffusivity increase.
The dependence of the first four moments of the RTDp on a and D was reported in the Supplementary Material of [11]. In the present summary of previous results, attention will be paid to the first moment alone.
In our past works we also determined the particle survival probability, i.e. the fraction of particles which do not get lost to the tube wall by diffusion and succeed to reach the tube outlet, referred to as “penetration” in the aerosol literature. Penetration, P, was determined by two methods: MC simulations of particles trajectories, and numerical solution of the advection-diffusion equation (ADE). The very good agreement between the results obtained by the two theoretical methods, in either UF or PF, was used as an indication of the goodness of the MC simulations. These two flow-related aerosol properties, RTD and penetration, are interrelated. But before entering into the discussion about how this relation emerges, it may be instructive to make a brief analysis of what can be termed “inner workings” of the aerosol diffusion process been considered here.
The dependence of the mean particle residence time distribution and its penetration on the tube aspect ratio and the particle diffusion coefficient can be explained by analyzing the evolution of other flow-related aerosol properties, as discussed in [8,9]. In those papers, we studied the particle radial position distribution and the mean axial velocity of the particles, and how these aerosol properties evolved along the tube. Instead of repeating the discussion, two new parameters have been considered in the present work, and , discussed next.
A particle undergoes a sequence of discrete displacements of variable lengths and , given by (1) and (2), each displacement taking place during a constant lapse of time . The particle thus occupies a sequence of radial positions and execute a series of axial displacements along its trajectory, with , being the total number of discrete displacements that the particle has needed to reach the tube exit (recall that if a particle hits the wall it remains attached to it and disappears from the calculations). The values of and averaged over the trajectories were determined at the end of each simulation run. The results obtained for these averages are shown separately in the two panels of Figure 3. The simulation results obtained for the mean particle residence time and the particle penetration through the tube are plotted in the two panels of Figure 4. Figure 3 is intended to illustrate the “inner workings” of the process, whereas Figure 4 gives the final, measurable outputs.
It is important to note first that non-diffusive particles follow the deterministic motion driven by the fluid flow field. When , , so that , i.e. the particle has a constant radial coordinate along its trajectory, that with which it entered into the tube. The mean initial radial coordinate of the particles is the mean of the distribution whose density is given by . Noting that for UF, and for PF, the following result is obtained:
Similarly, equation (2) leads to
because by definition, and the time step is constant and equal to 0.001 (see section 2.1). The simulation results shown in Figure 3 agree with the expectations given in (5) and (6).
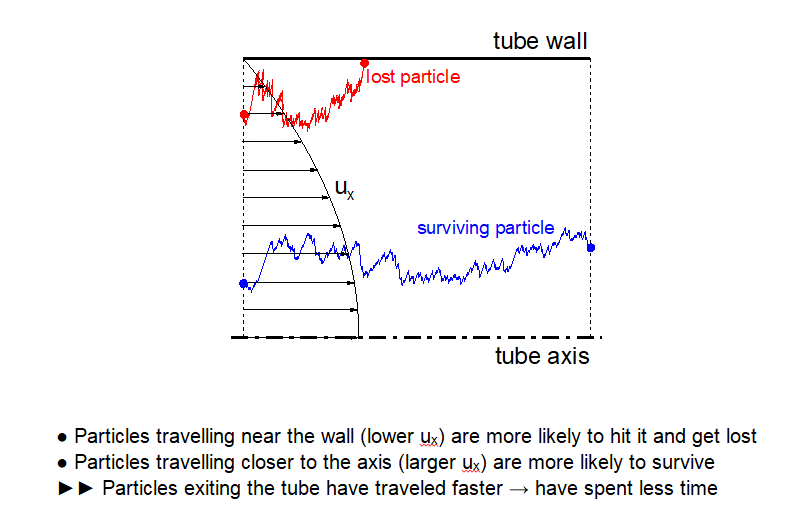
Consider first the trends shown by the mean particle radial position along its trajectory, averaged over all the particles released from the tube inlet, . (Since there are no interactions among particles, it makes no difference to speak of N particles undergoing individual trajectories, or of N trajectories of one and the same particle.) For a fixed value of a, decreases with D, reaching an asymptotic constant value beyond D ~ 0.3. This decrease is caused by the presence of an absorbing boundary in the system, the tube wall. Particles traveling near the wall are more prone to be driven towards it by radial diffusion and, hence, more likely to be lost from the flowing aerosol system. On the contrary, particles moving far from the absorbing barrier have a higher probability to survive, i.e. a larger value of P. The presence of the absorbing boundary, and not any sort of fictitious driving force acting on the particles, is the reason why they tend to accumulate in regions closer to the tube axis. On its part, particle axial diffusion plays an indirect role on the behavior of (see the last part of the following paragraph).
Consider now the other “inner” parameter, the mean length of the axial displacement, . While radial diffusion plays no role in UF because the fluid local velocity is constant everywhere, it must be taken into account in any other flow type, e.g. PF: as soon as the particle radial coordinate changes due to a radial random displacement, its axial velocity also changes and so it does the local axial displacement . But also depends on the strength of axial diffusion through the last term in (2); this second contribution to also occurs for UF. Since diffusion is an isotropic process, one would expect, in principle, that axial diffusion should have no effect on because, on average, the net axial displacement due to axial diffusion should vanish. But here, again, the presence of the absorbing wall boundary makes a difference. Particles which, on average, suffer more negative random axial displacements (i.e. directed towards the tube entrance) than positive ones, need a larger number of displacements to reach the tube exit, i.e. larger . A larger number of displacements of the particle means more likelihood to be driven, by radial diffusion, towards the absorbing wall, i.e., to a smaller survival probability P. The result is that the surviving particles will more likely be those which have undergone larger and positive axial displacements. And this effect must be enhanced by larger particle diffusivities, so that must increase with D, what is indeed observed in the right panel of Figure 3. As the tube aspect ratio a increases, so does the effective axial diffusion coefficient (see eq, (2)), and must correspondingly increase. The just discussed effect of axial diffusion on particle survival probability is the reason why slightly increases with a for a fixed value of D (see left panel in Figure 3). We have seen that, indeed, particles with higher values of penetration are those which need less number of displacements to reach the exit, i.e. they spend less time in the tube (less ) and, therefore, their chances to further accumulate closer to the wall are smaller.
The preceding two paragraphs have shown the intimate connection between the inner working parameters (, ) and the measurable outputs (, ). Altogether they form a coherent picture of the laminar flow of diffusive aerosols in a tube.
3. Comparison with Experimental Results
3.1. Particle Penetration
Three sets of experimental data of aerosol penetration through a tube in laminar regime are available. Ramamurthi et al. [13] measured the penetration of a 218PoOx cluster aerosol in a tube. In their experiments, tubes with 1.1 cm inner radius and lengths 8.8, 20.5 and 31.7 cm were used. The mean aerosol velocities in the tube were 39.1 and 64.9 cm/s. However, no care was taken to assure that the fluid flow in the tube was either uniform or parabolic and, in fact, no discussion about the actual flow type was provided. Comparison of their experimental measurements with the results obtained by MC simulations, using their reported data for geometrical and operating conditions, reveals that the type of flow in their experiments most probably lied between UF and PF, but in the absence of any further information it is not possible to draw definite conclusions or to make a quantitative comparison with the simulation results.
Otani et al. [14] measured tube penetration of Ag and NaCl particles with mobility-equivalent diameters between 0.5 and 10 nm using tubes with lengths 50, 100 and 200 cm, fixed inner diameter of 0.3 cm, and flow rates between 1 and 3 l/min. They took care that the flow in the tube was fully developed (PF) by connecting the entrance of the test tube to another tube of the same diameter and 20 cm long. They made measurements of penetration under different combinations of the tube aspect ratio a and the dimensionless diffusion coefficient D. Unfortunately, their experimental data were presented in a plot of P vs D with no indication of what was the specific value of a for any of the data points plotted. In these circumstances, it is not possible to compare their results with our simulations.
The third set of data was provided by the present author and his colleagues [15]. We used NaCl and Ag particles generated by the evaporation-condensation method, as well as air ions generated by a radioactive source of 241Am. The mobility-equivalent diameter of the test particles ranged between 2 and 6 nm. Aerosol flow rate through the tube was varied between 0.4 and 3.0 l/min. Penetration through a tube of length 100 cm was determined by comparing the particle number concentrations measured at the outlet of two circular straight tubes of lengths 100 and 120 cm, and inner diameter of 0.2 cm. We thus took care that the flow in the test tube was fully developed. The tube aspect ratio was fixed (), and only D was varied (between about 0.01 and 0.5). However, this is the only past work on particle penetration through a tube with which our present MC simulations can be compared. The result of the comparison, shown in Figure 5, is satisfactory.
3.2. Residence Time Distribution of Particles
The first, and only one to date, experimental RTD of aerosol particles in a tube has been published very recently by Perez-Lorenzo et al. [16]. Their experiments were aimed at determining the decomposition kinetics of a relatively large ion cluster using a tube between two differential mobility analyzers (DMA). The first DMA, run in pulse mode, provided clusters with definite electrical mobility and the second DMA was used to measure the time of flight of the selected ions in the tube. Time of flight, in this case, is equivalent to residence time of the clusters in the tube between the two DMAs. The experimentally measured RTD curve provided by the authors can be compared with MC calculations which have been carried out in the present work for the specific conditions of their experiment.
They used a tube of radius 2.225 mm and length 31 cm; the tube aspect ratio is thus . There is one more dimensionless variable, the cluster diffusivity, needed to perform the MC calculations. They did not report explicitly the diffusion coefficient of the cluster ions, but it can be inferred from other data reported in their paper; the dimensionless tube length in their experiments was , and from their definition of dimensionless axial coordinate and the given value of the aerosol flow rate, 0.6 l/min, the diffusion coefficient of the clusters results to be 0.0066 cm2/s which yields a dimensionless diffusivity of . The MC calculated RTDp is presented in Figure 6 along with their experimental data and the theoretical RTDf.
The MC curve reproduces reasonably well the experimental data though its final decay is not as fast. The two curves, experimental and MC, are quite different from that of the fluid. The latter decays much more slowly. The experiments of Perez-Lorenzo et al. have shown beyond any doubt that, in general, the RTD of the suspended particles is very different from that of the fluid.
According to the data displayed in Figure 6, the median of the RTD (the value of t at which ) from experiments and from MC simulation coincide: it is ~0.65 in both cases. In comparison, the median time for the fluid is , slightly larger than for the particles. Differences between fluid and particles are more significant in the case of the first moment of the RTD. The mean residence time of the fluid is, by definition, 1. For the MC simulations, the mean residence time has been taken as the arithmetic mean of the ages of all the particles that succeeded to exit the tube. The first moment of the RTD has been determined from the experimental data by numerical calculation of the integral
using central differences for dF; it results a value of 0.68. The corresponding mean particle residence time obtained from MC simulations was 0.70, which also coincides with the value calculated with the correlation proposed in [11].
The second moment of the RTD was also determined. The second and higher order moments for the fluid diverge. Table 1 summarizes the results found in the present work.
In the experimental work [16], or, in terms of the Peclet number (see [11]), . Under these conditions, axial diffusion of the clusters is negligible and only diffusion in the perpendicular direction to the fluid flow affects the RTD.
The comparison between experiment and theory has been restricted to a single case because, to the author’s knowledge, there is no other experimental RTD available at present. Experimental RTDs for other values of the particle diffusivity D and the tube aspect ratio a are needed to confirm the real validity of the numerical simulations we have been carried out in the last few years. The main lesson to be learned from the present study is, perhaps, that the RTD of the particles may considerably differ from that of the fluid where they are suspended in and, in particular, that the mean residence of the particles may be much shorter than formerly thought. The experiments of Perez-Lorenzo et al. [16] have demonstrated beyond any doubt that this is indeed the case.
4. Conclusions
Simulation of particles trajectories using the diffusion limit of Langevin’s equation constitutes an easy and reliable method to determine flow-related aerosol properties in a laminar flow tube. Deposition of particles on the tube wall by radial diffusion has two main effects on the surviving particles: induces their average drift towards the tube axis and, in conjunction with axial diffusion, promotes an increase in their mean axial velocity. The consequence is that the particle residence time distribution shifts to smaller times.
Author Contributions
Writing, Software, Methodology, Investigation, Conceptualization, Data analysis.
Funding
This work received no specific funding.
Data Availability Statement
The original contributions presented in this study are included in the article. Further inquiries can be directed to the corresponding author.
Conflicts of Interest
The author declares that he has no known competing financial interest or personal relationships that could have appeared to influence the work reported in this paper.
References
- Danckwerts, P.V. Continuous Flow Systems. Distribution of Residence Times. Chem. Eng. Sci. 1953, 2, 1–18. [Google Scholar] [CrossRef]
- Levenspiel, O. Chemical Reaction Engineering, 3rd ed.; Wiley: New York, 1999. [Google Scholar]
- Rodrigues, A.E. Residence Time Distribution (RTD) Revisited. Chem. Eng. Sci. 2021, 230, 116188. [Google Scholar] [CrossRef] [PubMed]
- Singh, R.K.; Wang, C.; Xu, Z. Residence Time Distribution in a Structured Packing Unit for Monitoring Aerosol Emissions. Int. J. Greenh. Gas. Control 2018, 79, 181–192. [Google Scholar] [CrossRef]
- Snellman, M.; Eom, N.; Messing, M.E.; Deppert, K. A Thermal Evaporator for Aerosol Core-Shell Nanoparticle Synthesis. J. Aerosol Sci. 2024, 175, 106276. [Google Scholar] [CrossRef]
- Alonso, M.; Carsí, M.; Alguacil, F.J. Residence Time Distribution of Ultrafine Aerosol Particles in a Tube with Transient and Parabolic Laminar Flow. J. Aerosol Sci. 2023, 174, 106231. [Google Scholar] [CrossRef]
- Baron, P.A.; Willeke, K. (Eds.) Aerosol Measurement: Principles, Techniques, and Applications; Wiley Interscience, 2001. [Google Scholar]
- Alguacil, F.J.; Alonso, M. The Motion of Brownian Particles Suspended in a Non-Uniform Fluid Flow. J. Aerosol Sci. 2024, 179, 106382. [Google Scholar] [CrossRef]
- Alonso, M. Evolution of Some Flow-Related Properties of Diffusive Aerosols along a Tube. J. Aerosol Sci. 2024, 181, 106428. [Google Scholar] [CrossRef]
- Alonso, M. Diffusional Penetration of Aerosols Through a Tube: Comparison between Monte Carlo Simulation of Brownian Particle Trajectory and the Numerical Solution of the Advection-Diffusion Equation. Chem. Eng. Sci. 2025, 302, 120942. [Google Scholar] [CrossRef]
- Alonso, M.; Alguacil, F.J.; Borra, J.P. The Role of the Peclet Number in the Diffusion Process of Aerosols in a Tube and Correlations to Estimate the Mean Particle Residence Time. J. Aerosol Sci. 2026, 192, 106737. [Google Scholar] [CrossRef]
- Gormley, P.G.; Kennedy, M. Diffusion from a Stream Flowing through a Cylindrical Tube. Proc. R. Ir. Acad. 1949, 52A, 163–169. [Google Scholar]
- Ramamurthi, M.; Strydom, R.; Hopke, P.K. Assesment of Wire and Tube Penetration Theories Using a 218PoOx Cluster Aerosol. J. Aerosol Sci. 1990, 21, 203–211. [Google Scholar] [CrossRef]
- Otani, Y.; Emi, H.; Cho, S.J.; Namiki, N. Generation of Nanometer Size Particles and their Removal from Air. Adv. Powder Technol. 1995, 4, 271–281. [Google Scholar] [CrossRef]
- Alonso, M.; Kousaka, Y.; Hashimoto, T.; Hashimoto, N. Penetration of Nanometer-Sized Aerosol Particles through Wire Screen and Laminar Flow Tube. Aerosol Sci. Technol. 1997, 27, 471–480. [Google Scholar] [CrossRef]
- Perez-Lorenzo, L.J.; Luebbert, C.; Higuera, F.J.; Fernandez de la Mora, J. Time of Flight Studies of Cluster Reaction-Diffusion in Parabolic Flow Reactor Tubes. J. Aerosol Sci. 2026, 193, 106759. [Google Scholar] [CrossRef]
Figure 1.
Examples of RTD functions for uniform (plug) flow (UF) at three different values of the tube aspect ratio, a, and several values of the dimensionless diffusion coefficient of the particles, D.
Figure 1.
Examples of RTD functions for uniform (plug) flow (UF) at three different values of the tube aspect ratio, a, and several values of the dimensionless diffusion coefficient of the particles, D.
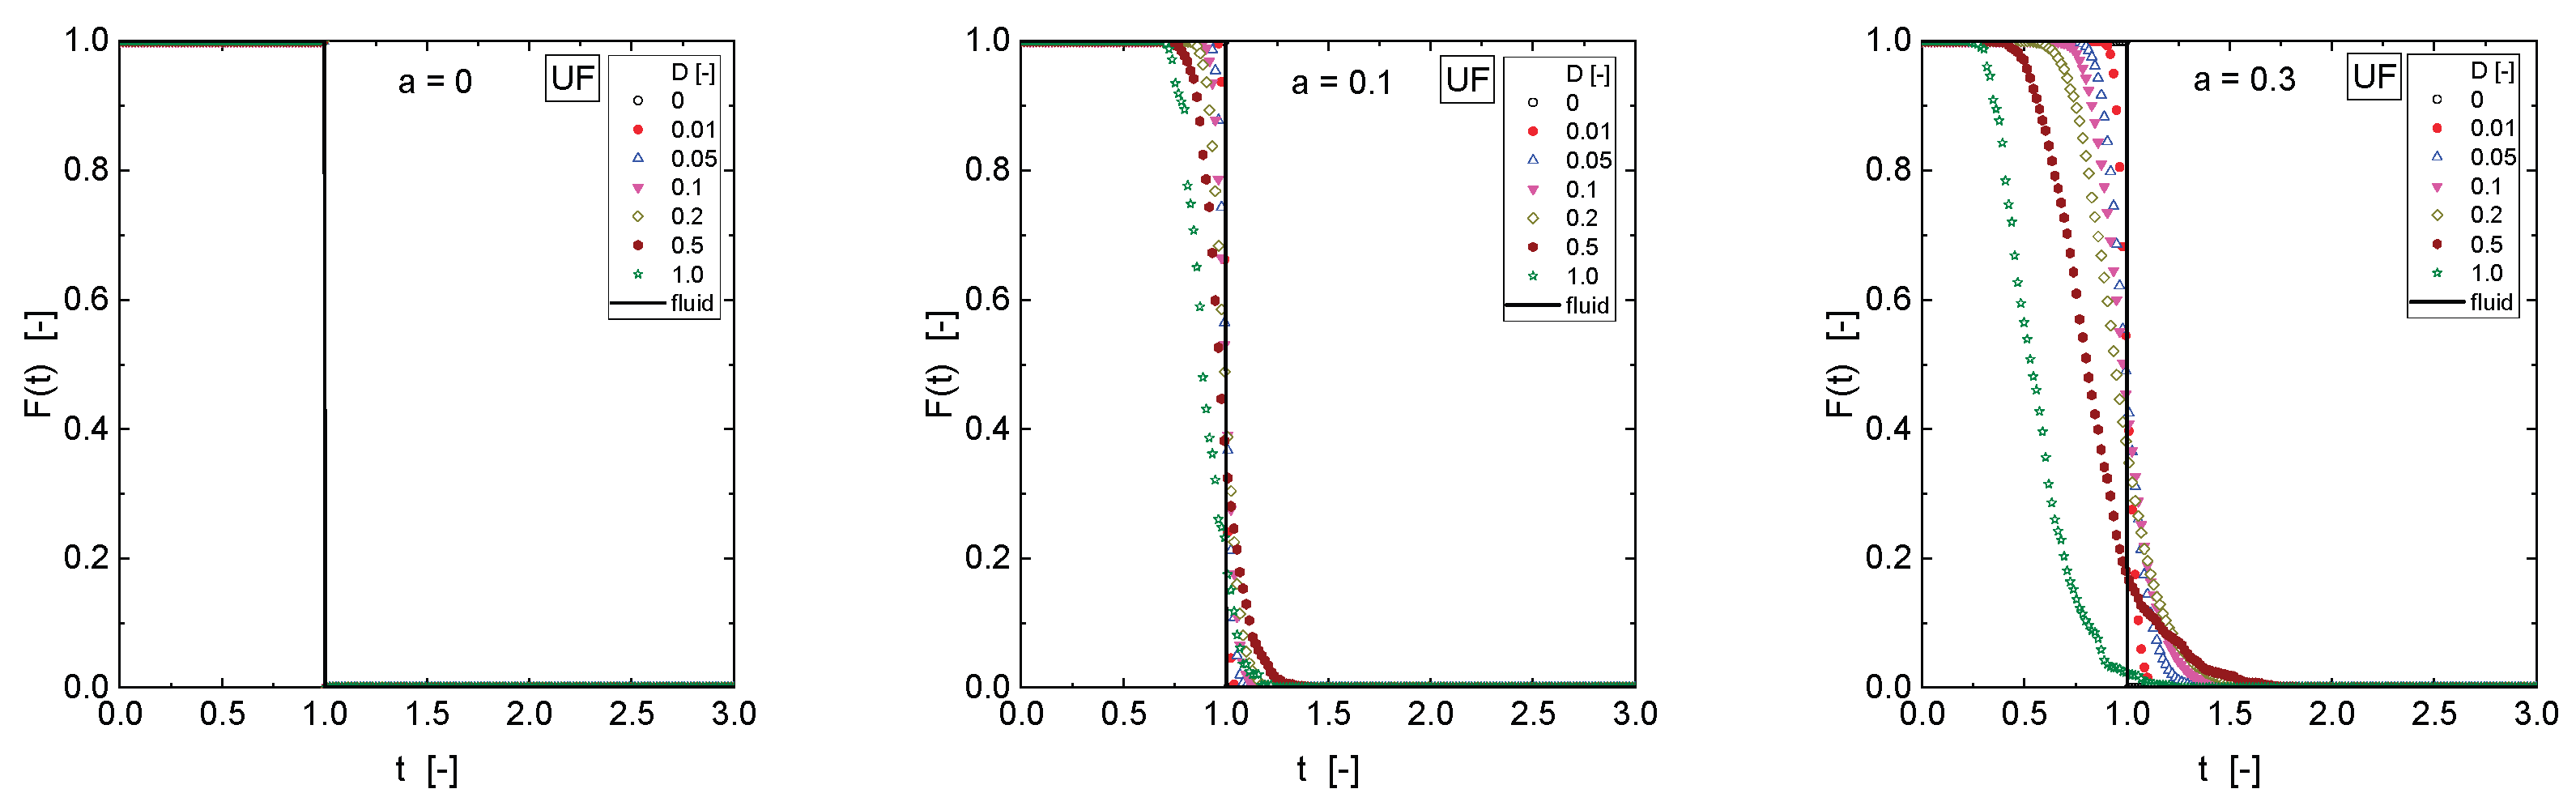
Figure 2.
Examples of RTD functions for parabolic flow (PF) at three different values of the tube aspect ratio, a, and several values of the dimensionless diffusion coefficient of the particles, D.
Figure 2.
Examples of RTD functions for parabolic flow (PF) at three different values of the tube aspect ratio, a, and several values of the dimensionless diffusion coefficient of the particles, D.
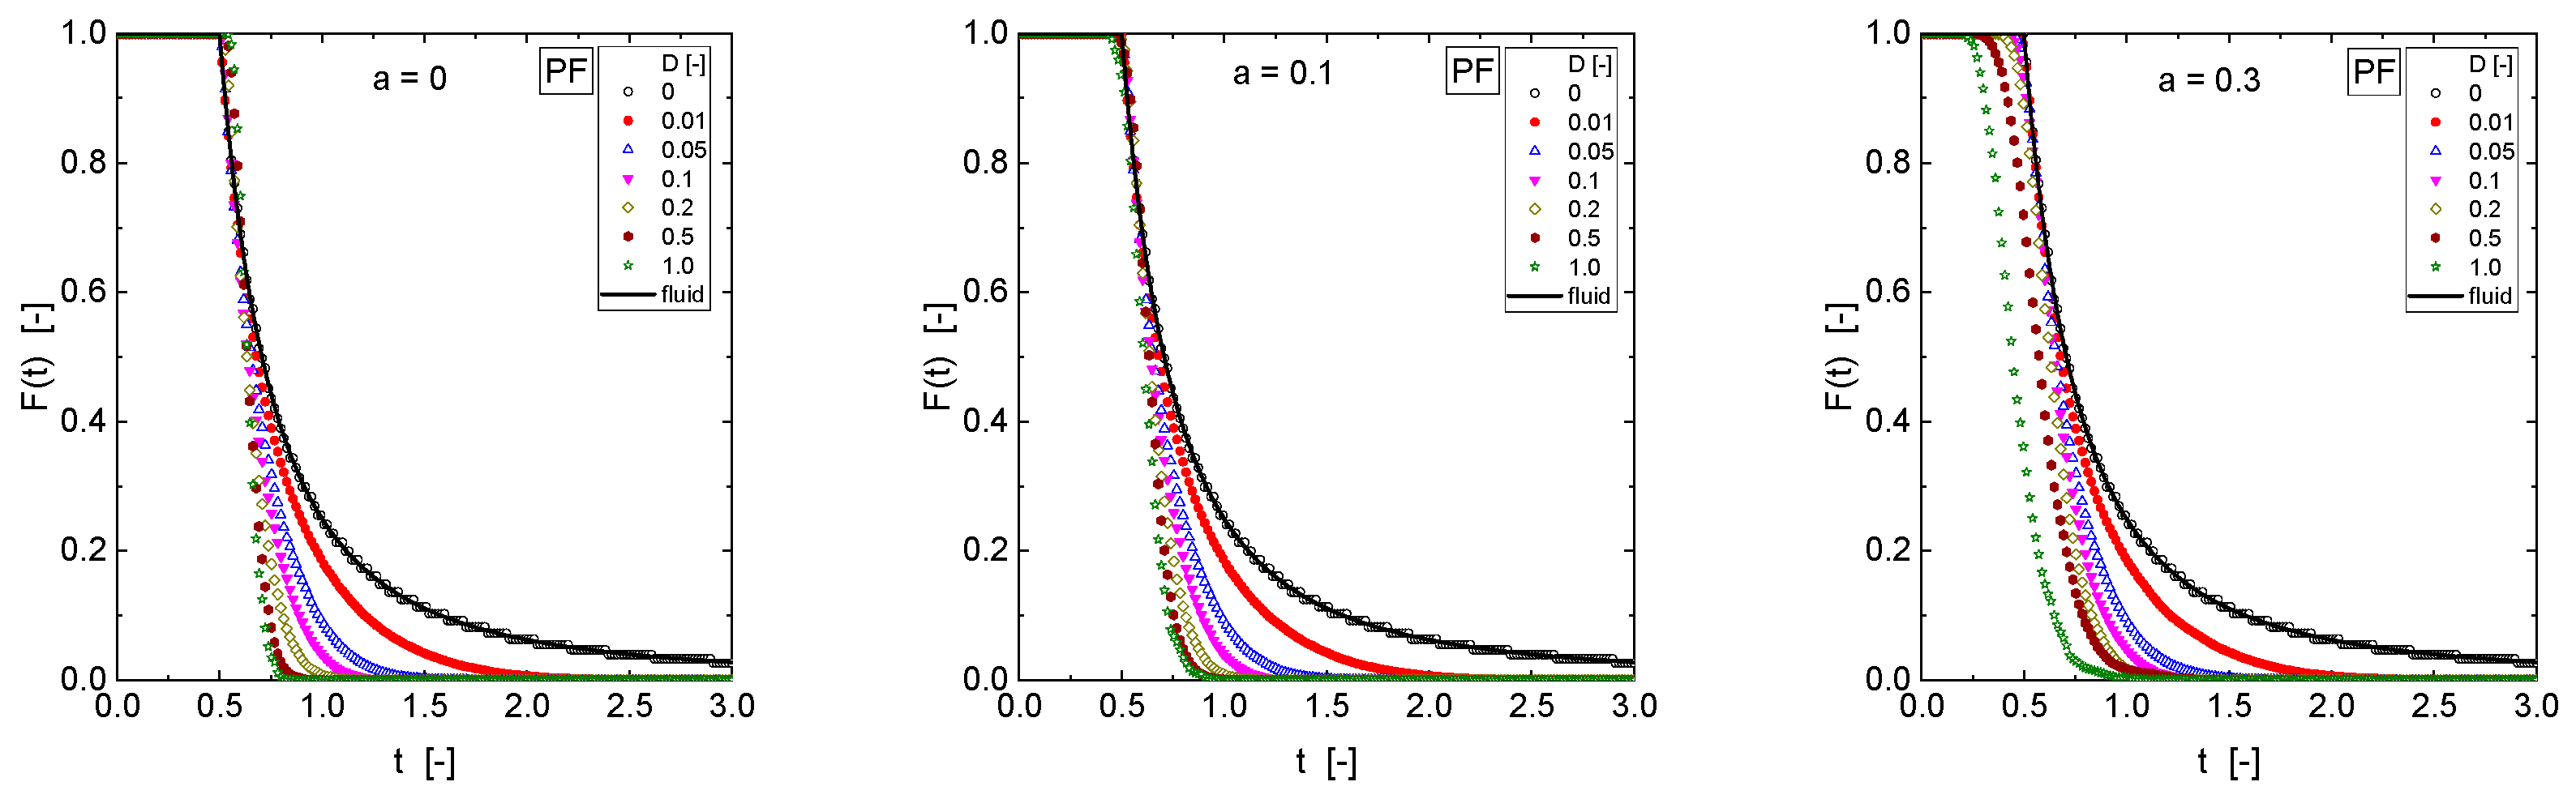
Figure 3.
Mean radial position and mean axial displacement of the particles as a function of the tube aspect ratio (a) and the particle diffusion coefficient (D) for uniform (UF) and parabolic (PF) flows.
Figure 3.
Mean radial position and mean axial displacement of the particles as a function of the tube aspect ratio (a) and the particle diffusion coefficient (D) for uniform (UF) and parabolic (PF) flows.
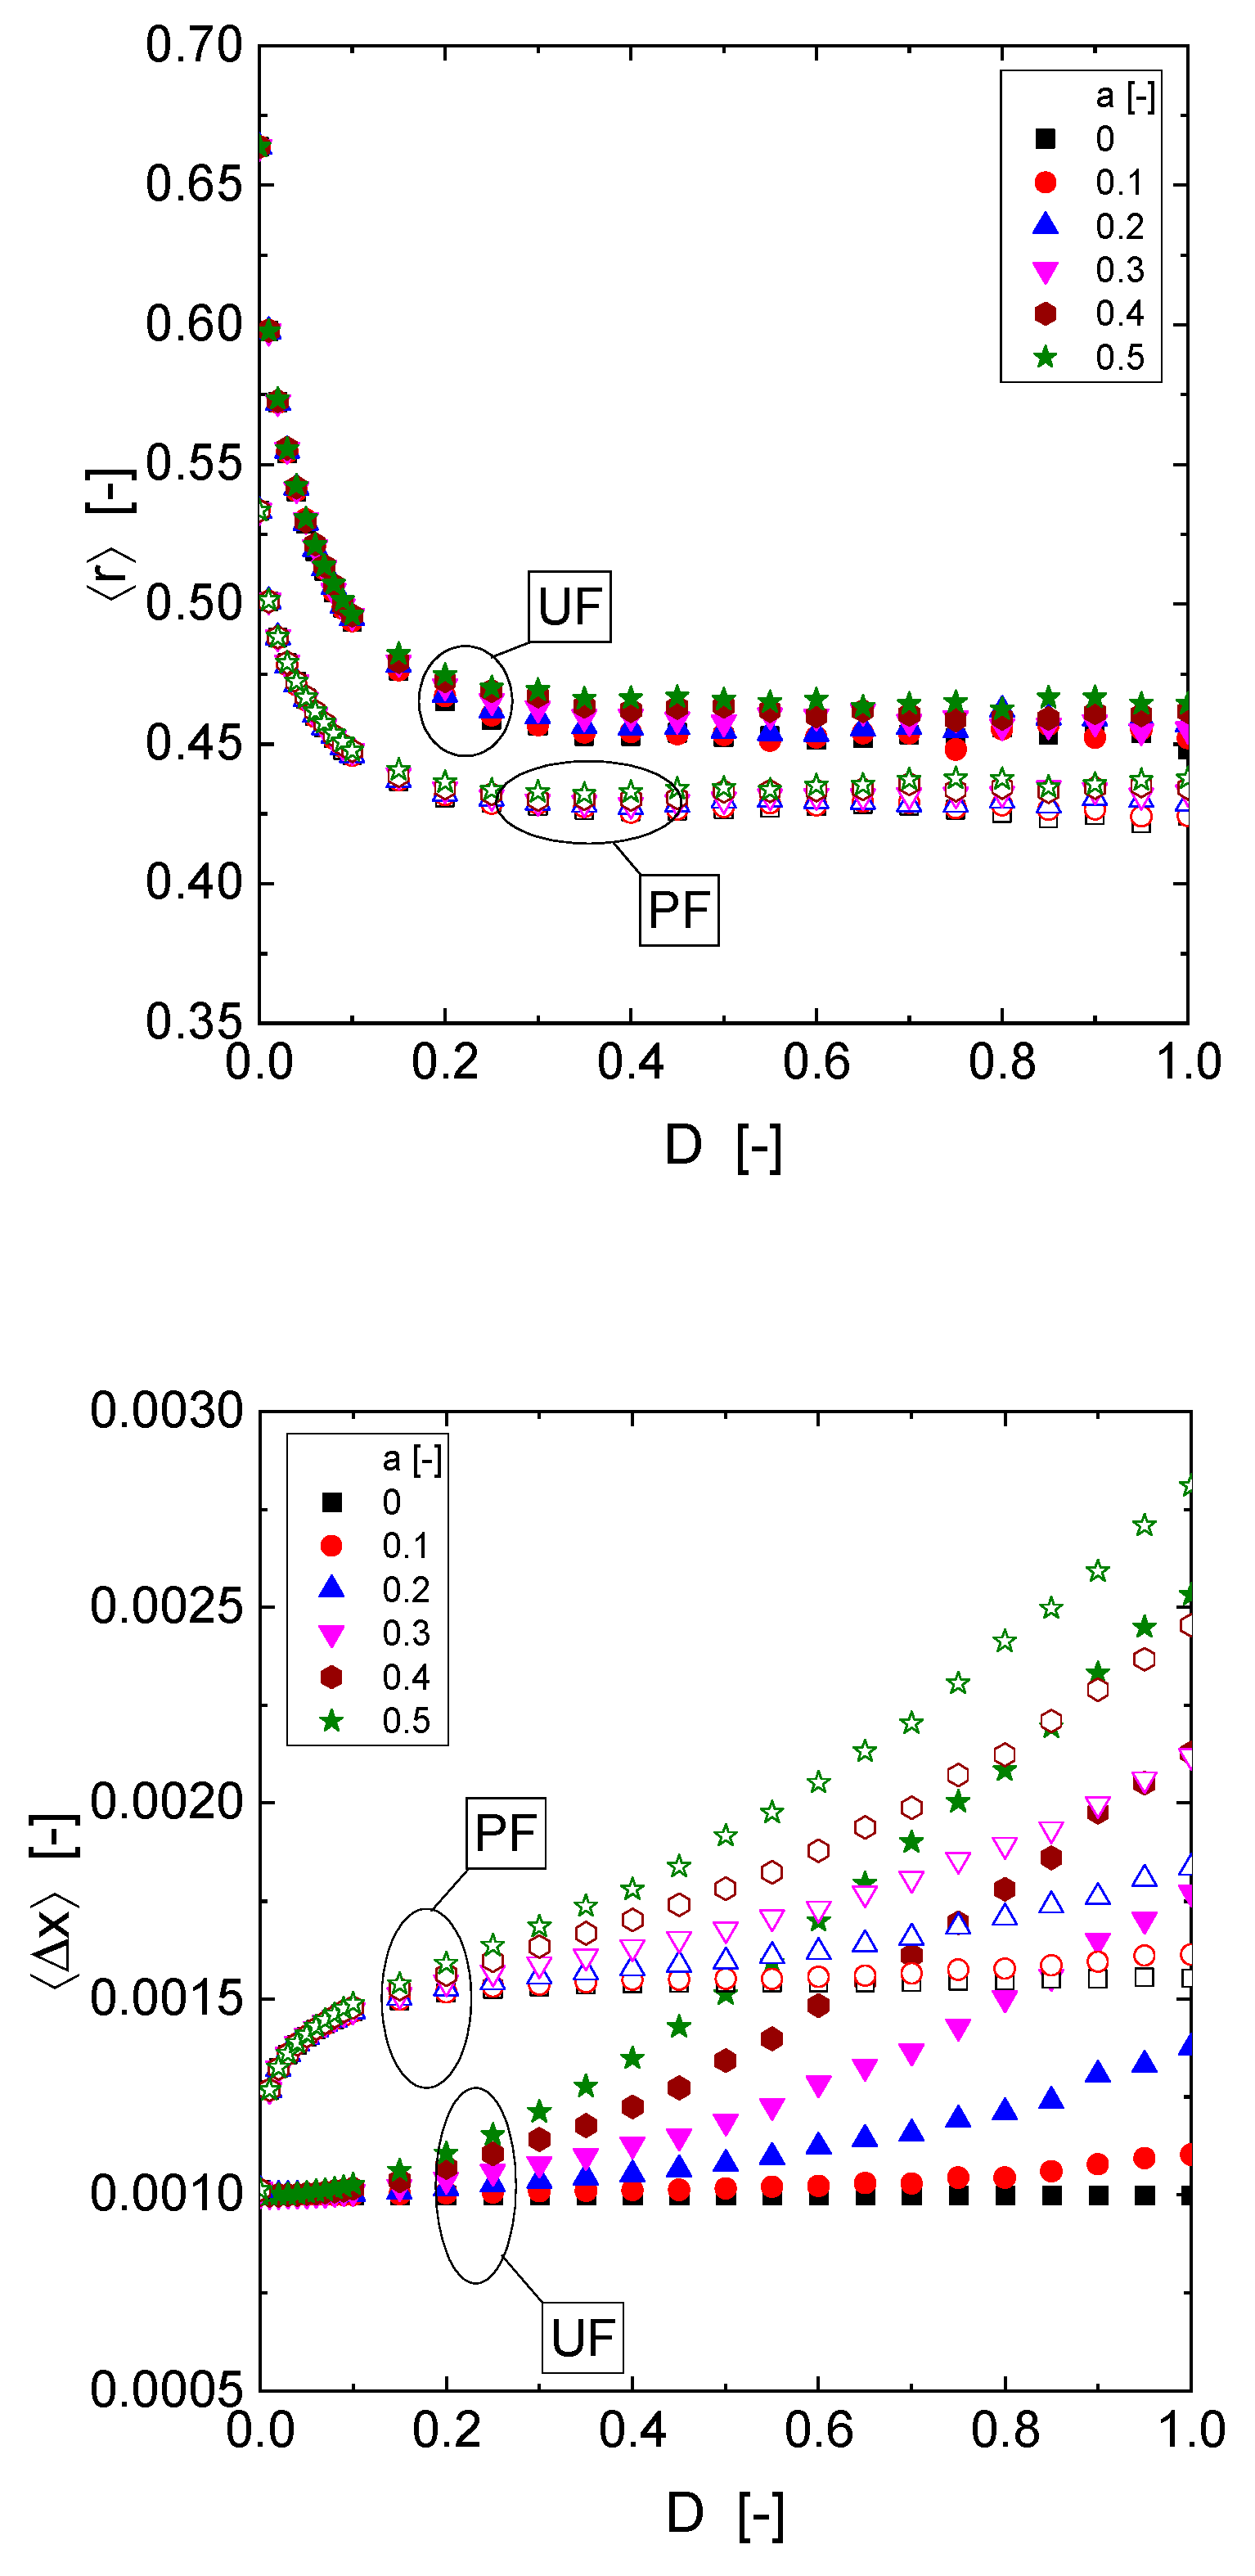
Figure 4.
Particle penetration through the tube and mean particle residence time as a function of the tube aspect ratio (a) and the dimensionless particle diffusion coefficient (D) obtained by Monte Carlo simulation of particles trajectories. The solid line in the left panel, labeled as GK, was determined with the series solution of Gormley and Kennedy [12], which is exclusively valid for parabolic fluid flow and no axial diffusion. The lines (thick for UF, dashed for PF) in the right panel were calculated with the correlations proposed in [11].
Figure 4.
Particle penetration through the tube and mean particle residence time as a function of the tube aspect ratio (a) and the dimensionless particle diffusion coefficient (D) obtained by Monte Carlo simulation of particles trajectories. The solid line in the left panel, labeled as GK, was determined with the series solution of Gormley and Kennedy [12], which is exclusively valid for parabolic fluid flow and no axial diffusion. The lines (thick for UF, dashed for PF) in the right panel were calculated with the correlations proposed in [11].
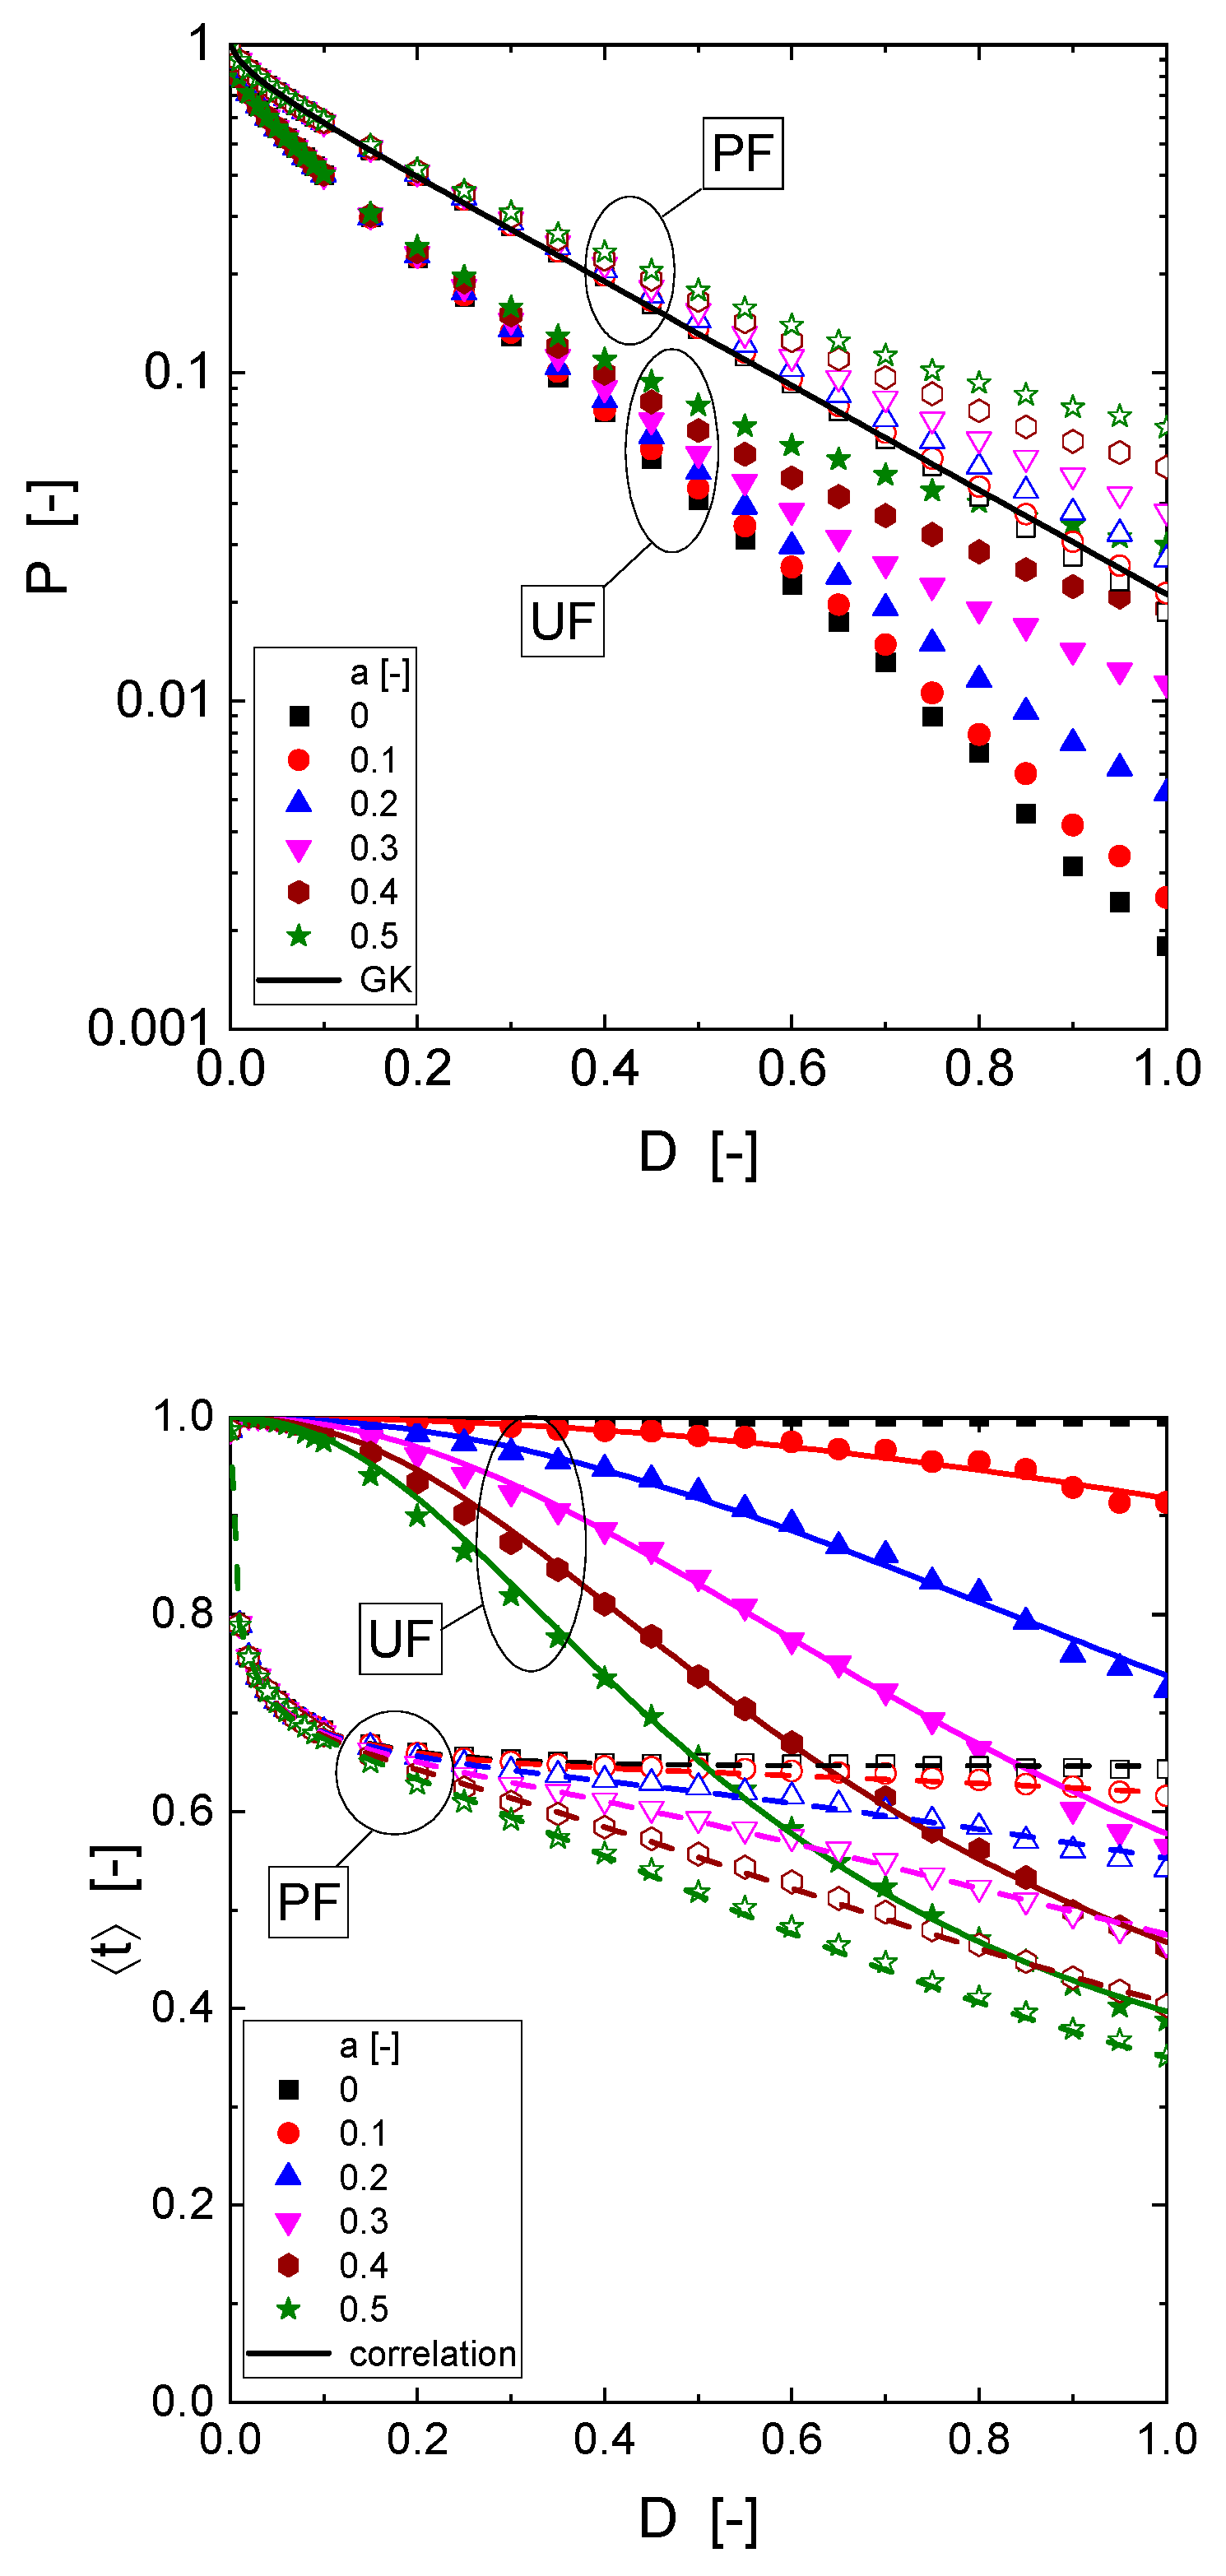
Figure 5.
Comparison of experimental results of aerosol penetration through a tube with numerical calculations using the MC simulation of particles trajectories. Experimental data taken from [15].
Figure 5.
Comparison of experimental results of aerosol penetration through a tube with numerical calculations using the MC simulation of particles trajectories. Experimental data taken from [15].
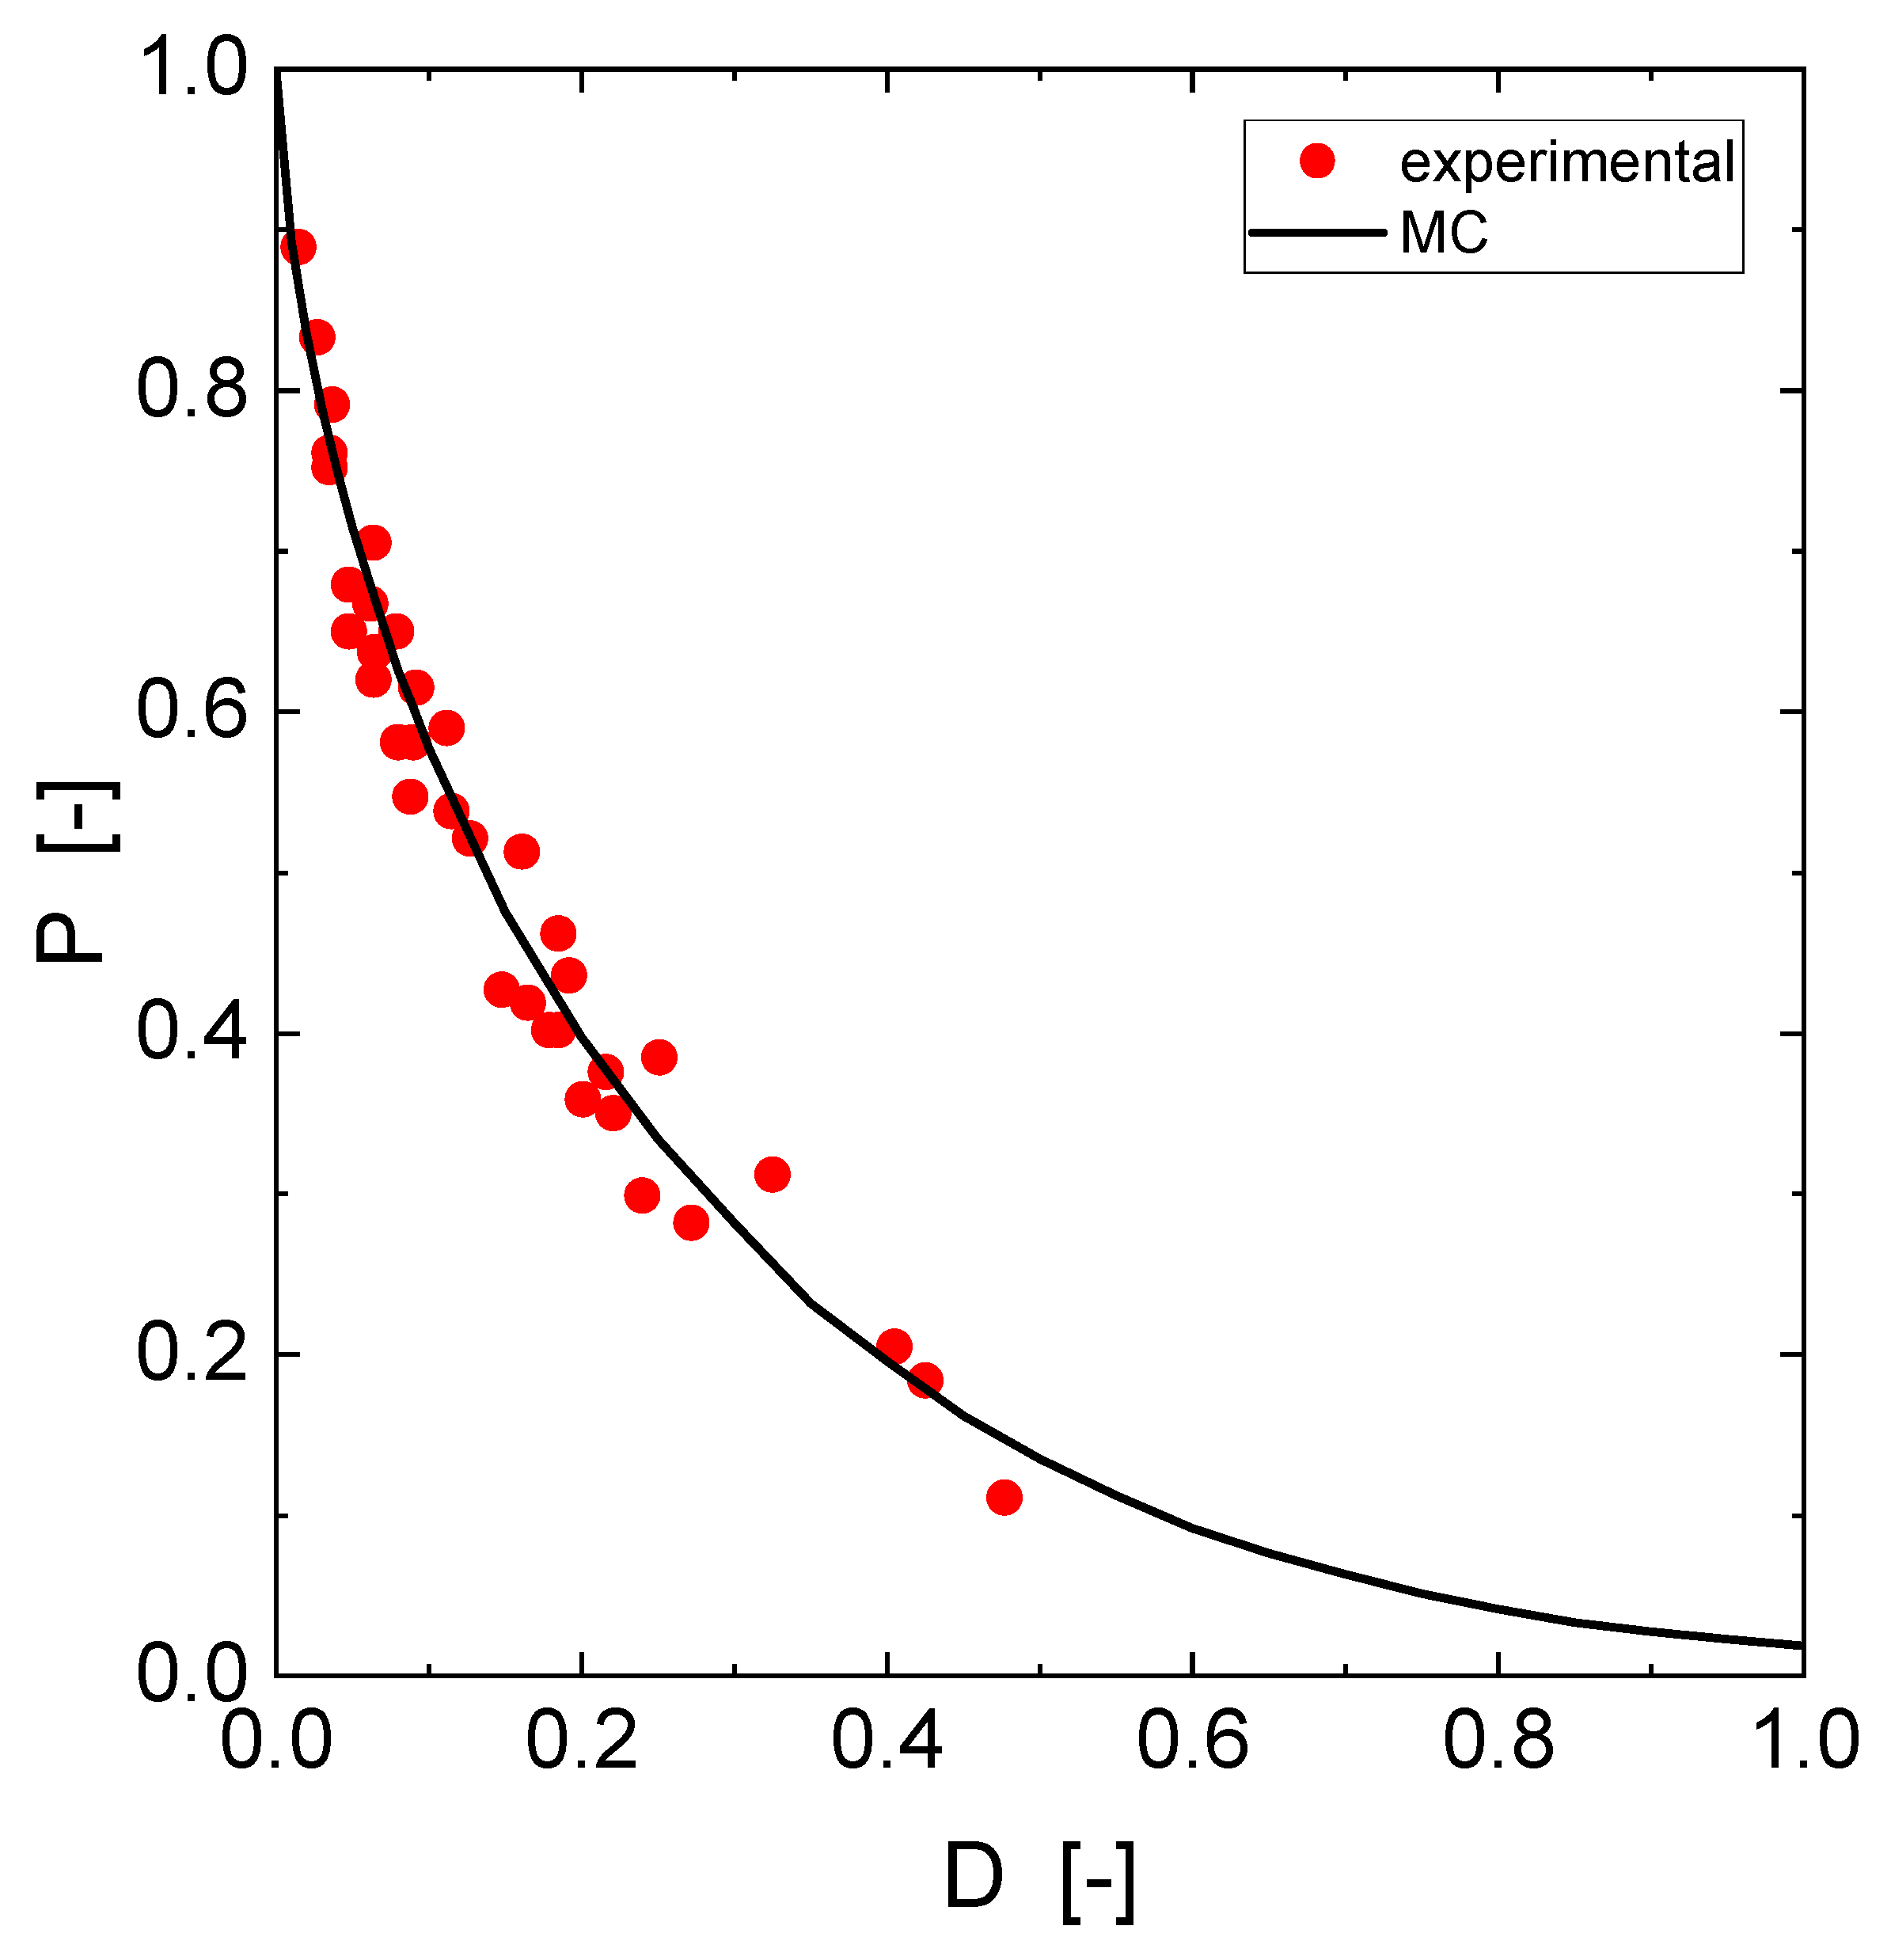
Figure 6.
The RTD for particles and fluid. The experimental data points were taken from [16]. The Monte Carlo curve represents the results obtained from MC simulation with and . The curve for the fluid was calculated with eq. (4).
Figure 6.
The RTD for particles and fluid. The experimental data points were taken from [16]. The Monte Carlo curve represents the results obtained from MC simulation with and . The curve for the fluid was calculated with eq. (4).
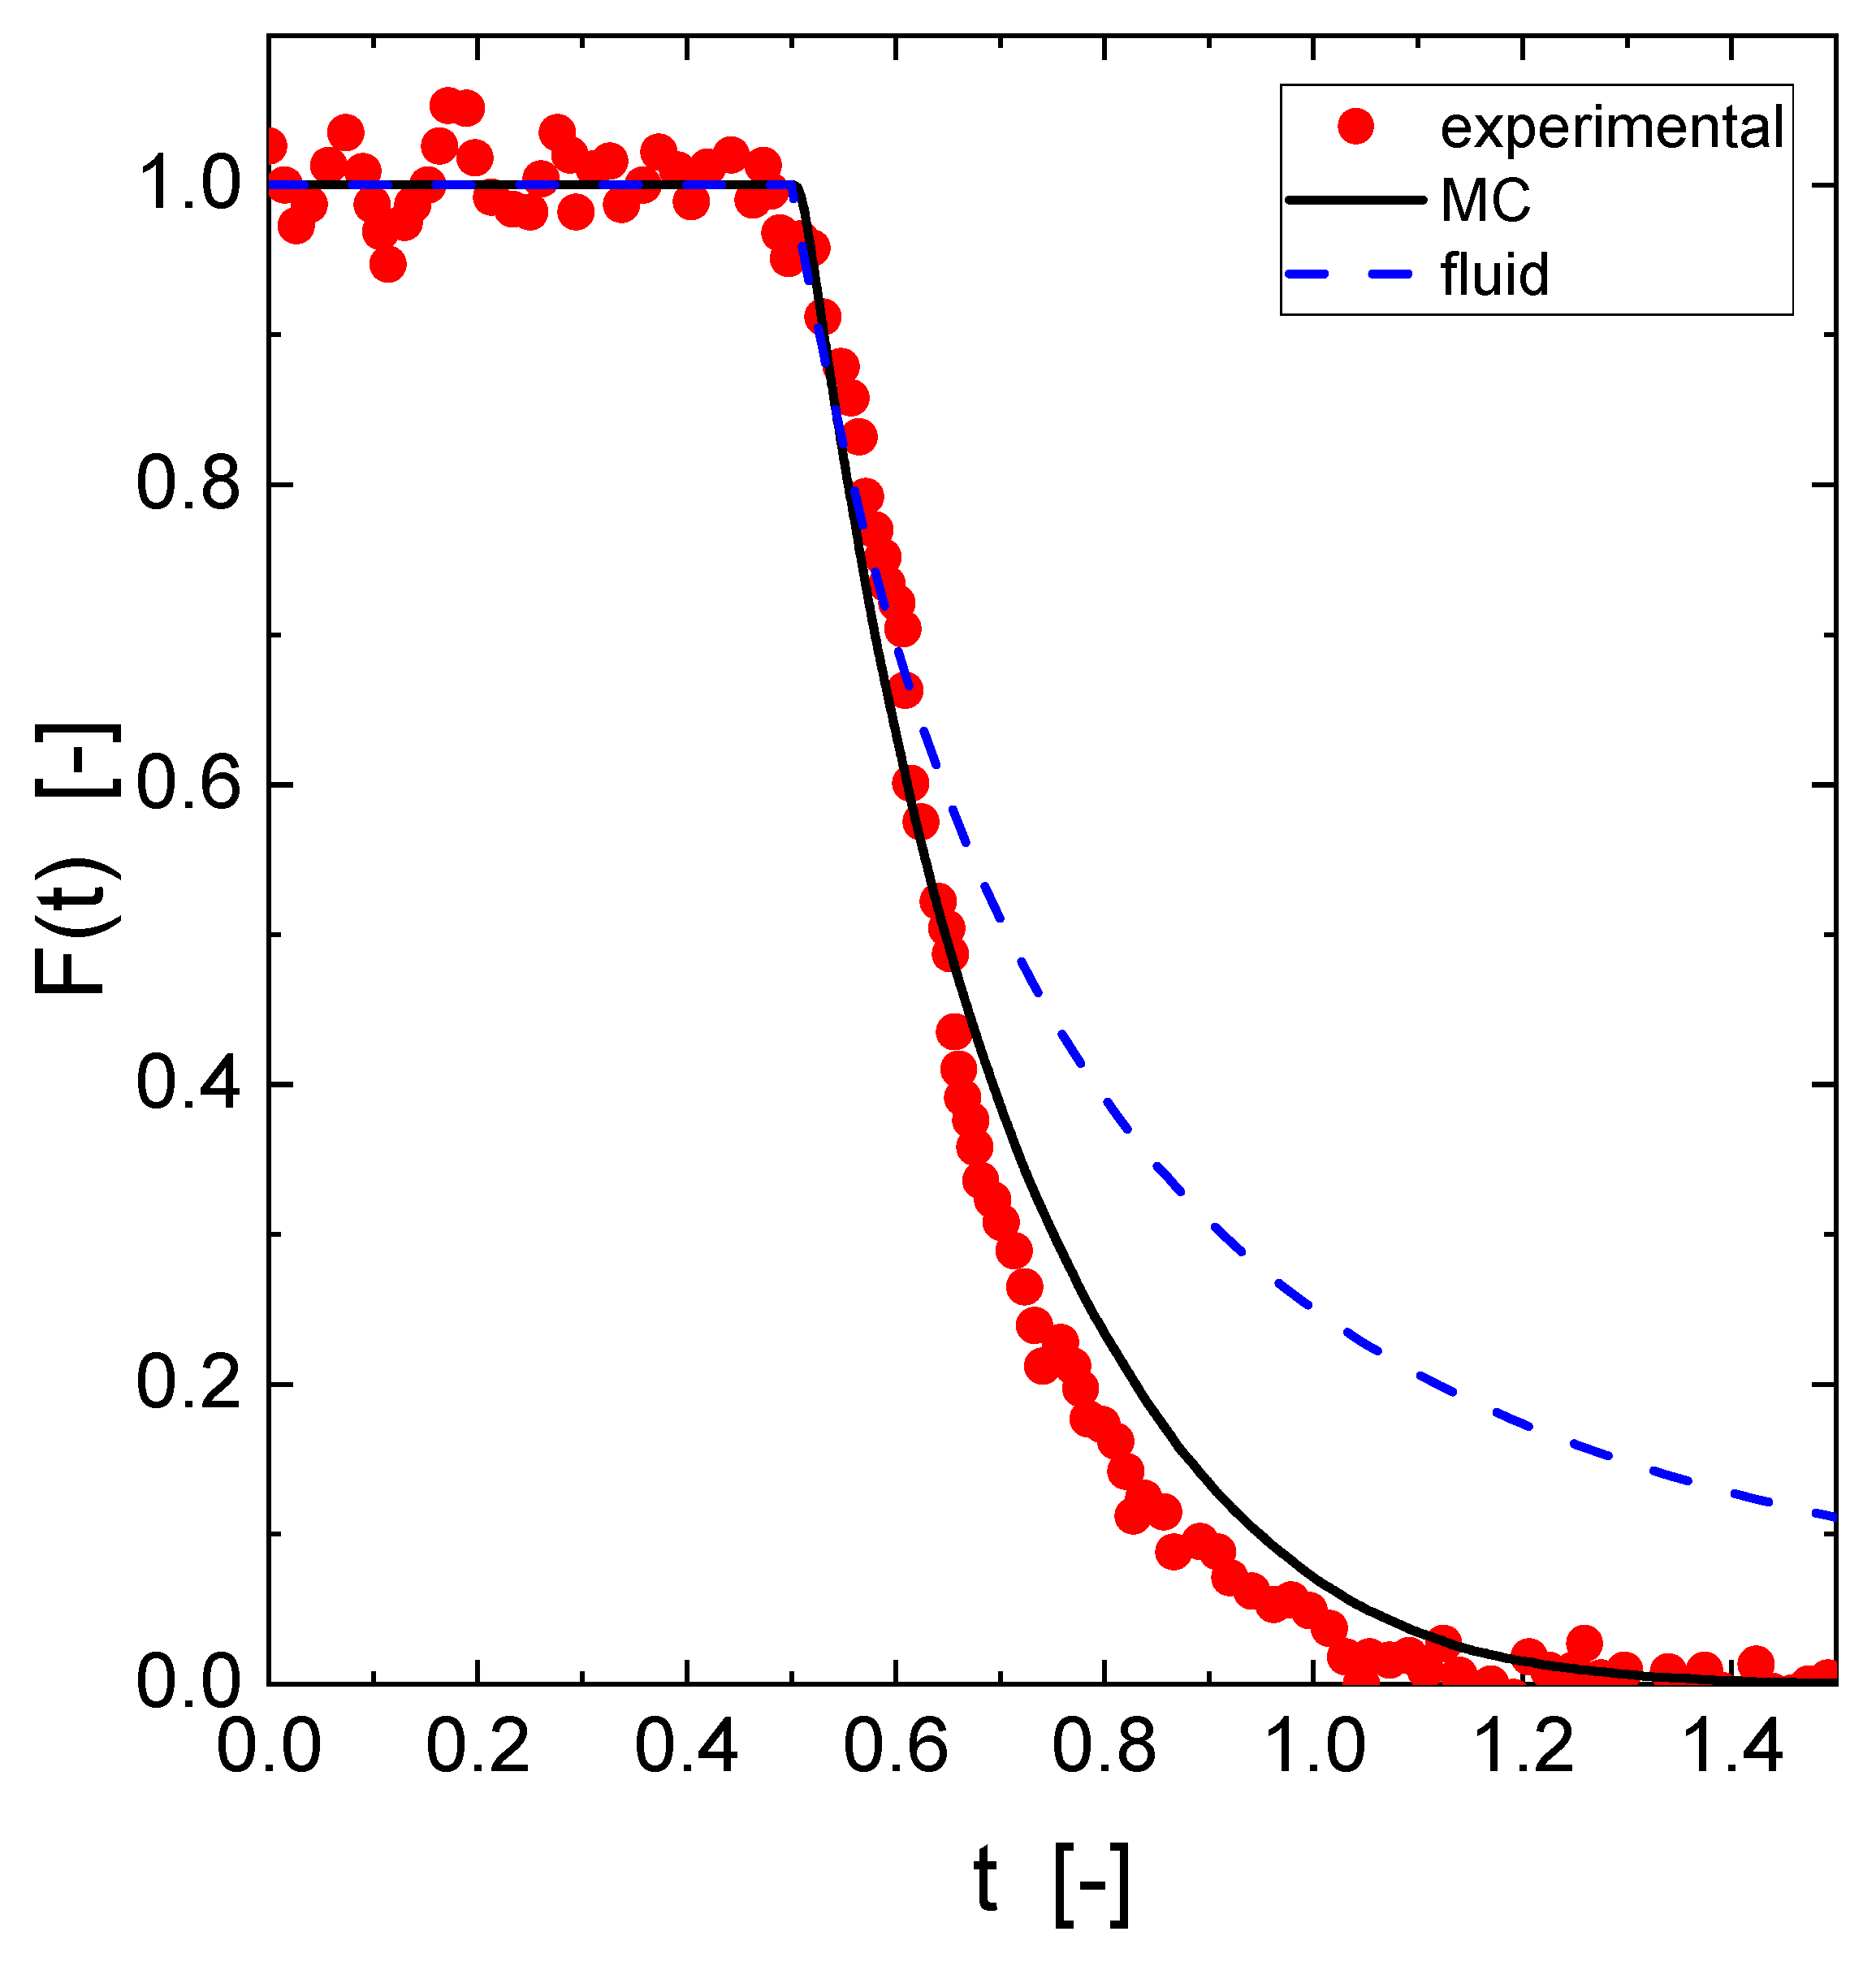

Table 1.
Summary of the results obtained for the median and the first two moments of the RTD of particles in the tube. Experimental data taken from [16]. Also given is the value of the first moment of the RTD calculated with the correlation proposed in [11].
| RTD | ||||
|---|---|---|---|---|
| Median | 1 | 2 | ||
|
particles |
experimental | 0.65 | 0.68 | 0.47 |
| MC simulation | 0.65 | 0.70 | 0.52 | |
| correlation | - | 0.70 | - | |
| fluid | 0.71 | 1 | ∞ | |
Disclaimer/Publisher’s Note: The statements, opinions and data contained in all publications are solely those of the individual author(s) and contributor(s) and not of MDPI and/or the editor(s). MDPI and/or the editor(s) disclaim responsibility for any injury to people or property resulting from any ideas, methods, instructions or products referred to in the content. |
© 2026 by the authors. Licensee MDPI, Basel, Switzerland. This article is an open access article distributed under the terms and conditions of the Creative Commons Attribution (CC BY) license (http://creativecommons.org/licenses/by/4.0/).
Copyright: This open access article is published under a Creative Commons CC BY 4.0 license, which permit the free download, distribution, and reuse, provided that the author and preprint are cited in any reuse.